daimler 2015: q2 and half year results presentation charts
TRANSCRIPT

1
Q2 and Half-Year 2015 Results.
July 23, 2015

Contents
2
RESULTS FOR Q2 2015
OUTLOOK FOR 2015
DEVELOPMENTS AT THE DIVISIONS
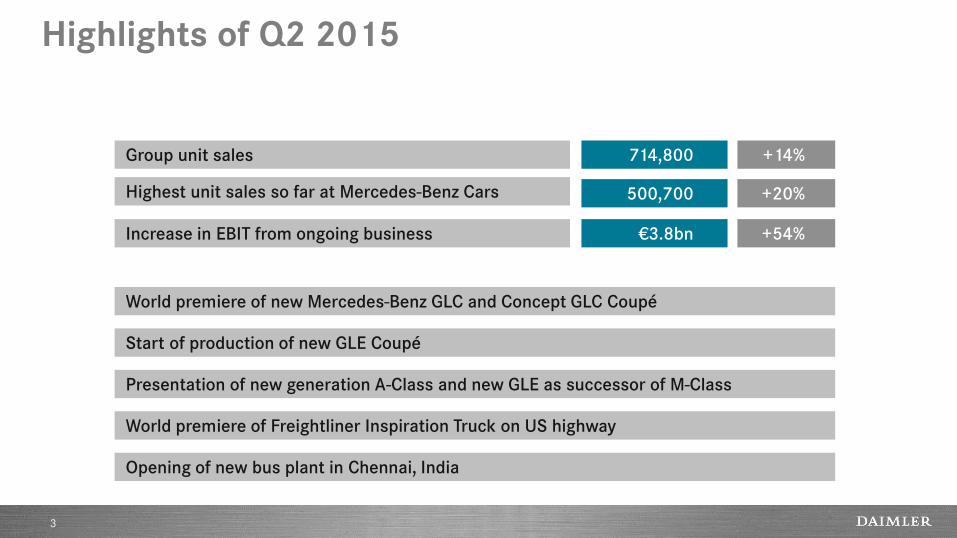
Highlights of Q2 2015
3
+14%
+20%
+54%
714,800
500,700
€3.8bn
Group unit sales
Highest unit sales so far at Mercedes-Benz Cars
Increase in EBIT from ongoing business
Start of production of new GLE Coupé
World premiere of Freightliner Inspiration Truck on US highway
Presentation of new generation A-Class and new GLE as successor of M-Class
World premiere of new Mercedes-Benz GLC and Concept GLC Coupé
Opening of new bus plant in Chennai, India
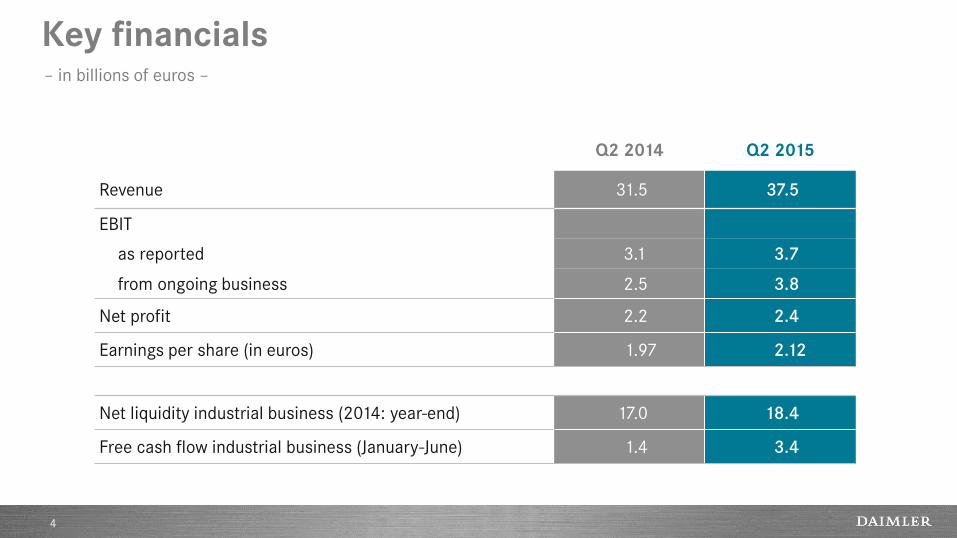
Key financials
4
– in billions of euros –
Q2 2014 Q2 2015
Revenue 31.5 37.5
EBIT
as reported 3.1 3.7
from ongoing business 2.5 3.8
Net profit 2.2 2.4
Earnings per share (in euros) 1.97 2.12
Net liquidity industrial business (2014: year-end) 17.0 18.4
Free cash flow industrial business (January-June) 1.4 3.4
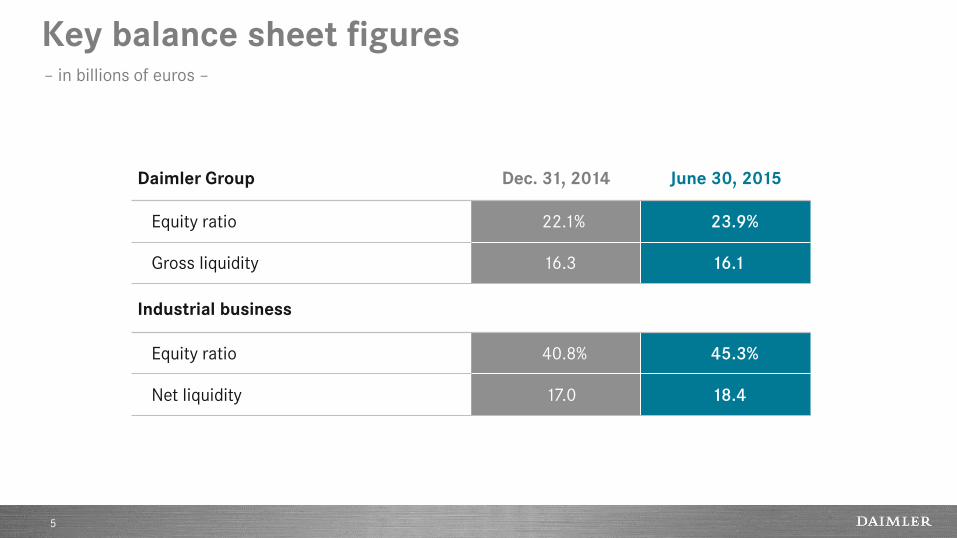
Key balance sheet figures
5
Daimler Group Dec. 31, 2014 June 30, 2015
Equity ratio 22.1% 23.9%
Gross liquidity 16.3 16.1
Industrial business
Equity ratio 40.8% 45.3%
Net liquidity 17.0 18.4
– in billions of euros –
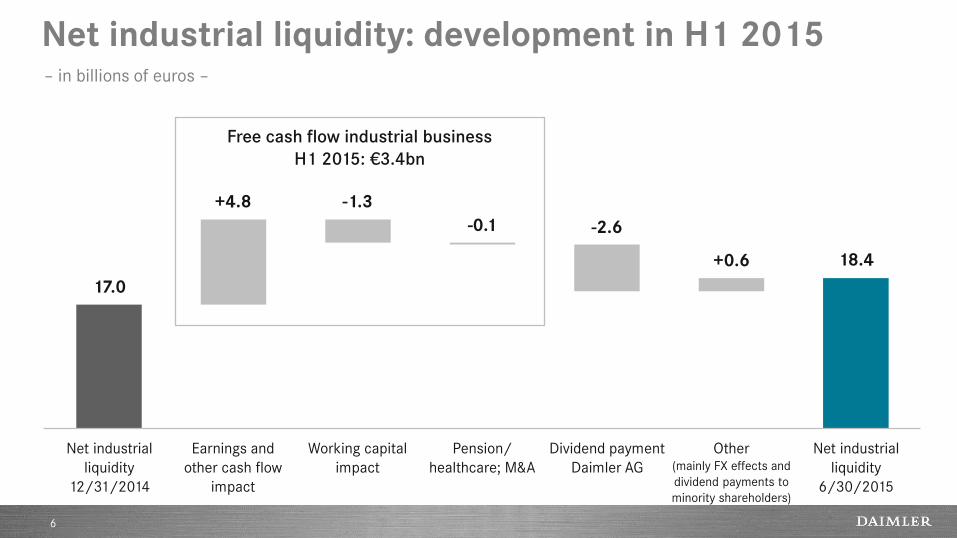
Net industrial liquidity: development in H1 2015
6
– in billions of euros –
Free cash flow industrial business
H1 2015: €3.4bn
Net industrial
liquidity
12/31/2014
Earnings and
other cash flow
impact
Working capital
impact
Other (mainly FX effects and
dividend payments to
minority shareholders)
Net industrial
liquidity
6/30/2015
-1.3
18.4 +0.6
17.0
+4.8
-0.1
Pension/
healthcare; M&A
-2.6
Dividend payment
Daimler AG
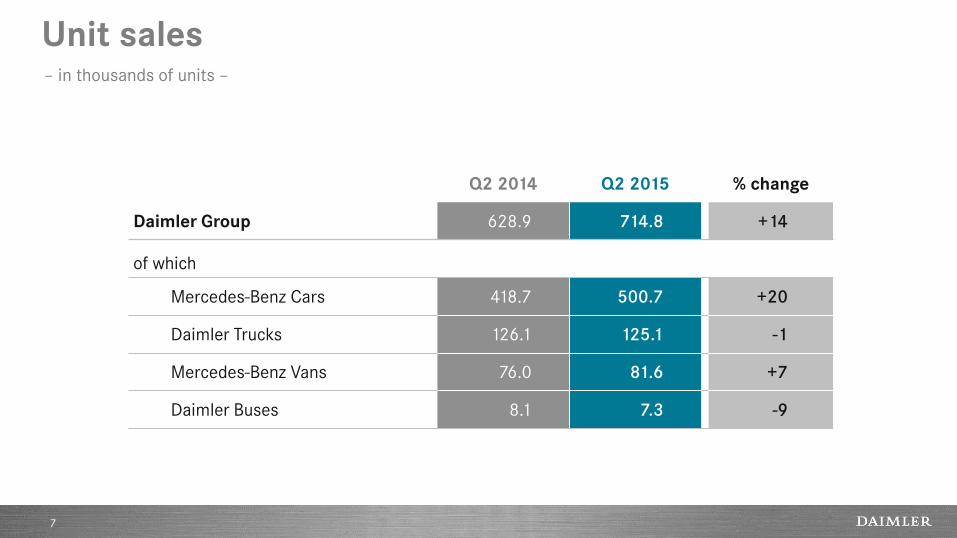
Unit sales
7
Q2 2014 Q2 2015 % change
Daimler Group 628.9 714.8 +14
of which
Mercedes-Benz Cars 418.7 500.7 +20
Daimler Trucks 126.1 125.1 -1
Mercedes-Benz Vans 76.0 81.6 +7
Daimler Buses 8.1 7.3 -9
– in thousands of units –
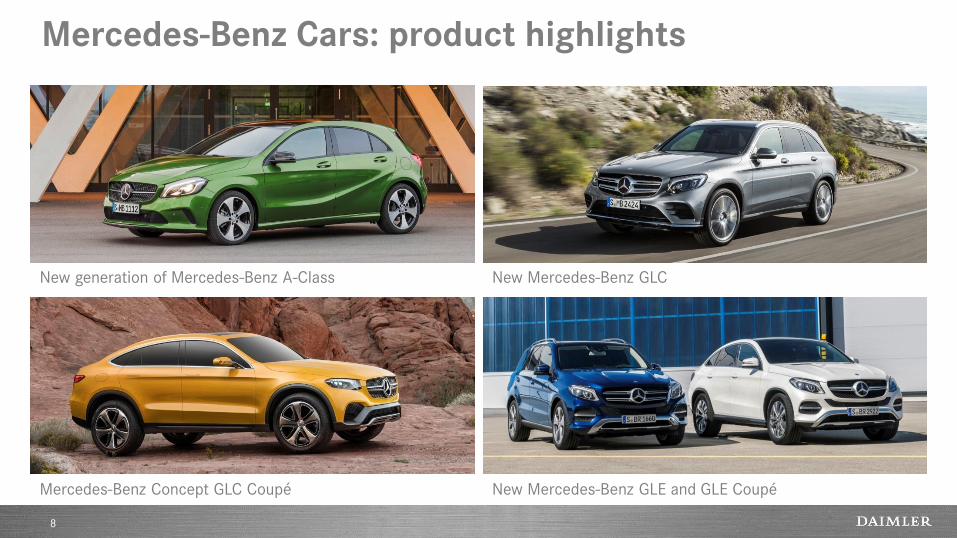
Mercedes-Benz Cars: product highlights
8
New Mercedes-Benz GLE and GLE Coupé
New generation of Mercedes-Benz A-Class New Mercedes-Benz GLC
Mercedes-Benz Concept GLC Coupé

Daimler Trucks: product highlights
9
New BharatBenz heavy-duty truck 3143 Freightliner Inspiration Truck
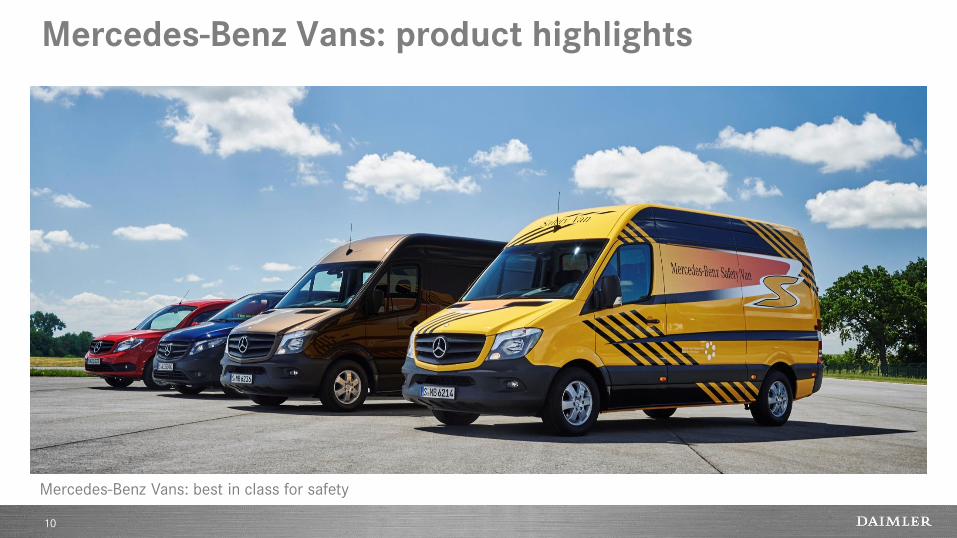
Mercedes-Benz Vans: product highlights
10
Mercedes-Benz Vans: best in class for safety
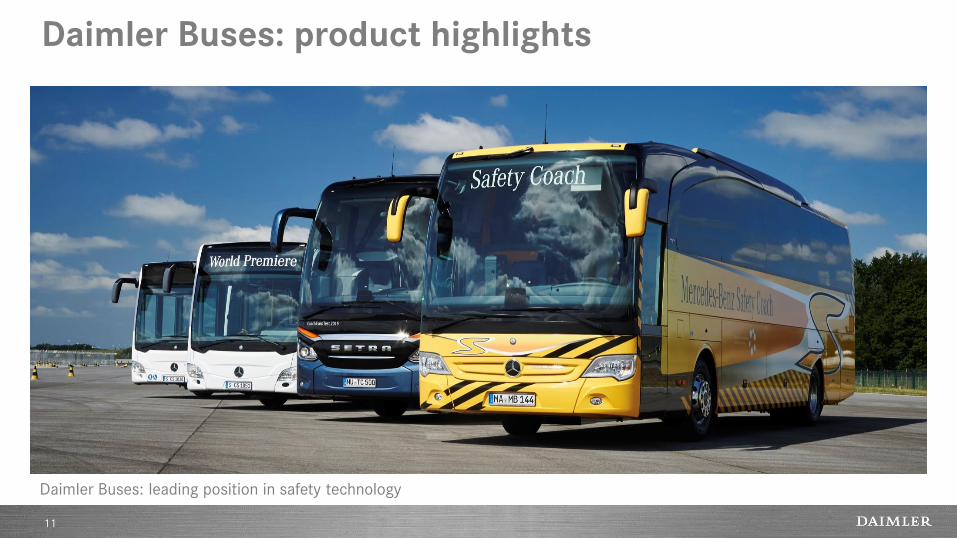
Daimler Buses: product highlights
11
Mercedes-Benz CapaCity L Mercedes-Benz and Setra buses in annual winter tests
Daimler Buses: leading position in safety technology
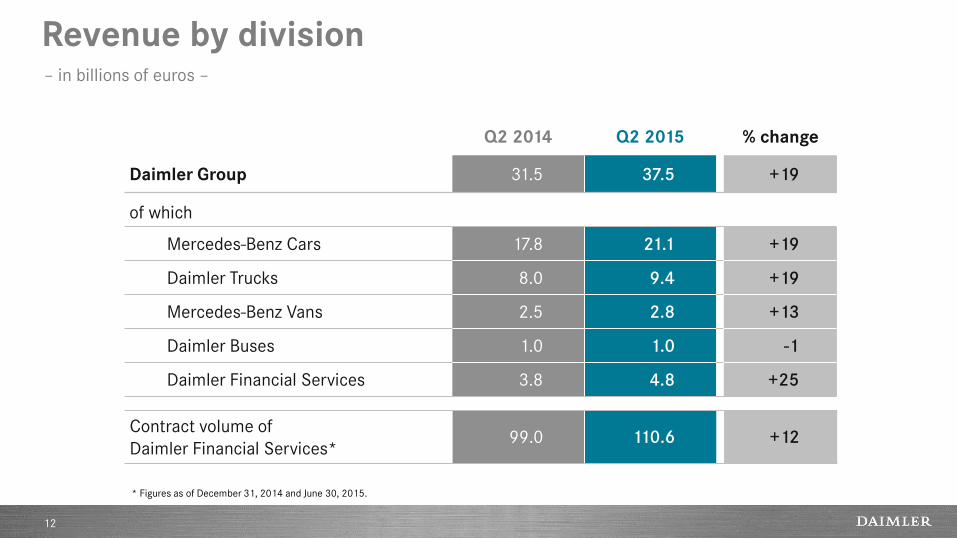
Revenue by division
12
Q2 2014 Q2 2015 % change
Daimler Group 31.5 37.5 +19
of which
Mercedes-Benz Cars 17.8 21.1 +19
Daimler Trucks 8.0 9.4 +19
Mercedes-Benz Vans 2.5 2.8 +13
Daimler Buses 1.0 1.0 -1
Daimler Financial Services 3.8 4.8 +25
Contract volume of
Daimler Financial Services* 99.0 110.6 +12
– in billions of euros –
* Figures as of December 31, 2014 and June 30, 2015.
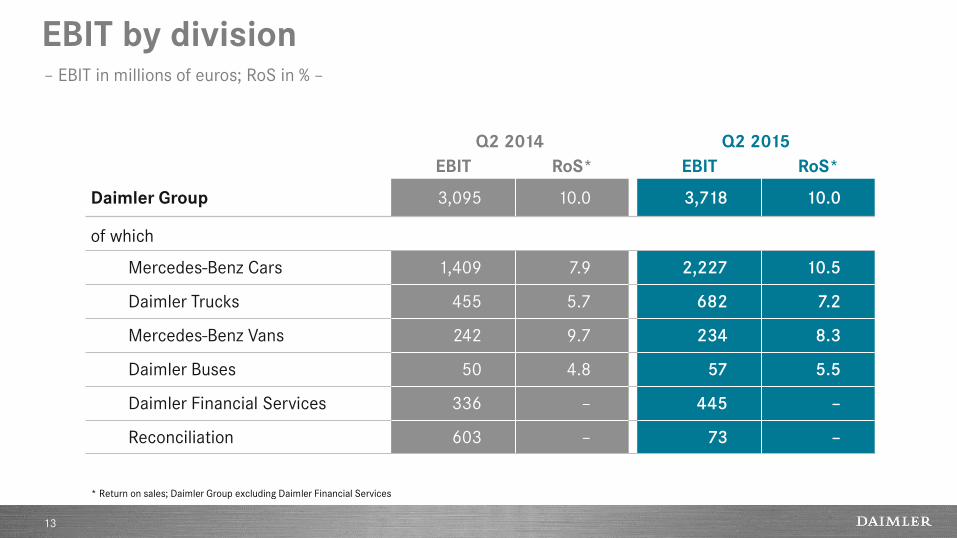
EBIT by division
13
Q2 2014 Q2 2015
EBIT RoS* EBIT RoS*
Daimler Group 3,095 10.0 3,718 10.0
of which
Mercedes-Benz Cars 1,409 7.9 2,227 10.5
Daimler Trucks 455 5.7 682 7.2
Mercedes-Benz Vans 242 9.7 234 8.3
Daimler Buses 50 4.8 57 5.5
Daimler Financial Services 336 – 445 –
Reconciliation 603 – 73 –
* Return on sales; Daimler Group excluding Daimler Financial Services
– EBIT in millions of euros; RoS in % –
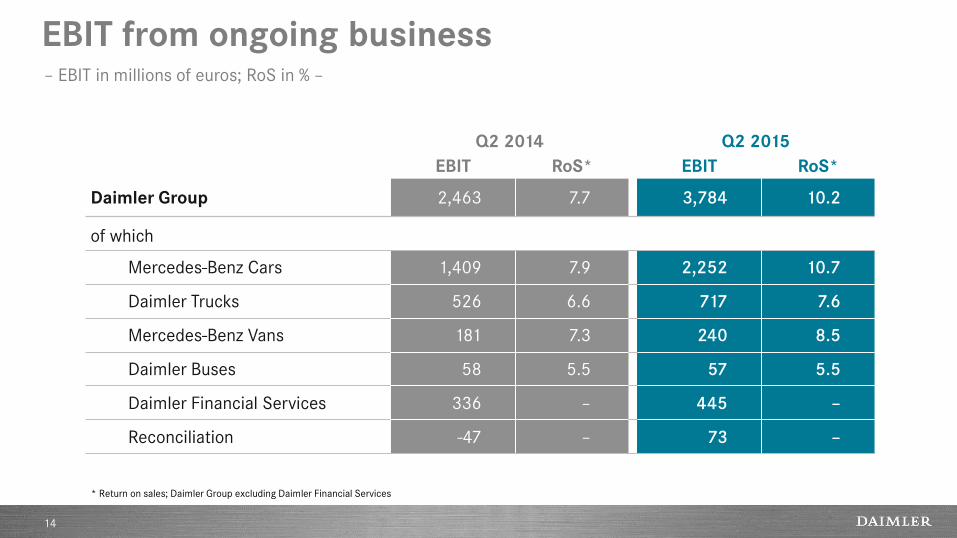
EBIT from ongoing business
14
Q2 2014 Q2 2015
EBIT RoS* EBIT RoS*
Daimler Group 2,463 7.7 3,784 10.2
of which
Mercedes-Benz Cars 1,409 7.9 2,252 10.7
Daimler Trucks 526 6.6 717 7.6
Mercedes-Benz Vans 181 7.3 240 8.5
Daimler Buses 58 5.5 57 5.5
Daimler Financial Services 336 – 445 –
Reconciliation -47 – 73 –
* Return on sales; Daimler Group excluding Daimler Financial Services
– EBIT in millions of euros; RoS in % –
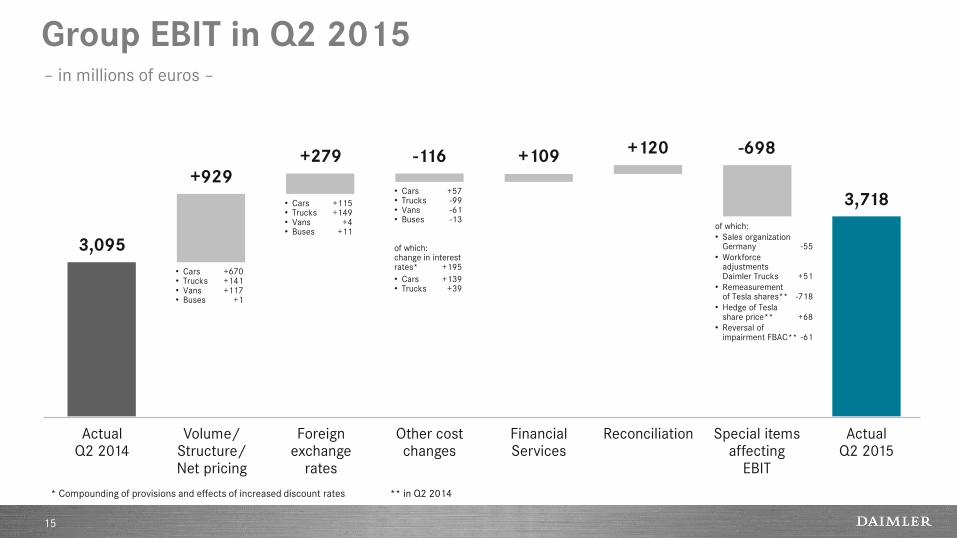
Group EBIT in Q2 2015
15
Actual Q2 2014
Volume/ Structure/ Net pricing
Foreign exchange
rates
Other cost changes
Reconciliation Actual Q2 2015
Financial Services
-116 -698
3,718
+109
3,095
+279 +929
• Cars +670 • Trucks +141 • Vans +117 • Buses +1
• Cars +115 • Trucks +149 • Vans +4 • Buses +11
• Cars +57 • Trucks -99 • Vans -61 • Buses -13
of which: change in interest rates* +195
• Cars +139 • Trucks +39
of which:
• Sales organization Germany -55
• Workforce adjustments Daimler Trucks +51
• Remeasurement of Tesla shares** -718
• Hedge of Tesla share price** +68
• Reversal of impairment FBAC** -61
Special items affecting
EBIT
+120
– in millions of euros –
* Compounding of provisions and effects of increased discount rates ** in Q2 2014
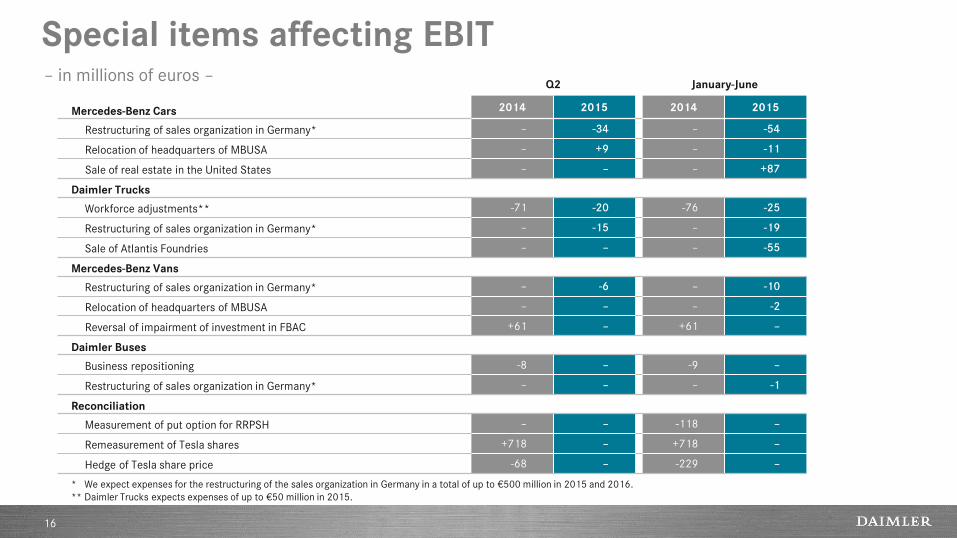
Special items affecting EBIT
16
Q2 January-June
Mercedes-Benz Cars 2014 2015 2014 2015
Restructuring of sales organization in Germany* – -34 – -54
Relocation of headquarters of MBUSA – +9 – -11
Sale of real estate in the United States – – – +87
Daimler Trucks
Workforce adjustments** -71 -20 -76 -25
Restructuring of sales organization in Germany* – -15 – -19
Sale of Atlantis Foundries – – – -55
Mercedes-Benz Vans
Restructuring of sales organization in Germany* – -6 – -10
Relocation of headquarters of MBUSA – – – -2
Reversal of impairment of investment in FBAC +61 – +61 –
Daimler Buses
Business repositioning -8 – -9 –
Restructuring of sales organization in Germany* – – – -1
Reconciliation
Measurement of put option for RRPSH – – -118 –
Remeasurement of Tesla shares +718 – +718 –
Hedge of Tesla share price -68 – -229 –
* We expect expenses for the restructuring of the sales organization in Germany in a total of up to €500 million in 2015 and 2016.
** Daimler Trucks expects expenses of up to €50 million in 2015.
– in millions of euros –

Contents
17
RESULTS FOR Q2 2015
OUTLOOK FOR 2015
DEVELOPMENTS AT THE DIVISIONS
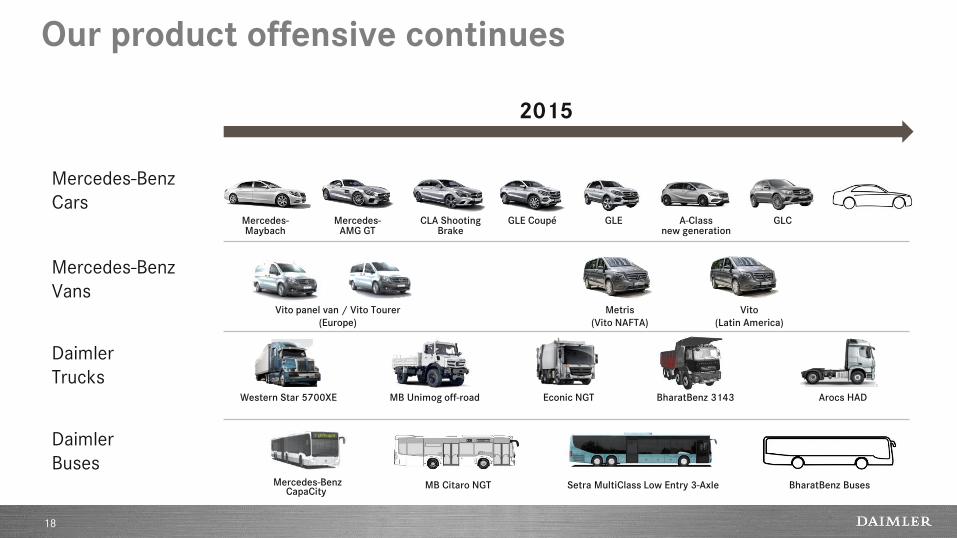
Our product offensive continues
18
2015
Mercedes-Benz
Vans
Daimler
Buses
Daimler
Trucks
Mercedes-Benz
Cars Mercedes-
AMG GT
Western Star 5700XE Econic NGT MB Unimog off-road
BharatBenz Buses
Arocs HAD
Setra MultiClass Low Entry 3-Axle
BharatBenz 3143
MB Citaro NGT
• 2015
Mercedes-Maybach
CLA Shooting Brake
GLE Coupé
Metris
(Vito NAFTA)
Vito
(Latin America)
Vito panel van / Vito Tourer
(Europe)
Mercedes-Benz CapaCity
GLE A-Class new generation
GLC
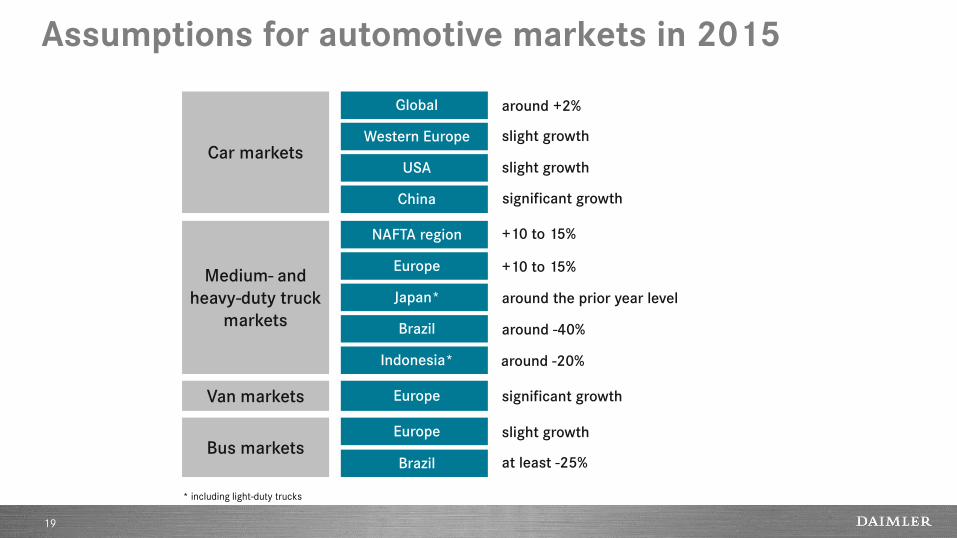
Assumptions for automotive markets in 2015
19
Car markets
Global
Western Europe
Medium- and
heavy-duty truck
markets
NAFTA region
Europe
Japan*
Brazil
Europe
Bus markets Europe
Brazil
around +2%
slight growth
+10 to 15%
+10 to 15%
around the prior year level
around -40%
significant growth
slight growth
at least -25%
USA slight growth
Van markets
* including light-duty trucks
Indonesia* around -20%
China significant growth
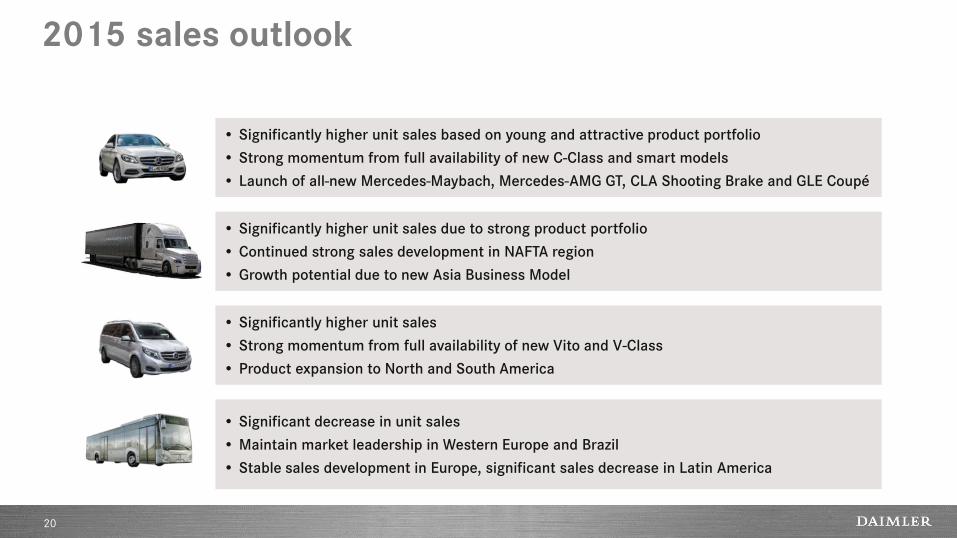
2015 sales outlook
20
• Significantly higher unit sales based on young and attractive product portfolio
• Strong momentum from full availability of new C-Class and smart models
• Launch of all-new Mercedes-Maybach, Mercedes-AMG GT, CLA Shooting Brake and GLE Coupé
• Significant decrease in unit sales
• Maintain market leadership in Western Europe and Brazil
• Stable sales development in Europe, significant sales decrease in Latin America
• Significantly higher unit sales
• Strong momentum from full availability of new Vito and V-Class
• Product expansion to North and South America
• Significantly higher unit sales due to strong product portfolio
• Continued strong sales development in NAFTA region
• Growth potential due to new Asia Business Model
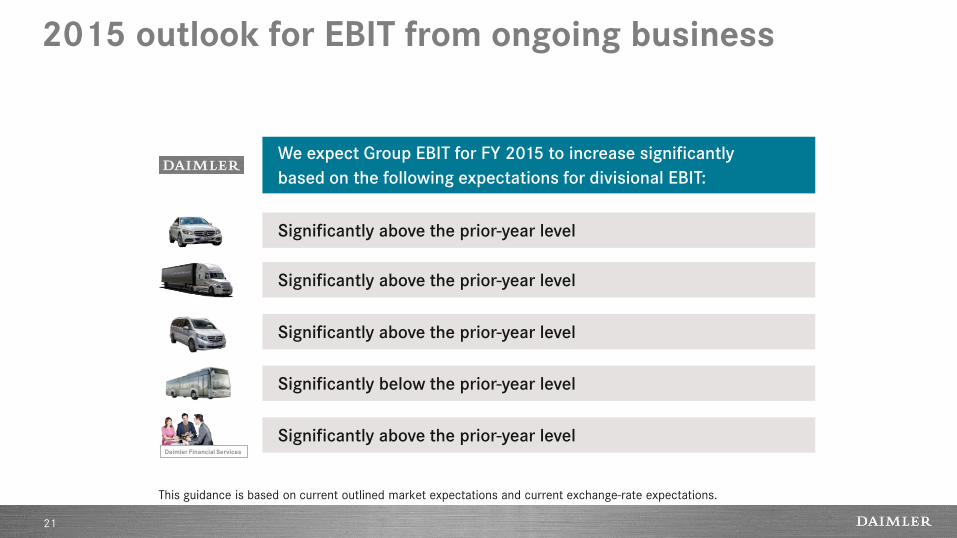
2015 outlook for EBIT from ongoing business
21
This guidance is based on current outlined market expectations and current exchange-rate expectations.
Significantly above the prior-year level
Significantly above the prior-year level
Significantly above the prior-year level
Significantly below the prior-year level
Significantly above the prior-year level
We expect Group EBIT for FY 2015 to increase significantly
based on the following expectations for divisional EBIT:
Daimler Financial Services

Contents
22
RESULTS FOR Q2 2015
OUTLOOK FOR 2015
DEVELOPMENTS AT THE DIVISIONS
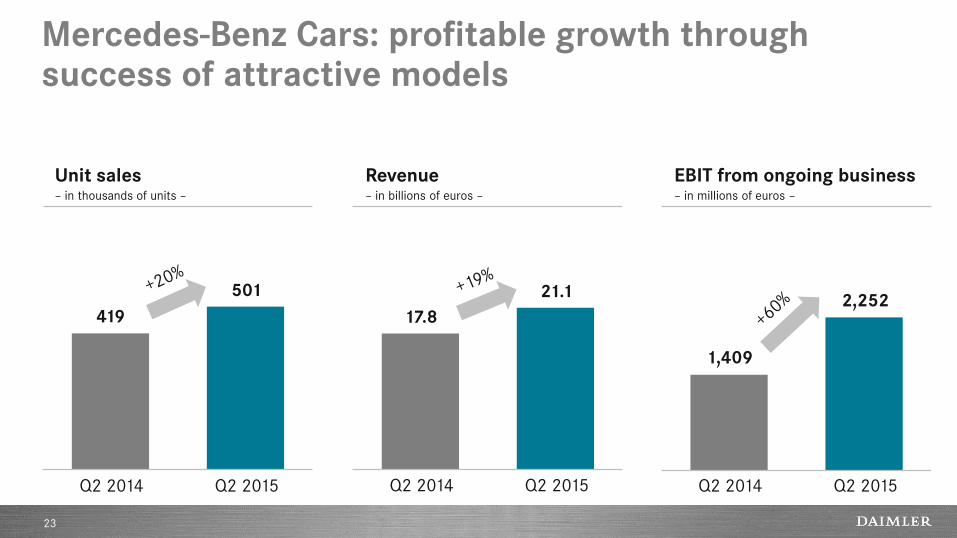
Mercedes-Benz Cars: profitable growth through success of attractive models
23
Unit sales – in thousands of units –
Q2 2014 Q2 2015
Revenue – in billions of euros –
EBIT from ongoing business – in millions of euros –
419
501
Q2 2014 Q2 2015
17.8
21.1
Q2 2014 Q2 2015
1,409
2,252
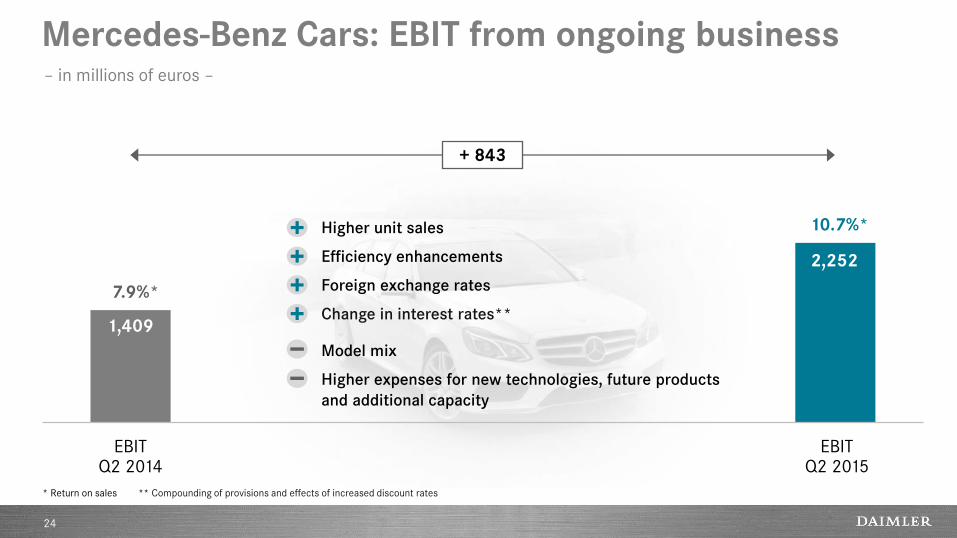
Mercedes-Benz Cars: EBIT from ongoing business
24
EBIT Q2 2014
EBIT Q2 2015
1,409
2,252
+ 843
7.9%*
10.7%* Higher unit sales
Efficiency enhancements
Foreign exchange rates
Change in interest rates**
Model mix
Higher expenses for new technologies, future products
and additional capacity
– in millions of euros –
* Return on sales ** Compounding of provisions and effects of increased discount rates
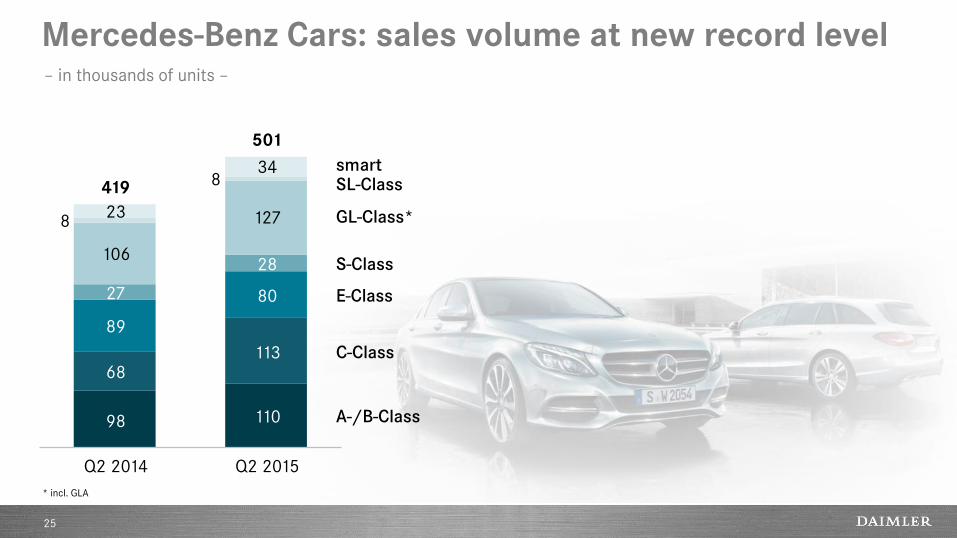
Mercedes-Benz Cars: sales volume at new record level
25
– in thousands of units –
Q2 2014
419
501
Q2 2015
110
113
80
28
8
98
68
89
27
8
smart
E-Class
C-Class
A-/B-Class
S-Class
SL-Class 34
23 GL-Class*
106
127
* incl. GLA
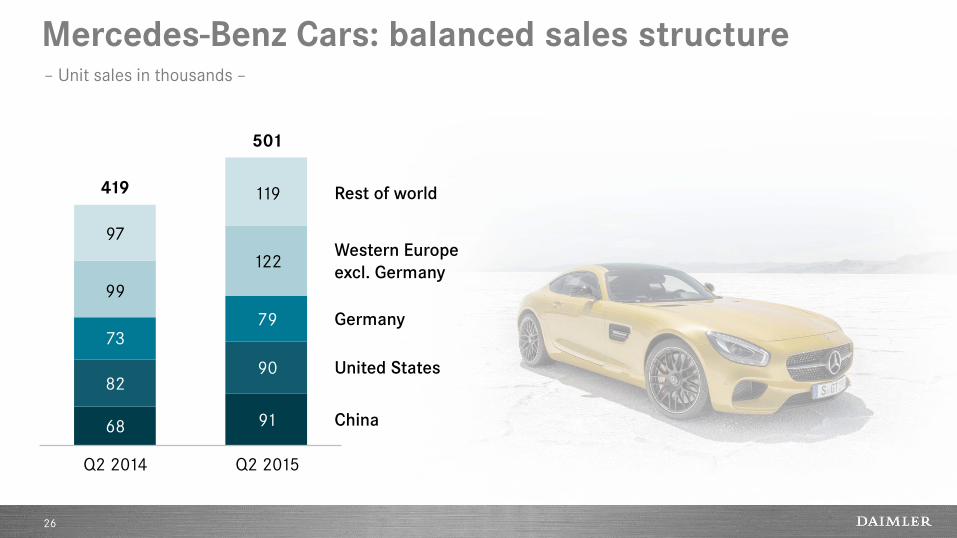
Mercedes-Benz Cars: balanced sales structure
26
Q2 2014
Rest of world
Germany
United States
China
419
Western Europe
excl. Germany
501
Q2 2015
91
90
79
122
119
68
82
73
99
97
– Unit sales in thousands –
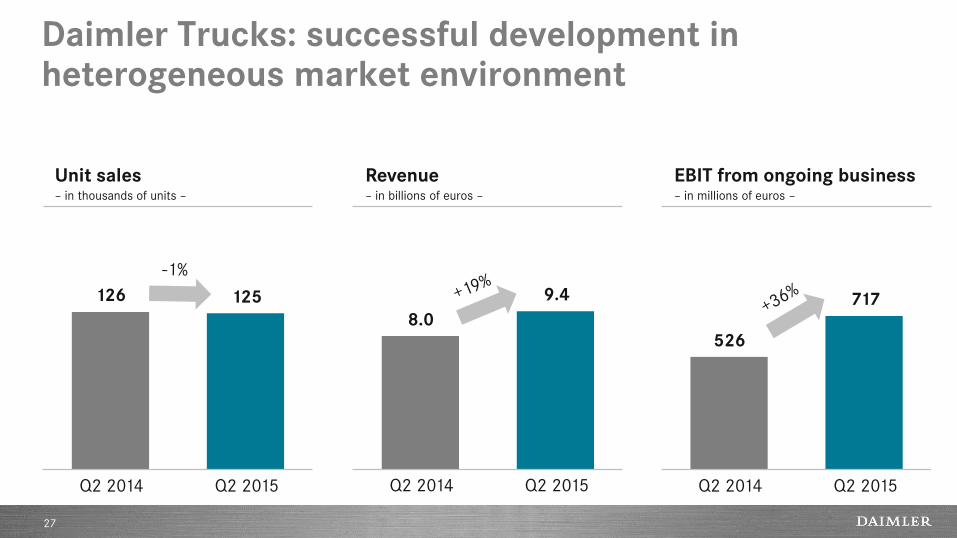
Daimler Trucks: successful development in heterogeneous market environment
27
126 125
8.0
9.4
526
717
Unit sales – in thousands of units –
Revenue – in billions of euros –
EBIT from ongoing business – in millions of euros –
Q2 2014 Q2 2015 Q2 2014 Q2 2015 Q2 2014 Q2 2015
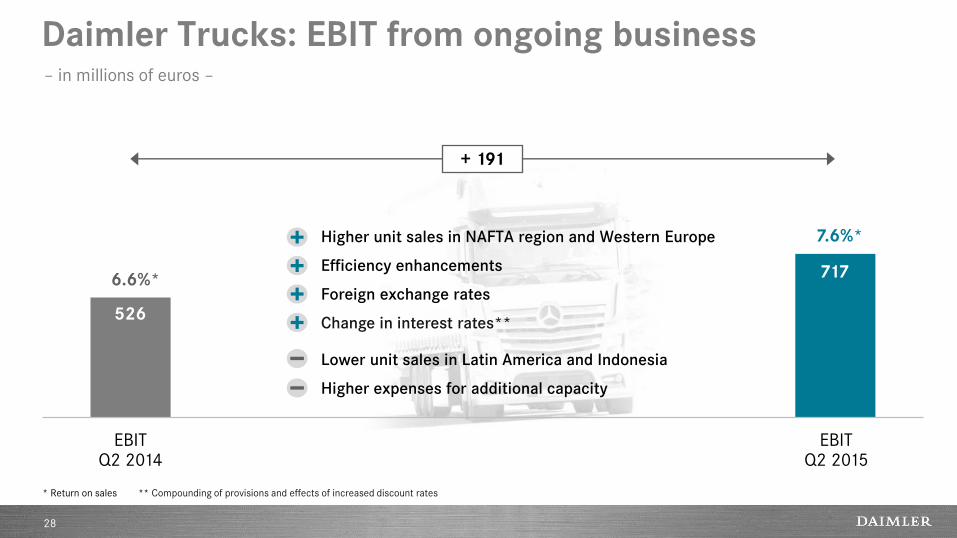
Daimler Trucks: EBIT from ongoing business
28
EBIT Q2 2014
EBIT Q2 2015
526
717
+ 191
6.6%*
7.6%*
* Return on sales ** Compounding of provisions and effects of increased discount rates
Higher unit sales in NAFTA region and Western Europe
Efficiency enhancements
Foreign exchange rates
Change in interest rates**
Lower unit sales in Latin America and Indonesia
Higher expenses for additional capacity
– in millions of euros –
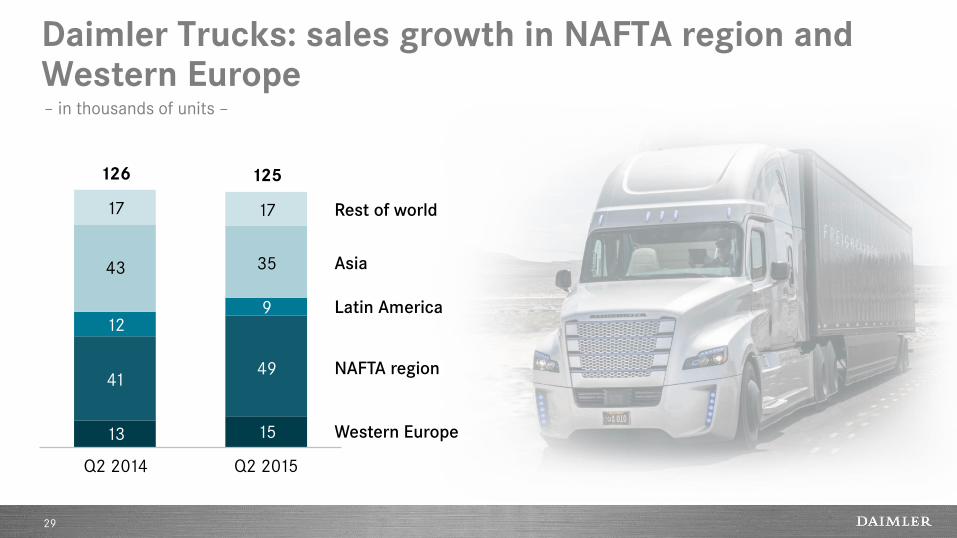
Daimler Trucks: sales growth in NAFTA region and Western Europe
29
Q2 2014
Rest of world
126
Asia
125
Q2 2015
15
49
9
35
17
13
41
12
43
17
Western Europe
NAFTA region
Latin America
– in thousands of units –
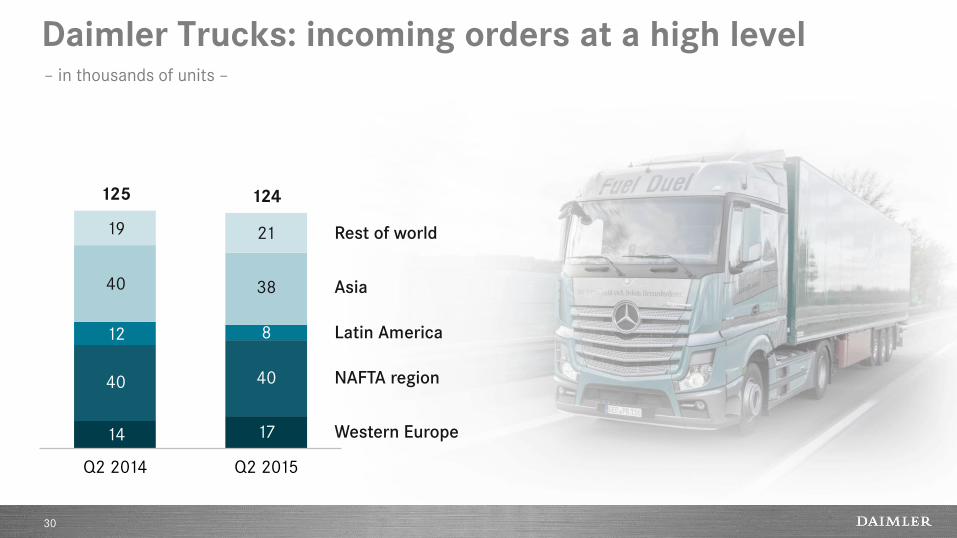
Daimler Trucks: incoming orders at a high level
30
125 124
17
40
8
38
21
14
40
12
40
19
Asia
Western Europe
NAFTA region
Rest of world
Latin America
Q2 2014 Q2 2015
– in thousands of units –
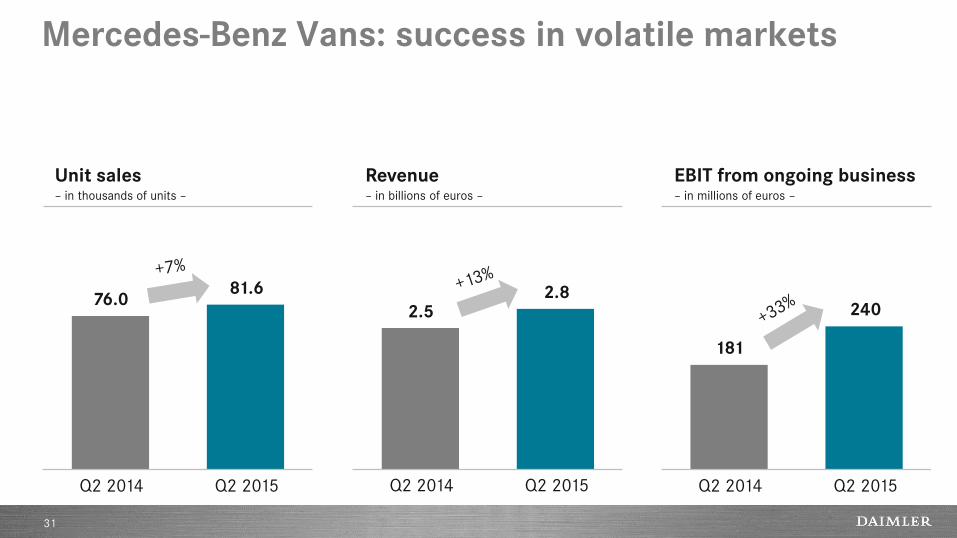
Mercedes-Benz Vans: success in volatile markets
31
76.0 81.6
2.5 2.8
181
240
Unit sales – in thousands of units –
Revenue – in billions of euros –
EBIT from ongoing business – in millions of euros –
Q2 2014 Q2 2015 Q2 2014 Q2 2015 Q2 2014 Q2 2015
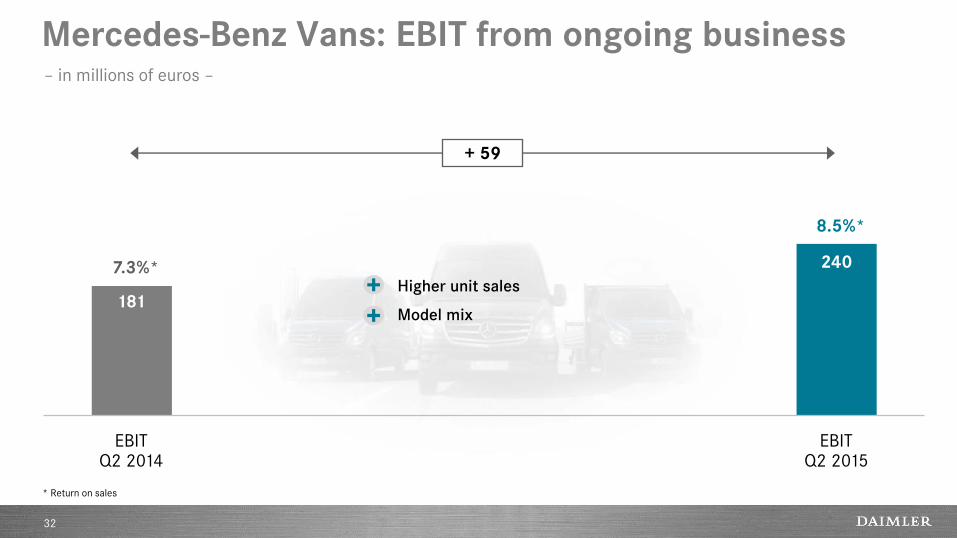
Mercedes-Benz Vans: EBIT from ongoing business
32
EBIT Q2 2014
EBIT Q2 2015
181
240
+ 59
7.3%*
8.5%*
* Return on sales
Higher unit sales
Model mix
– in millions of euros –
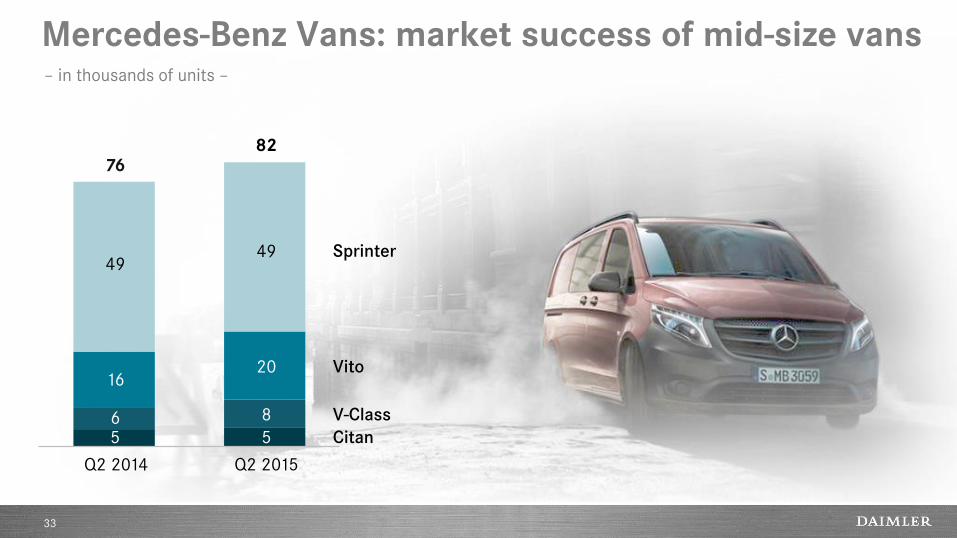
Mercedes-Benz Vans: market success of mid-size vans
33
76 82
5
20
49
6
16
49
V-Class
Sprinter
Vito
8
Citan
Q2 2014 Q2 2015
5
– in thousands of units –
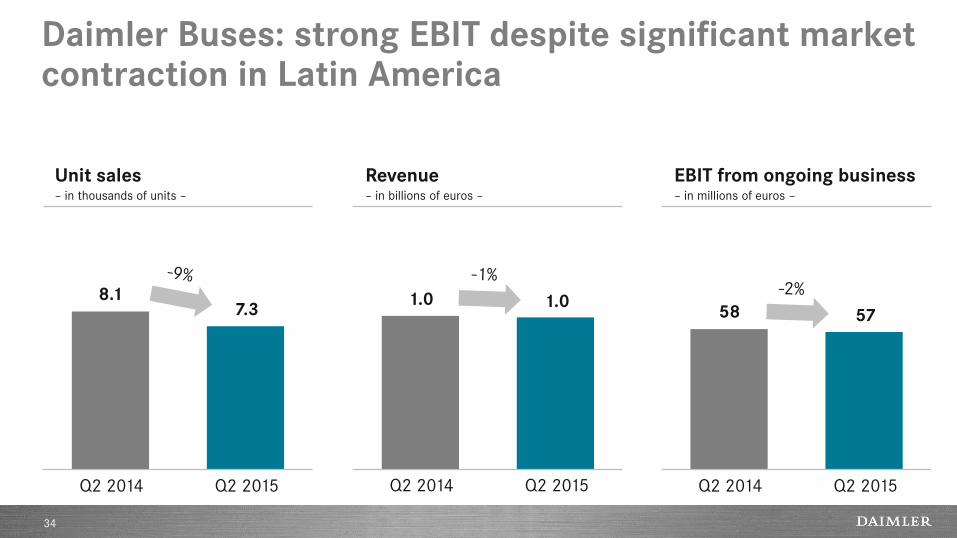
Daimler Buses: strong EBIT despite significant market contraction in Latin America
34
8.1 7.3
1.0 1.0 58 57
Unit sales – in thousands of units –
Revenue – in billions of euros –
EBIT from ongoing business – in millions of euros –
Q2 2014 Q2 2015 Q2 2014 Q2 2015 Q2 2014 Q2 2015
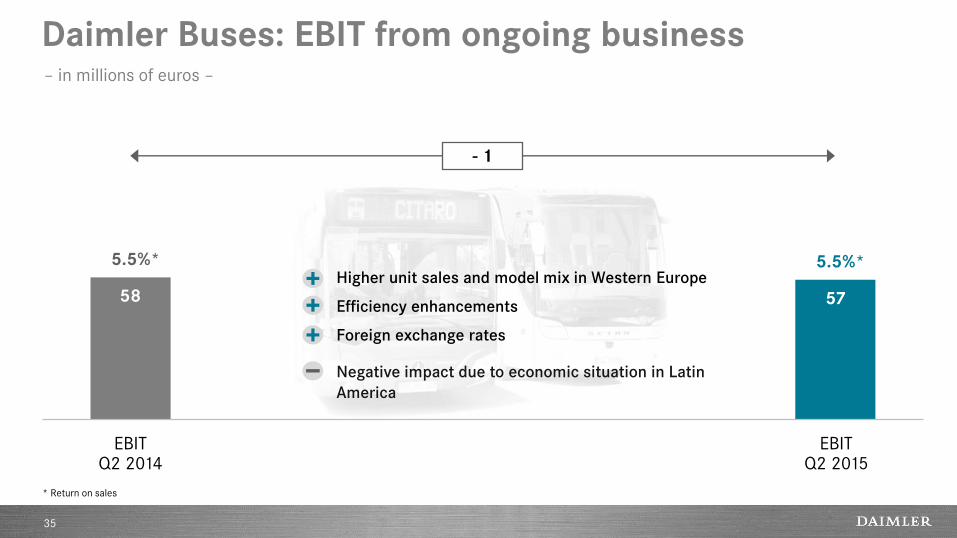
Daimler Buses: EBIT from ongoing business
35
EBIT Q2 2014
EBIT Q2 2015
58 57
- 1
5.5%* 5.5%*
* Return on sales
Higher unit sales and model mix in Western Europe
Efficiency enhancements
Foreign exchange rates
Negative impact due to economic situation in Latin
America
– in millions of euros –
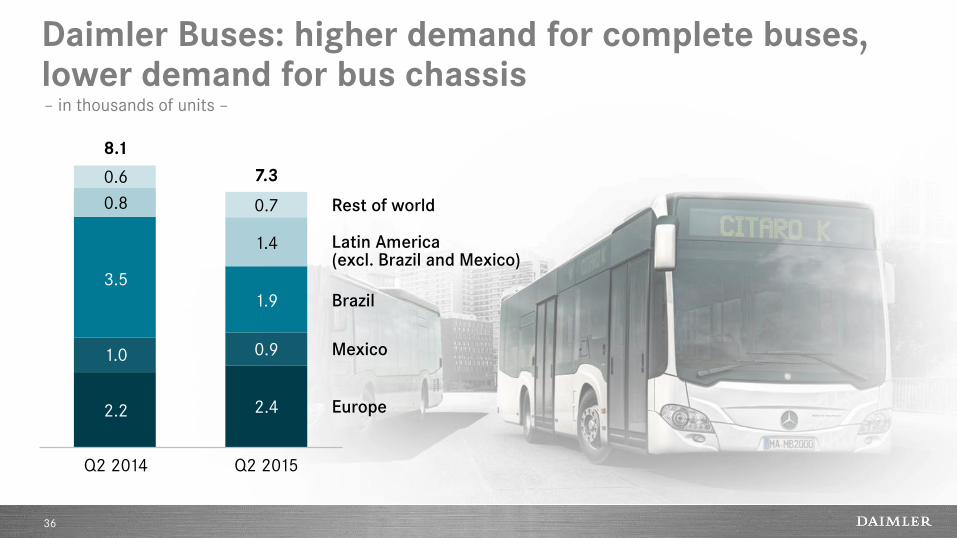
Daimler Buses: higher demand for complete buses, lower demand for bus chassis
36
Europe
Mexico
Rest of world
Brazil
Latin America (excl. Brazil and Mexico)
0.6
8.1
2.2
1.0
3.5
0.8
7.3
2.4
0.9
1.9
0.7
1.4
Q2 2014 Q2 2015
– in thousands of units –
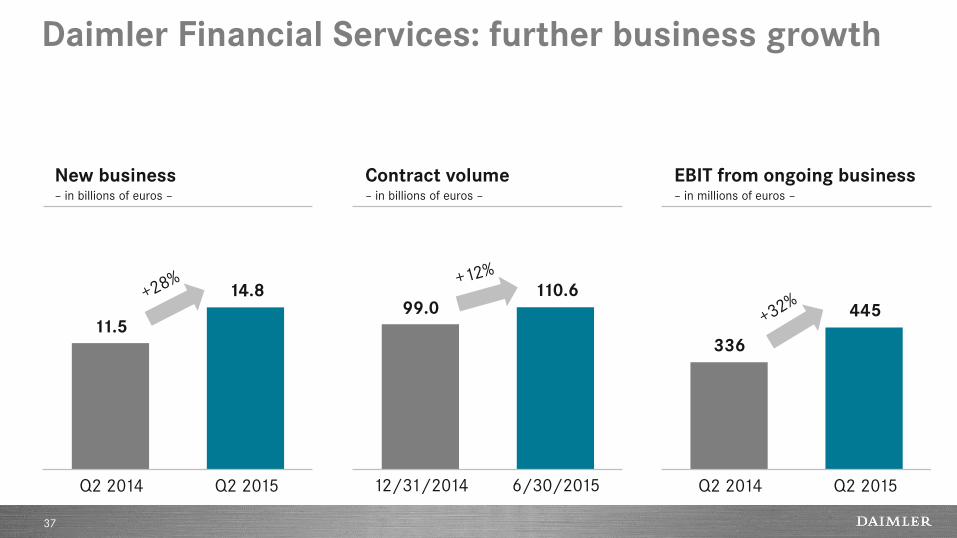
Daimler Financial Services: further business growth
37
11.5
14.8
12/31/2014 6/30/2015
99.0 110.6
336
445
New business – in billions of euros –
Contract volume – in billions of euros –
EBIT from ongoing business – in millions of euros –
Q2 2014 Q2 2015 Q2 2014 Q2 2015
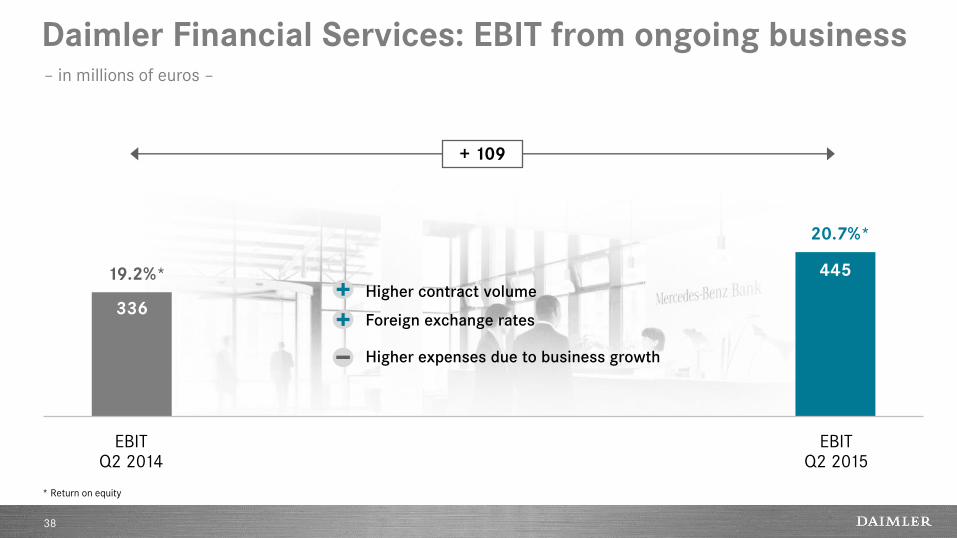
Daimler Financial Services: EBIT from ongoing business
38
EBIT Q2 2014
EBIT Q2 2015
336
445
+ 109
19.2%*
20.7%*
* Return on equity
Higher contract volume
Foreign exchange rates
Higher expenses due to business growth
– in millions of euros –
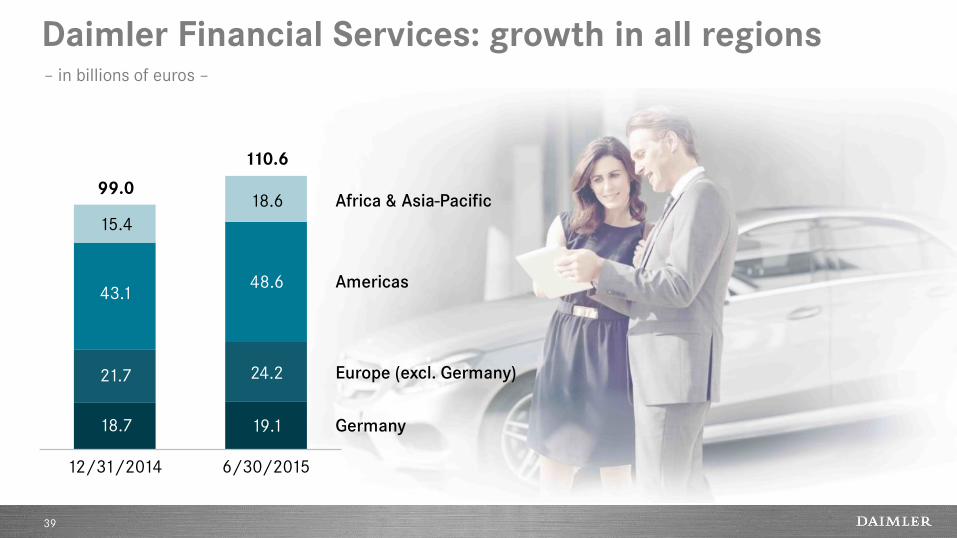
Daimler Financial Services: growth in all regions
39
12/31/2014 6/30/2015
Europe (excl. Germany)
Americas
Africa & Asia-Pacific
Germany
99.0
18.7
21.7
43.1
15.4
110.6
19.1
24.2
48.6
18.6
– in billions of euros –
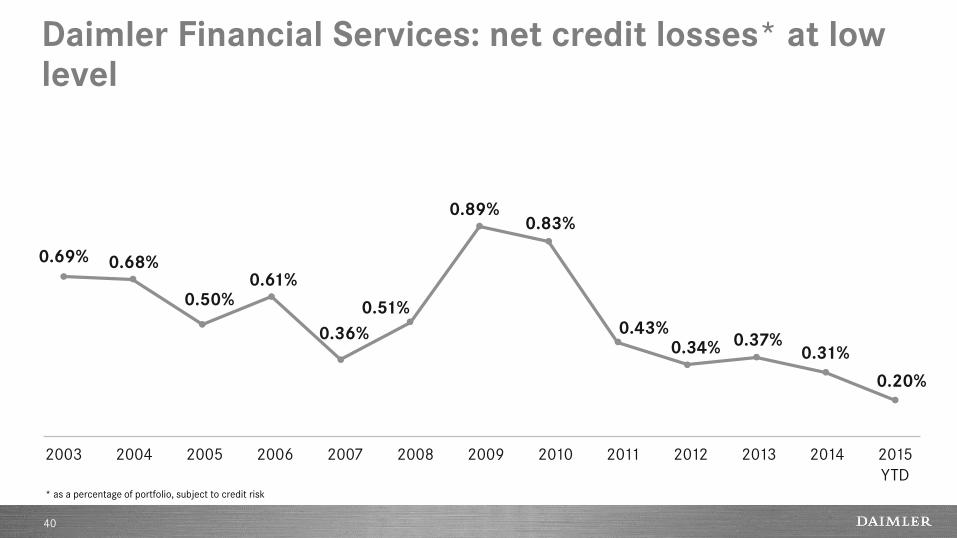
Daimler Financial Services: net credit losses* at low level
40
0.69% 0.68%
0.50% 0.61%
0.36%
0.51%
0.89% 0.83%
0.43% 0.34% 0.37%
0.31%
* as a percentage of portfolio, subject to credit risk
0.20%
2003 2004 2005 2006 2007 2008 2009 2010 2011 2012 2013 2014 2015
YTD
Disclaimer
41
This document contains forward-looking statements that reflect our current views about future events. The words “anticipate,” “assume,” “believe,”
“estimate,” “expect,” “intend,” “may,” ”can,” “could,” “plan,” “project,” “should” and similar expressions are used to identify forward-looking
statements. These statements are subject to many risks and uncertainties, including an adverse development of global economic conditions, in
particular a decline of demand in our most important markets; a worsening of the sovereign-debt crisis and increasing uncertainty in the euro zone;
an increase in political tension in Eastern Europe; a deterioration of our refinancing possibilities on the credit and financial markets; events of force
majeure including natural disasters, acts of terrorism, political unrest, industrial accidents and their effects on our sales, purchasing, production or
financial services activities; changes in currency exchange rates; a shift in consumer preferences towards smaller, lower-margin vehicles; a possible
lack of acceptance of our products or services which limits our ability to achieve prices and adequately utilize our production capacities; price
increases for fuel or raw materials; disruption of production due to shortages of materials, labor strikes or supplier insolvencies; a decline in resale
prices of used vehicles; the effective implementation of cost-reduction and efficiency-optimization measures; the business outlook for companies in
which we hold a significant equity interest; the successful implementation of strategic cooperations and joint ventures; changes in laws, regulations
and government policies, particularly those relating to vehicle emissions, fuel economy and safety; the resolution of pending government
investigations and the conclusion of pending or threatened future legal proceedings; and other risks and uncertainties, some of which we describe
under the heading “Risk and Opportunity Report” in the current Annual Report. If any of these risks and uncertainties materializes or if the
assumptions underlying any of our forward-looking statements prove to be incorrect, the actual results may be materially different from those we
express or imply by such statements. We do not intend or assume any obligation to update these forward-looking statements since they are based
solely on the circumstances at the date of publication.