q2 2015 earnings conference call presentation
TRANSCRIPT

July 23, 2015 | Myers Industries, Inc.
Second Quarter 2015 Earnings Presentation

2
Statements in this presentation concerning the Company’s goals, strategies, and expectations for business and financial results may be "forward-looking statements" within the meaning of the Private Securities Litigation Reform Act of 1995 and are based on current indicators and expectations. Whenever you read a statement that is not simply a statement of historical fact (such as when we describe what we "believe," "expect," or "anticipate" will occur, and other similar statements), you must remember that our expectations may not be correct, even though we believe they are reasonable. We do not guarantee that the transactions and events described will happen as described (or that they will happen at all). You should review this presentation with the understanding that actual future results may be materially different from what we expect. Many of the factors that will determine these results are beyond our ability to control or predict. You are cautioned not to put undue reliance on any forward-looking statement. We do not intend, and undertake no obligation, to update these forward-looking statements. These statements involve a number of risks and uncertainties that could cause actual results to differ materially from those expressed or implied in the applicable statements. Such risks include: (1) Changes in the markets for the Company’s business segments (2) Changes in trends and demands in the markets in which the Company competes (3) Unanticipated downturn in business relationships with customers or their purchases (4) Competitive pressures on sales and pricing (5) Raw material availability, increases in raw material costs, or other production costs (6) Harsh weather conditions (7) Future economic and financial conditions in the United States and around the world (8) Inability of the Company to meet future capital requirements (9) Claims, litigation and regulatory actions against the Company (10) Changes in laws and regulations affecting the Company (11) The Company’s ability to execute the components of its Strategic Business Evolution process Myers Industries, Inc. encourages investors to learn more about these risk factors. A detailed explanation of these factors is available in the Company’s publicly filed quarterly and annual reports, which can be found online at www.myersind.com and at the SEC.gov web site.
Safe Harbor Statement
Second Quarter 2015 Financial Summary
3
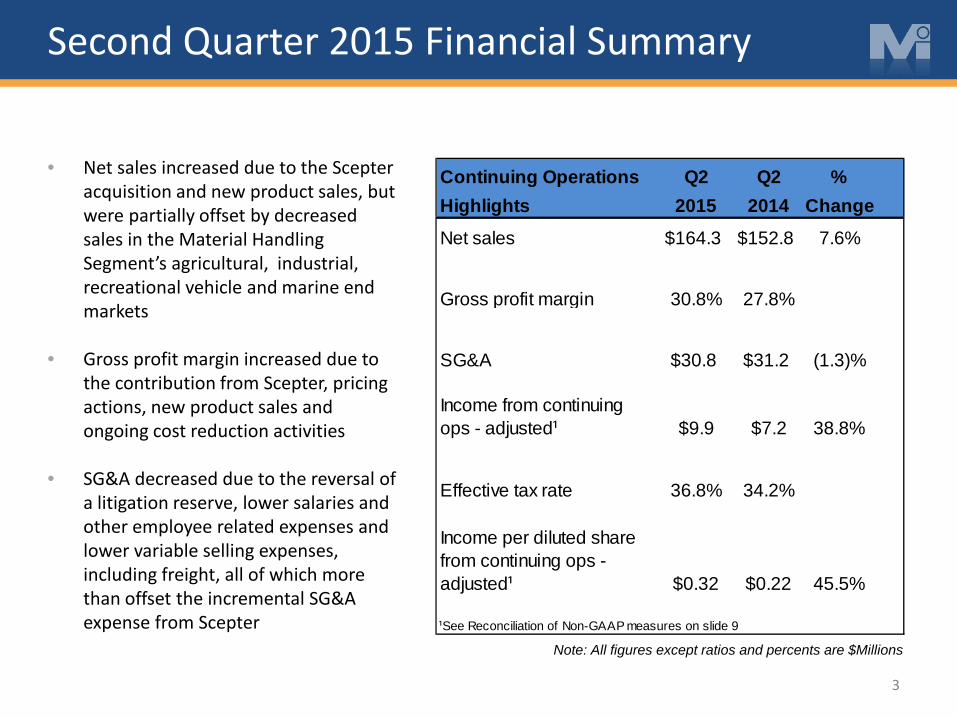
• Net sales increased due to the Scepter acquisition and new product sales, but were partially offset by decreased sales in the Material Handling Segment’s agricultural, industrial, recreational vehicle and marine end markets
• Gross profit margin increased due to the contribution from Scepter, pricing actions, new product sales and ongoing cost reduction activities
• SG&A decreased due to the reversal of a litigation reserve, lower salaries and other employee related expenses and lower variable selling expenses, including freight, all of which more than offset the incremental SG&A expense from Scepter Note: All figures except ratios and percents are $Millions
Continuing Operations Q2 Q2 %Highlights 2015 2014 Change
Net sales $164.3 $152.8 7.6%
Gross profit margin 30.8% 27.8%
SG&A $30.8 $31.2 (1.3)%
Income from continuing ops - adjusted¹ $9.9 $7.2 38.8%
Effective tax rate 36.8% 34.2%
Income per diluted share from continuing ops - adjusted¹ $0.32 $0.22 45.5%
¹See Reconciliation of Non-GAAP measures on slide 9
First Half 2015 Financial Summary
4
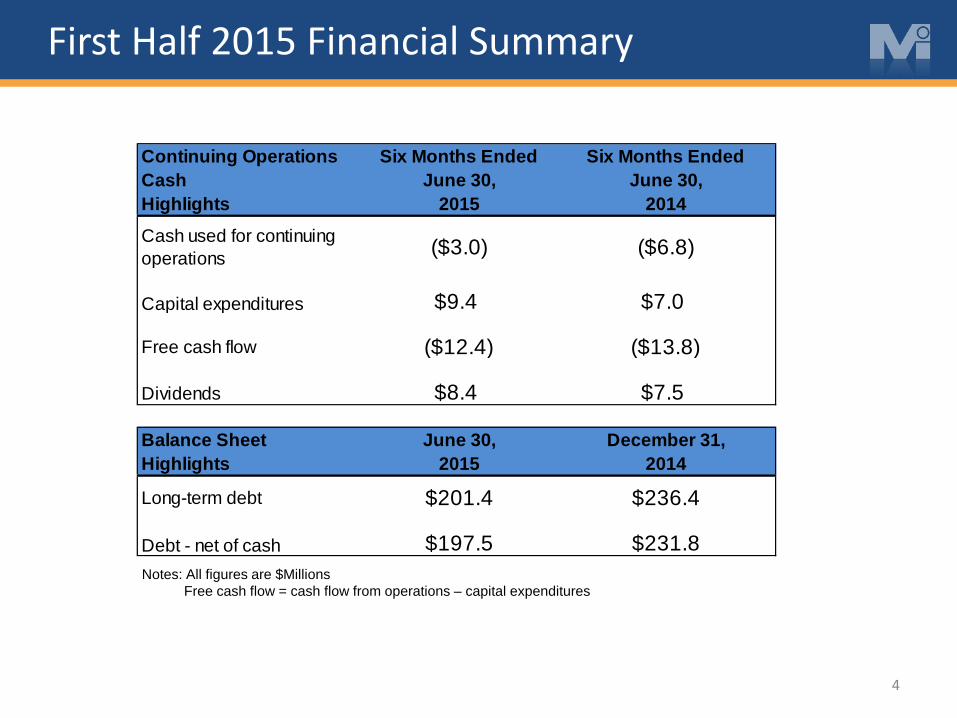
Notes: All figures are $Millions Free cash flow = cash flow from operations – capital expenditures
Continuing Operations Six Months Ended Six Months EndedCash June 30, June 30,Highlights 2015 2014
Cash used for continuing operations ($3.0) ($6.8)
Capital expenditures $9.4 $7.0
Free cash flow ($12.4) ($13.8)
Dividends $8.4 $7.5
Balance Sheet June 30, December 31,Highlights 2015 2014
Long-term debt $201.4 $236.4
Debt - net of cash $197.5 $231.8

• Incremental sales of $28.6 million from Scepter and new product sales were partially offset by sales declines in the agriculture, industrial, recreational vehicle and marine end markets as compared to Q2 2014, which resulted from weaker demand and a tough industrial economy
• Adjusted income before taxes (IBT)
increased versus Q2 2014 due to the contribution from Scepter, pricing actions, reductions in labor and overhead costs and decreased selling, general and administrative expenses
Second Quarter Results – Material Handling
5
$ Millions
See Reconciliation of Non-GAAP measures on slide 9
$115.8
$103.0
$95
$100
$105
$110
$115
$120
Q2 2015 Q2 2014
Net Sales
$18.2
$12.2
$0
$5
$10
$15
$20
Q2 2015 Q2 2014
IBT - Adjusted
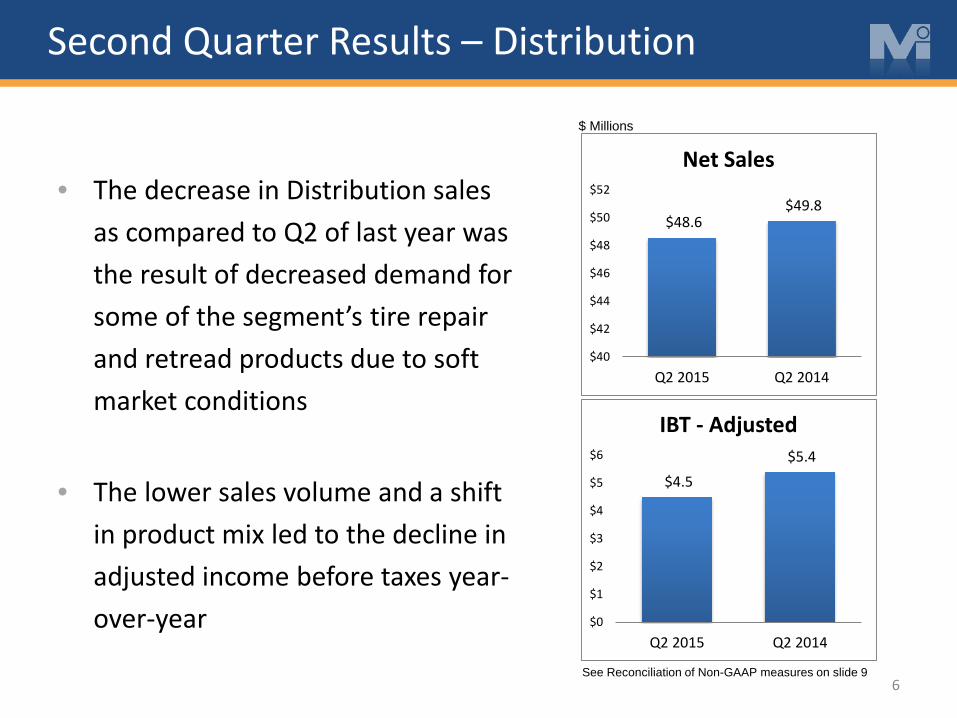
• The decrease in Distribution sales as compared to Q2 of last year was the result of decreased demand for some of the segment’s tire repair and retread products due to soft market conditions
• The lower sales volume and a shift in product mix led to the decline in adjusted income before taxes year-over-year
Second Quarter Results – Distribution
6
$ Millions
See Reconciliation of Non-GAAP measures on slide 9
$48.6 $49.8
$40
$42
$44
$46
$48
$50
$52
Q2 2015 Q2 2014
Net Sales
$4.5 $5.4
$0
$1
$2
$3
$4
$5
$6
Q2 2015 Q2 2014
IBT - Adjusted
Outlook/Guidance
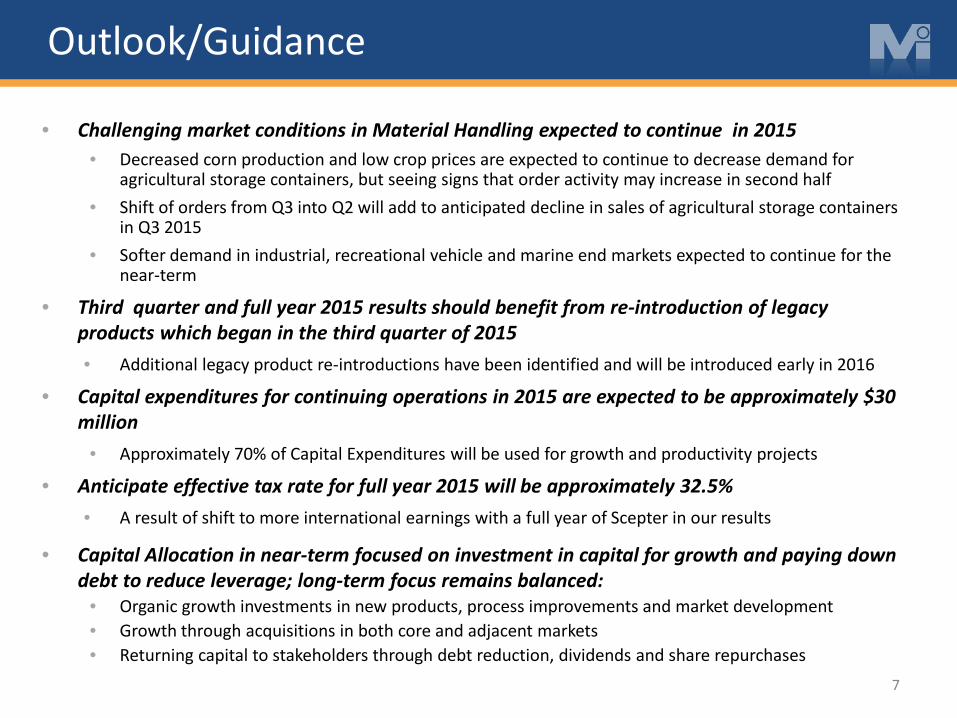
• Challenging market conditions in Material Handling expected to continue in 2015 • Decreased corn production and low crop prices are expected to continue to decrease demand for
agricultural storage containers, but seeing signs that order activity may increase in second half • Shift of orders from Q3 into Q2 will add to anticipated decline in sales of agricultural storage containers
in Q3 2015 • Softer demand in industrial, recreational vehicle and marine end markets expected to continue for the
near-term
• Third quarter and full year 2015 results should benefit from re-introduction of legacy products which began in the third quarter of 2015 • Additional legacy product re-introductions have been identified and will be introduced early in 2016
• Capital expenditures for continuing operations in 2015 are expected to be approximately $30 million
• Approximately 70% of Capital Expenditures will be used for growth and productivity projects
• Anticipate effective tax rate for full year 2015 will be approximately 32.5% • A result of shift to more international earnings with a full year of Scepter in our results
• Capital Allocation in near-term focused on investment in capital for growth and paying down debt to reduce leverage; long-term focus remains balanced:
• Organic growth investments in new products, process improvements and market development • Growth through acquisitions in both core and adjacent markets • Returning capital to stakeholders through debt reduction, dividends and share repurchases
7

Appendix
8
Reconciliation of Non-GAAP Measures
9
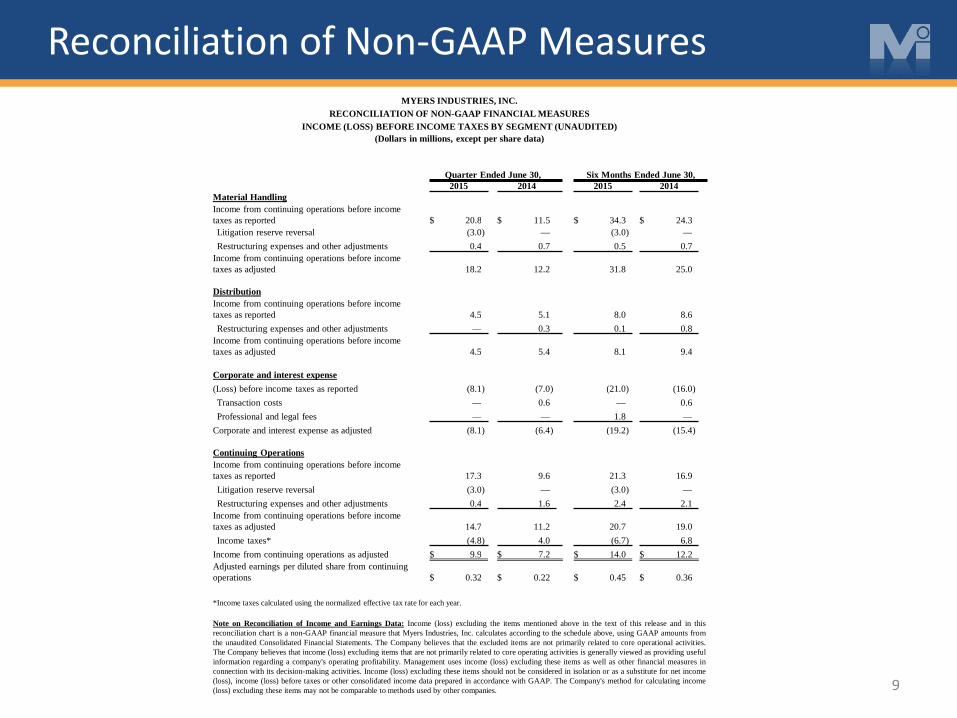
MYERS INDUSTRIES, INC. RECONCILIATION OF NON-GAAP FINANCIAL MEASURES
INCOME (LOSS) BEFORE INCOME TAXES BY SEGMENT (UNAUDITED) (Dollars in millions, except per share data)
Quarter Ended June 30, Six Months Ended June 30, 2015 2014 2015 2014 Material Handling
Income from continuing operations before income taxes as reported $ 20.8
$ 11.5
$ 34.3
$ 24.3
Litigation reserve reversal (3.0 ) — (3.0 ) —
Restructuring expenses and other adjustments 0.4 0.7 0.5 0.7
Income from continuing operations before income taxes as adjusted 18.2
12.2
31.8
25.0
Distribution
Income from continuing operations before income taxes as reported 4.5
5.1
8.0
8.6
Restructuring expenses and other adjustments — 0.3 0.1 0.8
Income from continuing operations before income taxes as adjusted 4.5
5.4
8.1
9.4
Corporate and interest expense (Loss) before income taxes as reported (8.1 ) (7.0 ) (21.0 ) (16.0 ) Transaction costs — 0.6 — 0.6 Professional and legal fees — — 1.8 —
Corporate and interest expense as adjusted (8.1 ) (6.4 ) (19.2 ) (15.4 ) Continuing Operations Income from continuing operations before income taxes as reported 17.3
9.6
21.3
16.9
Litigation reserve reversal (3.0 ) — (3.0 ) — Restructuring expenses and other adjustments 0.4 1.6 2.4 2.1
Income from continuing operations before income taxes as adjusted 14.7
11.2
20.7
19.0
Income taxes* (4.8 ) 4.0 (6.7 ) 6.8 Income from continuing operations as adjusted $ 9.9 $ 7.2 $ 14.0 $ 12.2 Adjusted earnings per diluted share from continuing operations $ 0.32
$ 0.22
$ 0.45
$ 0.36
*Income taxes calculated using the normalized effective tax rate for each year. Note on Reconciliation of Income and Earnings Data: Income (loss) excluding the items mentioned above in the text of this release and in this reconciliation chart is a non-GAAP financial measure that Myers Industries, Inc. calculates according to the schedule above, using GAAP amounts from the unaudited Consolidated Financial Statements. The Company believes that the excluded items are not primarily related to core operational activities. The Company believes that income (loss) excluding items that are not primarily related to core operating activities is generally viewed as providing useful information regarding a company's operating profitability. Management uses income (loss) excluding these items as well as other financial measures in connection with its decision-making activities. Income (loss) excluding these items should not be considered in isolation or as a substitute for net income (loss), income (loss) before taxes or other consolidated income data prepared in accordance with GAAP. The Company's method for calculating income (loss) excluding these items may not be comparable to methods used by other companies.
Market Indicators
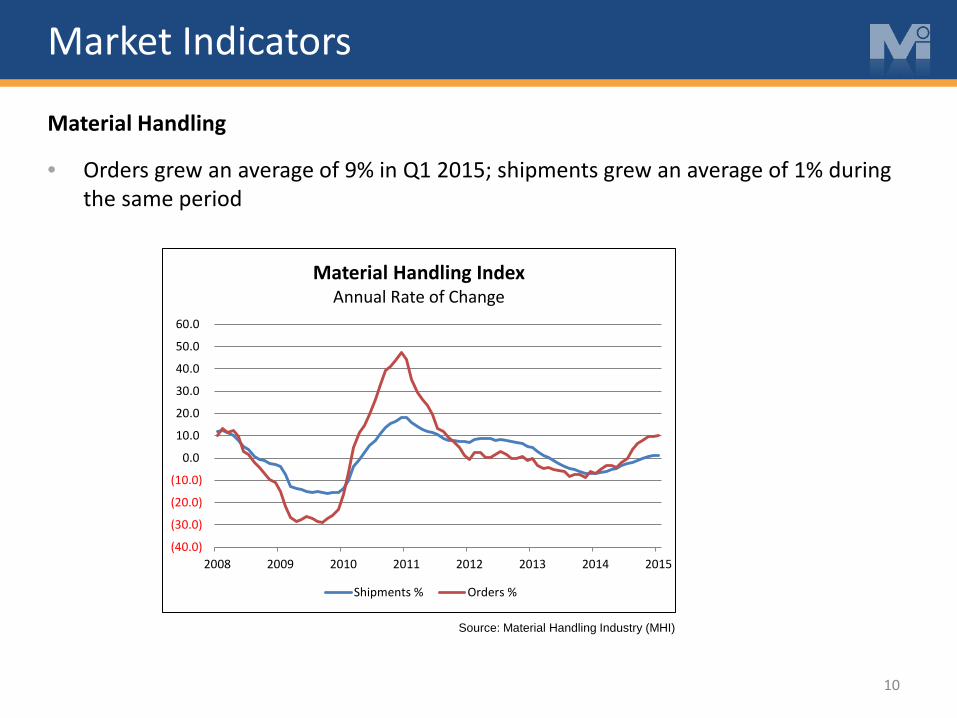
• Orders grew an average of 9% in Q1 2015; shipments grew an average of 1% during the same period
10
Material Handling
Source: Material Handling Industry (MHI)
(40.0)
(30.0)
(20.0)
(10.0)
0.0
10.0
20.0
30.0
40.0
50.0
60.0
2008 2009 2010 2011 2012 2013 2014 2015
Material Handling Index Annual Rate of Change
Shipments % Orders %

Market Indicators
• The Outdoor Power Equipment Institute (OPEI) estimates that total outdoor power equipment shipments will increase by 3.6% in 2015.
11
Material Handling
Source: OPEI U.S. Econometric Forecast – December 2014
2009 2010 2011 2012 2013 2014 2015 2016Consumer Products 6,223,328 6,588,176 5,875,396 6,191,291 6,379,735 5,897,982 6,221,402 6,553,717
Percent Change -10.6 5.9 -10.8 5.4 3.0 -7.6 5.5 5.3
Commercial Products 131,050 180,226 183,609 182,817 221,200 224,227 238,675 253,264 Percent Change -34.4 37.5 1.9 -0.4 21.0 1.4 6.4 6.1
Handheld Products 10,558,563 10,825,352 10,365,472 10,921,443 10,909,630 11,149,771 11,430,870 11,679,547 Percent Change -7.9 2.5 -4.2 5.4 -0.1 2.2 2.5 2.2
Total 16,912,941 17,593,754 16,424,477 17,295,551 17,510,565 17,271,980 17,890,947 18,486,528 -9.1 4.0 -6.6 5.3 1.2 -1.4 3.6 3.3
ACTUAL FORECAST

Market Indicators
• Recreational vehicle shipments are forecasted to decline in 2015 vs. 2014 by almost 6%
12
Material Handling
Source: RVIA Release
12.4 10.6
-5.8
(40)
(30)
(20)
(10)
0
10
20
30
40
50
60
0.0
50.0
100.0
150.0
200.0
250.0
300.0
350.0
400.0
450.0
2006 2007 2008 2009 2010 2011 2012 2013 2014 2015F
Annu
al R
ate
of C
hang
e (%
)
Uni
ts (0
00)
RV Shipments
RV Unit Shipments (000) % Change from P/Y
Market Indicators
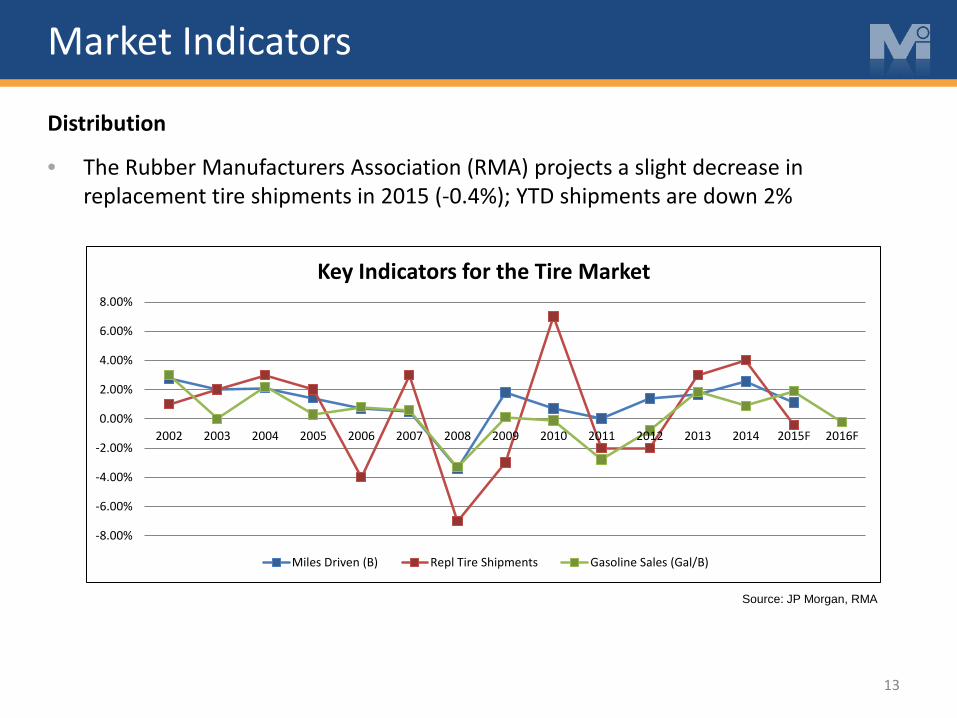
• The Rubber Manufacturers Association (RMA) projects a slight decrease in replacement tire shipments in 2015 (-0.4%); YTD shipments are down 2%
13
Distribution
Source: JP Morgan, RMA
-8.00%
-6.00%
-4.00%
-2.00%
0.00%
2.00%
4.00%
6.00%
8.00%
2002 2003 2004 2005 2006 2007 2008 2009 2010 2011 2012 2013 2014 2015F 2016F
Key Indicators for the Tire Market
Miles Driven (B) Repl Tire Shipments Gasoline Sales (Gal/B)