hi q2-2015-earnings-call-presentation-final
TRANSCRIPT

Second Quarter Financial Results May 12, 2015
Pursuing Growth • Building Value
a global diversified industrial company
2015 Hillenbrand
Hillenbrand Participants
Q2 ‘15 Earnings Presentation | 2
Joe Raver
– CEO
Kristina Cerniglia
– CFO
Thomas Kehl
– President, Coperion
Kim Ryan
– President, Batesville
2015 Hillenbrand
Forward-Looking Statements and Factors That May Affect Future Results:
Throughout this presentation, we make a number of “forward-looking statements” within the meaning of the Private Securities Litigation Reform Act of
1995. As the words imply, these are statements about future plans, objectives, beliefs, and expectations that might or might not happen in the future, as
contrasted with historical information. Forward-looking statements are based on assumptions that we believe are reasonable, but by their very nature are
subject to a wide range of risks.
Accordingly, in this presentation, we may say something like,
“We expect that future revenue associated with the Process Equipment Group will be influenced by order backlog.”
That is a forward-looking statement, as indicated by the word “expect” and by the clear meaning of the sentence.
Other words that could indicate we are making forward-looking statements include:
This is not an exhaustive list, but is intended to give you an idea of how we try to identify forward-looking statements. The absence of any of these words,
however, does not mean that the statement is not forward-looking.
Here is the key point: Forward-looking statements are not guarantees of future performance, and our actual results could differ materially from those set
forth in any forward-looking statements. Any number of factors, many of which are beyond our control, could cause our performance to differ significantly
from what is described in the forward-looking statements.
For a discussion of factors that could cause actual results to differ from those contained in forward-looking statements, see the discussions under the
heading “Risk Factors” in Item 1A of Part I our Form 10-Q for the period ended March 31, 2015, located on our website and filed with the SEC. We
assume no obligation to update or revise any forward-looking statements.
Disclosure regarding forward-looking statements
Q2 ‘15 Earnings Presentation | 3
2015 Hillenbrand
Hillenbrand’s strategy is focused on three key areas
Q2 ‘15 Earnings Presentation | 4
Develop Hillenbrand into a world-class global diversified industrial company
Leverage our strong financial foundation and the Hillenbrand Business System to deliver sustainable profit growth, revenue expansion, and free cash flow
Reinvest this cash in new growth initiatives, both organic and inorganic, that create shareholder value
2015 Hillenbrand
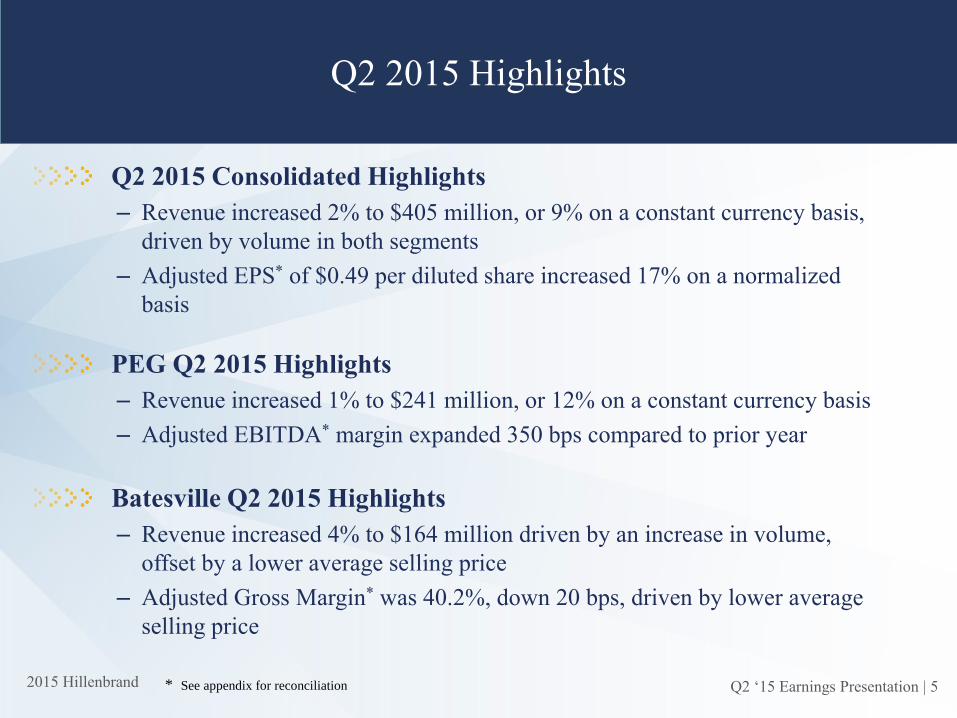
Q2 2015 Highlights
Q2 ‘15 Earnings Presentation | 5
Q2 2015 Consolidated Highlights
– Revenue increased 2% to $405 million, or 9% on a constant currency basis,
driven by volume in both segments
– Adjusted EPS* of $0.49 per diluted share increased 17% on a normalized
basis
PEG Q2 2015 Highlights
– Revenue increased 1% to $241 million, or 12% on a constant currency basis
– Adjusted EBITDA* margin expanded 350 bps compared to prior year
Batesville Q2 2015 Highlights
– Revenue increased 4% to $164 million driven by an increase in volume,
offset by a lower average selling price
– Adjusted Gross Margin* was 40.2%, down 20 bps, driven by lower average
selling price
* See appendix for reconciliation
2015 Hillenbrand
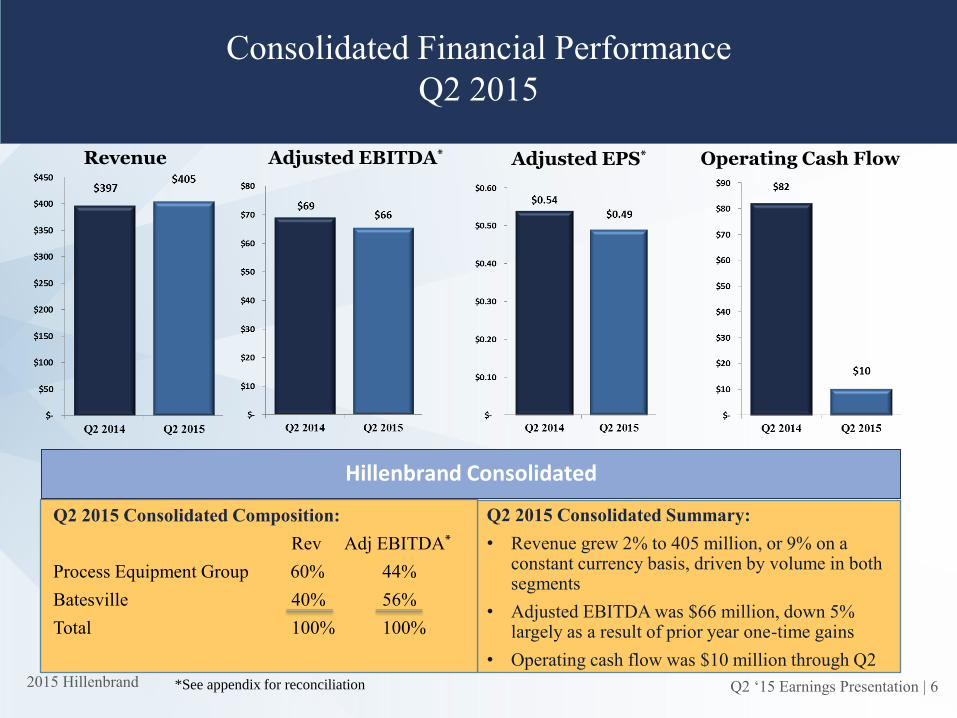
Consolidated Financial Performance
Q2 2015
Adjusted EPS*
Q2 2015 Consolidated Summary:
• Revenue grew 2% to 405 million, or 9% on a constant currency basis, driven by volume in both segments
• Adjusted EBITDA was $66 million, down 5% largely as a result of prior year one-time gains
• Operating cash flow was $10 million through Q2
Hillenbrand Consolidated
Operating Cash Flow
Q2 ‘15 Earnings Presentation | 6
Adjusted EBITDA* Revenue
*See appendix for reconciliation
Q2 2015 Consolidated Composition:
Rev Adj EBITDA*
Process Equipment Group 60% 44%
Batesville 40% 56%
Total 100% 100%
2015 Hillenbrand Q2 ‘15 Earnings Presentation | 7
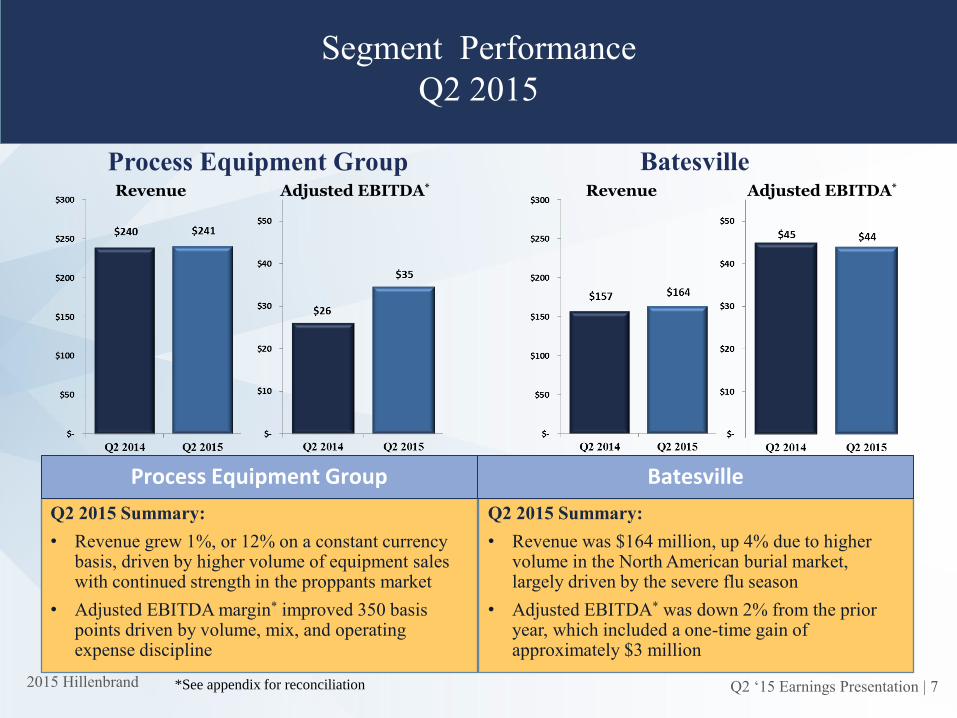
Segment Performance
Q2 2015
Process Equipment Group Batesville Revenue Adjusted EBITDA* Revenue Adjusted EBITDA*
Q2 2015 Summary:
• Revenue was $164 million, up 4% due to higher volume in the North American burial market, largely driven by the severe flu season
• Adjusted EBITDA* was down 2% from the prior year, which included a one-time gain of approximately $3 million
Process Equipment Group Batesville
*See appendix for reconciliation
Q2 2015 Summary:
• Revenue grew 1%, or 12% on a constant currency basis, driven by higher volume of equipment sales with continued strength in the proppants market
• Adjusted EBITDA margin* improved 350 basis points driven by volume, mix, and operating expense discipline
2015 Hillenbrand
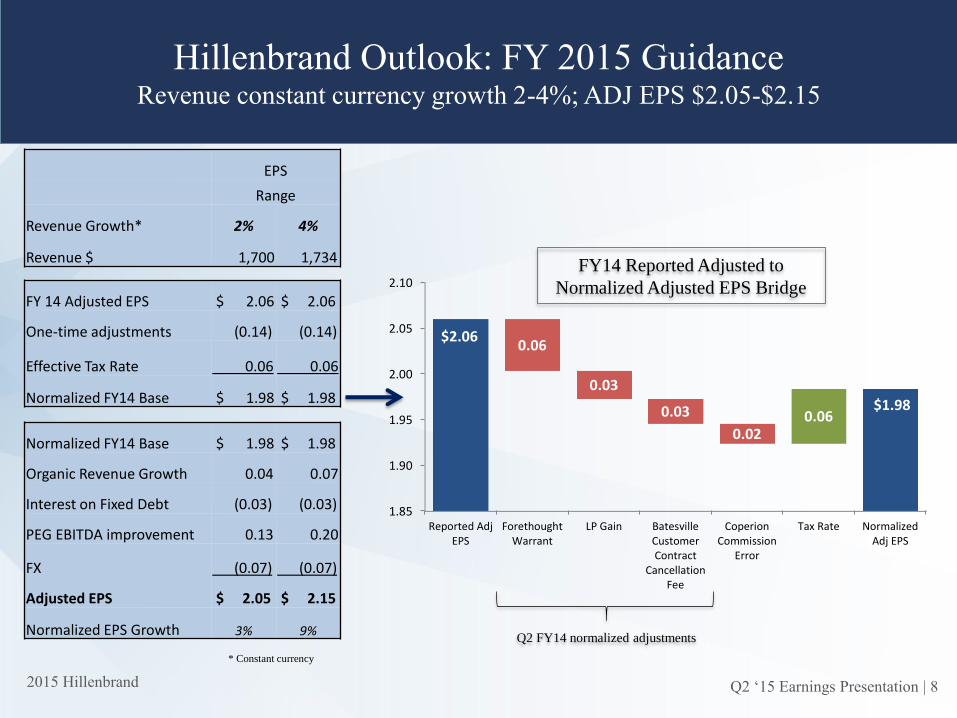
1.85
1.90
1.95
2.00
2.05
2.10
Reported AdjEPS
ForethoughtWarrant
LP Gain BatesvilleCustomerContract
CancellationFee
CoperionCommission
Error
Tax Rate NormalizedAdj EPS
$2.06
$1.98
0.06
0.03
0.03
0.02 0.06
Hillenbrand Outlook: FY 2015 Guidance Revenue constant currency growth 2-4%; ADJ EPS $2.05-$2.15
Q2 ‘15 Earnings Presentation | 8
EPS
Range
Revenue Growth* 2% 4%
Revenue $ 1,700 1,734
FY 14 Adjusted EPS $ 2.06 $ 2.06
One-time adjustments (0.14) (0.14)
Effective Tax Rate 0.06 0.06
Normalized FY14 Base $ 1.98 $ 1.98
Normalized FY14 Base $ 1.98 $ 1.98
Organic Revenue Growth 0.04 0.07
Interest on Fixed Debt (0.03) (0.03)
PEG EBITDA improvement 0.13 0.20
FX (0.07) (0.07)
Adjusted EPS $ 2.05 $ 2.15
Normalized EPS Growth 3% 9%
FY14 Reported Adjusted to
Normalized Adjusted EPS Bridge
* Constant currency
Q2 FY14 normalized adjustments
2015 Hillenbrand
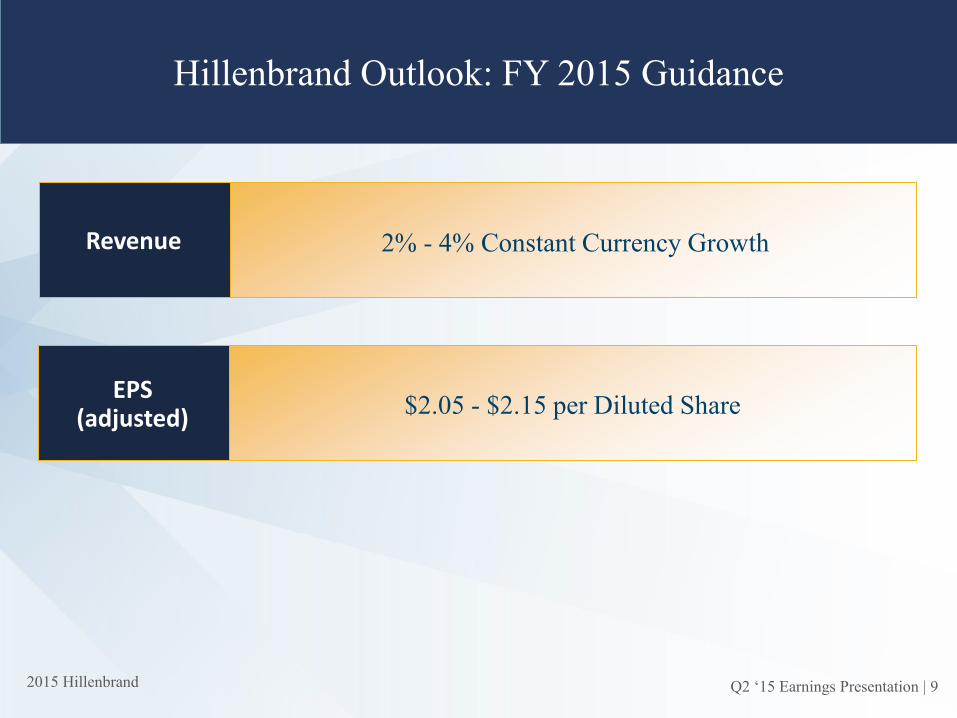
Hillenbrand Outlook: FY 2015 Guidance
2% - 4% Constant Currency Growth Revenue
Q2 ‘15 Earnings Presentation | 9
$2.05 - $2.15 per Diluted Share EPS
(adjusted)

Q&A
Q2 ‘15 Earnings Presentation | 10
2015 Hillenbrand
Replay Information
Q2 ‘15 Earnings Presentation | 11
Dial In: (855) 859-2056
International: +1 (404) 537-3406
Conference ID: 9488261
Encore Replay Dates: 5/12/2015 - 5/26/2015
Log on to: http://ir.hillenbrandinc.com/investor-relations

2015 Hillenbrand
Appendix
Q2 ‘15 Earnings Presentation | 12
2015 Hillenbrand
Disclosure regarding non-GAAP measures
While we report financial results in accordance with accounting principles generally accepted in the United States (GAAP), we also provide certain non-GAAP operating performance measures. These non-GAAP measures are referred to as “adjusted” and exclude expenses associated with backlog amortization, inventory step-up, business acquisition and integration, restructuring, and antitrust litigation. The related income tax for all of these items is also excluded. This non-GAAP information is provided as a supplement, not as a substitute for, or as superior to, measures of financial performance prepared in accordance with GAAP.
One important non-GAAP measure that we use is Adjusted Earnings Before Interest, Income Tax, Depreciation, and Amortization (“Adjusted EBITDA”). As previously discussed, a part of our strategy is to selectively acquire companies that we believe can benefit from our core competencies to spur faster and more profitable growth. Given that strategy, it is a natural consequence to incur related expenses, such as amortization from acquired intangible assets and additional interest expense from debt-funded acquisitions. Accordingly, we use Adjusted EBITDA, among other measures, to monitor our business performance.
Another important non-GAAP measure that we use is backlog. Backlog is not a term recognized under GAAP; however, it is a common measurement used in the Process Equipment Group industry. Our backlog represents the amount of consolidated revenue that we expect to realize on contracts awarded related to the Process Equipment Group. Backlog includes expected revenue from large systems, equipment, and to a lesser extent, replacement parts, components, and service.
We use this non-GAAP information internally to make operating decisions and believe it is helpful to investors because it allows more meaningful period-to-period comparisons of our ongoing operating results. The information can also be used to perform trend analysis and to better identify operating trends that may otherwise be masked or distorted by these types of items. Finally, the Company believes such information provides a higher degree of transparency.
13 Q2 ‘15 Earnings Presentation | 13
2015 Hillenbrand Q2 ‘15 Earnings Presentation | 14
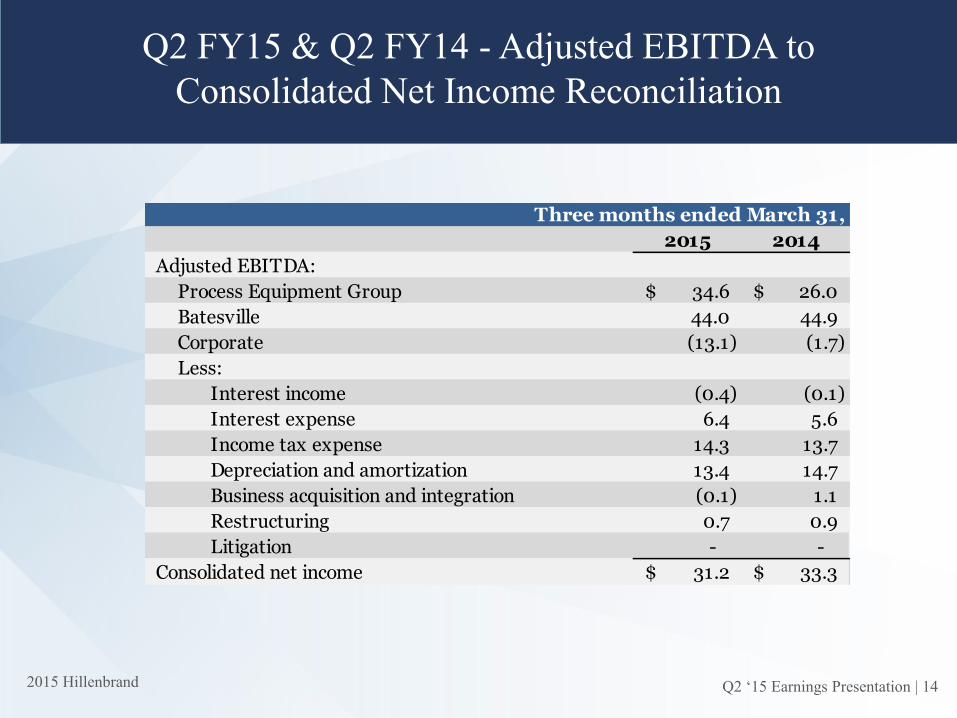
Q2 FY15 & Q2 FY14 - Adjusted EBITDA to
Consolidated Net Income Reconciliation
2015 2014
Adjusted EBITDA:
Process Equipment Group 34.6$ 26.0$
Batesville 44.0 44.9
Corporate (13.1) (1.7)
Less:
Interest income (0.4) (0.1)
Interest expense 6.4 5.6
Income tax expense 14.3 13.7
Depreciation and amortization 13.4 14.7
Business acquisition and integration (0.1) 1.1
Restructuring 0.7 0.9
Litigation - -
Consolidated net income 31.2$ 33.3$
Three months ended March 31,
2015 Hillenbrand Q2 ‘15 Earnings Presentation | 15
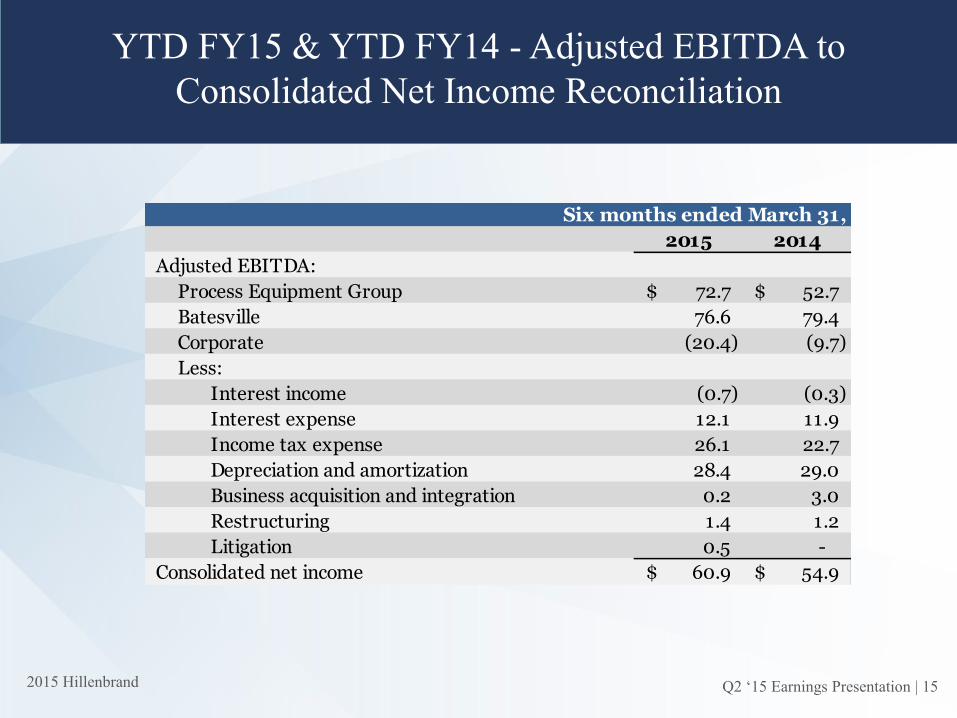
YTD FY15 & YTD FY14 - Adjusted EBITDA to
Consolidated Net Income Reconciliation
2015 2014
Adjusted EBITDA:
Process Equipment Group 72.7$ 52.7$
Batesville 76.6 79.4
Corporate (20.4) (9.7)
Less:
Interest income (0.7) (0.3)
Interest expense 12.1 11.9
Income tax expense 26.1 22.7
Depreciation and amortization 28.4 29.0
Business acquisition and integration 0.2 3.0
Restructuring 1.4 1.2
Litigation 0.5 -
Consolidated net income 60.9$ 54.9$
Six months ended March 31,
2015 Hillenbrand
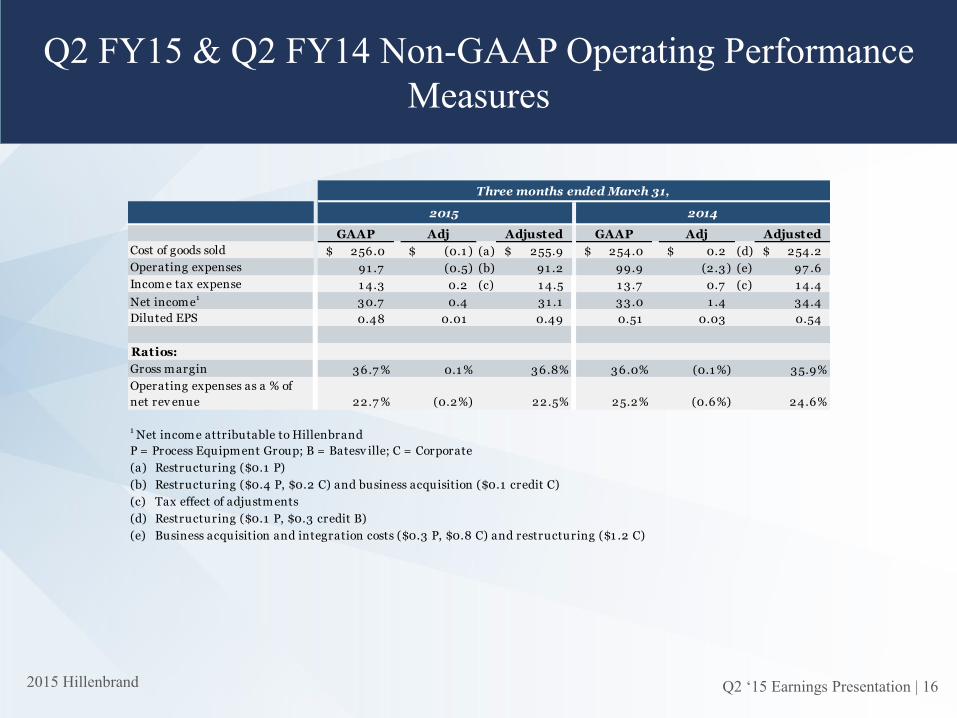
Q2 FY15 & Q2 FY14 Non-GAAP Operating Performance
Measures
Q2 ‘15 Earnings Presentation | 16
GAAP Adj Adjusted GAAP Adj Adjusted
Cost of goods sold 256.0$ (0.1 )$ (a) 255.9$ 254.0$ 0.2$ (d) 254.2$
Operating expenses 91 .7 (0.5) (b) 91 .2 99.9 (2.3) (e) 97 .6
Income tax expense 1 4.3 0.2 (c) 1 4.5 1 3 .7 0.7 (c) 1 4.4
Net income1
30.7 0.4 31 .1 33 .0 1 .4 34.4
Diluted EPS 0.48 0.01 0.49 0.51 0.03 0.54
Ratios:
Gross margin 36.7 % 0.1 % 36.8% 36.0% (0.1 %) 35.9%
22.7 % (0.2%) 22.5% 25.2% (0.6%) 24.6%
1 Net income attributable to Hillenbrand
P = Process Equipment Group; B = Batesv ille; C = Corporate
(a) Restructuring ($0.1 P)
(b) Restructuring ($0.4 P, $0.2 C) and business acquisition ($0.1 credit C)
(c) Tax effect of adjustments
(d) Restructuring ($0.1 P, $0.3 credit B)
(e) Business acquisition and integration costs ($0.3 P, $0.8 C) and restructuring ($1 .2 C)
Three months ended March 31,
2014
Operating expenses as a % of
net rev enue
2015

2015 Hillenbrand
YTD FY15 & YTD FY14 Non-GAAP Operating Performance
Measures
Q2 ‘15 Earnings Presentation | 17
GAAP Adj Adjusted GAAP Adj Adjusted
Cost of goods sold 51 9.1$ (1 .3)$ (a) 51 7 .8$ 507 .9$ 0.1$ (d) 508.0$
Operating expenses 1 82.9 (2.0) (b) 1 80.9 1 93.9 (4.4) (e) 1 89.5
Income tax expense 26.1 1 .0 (c) 27 .1 22.7 1 .3 (c) 24.0
Net income1
60.2 2 .3 62.5 53 .3 3 .0 56.3
Diluted EPS 0.94 0.04 0.98 0.83 0.05 0.88
Ratios:
Gross margin 35.6% 0.2% 35.8% 35.0% - 35.0%
22.7 % (0.3%) 22.4% 24.8% (0.6%) 24.2%
1 Net income attributable to Hillenbrand
P = Process Equipment Group; B = Batesv ille; C = Corporate
(a) Restructuring ($1 .2 B, $0.1 P)
(b) Restructuring ($0.7 P, $0.6 C), litigation ($0.5 B), and business acquisition and integration ($0.1 C, $0.1 P)
(c) Tax effect of adjustments
(d) Restructuring ($0.1 P, $0.2 credit B)
(e) Business acquisition and integration costs ($1 .0 P, $2.0 C), restructuring ($0.2 P, $1 .2 C)
2015 2014
Six months ended March 31,
Operating expenses as a % of
net rev enue