q1/ 2014 - telenor€¦ · q1/ 2014 interim report january ... while telenor recently secured new...
TRANSCRIPT

Q1/ 2014 Interim report January – March 2014

ContentsHighlights /01/
Interim report /02/Telenor’s operations /02/Group overview /08/Outlook for 2014 /10/
Condensed interim financial information /11/Notes to the consolidated interim financial statements /16/
Definitions /20/

TELENOR FIRST QUARTER 2014
/PAGE 1/
Jon Fredrik BaksaasPresident & CEO
Highlights first quarter 2014• Organic revenue growth of 1% 1)
• EBITDA margin of 35%• Operating cash flow of NOK 5.6 billion 2)
• Earnings per share of NOK 2.43
“I am pleased to present a solid start to the year. We added 6 million new mobile subscribers in the first quarter of 2014, the company’s best customer surge in two years. This growth was mainly driven by India, Pakistan and Bangladesh. The underlying mobile service revenue growth improved to 5 percent in the quarter.
In Norway, our growth and efficiency initiatives continue to be a top priority. We see rising demand for larger data packages, which resulted in improved mobile revenue growth of more than 3 percent in the quarter. Competitive pressure and declining revenues from traditional fixed telephony require us to focus on streamlining our operations and investments. At the same time, Telenor is implementing a major technology shift with an annual investment of more than NOK 4 billion.
The migration of customers to our new 3G network in Thailand is on track, with some 60 percent transferred. The move from a concession to a licence regime is already contributing to significant regulatory cost savings. The slow-down in revenue growth is explained by reduced interconnect rates, lower voice prices and the recent weakness in the Thai economy.
Mobile data represents the next growth curve for Telenor. We are persistently working to increase the number of active internet subscribers across all our markets. Out of our total customer base of 172 million subscribers, some 20
percent are currently active internet users 3), representing a large growth potential. While Telenor recently secured new spectrum in India and Pakistan, our business in Bangladesh significantly improved its 3G coverage during the first three months of the year. Our Indian operation reported an organic revenue growth of 44 percent in the quarter, gaining significant market share. We also launched a new internet strategy in India, focusing on affordable and service-based internet offers.
In conclusion, we had an encouraging start to the year. Our efficiency agenda is progressing, while we continue to work on bringing affordable internet to all and connecting the unconnected. However, we need to see continued improvement in all our markets, in particular a pick-up in revenues in Thailand and improved returns on the significant investments in Norway.
We maintain our financial outlook for the year, excluding Myanmar, of low single-digit organic revenue growth, a stable EBITDA margin and a capex to sales ratio of around 16%.”
Key figures Telenor Group
1st quarter Year
(NOK in millions except earnings per share) 2014 2013 2013
Revenues 26 515 24 716 104 027
EBITDA before other income and expenses 9 298 8 423 35 892
EBITDA before other income and expenses/Revenues (%) 35.1 34.1 34.5
Adjusted operating profit 4) 5 580 4 985 22 161
Adjusted operating profit/Revenues (%) 21.0 20.2 21.3
Profit after taxes and non-controlling interests 3 676 3 602 8 748
Earnings per share from total operations, basic, in NOK 2.43 2.34 5.74
Capex 6 595 2 868 17 044
Capex excl. licences and spectrum 3 694 2 868 14 659
Capex excl. licences and spectrum/Revenues (%) 13.9 11.6 14.1
Operating cash flow 2) 5 604 5 555 21 233
Net interest-bearing liabilities 5) 37 237 28 853 39 395
Please refer to page 10 for the full outlook for 2014, and page 20 for definitions.
1) Organic revenue is defined as revenue adjusted for the effects of acquisition and disposal of operations and currency effects.2) Operating cash flow is defined as EBITDA before other income and expenses – Capex, excluding licences and spectrum.3) See Definitions for details. 4) Adjusted operating profit is defined as Operating profit less other income and expenses and impairment losses.5) Net interest-bearing liabilities are defined as net interest-bearing debt excluding net present value of licence liabilities.
A solid start to the year

TELENOR FIRST QUARTER 2014
/PAGE 2/
Norway
1st quarter Year
(NOK in millions) 2014 2013 2013
Revenues mobile operation
Subscription and traffic 2 571 2 510 10 112
Interconnect revenues 194 188 777
Other mobile revenues 333 315 1 315
Non-mobile revenues 261 232 1 103
Total revenues mobile operation 3 358 3 245 13 308
Revenues fixed operation
Telephony 624 732 2 782
Internet and TV 1 324 1 232 5 060
Data services 112 121 463
Other fixed revenues 396 343 1 504
Total retail revenues 2 456 2 428 9 810
Wholesale revenues 463 492 1 953
Total revenues fixed operation 2 918 2 920 11 763
Total revenues 6 276 6 165 25 071
EBITDA before other items 2 658 2 717 10 758
Operating profit 1 507 1 916 7 423
EBITDA before other items/Total revenues (%) 42.4 44.1 42.9
Capex 1 048 988 4 863
Investments in businesses - 20 101
Mobile ARPU - monthly (NOK) 287 284 285
Fixed Telephony ARPU 264 270 271
Fixed Internet ARPU 337 320 327
TV ARPU 276 245 256
No. of subscriptions - Change in quarter/Total (in thousands):
Mobile 1 (5) 3 216
Fixed telephony (28) (31) 800
Fixed Internet 1 (3) 864
TV 2 3 527
• The number of mobile subscriptions increased by 1,000 during the quarter. At the end of the quarter, the subscription base was 1% higher than at the end of first quarter last year.
• Reported mobile ARPU increased 1% or NOK 3. Reduced roaming tariffs impacted ARPU negatively with NOK 2. ARPU was positively impacted by development in price plan mix in the consumer market, partly offset by sustained price competition in large enterprise market.
• Total mobile revenues increased 3% from higher subscription base, increased ARPU and increased revenues from handset sales. Mobile subscription and traffic revenues increased by 2%.
• Fixed revenues were stable. Increased revenues from Internet, TV and other fixed retail were offset by reductions in fixed telephony service and wholesale.
• The EBITDA margin decreased by 2 percentage points due to change in product mix towards low-margin hardware sales, increased TV content costs and increased operational expenses. Operation and maintenance costs increased due to higher fault rates following challenging weather and fire incidents with pending insurance claims.
• Operating profit declined by 21% mainly driven by NOK 277 million related to workforce reductions.
• Capital expenditures were driven by continued 4G and fibre footprint expansion. By the end of the first quarter, Telenor’s 4G network covered more than 57% of the population and during the quarter Telenor added 7,000 fibre customers, bringing the total customer base on fibre to 88,000.
• In April, Telenor Norway entered into a new national roaming agreement with Tele2.
Interim report Telenor’s operations
The comments below are related to Telenor’s development in the first quarter of 2014 compared to the first quarter of 2013, unless otherwise stated. All comments on EBITDA are made on development in EBITDA before other income and expenses (other items). Please refer to page 8 for ‘Specification of other income and expenses’. Additional information is available at: www.telenor.com/ir
TELENOR FIRST QUARTER 2014
/PAGE 3/
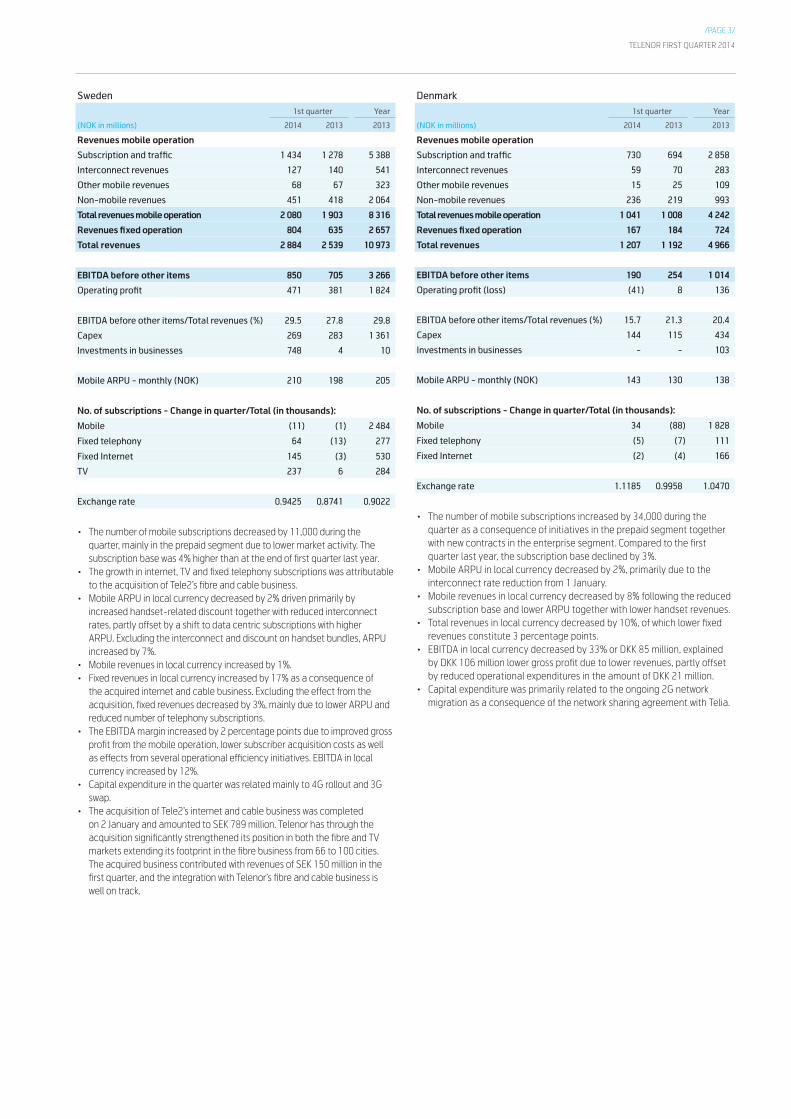
Sweden
1st quarter Year
(NOK in millions) 2014 2013 2013
Revenues mobile operation
Subscription and traffic 1 434 1 278 5 388
Interconnect revenues 127 140 541
Other mobile revenues 68 67 323
Non-mobile revenues 451 418 2 064
Total revenues mobile operation 2 080 1 903 8 316
Revenues fixed operation 804 635 2 657
Total revenues 2 884 2 539 10 973
EBITDA before other items 850 705 3 266
Operating profit 471 381 1 824
EBITDA before other items/Total revenues (%) 29.5 27.8 29.8
Capex 269 283 1 361
Investments in businesses 748 4 10
Mobile ARPU - monthly (NOK) 210 198 205
No. of subscriptions - Change in quarter/Total (in thousands):
Mobile (11) (1) 2 484
Fixed telephony 64 (13) 277
Fixed Internet 145 (3) 530
TV 237 6 284
Exchange rate 0.9425 0.8741 0.9022
• The number of mobile subscriptions decreased by 11,000 during the quarter, mainly in the prepaid segment due to lower market activity. The subscription base was 4% higher than at the end of first quarter last year.
• The growth in internet, TV and fixed telephony subscriptions was attributable to the acquisition of Tele2’s fibre and cable business.
• Mobile ARPU in local currency decreased by 2% driven primarily by increased handset-related discount together with reduced interconnect rates, partly offset by a shift to data centric subscriptions with higher ARPU. Excluding the interconnect and discount on handset bundles, ARPU increased by 7%.
• Mobile revenues in local currency increased by 1%. • Fixed revenues in local currency increased by 17% as a consequence of
the acquired internet and cable business. Excluding the effect from the acquisition, fixed revenues decreased by 3%, mainly due to lower ARPU and reduced number of telephony subscriptions.
• The EBITDA margin increased by 2 percentage points due to improved gross profit from the mobile operation, lower subscriber acquisition costs as well as effects from several operational efficiency initiatives. EBITDA in local currency increased by 12%.
• Capital expenditure in the quarter was related mainly to 4G rollout and 3G swap.
• The acquisition of Tele2’s internet and cable business was completed on 2 January and amounted to SEK 789 million. Telenor has through the acquisition significantly strengthened its position in both the fibre and TV markets extending its footprint in the fibre business from 66 to 100 cities. The acquired business contributed with revenues of SEK 150 million in the first quarter, and the integration with Telenor’s fibre and cable business is well on track.
Denmark
1st quarter Year
(NOK in millions) 2014 2013 2013
Revenues mobile operation
Subscription and traffic 730 694 2 858
Interconnect revenues 59 70 283
Other mobile revenues 15 25 109
Non-mobile revenues 236 219 993
Total revenues mobile operation 1 041 1 008 4 242
Revenues fixed operation 167 184 724
Total revenues 1 207 1 192 4 966
EBITDA before other items 190 254 1 014
Operating profit (loss) (41) 8 136
EBITDA before other items/Total revenues (%) 15.7 21.3 20.4
Capex 144 115 434
Investments in businesses - - 103
Mobile ARPU - monthly (NOK) 143 130 138
No. of subscriptions - Change in quarter/Total (in thousands):
Mobile 34 (88) 1 828
Fixed telephony (5) (7) 111
Fixed Internet (2) (4) 166
Exchange rate 1.1185 0.9958 1.0470
• The number of mobile subscriptions increased by 34,000 during the quarter as a consequence of initiatives in the prepaid segment together with new contracts in the enterprise segment. Compared to the first quarter last year, the subscription base declined by 3%.
• Mobile ARPU in local currency decreased by 2%, primarily due to the interconnect rate reduction from 1 January.
• Mobile revenues in local currency decreased by 8% following the reduced subscription base and lower ARPU together with lower handset revenues.
• Total revenues in local currency decreased by 10%, of which lower fixed revenues constitute 3 percentage points.
• EBITDA in local currency decreased by 33% or DKK 85 million, explained by DKK 106 million lower gross profit due to lower revenues, partly offset by reduced operational expenditures in the amount of DKK 21 million.
• Capital expenditure was primarily related to the ongoing 2G network migration as a consequence of the network sharing agreement with Telia.

TELENOR FIRST QUARTER 2014
/PAGE 4/
Hungary
1st quarter Year
(NOK in millions) 2014 2013 2013
Revenues
Subscription and traffic 772 741 3 177
Interconnect revenues 134 114 506
Other mobile revenues 21 17 85
Non-mobile revenues 69 57 254
Total revenues 996 930 4 022
EBITDA before other items 368 355 1 393
Operating profit 238 255 968
EBITDA before other items/Total revenues (%) 36.9 38.2 34.6
Capex 54 62 933
No. of subscriptions - Change in quarter/ Total (in thousands): (23) (69) 3 270
ARPU - monthly (NOK) 93 87 94
Exchange rate 0.0271 0.0251 0.0263
• The number of subscriptions deceased by 23,000 in the quarter, mainly due to seasonal churn in prepaid. The subscription base was stable compared to the same period last year.
• ARPU in local currency decreased by 1% mainly due to reduced traffic revenues partly offset by increased interconnect revenues.
• Revenues in local currency decreased by 1% due to lower ARPU partly offset by increased handset sales.
• The EBITDA margin decreased by 1 percentage point, mainly explained by increased handset costs and telecommunication tax partly being offset by lower operating expenses. In this quarter, NOK 99 million was recognised for the telecommunication tax, having a negative effect on the EBITDA margin of 10 percentage points.
• The capital expenditure was mainly related to 3G and 4G roll-out.
Globul - Bulgaria
1st quarter Year
(NOK in millions) 2014 2013 2013
Revenues
Subscription and traffic 506 - 862
Interconnect revenues 31 - 56
Other mobile revenues 5 - 17
Non-mobile revenues 87 - 216
Total revenues 628 - 1 151
EBITDA before other items 238 - 373
Operating profit (loss) (176) - (81)
EBITDA before other items/Total revenues (%) 37.8 - 32.4
Capex 49 - 121
No. of subscriptions - Change in quarter/ Total (in thousands): (24) - 3 995
ARPU - monthly (NOK) 45 - 46
Exchange rate 4.2679 - 4.1524
Globul was consolidated from 1 August 2013. The preceding table shows figures from the time of consolidation and comments below refer to development compared to same period last year:• The number of subscriptions decreased by 24,000 in the first quarter
mainly from churn of prepaid customers only partly offset by growth in the contract segment. At the end of the quarter, the subscription base was 2% higher than at the end of first quarter last year.
• ARPU in local currency decreased by 5%. Adjusted for the reductions in interconnect rate from 1 July 2013 and 1 January 2014, ARPU decreased by 2%.
• Revenues in local currency decreased by 7% from lower ARPU and reduced handset sales partly offset by a higher subscription base.
• The EBITDA margin increased by 5 percentage points compared to first quarter last year, mainly driven by improved gross margin from lower handset sales and decreased sales and marketing cost.
• Capital expenditure was low following preparations for the upcoming network renovation.
Montenegro & Serbia
1st quarter Year
(NOK in millions) 2014 2013 2013
Revenues
Subscription and traffic 569 537 2 364
Interconnect revenues 161 162 727
Other mobile revenues 21 18 105
Non-mobile revenues 59 46 197
Total revenues 811 763 3 393
EBITDA before other items 298 306 1 355
Operating profit 203 223 1 014
EBITDA before other items/Total revenues (%) 36.8 40.1 39.9
Capex 60 50 242
No. of subscriptions - Change in quarter/ Total (in thousands): (78) (21) 3 545
ARPU - monthly (NOK) 70 65 72
Exchange rate RSD 0.0722 0.0665 0.0690
Exchange rate EUR 8.3471 7.4277 7.8087
• The number of subscriptions decreased by 78,000 during the quarter mainly from reduced sales in the prepaid segment partly due to seasonal churn slightly offset by a larger contract base. The subscription base decreased by 3% compared to the same period last year.
• ARPU in local currency decreased by 2%. Adjusted for reduced interconnect rates ARPU increased by 1%.
• Revenues in local currency decreased by 3% compared to last year following decreased ARPU and decreased subscription base, partly offset by revenues from KBC Banka, consolidated as of December 2013.
• The EBITDA margin decreased by 3 percentage points compared to first quarter last year mainly driven by start-up costs in the bank and investments in subsidy of smartphones.
• Capital expenditure was mainly related to network rollout and retail expansion.
• The interconnect rates in Serbia were reduced from RSD 4.8 to RSD 3.95 on 1 January 2014 and in Montenegro from EUR 0.04 to EUR 0.022 effective on 1 March 2014.

TELENOR FIRST QUARTER 2014
/PAGE 5/
dtac - Thailand
1st quarter Year
(NOK in millions) 2014 2013 2013
Revenues
Subscription and traffic 3 097 3 089 12 751
Interconnect revenues 414 798 2 494
Other mobile revenues 62 96 276
Non-mobile revenues 614 535 2 591
Total revenues 4 187 4 519 18 112
EBITDA before other items 1 531 1 423 5 763
Operating profit 914 855 3 442
EBITDA before other items/Total revenues (%) 36.6 31.5 31.8
Capex 554 223 2 776
No. of subscriptions - Change in quarter/ Total (in thousands): 284 291 27 942
ARPU - monthly (NOK) 42 49 47
Exchange rate 0.1866 0.1887 0.1912
• The number of subscriptions increased by 284,000 during the quarter. At the end of the quarter, the subscriber base was 6% higher than at the end of first quarter last year.
• ARPU in local currency decreased by 13%. Reduction in interconnect rate from 1 July 2013 impacted ARPU negatively by 10%. Decline in voice revenues was partly offset by growth in data revenues.
• Total revenues in local currency declined by 6%. Adjusted for the interconnect rate reduction, revenues increased by 2% driven by a larger subscriber base and increased handset sales partly offset by lower ARPU.
• The EBITDA margin improved by 5 percentage points. The improvement was driven by lower interconnect rate and reduced regulatory costs, partly offset by higher operation and maintenance costs related to the expansion of the new 2.1 GHz network.
• Capital expenditure was mainly related to the new 3G network.• The migration to 3G services on the 2.1 GHz network continued through
first quarter and at the end of the quarter, dtac had 16 million subscribers on the new network.
DiGi - Malaysia
1st quarter Year
(NOK in millions) 2014 2013 2013
Revenues
Subscription and traffic 2 687 2 485 10 589
Interconnect revenues 157 182 729
Other mobile revenues 36 28 143
Non-mobile revenues 294 310 1 095
Total revenues 3 173 3 005 12 556
EBITDA before other items 1 423 1 302 5 651
Operating profit 1 212 774 4 008
EBITDA before other items/Total revenues (%) 44.8 43.3 45.0
Capex 372 349 1 383
No. of subscriptions - Change in quarter/Total (in thousands): (109) (121) 10 995
ARPU - monthly (NOK) 87 85 89
Exchange rate 1.8475 1.8246 1.8647
• The number of subscriptions decreased by 109,000 during the quarter mainly due to seasonal churn in the prepaid segment. At the end of the quarter, the subscription base was 5% higher than first quarter last year.
• ARPU in local currency remained stable as continuous growth in mobile data usage offset lower voice ARPU and reduced interconnect rate from 1 January.
• Total revenues in local currency increased by 4% as the effects of a larger subscription base combined with stable ARPU more than offset somewhat lower handset sales. Subscription and traffic revenues in local currency increased by 7%.
• The EBITDA margin improved by 1 percentage point primarily due to higher revenues, improved handset net margin as well as efficiency initiatives.
• Operating profit improved from higher EBITDA and lower accelerated depreciation this quarter as the network modernisation programme was completed in 2013.
• Capital expenditure was mainly related to rollout of new sites and backhaul fibre, capacity upgrades and IT-related investments.
Grameenphone - Bangladesh
1st quarter Year
(NOK in millions) 2014 2013 2013
Revenues
Subscription and traffic 1 673 1 419 6 212
Interconnect revenues 200 168 751
Other mobile revenues 8 9 26
Non-mobile revenues 79 77 305
Total revenues 1 961 1 672 7 294
EBITDA before other items 1 052 795 3 709
Operating profit 725 532 2 562
EBITDA before other items/Total revenues (%) 53.7 47.5 50.9
Capex 217 86 2 256
No. of subscriptions - Change in quarter/ Total (in thousands): 1 573 1 771 47 110
ARPU - monthly (NOK) 13 13 13
Exchange rate 0.0785 0.0711 0.0752
• The number of subscriptions increased by 1.6 million during the quarter. At the end of the quarter, the subscription base was 16% higher than first quarter last year.
• ARPU in local currency decreased by 9% due to campaigns and migration to lower priced products, in addition to the continued dilution effect from subscriber growth in lower revenue generating segments.
• Total revenues in local currency increased by 6% following improved political stability driving subscriber growth and voice traffic in addition to a healthy uptake in data revenues after the launch of 3G.
• The EBITDA margin increased by 6 percentage points mainly due to higher revenues and the reduction in SIM-tax from 16 May 2013. EBITDA in local currency increased by 20%.
• Capital expenditure increased mainly due to roll-out of 3G network and further expansion of 2G capacity.
• At the end of first quarter, Grameenphone holds a total of 2,143 3G sites, covering all 64 district headquarters.

TELENOR FIRST QUARTER 2014
/PAGE 6/
Pakistan
1st quarter Year
(NOK in millions) 2014 2013 2013
Revenues
Subscription and traffic 1 061 946 4 025
Interconnect revenues 104 133 487
Other mobile revenues 7 7 14
Non-mobile revenues 223 200 879
Total revenues 1 395 1 286 5 406
EBITDA before other items 537 496 2 052
Operating profit 377 1 822
EBITDA before other items/Total revenues (%) 38.5 38.6 38.0
Capex 202 427 1 279
No. of subscriptions - Change in quarter/ Total (in thousands): 1 806 277 33 405
ARPU - monthly (NOK) 11 12 12
Exchange rate 0.0589 0.0574 0.0579
• During the quarter, the number of subscriptions increased by 1.8 million. At the end of the first quarter, the subscription base was 14% higher than first quarter last year.
• ARPU in local currency decreased by 6%, due to continued intense on-net competition and subscriber growth in lower revenue generating segments.
• Total revenues in local currency increased by 6%, driven by strong subscriber growth and uptake in data revenues in addition to introduction of call set-up charges and increased surcharge on refills. Financial services contributed with 2 percentage points to the overall revenue growth despite strong competition from new entrants pushing over-the-counter transactions.
• The EBITDA margin remained stable as the increase in acquisition costs from strong subscriber growth was offset by post-swap savings and lower energy costs resulting from several energy saving initiatives.
• Operating profit improved by NOK 235 million as accelerated depreciations were reduced following the completion of network modernisation.
• Capital expenditure decreased after the completion of network modernisation and was focused towards network optimisation in addition to increased capacity and coverage.
• On 23 April 2014, Telenor Pakistan was awarded a 3G licence in the 2100 MHz band for a period of 15 years. The licence was acquired at the reserve price of USD 147.5 million, where 50% of spectrum fee is payable within 30 days of the auction and remaining amount will be paid in 5 equal annual instalments.
India
1st quarter Year
(NOK in millions) 2014 2013 2013
Revenues 919 708 3 001
EBITDA before other items (83) (185) (585)
Operating profit (loss) 1 531 (194) (576)
Capex 117 36 214
No. of subscriptions - Change in quarter/ Total (in thousands): *) 2 539 (3 255) 28 004
ARPU - monthly (NOK) 10 10 10
Exchange rate 0.0987 0.1038 0.1004
*) Please note that the definition for active subscriptions in the Indian operation is more conservative than the Group definition on page 20, due to high churn in the Indian market. Subscriptions are counted as active if there has been activity during the last 30 days.
• Telenor’s Indian operation continues to strengthen the “sabse sasta - most affordable” value proposition. The monthly churn rate continues to decline to 4.0% this quarter, down 0.5 percentage points from previous quarter. Together with stronger sales this contributes to a growth in subscriptions of 2.5 million, taking the total subscription base to 30.5 million.
• ARPU in local currency increased by 13% to INR 106, as a result of improved quality of the customer base and uptake of data usage and services.
• Revenues in local currency in the six circles increased by 44%, as a result of increased ARPU and a larger subscriber base. Gross margin in these comparable circles improved by 3 percentage points to 64%.
• To capitalise on the operation’s strong value proposition and business model, a programme expanding the network coverage utilising 5,000 base stations from closed down circles has been initiated. By end of first quarter, 1,036 new base stations have been deployed.
• EBITDA continued to improve as a result of increased revenues, improved gross margin and scalable operational expenditures.
• Operating profit was positively influenced by an offset of the initial licence fee of INR 16.6 billion (NOK 1.7 billion) paid by Unitech Wireless in 2008.
• Telewings participated in a spectrum auction in February and secured additional spectrum in the 1800 MHz band in four of its existing circles and startup spectrum in Assam for a total of INR 8.07 billion (NOK 0.8 billion). 33% of the amount was prepaid in February, while the remainder, including interest, will be paid in ten annual instalments, starting February 2017.
Myanmar
1st quarter Year
(NOK in millions) 2014 2013 2013
Revenues - - -
EBITDA before other items (68) - (48)
Operating profit (loss) (71) - (48)
Capex 3 203 - 7
No. of subscriptions - Change in quarter/ Total (in thousands): - - -
ARPU - monthly (NOK) - - -
Exchange rate 0.0062 - 0.0062
• On 5 February 2014, Telenor was awarded nationwide telecommunications licence in Myanmar on the 900 MHz and 2100 MHz spectrum.
• As a consequence of this, licence fee of USD 500 million (NOK 2.9 billion) was recognised as a licence capex in the quarter.
• Opex in the quarter was related to start-up cost for the network and organization. The first call in Telenor Myanmar’s network was produced at 7 April. Telenor Myanmar operation is well on track towards planned launch by end of third quarter.

TELENOR FIRST QUARTER 2014
/PAGE 7/
Broadcast
1st quarter Year
(NOK in millions) 2014 2013 2013
Revenues
Canal Digital DTH 1 128 1 120 4 536
Satellite Broadcasting 238 237 971
Norkring 283 245 1 057
Conax 166 130 627
Other/Eliminations (122) (122) (457)
Total revenues 1 693 1 610 6 735
EBITDA before other items
Canal Digital DTH 174 165 731
Satellite Broadcasting 158 160 661
Norkring 140 122 525
Conax 49 42 243
Other/Eliminations (8) (16) (52)
Total EBITDA before other items 511 472 2 109
Operating profit
Canal Digital DTH 160 152 673
Satellite Broadcasting 102 101 422
Norkring 77 55 268
Conax 41 32 203
Other/Eliminations 1 203 (17) (73)
Total operating profit 1 583 324 1 493
EBITDA before other items/Total revenues (%) 30.2 29.3 31.3
Capex 140 129 572
No. of subscriptions - Change in quarter/Total (in thousands):
DTH TV (9) (8) 929
• Total revenues increased by 5% and EBITDA by 8%, resulting in a 0.9 percentage point increase in the EBITDA margin.
• Revenues in Canal Digital DTH increased by 0.7% as positive currency effects offset the effect of lower subscriber base and hardware sales.
• The EBITDA margin in Canal Digital DTH was 15.4%, 0.7 percentage points higher than last year due to increased revenues and stable costs.
• Revenues and EBITDA in Satellite Broadcasting was on level with the first quarter in 2013.
• Revenues in Norkring increased by 15% and EBITDA by 14% due to digital audio broadcasting (DAB) roll-out and higher installation revenues.
• Revenues in Conax increased by 28% and EBITDA by 17% due to increased sale of conditional access modules. Conax was divested to Kudelski Group in March for a total consideration of NOK 1.4 billion, and a sales gain of NOK 1.2 billion was recognised in first quarter 2014.
• Capital expenditure increased primarily due to ground equipment investment in Satellite Broadcasting and platform investments in Canal Digital.
Other units
1st quarter Year
(NOK in millions) 2014 2013 2013
Revenues
International wholesale 440 444 1 730
Digital Services 155 122 556
Corporate functions 631 528 2 244
Other/eliminations 79 48 279
Total revenues 1 305 1 142 4 809
EBITDA before other items
International wholesale 12 16 71
Digital Services (46) (71) (263)
Corporate functions (177) (159) (759)
Other/eliminations 22 (2) 73
Total EBITDA before other items (189) (216) (877)
Operating profit (loss)
International wholesale 3 12 43
Digital Services (55) (82) (511)
Corporate functions (277) (283) (1 260)
Other/eliminations 13 (12) 22
Total operating profit (loss) (316) (365) (1 706)
Capex 166 119 618
Investments in businesses 171 24 6 676
• Revenues and EBITDA in Telenor Digital increased mainly due to improved results in machine-to-machine business.
• EBITDA in Corporate functions decreased mainly due to higher corporate activities partly offset by increased internal revenues.

TELENOR FIRST QUARTER 2014
/PAGE 8/
Group overview
The comments below are related to Telenor’s development in 2014 compared to 2013 unless otherwise stated. Please refer to note 9 for further information.
Revenues• Revenues increased by NOK 1.8 billion or 7.3% due to higher revenues from all operations except dtac, which was affected by lower interconnect rates in
Thailand. Positive currency effects on revenues were NOK 0.7 billion.
EBITDA before other items• EBITDA before other items increased by NOK 0.9 billion or 10.4% following improved performance in all Asian operations and Sweden in addition to the
inclusion of Globul in Bulgaria. Positive currency effects on EBITDA were NOK 0.25 billion.
Specification of other income and other expenses
1st quarter Year
(NOK in millions) 2014 2013 2013
EBITDA before other income and expenses 9 298 8 423 35 892
EBITDA before other income and expenses (%) 35.1 34.1 34.5
Licence refund in India 1 659 - -
Gains on disposal of fixed assets and operations 1 223 - 182
Losses on disposal of fixed assets and operations - (88) (213)
Workforce reductions and loss contracts (295) (182) (651)
EBITDA 11 884 8 153 35 209
EBITDA margin (%) 44.8 33.0 33.8
In the first quarter of 2014 ‘Other income and other expenses’ mainly consisted of the following items:• Licence refund in India (NOK 1.7 billion). See note 4 for further information.• Gains on disposal of operations were mainly related to divestment of Conax (NOK 1.2 billion).• Workforce reductions in Telenor Norway (NOK 277 million).
Operating profit• Operating profit increased by NOK 3.4 billion compared to first quarter last year due to improved EBITDA as described above and NOK 2.9 billion other items
as described above, partly offset by NOK 0.3 billion higher depreciations.
Associated companies and joint ventures
1st quarter Year
(NOK in millions) 2014 2013 2013
Telenors share of
Profit after taxes (1 800) 1 147 (440)
Amortisation of Telenor's net excess values (50) (83) (285)
Impairment losses - (3) (504)
Gains (losses) on disposal of ownership interests 13 4 (359)
Profit from associated companies and joint ventures (1 837) 1 065 (1 588)
• Profit after tax from associated companies and joint ventures in the first quarter of 2014 includes a one-time loss of NOK 2,019 million for Telenor’s share of VimpelCom’s settlement cost regarding resolution of its disputes in Algeria. See note 3 for further information.
• Profit after tax from associated companies and joint ventures in the first quarter of 2014 includes net income of NOK 413 million for Telenor’s share of VimpelCom’s reported result for the fourth quarter of 2013, adjusted for Telenor’s share of significant transactions and events which were recognised in the year 2013.
• Profit after tax from associated companies and joint ventures is impacted negatively with NOK 162 million from our online classifieds ventures with Schibsted ASA, mainly due to high marketing costs. However, the high spending has resulted in strong volume growth and performance versus competitors, particularly in Brazil.

TELENOR FIRST QUARTER 2014
/PAGE 9/
Financial items
1st quarter Year
(NOK in millions) 2014 2013 2013
Financial income 125 146 576
Financial expenses (357) (567) (2 502)
Net currency gains (losses) 161 168 (498)
Net change in fair value of financial instruments (24) 46 472
Net gains (losses and impairment) of financial assets and liabilities 19 - 39
Net financial income (expenses) (76) (207) (1 914)
Gross interest expenses (252) (464) (2 058)
Net interest expenses (187) (385) (1 666)
• Future licence obligation in India is reduced due to the licence refund given by Indian authorities. Financial expenses are reduced by NOK 175 million in first quarter 2014 as accrued interest is reduced following the reduction of the licence obligation.
• The net currency gains were primarily related to appreciation of certain Asian currencies against the US Dollar, reducing the US dollar commitments in some Asian subsidiaries.
• The change in fair value of financial instruments was related to ineffectiveness in fair value hedges and derivatives used for economic hedges that do not fulfil the requirements for hedge accounting.
Taxes• The estimated effective tax rate for the first quarter of 2014 is 26% mainly due to licence refund in India and Telenor Broadcast’s sale of Conax to Kudelski
Group, partly offset by Telenor’s share of effect related to VimpelCom’s settlement in Algeria.• The effective tax rate for 2014 is estimated to be around 29%.
Investments
1st quarter Year
(NOK in millions) 2014 2013 2013
Capex 6 595 2 868 17 044
Capex excl. licences and spectrum 3 694 2 868 14 659
Capex excl. licences and spectrum/Revenues (%) 13.9 11.6 14.1
• Capital expenditure (excl. licences) increased by NOK 0.8 billion as a result of network and infrastructure investments in dtac, Grameenphone and Myanmar.• Licence investments in the first quarter of 2014 amounted to NOK 2.9 billion related to Myanmar.
Cash flow• Net cash inflow from operating activities during the first quarter of 2014 was NOK 8.9 billion, an increase of NOK 0.8 billion compared to the first quarter of
2013. EBITDA was NOK 3.7 billion higher during the first quarter of 2014. However, NOK 2.9 billion related to licence refund in India and gain on divestment of Conax included in EBITDA did not have cash effect. In addition, there was a positive change of NOK 1.7 billion related to net operating working capital and decrease in income taxes paid of NOK 0.9 billion. These effects were offset by decrease in dividends received from associated companies of NOK 2.6 billion.
• Net cash outflow to investing activities during the first quarter of 2014 was NOK 6.9 billion, an increase of NOK 4.2 billion compared to the first quarter of 2013. The increase is mainly explained by higher investment in fixed assets of NOK 3.2 billion. In addition, Tele2’s fibre and cable business was acquired during the first quarter of 2014 resulting in cash outflow of NOK 0.7 billion.
• Net cash inflow to financing activities during the first quarter of 2014 was NOK 1.1 billion. During the first quarter of 2014 there was an increase in net borrowings of NOK 1.6 billion and dividends paid to non-controlling interests of NOK 0.5 billion.
• Cash and cash equivalents increased by NOK 3.1 billion during the first quarter of 2014 to NOK 15.1 billion as of 31 March 2014.
Financial position• During the first quarter, total assets increased by NOK 3.0 billion to NOK 184 billion primarily due to acquisition of spectrum licence in Myanmar, investments
in network and increase in cash and cash equivalents. These effects were partially offset by negative results from associated companies and joint ventures and strengthening of Norwegian Krone against all major currencies.
• Net interest bearing liabilities decreased by NOK 2.2 billion to NOK 37.2 billion mainly due to increase in cash and cash equivalents in Telenor ASA and dtac.• Total equity increased by NOK 2.9 billion to NOK 80.0 billion due to income from operations of NOK 4.6 billion, partially offset by currency translation effects,
remeasurement of defined benefit pension plans and dividends to non-controlling interests.
Transactions with related partiesFor detailed information on related party transactions refer to Note 32 in Telenor’s Annual Report 2013.
TELENOR FIRST QUARTER 2014
/PAGE 10/
Outlook for 2014
Based on the current Group structure excluding Myanmar and with currency rates as of 31 March 2014 Telenor expects:• Low single digit organic revenue growth.• Stable EBITDA margin before other income and expenses.• Capital expenditure as a proportion of revenues, excluding licences and spectrum, around 16%.
Risk and uncertaintiesThe existing risks and uncertainties described below are expected to remain for the next three months.
A growing share of Telenor’s revenues and profits is derived from operations outside Norway. Currency fluctuations may influence the reported figures in Norwegian Kroner to an increasing extent. Political risk, including regulatory conditions, may also influence the results.
For additional explanations regarding risks and uncertainties, please refer to the Report of the Board of Directors for 2013, section Risk Factors and Risk Management, and Telenor’s Annual Report 2013 Note 28 Managing Capital and Financial Risk Management and Note 33 Commitments and Contingencies. Readers are also referred to the disclaimer at the end of this section.
New developments of risks and uncertainties since the publication of Telenor’s Annual Report for 2013 are:
Legal disputesSee note 7 for details.
Financial aspectsAs of 31 March 2014, Telenor ASA had issued guarantees of NOK 2.1 billion related to India, of which NOK 1.2 billion related to interest-bearing liabilities. The remaining NOK 0.9 billion related to guarantees issued to the Indian Department of Telecom.
In relation to the licence issuance in Myanmar, a performance bond of USD 200 million has been issued to Myanmar authorities as a guarantee towards coverage and quality of service commitments during the first five years of the licence.
DisclaimerThis report contains statements regarding the future in connection with Telenor’s growth initiatives, profit figures, outlook, strategies and objectives. In particular, the section ‘Outlook for 2014’ contains forward-looking statements regarding the Group’s expectations. All statements regarding the future are subject to inherent risks and uncertainties, and many factors can lead to actual profits and developments deviating substantially from what has been expressed or implied in such statements.
Fornebu, 6 May 2014The Board of Directors of Telenor ASA
TELENOR FIRST QUARTER 2014
/PAGE 11/
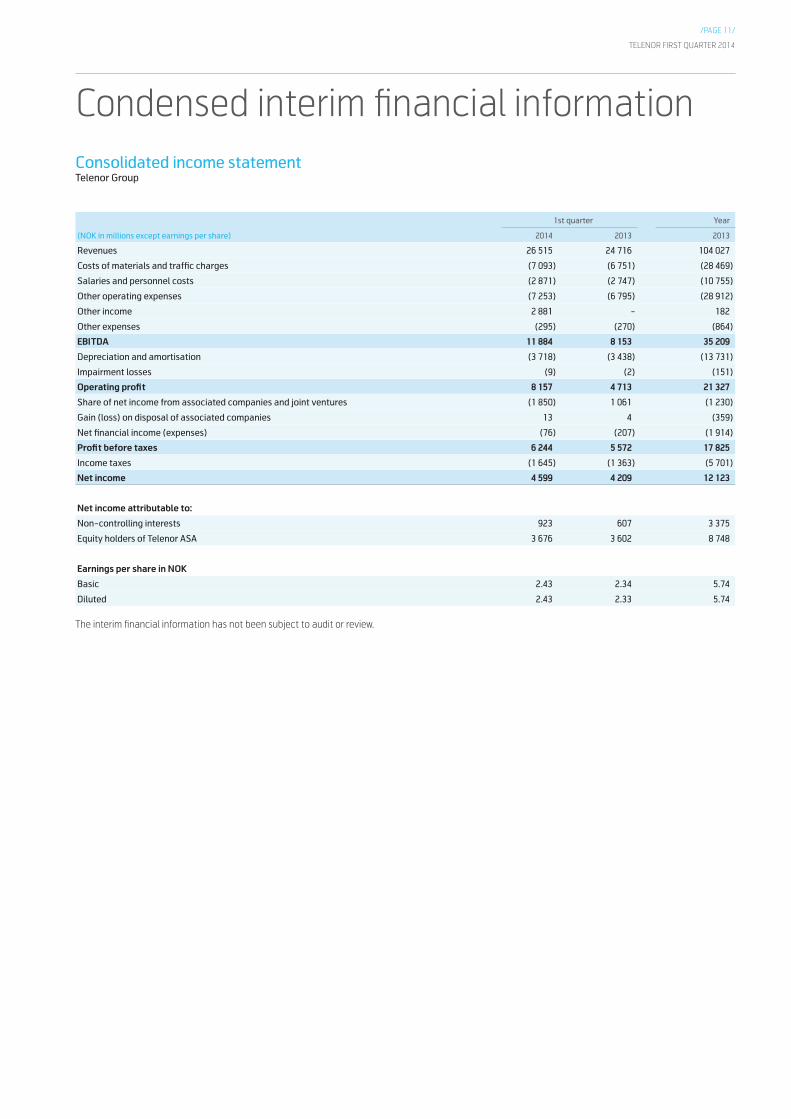
Consolidated income statementTelenor Group
1st quarter Year
(NOK in millions except earnings per share) 2014 2013 2013
Revenues 26 515 24 716 104 027
Costs of materials and traffic charges (7 093) (6 751) (28 469)
Salaries and personnel costs (2 871) (2 747) (10 755)
Other operating expenses (7 253) (6 795) (28 912)
Other income 2 881 - 182
Other expenses (295) (270) (864)
EBITDA 11 884 8 153 35 209
Depreciation and amortisation (3 718) (3 438) (13 731)
Impairment losses (9) (2) (151)
Operating profit 8 157 4 713 21 327
Share of net income from associated companies and joint ventures (1 850) 1 061 (1 230)
Gain (loss) on disposal of associated companies 13 4 (359)
Net financial income (expenses) (76) (207) (1 914)
Profit before taxes 6 244 5 572 17 825
Income taxes (1 645) (1 363) (5 701)
Net income 4 599 4 209 12 123
Net income attributable to:
Non-controlling interests 923 607 3 375
Equity holders of Telenor ASA 3 676 3 602 8 748
Earnings per share in NOK
Basic 2.43 2.34 5.74
Diluted 2.43 2.33 5.74
The interim financial information has not been subject to audit or review.
Condensed interim financial information

TELENOR FIRST QUARTER 2014
/PAGE 12/
Consolidated statement of comprehensive income Telenor Group
1st quarter Year
(NOK in millions) 2014 2013 2013
Net income 4 599 4 209 12 123
Translation differences on net investment in foreign operations (1 530) 3 157 7 688
Income taxes 14 (44) 125
Amount reclassified from equity to profit and loss on disposal 4 - 55
Net gain (loss) on hedge of net investment 878 (949) (4 030)
Income taxes (237) 266 1 130
Amount reclassified from equity to profit and loss on disposal - - (7)
Net gain on available-for-sale-investment 11 - 18
Amount reclassified from equity to profit and loss on disposal (17) - -
Share of other comprehensive income (loss) of associated companies 18 (51) 192
Amount reclassified from equity to profit and loss on disposal - - 240
Items that may be reclassified subsequently to income statement (860) 2 378 5 410
Remeasurement of defined benefit pension plans (353) (23) (1 246)
Income taxes 95 5 337
Items that will not be reclassified to income statement (258) (18) (908)
Other comprehensive income (loss), net of taxes (1 118) 2 360 4 502
Total comprehensive income 3 481 6 568 16 626
Total comprehensive income attributable to:
Non-controlling interests 882 861 3 566
Equity holders of Telenor ASA 2 599 5 707 13 059
The interim financial information has not been subject to audit or review.

TELENOR FIRST QUARTER 2014
/PAGE 13/
Consolidated statement of financial position Telenor Group
31 March 31 December 31 March
(NOK in millions) 2014 2013 2013
Deferred tax assets 2 688 3 585 4 143
Goodwill 20 955 21 442 18 124
Intangible assets 34 237 32 271 29 985
Property, plant and equipment 50 604 49 547 44 349
Associated companies and joint ventures 32 428 34 600 39 488
Other non-current assets 4 714 4 696 4 188
Total non-current assets 145 626 146 141 140 276
Prepaid taxes 283 531 267
Inventories 1 344 1 587 1 317
Trade and other receivables 19 230 19 701 18 042
Other current financial assets 2 249 1 027 1 875
Assets classified as held for sale 6 6 -
Cash and cash equivalents 15 058 11 978 9 838
Total current assets 38 169 34 830 31 338
Total assets 183 795 180 971 171 615
Equity attributable to equity holders of Telenor ASA 75 859 73 365 78 345
Non-controlling interests 4 052 3 672 3 554
Total equity 79 911 77 037 81 898
Non-current interest-bearing liabilities 51 425 51 001 38 805
Non-current non-interest-bearing liabilities 653 834 1 267
Deferred tax liabilities 2 104 2 127 1 505
Pension obligations 3 130 2 736 1 479
Provisions and obligations 2 787 2 874 3 228
Total non-current liabilities 60 099 59 572 46 285
Current interest-bearing liabilities 7 433 7 291 8 780
Trade and other payables 31 319 31 706 28 993
Current tax payables 2 501 2 566 3 627
Current non-interest-bearing liabilities 1 309 1 485 967
Provisions and obligations 1 223 1 315 1 064
Total current liabilities 43 785 44 362 43 431
Total equity and liabilities 183 795 180 971 171 615
Equity ratio including non-controlling interests (%) 43,5 42,6 47,7
Net interest-bearing liabilities 37 237 39 395 28 853
The interim financial information has not been subject to audit or review.

TELENOR FIRST QUARTER 2014
/PAGE 14/
Consolidated statement of cash flows Telenor Group
1st quarter Year
(NOK in millions) 2014 2013 2013
Profit before taxes from total operations 6 244 5 572 17 825
Income taxes paid (703) (1 631) (4 831)
Net (gains) losses from disposals, impairments and change in fair value of financial assets and liabilities (2 904) 42 (469)
Depreciation, amortisation and impairment losses 3 727 3 440 13 882
Loss (profit) from associated companies and joint ventures 1 837 (1 066) 1 589
Dividends received from associated companies - 2 594 8 194
Currency (gains) losses not related to operating activities (137) 36 498
Changes in other operating working capital assets and liabilities 879 (889) 301
Net cash flow from operating activities 8 943 8 098 36 990
Purchases of property, plant and equipment (PPE) and intangible assets (5 938) (2 707) (15 612)
Purchases of subsidiaries, associated companies and joint ventures, net of cash acquired (914) (60) (5 973)
Proceeds from PPE, intangible assets and businesses, net of cash disposed (124) 34 267
Proceeds from and purchases of other investments 57 82 703
Net cash flow from investing activities (6 919) (2 651) (20 614)
Proceeds from and repayments of borrowings 1 639 (3 883) 2 192
Proceeds from issuance of shares, incl. from non-controlling interests in subsidiaries 20 6 6
Share buyback by Telenor ASA - (538) (3 998)
Repayment of equity and dividends paid to non-controlling interests in subsidiaries (513) (185) (2 729)
Dividends paid to equity holders of Telenor ASA - - (9 239)
Net cash flow from financing activities 1 145 (4 600) (13 768)
Effects of exchange rate changes on cash and cash equivalents (90) 185 567
Net change in cash and cash equivalents 3 079 1 033 3 175
Cash and cash equivalents at the beginning of the period 11 978 8 805 8 805
Cash and cash equivalents at the end of the period1) 15 058 9 838 11 978
1) The first quarter of 2014 includes restricted cash of NOK 363 million, while the first quarter of 2013 included restricted cash of NOK 41 million.
The interim financial information has not been subject to audit or review.

TELENOR FIRST QUARTER 2014
/PAGE 15/
Consolidated statement of changes in equity Telenor Group
Attributable to equity holders of the parent
(NOK in millions) Total paid in
capital Other
reserves Retained earnings
Cumulative translation differences Total
Non-controlling
interests Total
equity
Equity as of 1 January 2013 9 334 (2 155) 75 956 (9 779) 73 355 3 057 76 412
Net income for the period - - 8 748 - 8 748 3 375 12 123
Other comprehensive income for the period - (459) - 4 770 4 311 191 4 502
Total comprehensive income for the period - (459) 8 748 4 770 13 059 3 566 16 625
Transactions with non-controlling interests - 222 - - 222 (209) 13
Equity adjustments in associated companies - (26) - - (26) - (26)
Dividends - - (9 239) - (9 239) (2 743) (11 982)
Share buy back (209) (3 789) - - (3 998) - (3 998)
Sale of shares, share issue, and share options to employees 2 (10) - - (8) - (8)
Equity as of 31 December 2013 9 127 (6 217) 75 464 (5 009) 73 365 3 672 77 037
Net income for the period - - 3 676 - 3 676 923 4 599
Other comprehensive income for the period - (245) - (832) (1 077) (41) (1 118)
Total comprehensive income for the period - (245) 3 676 (832) 2 599 882 3 481
Transactions with non-controlling interests - 7 - - 7 18 25
Dividends - - - - - (520) (520)
Sale of shares, share issue, and share options to employees - (113) - - (113) - (113)
Equity as of 31 March 2014 9 127 (6 567) 79 140 (5 840) 75 859 4 052 79 911
Attributable to equity holders of the parent
(NOK in millions) Total paid
in capital Other
reserves Retained earnings
Cumulative translation differences Total
Non-controlling
interests Total
equity
Equity as of 1 January 2013 9 334 (2 155) 75 956 (9 779) 73 355 3 057 76 412
Net income for the period - - 3 602 - 3 602 607 4 209
Other comprehensive income for the period - (69) - 2 175 2 106 254 2 360
Total comprehensive income for the period - (69) 3 602 2 175 5 707 861 6 568
Transactions with non-controlling interests - (69) - - (69) 76 7
Equity adjustments in associated companies - (25) - - (25) - (25)
Dividends - - - - - (440) (440)
Share buy back (27) (510) - - (538) - (538)
Sale of shares, share issue, and share options to employees - (87) - - (87) - (87)
Equity as of 31 March 2013 9 307 (2 916) 79 557 (7 603) 78 345 3 553 81 898
The interim financial information has not been subject to audit or review.

TELENOR FIRST QUARTER 2014
/PAGE 16//PAGE 16/
Note 1 – General accounting principlesTelenor (the Group) consists of Telenor ASA (the Company) and its subsidiaries. Telenor ASA is a limited liability company, incorporated in Norway. The condensed consolidated interim financial statements consist of the Group and the Group’s interests in associated companies and joint ventures. As a result of rounding differences, numbers or percentages may not add up to the total.
These interim condensed consolidated financial statements for the three months of 2014 ending 31 March 2014, have been prepared in accordance with IAS 34 Interim Financial Reporting. The interim condensed consolidated financial statements do not include all the information and disclosures required in the annual financial statements and should be read in conjunction with the Group’s Annual Report 2013. The accounting policies adopted in the preparation of the interim consolidated financial statements are consistent with those followed in the preparation of the Group’s Annual Financial Statements for the year ended 31 December 2013.
For information about the standards and interpretations effective from 1 January 2014, please refer to Note 1 in the Group’s Annual report 2013. The standards and interpretations effective from 1 January 2014 do not have a significant impact on the Group’s consolidated interim financial statements.
Note 2 – Business combinationsAcquisition of Tele2’s cable and fibre businessOn 2 January 2014, Telenor acquired 100% of the voting rights in Tele2’s Swedish residential fibre and cable TV business for NOK 747 million. The business includes 370,000 connected households, with 125,000 fixed broadband subscribers, 75,000 digital TV subscribers and 220,000 analogue TV households. The acquisition strengthens Telenor’s position as one of the leading providers of broadband and digital TV services in Sweden.
The purchase price allocation, which is performed with assistance from third party valuation experts, has been determined to be provisional. The purchase price allocation is provisional pending the final assessment of the identifiable assets. The preliminary fair values of the identifiable assets and liabilities of the business as at the date of acquisition were:
(NOK in millions) Preliminary fair values
as of acquisition date
Customer Base 240
Property, Plant & Equipment 610
Other assets 28
Total assets 878
Deferred tax liability 118
Current liabilities 37
Total liabilities 155
Net identifiable assets 723
Goodwill 24
Total consideration for the shares, satisfied by cash 747
The goodwill of NOK 24 million comprises the value of expected synergies arising from the acquisition. None of the goodwill is expected to be deductible for income tax purposes.
For the period between the date of acquisition and 31 March 2014, the acquired cable and fibre business has contributed NOK 142 million to Revenue and NOK -42 million to Profit before tax of the Group.
Notes to the consolidated interim financial statements
TELENOR FIRST QUARTER 2014
/PAGE 17/
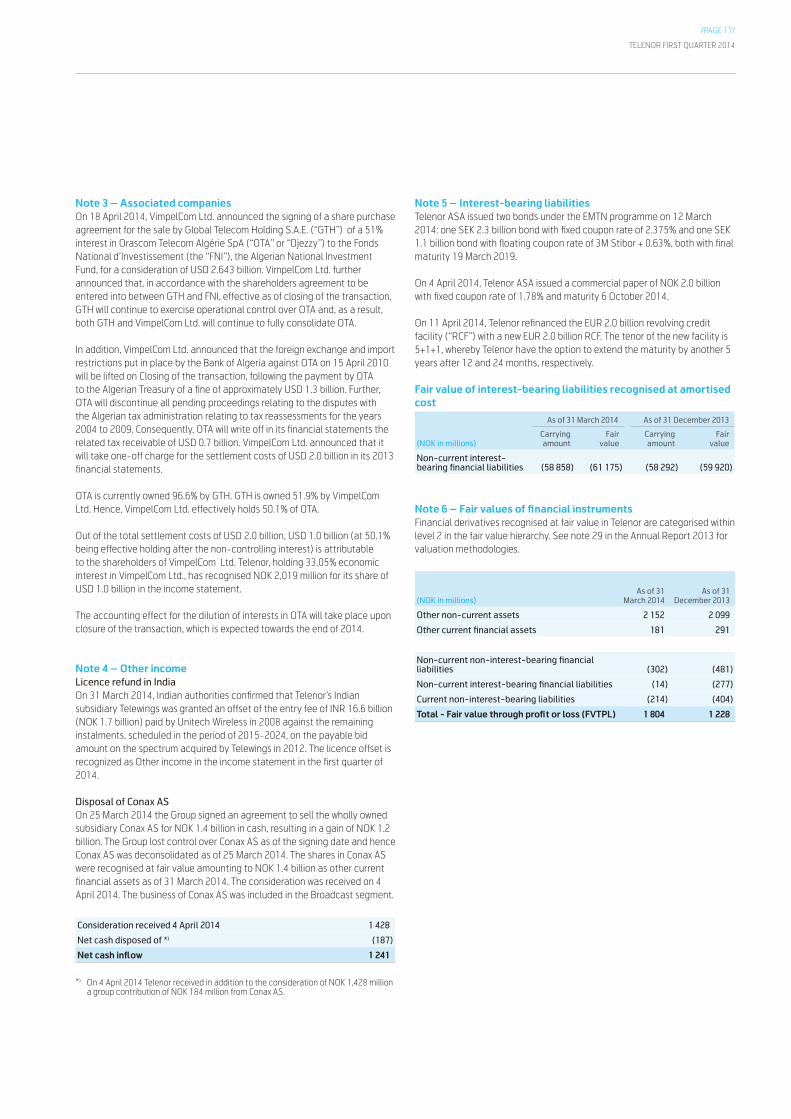
Note 3 – Associated companiesOn 18 April 2014, VimpelCom Ltd. announced the signing of a share purchase agreement for the sale by Global Telecom Holding S.A.E. (“GTH”) of a 51% interest in Orascom Telecom Algérie SpA (“OTA” or “Djezzy”) to the Fonds National d’Investissement (the “FNI”), the Algerian National Investment Fund, for a consideration of USD 2.643 billion. VimpelCom Ltd. further announced that, in accordance with the shareholders agreement to be entered into between GTH and FNI, effective as of closing of the transaction, GTH will continue to exercise operational control over OTA and, as a result, both GTH and VimpelCom Ltd. will continue to fully consolidate OTA.
In addition, VimpelCom Ltd. announced that the foreign exchange and import restrictions put in place by the Bank of Algeria against OTA on 15 April 2010 will be lifted on Closing of the transaction, following the payment by OTA to the Algerian Treasury of a fine of approximately USD 1.3 billion. Further, OTA will discontinue all pending proceedings relating to the disputes with the Algerian tax administration relating to tax reassessments for the years 2004 to 2009. Consequently, OTA will write off in its financial statements the related tax receivable of USD 0.7 billion. VimpelCom Ltd. announced that it will take one-off charge for the settlement costs of USD 2.0 billion in its 2013 financial statements.
OTA is currently owned 96.6% by GTH. GTH is owned 51.9% by VimpelCom Ltd. Hence, VimpelCom Ltd. effectively holds 50.1% of OTA.
Out of the total settlement costs of USD 2.0 billion, USD 1.0 billion (at 50.1% being effective holding after the non-controlling interest) is attributable to the shareholders of VimpelCom Ltd. Telenor, holding 33.05% economic interest in VimpelCom Ltd., has recognised NOK 2,019 million for its share of USD 1.0 billion in the income statement.
The accounting effect for the dilution of interests in OTA will take place upon closure of the transaction, which is expected towards the end of 2014.
Note 4 – Other incomeLicence refund in IndiaOn 31 March 2014, Indian authorities confirmed that Telenor’s Indian subsidiary Telewings was granted an offset of the entry fee of INR 16.6 billion (NOK 1.7 billion) paid by Unitech Wireless in 2008 against the remaining instalments, scheduled in the period of 2015-2024, on the payable bid amount on the spectrum acquired by Telewings in 2012. The licence offset is recognized as Other income in the income statement in the first quarter of 2014.
Disposal of Conax ASOn 25 March 2014 the Group signed an agreement to sell the wholly owned subsidiary Conax AS for NOK 1.4 billion in cash, resulting in a gain of NOK 1.2 billion. The Group lost control over Conax AS as of the signing date and hence Conax AS was deconsolidated as of 25 March 2014. The shares in Conax AS were recognised at fair value amounting to NOK 1.4 billion as other current financial assets as of 31 March 2014. The consideration was received on 4 April 2014. The business of Conax AS was included in the Broadcast segment.
Consideration received 4 April 2014 1 428
Net cash disposed of *) (187)
Net cash inflow 1 241
*) On 4 April 2014 Telenor received in addition to the consideration of NOK 1,428 million a group contribution of NOK 184 million from Conax AS.
Note 5 – Interest-bearing liabilitiesTelenor ASA issued two bonds under the EMTN programme on 12 March 2014: one SEK 2.3 billion bond with fixed coupon rate of 2.375% and one SEK 1.1 billion bond with floating coupon rate of 3M Stibor + 0.63%, both with final maturity 19 March 2019.
On 4 April 2014, Telenor ASA issued a commercial paper of NOK 2.0 billion with fixed coupon rate of 1.78% and maturity 6 October 2014. On 11 April 2014, Telenor refinanced the EUR 2.0 billion revolving credit facility (“RCF”) with a new EUR 2.0 billion RCF. The tenor of the new facility is 5+1+1, whereby Telenor have the option to extend the maturity by another 5 years after 12 and 24 months, respectively.
Fair value of interest-bearing liabilities recognised at amortised cost
As of 31 March 2014 As of 31 December 2013
(NOK in millions)Carrying amount
Fair value
Carrying amount
Fair value
Non-current interest-bearing financial liabilities (58 858) (61 175) (58 292) (59 920)
Note 6 – Fair values of financial instrumentsFinancial derivatives recognised at fair value in Telenor are categorised within level 2 in the fair value hierarchy. See note 29 in the Annual Report 2013 for valuation methodologies.
(NOK in millions)As of 31
March 2014As of 31
December 2013
Other non-current assets 2 152 2 099
Other current financial assets 181 291
Non-current non-interest-bearing financial liabilities (302) (481)
Non-current interest-bearing financial liabilities (14) (277)
Current non-interest-bearing liabilities (214) (404)
Total - Fair value through profit or loss (FVTPL) 1 804 1 228
TELENOR FIRST QUARTER 2014
/PAGE 18/
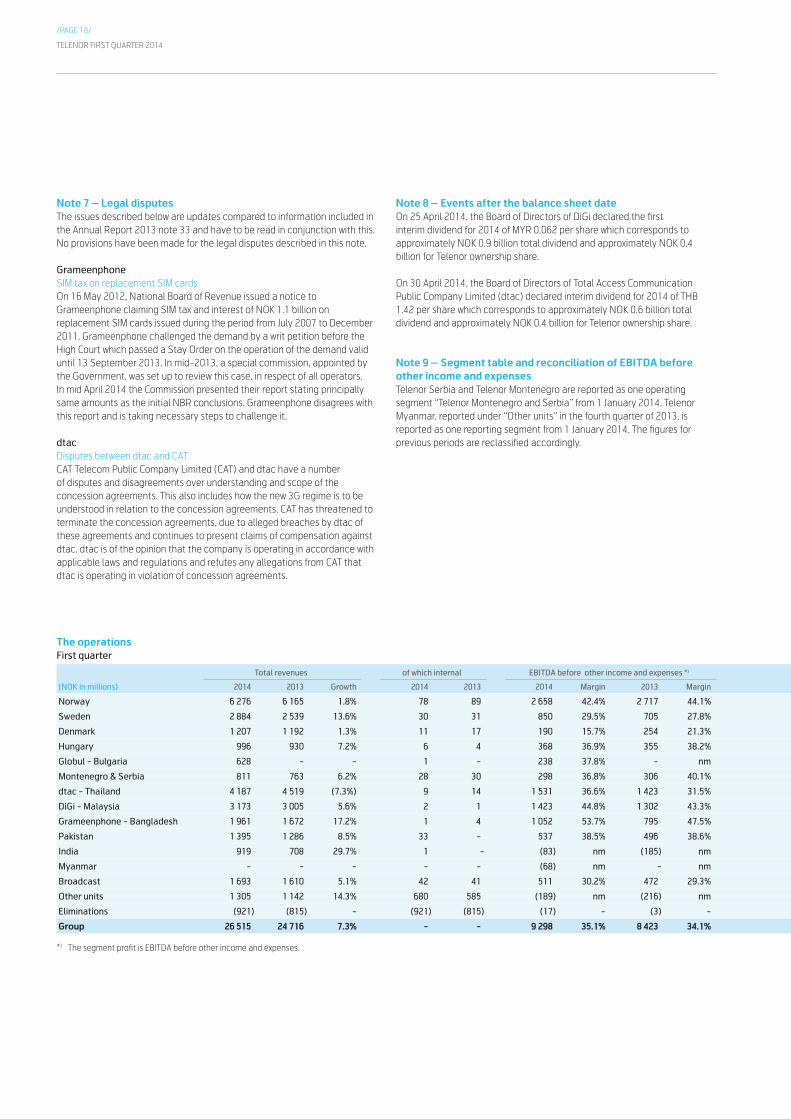
Note 7 – Legal disputesThe issues described below are updates compared to information included in the Annual Report 2013 note 33 and have to be read in conjunction with this. No provisions have been made for the legal disputes described in this note.
Grameenphone SIM tax on replacement SIM cardsOn 16 May 2012, National Board of Revenue issued a notice to Grameenphone claiming SIM tax and interest of NOK 1.1 billion on replacement SIM cards issued during the period from July 2007 to December 2011. Grameenphone challenged the demand by a writ petition before the High Court which passed a Stay Order on the operation of the demand valid until 13 September 2013. In mid-2013, a special commission, appointed by the Government, was set up to review this case, in respect of all operators. In mid April 2014 the Commission presented their report stating principally same amounts as the initial NBR conclusions. Grameenphone disagrees with this report and is taking necessary steps to challenge it.
dtac Disputes between dtac and CAT CAT Telecom Public Company Limited (CAT) and dtac have a number of disputes and disagreements over understanding and scope of the concession agreements. This also includes how the new 3G regime is to be understood in relation to the concession agreements. CAT has threatened to terminate the concession agreements, due to alleged breaches by dtac of these agreements and continues to present claims of compensation against dtac. dtac is of the opinion that the company is operating in accordance with applicable laws and regulations and refutes any allegations from CAT that dtac is operating in violation of concession agreements.
Note 8 – Events after the balance sheet dateOn 25 April 2014, the Board of Directors of DiGi declared the first interim dividend for 2014 of MYR 0.062 per share which corresponds to approximately NOK 0.9 billion total dividend and approximately NOK 0.4 billion for Telenor ownership share.
On 30 April 2014, the Board of Directors of Total Access Communication Public Company Limited (dtac) declared interim dividend for 2014 of THB 1.42 per share which corresponds to approximately NOK 0.6 billion total dividend and approximately NOK 0.4 billion for Telenor ownership share.
Note 9 – Segment table and reconciliation of EBITDA before other income and expensesTelenor Serbia and Telenor Montenegro are reported as one operating segment “Telenor Montenegro and Serbia” from 1 January 2014. Telenor Myanmar, reported under “Other units” in the fourth quarter of 2013, is reported as one reporting segment from 1 January 2014. The figures for previous periods are reclassified accordingly.
The operationsFirst quarter
Total revenues of which internal EBITDA before other income and expenses *) EBITDA Operating profit (loss)
(NOK in millions) 2014 2013 Growth 2014 2013 2014 Margin 2013 Margin 2014 Margin 2013 Margin 2014 Margin 2013 Margin
Norway 6 276 6 165 1.8% 78 89 2 658 42.4% 2 717 44.1% 2 360 37.6% 2 671 43.3% 1 507 24.0% 1 916 31.1%
Sweden 2 884 2 539 13.6% 30 31 850 29.5% 705 27.8% 860 29.8% 704 27.7% 471 16.3% 381 15.0%
Denmark 1 207 1 192 1.3% 11 17 190 15.7% 254 21.3% 173 14.3% 185 15.5% (41) (3.4%) 8 0.7%
Hungary 996 930 7.2% 6 4 368 36.9% 355 38.2% 349 35.0% 344 37.0% 238 23.8% 255 27.4%
Globul - Bulgaria 628 - - 1 - 238 37.8% - nm 235 37.4% - nm (176) nm - nm
Montenegro & Serbia 811 763 6.2% 28 30 298 36.8% 306 40.1% 296 36.6% 306 40.1% 203 25.0% 223 29.2%
dtac - Thailand 4 187 4 519 (7.3%) 9 14 1 531 36.6% 1 423 31.5% 1 538 36.7% 1 317 29.2% 914 21.8% 855 18.9%
DiGi - Malaysia 3 173 3 005 5.6% 2 1 1 423 44.8% 1 302 43.3% 1 432 45.1% 1 303 43.4% 1 212 38.2% 774 25.8%
Grameenphone - Bangladesh 1 961 1 672 17.2% 1 4 1 052 53.7% 795 47.5% 1 053 53.7% 795 47.5% 725 37.0% 532 31.8%
Pakistan 1 395 1 286 8.5% 33 - 537 38.5% 496 38.6% 541 38.8% 497 38.7% 377 27.0% 1 0.1%
India 919 708 29.7% 1 - (83) nm (185) nm 1 590 173.1% (192) nm 1 531 166.7% (194) nm
Myanmar - - - - - (68) nm - nm (68) nm - nm (71) nm - nm
Broadcast 1 693 1 610 5.1% 42 41 511 30.2% 472 29.3% 1 721 101.7% 474 29.4% 1 583 93.5% 324 20.1%
Other units 1 305 1 142 14.3% 680 585 (189) nm (216) nm (199) nm (248) nm (316) nm (365) nm
Eliminations (921) (815) - (921) (815) (17) - (3) - - - (3) - 1 - 2 -
Group 26 515 24 716 7.3% - - 9 298 35.1% 8 423 34.1% 11 884 44.8% 8 153 33.0% 8 157 30.8% 4 713 19.1%
*) The segment profit is EBITDA before other income and expenses.
TELENOR FIRST QUARTER 2014
/PAGE 19/
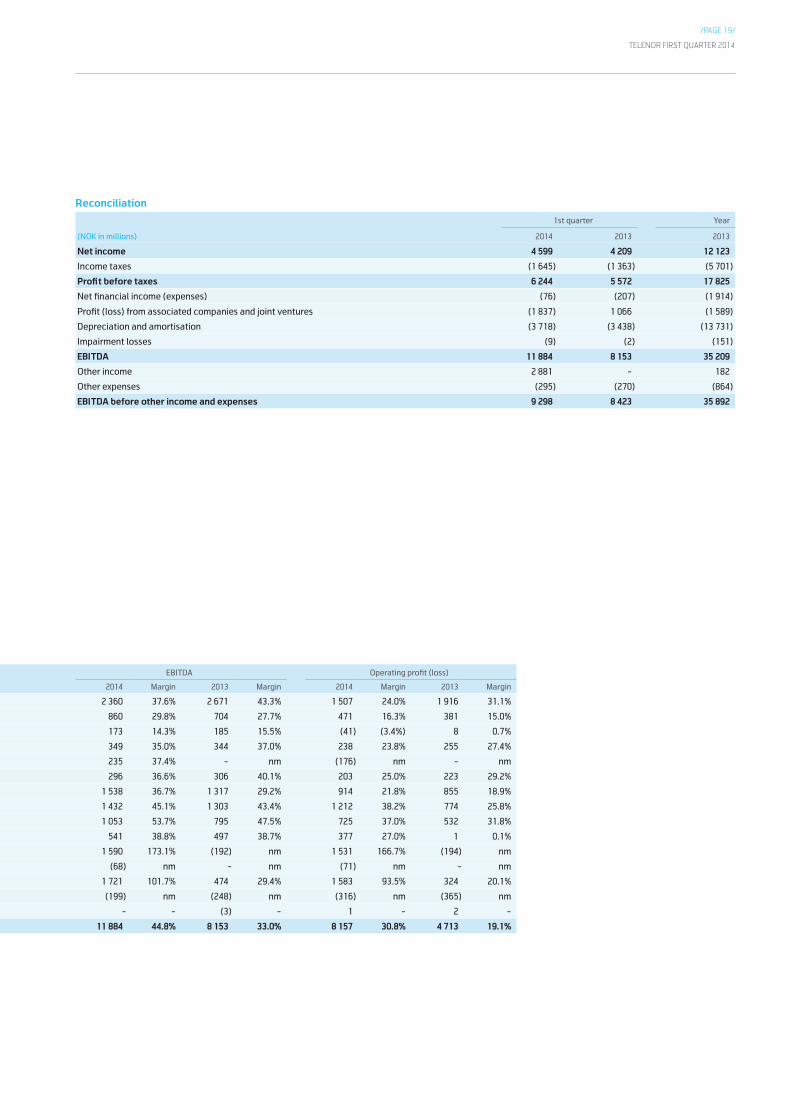
The operationsFirst quarter
Total revenues of which internal EBITDA before other income and expenses *) EBITDA Operating profit (loss)
(NOK in millions) 2014 2013 Growth 2014 2013 2014 Margin 2013 Margin 2014 Margin 2013 Margin 2014 Margin 2013 Margin
Norway 6 276 6 165 1.8% 78 89 2 658 42.4% 2 717 44.1% 2 360 37.6% 2 671 43.3% 1 507 24.0% 1 916 31.1%
Sweden 2 884 2 539 13.6% 30 31 850 29.5% 705 27.8% 860 29.8% 704 27.7% 471 16.3% 381 15.0%
Denmark 1 207 1 192 1.3% 11 17 190 15.7% 254 21.3% 173 14.3% 185 15.5% (41) (3.4%) 8 0.7%
Hungary 996 930 7.2% 6 4 368 36.9% 355 38.2% 349 35.0% 344 37.0% 238 23.8% 255 27.4%
Globul - Bulgaria 628 - - 1 - 238 37.8% - nm 235 37.4% - nm (176) nm - nm
Montenegro & Serbia 811 763 6.2% 28 30 298 36.8% 306 40.1% 296 36.6% 306 40.1% 203 25.0% 223 29.2%
dtac - Thailand 4 187 4 519 (7.3%) 9 14 1 531 36.6% 1 423 31.5% 1 538 36.7% 1 317 29.2% 914 21.8% 855 18.9%
DiGi - Malaysia 3 173 3 005 5.6% 2 1 1 423 44.8% 1 302 43.3% 1 432 45.1% 1 303 43.4% 1 212 38.2% 774 25.8%
Grameenphone - Bangladesh 1 961 1 672 17.2% 1 4 1 052 53.7% 795 47.5% 1 053 53.7% 795 47.5% 725 37.0% 532 31.8%
Pakistan 1 395 1 286 8.5% 33 - 537 38.5% 496 38.6% 541 38.8% 497 38.7% 377 27.0% 1 0.1%
India 919 708 29.7% 1 - (83) nm (185) nm 1 590 173.1% (192) nm 1 531 166.7% (194) nm
Myanmar - - - - - (68) nm - nm (68) nm - nm (71) nm - nm
Broadcast 1 693 1 610 5.1% 42 41 511 30.2% 472 29.3% 1 721 101.7% 474 29.4% 1 583 93.5% 324 20.1%
Other units 1 305 1 142 14.3% 680 585 (189) nm (216) nm (199) nm (248) nm (316) nm (365) nm
Eliminations (921) (815) - (921) (815) (17) - (3) - - - (3) - 1 - 2 -
Group 26 515 24 716 7.3% - - 9 298 35.1% 8 423 34.1% 11 884 44.8% 8 153 33.0% 8 157 30.8% 4 713 19.1%
*) The segment profit is EBITDA before other income and expenses.
Reconciliation
1st quarter Year
(NOK in millions) 2014 2013 2013
Net income 4 599 4 209 12 123
Income taxes (1 645) (1 363) (5 701)
Profit before taxes 6 244 5 572 17 825
Net financial income (expenses) (76) (207) (1 914)
Profit (loss) from associated companies and joint ventures (1 837) 1 066 (1 589)
Depreciation and amortisation (3 718) (3 438) (13 731)
Impairment losses (9) (2) (151)
EBITDA 11 884 8 153 35 209
Other income 2 881 - 182
Other expenses (295) (270) (864)
EBITDA before other income and expenses 9 298 8 423 35 892

TELENOR FIRST QUARTER 2014
/PAGE 20/
• Organic revenue is defined as revenue adjusted for the effects of acquisition and disposal of operations and currency effects.
• Capital expenditure (capex) is investments in tangible and intangible assets.
• Operating cash flow is defined as EBITDA before other income and expenses less capex, excluding licences and spectrum.
• Investments in businesses comprise acquisitions of shares and participations, including acquisitions of subsidiaries and businesses not organised as separate companies.
Mobile operationsRevenuesSubscription and traffic• consist of subscription and connection fees, revenues from voice
(outgoing traffic) and non-voice traffic, outbound roaming and other mobile service revenues. Subscription and traffic includes only revenues from the company’s own subscriptions.
Interconnect• consist of revenues from incoming traffic related to the company’s own
subscriptions. Revenues from incoming traffic related to service provider or MVNO subscriptions are not included.
Other mobile• consist of inbound roaming, national roaming, telemetric and revenues
related to service providers and MVNOs (Mobile Virtual Network Operators). Telemetric is defined as machine-to-machine SIM cards (M2M), for example vending machines and meter readings.
Non-mobile• consist of revenues from customer equipment and businesses that are not
directly related to mobile operations.
Mobile revenues from company’s own subscriptions• consist of ‘Subscription and traffic’ and ‘Interconnect’ and do not include
revenues from inbound roaming, national roaming, service providers, MVNOs, sale of customer equipment and incoming traffic related to service provider subscriptions.
Key figuresSubscriptionsContract subscriptions are counted until the subscription is terminated or until there has been no revenues or outgoing/incoming traffic during the last three months. Prepaid subscriptions are counted as active if there has been outgoing or incoming traffic or if the SIM card has been reloaded during the last three months. Service provider and MVNO subscriptions are not included. Data only SIM cards are included, but SIM cards used for telemetric applications and twin/multi SIM cards are excluded. Total subscriptions are voice SIM cards plus data only SIM cards used for mobile broadband.
Active mobile internet usersActive mobile internet users are subscriptions with at least 50 KB of data during the last month of the quarter.
Average traffic minutes per subscription per month (AMPU)Traffic minutes per subscription per month are calculated based on total outgoing and incoming rated minutes from the company’s own subscriptions less data only subscriptions. This includes zero rated minutes and outgoing minutes from own subscriptions while roaming. Outgoing and incoming minutes related to inbound roaming, national roaming, service providers and MVNOs are not included.
Average revenue per subscription per month (ARPU)ARPU is calculated based on mobile revenues from the company’s own subscriptions, divided by the average number of subscriptions for the relevant period.
Fixed operations
RevenuesTelephony• consist of subscription and connection fees, traffic (fixed to fixed, fixed to
mobile, to other countries, value added services, other traffic) for PSTN/ISDN and Voice over Internet Protocol (VoIP).
Internet and TV• consist of subscription and connection fees for xDSL and fibre,
subscription fees and traffic charges for Dial Up Internet in addition to revenues from TV services.
Data services• consist of Nordic Connect/IP-VPN, Global communication and security.
Other• consist of leased lines, managed services and other retail products.
Wholesale• consist of sale to service providers of telephony (PSTN/ISDN), Bitstream,
LLUB, national and international interconnect, transit traffic, leased lines and other wholesale products.
Key figuresSubscriptionsTelephony consist of PSTN, ISDN and VoIP subscriptions.
Internet consists of broadband access over xDSL, fibre and cable TV.
TV consists of TV services over fibre and cable.
Subscriptions are counted until the subscription is terminated.
Average revenue per subscription per month (ARPU)ARPU is calculated based on revenues from the company’s own subscriptions, divided by the average number of subscriptions for the relevant period.
Internet ARPU is calculated based on Internet revenues as defined above except TV service revenues.
TV ARPU is calculated based on revenues from TV services.
Broadcast
RevenuesCanal Digital DTH• consist of revenues from Nordic DTH subscribers, households in SMATV
networks and DTT subscribers in Finland.
Satellite Broadcasting• consist of revenues from satellite services from the satellite position
1-degree west.
Norkring• consist of revenues from terrestrial radio and TV transmission in Norway
and Belgium.
Conax• consist of revenues from sale of encryption and conditional access
services for TV distribution.
Other• consist of revenues from Telenor Media Invest.
Definitions

TELENOR FIRST QUARTER 2014
/PAGE 21/

First quarter 2014Published by Telenor ASAN-1331 Fornebu, NorwayPhone: +47 67 89 00 00
Investor Relations:Phone: +47 67 89 24 70e-mail: [email protected]
www.telenor.com
2141
106
• B
olt C
omm
unic
atio
n A
S •
bol
tcom
mun
icat
ion.
no