q-exactive lc-ms. turboflow technology - special columns - complex valving - extra pump uhplc -fast...
TRANSCRIPT
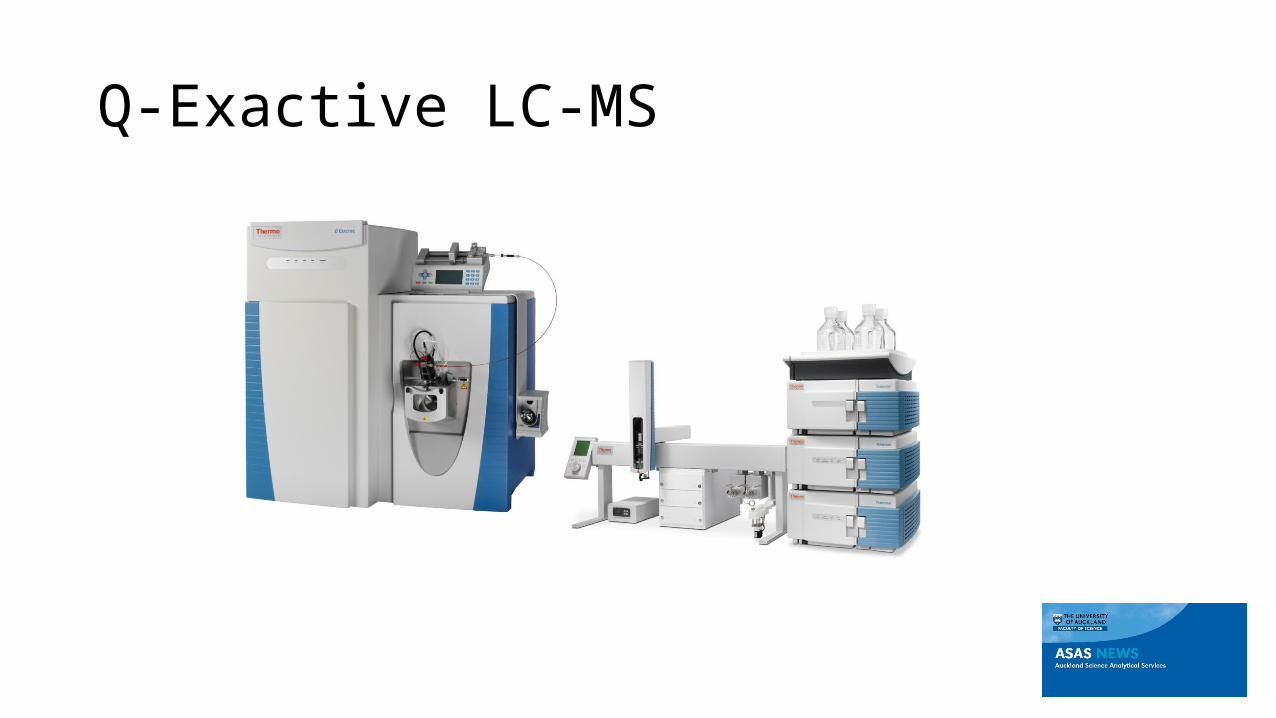
Q-Exactive LC-MS
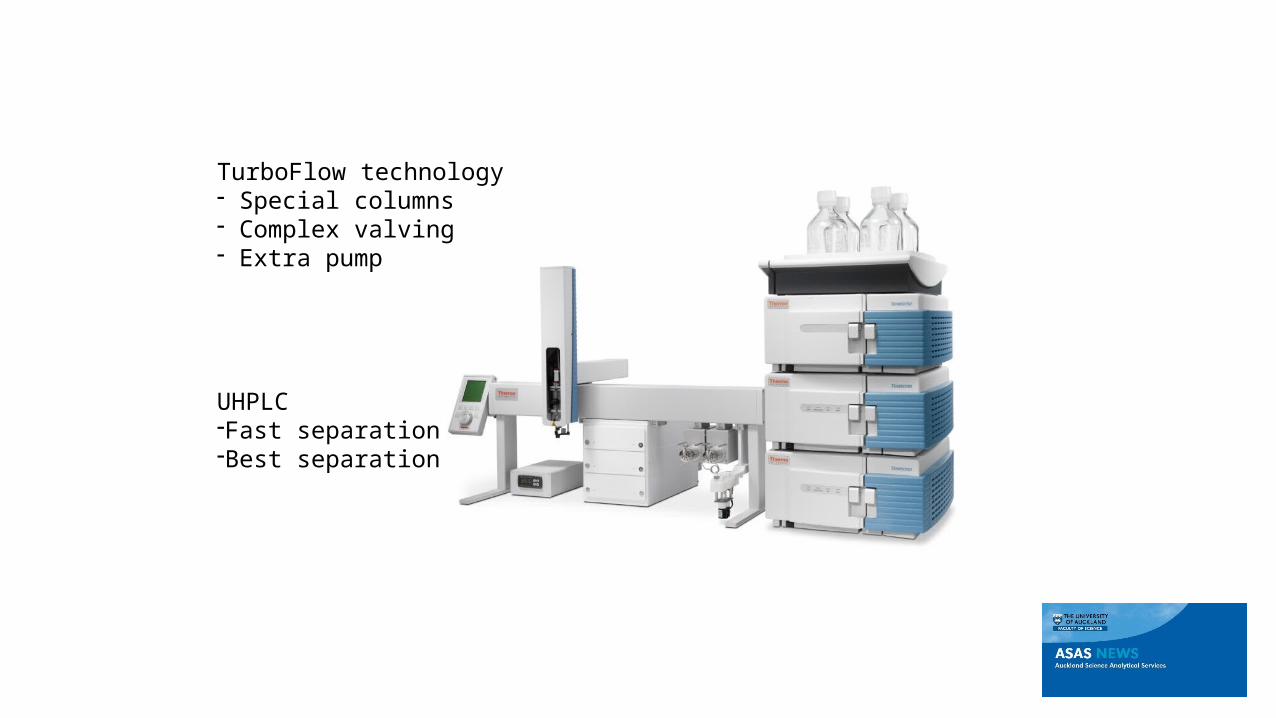
TurboFlow technology- Special columns- Complex valving- Extra pump
UHPLC-Fast separation-Best separation
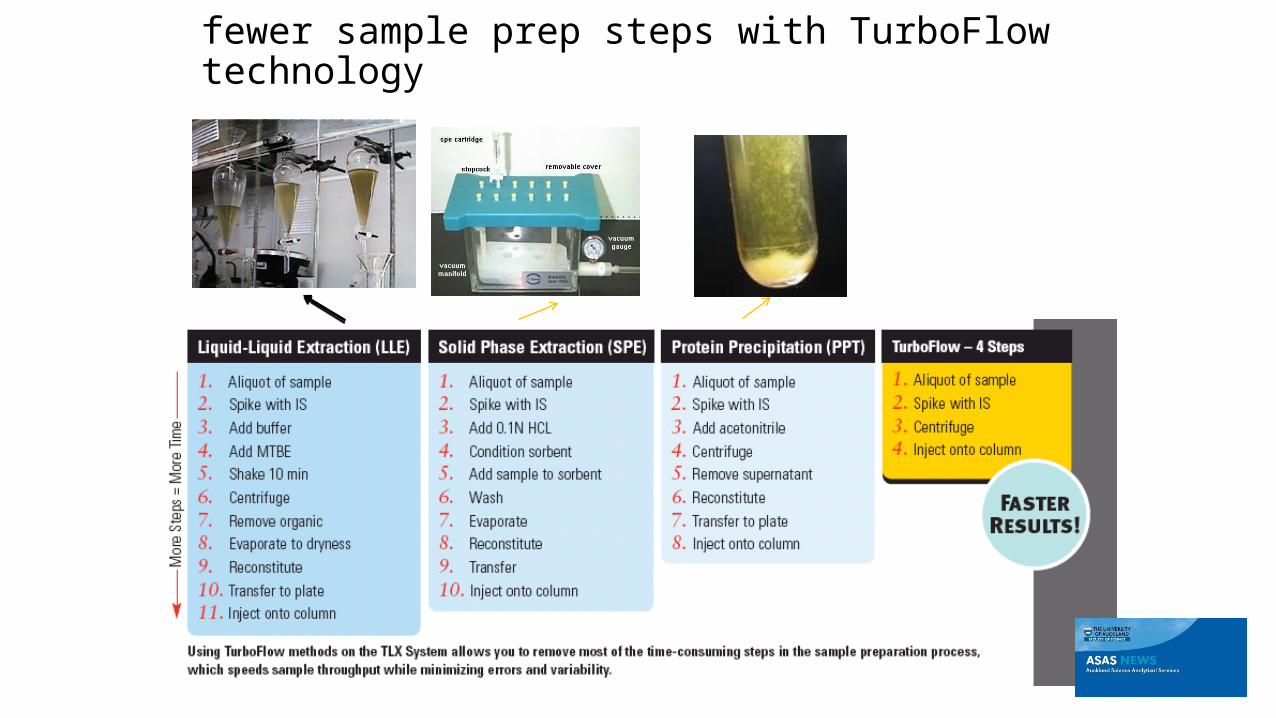
fewer sample prep steps with TurboFlow
technology
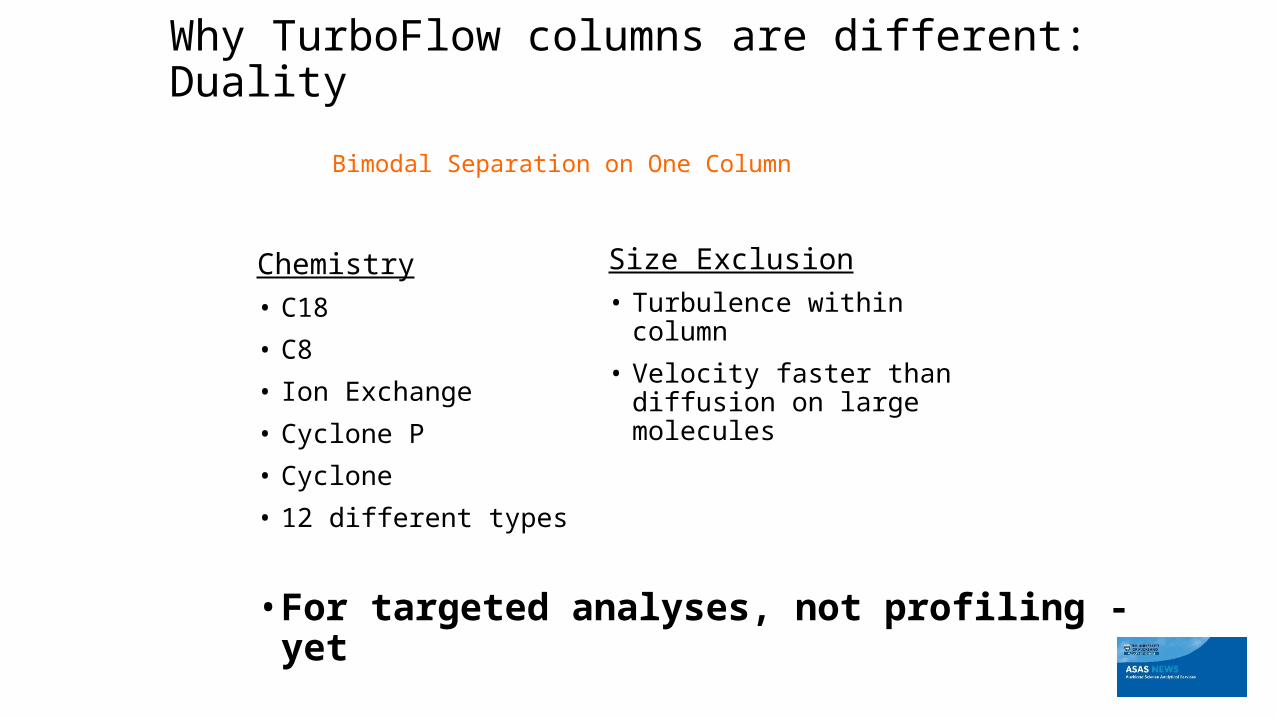
Why TurboFlow columns are different: Duality
Chemistry• C18
• C8
• Ion Exchange
• Cyclone P
• Cyclone
• 12 different types
• For targeted analyses, not profiling - yet
Size Exclusion• Turbulence within column
• Velocity faster than diffusion on large molecules
Bimodal Separation on One Column
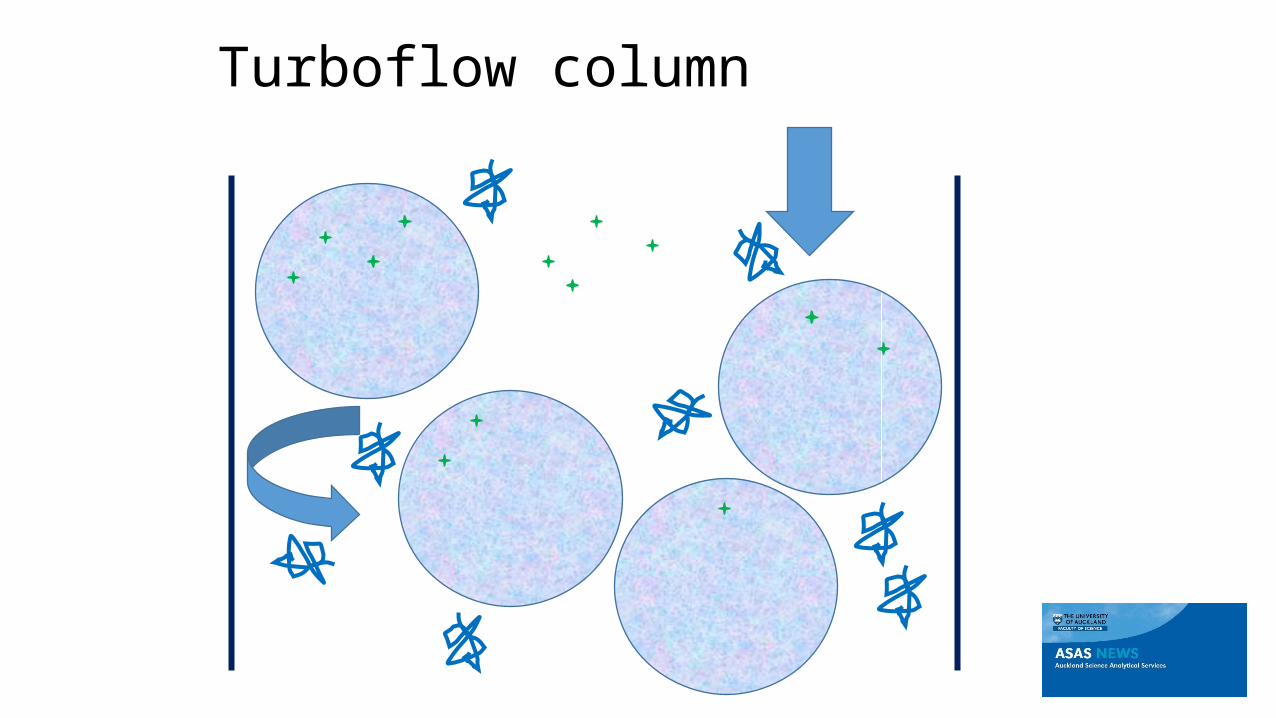
Turboflow column
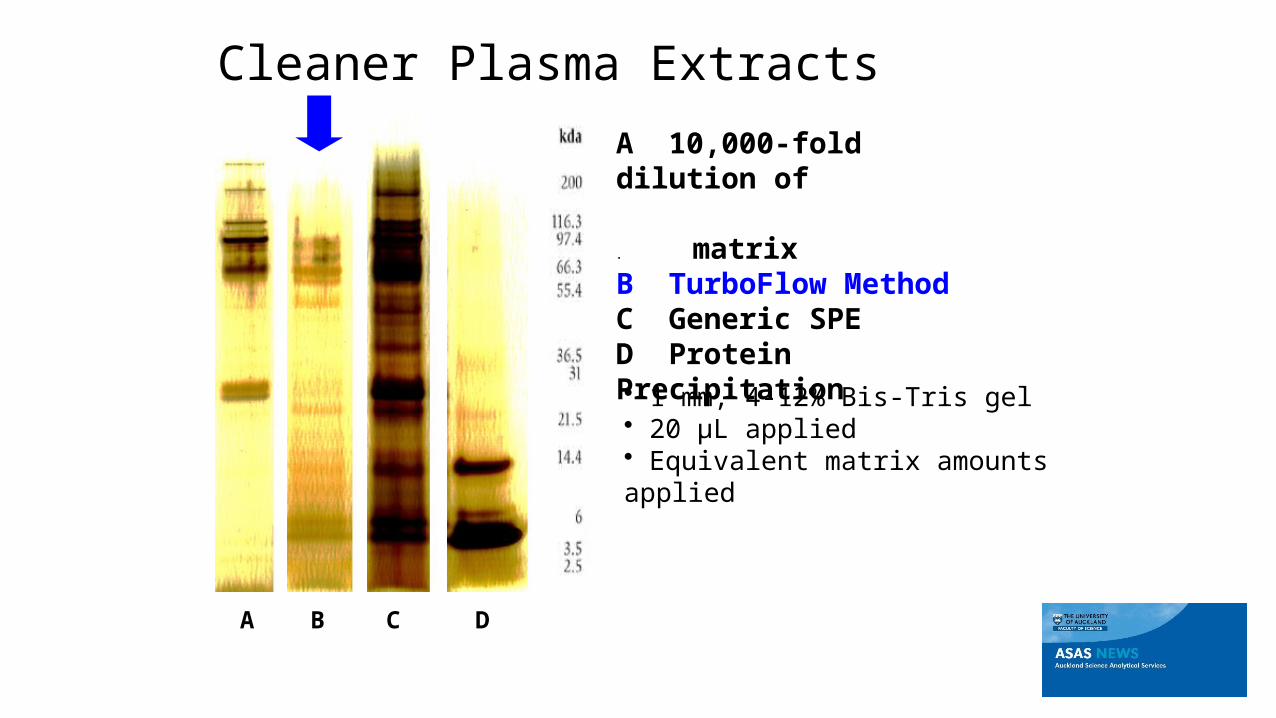
A 10,000-fold dilution of . matrixB TurboFlow MethodC Generic SPED Protein Precipitation
A B C D
• 1 mm, 4-12% Bis-Tris gel • 20 μL applied• Equivalent matrix amounts applied
Cleaner Plasma Extracts
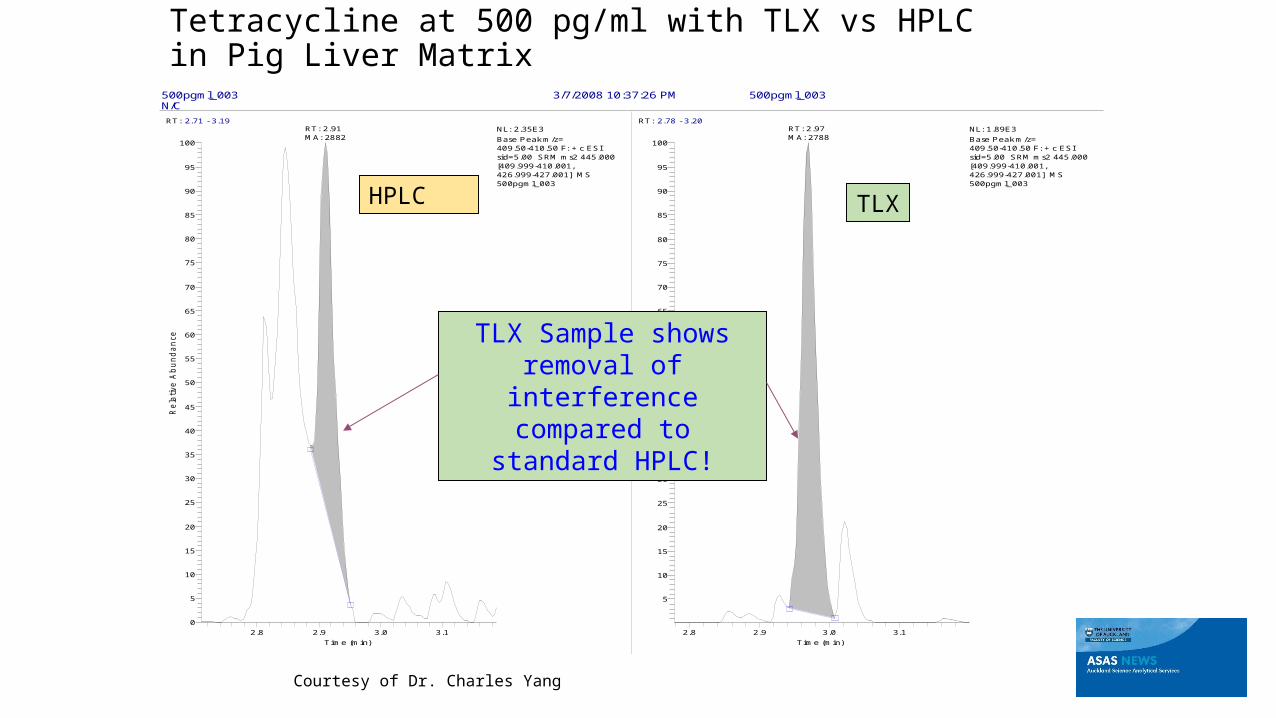
Tetracycline at 500 pg/ml with TLX vs HPLC in Pig Liver Matrix
500pgml_003 3/7/2008 10:37:26 PM 500pgml_003N/C
RT: 2.71 - 3.19
2.8 2.9 3.0 3.1
Time (min)
0
5
10
15
20
25
30
35
40
45
50
55
60
65
70
75
80
85
90
95
100
Re
lative
Ab
un
da
nce
RT: 2.91MA: 2882
NL: 2.35E3
Base Peak m/z= 409.50-410.50 F: + c ESI sid=5.00 SRM ms2 445.000 [409.999-410.001, 426.999-427.001] MS 500pgml_003
RT: 2.78 - 3.20
2.8 2.9 3.0 3.1
Time (min)
5
10
15
20
25
30
35
40
45
50
55
60
65
70
75
80
85
90
95
100
Re
lative
Ab
un
da
nce
RT: 2.97MA: 2788
NL: 1.89E3
Base Peak m/z= 409.50-410.50 F: + c ESI sid=5.00 SRM ms2 445.000 [409.999-410.001, 426.999-427.001] MS 500pgml_003
HPLC TLX
TLX Sample shows removal of
interference compared to standard HPLC!
Courtesy of Dr. Charles Yang
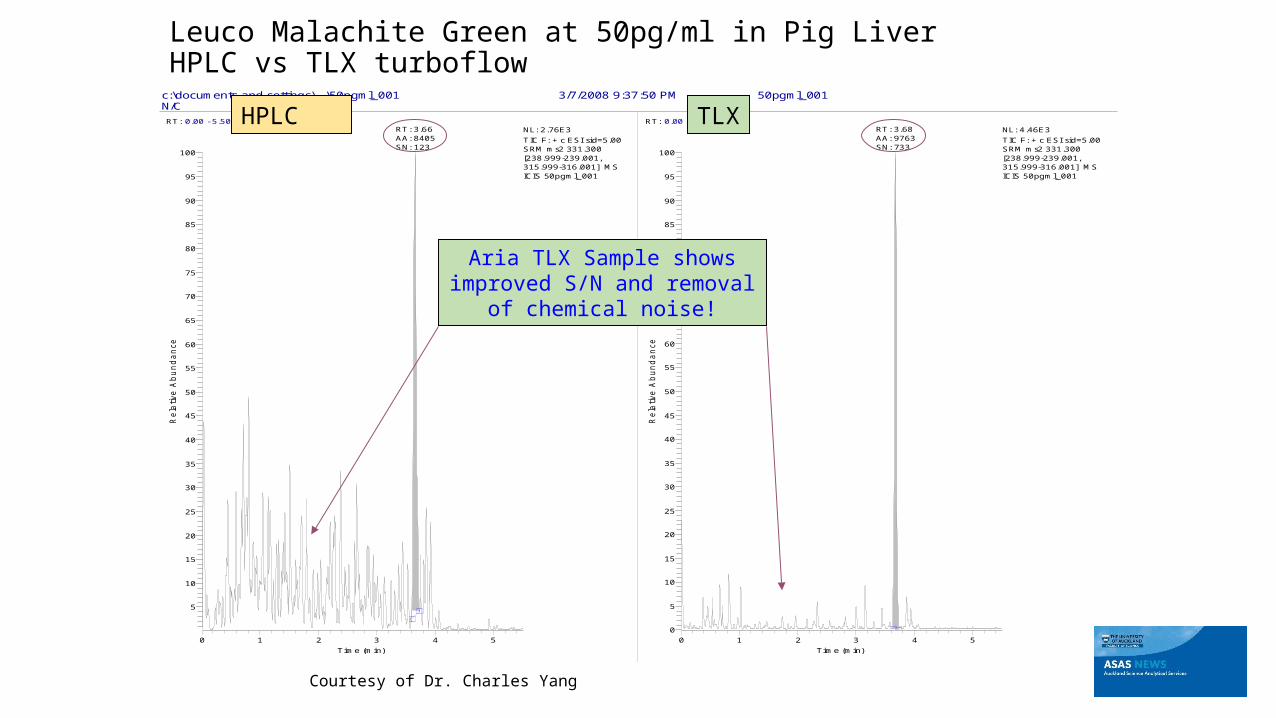
Leuco Malachite Green at 50pg/ml in Pig Liver HPLC vs TLX turboflow
c:\documents and settings\...\50pgml_001 3/7/2008 9:37:50 PM 50pgml_001N/C
RT: 0.00 - 5.50
0 1 2 3 4 5
Time (min)
5
10
15
20
25
30
35
40
45
50
55
60
65
70
75
80
85
90
95
100
Re
lative
Ab
un
da
nce
RT: 3.66AA: 8405SN: 123
NL: 2.76E3
TIC F: + c ESI sid=5.00 SRM ms2 331.300 [238.999-239.001, 315.999-316.001] MS ICIS 50pgml_001
RT: 0.00 - 5.50
0 1 2 3 4 5
Time (min)
0
5
10
15
20
25
30
35
40
45
50
55
60
65
70
75
80
85
90
95
100
Re
lative
Ab
un
da
nce
RT: 3.68AA: 9763SN: 733
NL: 4.46E3
TIC F: + c ESI sid=5.00 SRM ms2 331.300 [238.999-239.001, 315.999-316.001] MS ICIS 50pgml_001
HPLC TLX
Aria TLX Sample shows improved S/N and removal
of chemical noise!
Courtesy of Dr. Charles Yang
0 1 2 3 4 50
10000
20000
30000
40000
50000
60000
70000
80000
90000
100000
110000
120000
130000
140000
Inte
nsi
tyTime (min)
(B)
0 1 2 3 4 50
10000
20000
30000
40000
50000
60000
70000
80000
90000
100000
110000
120000
130000
140000
Inte
nsity
Time (min)
(B)
0 1 2 3 4 50
20000
40000
60000
80000
100000
120000
140000
Inte
nsity
Time (min)
(B)
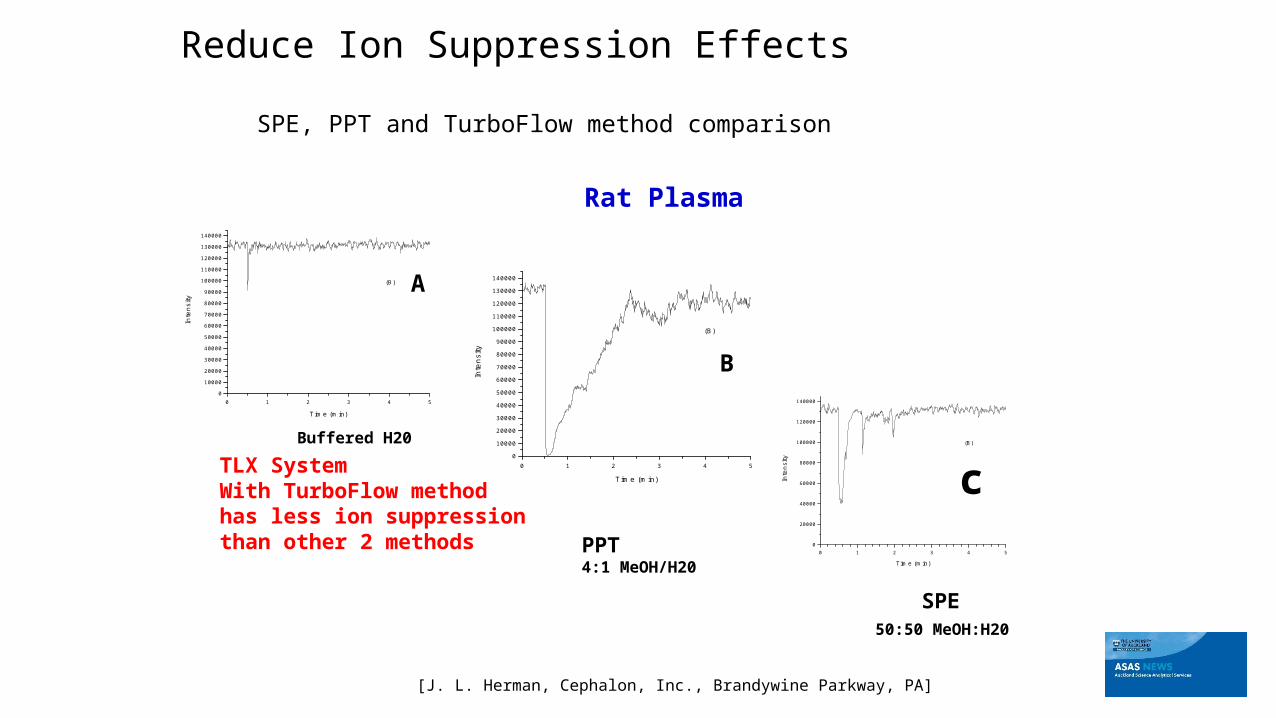
Rat Plasma
Buffered H20
50:50 MeOH:H20
TLX SystemWith TurboFlow methodhas less ion suppression than other 2 methods PPT
4:1 MeOH/H20
SPE
[J. L. Herman, Cephalon, Inc., Brandywine Parkway, PA]
Reduce Ion Suppression Effects
SPE, PPT and TurboFlow method comparison
A
B
c

Ubiquitous (all species)
Concentrated (mg/ml in plasma)
Relatively late-eluting
Surfactants –“matrix effectors”
Strongly retained (ghost peaks)
Unstable –degrade to fatty acids and head groups
Ref: K. C. Van Horn, Tandem Labs, BSAT Presentation 2006
Phospholipids – ion suppression
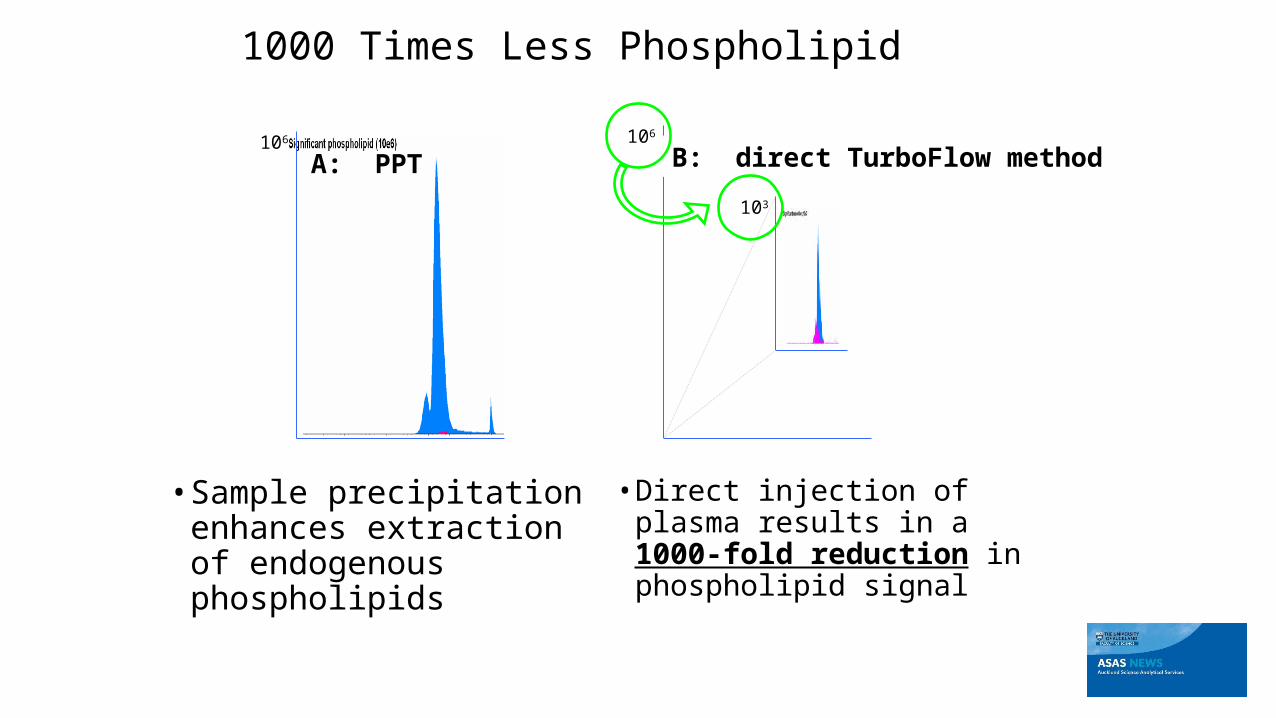
106 106
103
1000 Times Less Phospholipid
• Sample precipitation enhances extraction of endogenous phospholipids
• Direct injection of plasma results in a 1000-fold reduction in phospholipid signal
A: PPT B: direct TurboFlow method

Accela 1250 + Q ExactiveR = 70,000All compound elute in 2mins, with peak width of 0.04 mins = 9 scans under the peak
UHPLC: 60+ pesticides in 2 mins, 4s wide peaks, Full scan
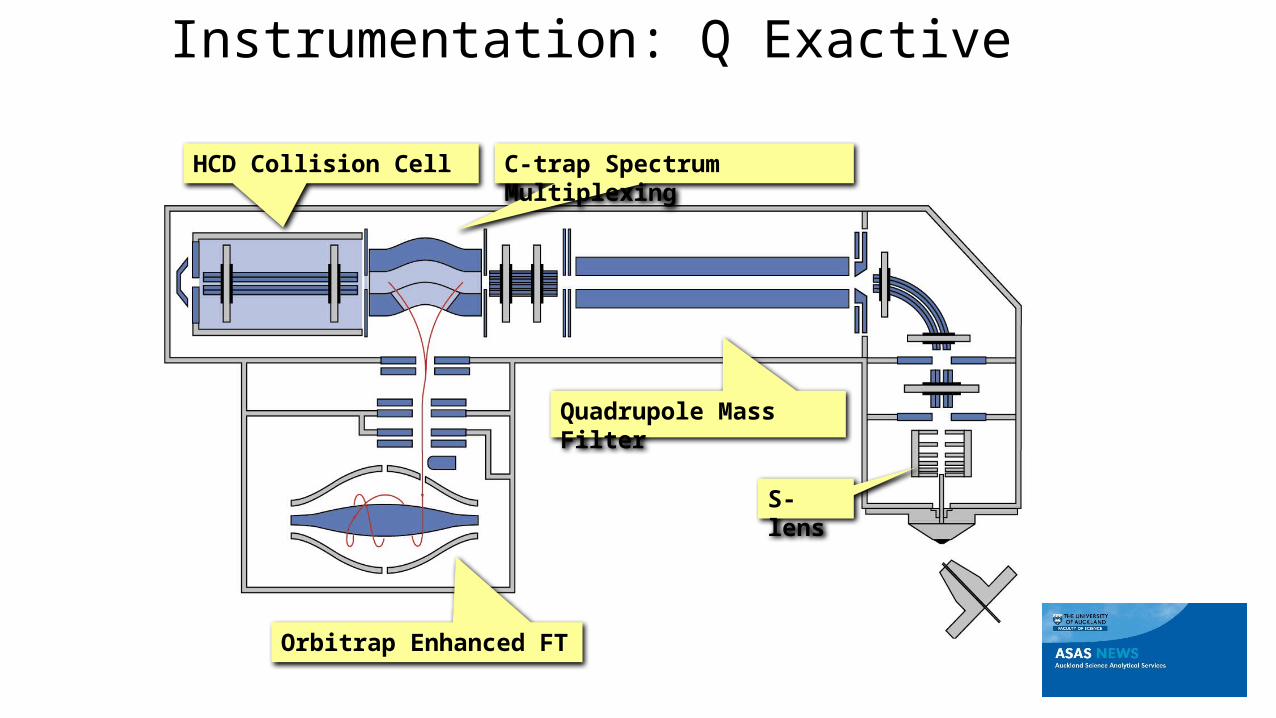
Instrumentation: Q Exactive
Quadrupole Mass Filter
HCD Collision Cell
S-lens
C-trap Spectrum Multiplexing
Orbitrap Enhanced FT
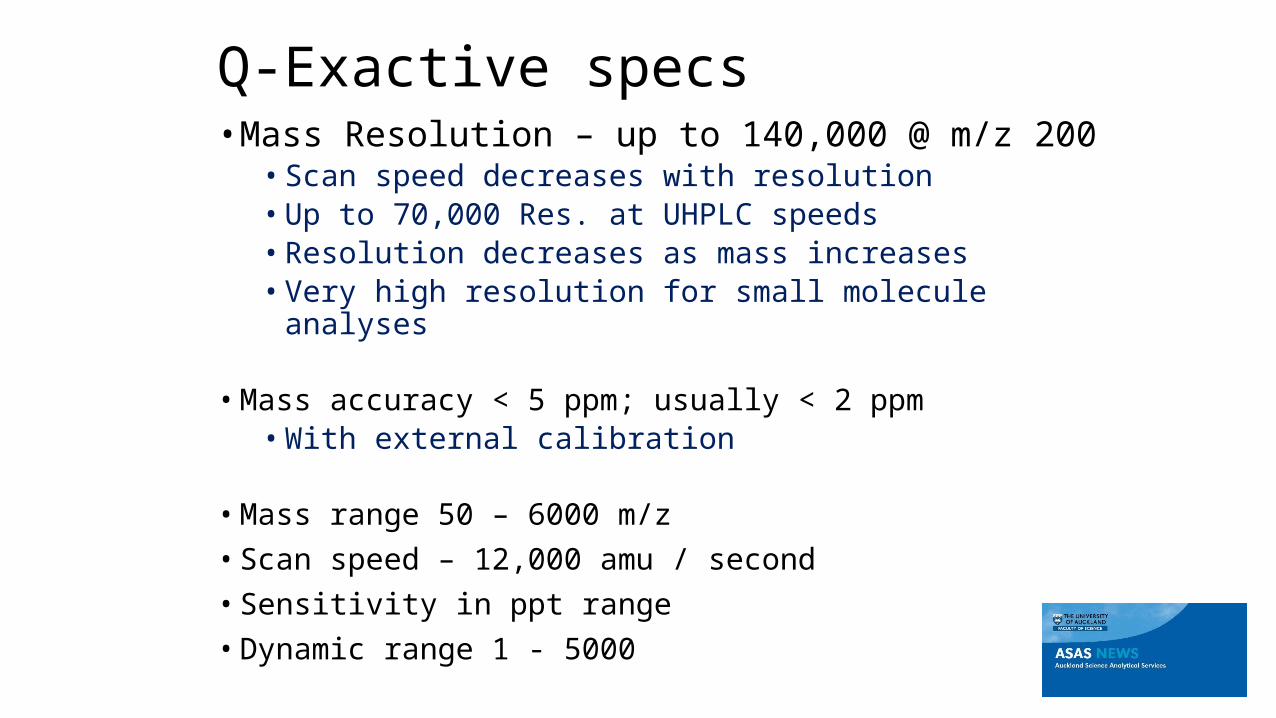
Q-Exactive specs• Mass Resolution – up to 140,000 @ m/z 200
• Scan speed decreases with resolution• Up to 70,000 Res. at UHPLC speeds• Resolution decreases as mass increases• Very high resolution for small molecule analyses
• Mass accuracy < 5 ppm; usually < 2 ppm• With external calibration
• Mass range 50 – 6000 m/z
• Scan speed – 12,000 amu / second
• Sensitivity in ppt range
• Dynamic range 1 - 5000
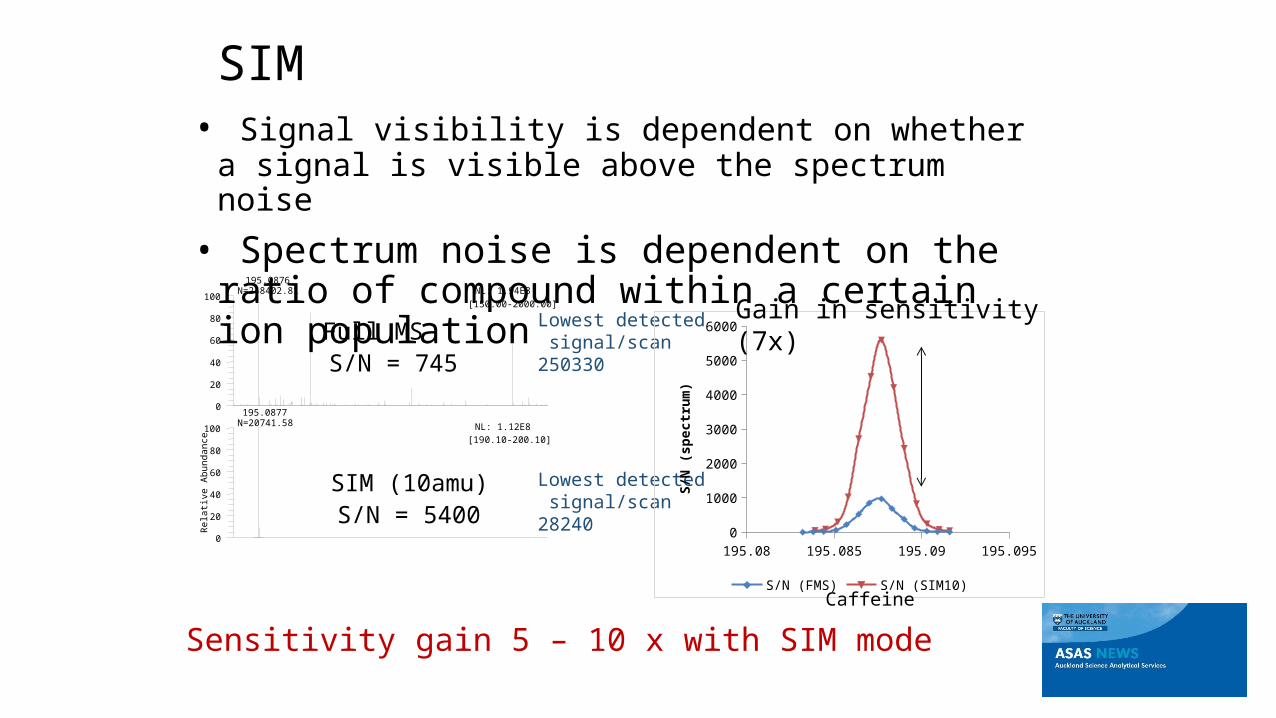
SIM• Signal visibility is dependent on whether a signal is
visible above the spectrum noise
• Spectrum noise is dependent on the ratio of compound within a certain ion population
0
20
40
60
80
100
Rela
tive
Ab
und
an
ce
0
20
40
60
80
100
195.0876N=248402.81
195.0877N=20741.58
NL: 1.94E8[150.00-2000.00]
NL: 1.12E8[190.10-200.10]
Full MS
SIM (10amu)
S/N = 745
S/N = 5400
Lowest detected signal/scan250330
Lowest detected signal/scan28240
195.082 195.084 195.086 195.088 195.09 195.092 195.0940
1000
2000
3000
4000
5000
6000
S/N (FMS) S/N (SIM10)
S/N
(spe
ctru
m)
Gain in sensitivity (7x)
Sensitivity gain 5 – 10 x with SIM modeCaffeine
-3
-2
-1
0
1
2
0 10 20 30 40 50 60
Te
mp
era
ture
Ch
an
ge
[K]
Time [h]
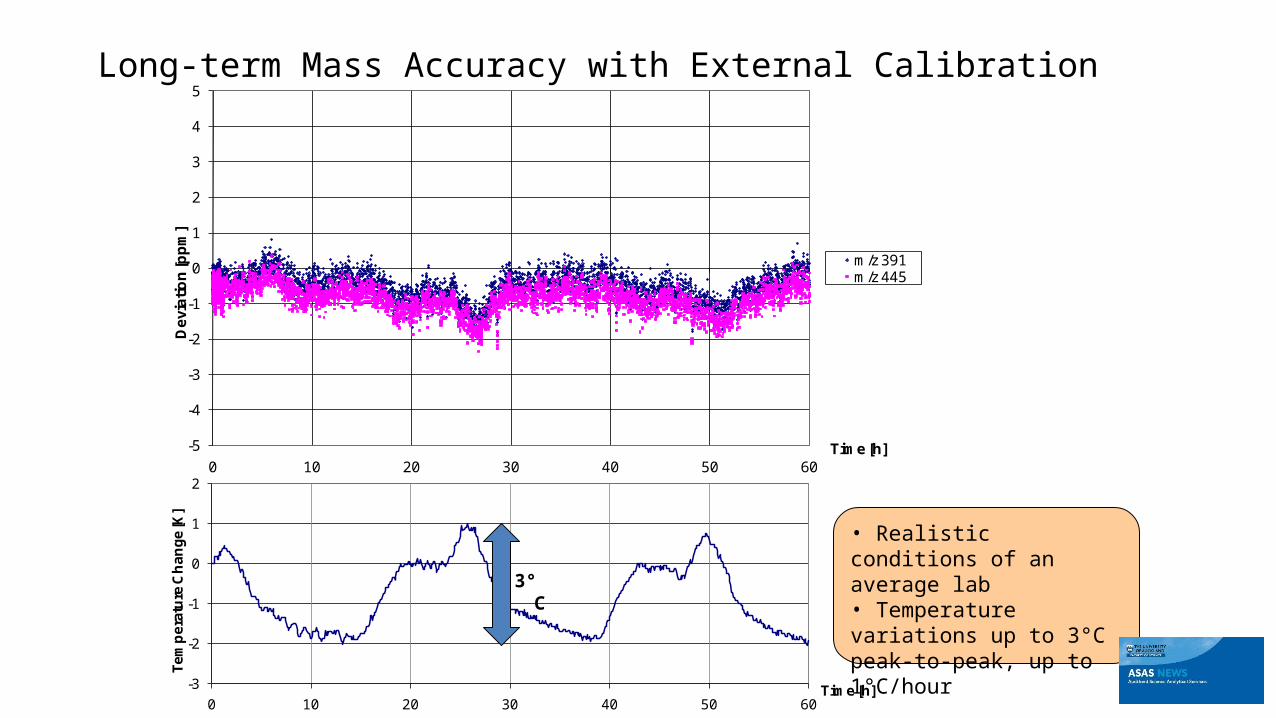
Long-term Mass Accuracy with External Calibration
-5
-4
-3
-2
-1
0
1
2
3
4
5
0 10 20 30 40 50 60
De
via
tio
n [p
pm
]
Time [h]
m/z 391m/z 445
3° C
• Realistic conditions of an average lab• Temperature variations up to 3°C peak-to-peak, up to 1°C/hour
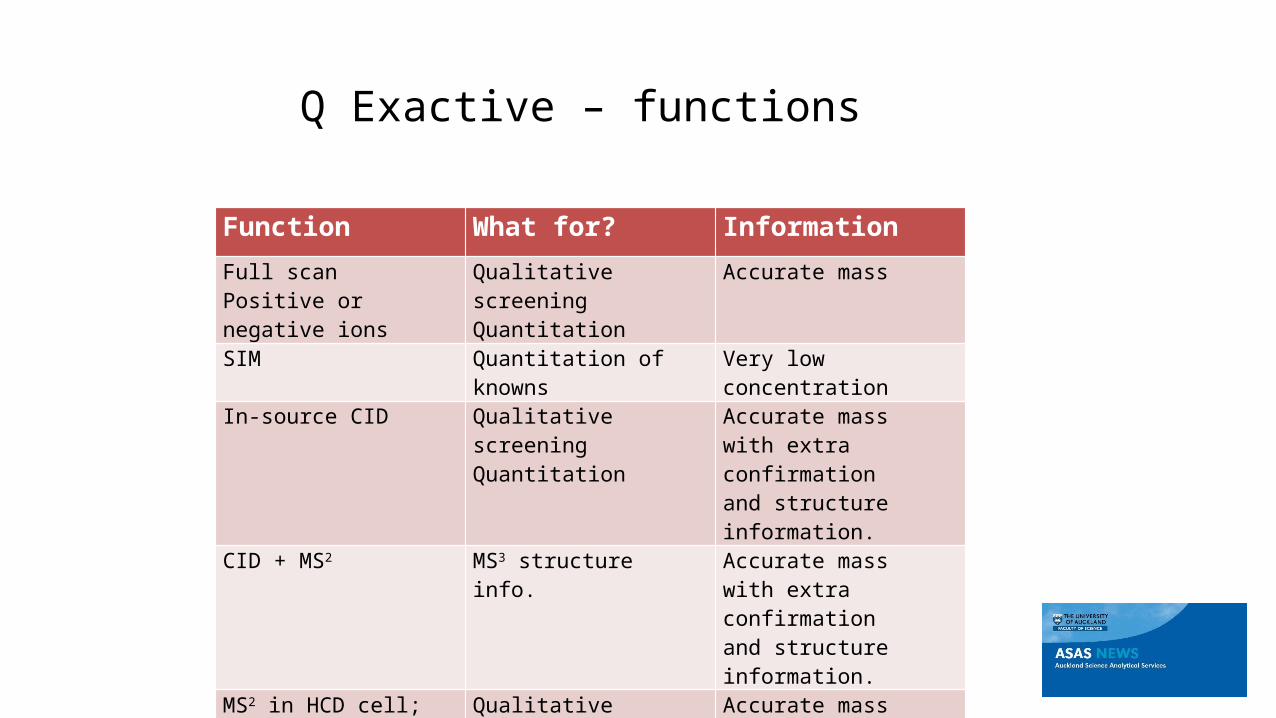
Q Exactive – functions
Function What for? Information
Full scanPositive or negative ions
Qualitative screeningQuantitation
Accurate mass
SIM Quantitation of knowns Very low concentration
In-source CID Qualitative screening Quantitation
Accurate mass with extra confirmation and structure information.
CID + MS2 MS3 structure info. Accurate mass with extra confirmation and structure information.
MS2 in HCD cell;All Ions Fragmentation, Data Dependent or targeted like QQQ
Qualitative screeningQuantitation
Accurate mass with extra confirmation and structure information.
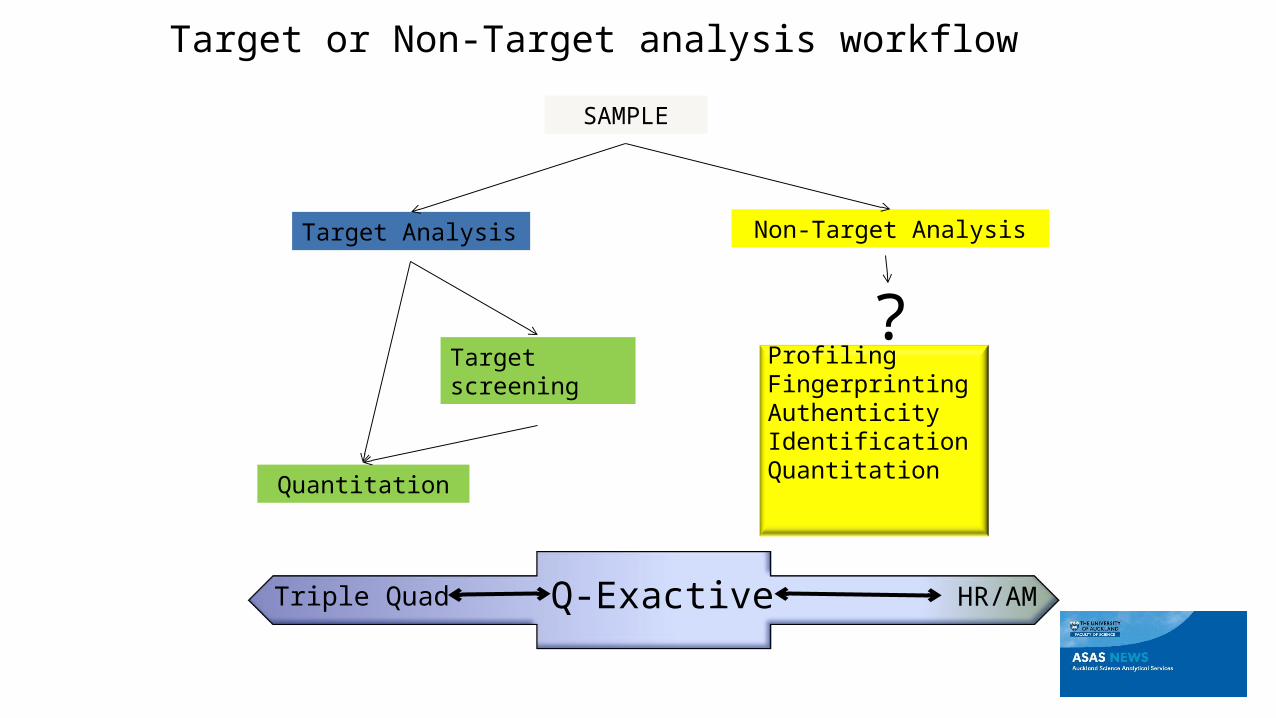
Target or Non-Target analysis workflow
SAMPLE
Target Analysis Non-Target Analysis
Quantitation
Target screening
?ProfilingFingerprintingAuthenticityIdentificationQuantitation
Q-ExactiveTriple Quad HR/AM
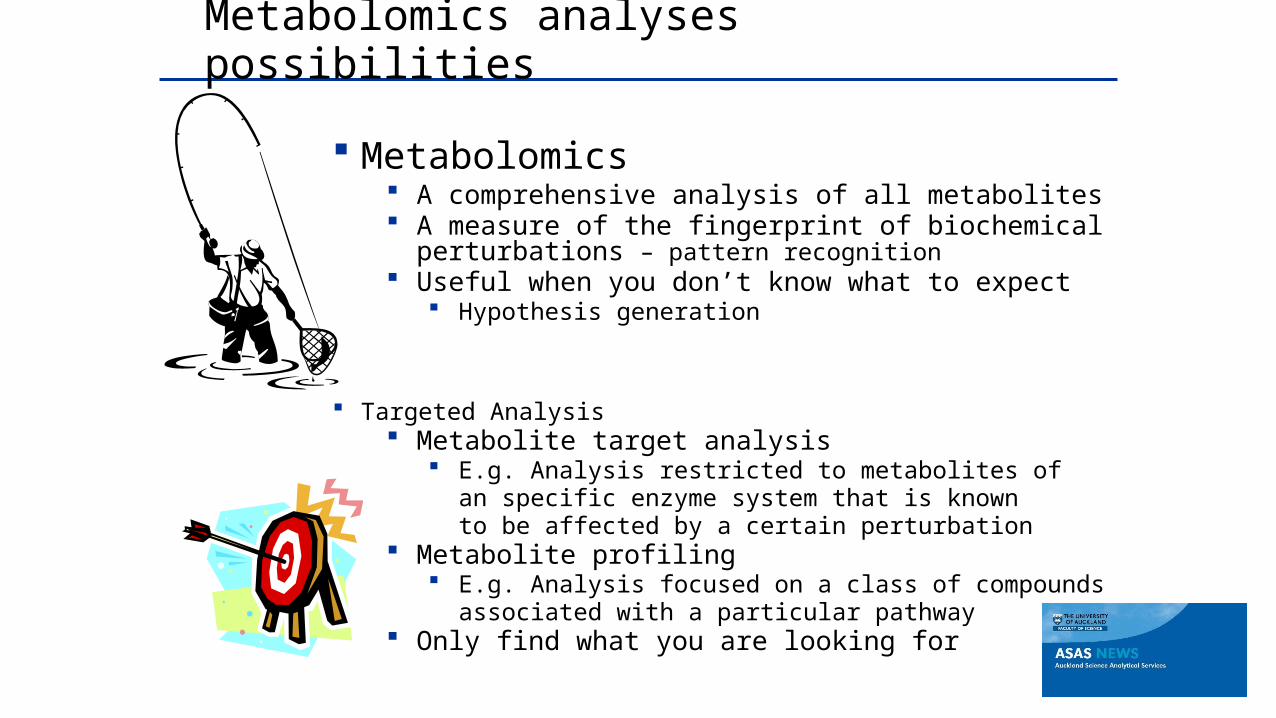
Metabolomics A comprehensive analysis of all metabolites A measure of the fingerprint of biochemical
perturbations – pattern recognition Useful when you don’t know what to expect
Hypothesis generation
Targeted Analysis Metabolite target analysis
E.g. Analysis restricted to metabolites of an specific enzyme system that is known to be affected by a certain perturbation
Metabolite profiling E.g. Analysis focused on a class of compounds
associated with a particular pathway Only find what you are looking for
Metabolomics analyses possibilities
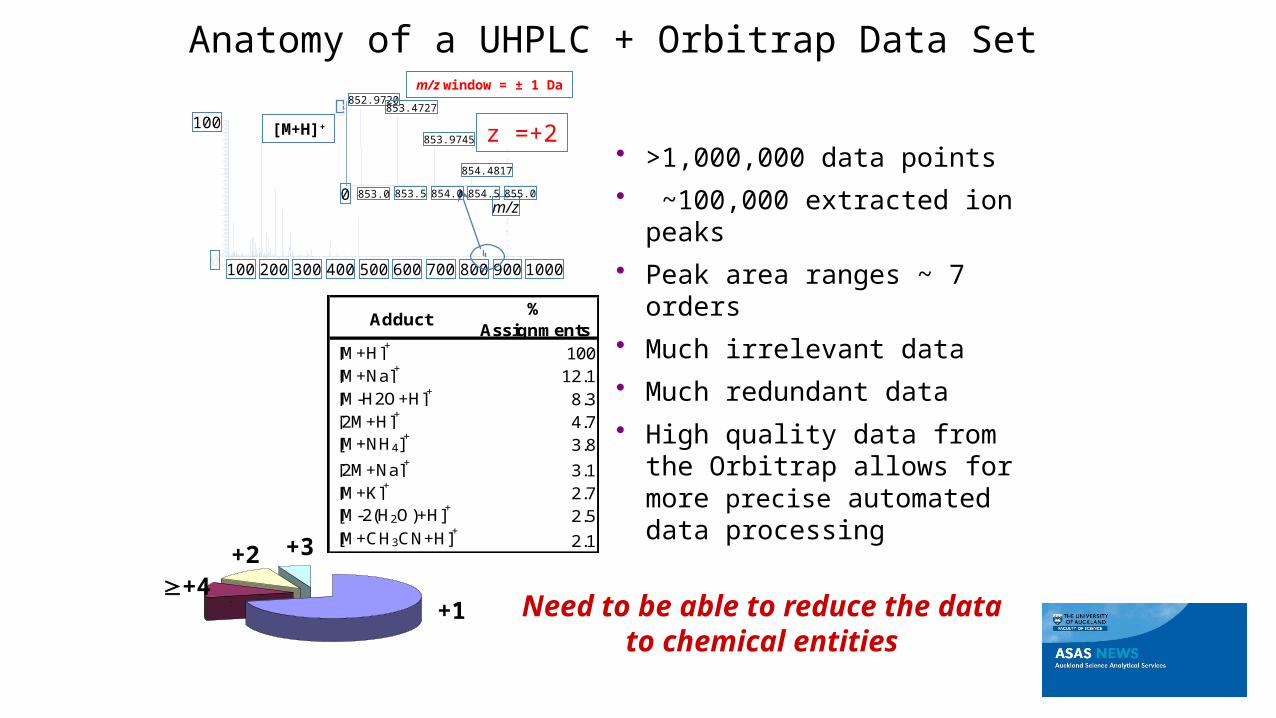
m/z window = ± 1 Da
100 200 300 400 500 600 700 800 90010000
100 [M+H]+
m/z853.0 853.5 854.0 854.5 855.00
852.9720853.4727
853.9745
854.4817
z =+25
• >1,000,000 data points• ~100,000 extracted ion
peaks• Peak area ranges ~ 7 orders• Much irrelevant data• Much redundant data• High quality data from the
Orbitrap allows for more precise automated data processing
Need to be able to reduce the data to chemical entities
Anatomy of a UHPLC + Orbitrap Data Set
Z=1(73%)Other
(5%)
Z=212%
Z=3(10%)
Adduct%
Assignments [M+H]+ 100 [M+Na]+ 12.1 [M-H2O+H]+ 8.3 [2M+H]+ 4.7 [M+NH4]
+3.8
[2M+Na]+ 3.1 [M+K]+ 2.7 [M-2(H2O)+H]+ 2.5 [M+CH3CN+H]+ 2.1
+1
+2 +3
+4

Software for Q Exactive• Xcalibur for data acquisition & initial processing
• SIEVE for handling large LC-MS data sets; differential analysis, trend evaluation; discovery
• ExactFinder for searching external data bases; unknown screening & routine targeted analysis
• MetWorks for metabolic samples; searches for biotransformations
• Mass Frontier for structural elucidation
• Proteome Discoverer for proteomics data; qualitative & quantitative
• ToxID for automated screening for known compounds

= Analyte signalsSample
~98% of lower intensity signals are eliminated
- Solvent blank
Chemical: Background Subtraction
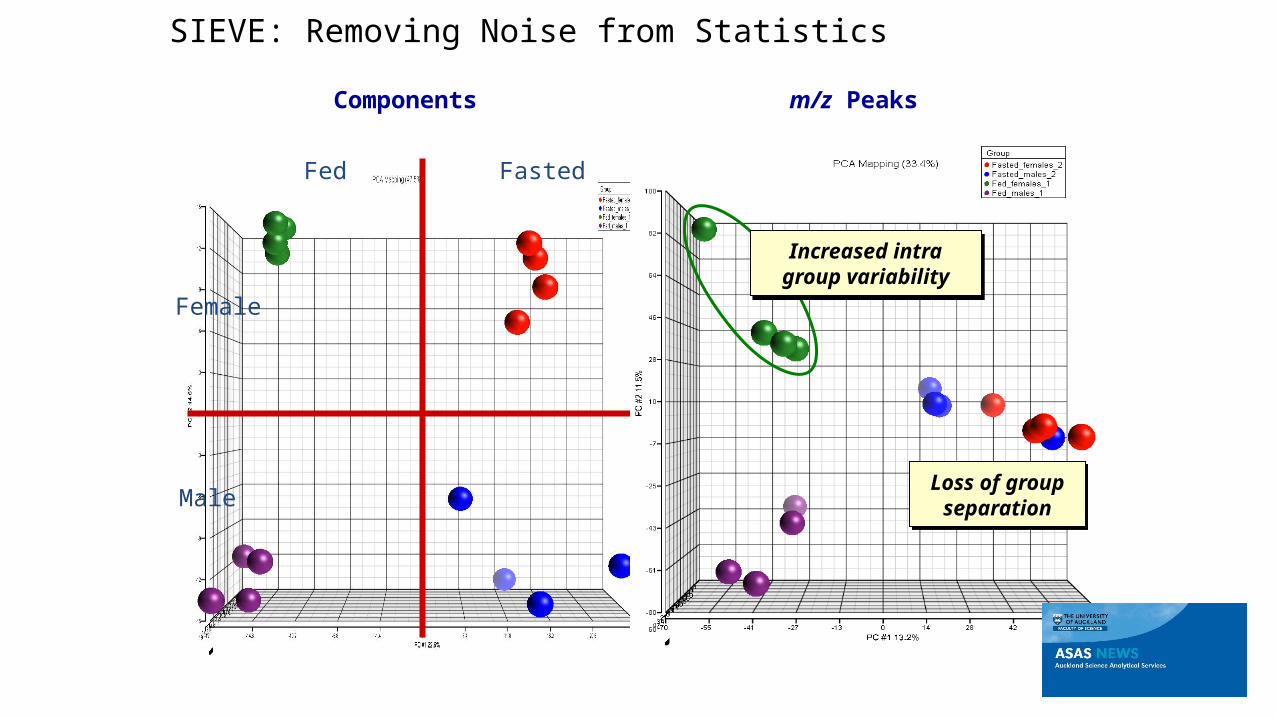
SIEVE: Removing Noise from Statistics
FastedFed
Female
Male
Components
Loss of group
separation
Loss of group
separation
m/z Peaks
Increased intra group variabilityIncreased intra
group variability
Q-Exactive
UHPLC – ultimate separation
TurboFlow - targeted analyses in bio matrices with little prep
Accurate mass, very stable, MS/MS
Margaret [email protected]