putting state pension costs in context - good jobs first
TRANSCRIPT
Ja n ua r y 2014
PUTTING STATE PENSION COSTS IN CONTEXT:
Good Jobs First | 1616 P Street NW, Suite 210 | Washington, DC 20036 | 202-232-1616 | www.goodjobsfirst.org
Public Pensions are under assault throughout the united states. led to believe that retirement costs for government workers are out of control, governors and legislators in numerous states have been moving to cut benefits, narrow eligibility requirements and push new hires into 401(k)-style defined-contribution plans instead of traditional and more secure defined-benefit coverage.
While it is true that numerous public pension systems are underfunded because of past decisions by policymakers and because the financial crisis harmed the value of pension-plan investments, that does not necessarily mean that the costs of benefits are excessive.
Good Jobs First seeks to put current pension costs (known as employer normal costs) into comparative context. Focusing on 10 states where the pension cost controversy has been intense, we compare those costs to the amount of revenue those states lose each year as the result of economic development subsidies offered to corporations as well as the tax preferences and accounting loopholes (including offshore tax havens) used by companies. While not providing an assessment of the effectiveness of any particular subsidy or provision at achieving targeted policy objectives, such as
creating family-wage jobs, this approach does provide an important perspective on public sector pensions.
We found that in all 10 states, the total annual cost of corporate subsidies, tax breaks and loopholes exceeds the total current annual pension costs for the main public pension plans administered by the states (see table below). in some cases the differences are enormous. in louisiana, subsidy and tax break/loophole costs are more than five times the current pension costs; in Florida they are about four times pension costs. in six of the ten states, pension costs are less than 50 percent of subsidy and loophole costs, and in another they are just barely above 50 percent.
in only one state do current pension costs come close to equaling subsidy and tax break/loophole costs. in arizona this is true not because pension costs are high but rather because the state tends to give out less in subsidies.
the state with the next highest ratio is illinois, where public pension costs are a red-hot issue. last month, Gov. Pat Quinn signed (behind closed doors) legislation that is supposed to shore up the state’s retirement system by reducing benefits and increasing state contributions. Yet even here, current pension costs are outweighed by the costs of corporate subsidies, tax breaks and loopholes.
HOW THEY COMPARE TO THE COST OF CORPORATE SUBSIDIES,
TAX BREAKS AND LOOPHOLES
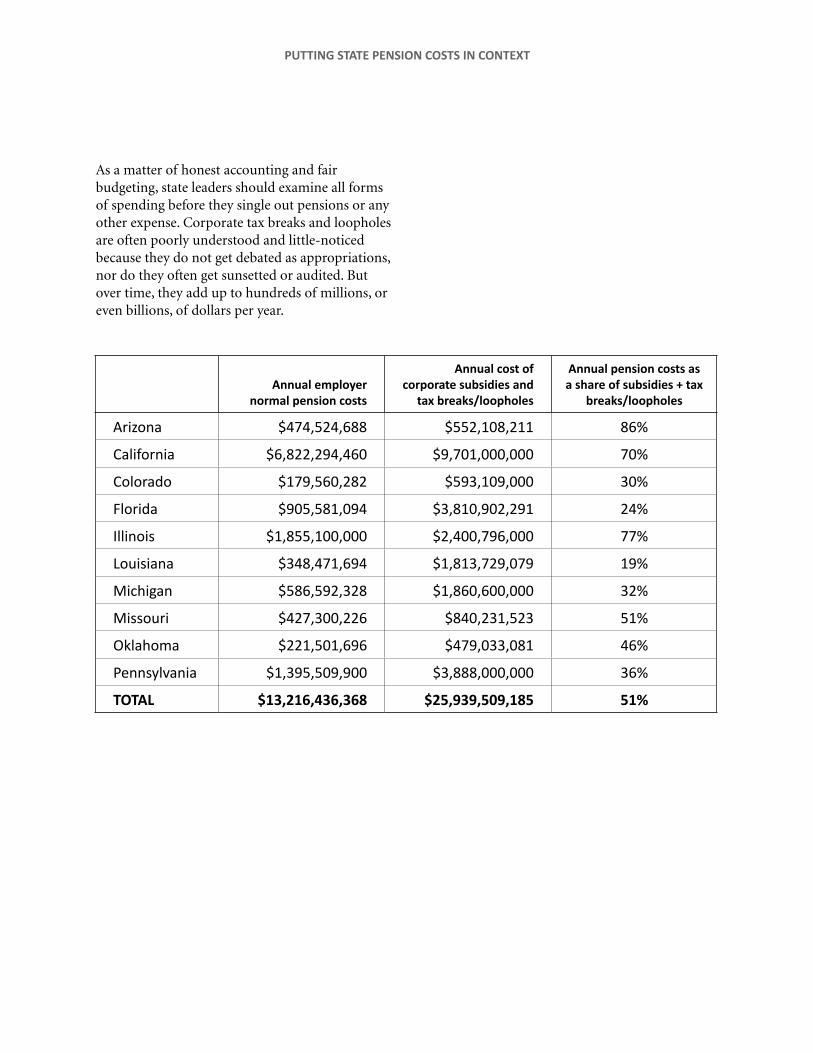
as a matter of honest accounting and fair budgeting, state leaders should examine all forms of spending before they single out pensions or any other expense. corporate tax breaks and loopholes are often poorly understood and little-noticed because they do not get debated as appropriations, nor do they often get sunsetted or audited. but over time, they add up to hundreds of millions, or even billions, of dollars per year.
PUTTING STATE PENSION COSTS IN CONTEXT
Annual employer
normal pension costs
Annual cost of corporate subsidies and
tax breaks/loopholes
Annual pension costs as a share of subsidies + tax
breaks/loopholes
arizona $474,524,688 $552,108,211 86%
California $6,822,294,460 $9,701,000,000 70%
Colorado $179,560,282 $593,109,000 30%
Florida $905,581,094 $3,810,902,291 24%
Illinois $1,855,100,000 $2,400,796,000 77%
Louisiana $348,471,694 $1,813,729,079 19%
Michigan $586,592,328 $1,860,600,000 32%
Missouri $427,300,226 $840,231,523 51%
Oklahoma $221,501,696 $479,033,081 46%
Pennsylvania $1,395,509,900 $3,888,000,000 36%
TOTAL $13,216,436,368 $25,939,509,185 51%
Ja n ua r y 2014
PUTTING STATE PENSION COSTS IN CONTEXT:
ARIZONA
Good Jobs First | 1616 P Street NW, Suite 210 | Washington, DC 20036 | 202-232-1616 | www.goodjobsfirst.org
Public Pension costs have been a contentious issue in arizona over the past year. a series in the Arizona Republic last May gave the impression that those costs were out of control.1 in July, the conservative Goldwater institute published a report stating that “arizona’s pension systems remain dead men walking.”2
While many numbers are bandied about, the central issue is how much of an obligation is being taken on each year to provide benefits for current government employees such as teachers and first responders. the best way to measure this is to use an amount known as employer normal cost. such costs can be found in the annual financial reports that each public pension plan has to produce. in the case of arizona, there are two main plans administered by the state: the arizona state Retirement system (asRs) and the Public safety Personnel Retirement system (PsPRs). the most recent financial reports indicate annual employer normal costs of $295.8 million for asRs and $178.7 million for PsPRs, or a total of $474.5 million.3
how should this amount be viewed? one approach is to compare it to the financial costs incurred by the state in supporting business through economic development subsidies and other special tax provisions. While not providing an assessment of the effectiveness of any particular subsidy or provision at achieving targeted policy objectives, such as creating family-wage jobs, this approach does provide an important perspective on public sector pensions.
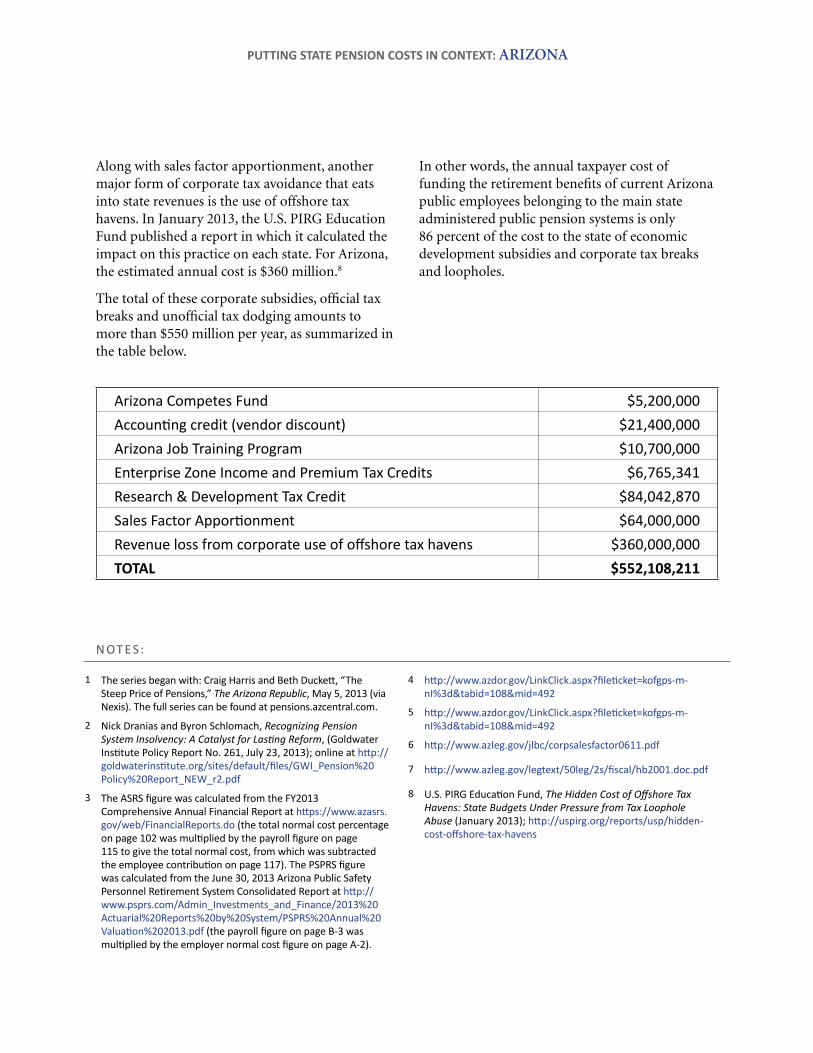
as for subsidies, arizona is not one of the biggest giveaway states, having eliminated programs such as enterprise zones. among the biggest costs is the research & development tax credit, which in the most recent fiscal year cost the state more than $84 million.4 to this can be added the cost of an archaic tax rule that allows retailers to keep a total of about $21 million of the sales tax revenues they collect.5
these subsidies and business tax breaks amount to about $100 million a year, but they don’t tell the whole story. arizona is one of the states that have responded to pressure from business lobbyists by adjusting the way in which corporations can apportion their taxable income to the state. the main push came from capital-intensive manufacturing companies such as intel serving national markets, which prefer to pay taxes based only on their sales in the state rather than the traditional formula based on payroll and property as well as sales. arizona began adjusting the formula in 2001, allowing companies to rely more and more on sales. by 2009 companies could opt for an 80 percent sales factor apportionment. a 2011 report by the Joint legislative budget committee estimated that this cost the state $63.6 million in revenue in 2008.6 the committee has issued no subsequent comprehensive cost estimates, but it has calculated that additional enacted increases in the sales factor apportionment (which will reach 100 percent in 2017) will cost another $24.6 million in FY2015, rising to $84 million in FY2018.7
n OT E S:
along with sales factor apportionment, another major form of corporate tax avoidance that eats into state revenues is the use of offshore tax havens. in January 2013, the u.s. PiRG education Fund published a report in which it calculated the impact on this practice on each state. For arizona, the estimated annual cost is $360 million.8
the total of these corporate subsidies, official tax breaks and unofficial tax dodging amounts to more than $550 million per year, as summarized in the table below.
in other words, the annual taxpayer cost of funding the retirement benefits of current arizona public employees belonging to the main state administered public pension systems is only 86 percent of the cost to the state of economic development subsidies and corporate tax breaks and loopholes.
arizona Competes Fund $5,200,000Accounting credit (vendor discount) $21,400,000arizona Job Training Program $10,700,000Enterprise Zone Income and Premium Tax Credits $6,765,341Research & Development Tax Credit $84,042,870Sales Factor Apportionment $64,000,000Revenue loss from corporate use of offshore tax havens $360,000,000TOTAL $552,108,211
1 The series began with: Craig Harris and Beth Duckett, “The Steep Price of Pensions,” The Arizona Republic, May 5, 2013 (via Nexis). The full series can be found at pensions.azcentral.com.
2 Nick Dranias and Byron Schlomach, Recognizing Pension System Insolvency: A Catalyst for Lasting Reform, (Goldwater Institute Policy Report No. 261, July 23, 2013); online at http://goldwaterinstitute.org/sites/default/files/GWI_Pension%20Policy%20Report_NEW_r2.pdf
3 The ASRS figure was calculated from the FY2013 Comprehensive Annual Financial Report at https://www.azasrs.gov/web/FinancialReports.do (the total normal cost percentage on page 102 was multiplied by the payroll figure on page 115 to give the total normal cost, from which was subtracted the employee contribution on page 117). The PSPRS figure was calculated from the June 30, 2013 Arizona Public Safety Personnel Retirement System Consolidated Report at http://www.psprs.com/Admin_Investments_and_Finance/2013%20Actuarial%20Reports%20by%20System/PSPRS%20Annual%20Valuation%202013.pdf (the payroll figure on page B-3 was multiplied by the employer normal cost figure on page A-2).
4 http://www.azdor.gov/LinkClick.aspx?fileticket=kofgps-m-nI%3d&tabid=108&mid=492
5 http://www.azdor.gov/LinkClick.aspx?fileticket=kofgps-m-nI%3d&tabid=108&mid=492
6 http://www.azleg.gov/jlbc/corpsalesfactor0611.pdf
7 http://www.azleg.gov/legtext/50leg/2s/fiscal/hb2001.doc.pdf
8 U.S. PIRG Education Fund, The Hidden Cost of Offshore Tax Havens: State Budgets Under Pressure from Tax Loophole Abuse (January 2013); http://uspirg.org/reports/usp/hidden-cost-offshore-tax-havens
PUTTING STATE PENSION COSTS IN CONTEXT: ARIZONA
Ja n ua r y 2014
PUTTING STATE PENSION COSTS IN CONTEXT:
california
Good Jobs First | 1616 P Street NW, Suite 210 | Washington, DC 20036 | 202-232-1616 | www.goodjobsfirst.org
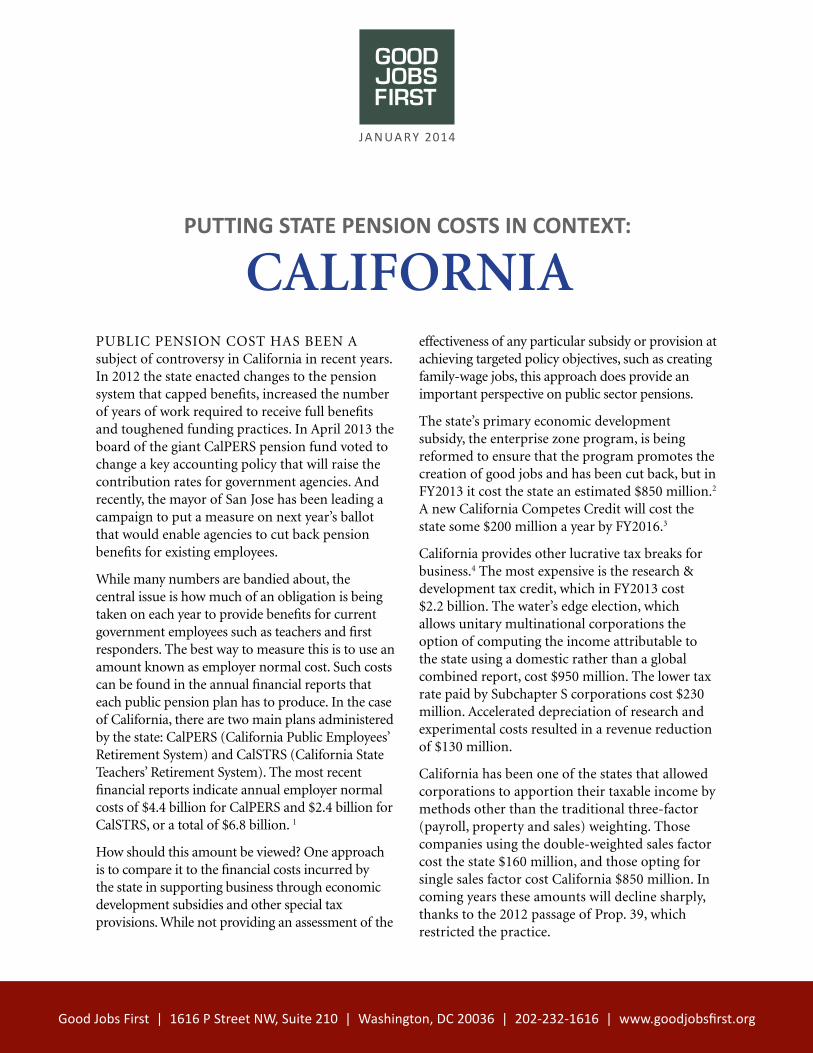
Public Pension cost has been a subject of controversy in california in recent years. in 2012 the state enacted changes to the pension system that capped benefits, increased the number of years of work required to receive full benefits and toughened funding practices. in april 2013 the board of the giant calPeRs pension fund voted to change a key accounting policy that will raise the contribution rates for government agencies. and recently, the mayor of san Jose has been leading a campaign to put a measure on next year’s ballot that would enable agencies to cut back pension benefits for existing employees.
While many numbers are bandied about, the central issue is how much of an obligation is being taken on each year to provide benefits for current government employees such as teachers and first responders. the best way to measure this is to use an amount known as employer normal cost. such costs can be found in the annual financial reports that each public pension plan has to produce. in the case of california, there are two main plans administered by the state: calPeRs (california Public employees’ Retirement system) and calstRs (california state teachers’ Retirement system). the most recent financial reports indicate annual employer normal costs of $4.4 billion for calPeRs and $2.4 billion for calstRs, or a total of $6.8 billion. 1
how should this amount be viewed? one approach is to compare it to the financial costs incurred by the state in supporting business through economic development subsidies and other special tax provisions. While not providing an assessment of the
effectiveness of any particular subsidy or provision at achieving targeted policy objectives, such as creating family-wage jobs, this approach does provide an important perspective on public sector pensions.
the state’s primary economic development subsidy, the enterprise zone program, is being reformed to ensure that the program promotes the creation of good jobs and has been cut back, but in FY2013 it cost the state an estimated $850 million.2 a new california competes credit will cost the state some $200 million a year by FY2016.3
california provides other lucrative tax breaks for business.4 the most expensive is the research & development tax credit, which in FY2013 cost $2.2 billion. the water’s edge election, which allows unitary multinational corporations the option of computing the income attributable to the state using a domestic rather than a global combined report, cost $950 million. the lower tax rate paid by subchapter s corporations cost $230 million. accelerated depreciation of research and experimental costs resulted in a revenue reduction of $130 million.
california has been one of the states that allowed corporations to apportion their taxable income by methods other than the traditional three-factor (payroll, property and sales) weighting. those companies using the double-weighted sales factor cost the state $160 million, and those opting for single sales factor cost california $850 million. in coming years these amounts will decline sharply, thanks to the 2012 passage of Prop. 39, which restricted the practice.
n OT E S:
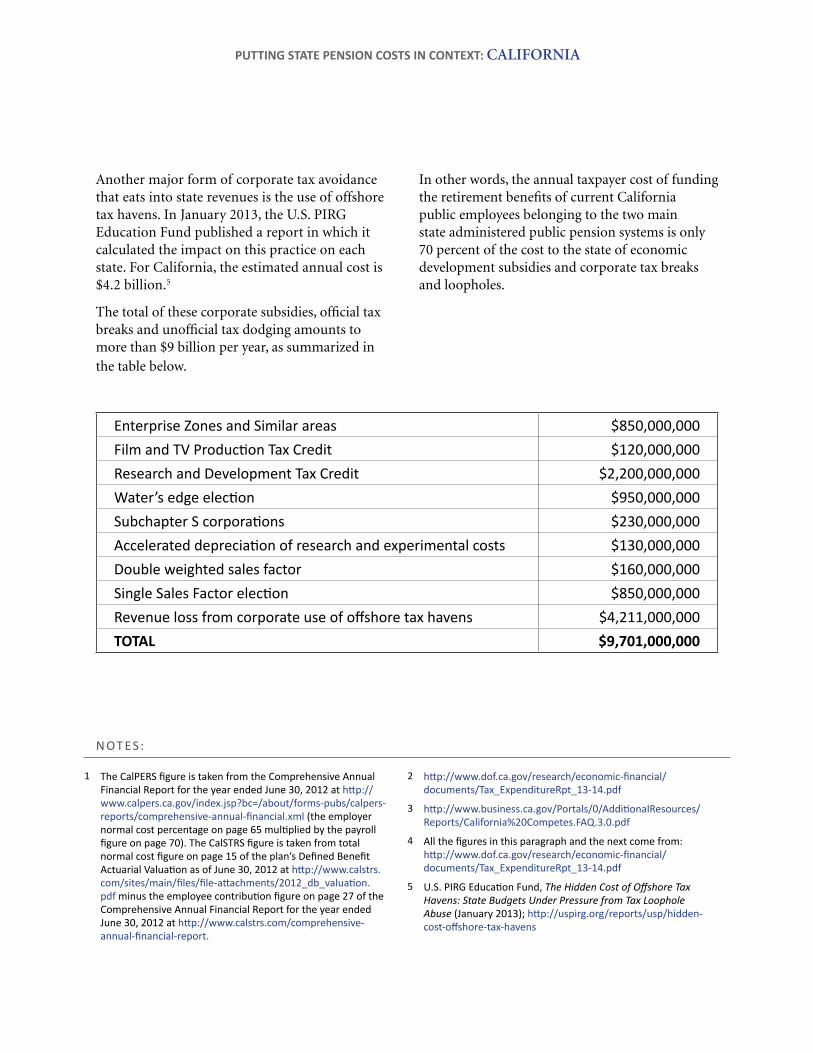
another major form of corporate tax avoidance that eats into state revenues is the use of offshore tax havens. in January 2013, the u.s. PiRG education Fund published a report in which it calculated the impact on this practice on each state. For california, the estimated annual cost is $4.2 billion.5
the total of these corporate subsidies, official tax breaks and unofficial tax dodging amounts to more than $9 billion per year, as summarized in the table below.
in other words, the annual taxpayer cost of funding the retirement benefits of current california public employees belonging to the two main state administered public pension systems is only 70 percent of the cost to the state of economic development subsidies and corporate tax breaks and loopholes.
1 The CalPERS figure is taken from the Comprehensive Annual Financial Report for the year ended June 30, 2012 at http://www.calpers.ca.gov/index.jsp?bc=/about/forms-pubs/calpers-reports/comprehensive-annual-financial.xml (the employer normal cost percentage on page 65 multiplied by the payroll figure on page 70). The CalSTRS figure is taken from total normal cost figure on page 15 of the plan’s Defined Benefit Actuarial Valuation as of June 30, 2012 at http://www.calstrs.com/sites/main/files/file-attachments/2012_db_valuation.pdf minus the employee contribution figure on page 27 of the Comprehensive Annual Financial Report for the year ended June 30, 2012 at http://www.calstrs.com/comprehensive-annual-financial-report.
2 http://www.dof.ca.gov/research/economic-financial/documents/Tax_ExpenditureRpt_13-14.pdf
3 http://www.business.ca.gov/Portals/0/AdditionalResources/Reports/California%20Competes.FAQ.3.0.pdf
4 All the figures in this paragraph and the next come from: http://www.dof.ca.gov/research/economic-financial/documents/Tax_ExpenditureRpt_13-14.pdf
5 U.S. PIRG Education Fund, The Hidden Cost of Offshore Tax Havens: State Budgets Under Pressure from Tax Loophole Abuse (January 2013); http://uspirg.org/reports/usp/hidden-cost-offshore-tax-havens
PUTTING STATE PENSION COSTS IN CONTEXT: california
Enterprise Zones and Similar areas $850,000,000Film and TV Production Tax Credit $120,000,000Research and Development Tax Credit $2,200,000,000Water’s edge election $950,000,000Subchapter S corporations $230,000,000Accelerated depreciation of research and experimental costs $130,000,000Double weighted sales factor $160,000,000Single Sales Factor election $850,000,000Revenue loss from corporate use of offshore tax havens $4,211,000,000 TOTAL $9,701,000,000
Ja n ua r y 2014
PUTTING STATE PENSION COSTS IN CONTEXT:
colorado
Good Jobs First | 1616 P Street NW, Suite 210 | Washington, DC 20036 | 202-232-1616 | www.goodjobsfirst.org
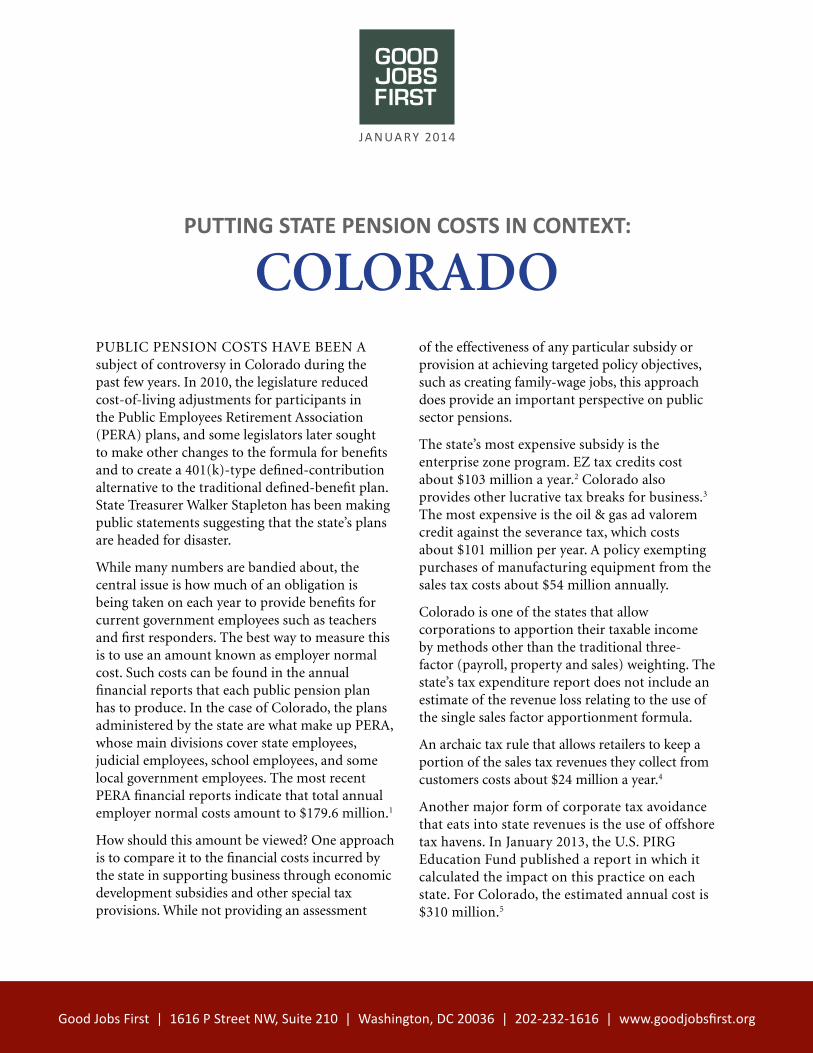
Public Pension costs have been a subject of controversy in colorado during the past few years. in 2010, the legislature reduced cost-of-living adjustments for participants in the Public employees Retirement association (PeRa) plans, and some legislators later sought to make other changes to the formula for benefits and to create a 401(k)-type defined-contribution alternative to the traditional defined-benefit plan. state treasurer Walker stapleton has been making public statements suggesting that the state’s plans are headed for disaster.
While many numbers are bandied about, the central issue is how much of an obligation is being taken on each year to provide benefits for current government employees such as teachers and first responders. the best way to measure this is to use an amount known as employer normal cost. such costs can be found in the annual financial reports that each public pension plan has to produce. in the case of colorado, the plans administered by the state are what make up PeRa, whose main divisions cover state employees, judicial employees, school employees, and some local government employees. the most recent PeRa financial reports indicate that total annual employer normal costs amount to $179.6 million.1
how should this amount be viewed? one approach is to compare it to the financial costs incurred by the state in supporting business through economic development subsidies and other special tax provisions. While not providing an assessment
of the effectiveness of any particular subsidy or provision at achieving targeted policy objectives, such as creating family-wage jobs, this approach does provide an important perspective on public sector pensions.
the state’s most expensive subsidy is the enterprise zone program. eZ tax credits cost about $103 million a year.2 colorado also provides other lucrative tax breaks for business.3 the most expensive is the oil & gas ad valorem credit against the severance tax, which costs about $101 million per year. a policy exempting purchases of manufacturing equipment from the sales tax costs about $54 million annually.
colorado is one of the states that allow corporations to apportion their taxable income by methods other than the traditional three-factor (payroll, property and sales) weighting. the state’s tax expenditure report does not include an estimate of the revenue loss relating to the use of the single sales factor apportionment formula.
an archaic tax rule that allows retailers to keep a portion of the sales tax revenues they collect from customers costs about $24 million a year.4
another major form of corporate tax avoidance that eats into state revenues is the use of offshore tax havens. in January 2013, the u.s. PiRG education Fund published a report in which it calculated the impact on this practice on each state. For colorado, the estimated annual cost is $310 million.5
n OT E S:
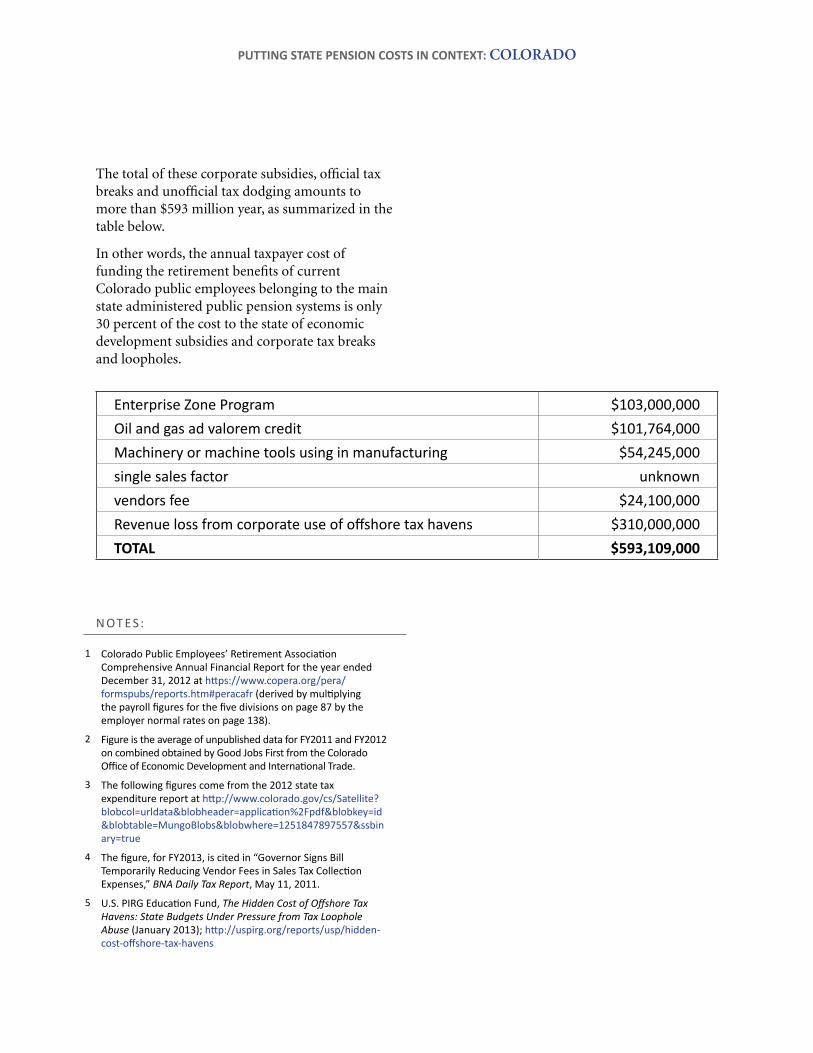
the total of these corporate subsidies, official tax breaks and unofficial tax dodging amounts to more than $593 million year, as summarized in the table below.
in other words, the annual taxpayer cost of funding the retirement benefits of current colorado public employees belonging to the main state administered public pension systems is only 30 percent of the cost to the state of economic development subsidies and corporate tax breaks and loopholes.
1 Colorado Public Employees’ Retirement Association Comprehensive annual Financial report for the year ended December 31, 2012 at https://www.copera.org/pera/formspubs/reports.htm#peracafr (derived by multiplying the payroll figures for the five divisions on page 87 by the employer normal rates on page 138).
2 Figure is the average of unpublished data for Fy2011 and Fy2012 on combined obtained by Good Jobs First from the Colorado Office of Economic Development and International Trade.
3 The following figures come from the 2012 state tax expenditure report at http://www.colorado.gov/cs/Satellite?blobcol=urldata&blobheader=application%2Fpdf&blobkey=id&blobtable=MungoBlobs&blobwhere=1251847897557&ssbinary=true
4 The figure, for FY2013, is cited in “Governor Signs Bill Temporarily Reducing Vendor Fees in Sales Tax Collection Expenses,” BNA Daily Tax Report, May 11, 2011.
5 U.S. PIRG Education Fund, The Hidden Cost of Offshore Tax Havens: State Budgets Under Pressure from Tax Loophole Abuse (January 2013); http://uspirg.org/reports/usp/hidden-cost-offshore-tax-havens
PUTTING STATE PENSION COSTS IN CONTEXT: colorado
Enterprise Zone Program $103,000,000Oil and gas ad valorem credit $101,764,000Machinery or machine tools using in manufacturing $54,245,000single sales factor unknownvendors fee $24,100,000Revenue loss from corporate use of offshore tax havens $310,000,000 TOTAL $593,109,000
Ja n ua r y 2014
PUTTING STATE PENSION COSTS IN CONTEXT:
FLORIDA
Good Jobs First | 1616 P Street NW, Suite 210 | Washington, DC 20036 | 202-232-1616 | www.goodjobsfirst.org
Public Pension costs have been a contentious issue in Florida in recent years. last year, there was an effort in the state legislature to force new government employees into a 401(k)-style defined-contribution plan instead of the more secure defined-benefit coverage that current employees receive. Proponents of the shift to defined contributions say they will resume their campaign this year.
While many numbers are bandied about, the central issue is how much of an obligation is being taken on each year to provide benefits for current government employees such as teachers and first responders. the best way to measure this is to use an amount known as employer normal cost. such costs can be found in the annual financial reports that each public pension plan has to produce. in the case of Florida, that means the Florida Retirement system. its most recent report indicates total employer normal costs of about $905.6 million a year.1
how should this amount be viewed? one approach is to compare it to the financial costs incurred by the state in supporting business through economic development subsidies and other special tax provisions. While not providing an assessment of the effectiveness of any particular subsidy or provision at achieving targeted policy objectives, such as creating family-wage jobs, this approach does provide an important perspective on public sector pensions.
Florida has been willing to spend large amounts to promote private-sector development. in the 2000s the state approved a series of huge giveaways for biotech research, including $545 million to the scripps Research institute and $233 million to the burnham institute for Medical Research.2 last year, hertz got an $84 million state-local package in connection with the relocation of its headquarters from new Jersey to lee county.3
in addition to these special deals, Florida has programs that give away tens of millions of dollars each year to numerous companies in the name of job creation. the most expensive of these subsidies is the Qualified target industry tax Refund, which in FY2012 cost $58 million.4 the Quick action closing Fund costs about $28 million, the economic Development transportation Fund $14 million and the enterprise Zone program $10 million.
Florida provides other lucrative tax breaks for business. Preferences relating to the corporate income and emergency excise tax alone cost more than $1.3 billion a year.5 Preferences relating to the premium tax paid by insurance companies cost $783 million. an archaic tax rule that allows retailers to keep a portion of the sales tax revenues they collect from customers costs about $60 million a year.6 in 2011 the legislature enacted a law at the urging of the giant restaurant company Darden (owner of Red lobster, olive Garden and other chains) that will allow it to apply unused corporate income tax credits against its sales tax liabilities, though only after 20 years.7
n OT E S:
another way Florida loses corporate income tax revenue is through its failure to adopt a reform known as combined reporting, which is designed to make it more difficult for large companies to export a substantial portion of their Florida profits to passive investment companies in Delaware or nevada, thereby shielding that income from taxation. Florida’s tax expenditure report estimates that the adoption of combined reporting would increase annual revenue by about $486 million.8
another major form of corporate tax avoidance that eats into state revenues is the use of offshore tax havens. in January 2013, the u.s. PiRG
education Fund published a report in which it calculated the impact on this practice on each state. For Florida the estimated cost was $979 million.9
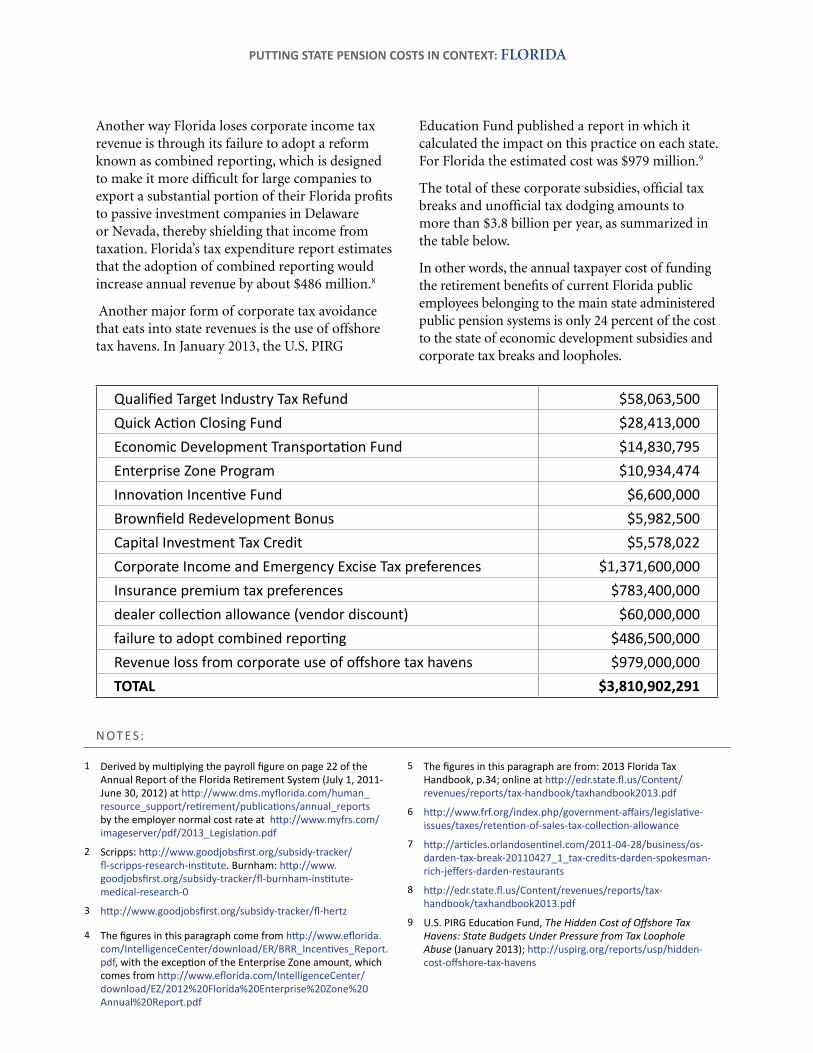
the total of these corporate subsidies, official tax breaks and unofficial tax dodging amounts to more than $3.8 billion per year, as summarized in the table below.
in other words, the annual taxpayer cost of funding the retirement benefits of current Florida public employees belonging to the main state administered public pension systems is only 24 percent of the cost to the state of economic development subsidies and corporate tax breaks and loopholes.
1 Derived by multiplying the payroll figure on page 22 of the Annual Report of the Florida Retirement System (July 1, 2011-June 30, 2012) at http://www.dms.myflorida.com/human_resource_support/retirement/publications/annual_reports by the employer normal cost rate at http://www.myfrs.com/imageserver/pdf/2013_Legislation.pdf
2 Scripps: http://www.goodjobsfirst.org/subsidy-tracker/fl-scripps-research-institute. Burnham: http://www.goodjobsfirst.org/subsidy-tracker/fl-burnham-institute-medical-research-0
3 http://www.goodjobsfirst.org/subsidy-tracker/fl-hertz
4 The figures in this paragraph come from http://www.eflorida.com/IntelligenceCenter/download/ER/BRR_Incentives_Report.pdf, with the exception of the Enterprise Zone amount, which comes from http://www.eflorida.com/IntelligenceCenter/download/EZ/2012%20Florida%20Enterprise%20Zone%20Annual%20Report.pdf
5 The figures in this paragraph are from: 2013 Florida Tax Handbook, p.34; online at http://edr.state.fl.us/Content/revenues/reports/tax-handbook/taxhandbook2013.pdf
6 http://www.frf.org/index.php/government-affairs/legislative-issues/taxes/retention-of-sales-tax-collection-allowance
7 http://articles.orlandosentinel.com/2011-04-28/business/os-darden-tax-break-20110427_1_tax-credits-darden-spokesman-rich-jeffers-darden-restaurants
8 http://edr.state.fl.us/Content/revenues/reports/tax-handbook/taxhandbook2013.pdf
9 U.S. PIRG Education Fund, The Hidden Cost of Offshore Tax Havens: State Budgets Under Pressure from Tax Loophole Abuse (January 2013); http://uspirg.org/reports/usp/hidden-cost-offshore-tax-havens
PUTTING STATE PENSION COSTS IN CONTEXT: FLORIDA
Qualified Target Industry Tax Refund $58,063,500Quick Action Closing Fund $28,413,000Economic Development Transportation Fund $14,830,795Enterprise Zone Program $10,934,474Innovation Incentive Fund $6,600,000Brownfield Redevelopment Bonus $5,982,500Capital Investment Tax Credit $5,578,022Corporate Income and Emergency Excise Tax preferences $1,371,600,000Insurance premium tax preferences $783,400,000dealer collection allowance (vendor discount) $60,000,000failure to adopt combined reporting $486,500,000Revenue loss from corporate use of offshore tax havens $979,000,000TOTAL $3,810,902,291
Ja n ua r y 2014
PUTTING STATE PENSION COSTS IN CONTEXT:
illinois
Good Jobs First | 1616 P Street NW, Suite 210 | Washington, DC 20036 | 202-232-1616 | www.goodjobsfirst.org
Public Pensions have been a red-hot issue in illinois in recent months. in december, Gov. Pat Quinn signed (behind closed doors) legislation that is supposed to shore up the state’s retirement system by reducing benefits and increasing state contributions. a labor coalition called We are one illinois labeled the legislation “pension theft” and vowed to fight it in court.1
While many numbers are bandied about, the central issue is how much of an obligation is being taken on each year to provide benefits for current government employees such as teachers and first responders. the best way to measure this is to use an amount known as employer normal cost. such costs can be found in the annual financial reports that each public pension plan has to produce. in the case of illinois there are three main plans administered by the state: the state employees’ retirement system of illinois (sers), the teachers’ retirement system of the state of illinois (trs), and the state universities retirement system of illinois (surs). the most recent financial reports indicate annual employer normal costs of $569.8 million for sers2; $842.5 million for trs3; and $442.8 million for surs.4 the total is about $1.85 billion.
how should this amount be viewed? one approach is to compare it to the financial costs incurred by the state in supporting business through economic development subsidies and other special tax provisions. While not providing an assessment of the effectiveness of any particular subsidy or provision at achieving targeted policy objectives, such as creating family-wage jobs, this approach does provide an important perspective on public sector pensions.
subsidies have been another controversial issue in the state. some of the biggest giveaways came in 2011, when sears got a $275 million state-local package and Motorola Mobility (now owned by Google) got $117 million.5 house speaker Michael Madigan recently called on the legislature to “resist the temptation to cave in to corporate officials’ demands every time they impose a deadline for payment in exchange for remaining in illinois.”6
these deals are the most visible part of a system in which the state gives away tens of millions of dollars each year in corporate tax credits in the name of job creation.7 the most visible program is the economic development in a Growing economy (or edGe) tax credit, which is derived partly from the state personal income taxes paid by workers and costs about $31 million a year. tax credits for film production cost about $11 million, and the enterprise zone investment credit costs $7 million.
illinois provides other lucrative tax breaks for business. the most expensive is the exemption for Manufacturing and assembling Machinery and equipment, which costs $183 million a year. an electricity excise tax for enterprise zones costs $39 million, and the Manufacturers’ Purchase credit against the sale tax costs $37 million. the two Million dollar cap on the Franchise tax for corporations results in a revenue loss of $18 million, while the research & development tax credit costs $10 million. an archaic tax rule that allows retailers to keep a portion of the sales tax revenues they collect from customers costs illinois about $121 million a year, more than in any other state.
n OT E S:
illinois is one of the states that allow corporations to apportion their taxable income by methods other than the traditional three-factor (payroll, property and sales) weighting. about a decade ago, the cost of the single sales factor policy to the state was estimated at $63 million a year.8 the state’s tax expenditure report does not include updated estimates.
another major form of corporate tax avoidance that eats into state revenues is the use of offshore tax havens. in January 2013 the u.s. PirG education Fund published a report in which it calculated the impact of this practice on each state. For illinois, the estimated annual cost is $1.9 billion.9
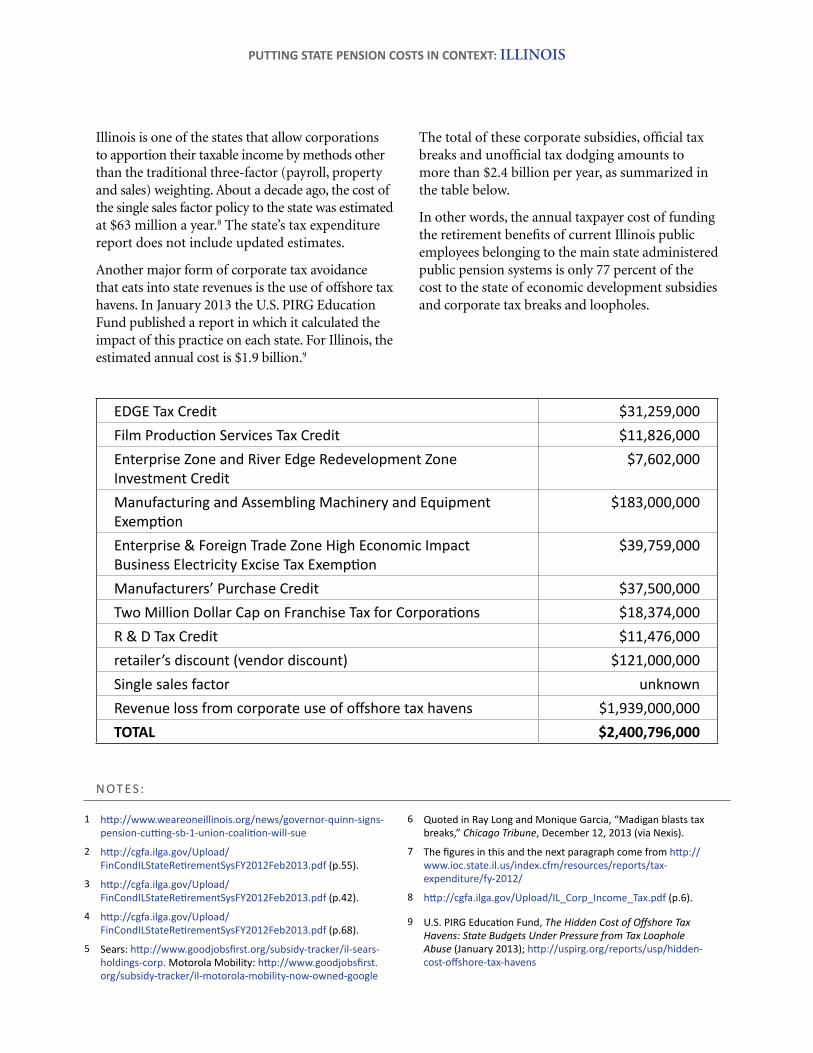
the total of these corporate subsidies, official tax breaks and unofficial tax dodging amounts to more than $2.4 billion per year, as summarized in the table below.
in other words, the annual taxpayer cost of funding the retirement benefits of current illinois public employees belonging to the main state administered public pension systems is only 77 percent of the cost to the state of economic development subsidies and corporate tax breaks and loopholes.
1 http://www.weareoneillinois.org/news/governor-quinn-signs-pension-cutting-sb-1-union-coalition-will-sue
2 http://cgfa.ilga.gov/Upload/FinCondILStateRetirementSysFY2012Feb2013.pdf (p.55).
3 http://cgfa.ilga.gov/Upload/FinCondILStateRetirementSysFY2012Feb2013.pdf (p.42).
4 http://cgfa.ilga.gov/Upload/FinCondILStateRetirementSysFY2012Feb2013.pdf (p.68).
5 Sears: http://www.goodjobsfirst.org/subsidy-tracker/il-sears-holdings-corp. Motorola Mobility: http://www.goodjobsfirst.org/subsidy-tracker/il-motorola-mobility-now-owned-google
6 Quoted in Ray Long and Monique Garcia, “Madigan blasts tax breaks,” Chicago Tribune, December 12, 2013 (via Nexis).
7 The figures in this and the next paragraph come from http://www.ioc.state.il.us/index.cfm/resources/reports/tax-expenditure/fy-2012/
8 http://cgfa.ilga.gov/Upload/IL_Corp_Income_Tax.pdf (p.6).
9 U.S. PIRG Education Fund, The Hidden Cost of Offshore Tax Havens: State Budgets Under Pressure from Tax Loophole Abuse (January 2013); http://uspirg.org/reports/usp/hidden-cost-offshore-tax-havens
PUTTING STATE PENSION COSTS IN CONTEXT: illinois
EDGE Tax Credit $31,259,000Film Production Services Tax Credit $11,826,000Enterprise Zone and River Edge Redevelopment Zone Investment Credit
$7,602,000
Manufacturing and Assembling Machinery and Equipment Exemption
$183,000,000
Enterprise & Foreign Trade Zone High Economic Impact Business Electricity Excise Tax Exemption
$39,759,000
Manufacturers’ Purchase Credit $37,500,000Two Million Dollar Cap on Franchise Tax for Corporations $18,374,000R & D Tax Credit $11,476,000retailer’s discount (vendor discount) $121,000,000Single sales factor unknownRevenue loss from corporate use of offshore tax havens $1,939,000,000TOTAL $2,400,796,000
Ja n ua r y 2014
PUTTING STATE PENSION COSTS IN CONTEXT:
Louisiana
Good Jobs First | 1616 P Street NW, Suite 210 | Washington, DC 20036 | 202-232-1616 | www.goodjobsfirst.org
Public Pensions have been in the spotlight in louisiana during the past few years. in 2012 Gov. bobby Jindal, who had described the state’s retirement system as “inefficient, expensive and outdated,” signed legislation providing that new state employees would be put in a cash balance plan instead of the traditional defined-benefit coverage existing employees enjoy.1 the move was challenged as a violation of a provision in the state constitution requiring a two-thirds vote of the legislature on certain pension changes. that argument was upheld by the louisiana supreme court.2 Jindal and other proponents of the cash balance approach plan to try again.
While many pension numbers are bandied about, the central issue is how much of an obligation is being taken on each year to provide benefits for current government employees such as teachers and first responders. the best way to measure this is to use an amount known as employer normal cost. such costs can be found in the annual financial reports that each public pension plan has to produce. in the case of louisiana there are two main plans administered by the state: the louisiana state employees’ Retirement system (laseRs) and the teachers’ Retirement system of louisiana (tRsl). the most recent financial reports indicate annual employer normal costs of $132.3 million for laseRs.3 For tRsl the figure is $216.1 million.4 the total is thus $348.4 million.
how should this amount be viewed? one approach is to compare it to the financial costs incurred by the state in supporting business through economic development subsidies and other special tax provisions. While not providing an assessment of the effectiveness of any particular subsidy or provision at
achieving targeted policy objectives, such as creating family-wage jobs, this approach does provide an important perspective on public sector pensions.
louisiana has a reputation of awarding large subsidy packages to corporations. in the Megadeals report Good Jobs First published in June 2013, we identified 11 deals in the state worth $75 million or more, or a total of $3.1 billion.5 among these were a $1.7 billion package for cheniere energy’s natural gas liquefaction plant in 20106; $257 million for sasol’s natural gas complex in 20137; and $255 million for a nucor steel mill in 2010.8
these individual deals are the most visible part of a system in which the state gives away hundreds of millions of dollars each year in corporate subsidies in the name of job creation. louisiana’s most expensive subsidy is the Motion Picture investor tax credit, which costs more than $227 million a year.9
the other main programs are the industrial tax exemptions, which cost about $97 million per year10 and enterprise Zones, which cost $67 million.11 an archaic tax rule that allows retailers to keep a portion of the sales tax revenues they collect from customers costs louisiana about $28 million a year.
louisiana provides other lucrative tax breaks for business.12 For example, preferential treatment of subchapter s corporations costs the state $473 million in corporate tax revenue each year. and insurance company Premium tax credits cost $296 million. the Research & Development tax credit costs $41 million.
louisiana is one of the states that allow corporations to apportion their taxable income by methods other than the traditional three-factor
n OT E S:
(payroll, property and sales) weighting. the state’s tax expenditure report does not estimate the revenue loss from the use of single sales factor.
another way louisiana loses corporate income tax revenue is through its failure to adopt a reform known as combined reporting, which is designed to make it more difficult for large companies to export a substantial portion of their louisiana profits to passive investment companies in states such as Delaware or nevada, thereby shielding a substantial portion of their louisiana income from any taxation. the state’s tax expenditure report also fails to estimate the revenue cost resulting from this policy, but the louisiana budget Project has put it at up to $61 million a year.13
Yet another major form of corporate tax avoidance that eats into state revenues is the use of offshore tax havens. in January 2013 the u.s. PiRG education Fund published a report in which it calculated the impact on this practice on each state. For louisiana the estimated annual cost is $489 million.14
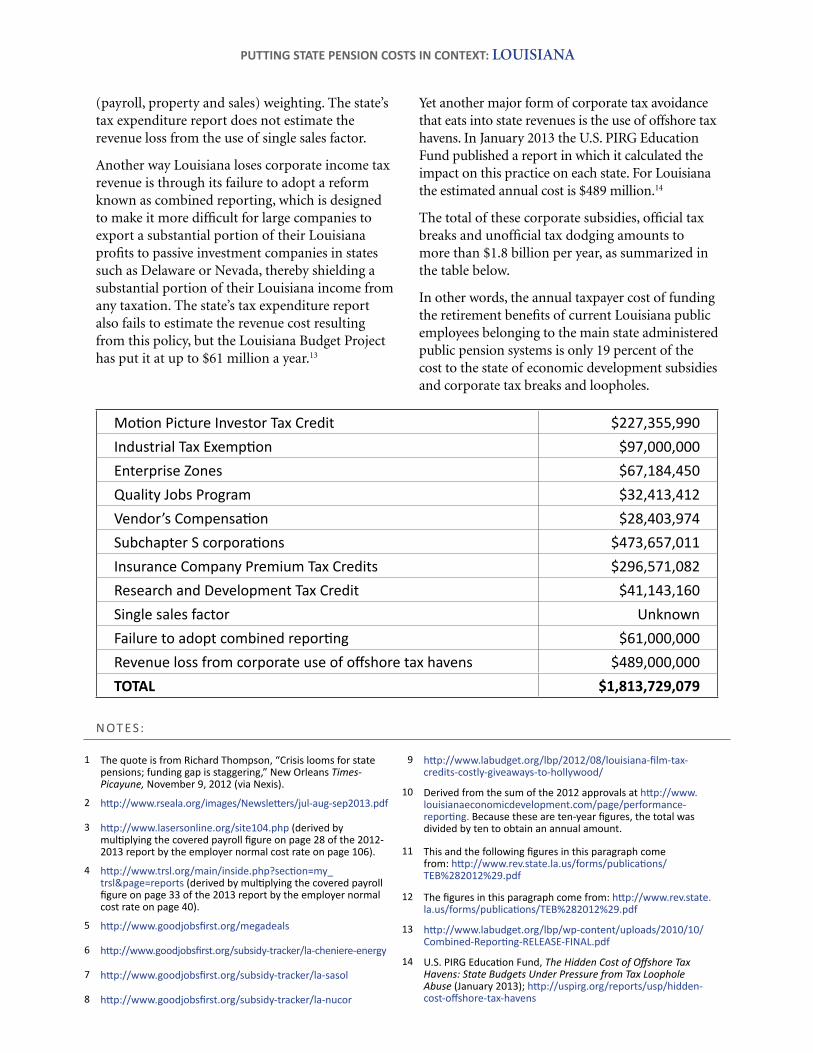
the total of these corporate subsidies, official tax breaks and unofficial tax dodging amounts to more than $1.8 billion per year, as summarized in the table below.
in other words, the annual taxpayer cost of funding the retirement benefits of current louisiana public employees belonging to the main state administered public pension systems is only 19 percent of the cost to the state of economic development subsidies and corporate tax breaks and loopholes.
1 The quote is from richard Thompson, “Crisis looms for state pensions; funding gap is staggering,” new Orleans Times-Picayune, november 9, 2012 (via nexis).
2 http://www.rseala.org/images/Newsletters/jul-aug-sep2013.pdf
3 http://www.lasersonline.org/site104.php (derived by multiplying the covered payroll figure on page 28 of the 2012-2013 report by the employer normal cost rate on page 106).
4 http://www.trsl.org/main/inside.php?section=my_trsl&page=reports (derived by multiplying the covered payroll figure on page 33 of the 2013 report by the employer normal cost rate on page 40).
5 http://www.goodjobsfirst.org/megadeals
6 http://www.goodjobsfirst.org/subsidy-tracker/la-cheniere-energy
7 http://www.goodjobsfirst.org/subsidy-tracker/la-sasol
8 http://www.goodjobsfirst.org/subsidy-tracker/la-nucor
9 http://www.labudget.org/lbp/2012/08/louisiana-film-tax-credits-costly-giveaways-to-hollywood/
10 Derived from the sum of the 2012 approvals at http://www.louisianaeconomicdevelopment.com/page/performance-reporting. Because these are ten-year figures, the total was divided by ten to obtain an annual amount.
11 This and the following figures in this paragraph come from: http://www.rev.state.la.us/forms/publications/TEB%282012%29.pdf
12 The figures in this paragraph come from: http://www.rev.state.la.us/forms/publications/TEB%282012%29.pdf
13 http://www.labudget.org/lbp/wp-content/uploads/2010/10/Combined-Reporting-RELEASE-FINAL.pdf
14 U.S. PIRG Education Fund, The Hidden Cost of Offshore Tax Havens: State Budgets Under Pressure from Tax Loophole Abuse (January 2013); http://uspirg.org/reports/usp/hidden-cost-offshore-tax-havens
PUTTING STATE PENSION COSTS IN CONTEXT: Louisiana
Motion Picture Investor Tax Credit $227,355,990Industrial Tax Exemption $97,000,000Enterprise Zones $67,184,450Quality Jobs Program $32,413,412Vendor’s Compensation $28,403,974Subchapter S corporations $473,657,011Insurance Company Premium Tax Credits $296,571,082research and Development Tax Credit $41,143,160Single sales factor UnknownFailure to adopt combined reporting $61,000,000Revenue loss from corporate use of offshore tax havens $489,000,000TOTAL $1,813,729,079

Ja n ua r y 2014
PUTTING STATE PENSION COSTS IN CONTEXT:
michigan
Good Jobs First | 1616 P Street NW, Suite 210 | Washington, DC 20036 | 202-232-1616 | www.goodjobsfirst.org
The recenT ruling by a federal bankruptcy judge approving detroit’s bankruptcy filing and allowing the city to proceed with plans to slash employee benefits landed like a bombshell in the world of public pensions. as the New York Times put it, the judge “dealt a major blow to the widely held belief that state laws preserve public pensions.”1 The move by detroit’s emergency manager is expected to open the door to more assaults on pension benefits throughout Michigan and in other states.
While many pension numbers are bandied about, the central issue is how much of an obligation is being taken on each year to provide benefits for current government employees such as teachers and first responders. The best way to measure this is to use an amount known as employer normal cost. Such costs can be found in the annual financial reports that each public pension plan has to produce. in the case of Michigan there are three main plans administered by the state: the Michigan State employees’ retirement System (MSerS), the Michigan Public School employees’ retirement System (MPSerS) and the Municipal employees’ retirement System of Michigan (MerS). The most recent financial reports indicate annual employer normal costs of $95.7 million for MSerS2; $366.2 million for MPSerS3; and $124.7 million for MerS.4 The total is $586.6 million.
how should this amount be viewed? One approach is to compare it to the financial costs incurred by the state in supporting business through economic development subsidies and other special tax
provisions. While not providing an assessment of the effectiveness of any particular subsidy or provision at achieving targeted policy objectives, such as creating family-wage jobs, this approach does provide an important perspective on public sector pensions.
during the past decade, Michigan has been one of the most aggressive states in terms of giving large subsidy packages to corporations. in the Megadeals report good Jobs first published in June 2013, we found that Michigan accounted for more subsidy packages worth $75 million or more (29) than any other state.5 Those deals had a total estimated cost of $7.1 billion.
Since taking office in 2011, gov. rick Snyder has de-emphasized big subsidy packages in favor of across-the-board tax cuts for business totaling $1.4 billion, accompanied by cuts in social safety net programs and education.6 yet the financial legacy of those large subsidy deals, as well as smaller ones, lives on. The cost of the advanced battery credit for fy2014 is estimated at $332 million, while the state’s Mega tax credit, which was at the center of many of those packages, is reducing revenue by $245 million.7 The cost of tax increment financing is put at $280 million and brownfield redevelopment credits have a price tag of $40 million.
Michigan provides other lucrative tax breaks for business, such as an industrial facilities property tax break that costs $228 million a year and an exclusion for foreign dividends that costs $211 million. in 2014 voters will be asked to repeal the $1 billion personal property tax that corporations pay on machinery and other equipment.
n OT E S:
Michigan is one of the states that allow corporations to apportion their taxable income by methods other than the traditional three-factor (payroll, property and sales) weighting. The Michigan tax expenditure report does not contain an estimate of the revenue impact of single sales factor.
another major form of corporate tax avoidance that eats into state revenues is the use of offshore tax havens. in January 2013 the u.S. Pirg education fund published a report in which it calculated the impact on this practice on each state. for Michigan, the estimated cost is $523 million.8
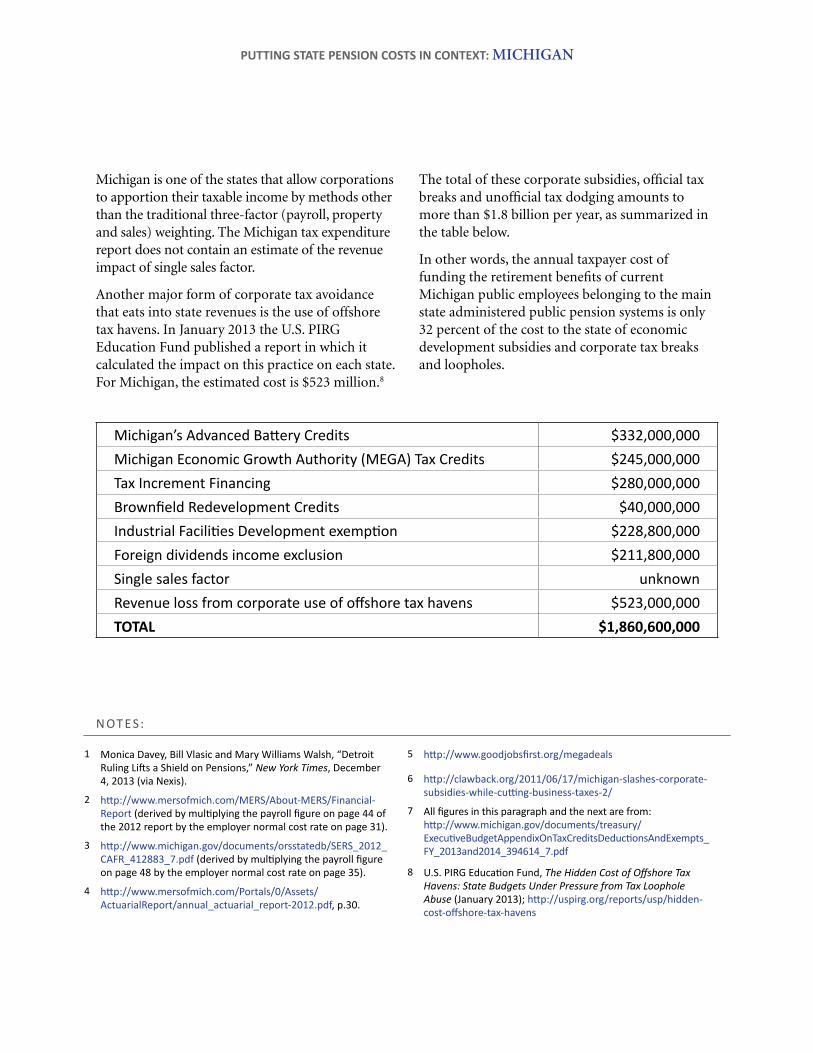
The total of these corporate subsidies, official tax breaks and unofficial tax dodging amounts to more than $1.8 billion per year, as summarized in the table below.
in other words, the annual taxpayer cost of funding the retirement benefits of current Michigan public employees belonging to the main state administered public pension systems is only 32 percent of the cost to the state of economic development subsidies and corporate tax breaks and loopholes.
1 Monica Davey, Bill Vlasic and Mary Williams Walsh, “Detroit Ruling Lifts a Shield on Pensions,” New York Times, December 4, 2013 (via nexis).
2 http://www.mersofmich.com/MERS/About-MERS/Financial-Report (derived by multiplying the payroll figure on page 44 of the 2012 report by the employer normal cost rate on page 31).
3 http://www.michigan.gov/documents/orsstatedb/SERS_2012_CAFR_412883_7.pdf (derived by multiplying the payroll figure on page 48 by the employer normal cost rate on page 35).
4 http://www.mersofmich.com/Portals/0/Assets/ActuarialReport/annual_actuarial_report-2012.pdf, p.30.
5 http://www.goodjobsfirst.org/megadeals
6 http://clawback.org/2011/06/17/michigan-slashes-corporate-subsidies-while-cutting-business-taxes-2/
7 All figures in this paragraph and the next are from: http://www.michigan.gov/documents/treasury/ExecutiveBudgetAppendixOnTaxCreditsDeductionsAndExempts_FY_2013and2014_394614_7.pdf
8 U.S. PIRG Education Fund, The Hidden Cost of Offshore Tax Havens: State Budgets Under Pressure from Tax Loophole Abuse (January 2013); http://uspirg.org/reports/usp/hidden-cost-offshore-tax-havens
PUTTING STATE PENSION COSTS IN CONTEXT: michigan
Michigan’s Advanced Battery Credits $332,000,000Michigan Economic Growth authority (MEGa) Tax Credits $245,000,000Tax Increment Financing $280,000,000Brownfield Redevelopment Credits $40,000,000Industrial Facilities Development exemption $228,800,000Foreign dividends income exclusion $211,800,000Single sales factor unknownRevenue loss from corporate use of offshore tax havens $523,000,000TOTAL $1,860,600,000
Ja n ua r y 2014
PUTTING STATE PENSION COSTS IN CONTEXT:
missouri
Good Jobs First | 1616 P Street NW, Suite 210 | Washington, DC 20036 | 202-232-1616 | www.goodjobsfirst.org
In 2010 the state enacted a publIc pension overhaul that tightened eligibility rules and required new employees to contribute 4 percent of their pay into the retirement system. Yet conservative groups such as the show-Me Institute insist that the system is an “economic ticking time bomb” and are calling for more “reforms.”1
While many pension numbers are bandied about, the central issue is how much of an obligation is being taken on each year to provide benefits for current government employees such as teachers and first responders. the best way to measure this is to use an amount known as employer normal cost. such costs can be found in the annual financial reports that each public pension plan has to produce. In the case of Missouri there are four main plans administered by the state: the Missouri state employees’ Retirement system (MOseRs), the public school Retirement system of Missouri (psRs), the public education employee Retirement system of Missouri (peeRs), and the Missouri department of transportation and highway patrol employees’ Retirement system (MpeRs). the most recent financial reports indicate annual employer normal costs of $134.6 million for MOseRs2; $198.3 million for psRs3; $56.5 million for peeRs4; and $37.8 million for MpeRs.5 the total is $427.2 million.
how should this amount be viewed? One approach is to compare it to the financial costs incurred by the state in supporting business through economic development subsidies and other special tax
provisions. While not providing an assessment of the effectiveness of any particular subsidy or provision at achieving targeted policy objectives, such as creating family-wage jobs, this approach does provide an important perspective on public sector pensions.
Missouri has been willing to offer lucrative subsidy packages to large corporations. these packages are not the only way the state provides incentives to corporations in the name of job creation. Missouri’s Quality Jobs program, which allows employers to keep – for a defined period of time - state personal income taxes paid by newly hired workers, costs $42 million a year.6 Other subsidies include state supplemental tax increment financing, which costs $10 million, and enhanced enterprise Zones, which have a price tag of nearly $7 million.
an archaic tax rule that allows retailers to keep a portion of the sales tax revenues they collect from customers costs Missouri about $37 million a year.7
Missouri is one of the states that allow corporations to apportion their taxable income by methods other than the traditional three-factor (payroll, property and sales) weighting. In its 2005 budget the state estimated that single sales factor was costing $57 million a year; more recent estimates are not available.8
another way Missouri loses corporate income tax revenue is through its failure to adopt a reform known as combined reporting, which is designed to make it more difficult for large companies to export
n OT E S:
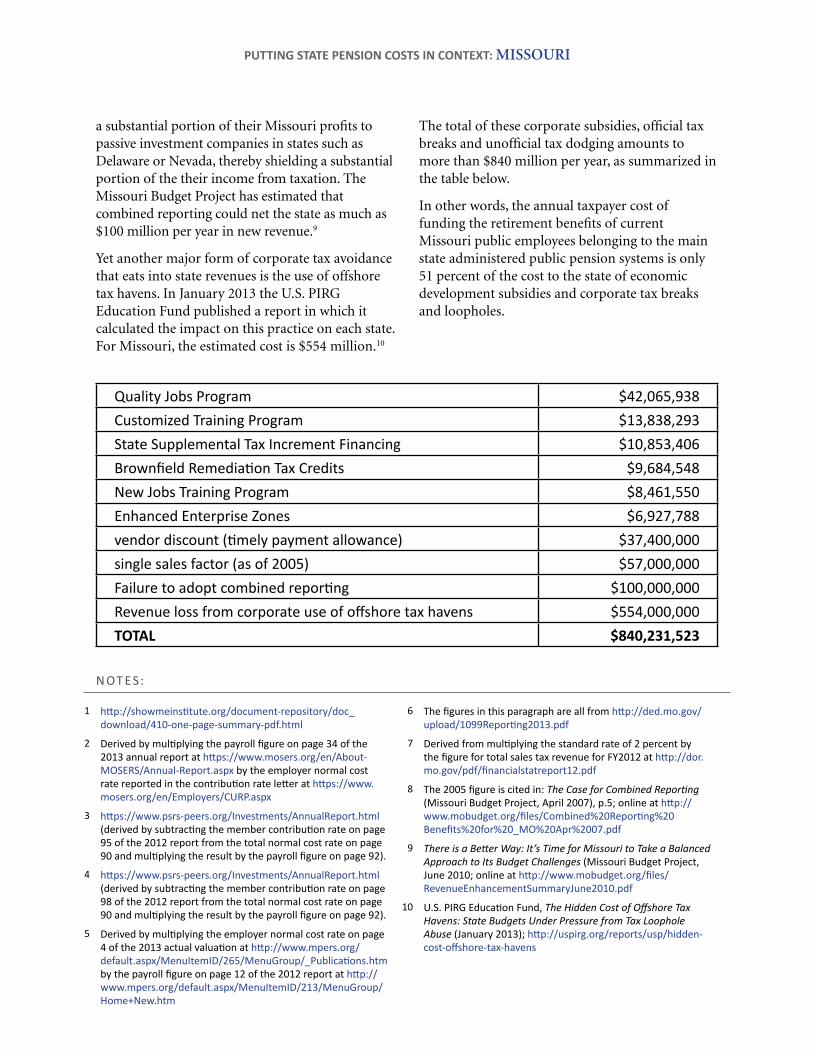
a substantial portion of their Missouri profits to passive investment companies in states such as delaware or nevada, thereby shielding a substantial portion of the their income from taxation. the Missouri budget project has estimated that combined reporting could net the state as much as $100 million per year in new revenue.9
Yet another major form of corporate tax avoidance that eats into state revenues is the use of offshore tax havens. In January 2013 the u.s. pIRG education Fund published a report in which it calculated the impact on this practice on each state. For Missouri, the estimated cost is $554 million.10
the total of these corporate subsidies, official tax breaks and unofficial tax dodging amounts to more than $840 million per year, as summarized in the table below.
In other words, the annual taxpayer cost of funding the retirement benefits of current Missouri public employees belonging to the main state administered public pension systems is only 51 percent of the cost to the state of economic development subsidies and corporate tax breaks and loopholes.
1 http://showmeinstitute.org/document-repository/doc_download/410-one-page-summary-pdf.html
2 Derived by multiplying the payroll figure on page 34 of the 2013 annual report at https://www.mosers.org/en/About-MOSERS/Annual-Report.aspx by the employer normal cost rate reported in the contribution rate letter at https://www.mosers.org/en/Employers/CURP.aspx
3 https://www.psrs-peers.org/Investments/AnnualReport.html (derived by subtracting the member contribution rate on page 95 of the 2012 report from the total normal cost rate on page 90 and multiplying the result by the payroll figure on page 92).
4 https://www.psrs-peers.org/Investments/AnnualReport.html (derived by subtracting the member contribution rate on page 98 of the 2012 report from the total normal cost rate on page 90 and multiplying the result by the payroll figure on page 92).
5 Derived by multiplying the employer normal cost rate on page 4 of the 2013 actual valuation at http://www.mpers.org/default.aspx/MenuItemID/265/MenuGroup/_Publications.htm by the payroll figure on page 12 of the 2012 report at http://www.mpers.org/default.aspx/MenuItemID/213/MenuGroup/Home+New.htm
6 The figures in this paragraph are all from http://ded.mo.gov/upload/1099Reporting2013.pdf
7 Derived from multiplying the standard rate of 2 percent by the figure for total sales tax revenue for FY2012 at http://dor.mo.gov/pdf/financialstatreport12.pdf
8 The 2005 figure is cited in: The Case for Combined Reporting (Missouri Budget Project, April 2007), p.5; online at http://www.mobudget.org/files/Combined%20Reporting%20Benefits%20for%20_MO%20Apr%2007.pdf
9 There is a Better Way: It’s Time for Missouri to Take a Balanced Approach to Its Budget Challenges (Missouri Budget Project, June 2010; online at http://www.mobudget.org/files/RevenueEnhancementSummaryJune2010.pdf
10 U.S. PIRG Education Fund, The Hidden Cost of Offshore Tax Havens: State Budgets Under Pressure from Tax Loophole Abuse (January 2013); http://uspirg.org/reports/usp/hidden-cost-offshore-tax-havens
PUTTING STATE PENSION COSTS IN CONTEXT: missouri
Quality Jobs Program $42,065,938Customized Training Program $13,838,293State Supplemental Tax Increment Financing $10,853,406Brownfield Remediation Tax Credits $9,684,548New Jobs Training Program $8,461,550Enhanced Enterprise Zones $6,927,788vendor discount (timely payment allowance) $37,400,000single sales factor (as of 2005) $57,000,000Failure to adopt combined reporting $100,000,000Revenue loss from corporate use of offshore tax havens $554,000,000TOTAL $840,231,523
Ja n ua r y 2014
PUTTING STATE PENSION COSTS IN CONTEXT:
oklahoma
Good Jobs First | 1616 P Street NW, Suite 210 | Washington, DC 20036 | 202-232-1616 | www.goodjobsfirst.org
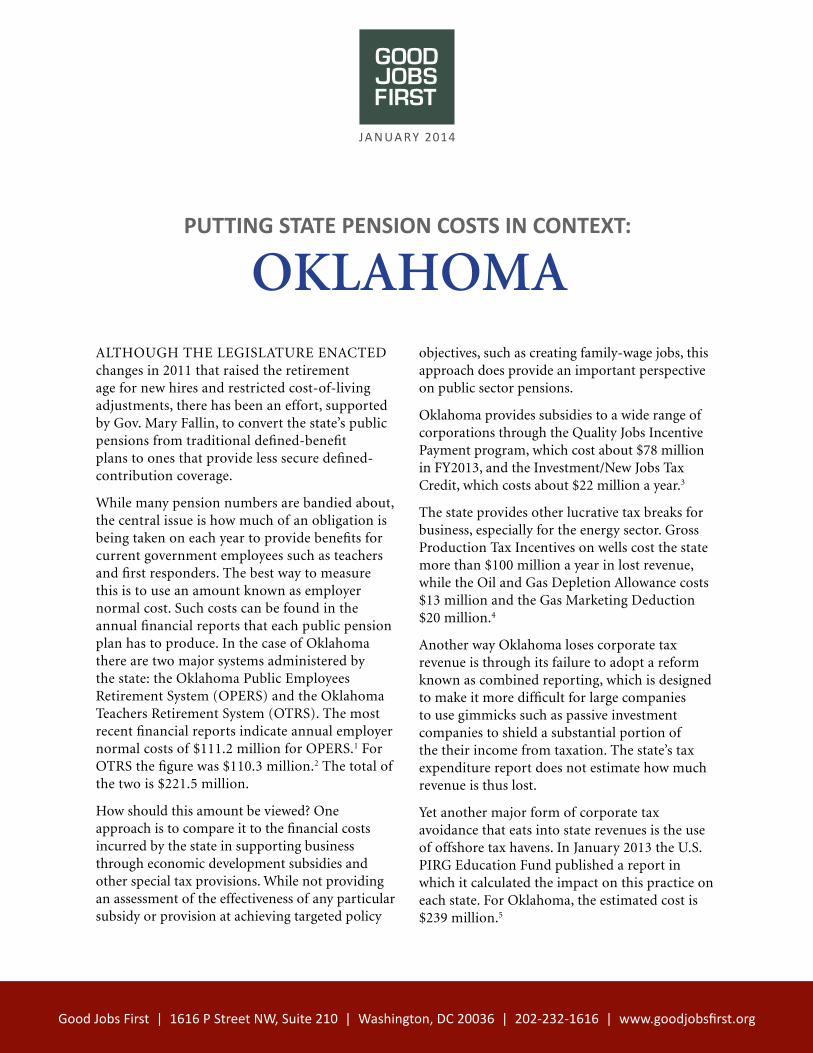
Although the legislAture enActed changes in 2011 that raised the retirement age for new hires and restricted cost-of-living adjustments, there has been an effort, supported by gov. Mary Fallin, to convert the state’s public pensions from traditional defined-benefit plans to ones that provide less secure defined-contribution coverage.
While many pension numbers are bandied about, the central issue is how much of an obligation is being taken on each year to provide benefits for current government employees such as teachers and first responders. the best way to measure this is to use an amount known as employer normal cost. such costs can be found in the annual financial reports that each public pension plan has to produce. in the case of oklahoma there are two major systems administered by the state: the oklahoma Public employees retirement system (oPers) and the oklahoma teachers retirement system (otrs). the most recent financial reports indicate annual employer normal costs of $111.2 million for oPers.1 For otrs the figure was $110.3 million.2 the total of the two is $221.5 million.
how should this amount be viewed? one approach is to compare it to the financial costs incurred by the state in supporting business through economic development subsidies and other special tax provisions. While not providing an assessment of the effectiveness of any particular subsidy or provision at achieving targeted policy
objectives, such as creating family-wage jobs, this approach does provide an important perspective on public sector pensions.
oklahoma provides subsidies to a wide range of corporations through the Quality Jobs incentive Payment program, which cost about $78 million in FY2013, and the investment/new Jobs tax credit, which costs about $22 million a year.3
the state provides other lucrative tax breaks for business, especially for the energy sector. gross Production tax incentives on wells cost the state more than $100 million a year in lost revenue, while the oil and gas depletion Allowance costs $13 million and the gas Marketing deduction $20 million.4
Another way oklahoma loses corporate tax revenue is through its failure to adopt a reform known as combined reporting, which is designed to make it more difficult for large companies to use gimmicks such as passive investment companies to shield a substantial portion of the their income from taxation. the state’s tax expenditure report does not estimate how much revenue is thus lost.
Yet another major form of corporate tax avoidance that eats into state revenues is the use of offshore tax havens. in January 2013 the u.s. Pirg education Fund published a report in which it calculated the impact on this practice on each state. For oklahoma, the estimated cost is $239 million.5
n OT E S:
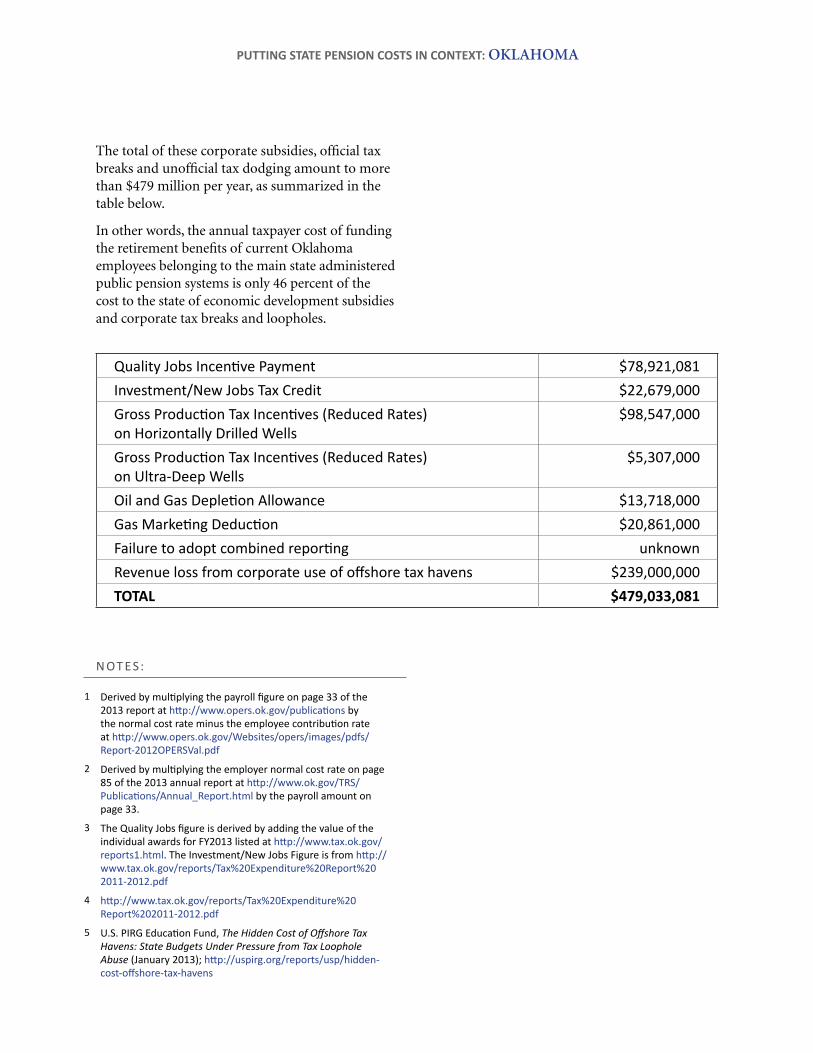
the total of these corporate subsidies, official tax breaks and unofficial tax dodging amount to more than $479 million per year, as summarized in the table below.
in other words, the annual taxpayer cost of funding the retirement benefits of current oklahoma employees belonging to the main state administered public pension systems is only 46 percent of the cost to the state of economic development subsidies and corporate tax breaks and loopholes.
1 Derived by multiplying the payroll figure on page 33 of the 2013 report at http://www.opers.ok.gov/publications by the normal cost rate minus the employee contribution rate at http://www.opers.ok.gov/Websites/opers/images/pdfs/Report-2012OPERSVal.pdf
2 Derived by multiplying the employer normal cost rate on page 85 of the 2013 annual report at http://www.ok.gov/TRS/Publications/Annual_Report.html by the payroll amount on page 33.
3 The Quality Jobs figure is derived by adding the value of the individual awards for FY2013 listed at http://www.tax.ok.gov/reports1.html. The Investment/New Jobs Figure is from http://www.tax.ok.gov/reports/Tax%20Expenditure%20Report%202011-2012.pdf
4 http://www.tax.ok.gov/reports/Tax%20Expenditure%20Report%202011-2012.pdf
5 U.S. PIRG Education Fund, The Hidden Cost of Offshore Tax Havens: State Budgets Under Pressure from Tax Loophole Abuse (January 2013); http://uspirg.org/reports/usp/hidden-cost-offshore-tax-havens
PUTTING STATE PENSION COSTS IN CONTEXT: oklahoma
Quality Jobs Incentive Payment $78,921,081Investment/New Jobs Tax Credit $22,679,000Gross Production Tax Incentives (Reduced Rates) on Horizontally Drilled Wells
$98,547,000
Gross Production Tax Incentives (Reduced Rates) on Ultra-Deep Wells
$5,307,000
Oil and Gas Depletion Allowance $13,718,000 Gas Marketing Deduction $20,861,000 Failure to adopt combined reporting unknownRevenue loss from corporate use of offshore tax havens $239,000,000TOTAL $479,033,081

Ja n ua r y 2014
PUTTING STATE PENSION COSTS IN CONTEXT:
pennsylvania
Good Jobs First | 1616 P Street NW, Suite 210 | Washington, DC 20036 | 202-232-1616 | www.goodjobsfirst.org
Since taking office in 2011, gov. tom corbett has been promoting the idea that the state is facing a public pension crisis, calling retirement costs “a tapeworm eating up the budget.”1 Last year, he presented a plan that included putting all new employees in 401(k)-style defined-contribution plans rather than traditional and more secure defined-benefit ones. So far, the legislature has not gone along.
While many pension numbers are bandied about, the central issue is how much of an obligation is being taken on each year to provide benefits for current government employees such as teachers and first responders. the best way to measure this is to use an amount known as employer normal cost. Such costs can be found in the annual financial reports that each public pension plan has to produce. in the case of Pennsylvania there are two main plans administered by the state: the Pennsylvania State employees’ Retirement System (SeRS) and the Pennsylvania Public School employees’ Retirement System (PSeRS). the most recent financial reports indicate annual employer normal costs of $277.5 million for SeRS.2 for PSeRS the figure is $1.18 billion.3 the total is about $1.4 billion.
How should this amount be viewed? one approach is to compare it to the financial costs incurred by the state in supporting business through economic development subsidies and other special tax provisions. While not providing an assessment of the effectiveness of any particular subsidy or provision at achieving targeted policy objectives,
such as creating family-wage jobs, this approach does provide an important perspective on public sector pensions.
Many companies benefit from subsidy programs such as keystone opportunity Zones, which cost the state $29 million a year; keystone innovation Zone tax credits, which costs $13 million; the Job creation tax credit, which costs $10 million; and the newer Pennsylvania first program, which costs $37 million.4 an archaic tax rule that allows retailers to keep a portion of the sales tax revenues they collect from customers costs Pennsylvania about $71 million a year.5
the state provides other lucrative tax breaks for business.6 the research & development tax credit costs $55 million a year. Preferential tax treatment of S corporations and limited liability companies results in annual revenue losses to the state of $705 million and $513 million, respectively.
Pennsylvania is one of the states that allow corporations to apportion their taxable income by methods other than the traditional three-factor (payroll, property and sales) weighting. the state estimates that the use of single sales factor results in an annual revenue loss of about $202 million.7
another way Pennsylvania has been losing corporate tax revenue is through its long-time failure to adopt a reform known as combined reporting, which is designed to make it more difficult for large companies to export a substantial portion of their Pennsylvania profits to passive investment companies in states such as Delaware or nevada,
n OT E S:
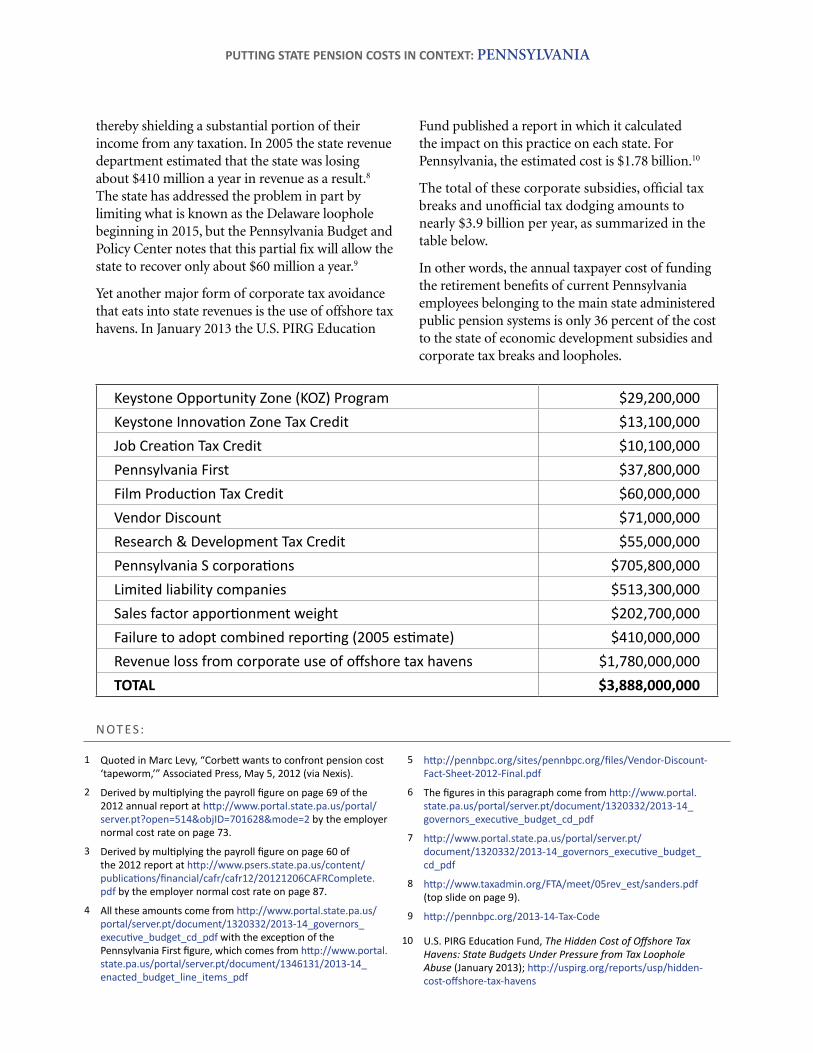
thereby shielding a substantial portion of their income from any taxation. in 2005 the state revenue department estimated that the state was losing about $410 million a year in revenue as a result.8 the state has addressed the problem in part by limiting what is known as the Delaware loophole beginning in 2015, but the Pennsylvania Budget and Policy center notes that this partial fix will allow the state to recover only about $60 million a year.9
Yet another major form of corporate tax avoidance that eats into state revenues is the use of offshore tax havens. in January 2013 the U.S. PiRg education
fund published a report in which it calculated the impact on this practice on each state. for Pennsylvania, the estimated cost is $1.78 billion.10
the total of these corporate subsidies, official tax breaks and unofficial tax dodging amounts to nearly $3.9 billion per year, as summarized in the table below.
in other words, the annual taxpayer cost of funding the retirement benefits of current Pennsylvania employees belonging to the main state administered public pension systems is only 36 percent of the cost to the state of economic development subsidies and corporate tax breaks and loopholes.
1 Quoted in Marc Levy, “Corbett wants to confront pension cost ‘tapeworm,’” Associated Press, May 5, 2012 (via Nexis).
2 Derived by multiplying the payroll figure on page 69 of the 2012 annual report at http://www.portal.state.pa.us/portal/server.pt?open=514&objID=701628&mode=2 by the employer normal cost rate on page 73.
3 Derived by multiplying the payroll figure on page 60 of the 2012 report at http://www.psers.state.pa.us/content/publications/financial/cafr/cafr12/20121206CAFRComplete.pdf by the employer normal cost rate on page 87.
4 All these amounts come from http://www.portal.state.pa.us/portal/server.pt/document/1320332/2013-14_governors_executive_budget_cd_pdf with the exception of the Pennsylvania First figure, which comes from http://www.portal.state.pa.us/portal/server.pt/document/1346131/2013-14_enacted_budget_line_items_pdf
5 http://pennbpc.org/sites/pennbpc.org/files/Vendor-Discount-Fact-Sheet-2012-Final.pdf
6 The figures in this paragraph come from http://www.portal.state.pa.us/portal/server.pt/document/1320332/2013-14_governors_executive_budget_cd_pdf
7 http://www.portal.state.pa.us/portal/server.pt/document/1320332/2013-14_governors_executive_budget_cd_pdf
8 http://www.taxadmin.org/FTA/meet/05rev_est/sanders.pdf (top slide on page 9).
9 http://pennbpc.org/2013-14-Tax-Code
10 U.S. PIRG Education Fund, The Hidden Cost of Offshore Tax Havens: State Budgets Under Pressure from Tax Loophole Abuse (January 2013); http://uspirg.org/reports/usp/hidden-cost-offshore-tax-havens
PUTTING STATE PENSION COSTS IN CONTEXT: pennsylvania
Keystone Opportunity Zone (KOZ) Program $29,200,000Keystone Innovation Zone Tax Credit $13,100,000Job Creation Tax Credit $10,100,000Pennsylvania First $37,800,000Film Production Tax Credit $60,000,000Vendor Discount $71,000,000Research & Development Tax Credit $55,000,000Pennsylvania S corporations $705,800,000Limited liability companies $513,300,000Sales factor apportionment weight $202,700,000Failure to adopt combined reporting (2005 estimate) $410,000,000Revenue loss from corporate use of offshore tax havens $1,780,000,000TOTAL $3,888,000,000