pension accounting update: putting theory into … accounting update: putting theory into practice...
TRANSCRIPT

Pension Accounting Update: Putting Theory into Practice
Minnesota Society of CPAs
Earle Brown Heritage Center
June 1, 2015
Presented by:
John Wicklund, Assistant Executive Director, TRA
Jim Riebe, Principal Accounting Officer, PERA

2
Pension Accounting:
Putting Theory into Practice
Today’s Agenda
GASB 67: Pension Plan Reporting
GASB 68: Accounting and Financial
Reporting for Pensions
Case study of Minnetonka School District
GASB 68 implementation, includes
footnote disclosures, RSI schedules, and
GASB 71 transition guidance
Controls Over Census Data
Key Messages for School Boards and
Executive Management
Summary

GASB 67 implementation
Accounting and Financial Reporting for Pension Plans—an
amendment of GASB Statement 25
Implemented for plan fiscal year ended June 30, 2014
More extensive footnote disclosures
Disclose total pension liability, fiduciary net position, net pension liability
and fiduciary net position as a percentage of total pension liability
3
PERA General Employees
Retirement Fund TRA Fund
Total Pension Liability (Calculated by Actuary) $22,102,321,000 $24,901,612,000
Less: Fiduciary Net Position $17,404,822,000 $20,293,684,000
Net Pension Liability $4,697,499,000 $4,607,928,000
Fiduciary Net Position as % of NPL 78.7% 81.5%

GASB 67 implementation
Major changes—more extensive footnote disclosures
(continued)
NPL sensitivity analysis
Investments, including money-weighted rate of return
Actuarial assumptions
Required supplementary information
Ten-Year Schedule of Changes in Net Pension Liabilities
Ten-Year Schedule of NPL
Ten-Year Schedule of Employer Contributions
Covered payroll, i.e. “pensionable wages” requirement changed to covered-employee payroll, i.e. “total wage compensation” of covered employees
PERA and TRA plan to report “covered payroll” and recommend employers report “covered-employee payroll”
4

GASB 67 implementation
PERA’s CAFR available at: www.mnpera.org
Click on About PERA tab, then click on Financial Information tab
TRA’s CAFR available at: www.minnesotatra.org
Click on Members tab, then click on Publications and scroll down to
Comprehensive Annual Financial Report
5
6
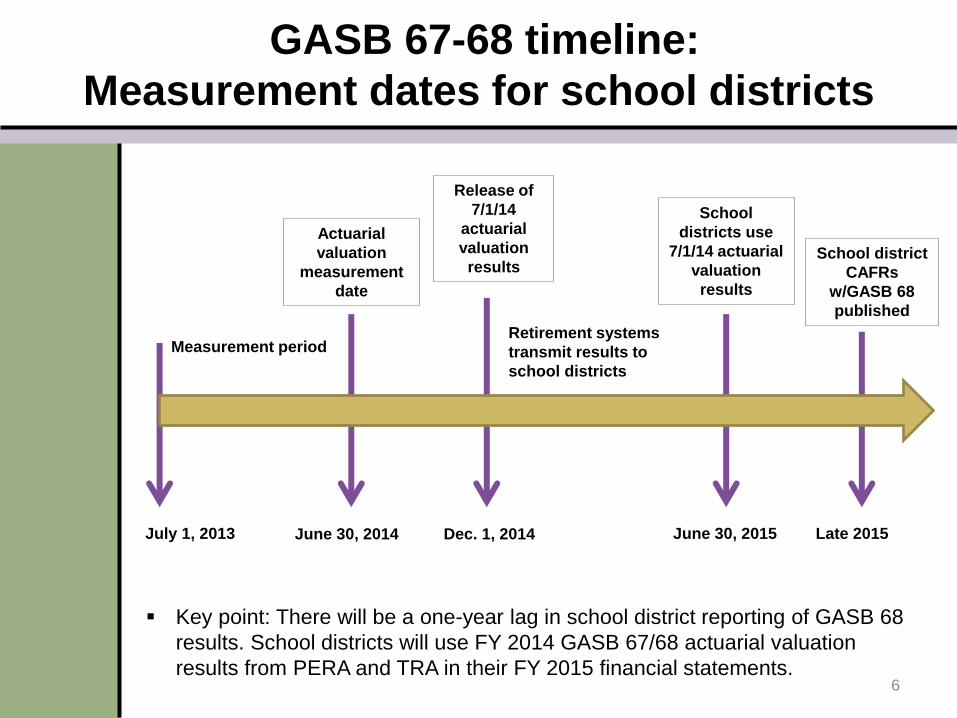
Measurement period
Actuarial
valuation
measurement
date
Release of
7/1/14
actuarial
valuation
results
School
districts use
7/1/14 actuarial
valuation
results
School district
CAFRs
w/GASB 68
published
Retirement systems
transmit results to
school districts
July 1, 2013 June 30, 2014 Dec. 1, 2014 June 30, 2015 Late 2015
Key point: There will be a one-year lag in school district reporting of GASB 68
results. School districts will use FY 2014 GASB 67/68 actuarial valuation
results from PERA and TRA in their FY 2015 financial statements.
GASB 67-68 timeline:
Measurement dates for school districts
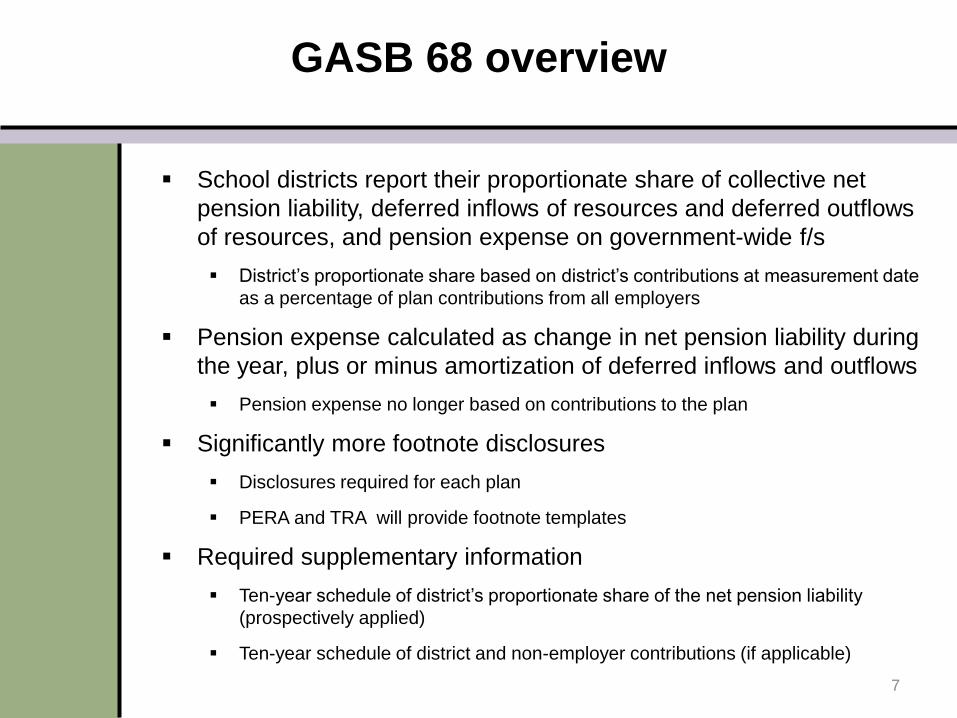
School districts report their proportionate share of collective net
pension liability, deferred inflows of resources and deferred outflows
of resources, and pension expense on government-wide f/s
District’s proportionate share based on district’s contributions at measurement date
as a percentage of plan contributions from all employers
Pension expense calculated as change in net pension liability during
the year, plus or minus amortization of deferred inflows and outflows
Pension expense no longer based on contributions to the plan
Significantly more footnote disclosures
Disclosures required for each plan
PERA and TRA will provide footnote templates
Required supplementary information
Ten-year schedule of district’s proportionate share of the net pension liability
(prospectively applied)
Ten-year schedule of district and non-employer contributions (if applicable)
7
GASB 68 overview

Schedule of Employer Allocations
PERA General Employees Retirement Fund and TRA Fund
Fiscal Year Ended June 30, 2014
8
Case study: proportional share
PERA GERF
Contributions
PERA GERF
Proportional
Share
TRA Fund
Contributions
TRA
Proportional
Share
MINNETONKA ISD-276 $1,332,949 0.3502% $3,535,644 1.1065%
Total Fund Contributions $380,612,332 100.00% $319,531,443 100.00%

General Employees Retirement Plan
Reconciliation of Proportionate Share Contributions to Financial
Statement Contributions
Fiscal Year Ended June 30, 2014
9
PERA contributions reconciliation
YE 2013 YE 2014 Subtotal Subtotal Total
Employer
Unit No.
Employer
Name
Employer
Contributions
- Matching
(6.25 or 6.5%)
Employer
Contribution
- Additional
(1%)
Adjustment for
Employer
Accrual
(Received in
Current FY but
Recognized in
Prior FY)
Adjustment
for Employer
Accrual
(Received in
Future FY
but
Recognized
in Current
FY)
Employer
Contributions
Allocated for
GASB 68
Employer
Contributions
NOT Allocated
for GASB 68
(Omitted
Deductions,
Member
Buybacks,
Employer
Portion Paid by
Employee,
Interest)
Employer
Contributions
Amount
Reported on
CAFR
1855-30
MINNETONKA
ISD-276 $1,139,837 $182,365 $42,096 $52,843 $1,332,949 $4,847 $1,337,796
TOTAL ALL EMPLOYERS $329,397,171 $52,701,183 $9,163,798 $8,522,223 $381,456,778 $794,328 $382,251,106

Schedule of Pension Amounts by Employer
Fiscal Year Ended June 30, 2014
10
Pension amounts (1 of 2)
Pension
System/Fund
Employer
Unit ID
No. Employer Name
Beginning Net
Pension Liability
(NPL)
Ending Net Pension
Liability (Single
Discount Rate
Assumption 7.90%)
(NPL)
Sensitivity of Ending
Net Pension Liability
to 1% Decrease in
Single Rate
Assumption (6.90%)
Sensitivity of Ending
Net Pension Liability
to 1% Increase in
Single Rate
Assumption (8.90%)
Differences
Between Expected
and Actual
Economic
Experience
Difference
Between
Projected
and Actual
Investment
Earnings
Changes in
Actuarial
Assumptions
Changes in
Proportion and
Differences
Between
Employer
Contributions
and
Proportionate
Share of
Contributions
Total Deferred
Outflows of
Resources
PERA/GERF 1855-30 MINNETONKA ISD-276 $19,065,147 $16,450,641 $26,519,098 $8,166,671 $252,466 $0 $1,695,402 $0 $1,947,868
PERA/GERF Amount from Actuary $5,444,074,000 $4,697,499,000 $7,572,558,000 $2,332,002,000 $72,092,000 $0 $484,124,000 $0 $556,216,000
TRA 00276 MINNETONKA ISD-276 $61,599,869 $50,986,723 $84,263,593 $23,245,319 $4,350,548 $0 $0 $1,551,890 $5,902,438
TRA Amount from Actuary $5,736,624,000 $4,607,928,000 $7,615,327,000 $2,100,797,000 393,181,000$ $0 $0 $89,701,164 $482,882,164
Deferred Outlow of Resources

Schedule of Pension Amounts by Employer
Fiscal Year Ended June 30, 2014
11
Pension amounts (2 of 2)
Pension
System/Fund
Employer
Unit ID No. Employer Name
Differences
Between
Expected and
Actual
Economic
Experience
Difference
Between Projected
and Actual
Investment
Earnings
Changes in
Actuarial
Assumptions
Changes in
Proportion and
Differences Between
Employer
Contributions and
Proportionate Share
of Contributions
Total Deferred
Inflows of
Resources
Proportionate
Share of Plan
Pension Expense
Net
Amortization of
Deferred
Amounts from
Changes in
Proportion and
Proportionate
Share of
Pension
Expense
Total Pension
Expense
PERA/GERF 1855-30 MINNETONKA ISD-276 $0 $4,444,949 $0 $0 $4,444,949 $1,221,217 $0 $1,221,217
PERA/GERFAmount from Actuary $0 $1,269,260,000 $0 $0 $1,269,260,000 $348,720,000 $0 $348,720,000
TRA 00276 MINNETONKA ISD-276 $0 $16,029,711 $0 $0 $16,029,711 $2,725,758 $323,986 $3,049,744
TRA Amount from Actuary $1,448,686,000 $1,448,686,000 $246,340,501 $246,340,501
Deferred Inflow of Resources
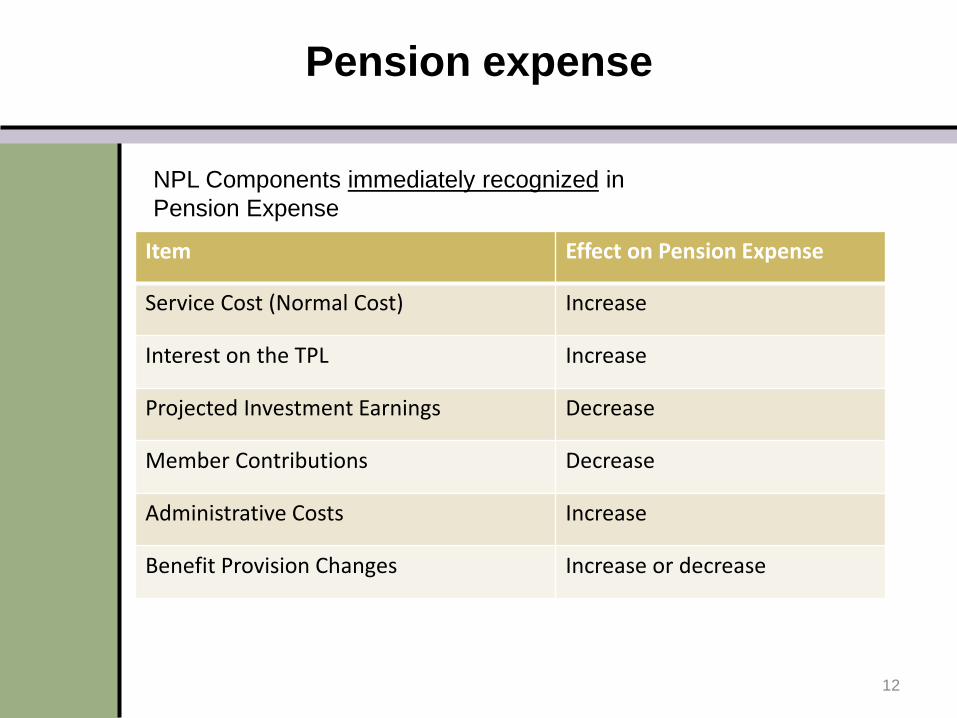
Pension expense
12
NPL Components immediately recognized in
Pension Expense
Item Effect on Pension Expense
Service Cost (Normal Cost) Increase
Interest on the TPL Increase
Projected Investment Earnings Decrease
Member Contributions Decrease
Administrative Costs Increase
Benefit Provision Changes Increase or decrease

13
Pension expense
Components deferred and recognized later include:
Deferred portions are accumulated as ―deferred outflows of
resources‖ or ―deferred inflows of resources‖ and recognized as
pension expense in future years
Item Amortization Period
Difference between actual and projected earnings on investments
5 Years
Changes in actuarial assumptions (mortality, disability, salary growth, inflation, payroll growth, etc.)
Closed period equal to the average of the expected remaining service lives of all employees (active, inactive, and retirees)
Difference between actual and assumed actuarial experience

PERA GASB 68 Reconciliation For fiscal year ended June 30, 2014
14

TRA GASB 68 Reconciliation For fiscal year ended June 30, 2014
15
GASB STATEMENT NO. 68 RECONCILIATION (DOLLARS IN THOUSANDS)
Total Pension
Liability Plan Fiduciary Net Position
Net Pension Liability
Deferred Outflows
Deferred Inflows
Pension Expense
Balances at June 30, 2013 $ 23,755,943 $ 18,019,319 $ 5,736,624
Changes for the Year:
Service Cost $ 367,621 - $ 367,621 - - $ 367,621
Interest on Total Pension Liability 1,895,469 - 1,895,469 - - 1,895,469
Benefit Changes - - - - - -
Difference between expected and actual experience 475,265 - 475,265 $ 393,181 - 82,084
Changes in assumptions - - - - - -
Changes in proportion 89,701 $ (89,701)
Contributions – employer - $ 299,300 (299,300) - - -
Contributions - non-employer - 21,001 (21,001) - - -
Contributions - member - 294,632 (294,632) - - (294,632)
Net investment income - 3,257,693 (3,257,693) - (1,448,686) (1,809,007)
Benefit payments, including refunds of employee contributions (1,592,686) (1,592,686) - - - -
Administrative expense - (9,430) 9,430 - - 9,430
Other changes - 3,855 (3,855) - - (3,855)
Net Changes $ 1,145,669 $ 2,274,365 $ (1,128,696) $ 482,882 $ (1,538,387) $ 247,110
Balances at June 30, 2014 $ 24,901,612 $ 20,293,684 $ 4,607,928 $ 482,882 $ (1,538,387) $ 247,110
16
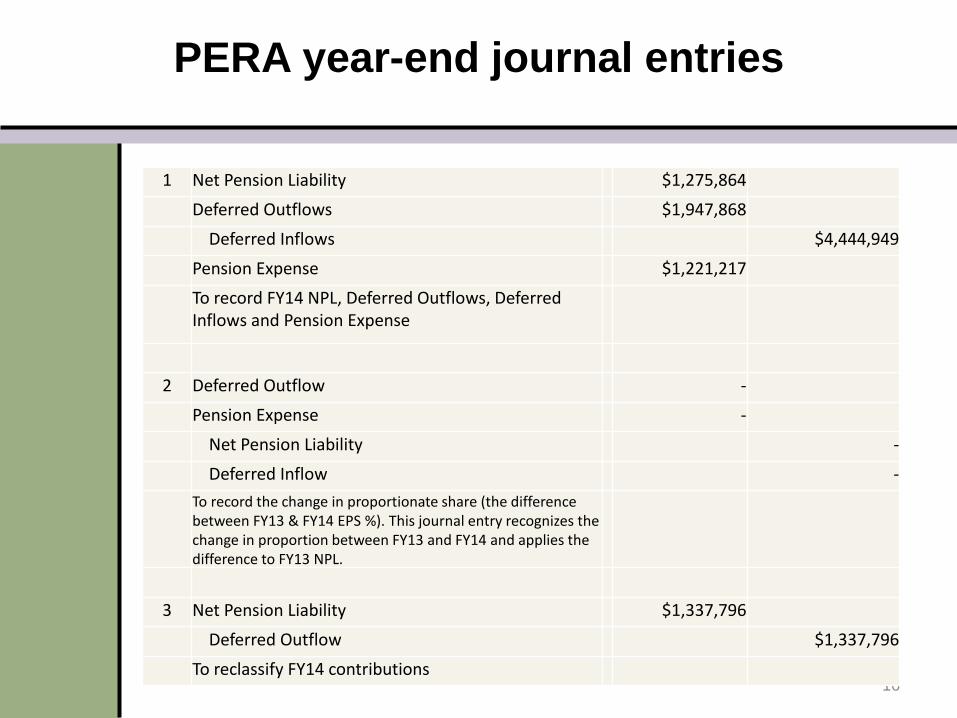
PERA year-end journal entries
1 Net Pension Liability $1,275,864
Deferred Outflows $1,947,868
Deferred Inflows $4,444,949
Pension Expense $1,221,217
To record FY14 NPL, Deferred Outflows, Deferred Inflows and Pension Expense
2 Deferred Outflow -
Pension Expense -
Net Pension Liability -
Deferred Inflow -
To record the change in proportionate share (the difference between FY13 & FY14 EPS %). This journal entry recognizes the change in proportion between FY13 and FY14 and applies the difference to FY13 NPL.
3 Net Pension Liability $1,337,796
Deferred Outflow $1,337,796
To reclassify FY14 contributions

17
PERA year-end journal entries
4 Pension Expense -
Deferred Outflow -
To amortize the change in proportionate share
5 Pension Expense N/A
Revenue- State Aid N/A
Record pension expense and revenue for direct aid
6 Deferred Outflow of Resources $1,438,000
Cash $1,438,000
Estimated employer contributions made during FY15

18
GASB Statement 68, paragraph 15
For FY 2014, TRA received direction contributions of $21.0
million
State of Minnesota will be allocated 5.1641% or
$238 million of TRA’s NPL of $4.6 billion
Other TRA employers will need to record a special journal
entry increasing pension expense and increasing revenue
as an offset
Example: Minnetonka will have a journal entry of $156,463
TRA special funding situation
Revenue Expense
Liability
TRA
Direct aid
Employer unit

19
TRA year-end journal entries
1 Net Pension Liability $ 8,953,405
Deferred Outflows $ 4,350,548
Deferred Inflows $16,029,711
Pension Expense $ 2,725,758
To record FY14 NPL, Deferred Outflows, Deferred Inflows and Pension Expense
2 Deferred Outflow $ 1,875,876
Pension Expense
Net Pension Liability $ 1,875,876
Deferred Inflow
To record the change in proportionate share (the difference between FY13 & FY14 EPS %). This journal entry recognizes the change in proportion between FY13 and FY14 and applies the difference to FY13 NPL.
3 Net Pension Liability $ 3,535,644
Deferred Outflow $ 3,535,644
To reclassify FY14 contributions
20
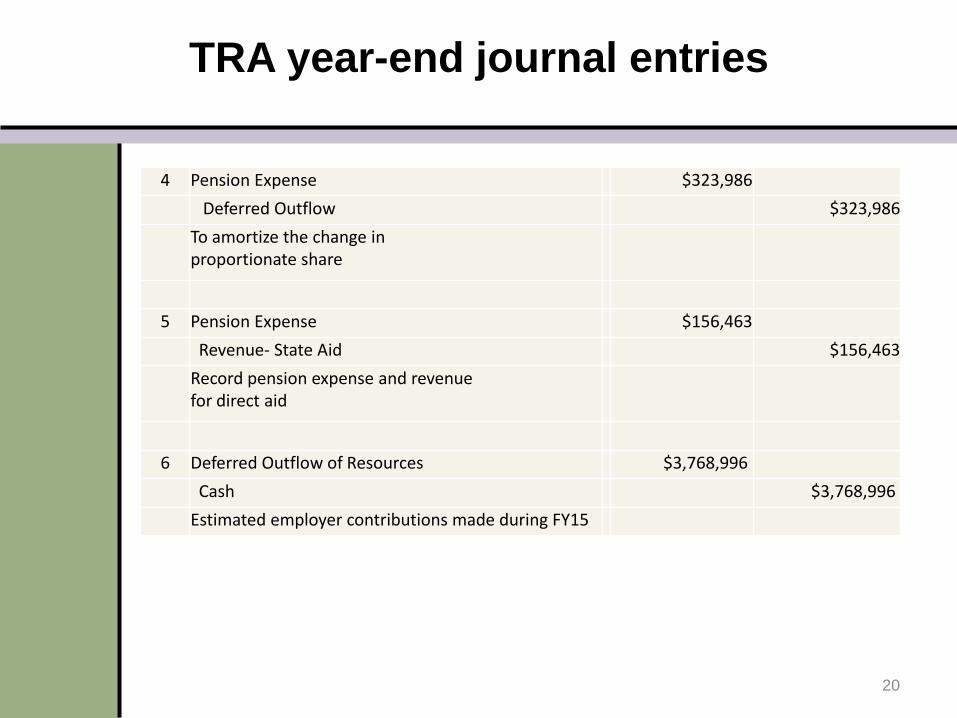
TRA year-end journal entries
4 Pension Expense $323,986
Deferred Outflow $323,986
To amortize the change in proportionate share
5 Pension Expense $156,463
Revenue- State Aid $156,463
Record pension expense and revenue for direct aid
6 Deferred Outflow of Resources $3,768,996
Cash $3,768,996
Estimated employer contributions made during FY15
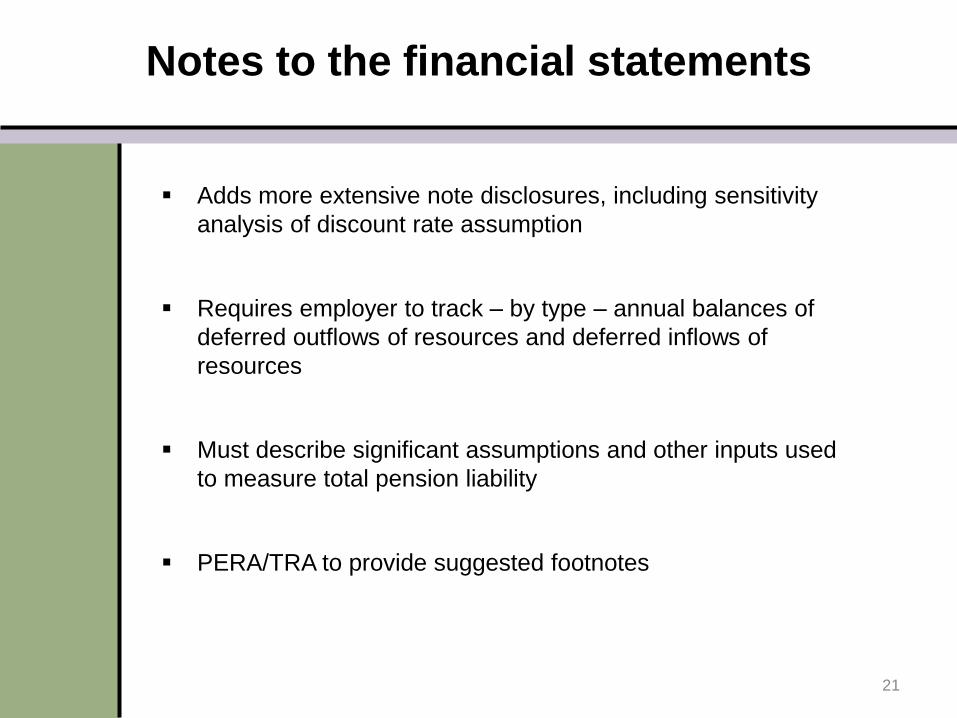
Notes to the financial statements
Adds more extensive note disclosures, including sensitivity
analysis of discount rate assumption
Requires employer to track – by type – annual balances of
deferred outflows of resources and deferred inflows of
resources
Must describe significant assumptions and other inputs used
to measure total pension liability
PERA/TRA to provide suggested footnotes
21
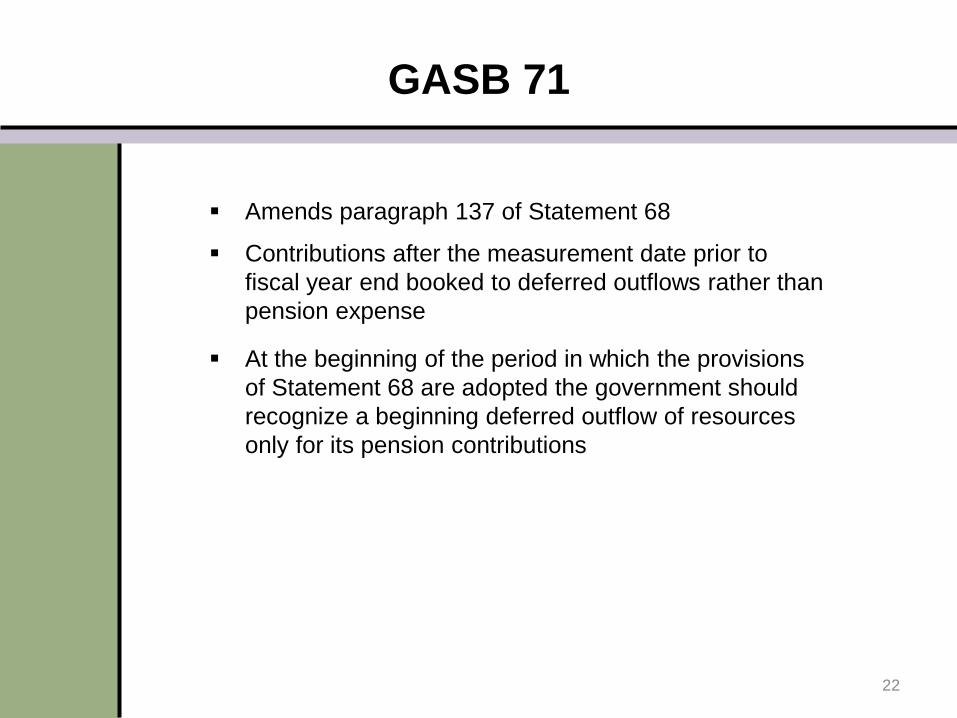
GASB 71
Amends paragraph 137 of Statement 68
Contributions after the measurement date prior to
fiscal year end booked to deferred outflows rather than
pension expense
At the beginning of the period in which the provisions
of Statement 68 are adopted the government should
recognize a beginning deferred outflow of resources
only for its pension contributions
22

Transition year journal entries
Minnetonka School District example: employer contributions expensed during
initial measurement period are reclassified
June 30, 2014 June 30, 2015 June 30, 2013
Employer’s Fiscal Year
End Reporting Date
(and New
Measurement Date)
Employer’s Prior
Fiscal Year End (and
Measurement Date)
Measurement Period
Measurement Date
NPL PERA $19M+
TRA $62M
Contibutions $1.3M PERA; $3.5M TRA
23
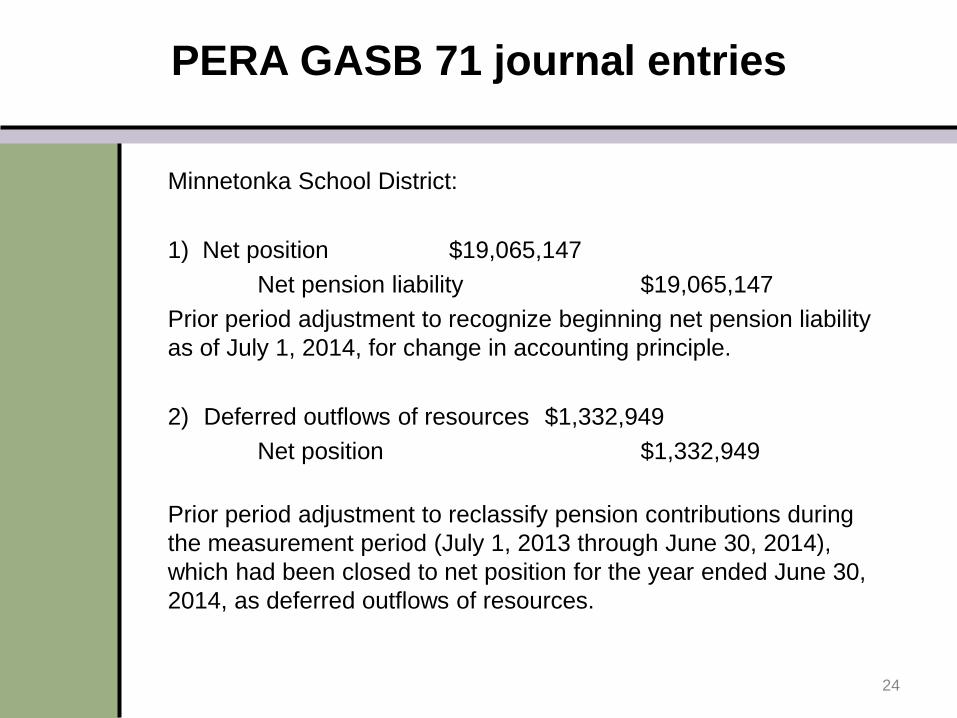
PERA GASB 71 journal entries
24
Minnetonka School District:
1) Net position $19,065,147
Net pension liability $19,065,147
Prior period adjustment to recognize beginning net pension liability
as of July 1, 2014, for change in accounting principle.
2) Deferred outflows of resources $1,332,949
Net position $1,332,949
Prior period adjustment to reclassify pension contributions during
the measurement period (July 1, 2013 through June 30, 2014),
which had been closed to net position for the year ended June 30,
2014, as deferred outflows of resources.

TRA GASB 71 journal entries
25
Minnetonka School District:
1) Net position $61,599,869
Net pension liability $61,599,869
Prior period adjustment to recognize beginning net pension liability
as of July 1, 2014, for change in accounting principle.
2) Deferred outflows of resources $3,535,644
Net position $3,535,644
Prior period adjustment to reclassify pension contributions during
the measurement period (July 1, 2013 through June 30, 2014),
which had been closed to net position for the year ended June 30,
2014, as deferred outflows of resources.

Employers are now required to prepare:
Ten-Year Schedule of District and Non-Employer Contributions (if applicable)
Schedule could be prepared for all years or prospectively
Ten-Year Schedule of District’s Proportionate Share of the Net Pension Liability
Schedule to be prepared prospectively
GASB 68 (and 67) changed the definition of ―covered payroll‖
defined as ―pensionable wages‖ in prior guidance to ―covered-
employee payroll‖ which is defined as ―total payroll‖ or ―total
compensation‖ of employees covered by the pension plan
Plans do not capture ―covered-employee payroll,‖ therefore:
PERA and TRA plan to continue to report ―covered payroll‖ (pensionable
wages)
Recommend employers report ―covered-employee payroll‖
GASB 68 paragraph 81, Implementation Guide Q&A #210
26
Required supplementary information

Schedule of District Contributions
Ten-year schedule presenting by plan:
Statutorily required employer contributions
Actual contributions paid by employer
Difference between required contributions and paid
contributions
Amount of contributions paid in relation to required
contributions as a percentage of the district’s covered-
employee payroll as of the reporting date (June 30, 2015)
27
Required supplementary information

28
Schedule of District Contributions
GERF/TRA Retirement Funds
Last Ten Years
Fiscal Year
Ending
June 30 Pension Plan
Statutorily
Required
Contribution*
Contributions in
Relation to the
Statutorily Required
Contributions*
Contribution
Deficiency
(Excess)
District's Covered-
Employee Payroll*
Contributions as a
Percentage of Covered-
Employee Payroll
2015 PERA** $1,438,084 $1,438,084 $0 $21,653,569 6.64%
2015 TRA** $3,768,996 $3,768,996 $0 $53,774,853 7.01%
2014
2013
2012
2011
2010
2009
2008
2007
2006
2005
*June 30, 2015, amounts are estimated for purposes of illustration
**Funds are combined for purposes of illustration only
Required supplementary information

Schedule of District’s and Non-Employer (if applicable) Share of Net Pension Liability
Ten-year schedule presenting, by plan:
Employer’s proportion (percentage) of the collective NPL
Employer’s proportion (amount) of the collective NPL
Employer’s covered-employee payroll as of the measurement date (June 30, 2014)
Employer’s proportion (amount) of the collective NPL as a percentage of the employer’s covered-employee payroll
Pension plan’s fiduciary net position as a percentage of the total pension liability
For special funding situations, also include the employer’s proportionate share (amount) of the non-employer contributing entities’ total proportionate share amount and the total of this amount and the employer’s proportionate share (amount) (see GASB 68, paragraph 81.a.(2))
29
Required supplementary information
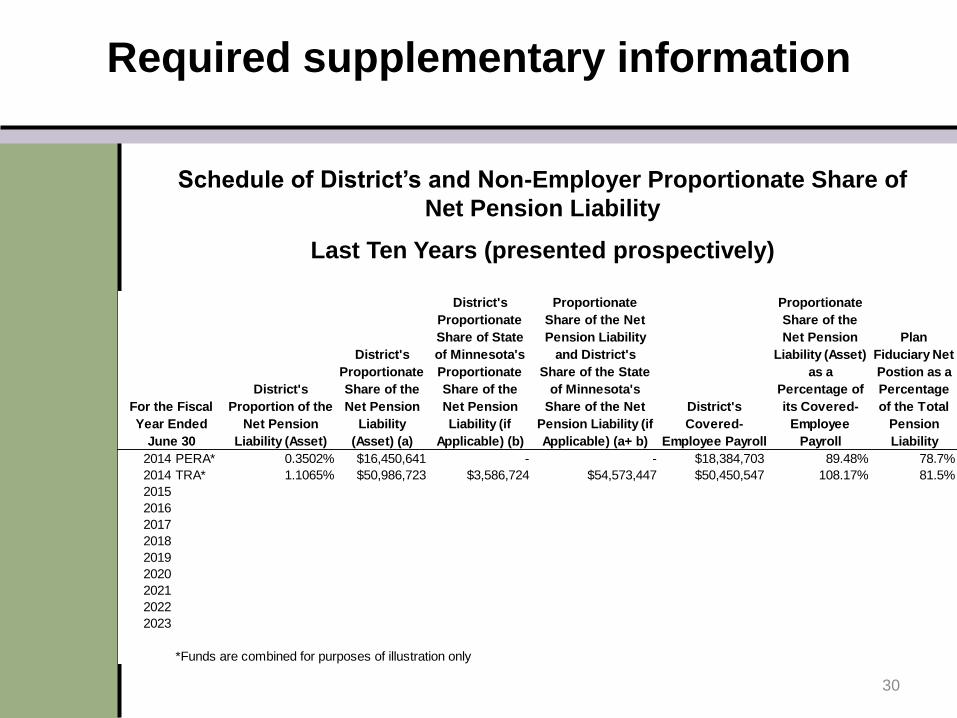
Schedule of District’s and Non-Employer Proportionate Share of
Net Pension Liability
Last Ten Years (presented prospectively)
30
Required supplementary information
District's
Proportion of the
Net Pension
Liability (Asset)
District's
Proportionate
Share of the
Net Pension
Liability
(Asset) (a)
District's
Proportionate
Share of State
of Minnesota's
Proportionate
Share of the
Net Pension
Liability (if
Applicable) (b)
District's
Proportionate
Share of the Net
Pension Liability
and District's
Share of the State
of Minnesota's
Share of the Net
Pension Liability (if
Applicable) (a+ b)
District's
Covered-
Employee Payroll
District's
Proportionate
Share of the
Net Pension
Liability (Asset)
as a
Percentage of
its Covered-
Employee
Payroll
Plan
Fiduciary Net
Postion as a
Percentage
of the Total
Pension
Liability
2014 PERA* 0.3502% $16,450,641 - - $18,384,703 89.48% 78.7%
2014 TRA* 1.1065% $50,986,723 $3,586,724 $54,573,447 $50,450,547 108.17% 81.5%
2015
2016
2017
2018
2019
2020
2021
2022
2023
*Funds are combined for purposes of illustration only
For the Fiscal
Year Ended
June 30

Legislative Auditor’s Office (plan financial statement auditor)
decided not to audit the GASB 68 pension allocation schedules Plan auditor is still responsible for the plan net pension liability disclosed in plan
footnotes
Plan auditor hired Milliman to review PERA’s and TRA’s GASB 68 actuarial
valuations
PERA contracted with Abdo, Eick, and Meyers, LLP and TRA
contracted with Office of the State Auditor to audit and provide
opinions on both pension allocation schedules
Stay for the next session (Auditor Perspective on Pension
Accounting) for further details.
31
Audit issues

Census data
PERA and TRA annually compile a data file of demographic and
payroll information about all members, active and retired.
Source file for the annual actuarial valuation supporting GASB 67-68
reporting.
AICPA White Paper examples of census data include date of birth
(employee and spouse), years of service, marital status, eligible
compensation, gender, date of retirement, class of employee,
employment status
32
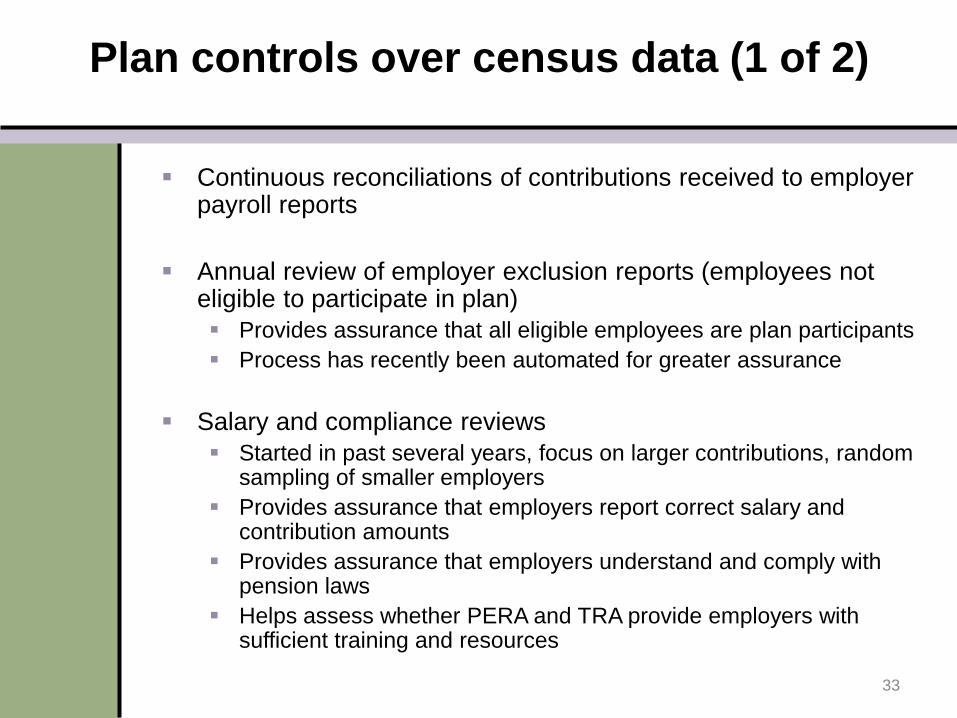
Continuous reconciliations of contributions received to employer payroll reports
Annual review of employer exclusion reports (employees not eligible to participate in plan)
Provides assurance that all eligible employees are plan participants
Process has recently been automated for greater assurance
Salary and compliance reviews
Started in past several years, focus on larger contributions, random sampling of smaller employers
Provides assurance that employers report correct salary and contribution amounts
Provides assurance that employers understand and comply with pension laws
Helps assess whether PERA and TRA provide employers with sufficient training and resources
33
Plan controls over census data (1 of 2)

Detailed questionnaire used to collect facts about entity
Employer education
Online and live group employer presentations
Employer manual
Employer newsletters and brochures
Annual statements mailed to members
Upon retirement, notarized signatures of member, spouse, proof of
age, termination verification form from employer, proof of name
change
TRA internal audit compliance reviews
34
Plan controls over census data (2 of 2)
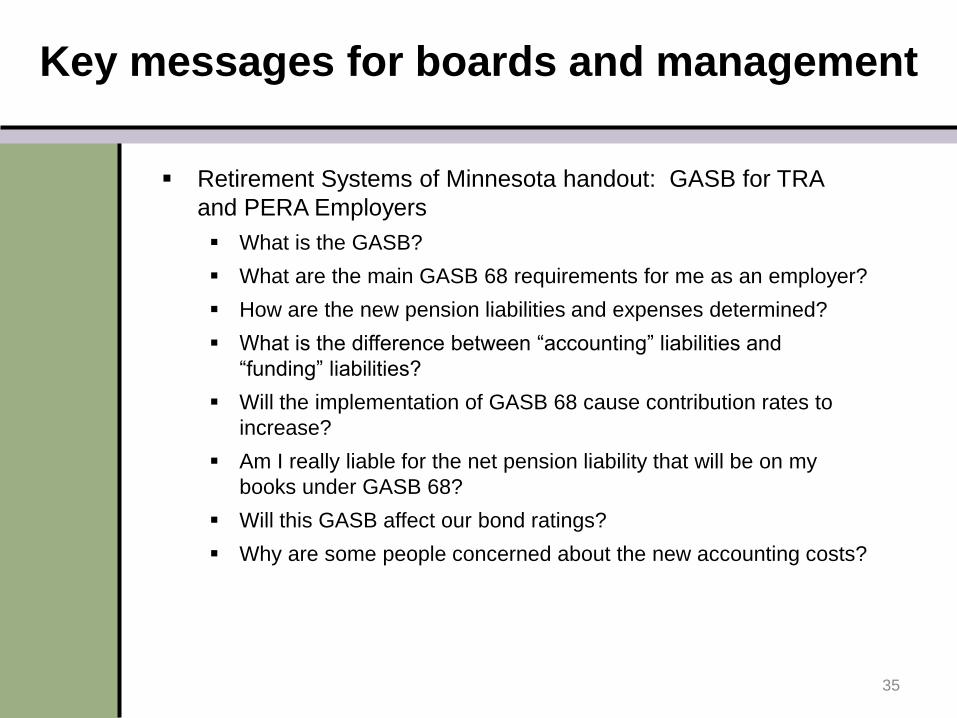
Key messages for boards and management
Retirement Systems of Minnesota handout: GASB for TRA
and PERA Employers
What is the GASB?
What are the main GASB 68 requirements for me as an employer?
How are the new pension liabilities and expenses determined?
What is the difference between ―accounting‖ liabilities and
―funding‖ liabilities?
Will the implementation of GASB 68 cause contribution rates to
increase?
Am I really liable for the net pension liability that will be on my
books under GASB 68?
Will this GASB affect our bond ratings?
Why are some people concerned about the new accounting costs?
35

36
PERA has posted audited GASB 68 information on its website.
TRA has posted individual employer reports available on its
secure employer web portal.
Independent Auditor’s Report
Schedule of Employer Allocations
Schedule of Pension Amounts by Employer
Auditor only takes responsibility for ―the total for all entities‖ of
specific columns (excludes individual employer totals, specific
types of deferred inflows/outflows, and NPL +/- 1 % sensitivity
analysis)
Notes to the pension schedules
Templates of pension footnotes for employers (unaudited)
Summary

37
• GFOA - GAAFR Blue Book (electronic copy) current through
GASB Statement 70
• Journal entries
• GAAFR Newsletter (March 2015) GASB 68 Employer
Journal Entries
• GASB 68 Implementation Guide illustrations 3 & 4
• GASB website – GASB 68 Toolkit for Employers
• ―Making the GASB Numbers Our Own,‖ GFOA Government
Finance Review of August 2014
Good Resources

38
Visit the ―Employer‖ tab on PERA’s and TRA’s websites.
www.mnpera.org (click on GASB 68 Pension Accounting
Standards)
www.minnesotatra.org/employerinfo/gasb
You’ll find:
Links to GASB publications
Links to AICPA audit guidance
Toolkit of informational guides/articles
Frequently asked questions
News and developments on implementation
Questions? E-mail Jim Riebe (PERA) [email protected] or
John Wicklund (TRA) [email protected].
PERA & TRA resources