putting performance measurement tools to work at...
TRANSCRIPT
8/28/2012
1
Putting Performance Measurement Tools to
Work at Maple Leaf Foods
Making Metrics MatterAugust 29, 2012 ASSE Virtual Symposium
Bob FrankDirector, Safety & Risk Management
Maple Leaf Foods USA
1
Session Objectives
1. Overview of Maple Leaf Foods ◦ Company Overview◦ Past Safety Performance
2. Polling Results3. Performance Tools◦ Safety Balanced Scorecard◦ Safety Business Plan◦ Supervisor Scorecard◦ Manufacturing Excellence
4. Current Performance5. Final Thoughts
2
Maple Leaf Foods
Maple Leaf Foods is one of Canada’s leading consumer packaged food companies, specializing in fresh and prepared meats, meals and bakery products. We have three of the top 20 Canadian retail brands as well as leading market positions in North American frozen par-baked bread and specialty bakery products in the United Kingdom.
3

8/28/2012
2
Maple Leaf Foods Breakdown
66%
29%5%
ProteinBakeryAgribusiness
4
Bakery Products Group•Fresh breads, rolls, ethnic breads
•Bagels, croissants, morning goods
•Premium artisan breads
•Frozen partially & fully baked goods
•Fresh pasta and sauces
Meat Products Group•Processed meats
•Chilled and frozen ready-to-cook products
•Chilled ready-to-serve products
•Value-added fresh pork, poultry and turkey products
Agribusiness Group•Rendering operations
•Biodiesel production
•Hog production
Total Company Sales: $5.2 billionSales by Group:
Frozen Bakery Business Unit
5
Maple Leaf Foods Safety PerformanceTRIR 2003 - 2006
6
8/28/2012
3
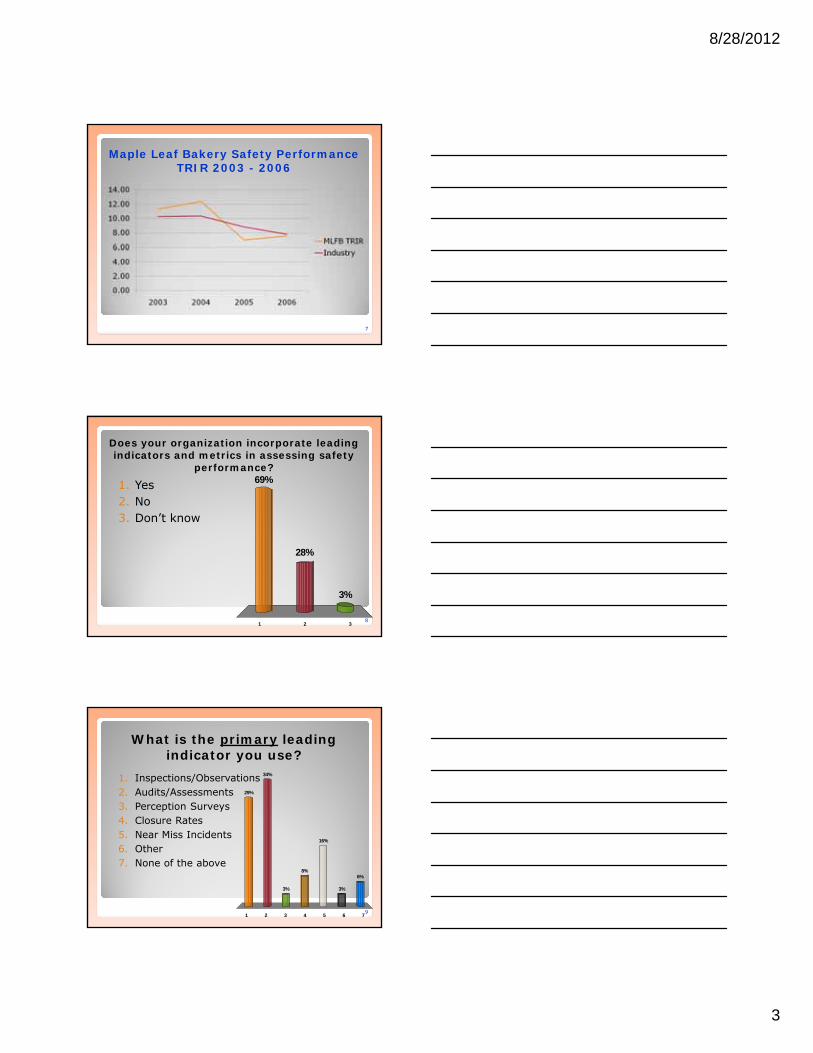
Maple Leaf Bakery Safety PerformanceTRIR 2003 - 2006
7
Does your organization incorporate leading indicators and metrics in assessing safety
performance?
81 2 3
69%
3%
28%
1. Yes2. No3. Don’t know
What is the primary leading indicator you use?
91 2 3 4 5 6 7
29%
34%
3%
6%
3%
16%
8%
1. Inspections/Observations2. Audits/Assessments3. Perception Surveys4. Closure Rates5. Near Miss Incidents6. Other7. None of the above

8/28/2012
4
For those organizations that incorporate leading metrics as a measure of safety
performance, are you able to demonstrate an improvement in lagging indicators?
101 2 3 4
39%
16%16%
29%1. Yes2. No3. Don’t know4. Don’t use
leading metrics
Does your organization hold supervisors and managers accountable for completing
specific safety related tasks?
111 2
50%50%
1. Yes2. No
If so, what is the primary driver of “accountability”?
121 2 3 4 5
28%
9%
28%
11%
24%
1. Performance appraisal process
2. Bonus compensation3. Expectation4. Still working on it5. Not Applicable

8/28/2012
5
Maple Leaf’s Commitment to Safety
Safe Food Produced In A Safe Environment; No One Gets Hurt!
13
14
Measures Medical Aid Rate
LTA Rate
15
SAFETY BALANCED SCORECARD
2007
Trailing Leading
Supv. Safety Scorecard
66% 34%
2008 Measures Medical Aid Rate
LTA Rate
Supv. Safety Scorecard
Safety Business Plan
Trailing 50% Leading50%
2012Measures Medical
Aid RateDART Rate
Supv. Safety
Scorecard
Safety Business Plan
Job Safety Chapter
Trailing 40% Leading60%

8/28/2012
6
Measures
Total Reportable Freq Rate
DART rate
(severity)
Supv. Safety Scorecard
Safety Business Plan
Job Safety Chapter
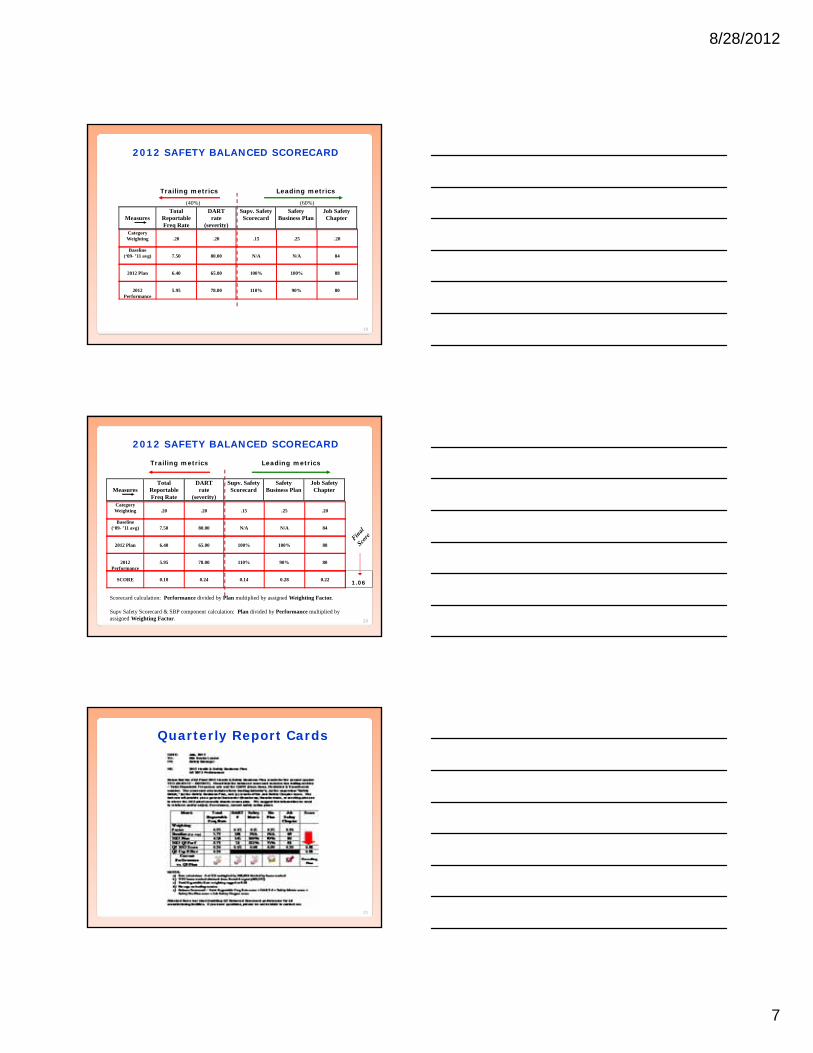
2012 SAFETY BALANCED SCORECARD
Trailing metrics Leading metrics
(40%) (60%)
Category Weighting .20 .20 .15 .25 .20
16
Measures
Total Reportable Freq Rate
DART rate
(severity)
Supv. Safety Scorecard
Safety Business Plan
Job Safety Chapter
2012 SAFETY BALANCED SCORECARD
Trailing metrics Leading metrics
(40%) (60%)
Category Weighting .20 .20 .15 .25 .20
Baseline(‘09- ’11 avg) 7.50 80.00 N/A N/A 84%
17
Measures
Total Reportable Freq Rate
DART rate
(severity)
Supv. Safety Scorecard
Safety Business Plan
Job Safety Chapter
2012 SAFETY BALANCED SCORECARD
Trailing metrics Leading metrics
(40%) (60%)
Category Weighting .20 .20 .15 .25 .20
Baseline(‘09- ’11 avg) 7.50 80.00 N/A N/A 84%
2012 Plan 6.40 65.00 100% 100% 88%
18
8/28/2012
7
Measures
Total Reportable Freq Rate
DART rate
(severity)
Supv. Safety Scorecard
Safety Business Plan
Job Safety Chapter
2012 SAFETY BALANCED SCORECARD
Trailing metrics Leading metrics
(40%) (60%)
Category Weighting .20 .20 .15 .25 .20
Baseline(‘09- ’11 avg) 7.50 80.00 N/A N/A 84
2012 Plan 6.40 65.00 100% 100% 88
2012 Performance
5.95 78.00 110% 90% 80
19
Measures
Total Reportable Freq Rate
DART rate
(severity)
Supv. Safety Scorecard
Safety Business Plan
Job Safety Chapter
2012 SAFETY BALANCED SCORECARD
Trailing metrics Leading metrics
Category Weighting .20 .20 .15 .25 .20
Baseline(‘09- ’11 avg) 7.50 80.00 N/A N/A 84
2012 Plan 6.40 65.00 100% 100% 88
2012 Performance
5.95 78.00 110% 90% 80
SCORE 0.18 0.24 0.14 0.28 0.22
Scorecard calculation: Performance divided by Plan multiplied by assigned Weighting Factor.
Supv Safety Scorecard & SBP component calculation: Plan divided by Performance multiplied by assigned Weighting Factor.
1.06
20
Quarterly Report Cards
21

8/28/2012
8
22
Metrics
Total Occ. Accidents
Work Comp Cost/Hr
# of Near Misses
Reported
Safety Assessment Conducted
Closure Rate
# of JSA’s Reviewed
# of Front Line Leader One-on-One’s
Category Weighting
.15
.15
.05
.20
.20
.10
.15
As Process Matures . . .Increase Transition to Leading Metrics
Trailing metrics Leading metrics
(30%) (70%)
Leading Metric – Safety Business Plan
Plant: ________________ Date: ______________
Activity Action Steps Completion Date Responsibility Score
(1) Reduce Ergonomic Risk
(2) Walking/Working Surfaces
(3) Leadership Training
(4) LOCAL ACTIVITY #1:
(5) LOCAL ACTIVITY #2:
(6) LOCAL ACTIVITY #3:
SCORE TOTAL:
Prepared by:_______________________________ Date:_________________ Approved by Plant Mgr.:_________________________ Date:_________________
23
Supervisor’s Safety Scorecard
24

8/28/2012
9
Leading Metric – Supv Scorecard
Examples of 20 Activities We Measure:Near Miss incidents reported & investigatedClosure on accident investigation reportsDaily shift safety auditsPre-operational inspectionsSafety Work Orders (prioritized by Risk Grid)JHSC Meetings (schedule, attendance, closure rates, communications)
Safety Crew TalksContractor Observations
25
Job Safety Chapter SummaryEXCELLENT ABOVE AVG AVG BELOW AVG NEEDS IMP
4.5 - 5.0 3.5 - 4.4 2.5 - 3.4 1.5 - 2.4 0 - 1.4Sub Elements
LEADERSHIP 1.01.00 Leadership Structure 4.41.02.00 OHS Resources 3.31.03.00 Management Meetings 4.3
TRAINING 2.01.00 New Employee Orientation 4.02.02.00 Employee Training 3.42.03.00 Leadership training - Site Leadership Team 1.6
HAZARD MGT. 3.01.00 Hazard Identification & Response Systems 3.43.02.00 Monthly Plant Inspections 3.73.03.00 Specific Inspections 4.03.04.00 Operator inspections 4.03.05.00 Safety Rules 4.3
TASKS 4.01.00 Task Inventory & Risk Assessment 3.44.02.00 Lock out tag out 3.64.03.00 Confined Space Entry 3.64.04.00 Hot work 3.14.05.00 Working at Heights 2.44.06.00 Standard Operating Procedures 4.34.07.00 Task Observations 2.3
ACCIDENT INVEST 5.01.00 Accident & Incident Investigations 4.9EMERGENCY 6.01.00 Emergency Preparedness & Response Plan 4.6
6.02.00 Emergency Preparedness & Response Procedures 4.1COMMUNICATIONS7.01.00 Joint OHS Committee 4.4
7.02.00 Safety Talks 3.37.03.00 OHS Communications 3.97.04.00 OHS Recognition 3.4
OCC HEALTH 8.01.00 First Aid/CPR 3.78.02.00 Chemical & Hazardous Substances 4.38.03.00 Exposure Monitoring & Control Plan for Chemical, Biological and Physical Hazards 3.6
ENGINEERING 9.01.00 Safeguarding 3.19.02.00 Capital Expenditure Requests 3.69.03.00 Contractor management process 3.69.04.00 Service providers 3.7
26
Risk Assessment Grid
27

8/28/2012
10
Six Sigma @ The Edge
28
How the company listens to the voice of the front-line employee
Improved communication (daily pre-shift meetings by Workgroups)
Management and employees Everyone getsManagement and supervisors the same Supervisors and employees information!Employee to employee
Improved job knowledge (ID the issue, track the issue, propose a project to correct it)
A cleaner, safer, more organized place to work! Less Injuries!!
Instills a sense of pride in what you do!
Consists of ~8 hourly ee’s led by supervisor
S&H Leading IndicatorsEmployees trained in CPR/FA
Number (or %) of managers trained in Safety & Health Leadership
Incident investigations completed within prescribed timeframe
Wellness program participation rates
Resolution of ee suggestions/complaints
Avg. age of outstanding recommendations
EE perception surveys
Percent of internal inspections conducted as scheduled
Number of sr. leadership meetings with safety included on the agenda
Number of safe acts, near misses reported or recognized
Leading Metric: Percent SafeBehaviors
ObservationsSafe At-Risk % Safes Sample
Operator’s driver license displayed above the waist
48 9 84% 57
Forks 6” or less from ground when traveling
24 4 86% 28
Seat belt worn during forklift operation 51 18 74% 69
Sounds horn when exiting trailer 18 4 82% 22
Sets parking brake, puts forks to floor, puts gear in neutral, and shuts off when leaving forklift unattended
30 5 86% 35
Uses approved lift cage when elevating ee’s to high racks
12 2 86% 14

8/28/2012
11
Recommended Approach to Safety Performance Metrics
Organization Level # of Metrics Metric Balance
Corporate 5 to 8 20% Leading80% Lagging
Division 12 to 15 50% Leading50% Lagging
Location 50 to 60 80% Leading20% Lagging
Rewards For Excellence Program
VP Reg'lDirectors
Plant Mgr
Production Mgr
Maintenance Manager
QA Manager
PltSupv’s
Min Target Max
Direct Costs 15 15 15 15 15 10 15 101 100 99
OH Spend 15 10 15 15 10 10 10 105 100 95
Total Downtime % 5 10 10 10 110 Budget 90
Health and Safety 20 20 20 20 20 20 20 1.10 1.00 0.90
QA Conformance 20 15 15 20 15 20 15 10 15 20
Schedule Compliance 15 20 20 15 15 10 10 85 90 95
Six Sigma 15 20 10 5 5 10Scorecard and Plant
Specific/TBD
Other 10 20 20Scorecard and Plant
Specific/TBD
Illustration Only32
33
Linking Safety Baln Score WithOther Initiatives
Corporate Safety Award Programs
At MLFB, 4 Award Programs:1. Best Performance2. Most Improved3. Distinguished Achievement4. MLFB Annual Safety Performance Award

8/28/2012
12
34
Linking Safety Baln Score WithOther Initiatives
Corporate Safety Award Programs
Best Performance & Most Improved◦ 25% Lagging Metric (TRIR)◦ 25% Accident Cost (Total Incurred + Other)◦ 50% Balanced Scorecard Score
MLFB Annual Safety Performance Award◦ SBS Score of 1.00 or below◦ Meeting majority of site safety action plans◦ $10,000 stipend
Control Chart: 2007 – 2011
35
0.00
1.00
2.00
3.00
4.00
5.00
6.00
7.00
8.00
2007 2008 2009 2010 2011 2012 P6
MLFB TRIRIndustry
Maple Leaf Bakery Safety PerformanceTRIR 2007 – 2012 YTD
36

8/28/2012
13
0
2
4
6
8
10
12
14
2003 2004 2005 2006 2007 2008 2009 2010 2011 2012
MLFB TRIRIndustry
Maple Leaf Bakery Safety PerformanceTRIR 2003 – 2012 YTD
37
Beginning of shift to leading indicators
0
5
10
15
20
25
2003 2004 2005 2006 2007 2008 2009 2010 2011
MLF TRIR
Industry
Beginning of shift to leading indicators
Maple Leaf Foods Safety PerformanceTRIR 2003 - 2011
38
Maple Leaf Foods
Lost Time Incident Rates
39

8/28/2012
14
Lost Time Accident Severity
The actual severity of lost time injuries, as measured by “days away from work”, has declined past two years. Contributing factors:• Safety investments and program initiatives (e.g. ergonomics),• Aggressive return-to-work and claims management practices,•Site Leadership expectations and accountabilities (Zero Tolerance, Safe Work Practices, Audits).OPPORTUNITY
Timely reportingReduced attorney involvement
(U.S.)
*# days lost x 200,000/hrs worked
40
Collective (United Sates, Canada) workers’ compensation rates per $100 payroll has declined 25% since 2006:◦ 2006 = $3.18/$100◦ 2010 = $2.37/$100
Within the U.S. improved loss experience paved the way for a 44% reduction in fixed premium costs per $100 payroll:◦ 2006 = $1.059◦ 2011 = $0.5890
We have been able to reduce our required letters of credit (collateral) by $1,125,000.
Canadian NEER, COR and Safety Group insurance rebates totaling in excess of $1,000,000
41
Financial Impact
Workers Compensation Rates per $100 Payroll
42
8/28/2012
15
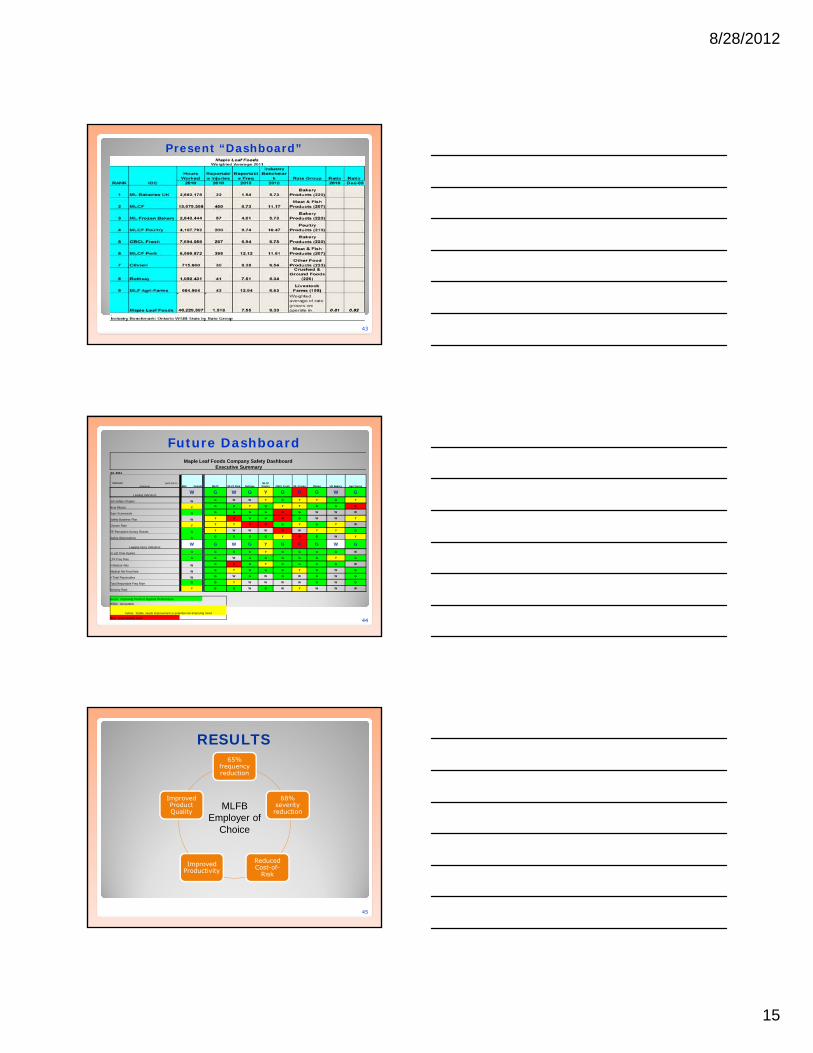
Present “Dashboard”
43
Future DashboardMaple Leaf Foods Company Safety Dashboard
Executive SummaryQ2, 2011
Indicator (with link to definition) MLF Overall MLCF MLCF Pork Rothsay
MLCF Poultry CBCL Fresh ML Frozen Olivieri UK Bakery Agri Farms
Leading IndicatorsW G W G Y G R G W G
Job Safety Chapter W G W W Y G Y Y G Y
Near Misses Y G G Y G Y Y G G R
Supv Scorecards G G G G G R G W W W
Safety Business Plan W Y R G G R G W W Y
Closure Rate Y Y Y R R G Y G Y W
EE Perception Survey Results G Y W W W R W Y Y G
Safety Observations G G G G G Y R G W Y
Lagging Injury IndicatorsW G W G Y G R G W G
# Lost Time Injuries G G G G Y G G G G W
LTA Freq Rate G G W G G G G G Y G
# Medical Aids W G R G Y G G G G W
Medical Aid Freq Rate W G Y G G G Y G W G
# Total Reportables W G W G W G W G W G
Total Reportable Freq Rate G G Y W W W W G W G
Severity Rate Y G G W G W Y W W W
Green: Improving Trend or Superior PerformanceWhite: Acceptable
Yellow: Stable, needs improvement or potential non-improving trend
Red: Unacceptable level 44
RESULTS
45
65% frequency reduction
68% severity
reduction
Reduced Cost-of-
RiskImproved
Productivity
Improved Product Quality
MLFB Employer of
Choice
8/28/2012
16
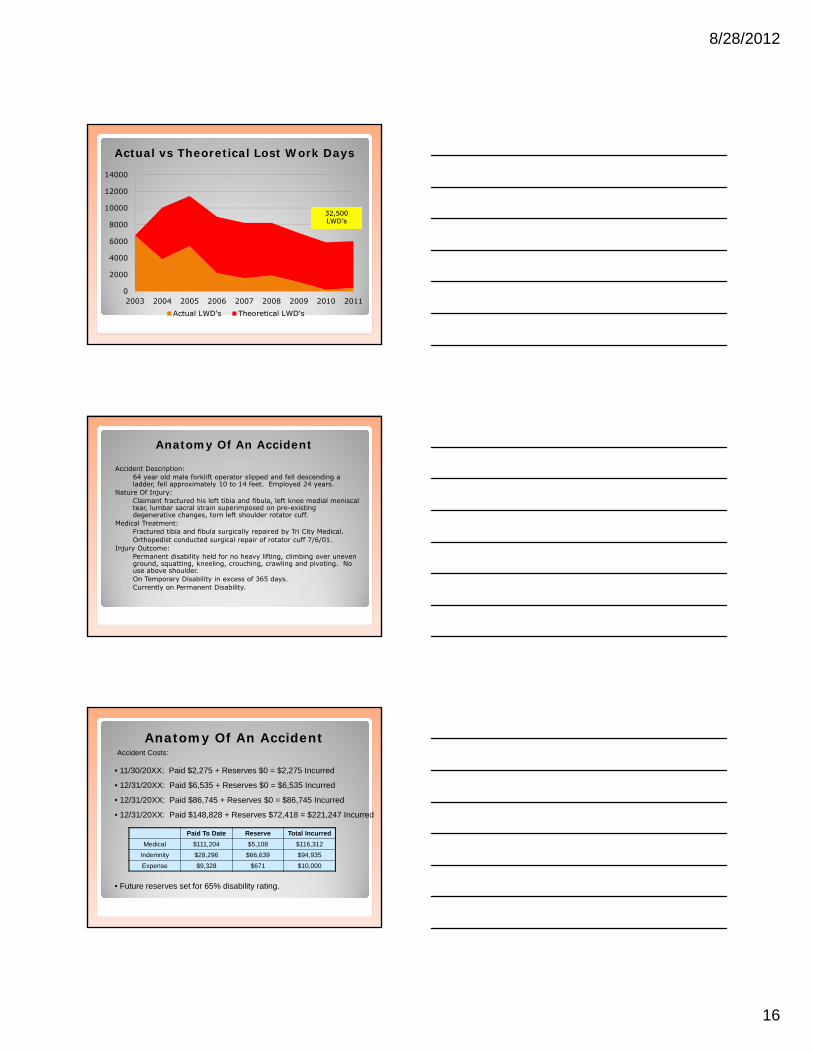
Actual vs Theoretical Lost Work Days
0
2000
4000
6000
8000
10000
12000
14000
2003 2004 2005 2006 2007 2008 2009 2010 2011Actual LWD's Theoretical LWD's
32,500 LWD’s32,500 LWD’s
Anatomy Of An Accident
Accident Description:◦ 64 year old male forklift operator slipped and fell descending a
ladder, fell approximately 10 to 14 feet. Employed 24 years.Nature Of Injury:
◦ Claimant fractured his left tibia and fibula, left knee medial meniscaltear, lumbar sacral strain superimposed on pre-existing degenerative changes, torn left shoulder rotator cuff.
Medical Treatment:◦ Fractured tibia and fibula surgically repaired by Tri City Medical.◦ Orthopedist conducted surgical repair of rotator cuff 7/6/01.
Injury Outcome:◦ Permanent disability held for no heavy lifting, climbing over uneven
ground, squatting, kneeling, crouching, crawling and pivoting. No use above shoulder.
◦ On Temporary Disability in excess of 365 days.◦ Currently on Permanent Disability.
Anatomy Of An Accident
Paid To Date Reserve Total IncurredMedical $111,204 $5,108 $116,312
Indemnity $28,296 $66,639 $94,935Expense $9,328 $671 $10,000
Accident Costs:
• 12/31/20XX: Paid $6,535 + Reserves $0 = $6,535 Incurred
• 12/31/20XX: Paid $86,745 + Reserves $0 = $86,745 Incurred
• 12/31/20XX: Paid $148,828 + Reserves $72,418 = $221,247 Incurred
• Future reserves set for 65% disability rating.
• 11/30/20XX: Paid $2,275 + Reserves $0 = $2,275 Incurred

8/28/2012
17
Additional Sales Needed To Offset Accident Costs Based on Company Gross Margins
Accident
C os ts
1%
G ros s Margin
5%
G ros s Margin
14.8% G ros s
Margin $ 1,000 $ 100,000 $ 20,000 $ 6,700
$ 5,000 $ 500,000 $ 100,000 $ 33,300
$ 10,000 $ 1,000,000 $ 200,000 $ 66,700
$ 25,000 $ 2,500,000 $ 500,000 $ 166,700
$ 100,000 $ 10,000,000 $ 2,000,000 $ 666,700
Sales Perspective:$221,000 Fall Accident
Sell the equivalent of $1,500,000 of a basic salad product to recoup the lost gross margin of this workplace incident.
Find a new customer the size of American XYZ Company who generated $1,500,000 in total sales (#12 in our Food Service channel).
Manufacturing Perspective:$221,000 Fall Accident
XYZ Plant cost to produce and distribute customer product = $0.252/lb.877,000 lbs production needed to recoup DIRECTcost of this incident.
Approx 2 ½ days of production
3,500,000 lbs production needed to recoup INDIRECT cost of this incident.
Approx 9 days of production3.1% of total annual production

8/28/2012
18
What you measure drives behaviorFocus on managing what is important, not what is easiest to measureAttempt to tie in Financial Indicators (i.e workers comp $$, direct & indirect costs)Metrics (leading & lagging) can be difficult to collect, they can be time consuming, inflexible and may present significant change management issues!
Real Drivers of Safety Performance
52
BARRIERSSystems to collect data are problematic◦ Including data validationRestructuring/Reorganization – baselines keep movingReporting Level: How senior?◦ (level of understanding of EHS)Difficult to roll-up due to diversity of operationsDesire to use as a metric for performance –makes them subject to gamingNot supported by senior leadershipExtra work, confusing, subjective
53
ConclusionHealth & Safety Performance Metrics are Evolving◦ Going beyond incidents◦ Integrating risk assessment and control
methodologies“Next Level” Performance Metrics complement, and do not replace, outcome (lagging) measures.◦ Focus on how well key elements of our OHS
Management System (Job Safety Chapter) are performing.
“The mix of an organization’s performance indicators tends to reflect the maturity of its EHS process.”
Grace Weaver, Strategic Environmental Management, 1996
54

8/28/2012
19
Sources of InformationCommonwealth of Australia (Dept of Employment and Workplace Relations), 2005 “Guidance on the Use of Positive Performance Indicators to Improve Workplace Health & Safety”http://www.safeworkaustralia.gov.au/NR/rdonlyres/596857A7-6390-4263-8915-4689221D01DD/0/ASCCPPIGuidanceBooklet.pdf
Health and Safety Executive (United Kingdom), 2001 “A Guide to Measuring Health & Safety Performance”http://www.hse.gov.uk/opsunit/perfmeas.pdf
“Far better an approximate answer to the right question which may be difficult to frame . . .
. . . than an exact answer to the wrong question which is always easy to ask.”
John W. Tukey, Statistician
55
Thank You!
847-655-8140
56