put regional district me of nanaimo · manually or mechanically using trommel screens with knives....
TRANSCRIPT
put REGIONALile DISTRICT"me OF NANAIMO
STAFF REPORT
TO: Daniel Pearce DATE: May 21, 2015A/General Manager, Transportation &Solid Waste Services MEETING: RSWAC, May 28, 2015
FROM: Sharon Horsburgh FILE: 5365-00Senior Solid Waste Planner
SUBJECT: An Overview of Multi Material Recycling Facility Technologies
RECOMMENDATION
That the Regional Solid Waste Advisory Committee (RSWAC) receive this report for information as part ofthe 2015 Solid Waste Management Plan Review Process.
PURPOSE
To provide background information on Multi-Material Recycling facilities that is intended to stimulatediscussion on future options for consideration during the Solid Waste Management Plan Review Process.
BACKGROUND
Materials Recovery Facility Processes
Materials Recovery Facilities (MRFs) provide an intermediary or pretreatment approach involving themanual and mechanical separation of a Municipal Solid Waste (MSW) feedstock into recyclable and non-recyclable materials streams. There are two distinct types of MRF's which are typically referred to as"clean" or "dirty" MRF processes.
"Clean" MRFs
The most common type of MRF are "clean MFRs" that provide sorting and processing function for clean,dry, commingled recyclable materials (excluding putrescible and green wastes) derived from sourceseparated collection programs.
"Dirty" MRF's
Dirty MRF's tend to handle single stream materials that require processes to provide a sorting functionfor mixed MSW feedstocks (including putrescible and organic wastes). Some dirty MRF's process residualwaste exclusively to provide energy and fuel sources for other waste disposal treatments. Generally,dirty MRFs are tooled to exclusively recover dry recyclables, with the wet residue and non-recyclablesdestined for landfill or as feedstock for incinerators/advanced thermal treatment processes. According toresearch this type of system achieves at best 50 per cent recovery of material for recycling and theresidual is either landfilled or used as fuel waste to energy facilities.
rMRF processes involve a number of stages, including removal and processing of large bulky items,manual and automated sorting of recyclables, and organics screening. Bagged waste may be openedmanually or mechanically using trommel screens with knives. Typical MRF equipment used to recoverrecyclables includes conveyors, screens, magnets and eddy current separators, shredders, crushers andbailers.
File: 5365-00Date: May 21, 2015Page: 2
Collection Methods
Over the last 20 to 30 years the basic MRF, along with collection systems, has been rapidly changing.Collection systems have evolved from the multi-bin/truck-side sort method to dual-stream (termedcommingled), to wet/dry collection systems where the wet fraction is organic waste such as food wasteand yard waste; soiled paper, foil, plastic, and other materials; diapers and the dry fraction consisting ofrecyclables and non-recyclables.
Curbside collection options include: single stream collection (fully commingled); two stream collection(partially commingled); multi-stream collection (segregated); and Co-collection. This approach isessentially the simultaneous collection of two or more material streams (e.g., recyclables and garbage, orrecyclables and organics) with one vehicle. Co-collection may provide improved efficiency over operatingtwo (or more) collection vehicles on the same route. Single stream recycling is where all recyclablematerials are collected co-mingled in a single container.
More recently, there has been a shift by some communities to move to automated collection which hasled to single-stream processing. One disadvantage is that the high equipment costs of MRF's for thepaper/container auto-sort machines, contaminated materials, and the reluctance by industry to changecollection methods. In the Regional District of Nanaimo (RDN) we have a five year contract withProgressive Waste Solutions who purchased new split packer collection trucks at the beginning of thecurbside collection contract. Examples of collection trucks are included in Appendix 1.
For curbside collection the level of commingling at the curb influences the types of material collected,types of trucks used, and the design of the processing facility. Decision makers must decide whether toinvest more effort in the collection system (maximum source segregation/minimal sorting) or inprocessing (commingled collection/maximum processing). Collection costs are typically higher with moredetailed material separation curbside, but processing costs can be lower. When material is commingledcurbside, collection costs are lower, but processing costs can be higher. Collection and processing costsneed to be combined to assess the most cost-effective system.
On Vancouver Island, single family recycling programs tend to offer curbside collection programs thatsource separate recyclables, garbage and increasingly food waste. Recyclable materials from theseprograms are shipped to clean MRFs, organics are sent to composting facilities, and residual in the formof garbage is landfilled.
Types of Material Recovery Facilities
There have been MRF's operating at a commercial scale in North America for a number of years. Thereare numerous clean MRFs located in the Lower Mainland. Green by Nature recently opened a state-of-the-art MRF facility to handle containers collected through Multi-Material BC (MMBC). In Nanaimo, thereare three clean MRFs that process primarily source separated recyclables from the residential sector,multi-family and the Industrial, Commercial and Institutional (ICI) sector.
Many of the dirty MRF facilities are being modernized to handle "mixed waste". Advanced technology isemployed to "break open the bag" and extract recyclables and this requires less manual labour. Newermodern facilities are safer and offer more efficient processes to recover material from the waste streamcompared to their low-tech predecessors. Many of the innovations and improvements have evolvedfrom the processing of source separated recyclables. These modern facilities are employed in a growingnumber of cities across the United States to extract recyclables left in the waste stream. Advancedtechnology designed to maximize recovery includes screening equipment, air separators, opticaltechnology, magnets, eddy current separators and manual quality controls.
File: 5365-00Date: May 21, 2015Page: 3
NextUse, owned by Belkorp Environmental Services Ltd., proposes to build a mixed waste processingfacility in Coquitlam that would have the technological ability to employ the "break the bag" technique.This facility is awaiting licensing approval from Metro Vancouver under Bylaw 181. This would be the firstMRF of its kind in British Columbia.
Single-stream MRFs for recycling have evolved and are the most common technology in North America.This MRF system is very convenient as it can handle a variety of collection methods. MRF's can rangefrom low technology with mostly manual sorts to highly technological sort lines with almost no humanhands touching the material. Advances in MRF technologies include; paper screening from containers,acceptance of eddy current magnets, and optical and near-infrared sorting units. Modern single-streamMRFs automatically sort by paper grade or container type/color/resin, with quality and speeds far greaterthan human sorters can achieve. Although these advanced sort units can be expensive, especially if usedin tandem for multiple sorts, they are still less expensive per unit than the initial equipment used 20 yearsago.
MRFs sorting through pure MSW are still utilized in several places. In this process, no MSW collectionchanges need to be made, but, on the processing side, dirty MRFs require lots of equipment and sortersto handle volume to reduce contamination. The dirty MRF requires good equipment, skilled operators,and extensive maintenance programs, plus an understanding of the end markets for the lower-qualitysorted materials. One benefit of the dirty MRF is that the technology will most likely serve well inprepping material for waste to energy facilities.
Current Flow of Recyclables in the RDN
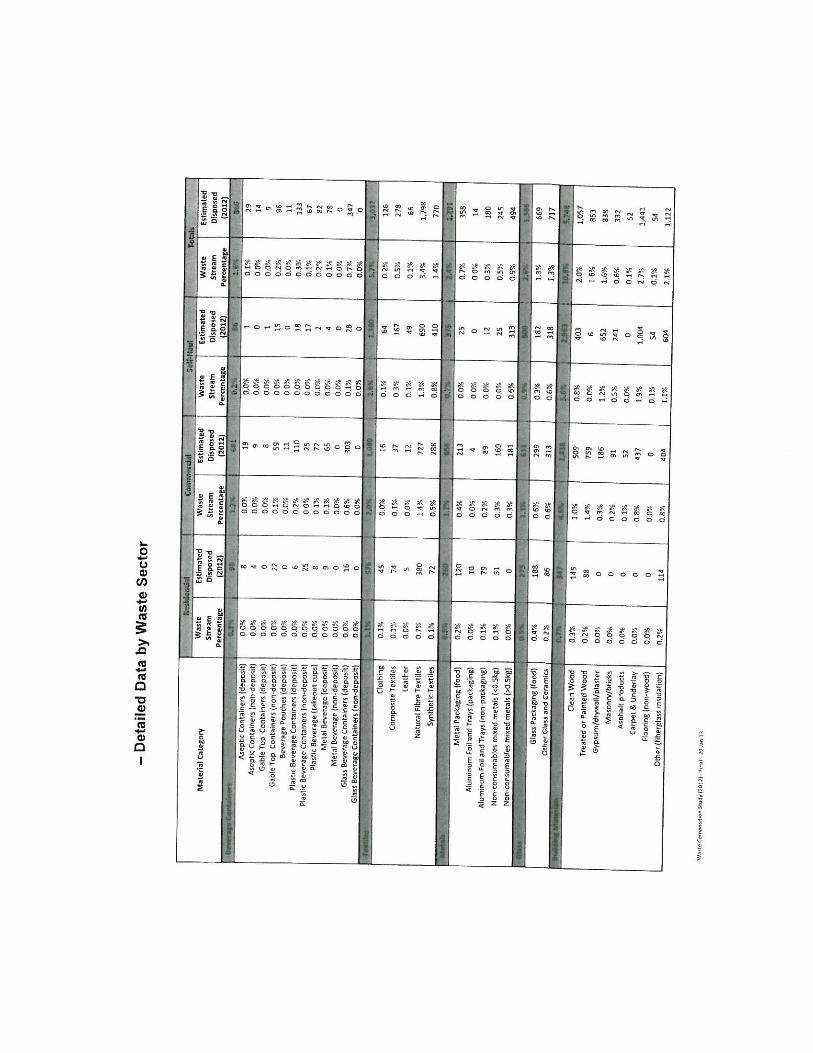
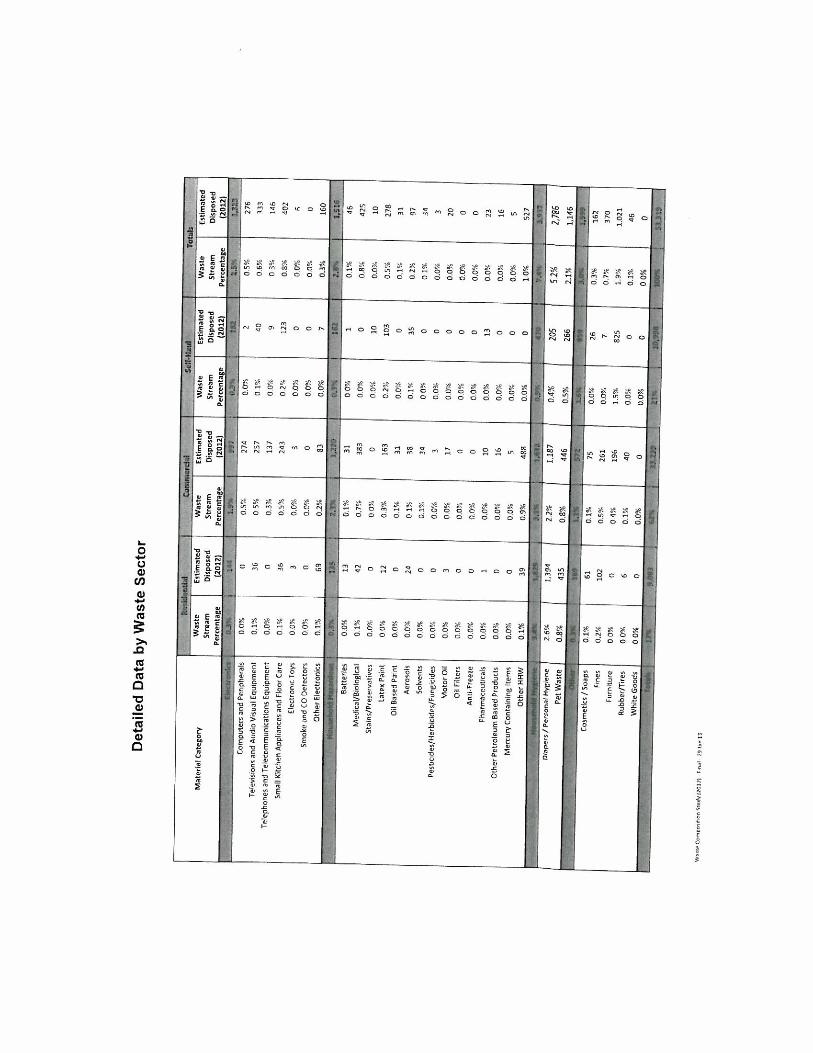
Annually the RDN receives approximately 50,000 metric tonnes of MSW. The RDN's 2012 WasteComposition Study indicated the types of materials being landfilled. To illustrate the volume of waste bycategory, please see Appendix 2. This will highlight the volume of materials that could potentially berecovered.
The RSWAC has identified a MRF as a potential option to manage the RDN's waste stream. The followingpoints should be given consideration as part of any future research:
1. Currently, the RDN and the City of Nanaimo does not control ownership of curbside recyclablematerials. This transfer of ownership is a result of the Provincial recycling regulation thatrequires printed paper and packaging to be managed by MMBC that is an industry stewardshipprogram. Curbside collectors such as the City of Nanaimo and the Regional District, servicingsingle family housing have contracted with MMBC who pay the collector to collect on theirbehalf.
2. Six drop-off depots operating in the region are also contracted to MMBC to accept recyclablesgenerated by the residential sector.
3. There is a strong vibrant private recycling industry that has evolved from a culture of sourceseparation and a regulatory framework that has contributed to the Region's impressive highdiversion rate.
4. The ICI waste stream is managed exclusively by the private sector hauling community andprocessing of recyclables is conducted by well-established clean MRFs that have emerged tohandle source separated recyclables region wide.
5. To establish a MRF significant capital investment is required. In addition, it is necessary to havesufficient feedstock to support a facility.
File: 5365-00Date: May 21, 2015Page: 4
General System Performance
The RDN's 2012 Waste Composition study information shows that approximately 30-35 per cent of thewaste stream is potentially recyclable at MRFs (this excludes compostable material). The actual amountdepends on whether there is a deposit-return system on various containers, which affects the amount ofplastic and metal packaging available for recycling. The top recyclables categories in municipal wastestreams in Canada (percentage of residential waste composition):
Recyclables %Paper 7
Plastics 14Glass 3Metal 3
Beverage containers 1.Electronics 2
Household Hazardous Materials 2
The actual amount recycled, and therefore the amount of diversion depends on the type of collectionsystem (curbside or depot), and materials collected. According to research, good curbside recyclingprograms should achieve 90 per cent participation or higher. Even when households participate they do notalways recycle all material collected by the program, therefore participation must be multiplied by captureto estimate the proportion of the waste stream that will be recovered in a program. Experience has shownthat capture varies by material, generally related to how complicated the recycling message is. In maturecurbside programs, people understand that cans, bottles, and newspapers are recyclable; therefore captureof these can be as high as 80 or 90 per cent where good promotion and education programs exist and incommunities with user pay systems, which encourage participation. Once new materials are added in anexpanded collection program, people are often confused (e.g., different kinds of plastics and mixed paper).
The RDN's curbside recycling program is mature and sophisticated, achieving diversion rates of 25-30 percent of the residential waste stream. Depot programs generally divert seven to 12 per cent. Deposit orreturn-to-retail systems typically recover more than 80 per cent of targeted beverage containers. Residualrates also vary depending on how materials are collected. "Typical" residual rates are five to seven per centor less for curbside sorted materials, and 20 per cent for bag or cart collection systems, or where nocurbside sort takes place. Wet/dry programs, where waste is collected in two streams, experience acombined 30 per cent residue rate in their wet and dry streams (because wet/dry programs usually directnon divertible materials into one stream or the other).
The recycling industry is vulnerable to global market conditions. When markets fail, recycling is anexpensive way to process waste. Solutions to market vulnerability include structuring contracts to sharemarket risk with either a recycling contractor, or directly with the market itself. It is preferable toguarantee rates to sign a long term contract, usually for five years. In such an arrangement, the early yearswill focus on establishing efficient collection and processing. Collection is the most expensive part,therefore attention would be on reducing collection costs. Current trends would indicate moves towardsfaster single stream collection with more expensive MRF's are more cost effective overall.
ALTERNATIVES
There are no alternatives for this report.
File: 5365-00Date: May 21, 2015Page: 5
FINANCIAL IMPLICATIONS
This report is presented for information only therefore has no financial implications.
STRATEGIC PLAN IMPLICATIONS
This report was prepared to provide information to RSWC as part of the Regional District's Solid WasteManagement Plan (SWMP) review process.
SUMMARY/CONCLUSIONS
This memorandum is intended to stimulate discussion by the RSWAC for the purposes of the RDN SWMPreview and provides an overview of MRF technologies for future consideration.
A MRF is a mechanized sorting facility, which separates recyclables and organics from waste that wouldotherwise be Iandfilled. There are numerous MRFs in operation in the US and in Europe. Similar MRFshave been proposed in Metro Vancouver and one in Fraser Valley Regional District. However, it wasrecently announced that the latter has been discontinued due to public opposition. Currently there arethree MRFs in Nanaimo that handle source separated recyclable materials. New programs will depend onfuture trends and global commodity markets.
Report Writer Writer A/General Manager Concurrence
C.A.O. Concurrence

APPENDIX 1
Collection Systems
Dual Stream Collected In Split Packer System in RDN & RDN Split Packer - Commingled Recyclables
Front End Loaded
Single Stream - Automated CollectionSystem

1='
12, I _X. 2
Detailed
Data by Waste Sector
Material
Category
i.- l- ti-.:
Cosnnterrit!
501.1tattl
'Totals.
Waste
Stream
Percentage
Estimated
Disposed
(7012)
Waste
Stream
Percentage
Estimated
Disposed
(2012)
Waste
Stream
Percentage
Estimated
Disposed
12012)
Waste
Stream
Percentage
Estimated
Disposed
(2017)
'.112"1111111.7
.7
'----211.111r7
"."
77...
111%
8,655
Newsprint
0.1%
76
13%
690
0.3%
139
1.7%
900
Cardboard
(recyclable)
0.7%
105
2.4%
1.271
0.3%
143
7.8%
1519
Cardboard
(waxed)
0.0%
0an%
1ao%
00.0%
I.
Cardboard
(non-recyclable)
0.0%
00.2%
108
00%
00.2%
108
Bowboard
./ Cores
0.4%
191
1.3%
709
0.2%
124
1.9%
1,028
Office
Paper
04%
198
2.5%
1,324
0.7%
368
3.5%
1,884
Magatines
and Catalogues
DO%
10.2%
106
01%
59
0.3%
166
Melded Paper Containers
0.0%
20
0.4%
237
0.0%
25
0.146
282
Hardcover
1300ks
0.0%
70.2%
91
0 2%
87
0 3%
186
Takeout Cops
0.1%
30
0.7%
360
00%
23
0.8%
413
Composite
Can
0.0%
80.0%
21
0.0%
20.1%
31
Other Paper
0.0%
10.2%
130
0.0%
07%
131
1313
.1%
... ..
Bags - Retail
(carry -out and grocery)
0.2%
174
0.2%
115
0.1%
44
0.5%
284
Bags • Packaging
(film
and overwrap)
0.9%
468
2.2%
1,173
0 2%
127
3.3%
1,768
Rags - Non Packaging
le.g Ziploc
bags)
0.2%
113
0.7%
379
al%
46
1.0%
538
Other Plastic
Film (pallet
wrap)
0.1%
27
0.910
473
0.0%
009%
500
PETE 141.
0.1%
71
0.2%
99
0.1%
33
04%
202
HDPE 62
01%
65
0.4%
235
0.1%
58
0 7%
357
PVC 43
00%
00.0%
70.0%
10.0%
8mu 44
00%
0ao%
60.0%
00.0%
6PP 45
0.1%
37
0.2%
131
0.1%
29
0.4%
198
P.5.46
02%
98
0.8%
450
0.1%
45
1.17E
593
Mixed Resin 47
0.0%
25
0 4%
210
913%
25
0.5%
260
Other uncoded plashci
0.2%
104
0.7%
391
05%
791
1.5%
789
Durable plaiStic
(nonipackaging)
0.3%
ISO
1.4%
753
1.7%
901
3 4%
1,833
Foed Waste
4.5%
2,391
17.6%
9,386
2.4%
1.297
74.5%
13,065
Yard and Garden
0.4%
723
4,7%
2.490
0.0%
12
5.1%
2,725
CompOstable
Paper
1.3%
696
3.7%
1,987
0.3%
141
5.3%
2.824
Tree Based Wood
0.0%
000%
16
0.0%
31
0.0%
19
Wham r erapo..”
Study120//1
Ina, .-Nlan
II
Z XION3ddV
- Detailed
Data by Waste Sector
Material
Category
Self -Haul
Totals
Waste
5 [team
Percentage
Estimated
Disposed
(2012)
Waste
Stream
Percentage
Estimated
Disposed
2012)
Waste
Stream
Percentage
r Estimated
Disposed
(2012)
Waste
Stream
Percent e
Estimated
Disposed
(2012)
Aseptic
Containers
(deposit)
0.0%
80.6%
19
0.0%
10.1%
29
Aseptic
Containers
(non-deposit)
0.0%
40.0%
90.0%
00.0%
14
Gable Top Containers
(deposit)
0.0%
00.0%
80.0%
10.0%
9Gable Top Containers
(non -deposit)
0.0%
22
0.1%
59
0.0%
1.5
0.2%
96
Beverage
Pouches (deposit)
0.0%
00.0%
11
0.0%
00.0%
11
Plastic
Beverage Containers
(deposit)
0.0%
60.2%
110
0.0%
18
0.3%
133
Plastic
Beverage Containers
(non -deposit)
0.0%
25
0 0%
25
0 0%
17
0.1%
67
Plastic
Beverage
(takeout
cups)
0.0%.
80 I%
77
0.0%
20.2%
82
Metal Beverage
(deposit)
0.0%
90.1%
65
0.0%
40.1%
78
Metal Beverage
(non-deposit)
0.0%
00.0%
00.0%
00.0%
0Glass Beverage Containers
(deposit)
0.0%
16
0.6%
303
0.1%
28
0.7%
347
Glass Severe e Containers
(non.deposit)
0.0%
00.0%
00.0%
00.0%
Clothing
0.1%
45
0.0%
16
0.1%
64
0.2%
126
Composite
Textiles
0.1%
74
0.1%
37
0.3%
167
0.5%
278
Leather
0.0%
50.0%
12
0.1%
49
0.1%
66
Natural
Fibre
Textiles
0.7%
380
1.4%
727
1.3%
690
3.4%
1,798
Synthetic
Textiles
0.1%
72
0.5%
288
0.8%
410
1.4%
770
-..
_,.....
- .
.Metal Packaging
(food)
0.2%
120
0.4%
213
0.0%
25
0.7%
358
Aluminum Foil
and Trays (packaging)
0.0%
10
0.0%
400%
000%
14
Aluminum Foil
and Trays
(non -packaging)
0.1%
79
0.2%
89
0-0%
12
0.3%
180
Non-consumables
mixed metals
(<0.6k8)
0.1%
51
0.3%
169
0.0%
25
0.5%
245
Non-tonsumables
mixed metals
(>0,
Skg)
0.0%
00.3%
181
0.6%
313
0.9%
494
MINE
1111IIIIIM.
Glass
Packaging
(food)
0.4%
188
0.6%
299
0.3%
182
1.3%
669
Other Glass and Ceramics
0.2%
86
0.6%
313
0.6%
318
1.3%
717 48
Clean Wood
0.3%
145
1.0%
509
0.8%
403
2.0%
1,057
Treated
or Painted
Wood
0.2%
28
1.4%
759
0.0%
61.6%
858
Gypsum/drywall/plaster0.0%
00.3%
186
1.2%
652
1.6%
838
Masonry/bricks
0.0%
00.2%
91
0,5%
241
0.6%
332
Asphalt
products
0.0%
001%
52
0.0%
00195
52
Carpet & Underlay
0.0%
00.8%
437
1.9%
1,004
2.7%
1,441
Flooring
(non -wood)
0.0%
00.0%
00.1%
54
0.1%
54
Other (fiberglass
insulation)
0.2%
114
0.8%
404
1.1%
604
2.1%
1,122
Waste Convention Siudv 12 014 • roar • .29 len I t
Detailed Data by Waste Sector
Material
Category
Computers and Peripherals
Televisions
and Audio Visual
Equipment
Telephones
and Telecommunications
Equipment
Small Kitchen
Appliances
and Floor Care
Electronic
Toys
Smoke and CO Detectors
Other ElectroniCS
Batteries
Medical/Biological
Stains/Preservatives
Latex Paint
Oil Based Paint
Aerosols
Solvents
Pesticides/Herbicides/Fungicides
Motor Oil
Oil Filters
Anii.Freeze
Pharmaceuticals.
Other Petroleum
Based Products
Mercury Containing
Items
W7 /4[ 1"Comootitmniwev120121
Other HHW
Diapers
/ Personal
Hygiene
Pet Waste
Foul
29 1.10,
Cosmetics
/ Soaps
Fines
Furniture
Rubber/Tires
White Goods
/1111.1111111*
Waste
Stream
Percentage
0.0%
0.1%
0.0%
0.1%
0.0%
0.0%
0.1%
Cartunaciai
Self-Haul
Totds
Estimated
Disposed
2012
0 an
0 36 3 0 69
Waste
Stream
Percentage
Estimated
Disposed
(2012)
Waste
Stream
Percentage
Estimated
Disposed
(2012)
Waste
Stream
Percentage
Estimated
Disposed
(2012)
0.5%
0.5%
0.3%
0.5%
0.0%
0.0%
0.2%
997
_0.5%
0.6%
0.3%
0.8%
0.0%
0.0%
0.3%
,32.1
11
____276
333
146
402
6 0 160
274
257
137
243
3 0 $3
0.0%
0.1%
0.0%
0 2%
0.0%
0.0%
0.0%
2 40 9 123
0 0 7.
, .
0.0%
13
0.1%
31
0.0%
10.1%
46
0.1%
42
0.7%
383
0.0%
00.8%
425
0.0%
00.0%
00.0%
10
0.0%
10
0.0%
12
0.3%
163
0.2%
103
0,5%
278
0.0%
00.1%
31
0.0%
00,1%
31
0.0%
24
0 1%
38
0.1%
35
0.2%
97
0.0%
00.1%
34
0.0%
001%
3.1
0.0%
00.0%
30.0%
00.0%
30.0%
30.0%
17
0.0%
00.0%
20
0.0%
00.0%
00.0%
00.0%
00.0%
00.0%
00.0%
00.0%
000%
10.0%
10
0.0%
13
0.0%
23
0.0%
00.0%
16
0.0%
00.0%
16
0.0%
00.0%
50.0%
00.0%
50.1%
39
0.9%
488
0.0%
01.0%
527
2.6%
1,394
21%
1187
0.4%
205
5.2%
2,786
0.8%
435
0.8%
445
0.5%
266
2.1%
1,146
.1Z-sialli
0.1.%
61
0.1%
75
0.0%
26
0.3%
162
0.2%
102
0.5%
261
0.046
70.7%
370
0.0%
00.4%
196
1.5%
825
1.9%
1,021
0.0%
60.1%
40
0.0%
00.1%
46
0.0%
00.0%
00.0%
00.0%
0