pushover analysis for the seismic response prediction of ... · pushover analysis for the seismic...
TRANSCRIPT
Pushover analysis for the seismic response prediction of
cable-stayed bridges under multi-directional excitation
A. Camara1, M.A. Astiz1
(1) Department of Mechanics and Structures. School Of Civil Engineering. TechnicalUniversity of Madrid. Prof. Aranguren s/n, Madrid, Spain
Abstract
Cable-stayed bridges represent nowadays key points in transport networksand their seismic behaviour needs to be fully understood, even beyond theelastic range of materials. Both nonlinear dynamic (NL-RHA) and static(pushover) procedures are currently available to face this challenge, each withintrinsic advantages and disadvantages, and their applicability in the study ofthe nonlinear seismic behaviour of cable-stayed bridges is discussed here. Theseismic response of a large number of finite element models with different spanlengths, tower shapes and class of foundation soil is obtained with differentprocedures and compared. Several features of the original modal pushoveranalysis (MPA) are modified in light of cable-stayed bridge characteristics,furthermore, an extension of MPA and a new coupled pushover analysis(CNSP) are suggested to estimate the complex inelastic response of suchoutstanding structures subjected to multi-axial strong ground motions.
Keywords:Pushover analysis; seismic excitation; nonlinear dynamics; cable-stayedbridges; computational cost
1. Introduction
Cable-stayed bridges represent key points of the transport networks and,consequently, they are conceived to remain nearly elastic under the designseismic action, typically including dampers to control the response when
Email addresses: [email protected] (A. Camara), [email protected] (M.A.Astiz)
Please cite this paper as: A. Camara, M.A. Astiz, Pushover analysis for the seismic response prediction of cable-stayed bridges under multi-directional excitation, Engineering Structures, 41, 2012, 444-455.
located in seismic-prone areas. However, several important cable-stayedbridges with dampers (e.g. Rion-Antirion in Greece or Stonecutters in China)also allow some structural damage in the towers in order to reduce responseuncertainties under unexpectedly large earthquakes. On the other hand,there are many cable-stayed bridges without seismic devices which are ex-posed to large earthquakes and inelastic excursions. Considering these ex-treme events, designers need appropriate methodologies to address if theductility demand along the towers is acceptable, and to verify the elasticresponse of the deck.
Non-Linear Response History Analysis (NL-RHA) is undoubtedly themost rigorous methodology to deal with inelasticity in dynamic studies, al-lowing also the consideration of viscous dampers. However, several uncer-tainties are introduced in the definition of the models and analysis, to thepoint that there are seismic regulations which preclude this procedure [1]. Inthis sense, nonlinear static pushover analysis is very appealing.
In recent years, pushover strategies have received a great deal of research,especially since seismic design guidelines [2, 3] were published. Their maingoal is to estimate the nonlinear seismic response by means of static calcula-tions, pushing the structure up to certain target displacement using load pat-terns which try to represent the distribution of inertia forces. These method-ologies are useful to uncover design weaknesses that could remain hidden inan elastic analysis and yield good estimations of the nonlinear seismic perfor-mance under certain conditions, drastically reducing the computational cost[4]. For these reasons many design guidelines recommend the use of pushoveranalysis to evaluate the inelastic seismic response [2, 5, 6], whereas the N2pushover analysis [7] is adopted in Eurocode 8 [8]. However, the mathe-matical basis of the procedure is far from accurate; it is assumed that thenonlinear response of a multi degree-of-freedom structure can be related tothe response of an equivalent single degree-of-freedom model (SDOF), whichimplies that the response is controlled by a single mode; furthermore it isassumed that this modal shape remains constant through the analysis [4].Although these assumptions are clearly incorrect, if the structure responseis dominated by the first mode of vibration the estimated results have beenfound to be generally accurate compared with rigorous NL-RHA [4, 9, 10].Different proposals have been made to overcome the aforementioned short-comings, briefly described in the following lines.
Chopra and Goel [11] introduced the Modal Pushover Analysis (MPA) inorder to take into account the contributions of several important modes in
2
the nonlinear dynamic response of the structure, neglecting the interactionbetween modes in nonlinear range and studying their response independentlyas it is performed in spectral analysis. This procedure, initially proposedfor buildings under one-directional ground shaking and included in FEMA-440 [6], has been improved in order to include the effect of higher modesthrough spectral analysis, considering their response completely elastic [12].The modal contribution is finally combined with standard rules like CQC(Complete Quadratic Combination) or SRSS (Square Root of the Sum ofSquares), based on elastic superposition principles unable to retain the signof the modal force distributions, which may introduce errors [13].
Several adaptive pushover methods have been developed in order to ‘up-date’ the load distribution pattern along the structure as long as yieldingmechanisms are developed, they can be based on imposed load [14] or dis-placements patterns [15]. Although the consideration of variable modal prop-erties normally improves the accuracy of the procedure [13, 15], its difficultyis inevitably increased and it is somewhat away from the initial objective of asimplified yet accurate method. Moreover, Papanikolau et al [16] pointed outthe misleading results that adaptive pushover strategies could offer, and thenumerical difficulties involved in the extraction of vibration modes if largeinelastic deformations arise.
Another pitfall of pushover analysis is the difficulty in modelling three-dimensional (3D) and torsional effects, as well as considering multi-directionalsimultaneous seismic excitation, which in the present work are found to beimportant in structures with strong mode coupling like cable-stayed bridges[17]. In this direction, Lin and Tsai [18] proposed an extension of MPA,substituting the SDOF by a three degree of freedom system which takes intoaccount the coupling between the two horizontal translations and the verti-cal rotation, increasing the complexity of the procedure. More practically,Huang and Gould [19] performed a simultaneous bi-directional pushover anal-ysis considering two load patterns along both horizontal directions.
So far, most of the research is currently focused on buildings and fewworks address the problem of the applicability of pushover analysis to bridges[9, 10, 20]; the work of Paraskeva et al [21] proposed key issues to em-ploy MPA to bridges, providing information about the selection of the con-trol point (among other features), and applying the procedure to a stronglycurved bridge, where transverse modes present displacements also in longi-tudinal direction. Nonetheless, no specific studies on this topic about cable-stayed bridges have been found by the authors. On the other hand, bridges
3
are usually more affected by higher modes and, therefore, proposing modalpushover procedures for these structures is even more of a challenge than inthe case of buildings.
In this work, several considerations proposed for the applicability of MPAin triaxially excited cable-stayed bridges are first included. Subsequently,two new procedures are presented; the Extended Modal Pushover Analy-sis (EMPA), which considers the 3D components of the accelerograms, andthe Coupled Nonlinear Static Pushover analysis (CNSP), which takes intoaccount the nonlinear coupling between the governing modes. The valida-tion of these pushover methods is performed by comparing their results withthe extreme seismic response recorded in NL-RHA, considered as the ‘exact’solution.
2. Implementation issues of MPA in cable-stayed bridges
The complex interactions among vibration modes, characteristic of cable-stayed bridges [17], force the designer to consider the full 3D model inpushover analysis. Furthermore, large differences in the stiffness of theirconstitutive members (towers, deck and cable-system) favour significant con-tributions of modes higher than the fundamental one, and typically amongthe first twenty modes (see section 6.1), which clearly differentiate thesestructures from buildings. Several special features about the implementationof MPA in three-axially excited cable-stayed bridges have been proposed inthis study and are described in the following lines.
MPA has been conceived for structures under one-directional seismic ex-citation, being its mathematical development included elsewhere [11]; if thebridge is three-directionally excited, in-plane pushover analyses may be con-ducted separately, deciding first which is the characteristic direction of thenth mode (referred as DRn) and neglecting its contributions in the otherdirections.
A previous study about the contributions of each mode below a reason-able upper limit of fmax = 25 Hz (higher modes are neglected) should beperformed in order to select the governing horizontal modes in longitudinaland transverse directions, i.e. the ones with larger contributions in the corre-sponding response (see section 6.1). The inelastic demand is assumed to begoverned by the first vibration modes, consequently, it is proposed to includein the nonlinear static analyses all the vibration modes below the limiting fre-quency fgov, which is established as fgov = max(fnX , fnY ), where fnX and fnY
4
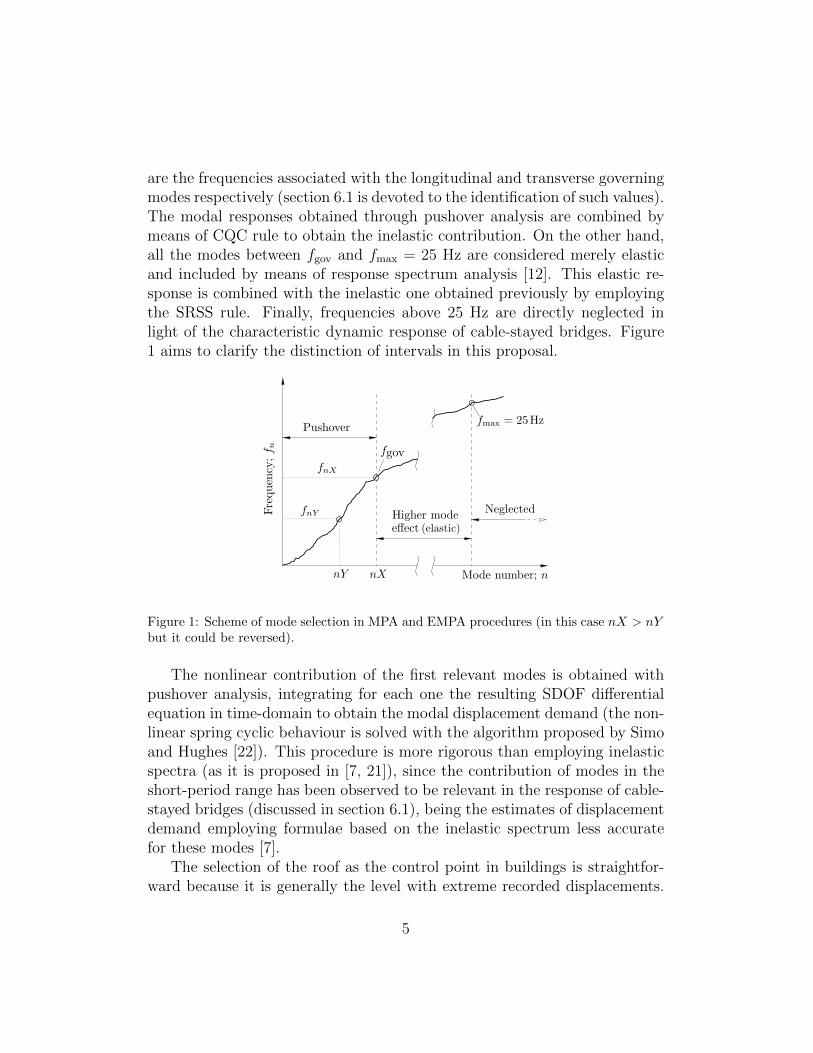
are the frequencies associated with the longitudinal and transverse governingmodes respectively (section 6.1 is devoted to the identification of such values).The modal responses obtained through pushover analysis are combined bymeans of CQC rule to obtain the inelastic contribution. On the other hand,all the modes between fgov and fmax = 25 Hz are considered merely elasticand included by means of response spectrum analysis [12]. This elastic re-sponse is combined with the inelastic one obtained previously by employingthe SRSS rule. Finally, frequencies above 25 Hz are directly neglected inlight of the characteristic dynamic response of cable-stayed bridges. Figure1 aims to clarify the distinction of intervals in this proposal.
Figure 1: Scheme of mode selection in MPA and EMPA procedures (in this case nX > nYbut it could be reversed).
The nonlinear contribution of the first relevant modes is obtained withpushover analysis, integrating for each one the resulting SDOF differentialequation in time-domain to obtain the modal displacement demand (the non-linear spring cyclic behaviour is solved with the algorithm proposed by Simoand Hughes [22]). This procedure is more rigorous than employing inelasticspectra (as it is proposed in [7, 21]), since the contribution of modes in theshort-period range has been observed to be relevant in the response of cable-stayed bridges (discussed in section 6.1), being the estimates of displacementdemand employing formulae based on the inelastic spectrum less accuratefor these modes [7].
The selection of the roof as the control point in buildings is straightfor-ward because it is generally the level with extreme recorded displacements.
5
However, when dealing with three-directionally excited cable-stayed bridges,this point is not obvious. It is proposed here to establish the control pointas the point with maximum modal displacement in the specific studied modealong its dominant direction (defined in section 6.1). Therefore, optimizedcontrol points are considered by this proposal, which may be different fromone vibration mode to another.
In order to idealize the obtained ‘capacity curve’ (relating the base shearand the displacement of the control point) into a bi-linear plot, a specific‘Equal Area’ rule has been considered to represent more properly the actualcurves obtained in the towers of cable-stayed bridges. In light of an extensivenumber of capacity curves extracted from these structures, the ideal elasticstiffness has been established as 75% of the initial one in the recorded curve,which presents a gradually decreasing slope caused by progressive develop-ment of plastic hinges at different locations along the towers.
3. Extended Modal Pushover Analysis: EMPA
An Extended Modal Pushover Analysis (EMPA) is proposed here, in or-der to fully take into account the multi-directional seismic excitation uT
g (t) =(uXg , u
Yg , u
Zg ). Neglecting the contributions of one specific mode in directions
different than the characteristic one (like original MPA suggests) is reason-able in regular buildings, where two well defined flexure planes are present,but could be misleading in irregular buildings or in bridges with strong modalcoupling like cable-stayed bridges. Paraskeva et al [21] applied MPA to onebridge with curved deck, considering also the longitudinal displacements intransverse modes. Cable-stayed bridges, on the other hand, are also affectedby the vertical excitation in transverse modes; vibration modes with trans-verse flexure of the towers and the deck present a characteristic interactionwith the girder torsion, and also with its vertical flexure in structures withmoderate to medium spans (below 500 m), due to the coupled response ex-erted by the cable-system. Other modes with significant interactions arepresent in cable-stayed bridges [17], and two or three accelerogram compo-nents at the same time may contribute significantly to the response in thesemodes, but original MPA would discard secondary sources of the seismicresponse. EMPA has been designed as an attempt to incorporate these ef-fects. Finishing with the motivation, note that although φn is the modaldisplacement vector in a transverse, longitudinal or vertical mode, it couldhave non-zero components in the other two directions, albeit typically much
6
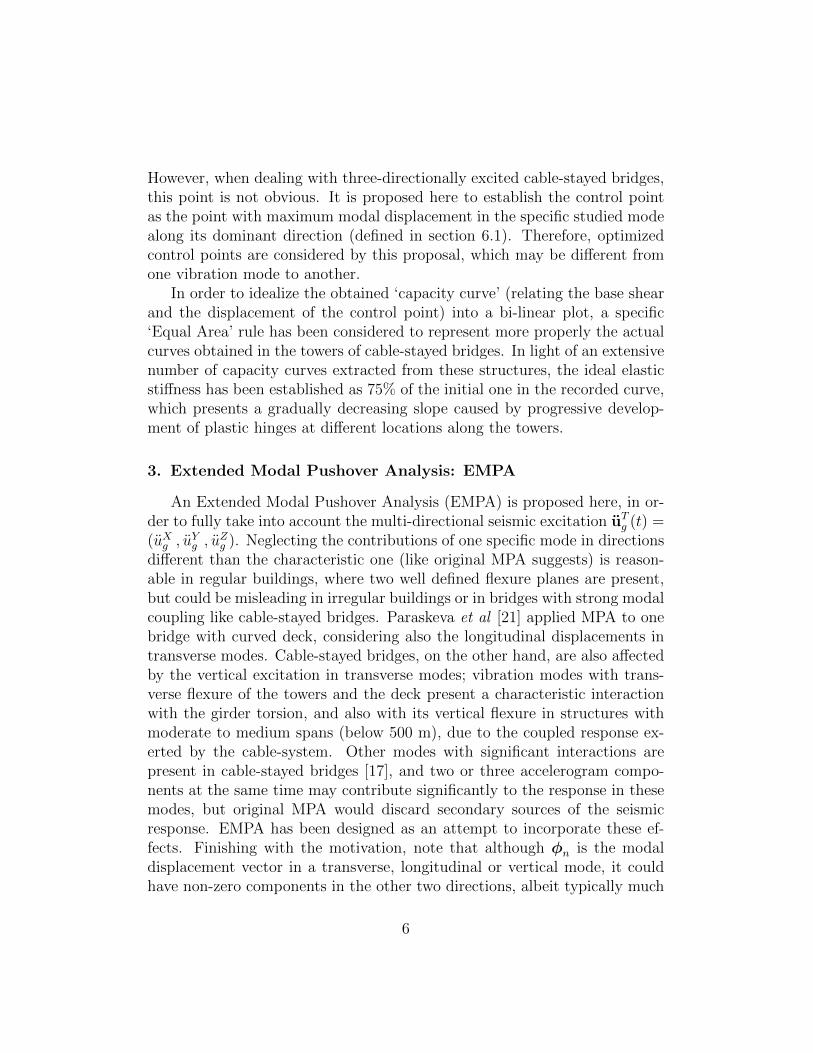
smaller than the dominating ones. Hence, the load distributions of vibrationmodes are 3D, as it is schematically represented in figure 2(a), particularizedfor a transverse mode (DRn = Y ).
(a) Load distribution s∗n = mφn (b) Resulting control point dis-placement urn
Figure 2: Schematic 3D features of EMPA in a transverse n-mode (DRn = Y ).
EMPA is based on the same principles as MPA, but considering the sys-tem of dynamics under general 3D ground motions. The seismic excitationvector (right part of the system of dynamics) is the sum of three terms, eachone corresponding to the three components of the accelerogram record:
mu + cu + fS (u, u) = −sX uXg (t) − sY uYg (t) − sZ uZg (t) (1)
where, u(t) is the relative displacement vector, m and c are respectivelythe mass and damping matrices of the structure, fS defines the relation-ship between force and displacement vectors, ujg is the ground accelerationin j-direction (j = X, Y, Z). Finally, considering a structure composed ofN degrees of freedom, sj [N × 1] is the spatial distribution of the seismicexcitation in j-direction:
sj = mιj =N∑i=1
sji =N∑i=1
Γjimφi (2)
7
Γji and φi being respectively the participation factor (scalar) in j-direction
and the mode shape vector associated with ith mode. It is worth noting thatboth forces and bending moments are included in the expanded excitationvector, since three displacements and three rotations (6 DOF) per node areactivated in the model and included in φi. On the other hand, ιj [N × 1]is the displacement vector of the structure when the same unit movement isimposed in all the foundations in direction j. The spatial variability of theseismic action is not considered in this work and, hence, the displacementsprescribed at ground level are equal. Pre-multiplying each term of equa-tion (2) by φT
n , and considering the orthogonality of the mass matrix, Γjn is
obtained:
Γjn =
φTnmιj
Mn
; with j = X, Y, Z (3)
Introducing the expanded vectors sX , sY , sZ in expression (1) with (2),pre-multiplying by φT
n and taking into account the orthogonality properties:
φTnmu + φT
ncu + φTn fS(u, u) = −Mn
(ΓXn u
Xg + ΓY
n uYg + ΓZ
n uZg
)︸ ︷︷ ︸u∗g,n(t)
(4)
EMPA extends the original methodology to consider the 3D earthquakeexcitation by means of an equivalent acceleration history u∗g,n (t), defined in(4) in terms of the modal properties besides the earthquake record itself. Sofar the procedure is exact but, as it is assumed in MPA, the coupling betweenmodes in nonlinear range is neglected at this point and a set of J (J < N)relevant modes is considered:
u(t) =J∑
i=1
ui(t) ≈J∑
i=1
φiqi (t) (5)
where qi is a generalized coordinate which takes into account the 3Dnature of the mode shape φi, being defined in expression (8b) below. Theuncoupled SDOF system from (4) and (5) is obtained as follows:
¨qn + 2ξnωn ˙qn +Fsn
Mn
= −u∗g,n (t) (6)
8
The procedure now takes into account the three components of the 3Dpushover analysis (figure 2) by means of Fsn = φT
n fS(qn, ˙qn), without neglect-ing the components different from the mode dominating direction (DRn).The bar symbol over Fsn is established in order to differentiate it from theunidirectional pushover analysis in MPA. In fact, the capacity curve, whichdefines the required relationship Fsn/Mn, is obtained in a different way thanMPA, taking into account the aforementioned contributions of the excita-tion vector in all available degrees of freedom. In order to do that, threecapacity curves are recorded in a single pushover analysis of each mode, as-sociated with the longitudinal, transverse and vertical directions; (V X
bn −uXrn),(V Y
bn − uYrn), (V Zbn − uZrn), as it was depicted in figure 2, where V j
bn and ujrn arerespectively the total base shear and the displacement of the control pointin j-direction during the 3D static analysis of nth mode.
Once these projected 2D capacity plots are obtained, they are transformedinto coordinates Fsn/Mn − qn:
F jsn
Mn
=V jbn
Ljn
(7a)
qjn =ujrnφjrn
(7b)
in which F jsn and qjn represent the projection in j-direction (j = X,Y,Z)
of the 3D capacity curve associated with nth mode, whereas ujrn and φjrn are
respectively the corresponding displacement and normalized modal displace-ment at the control point, which is selected with the considerations proposedin MPA, regardless of the direction where the peak modal displacement isrecorded. Finally Lj
n = φTnmιj.
A so-called ‘modular capacity curve’ (Fsn/Mn − qn) is suggested to in-troduce the information of the three projected curves (F j
sn/Mn − qjn) in theSDOF equation (6):
Fsn
Mn
=
√(FXsn
Mn
)2
+
(F Ysn
Mn
)2
+
(FZsn
Mn
)2
(8a)
qn =
√(qXn )2 + (qYn )2 + (qZn )2 (8b)
9
This modular capacity curve includes information of the longitudinal,transverse and vertical capacity curves in the nth mode, and allows the def-inition of the equivalent SDOF expressed in (6), which subjected to theequivalent accelerogram u∗g,n (t) and integrated in time domain, results in themodular generalized displacement demand max
t[qn(t)]. The modular target
displacement which marks the end of the 3D pushover analysis (see figure2(b)) is then:
umaxrn = φrn max
t[qn (t)] (9)
where φrn =√
(φXrn)2 + (φY
rn)2 + (φZrn)2.
The rest of the steps, combining modal maxima and considering highermode effects are the same as in MPA. The same distribution of the modalrange presented in MPA (figure 1) is employed, discerning among modeswhich require pushover analysis, response spectrum analysis or ignored fre-quencies.
4. Coupled Nonlinear Static Pushover analysis: CNSP
MPA neglects the interaction between the modes, superposing modal con-tributions just as it is done in a modal elastic analysis. The proposed ex-tension (EMPA), despite considering the contribution of vibration modes inall directions, besides the associated effect under 3D seismic excitation, alsoassumes the different modes uncoupled and pushover analysis is performedseparately for each mode. However, studying the longitudinal and trans-verse flexure separately is conceptually wrong if material nonlinearities areinvolved, because the damage exerted to the tower due to its longitudinalflexure unavoidably affects the transverse response and vice versa. In orderto overcome this drawback, and to consider the nonlinear modal interaction,the Coupled Nonlinear Static Pushover analysis (CNSP) is proposed here,rooted in EMPA (presented above) and in the proposal of Huang and Gould[19].
Like in other pushover strategies, first a modal analysis is carried out inorder to select the governing modes, but now only these dominant modesare selected for the nonlinear static analysis; one in the transverse direction(φnY ) and the other in the longitudinal one (φnX), as it is shown in figure5. Once the governing modes have been selected, their load distribution isobtained separately, retaining its 3D nature as it is done in EMPA:
10
s∗nY = mφnY ; s∗nX = mφnX (10)
In order to obtain the coupled response in longitudinal and transversedirections, a coupled load pattern (s∗C) results from the algebraic weightedaddition of both force distributions. These components are multiplied by thefactor Λ, which takes into account the difference in the spectral accelerationsassociated with each governing mode [19]:
s∗C = ΛY s∗nY + ΛXs∗nX (11)
where Λj = Saj/max(SaY , SaX), with j = X, Y , whereas SaX and SaY
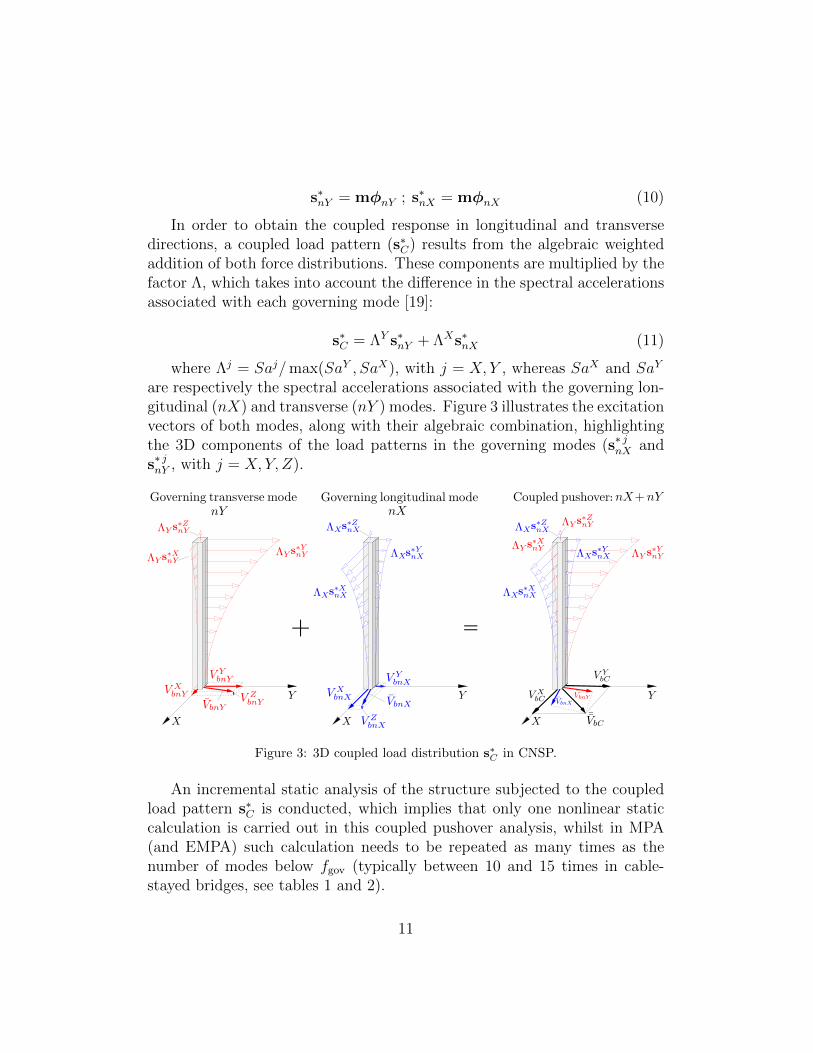
are respectively the spectral accelerations associated with the governing lon-gitudinal (nX) and transverse (nY ) modes. Figure 3 illustrates the excitationvectors of both modes, along with their algebraic combination, highlightingthe 3D components of the load patterns in the governing modes (s∗ jnX ands∗ jnY , with j = X, Y, Z).
Figure 3: 3D coupled load distribution s∗C in CNSP.
An incremental static analysis of the structure subjected to the coupledload pattern s∗C is conducted, which implies that only one nonlinear staticcalculation is carried out in this coupled pushover analysis, whilst in MPA(and EMPA) such calculation needs to be repeated as many times as thenumber of modes below fgov (typically between 10 and 15 times in cable-stayed bridges, see tables 1 and 2).
11
The coupled capacity curve resulting from CNSP (right part of figure 3)involves two vibration modes (i.e. two DOF). Unfortunately, pushover pro-cedures presented so far deal only with one DOF. Several authors proposedsolutions for coupled capacity curves; Lin and Tsai [18] suggested a threeDOF system which inevitably increases the complexity of the pushover anal-ysis; more practically, Huang and Gould [19] extracted the transverse andlongitudinal components of the coupled pushover analysis, and obtained thecorresponding displacement demands from the ‘capacity spectrum method’included in ATC-40 [2].
The proposal of Huang and Gould [19], apart from being rooted in theATC-40 capacity spectrum method (which may yield misleading results [23]),is not valid here; these authors considered only the characteristic dominantdirection of each governing mode and, therefore, the projections of the cou-pled capacity curve along the principal axes were directly the contributionsof each mode. However, CNSP involves all the components in the excita-tion vector of each governing mode, not only the dominant direction, whichsomewhat complicates the picture. The following solution is proposed at thispoint; the contribution of each dominant vibration mode to transverse andlongitudinal components of the coupled capacity curve are computed by mul-tiplying the projection of the curve in j-direction (V j
bC −ujrC , see figure 3) bya factor expressing the global weight of both modes in this direction, whichcould be obtained through the comparison of their participation factors in j-direction. The two-degree of freedom coupled problem is then dissociated intwo independent SDOF systems, one related to the transverse mode and theother to the longitudinal one, but retaining the effect of flexure interactionbetween both directions.
Summarizing the philosophy of CNSP, graphically illustrated in figure 4;(i) the inertia forces associated with the governing modes are combined bymeans of expression (11); (ii) with this load pattern, one coupled pushoveranalysis is performed, obtaining the coupled capacity curve ( ¯VbC− ¯urC , where¯VbC and ¯urC are respectively the resultant of the base-shear and control pointdisplacement in the 3D coupled pushover analysis, see figure 4) and its corre-sponding projections in the principal directions (V j
bC − ujrC); (iii) consideringthe weight of both modes in each direction, this curve is disaggregated, sub-sequently obtaining the nonlinear spring behaviour of two SDOF systemscorresponding to the longitudinal and transverse responses. Each one ofthese two SDOF systems is independent, but its definition was influencedby the other SDOF through the nonlinear coupled effect. Subsequent steps
12
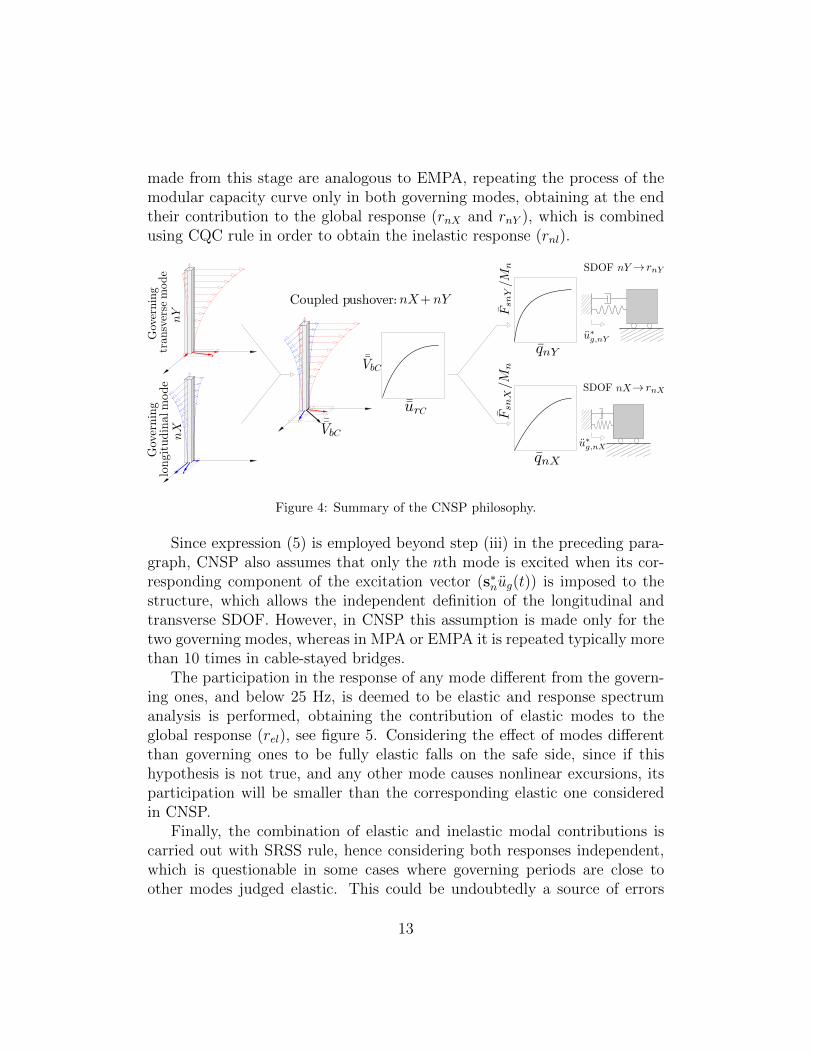
made from this stage are analogous to EMPA, repeating the process of themodular capacity curve only in both governing modes, obtaining at the endtheir contribution to the global response (rnX and rnY ), which is combinedusing CQC rule in order to obtain the inelastic response (rnl).
Figure 4: Summary of the CNSP philosophy.
Since expression (5) is employed beyond step (iii) in the preceding para-graph, CNSP also assumes that only the nth mode is excited when its cor-responding component of the excitation vector (s∗nug(t)) is imposed to thestructure, which allows the independent definition of the longitudinal andtransverse SDOF. However, in CNSP this assumption is made only for thetwo governing modes, whereas in MPA or EMPA it is repeated typically morethan 10 times in cable-stayed bridges.
The participation in the response of any mode different from the govern-ing ones, and below 25 Hz, is deemed to be elastic and response spectrumanalysis is performed, obtaining the contribution of elastic modes to theglobal response (rel), see figure 5. Considering the effect of modes differentthan governing ones to be fully elastic falls on the safe side, since if thishypothesis is not true, and any other mode causes nonlinear excursions, itsparticipation will be smaller than the corresponding elastic one consideredin CNSP.
Finally, the combination of elastic and inelastic modal contributions iscarried out with SRSS rule, hence considering both responses independent,which is questionable in some cases where governing periods are close toother modes judged elastic. This could be undoubtedly a source of errors
13
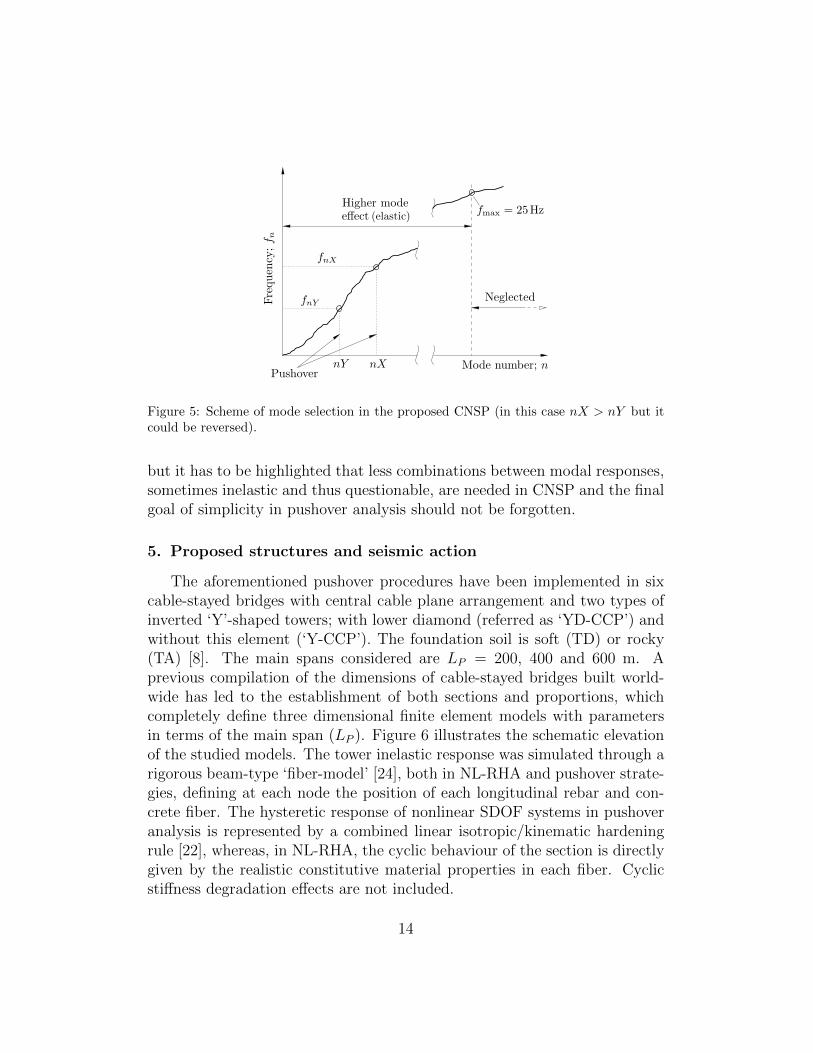
Figure 5: Scheme of mode selection in the proposed CNSP (in this case nX > nY but itcould be reversed).
but it has to be highlighted that less combinations between modal responses,sometimes inelastic and thus questionable, are needed in CNSP and the finalgoal of simplicity in pushover analysis should not be forgotten.
5. Proposed structures and seismic action
The aforementioned pushover procedures have been implemented in sixcable-stayed bridges with central cable plane arrangement and two types ofinverted ‘Y’-shaped towers; with lower diamond (referred as ‘YD-CCP’) andwithout this element (‘Y-CCP’). The foundation soil is soft (TD) or rocky(TA) [8]. The main spans considered are LP = 200, 400 and 600 m. Aprevious compilation of the dimensions of cable-stayed bridges built world-wide has led to the establishment of both sections and proportions, whichcompletely define three dimensional finite element models with parametersin terms of the main span (LP ). Figure 6 illustrates the schematic elevationof the studied models. The tower inelastic response was simulated through arigorous beam-type ‘fiber-model’ [24], both in NL-RHA and pushover strate-gies, defining at each node the position of each longitudinal rebar and con-crete fiber. The hysteretic response of nonlinear SDOF systems in pushoveranalysis is represented by a combined linear isotropic/kinematic hardeningrule [22], whereas, in NL-RHA, the cyclic behaviour of the section is directlygiven by the realistic constitutive material properties in each fiber. Cyclicstiffness degradation effects are not included.
14

Figure 6: Schematic bridge elevation. Measurements in meters.
The seismic action consists of two groups of twelve synthetic accelero-grams, each obtained fitting its acceleration spectrum to the elastic designone proposed by Eurocode 8 (EC8) [8] for rocky soil (TA) and soft soil (TD),both considering type 1 spectrum and ground acceleration ag = 0.5g (repre-sentative of highly seismic areas worldwide). Damping ratio is 4% in orderto consider the reduced damping of cable-stayed bridges.
The minimum number of required records is usually three or four in seis-mic codes [25], but researchers agree that this limit is too low; a sensitivityanalysis of the response of cable-stayed bridges under twenty four syntheticsignals has been performed here, concluding that the axial load along thetowers is specially sensitive to the number of records studied, but the devi-ations are minimized and the solution is robust if the averaged response oftwelve accelerograms is obtained. The total duration of the accelerogramsis 20 s, and the strong pulse phase interval 4 s. The set of 12 records 3Dapplied have been generated with an ad hoc algorithm described elsewhere[26], satisfying Eurocode 8 provisions.
6. Discussion of the results
6.1. Selection of governing modes. Response spectrum analysis
The study about the contributions of each vibration mode to the globalresponse, considering the specific seismic action applied, is a paramount stageprior to the pushover analysis. Before the identification of the governingmodes, the characteristic dominant direction of each mode (DR) should bedistinguished. It is proposed to assign DRn as the direction j (j = X, Y, Z)
15
associated with the maximum value of the participation factor for the nthmode in each direction (expression (3)), excluding the ones which are mainlyrelated to rotations.
The contribution of each mode to the global behaviour is addressed bymeans of elastic response spectrum analysis, including only the consideredmode. The total response in this section, for comparison purposes, is as-sumed as the result of response spectrum analysis involving all modes withfrequency lower than fmax = 25 Hz. The modes with larger contributionsto the longitudinal (VX) and transverse shear (VY ) seismic forces along thetower height are considered respectively longitudinal and transverse govern-ing modes.
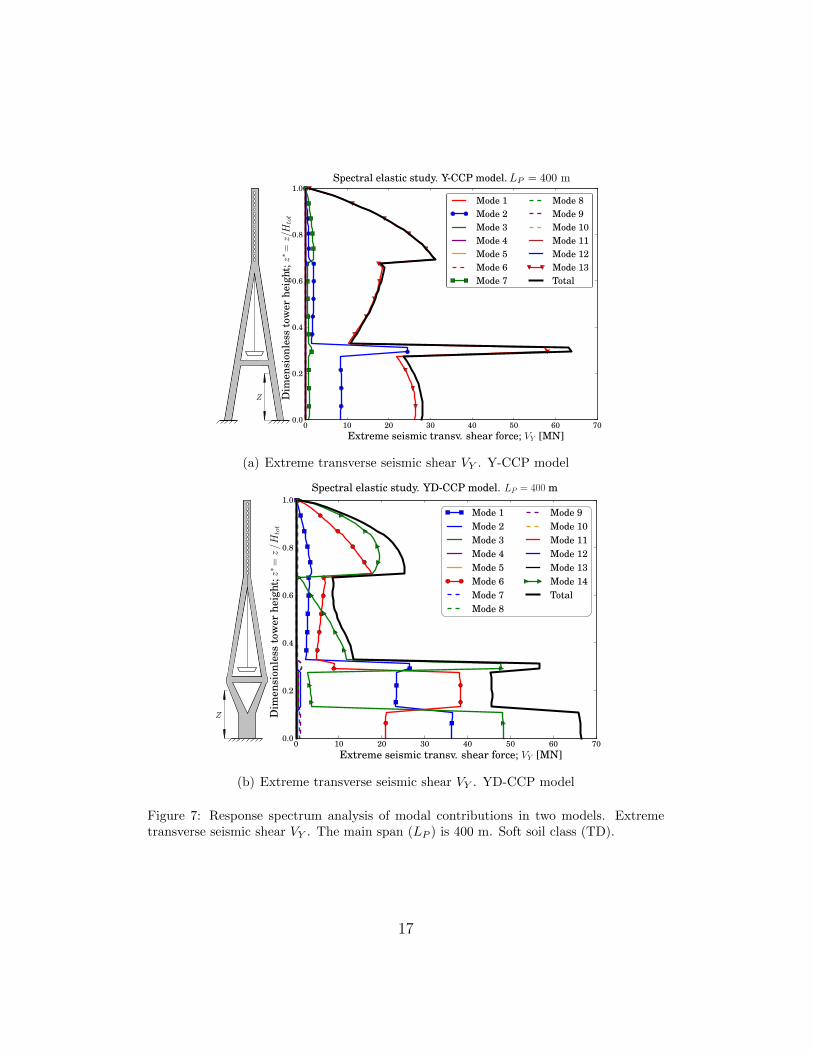
Figure 7 presents the total response and modal contributions to the trans-verse shear along the tower in two models with and without lower diamond.Mode No. 13 is clearly the governing one in transverse direction (nY = 13) inthe bridge considered in figure 7(a), but the decision in the case representedin figure 7(b) is more questionable; looking at the seismic forces around thefoundation level, the mode No. 14 is the transverse governing one in thisbridge (nY = 14).
In some cases (e.g. figure 7(b)) the response is not clearly dominated byone governing mode, instead, several modes may contribute significantly. Inorder to assess the contribution level of the governing modes with respectto the total corresponding response, it is proposed to average (for the wholetower) the ratio between the contribution of each single governing mode totheir representative shear in a specific section k (V k
X,nX or V kY,nY ) and the
total response (V kX,tot or V k
Y,tot, including all modes below 25 Hz).
Vj,nj
Vj,tot=
Nnod∑k=1
V kj,nj
V kj,tot
Nnod
; with j = X, Y (12)
where Nnod is the number of nodes along the tower height.According to the theoretical description presented above, CNSP accu-
racy is expected to be increased if the contribution of the governing modesis important, i.e. when the ratios proposed in expression (12) are close tothe unity. The results are collected in tables 1 and 2, extracting the fol-lowing useful conclusions prior to any nonlinear seismic calculation; (1) thetransverse response is largely dominated by a single governing mode (nY )whilst in the longitudinal direction this is not as clear, probably due to the
16
(a) Extreme transverse seismic shear VY . Y-CCP model
(b) Extreme transverse seismic shear VY . YD-CCP model
Figure 7: Response spectrum analysis of modal contributions in two models. Extremetransverse seismic shear VY . The main span (LP ) is 400 m. Soft soil class (TD).
17
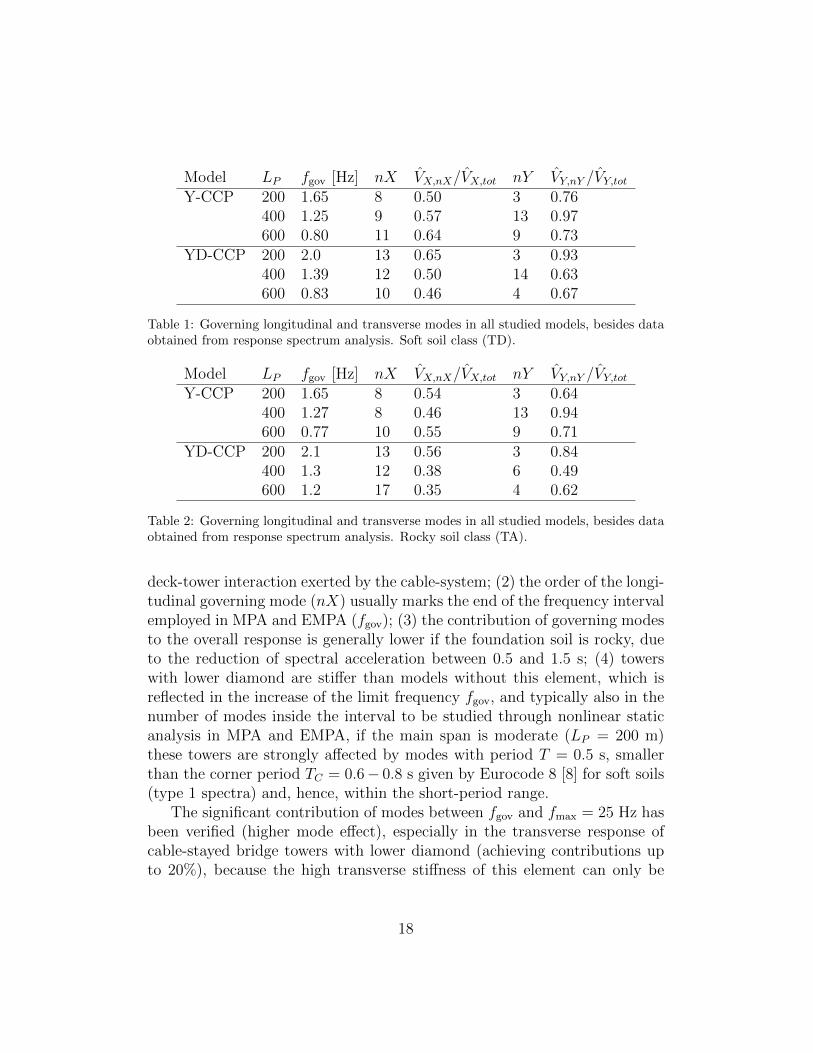
Model LP fgov [Hz] nX VX,nX/VX,tot nY VY,nY /VY,totY-CCP 200 1.65 8 0.50 3 0.76
400 1.25 9 0.57 13 0.97600 0.80 11 0.64 9 0.73
YD-CCP 200 2.0 13 0.65 3 0.93400 1.39 12 0.50 14 0.63600 0.83 10 0.46 4 0.67
Table 1: Governing longitudinal and transverse modes in all studied models, besides dataobtained from response spectrum analysis. Soft soil class (TD).
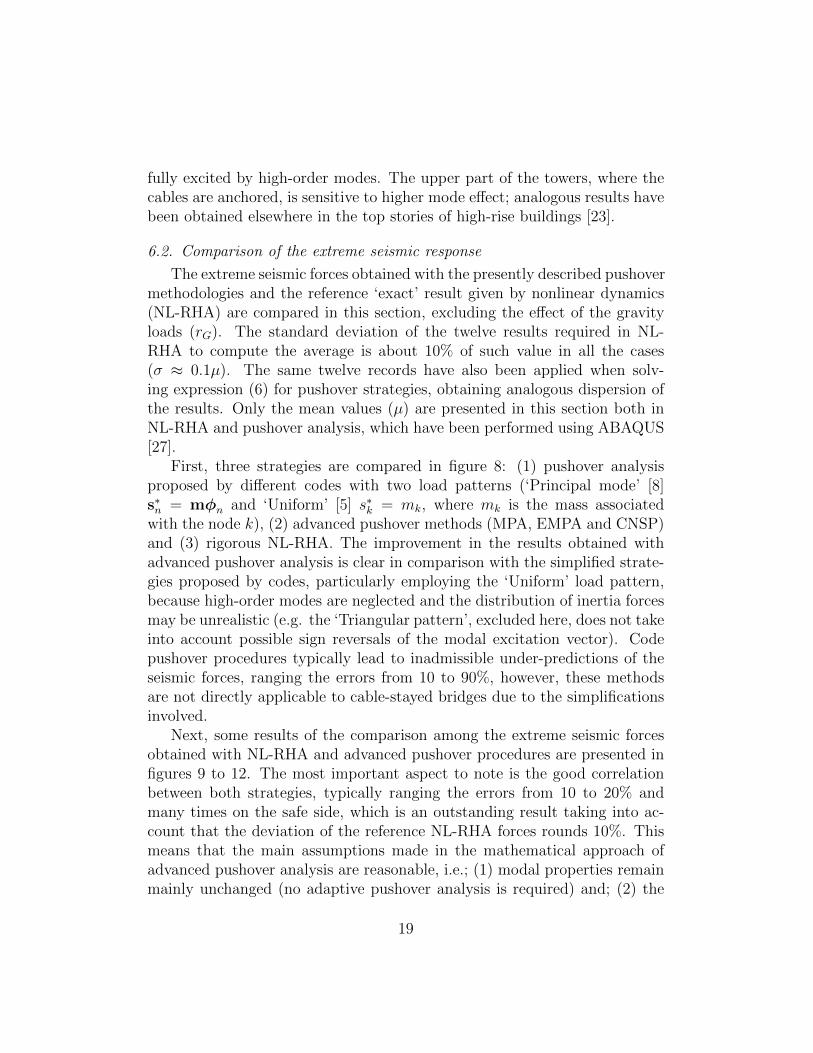
Model LP fgov [Hz] nX VX,nX/VX,tot nY VY,nY /VY,totY-CCP 200 1.65 8 0.54 3 0.64
400 1.27 8 0.46 13 0.94600 0.77 10 0.55 9 0.71
YD-CCP 200 2.1 13 0.56 3 0.84400 1.3 12 0.38 6 0.49600 1.2 17 0.35 4 0.62
Table 2: Governing longitudinal and transverse modes in all studied models, besides dataobtained from response spectrum analysis. Rocky soil class (TA).
deck-tower interaction exerted by the cable-system; (2) the order of the longi-tudinal governing mode (nX) usually marks the end of the frequency intervalemployed in MPA and EMPA (fgov); (3) the contribution of governing modesto the overall response is generally lower if the foundation soil is rocky, dueto the reduction of spectral acceleration between 0.5 and 1.5 s; (4) towerswith lower diamond are stiffer than models without this element, which isreflected in the increase of the limit frequency fgov, and typically also in thenumber of modes inside the interval to be studied through nonlinear staticanalysis in MPA and EMPA, if the main span is moderate (LP = 200 m)these towers are strongly affected by modes with period T = 0.5 s, smallerthan the corner period TC = 0.6− 0.8 s given by Eurocode 8 [8] for soft soils(type 1 spectra) and, hence, within the short-period range.
The significant contribution of modes between fgov and fmax = 25 Hz hasbeen verified (higher mode effect), especially in the transverse response ofcable-stayed bridge towers with lower diamond (achieving contributions upto 20%), because the high transverse stiffness of this element can only be
18
fully excited by high-order modes. The upper part of the towers, where thecables are anchored, is sensitive to higher mode effect; analogous results havebeen obtained elsewhere in the top stories of high-rise buildings [23].
6.2. Comparison of the extreme seismic response
The extreme seismic forces obtained with the presently described pushovermethodologies and the reference ‘exact’ result given by nonlinear dynamics(NL-RHA) are compared in this section, excluding the effect of the gravityloads (rG). The standard deviation of the twelve results required in NL-RHA to compute the average is about 10% of such value in all the cases(σ ≈ 0.1µ). The same twelve records have also been applied when solv-ing expression (6) for pushover strategies, obtaining analogous dispersion ofthe results. Only the mean values (µ) are presented in this section both inNL-RHA and pushover analysis, which have been performed using ABAQUS[27].
First, three strategies are compared in figure 8: (1) pushover analysisproposed by different codes with two load patterns (‘Principal mode’ [8]s∗n = mφn and ‘Uniform’ [5] s∗k = mk, where mk is the mass associatedwith the node k), (2) advanced pushover methods (MPA, EMPA and CNSP)and (3) rigorous NL-RHA. The improvement in the results obtained withadvanced pushover analysis is clear in comparison with the simplified strate-gies proposed by codes, particularly employing the ‘Uniform’ load pattern,because high-order modes are neglected and the distribution of inertia forcesmay be unrealistic (e.g. the ‘Triangular pattern’, excluded here, does not takeinto account possible sign reversals of the modal excitation vector). Codepushover procedures typically lead to inadmissible under-predictions of theseismic forces, ranging the errors from 10 to 90%, however, these methodsare not directly applicable to cable-stayed bridges due to the simplificationsinvolved.
Next, some results of the comparison among the extreme seismic forcesobtained with NL-RHA and advanced pushover procedures are presented infigures 9 to 12. The most important aspect to note is the good correlationbetween both strategies, typically ranging the errors from 10 to 20% andmany times on the safe side, which is an outstanding result taking into ac-count that the deviation of the reference NL-RHA forces rounds 10%. Thismeans that the main assumptions made in the mathematical approach ofadvanced pushover analysis are reasonable, i.e.; (1) modal properties remainmainly unchanged (no adaptive pushover analysis is required) and; (2) the
19
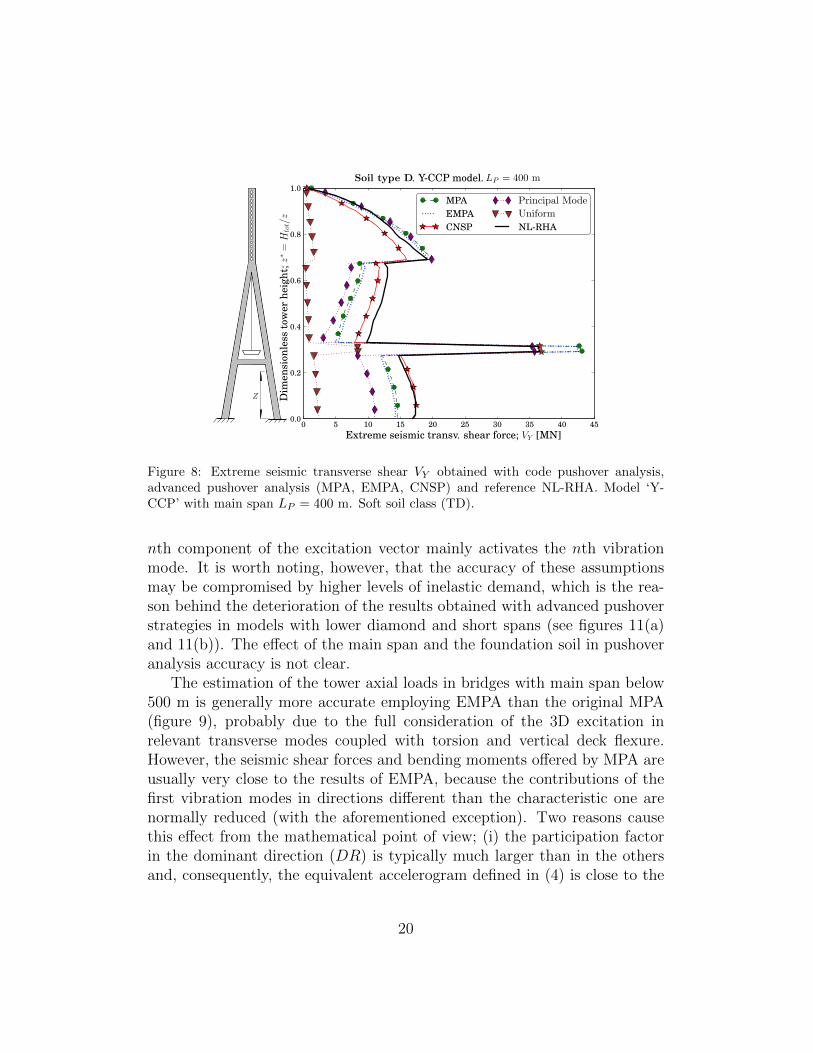
Figure 8: Extreme seismic transverse shear VY obtained with code pushover analysis,advanced pushover analysis (MPA, EMPA, CNSP) and reference NL-RHA. Model ‘Y-CCP’ with main span LP = 400 m. Soft soil class (TD).
nth component of the excitation vector mainly activates the nth vibrationmode. It is worth noting, however, that the accuracy of these assumptionsmay be compromised by higher levels of inelastic demand, which is the rea-son behind the deterioration of the results obtained with advanced pushoverstrategies in models with lower diamond and short spans (see figures 11(a)and 11(b)). The effect of the main span and the foundation soil in pushoveranalysis accuracy is not clear.
The estimation of the tower axial loads in bridges with main span below500 m is generally more accurate employing EMPA than the original MPA(figure 9), probably due to the full consideration of the 3D excitation inrelevant transverse modes coupled with torsion and vertical deck flexure.However, the seismic shear forces and bending moments offered by MPA areusually very close to the results of EMPA, because the contributions of thefirst vibration modes in directions different than the characteristic one arenormally reduced (with the aforementioned exception). Two reasons causethis effect from the mathematical point of view; (i) the participation factorin the dominant direction (DR) is typically much larger than in the othersand, consequently, the equivalent accelerogram defined in (4) is close to the
20
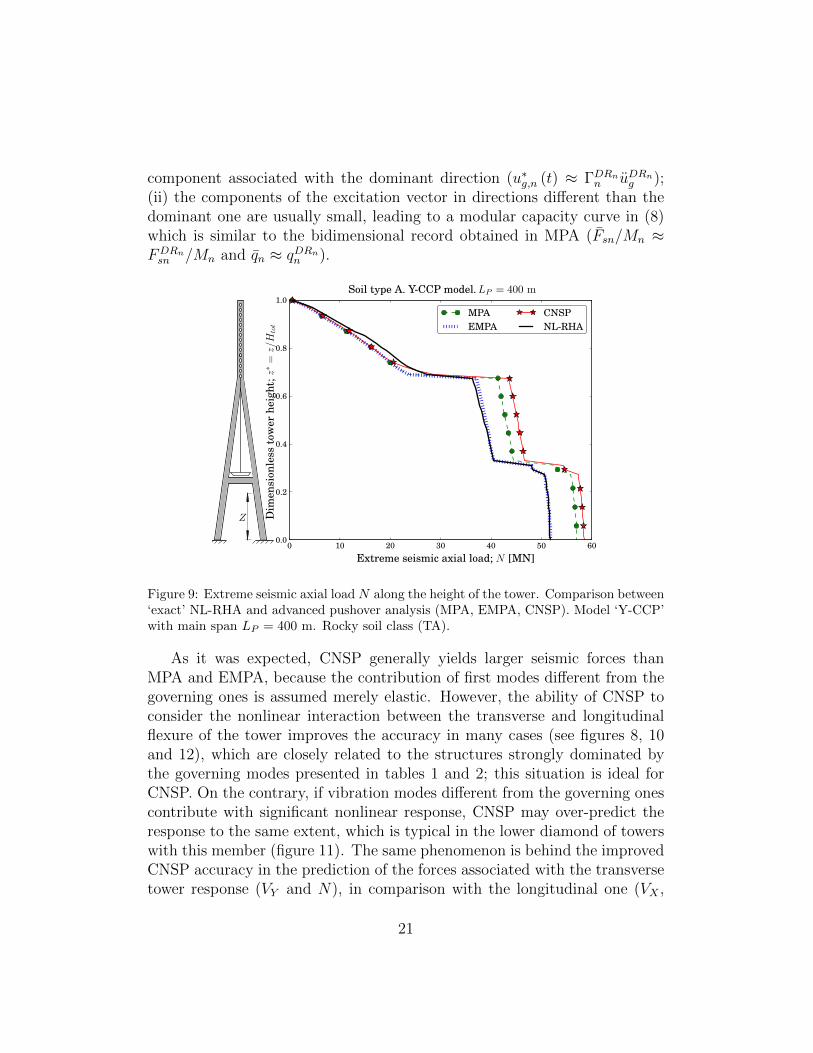
component associated with the dominant direction (u∗g,n (t) ≈ ΓDRnn uDRn
g );(ii) the components of the excitation vector in directions different than thedominant one are usually small, leading to a modular capacity curve in (8)which is similar to the bidimensional record obtained in MPA (Fsn/Mn ≈FDRnsn /Mn and qn ≈ qDRn
n ).
Figure 9: Extreme seismic axial load N along the height of the tower. Comparison between‘exact’ NL-RHA and advanced pushover analysis (MPA, EMPA, CNSP). Model ‘Y-CCP’with main span LP = 400 m. Rocky soil class (TA).
As it was expected, CNSP generally yields larger seismic forces thanMPA and EMPA, because the contribution of first modes different from thegoverning ones is assumed merely elastic. However, the ability of CNSP toconsider the nonlinear interaction between the transverse and longitudinalflexure of the tower improves the accuracy in many cases (see figures 8, 10and 12), which are closely related to the structures strongly dominated bythe governing modes presented in tables 1 and 2; this situation is ideal forCNSP. On the contrary, if vibration modes different from the governing onescontribute with significant nonlinear response, CNSP may over-predict theresponse to the same extent, which is typical in the lower diamond of towerswith this member (figure 11). The same phenomenon is behind the improvedCNSP accuracy in the prediction of the forces associated with the transversetower response (VY and N), in comparison with the longitudinal one (VX ,
21
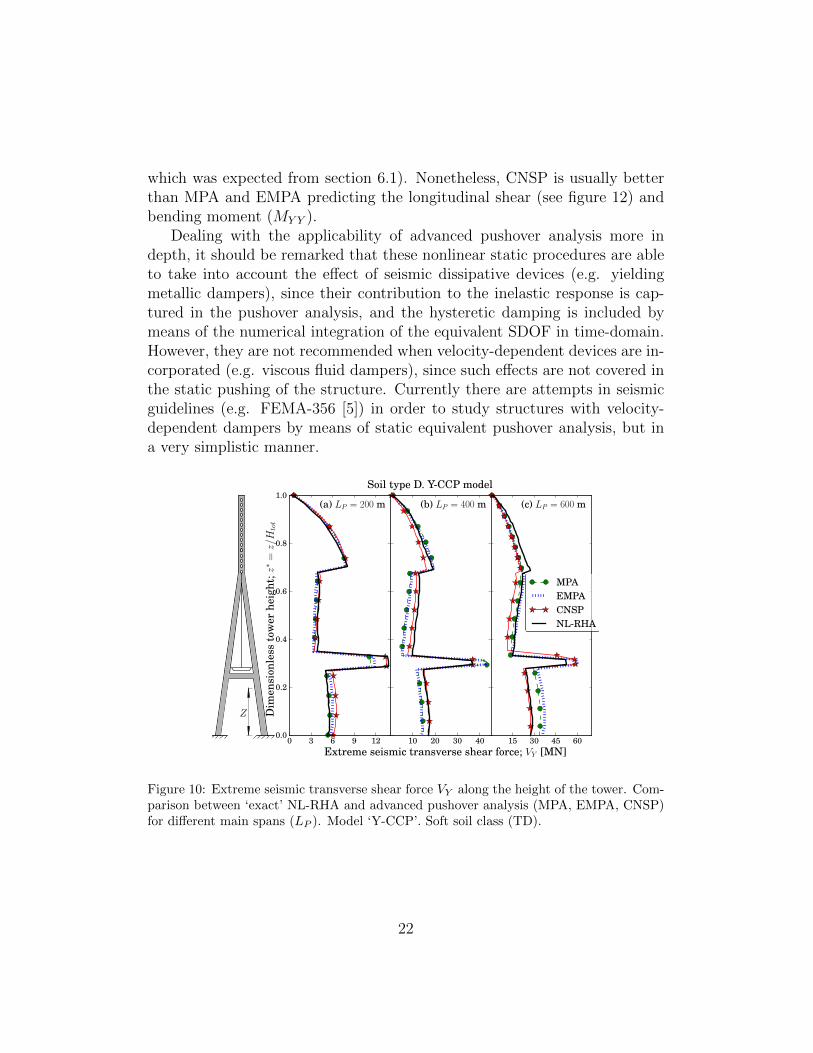
which was expected from section 6.1). Nonetheless, CNSP is usually betterthan MPA and EMPA predicting the longitudinal shear (see figure 12) andbending moment (MY Y ).
Dealing with the applicability of advanced pushover analysis more indepth, it should be remarked that these nonlinear static procedures are ableto take into account the effect of seismic dissipative devices (e.g. yieldingmetallic dampers), since their contribution to the inelastic response is cap-tured in the pushover analysis, and the hysteretic damping is included bymeans of the numerical integration of the equivalent SDOF in time-domain.However, they are not recommended when velocity-dependent devices are in-corporated (e.g. viscous fluid dampers), since such effects are not covered inthe static pushing of the structure. Currently there are attempts in seismicguidelines (e.g. FEMA-356 [5]) in order to study structures with velocity-dependent dampers by means of static equivalent pushover analysis, but ina very simplistic manner.
Figure 10: Extreme seismic transverse shear force VY along the height of the tower. Com-parison between ‘exact’ NL-RHA and advanced pushover analysis (MPA, EMPA, CNSP)for different main spans (LP ). Model ‘Y-CCP’. Soft soil class (TD).
22
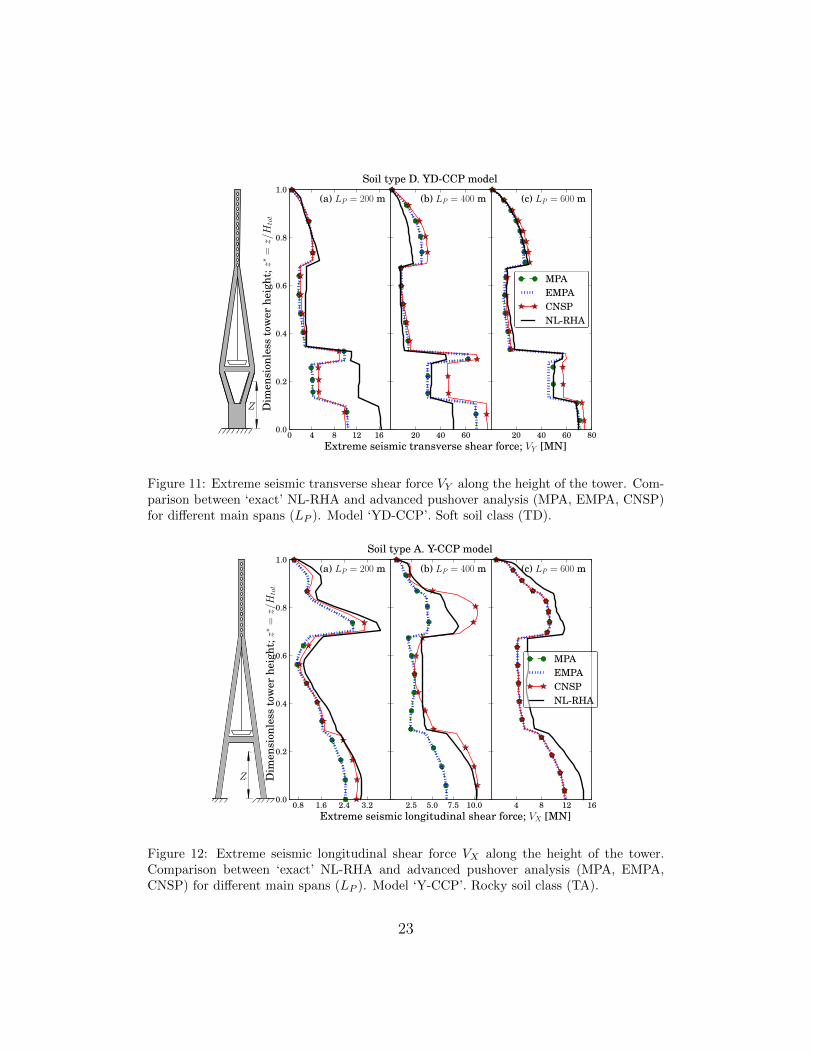
Figure 11: Extreme seismic transverse shear force VY along the height of the tower. Com-parison between ‘exact’ NL-RHA and advanced pushover analysis (MPA, EMPA, CNSP)for different main spans (LP ). Model ‘YD-CCP’. Soft soil class (TD).
Figure 12: Extreme seismic longitudinal shear force VX along the height of the tower.Comparison between ‘exact’ NL-RHA and advanced pushover analysis (MPA, EMPA,CNSP) for different main spans (LP ). Model ‘Y-CCP’. Rocky soil class (TA).
23
CPU timeModel Soil NL-RHA MPA/EMPA CNSPY-CCP TA 5.80 0.30 0.05
TD 34.47 0.75 0.08YD-CCP TA 18.52 0.50 0.06
TD 47.76 0.77 0.11
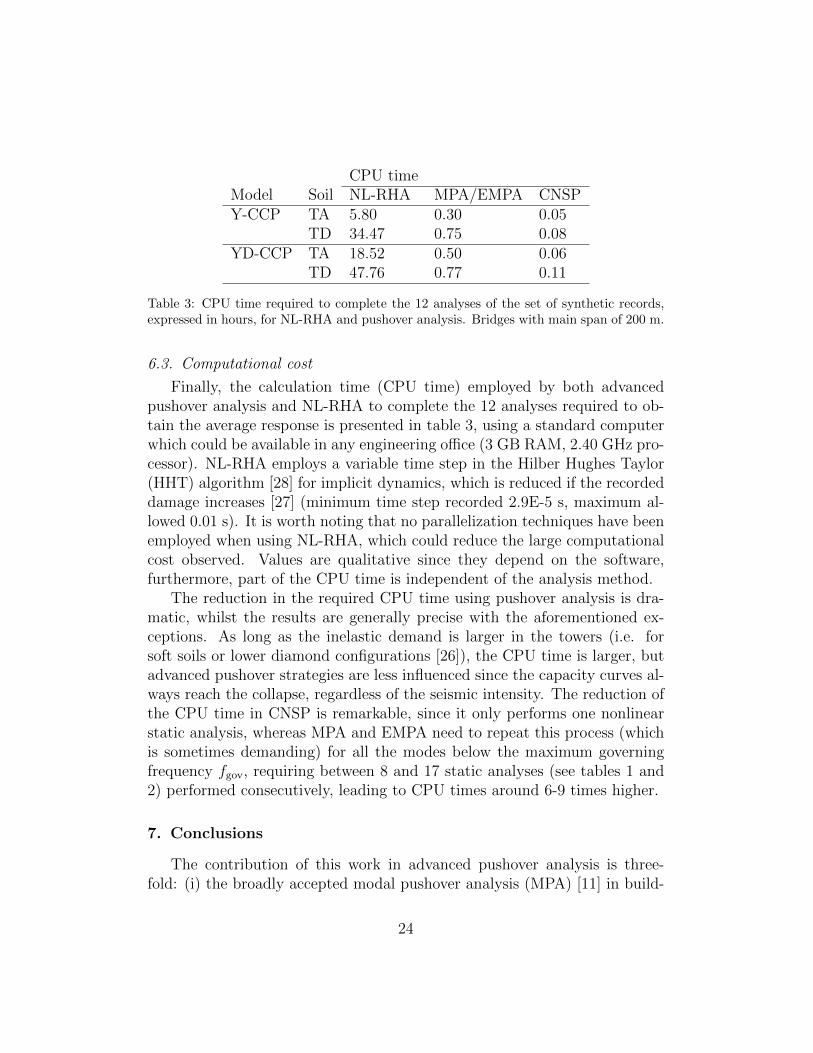
Table 3: CPU time required to complete the 12 analyses of the set of synthetic records,expressed in hours, for NL-RHA and pushover analysis. Bridges with main span of 200 m.
6.3. Computational cost
Finally, the calculation time (CPU time) employed by both advancedpushover analysis and NL-RHA to complete the 12 analyses required to ob-tain the average response is presented in table 3, using a standard computerwhich could be available in any engineering office (3 GB RAM, 2.40 GHz pro-cessor). NL-RHA employs a variable time step in the Hilber Hughes Taylor(HHT) algorithm [28] for implicit dynamics, which is reduced if the recordeddamage increases [27] (minimum time step recorded 2.9E-5 s, maximum al-lowed 0.01 s). It is worth noting that no parallelization techniques have beenemployed when using NL-RHA, which could reduce the large computationalcost observed. Values are qualitative since they depend on the software,furthermore, part of the CPU time is independent of the analysis method.
The reduction in the required CPU time using pushover analysis is dra-matic, whilst the results are generally precise with the aforementioned ex-ceptions. As long as the inelastic demand is larger in the towers (i.e. forsoft soils or lower diamond configurations [26]), the CPU time is larger, butadvanced pushover strategies are less influenced since the capacity curves al-ways reach the collapse, regardless of the seismic intensity. The reduction ofthe CPU time in CNSP is remarkable, since it only performs one nonlinearstatic analysis, whereas MPA and EMPA need to repeat this process (whichis sometimes demanding) for all the modes below the maximum governingfrequency fgov, requiring between 8 and 17 static analyses (see tables 1 and2) performed consecutively, leading to CPU times around 6-9 times higher.
7. Conclusions
The contribution of this work in advanced pushover analysis is three-fold: (i) the broadly accepted modal pushover analysis (MPA) [11] in build-
24
ing structures is adapted to three-axially excited cable-stayed bridges, (ii)an extension of MPA, referred as EMPA, is suggested to fully consider thethree-dimensional effects of the vibration modes and the seismic excitation,and (iii) a procedure named CNSP is proposed in order to take into ac-count the nonlinear coupling between governing longitudinal and transversemodes. The mathematical background of the advanced pushover proceduresproposed in this work has been presented with generality and, hence, theycould be applied to any structure, either bridge or building. The followingconclusions are drawn from this study about 3D pushover procedures in largecable-stayed bridges:
• If the response of a cable-stayed bridge under unexpectedly large earth-quakes needs to be explored, nonlinear dynamics (NL-RHA) is the mostrigorous methodology, but the computational time associated is dis-couraging at the early stages of the structure project, where severaldetails are often changed. Taking into account the reduced calcula-tion time of advanced pushover analysis, and their generally accurateresults (errors are typically below 20%), these methodologies are recom-mended. The final design of the structure should be verified by meansof NL-RHA, especially if inelastic displacement demands obtained inthe pushover analysis reveal strong nonlinearities (which could the caseof bridges with lower diamond and reduced spans), or if special-purposeseismic devices are incorporated, in agreement with Eurocode 8-2 [8].
• The applicability of MPA to cable-stayed bridges has been addressed,suggesting criteria for the selection of the control point, the dominantmodes or the idealization of the capacity curve. Nonetheless, the pre-diction of the tower axial load may be significantly improved by theproposed extension of the original modal pushover analysis (EMPA) inbridges with main span below 500 m, due to the simultaneous participa-tion of several accelerogram components in the excitation of significantcoupled modes. However, EMPA is typically close to MPA in terms ofshear and bending moments, which is explained by the reduced effect ofthe most contributing vibration modes for these measures in directionsdifferent from the dominating one.
• The proposed coupled pushover analysis (CNSP) is generally on the safeside with respect to MPA, EMPA and normally also in comparison withNL-RHA, which is an advantage in the design of any structure. Another
25
advantage of CNSP, apart from the minimum calculation time required,is the reduction in the number of superpositions of nonlinear modalresponses by means of combination rules built upon elastic principles,which are far from rigorous. However, the over-prediction may be toolarge in bridges with lower diamond and moderate spans, since high-order modes are required to excite this stiff member and some of them,assumed elastic, actually introduce nonlinear response.
• The contribution of higher modes (between approximately 1 Hz and25 Hz) is important and, therefore, pushover analysis should includethis effect considering their purely elastic contribution by means ofresponse spectrum analysis. The important weight of several modesin the seismic response is the main reason behind the unacceptableunder-predictions observed in simplified pushover methods proposed byseismic codes or guidelines, which are not recommended in the analysisof cable-stayed bridges. In fact, these structures are not strictly coveredby the pushover analysis specified in Eurocode 8-2 [8].
References
[1] German National Annex - Eurocode 8: Design of structures for earth-quake resistance. Part 1: General rules, seismic actions and rules forbuildings, 2011. Ref.No: DIN EN 1998-1/NA.
[2] ATC-40: Seismic evaluation and retrofit of concrete buildings, 1996.California Seismic Safety Comission.
[3] FEMA-273: NEHRP Guidelines for the seismic rehabilitation of build-ings, Washington DC, 1997.
[4] H. Krawinkler, G. Seneviratna, Pros and cons of a pushover analysisof seismic performance evaluation, Engineering Structures 20 (1998)452–464.
[5] FEMA-356: Prestandard and commentary for the seismic rehabilitationof buildings, Washington DC, 2000.
[6] FEMA-440: Improvements of nonlinear static seismic analysis proce-dures, Washington DC, 2005.
26
[7] P. Fajfar, A nonlinear analysis method for performance based seismicdesign, Earthquake Spectra 16 (2000) 573–592.
[8] Eurocode 8: Design of structures for earthquake resistance. Part 2:Bridges, 2005. Ref.No: EN 1998-2:2005.
[9] Z. Lu, H. Ge, T. Usami, Applicability of pushover analysis-based seismicperformance evaluation procedure for steel arch bridges, EngineeringStructures 26 (2004) 1957–1977.
[10] G. Gosh, Y. Singh, S. Thakkar, Performance-based seismic design of acontinuous bridge, in: Proceedings of the Institution of Civil Engineers,pp. 177–182.
[11] A. Chopra, R. Goel, A modal pushover analysis procedure for estimatingseismic demands for buildings, Earthquake engineering and structuraldynamics 31 (2002) 561–582.
[12] A. Chopra, R. Goel, C. Chintanapakdee, Evaluation of a modifiedmpa procedure assuming higher modes as elastic to estimate seismicdemands, Earthquake Spectra 20 (2004) 757–778.
[13] B. Ferracuti, R. Pinho, M. Savoia, R. Francia, Verification ofdisplacement-based adaptive pushover through multi-ground motion in-cremental dynamic analysis, Engineering Structures 31 (2009) 1789–1799.
[14] B. Gupta, S. Kunnath, Adaptive spectra-based pushover procedure forseismic evaluation of structures, Earthquake Spectra 16(2) (2000) 367–391.
[15] S. Antoniou, R. Pinho, Development and verification of a displacement-based adaptive pushover procedure, Journal of Earthquake Engineering8(5) (2004) 643–661.
[16] V. Papanikolaou, A. Elnashai, J. Pareja, Limits of applicability of con-ventional and adaptive pushover analysis for seismic response assess-ment, Technical Report, Mid - America Earthquake Center, 2005.
[17] A. Abdel-Ghaffar, Cable - stayed bridges under seismic action, in:Cable - stayed Bridges; Recent Developments and their Future, ElsevierScience Ltd., Yokohama (Japan), 1991, pp. 171–192.
27
[18] J. Lin, K. Tsai, Seismic analysis of two-way asymmetric building systemsunder bi-directional seismic ground motions, Earthquake engineeringand structural dynamics 37 (2008) 305–328.
[19] W. Huang, P. Gould, 3-d pushover analysis of a collapsed reinforcedconcrete chimney, Finite Elements in Analysis and Design 43 (2007)879–887.
[20] N. Shattarat, M. Symans, D. McLean, W. Cofer, Evaluation of nonlinearstatic analysis methods and software tools for seismic analysis of highwaybridges, Engineering Structures 30 (2008) 1335 – 1345.
[21] T. Paraskeva, A. Kappos, A. Sextos, Extension of modal pushover anal-ysis to seismic assessment of bridges, Earthquake engineering and struc-tural dynamics 35 (2006) 1269–1293.
[22] J. Simo, T. Hughes, Computational inelasticity, Springer, Stanford(USA), 1998.
[23] A. Chopra, Dynamics of structures, theory and applications to earth-quake engineering, Prentice Hall, University of California, Berkeley,2007. Third edition.
[24] F. Legeron, P. Paultre, J. Mazars, Damage mechanics modelling ofnonlinear seismic behavior of concrete structures, Journal of StructuralEngineering 131 (2005) 946–955.
[25] J. Bommer, C. Ruggeri, The specification of acceleration time-historiesin seismic design codes, European Earthquake Engineering 16 (2002)3–17.
[26] A. Camara, M. Astiz, Typological study of the elastic seismic behaviourof cable-stayed bridges, in: Proceedings of the Eighth European Con-ference on Structural Dynamics (2011), Leuven (Belgium).
[27] ABAQUS, Finite element analysis program; version 6.11, ProvidenceUSA, 2011.
[28] H. Hilber, T. Hughes, R. Taylor, Improved numerical dissipation of timeintegration algorithms in structural dynamics, Earthquake engineeringand structural dynamics 5 (1977) 283–292.
28