purification and properties of human transferrin c and a ... · between transferrin varieties,...
TRANSCRIPT

THE JOURNAL OF BIOLOGICAL CHEMISTRY Vol. 242, No. 10, Issue of May 25, pp. 2507-2513, 1967
Printed in U.S.A.
Purification and Properties of Human Transferrin C and a
Slow Moving Genetic Variant*
(Received for publication, January 28, 1966)
WALTER E. ROOP$ AND FRANK W. PUTNAM$
From the Department of Biochemistry, College of Medicine, University oj Florida, Gainesville, Florida 06321
SUMMARY
Human transferrin C and a genetic variant found by a starch gel electrophoresis screening program were purified and compared structurally. Isolation combined two bulk fractionations, with the use of rivanol and ammonium sulfate, with the more selective procedures of Sephadex G-100 ‘gel Gltration and diethylaminoethyl Sephadex A-50 ion exchange chromatography. Transferrin C and the variant were sep- arated during the latter. The product obtained was ho- mogeneous in the ultracentrifuge (s~~,~ = 5.1 S), in free boundary electrophoresis at several pH values (mobility = -3.03 and -3.63 units for apo- and ferritransferrins C,
respectively, in pH 8.6 Veronal; isoelectric point, p1, of apotransferrin C = 5.5), in immunoelectrophoresis, and in starch gel electrophoresis. Ammo acid analyses agreed with published data but failed to reveal differences between the two varieties.
The peptide map of the Caucasian variant D-G. F. contains all the peptide spots seen in the map from transferrin C and a single additional spot not seen in the latter. The peptide is neutral at pH 6.5 and fails to stain for arginine, histidine, or tyrosine. This variant peptide is assumed to arise from one of two overlapping peptides, from the unresolved “core,” or from a peptide produced from two distinct parts of the molecule.
Genet’ically controlled variant forms that differ in electro- phoretic mobility are now known for several plasma proteins, e.g. haptoglobin (I), transferrin (2), the group specific component Gc (3), and albumin (4). Of these, only for human haptoglobin
* This study was supported in part by Research Grant HE- 02966 from the National Heart Institute, United States Public Health Service. A preliminary report has been presented (ROOP, W. E.. Fed. Proc., 22,649 (1963)). This workis taken in part from a dissertation presented by Walter E. Roop to the Graduate Facultv of the Universitv of Florida in partial fullillment of the requirements for the degree of Doctor of-Philosophy.
$ Present address, Department of Biochemistry, Loma Linda University, Loma Linda, California 92354.
8 Present address, Division of Biological Sciences, Indiana University, Bloomington, Indiana 47401.
has the structural basis been even partially elucidated (5). The existence of numerous variants of human transferrin led us into a study of the structural differences in the various forms.
Although various methods are available for the isolation of these proteins, procedures for the separation of the polymorphic forms have to be developed in each case before structural study of the differences can be undertaken. This is especially true when the low frequency of the variant-determining gene makes isolation of the protein from homozygotes impractical. Such is the case with transferrin. Separation of the genetic variants was therefore necessary in addition to isolation of adequate amounts of highly purified transferrin C,’ the common form. Since available procedures, e.g. those in which ethanol (6), ammonium sulfate (7), and rivano12 (8) are used, failed to sepa- rate the variants, a combination of procedures was devised which rapidly eliminated the bulk of the protein and permitted separa- tion of the variants from transferrin C in the final stage. The material thus obtained was homogeneous by a number of physical and biological criteria. Special care was taken to detect hemo- pexin, which has been reported to be a very common contaminant of transferrin (9). Variants from four individuals have been purified and several others partially purified. A slow moving variant having the mobility of the typically Negro transferrin D13 has been purified from the plasma of a heterozygous Cau- casian donor (G.F.); peptide mapping of this slow moving variant (D-G.F.) revealed a single peptide not identifiable in the map of transferrin C.
1 The nomenclature of human transferrin is based on the follow- ing principles. The common form is C, electrophoretically faster forms (at nH 8.6) are B, and slower forms are D. Subscrints further‘specify the variants; within each group increasing num&i- cal subscrints indicate decreasing mobility. Non-numerical sub- scripts indicate the ethnic group in which, or the place where, the variant was first identified as distinct. Throughout this study, isolated variants have been designated by using the donor’s initials after a hyphen, e.g. D-G.F. With further proof of its distinctness from previously reported proteins, transferrin D-G.F. will be named D-Raiford after the pattern now in use for hemo- globins.
2 Rivanol or ethodin (Winthrop) is 6,9-diamino-2-ethoxyacri- dine lactate.
3 Certain variants are relatively common in and characteristic of particular ethnic groups, e.g. D, in Negroes, Bz in Caucasians, D~hi in Orientals, and Bl-2 in Navaho Indians and some other Amerinds. Other variants are quite rare and apparently are confined to particular families.
2507
by guest on January 13, 2020http://w
ww
.jbc.org/D
ownloaded from

2508 Properties of Transferrin C and Genetic Variant
Plasma
Vol. 242, No. 10
I Precipitate (albumin, etc.) discarded
Precipitate (immunoglobulin) discarded
I Supernatant solution discarded
Transferrin-free fractions discarded
I Transferrin-free fractions discarded
pH 7.5 to 8.5, 25” Fe3+, 0.2 mM; HCO,-, 0.5 mM; citrate, 0.5 mM 1 hour of stirring
pH 9.4; 5”; rivanol, 3.5 volumes of 0.4yo 16 hours of stirring Centrifuge and decant through filter paper
Adsorption chromatography to remove rivanol Sephadex G-25 (medium); 0.025 M ammonium acetate
pH 6.5, 5”, (NHI)$04, 33 g/100 ml 16 hours of stirring Centrifuge and wash three times
pH 6.5, 5”, (NHI)$04, 11 g/100 ml Centrifuge and wash three times
Dissolve in 1 M NaCl-0.1 M Tris-0.06 M HCl, pH 8.0 Fe3+, 0.2 mM; HCO,, 0.5 mMn; citrate, 0.5 mM 1 hour, 25”
Gel filtration with Sephadex G-100, 1 M NaCl
Buffer transfer to 0.1 M Tris, 0.06 M HCl, pH 8.0, with Sephadex G-25 (medium)
Ion exchange chromatography on DEAE-Sephadex A-50 (medium)-0.1 M Tris-0.06 M HCI, pH 8.0, linear gradient to 0.5 M Tris-0.3 M HCl, pH 8.0
Desalting with Sephadex G-25 medium, deionized water Lyophilize
Transferrin
FIG. 1. Flow sheet showing the method used to prepare human transferrin and separate its variants
EXPERIMENTAL PROCEDURE
Acid-citrate-dextrose or EDTA plasma was obtained from healthy donors;4 the donors of variant-containing plasma had been identified by a screening program based on starch gel elec- trophoresis and radioautography. Details are to be published elsewhere.
Isolation of Transferrin-The procedure developed for the purification of human transferrin and the separation of the genetic varieties from the plasma of heterozygotes is based on the following principles: (a) stabilization of the transferrin by saturation with iron; (6) batchwise removal of most of the un- wanted proteins by two methods which would not differentiate between transferrin varieties, namely, rivanol precipitation of albumin and most of the other plasma proteins, and ammonium sulfate fractionation of the supernatant solution from which the rivanol had been removed, and (c) final purification by two methods differing in principle, namely, gel filtration based on molecular size and ion exchange chromatography based on molecular charge. Since the equal sized genetic varieties differ in charge, it was possible in the last step to separate them from each other. The conditions used are given in flow sheet form in Fig. 1.
The steps involving gel filtration and ion exchange chroma-
4 Samples of blood for screening and isolation of transferrin were kindly provided by the University of Florida Teaching Hospital Blood Bank through the courtesy of Drs. John B. Henry and F. William Sunderman, Jr.
tography were carried out on the Beckman model 130 Spec- trochrom, with refrigerated columns and fraction collector. The pH and conductivity of the column effluent and its optical density at three wave lengths were monitored; the wave lengths selected in this study were 280 rnp for total protein, 410 rnp for heme-containing proteins, and 460 rnp for transferrin.
Preparation of Apotransferrin-Iron was removed from trans- ferrin by dissolving the latter (1 g) in Tris-citrate buffer (10 ml of 0.6 M Tris-0.3 M citric acid, pH 5.0) and allowing the re- sultant solution to stand at room temperature for 1 hour. The solution was then desalted by passage through a column of Sephadex G-25 pre-equilibrated with deionized water. The apotransferrin-containing solution was then lyophlized.
Immunoelectrophoreti Analysis (10)-A solution of the antigen (0.15 mg per ml) was subjected to electrophoresis in a thin layer of agar gel on a microscope slide. The gel contained agar (lo/,) in 0.025 M Verona1 buffer, pH 8.6. The precipitin patterns were developed with commercial antisera against whole human serum; one antiserum was used even though it was deficient in antibodies against albumin, since it contained antibodies against hemopexin (which frequently contaminates transferrin prkparations).2
Starch Gel ElectrophoresisStarch gel electrophoresis was performed with the use of the discontinuous buffer system of Poulik (11) and “starch-hydrolyzed” (Connaught Medical Research Laboratories). Radioautography with 59Fe was carried out by the method of Giblett, Hickman, and Smithies (12). The transferrin variants found were identified by com-
by guest on January 13, 2020http://w
ww
.jbc.org/D
ownloaded from

Issue of May 25, 1967 W. E. Roop and F. W. Putnam 2509
0.0 260 m/A
5.6 1
40 -I A
4.0-
3.2-
2.4 -
,.6;-‘-: ‘, 0. D. 460 m+
.3 OS
/-\ .2
-c-------m- ,’ ’ 0 ,* l --.
:
-.I
I I I 600
I 700 900
I SW 1000 1100
ELUATE VOLUME (ml)
FIG. 2. Effluent diagram of a partially purified preparation of transferrin. The fraction precipitated from reagent-free, super- natant solution of the rivanol step by 55 to 72% saturation with ammonium sulfate was used. It was dissolved in 0.15 M sodium chloride and 20 ml was applied to a column of Sephadex G-100 (100 n). The same solvent was used for develonment. The temperature was 5’. Fractions contained 10 ml and were collected at 30 ml per hour. -, absorbance at 286 mp; - - -, absorbance at 460 rnp.
with 6 M HCl. The analysis was carried out with the Beckman model 120 amino acid analyzer and the 50” system of Spackman, Stein, and Moore (15).
Peptide Mapping-Performic acid-oxidized protein (16) was digested with twice crystallized trypsin (Worthington) (17) for 20 to 24 hours at 37” in 0.02 M ammonium bicarbonate buffer, pH 8.0. The resultant peptide mixture was mapped according to the procedure of Katz, Dreyer, and Anfinsen (18) with the use of the organic phase from a mixture of butanol-acetic acid-water (4 : 1: 5, v/v/v) for chromatography; electrophoresis was con- ducted in the second dimension with a Gilson Medical Elec- tronics model D high voltage electrophorator with a pH 3.7 buffer of pyridine-acetic acid-water (1:10:289). Peptides were detected by staining with ninhydrin for amino groups, by the Sakaguchi reaction for arginine, by the Pauly reaction for histidine and tyrosine, and by the nitrosonaphthol reaction for tyrosine (19).
RESULTS AND DISCUSSION
In order to locate individuals with transferrin variants, samples of blood from blood bank donors were obtained and examined by starch gel electrophoresis. The ability of presumptive transferrin variants to bind iron was demonstrated by radio- autography. The individual variants were identified by com- parison of their starch gel electrophoretic mobility with that of
FIG. 3. Starch gel pattern showing the separation of protein components obtained by gel filtration of Sephadex G-100. The
right, were taken at regular intervals from the protein-containing fractions. Starch gel electrophoresis was carried out in the
preparation applied to the column was obtained as in Fig. 2, but is not the same preparation. Successive samples, from left to
discontinuous Tris-citrate-borate buffer system. Reference sera were included on each gel.
parison with published patterns, with each other, and with authentic samples in the case of transferrins BZ and Di, and by reference samples of serum of transferrin Types B&, CDr, and comparison with published photographs (20) of starch gel CDa.5 patterns in the case of transferrin Br.
Free Boundary Electrophoresis-The protein was examined As previously mentioned, the rarity of individuals homozygous with the Beckman model H electrophoresis diffusion apparatus for transferrin variants requires that a satisfactory procedure at a concentration of 1 y0 in the standard 0.1-p buffers of Longs- for isolating transferrin for structural studies not only should worth (13) and of Alberty (14). give a product of high purity, but should also separate two
Ultracentrifugal Analysis--The protein was examined at a varieties present in the same starting material. The final proce- concentration of 10 mg per ml in 0.15% NaCl in the Beckman dure, summarized in Fig. 1, proved capable of meeting both model E analytical ultracentrifuge. requirements. The isolation procedure originally planned had
Amino Acid Analysis--The protein was desalted with Sepha- two steps: first, rivanol precipitation of albumin and most of dex G-25 and dried in a vacuum over concentrated sulfuric acid. the other plasma proteins except immunoglobulins (8) ; second, This protein was hydrolyzed at 105” for 22 hours in a vacuum ion exchange chromatography (21) on DEAE-cellulose to remove
6 Samples of plasma of transferrin types B&, CDr, and CD8 the immunoglobulins and any remaining contaminants. It was
were graciously provided by Dr. Eloise R. Giblett of the Seattle found that loss of transferrin resulted from the use of charcoal Blood Bank, Seattle, Washington. recommended (8) to remove excess rivanol from the supernatant
by guest on January 13, 2020http://w
ww
.jbc.org/D
ownloaded from

2510 Properties of Transjerrin C and Genetic Variant Vol. 242, No. 10
solution after precipitation of the bulk of the proteins. An rivanol could not be eluted from the column even by prolonged attempt was then made to remove the rivanol by gel filtration. washing with distilled water. A dilute ammonium acetate Upon attempted gel filtration with Sephadex G-25, the rivanol solution (0.025 M) gradually eluted the rivanol upon prolonged was indeed removed from the solution. The mechanism of washing. removal was not gel filtration, however, but adsorption. The When DEAE-cellulose was tried as a means for fractionation
(21), it was found that flow rates were objectionably slow,
-0 mmho resolution was inadequate, and reproducibility was poor.
conduciwily In the exploratory work ammonium sulfate fractionation of -2 the rivanol-free supernatant solution was used as an alternate
to ion exchange chromatography. Subsequently, ammonium sulfate fractionation was adopted as a method of achieving a second bulk separation with simultaneous concentration of the transferrin. In this way the greater part of the remaining non- transferrin protein (mainly immunoglobulin) was removed.
After both the Spectrochrom apparatus and Sephadex G-100 became available, they were used to complete the purification.
0 It was considered important to use two relatively independent -.I0 0 methods for the final steps in the purification. In this way
impurities which failed to separate by one method could probably .I- be eliminated by the other. Gel filtration on Sephadex G-100
0 100 200 300 400 500 600 700 800 900 IO00 1100 was selected for the first of these. A high salt concentration
ELUATE VOLUME Iml) (1 M NaCl) was used to minimize protein-protein interactions.
FIG. 4. Effluent diagram of partially purified preparation of The elution diagram is shown in Fig. 2; the protein separation
transferrin. The transferrin-containing fractions from Sephadex in Fig. 3.
G-100 were transferred to 0.02 M phosphate buffer at pH 6.6 and The final method used in the fractionation scheme was ion applied to a column, 32 X 1.9 cm, of DEAELSephadex A-50 me- exchange chromatography. The ion exchanger used, DEAE- dium equilibrated with the same solvent. Fractions contained 10 ml and were collected at 50 ml per hour. Proteins were e*uted by
Sephadex A-50, has the advantages of greater capacity, greater
a linear concentration gradient of sodium chloride to 1 M. flow rates, and less tendency toward irreversible adsorption than
-, absorbance at 280 rnp; - - -, absorbance at 460 q. The upper line DEAE-cellulose. A linear concent.ration gradient, pH 8.0 indicates the conductivity of the effluent. The temperature was (0.1 to 0.5 M), of alkaline Tris buffer was used to avoid loss of 5”. iron from the transferrin. The color of the complex was used
FIG. 5. Starch gel pattern showing the separation of com- intervals from the protein-containing fractions. ponents obtained by ion exchange chromatography on DEAE-
Electrophoresis was as in Fig. 3. The preparation shown contained both trans-
Sephadex A-50 medium. The preparation applied to the column ferrin C and transferrin Dr. was obtained from the transferrin-containing fractions from gel
These are largely separated from each other and from the other proteins. X represents an un-
filtration. Samples, from right to left, were taken at regular identified contaminant.
by guest on January 13, 2020http://w
ww
.jbc.org/D
ownloaded from
2511 Issue of May 25, 1967 W. E. Roop and F. W. Putnum
to detect the presence of transferrin in the effluent. An elution diagram is shown in Fig. 4. It was important to maintain the transferrin in the iron-saturated form to prevent artifactual multiplication of peaks with greater risk of overlap with a con- taminant. Use of the ion exchanger was reserved until last to permit it to separate the genetic varieties after maximum pre- bJL1 liminary purification. The possibility of rechromatographmg the transferrin in the iron-free form was held in reserve should the product be nonhomogeneous, but this proved unnecessary, LLJ- as is seen from the starch gel electrophoresis pattern shown in Fig. 5.
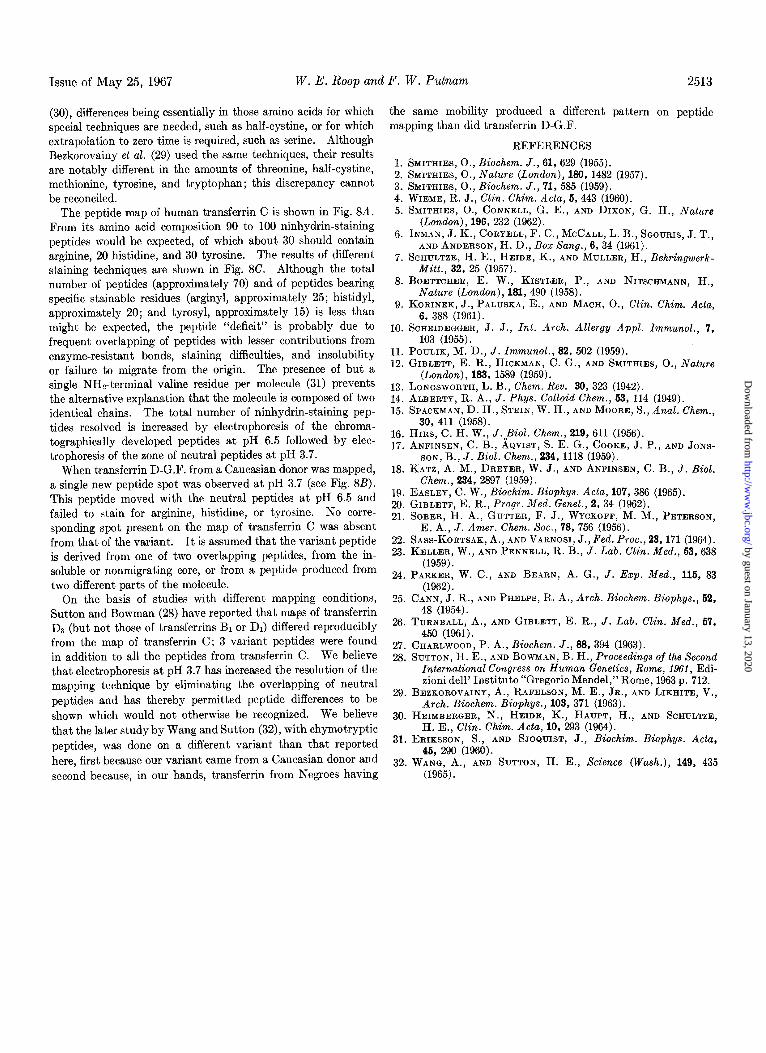
The preparations of transferrin obtained by this procedure were homogeneous in starch gel electrophoresis. A preparation of apotransferrin C failed to separate from the iron-containing form, in agreement with the absence of separate zones in samples of plasma. This phenomenon has since been explained by the presence in the starch of iron which converts the apo form to rd -d the ferri form during electrophoresis (22). FIG. 7. Representative Tiselius electrophoresis diagrams of
transferrin C at different pH values. Vertical lines indicate the initial boundaries; horizontal arrows, the direction of migration. a, apotransferrin C, pH 9.69,4.65 volts per cm, 15.0 thousand see; b, ferritransferrin C, pH 8.60, 6.75 volts per cm, 9.0 thousand see; c, apotransferrin C, pH 7.51, 3.81 volts per cm, 14.8 thousand see; d, apotransferrin C, pH 6.15,3.96 volts per cm, 27.0 thousand set; and e, a partially purified preparation containing transferrins Bz and C. The two major peaks represent transferrins C and Bz, and are seen to be approximately equal in area. Of the two, B) is the faster moving.
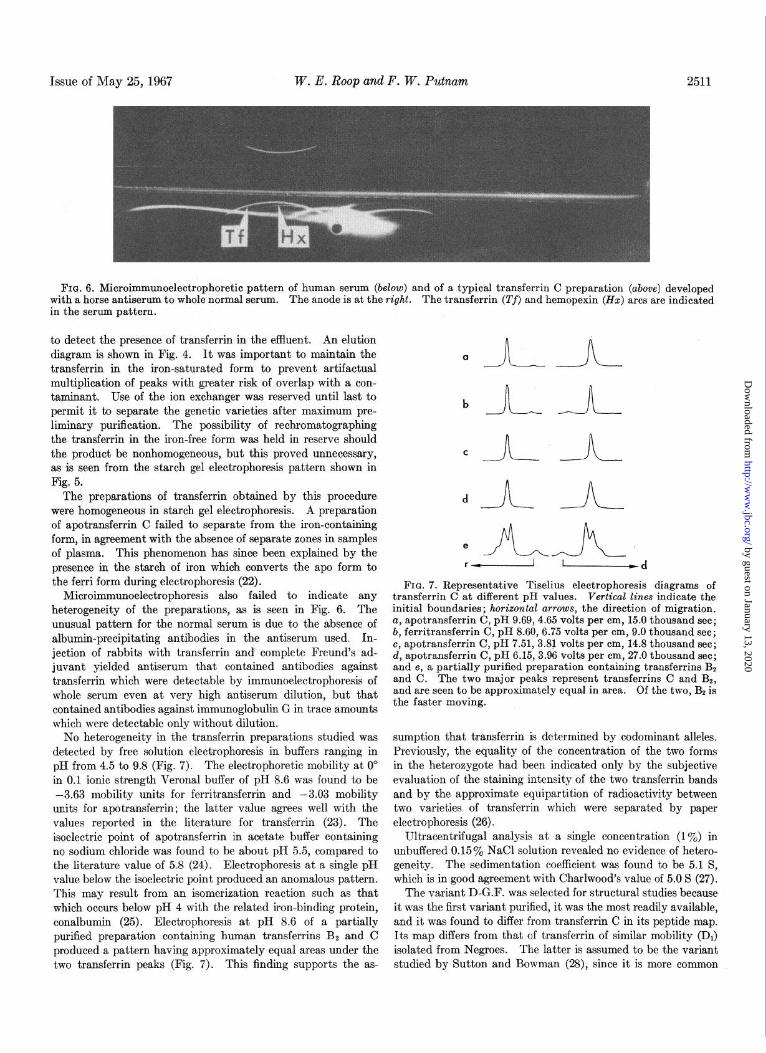
FIQ. 6. Microimmunoelectrophoretic pattern of human serum (below) and of a typical transferrin C preparation (above) developed with a horse antiserum to whole normal serum. The anode is at the right. The transferrin (Tf) and hemopexin (HZ) arcs are indicated in the serum pattern.
Microimmunoelectrophoresis also failed to indicate any heterogeneity of the preparations, as is seen in Fig. 6. The unusual pattern for the normal serum is due to the absence of albumin-precipitating antibodies in the antiserum used. In- jection of rabbits with transferrin and complete Freund’s ad- juvant yielded antiserum that contained antibodies against transferrin which were detectable by immunoelectrophoresis of whole serum even at very high antiserum dilution, but that contained antibodies against immunoglobulin G in trace amounts which were detectable only without dilution.
No heterogeneity in the transferrin preparations studied was detected by free solution electrophoresis in buffers ranging in pH from 4.5 to 9.8 (Fig. 7). The electrophoretic mobility at 0” in 0.1 ionic strength Verona1 buffer of pH 8.6 was found to be -3.63 mobility units for ferritransferrin and -3.03 mobility
units for apotransferrin; the latter value agrees well with the values reported in the literature for transferrin (23). The isoelectric point of apotransferrin in acetate buffer containing no sodium chloride was found to be about pH 5.5, compared to the literature value of 5.8 (24). Electrophoresis at a single pH value below the isoelectric point produced an anomalous pattern. This may result from an isomerisation reaction such as that which occurs below pH 4 with the related iron-binding protein, conalbumin (25). Electrophoresis at pH 8.6 of a partially purified preparation containing human transferrins Bz and C produced a pattern having approximately equal areas under the two transferrin peaks (Fig. 7). This finding supports the as-
sumption that transferrin is determined by codominant alleles. Previously, the equality of the concentration of the two forms in the heterozygote had been indicated only by the subjective evaluation of the staining intensity of the two transferrin bands and by the approximate equipartition of radioactivity between two varieties of transferrin which were separated by paper electrophoresis (26).
Ultracentrifugal analysis at a single concentration (1%) in unbuffered 0.15% NaCl solution revealed no evidence of hetero- geneity. The sedimentation coefficient was found to be 5.1 S, which is in good agreement with Charlwood’s value of 5.0 S (27).
The variant D-G.F. was selected for structural studies because it was the first variant purified, it was the most readily available, and it was found to differ from transferrin C in its peptide map. Its map differs from that of transferrin of similar mobility (Dr) isolated from Negroes. The latter is assumed to be the variant studied by Sutton and Bowman (28), since it is more common
by guest on January 13, 2020http://w
ww
.jbc.org/D
ownloaded from

2512 Properties of Transjerrin C and Genetic Variunf Vol. 242, No. 10
TABLE I Amino acid compbsition of human transfer&
All data have been calculated so that the weight of amino acid residues recovered (excluding tryptophyl when determined) equals 83,773. After addition of 8 tryptophyl, 4 N-acetyl-neura- minyl, 8 IV-acetylglucosaminyl, and 12 hexosyl residues, a molecu- lar weight of 90,000 is obtained. This value was used since Charl- wood’s lower value (27) has not been confirmed and he himself, in a personal communication, reported I r nolecular weight vulucs closer to those of others (7, 8) than hr !h ad nreviouslv calculated.
Residue
Lysine .............. Histidine ........... Arginine. ........... Aspartic acid. ...... Threonine .......... Serine .............. Glutamic acid. Proline ............. Glycine ............. Alanine ............. Half-cystined ........ Valine .............. Methionined. ........ Isoleucine .......... Leucine. ............ Tyrosine ............ Phenylalanine ......
Totals. ..... .......
Tryptophan.. 8
-
1
-
67.5 67.6 65.9 68.8” 69.0 21.5 21.0 20.9 24.50 22.3 30.1 30.6 30.7 28. 2c 30.2 91.0 93.6 90.0 91.2c 90.7 33.5 34.6 35.1c 29.1C 33.7c 42.9 44.9 46.10 44.6” 44. lc 66.1 68.5 68.1 70.Sc 72.6 38.8 40.0 39.5 40.0 36.0 58.0 57.2 56.0 60.7~ 55.2 65.7 68.9 64.8 65.0c 64.4 39.6 39.5 43.9” 26.7 45.5c 48.7 46.8 51.6 53.0” 49.9” 9.4 9.2 11.0” 27.2 9.2
16.8 16.2 16.5 15.8” 17.0 69.8 67.2 65.9 65.e 66.5 29.1 27.9 28.6 20.0 25.8” 33.2 34.4 30.7 34.3” 31.6
762 768 765 765 764
-
P ’ B
--
-
Literature values, transferrin C
25 10
* Average of six determinations. b Average of four determinations. c Corrected by extrapolation or prior oxidation of sample. d Includes oxidized forms.
and therefore more likely to occur in homozygous form as they found it. The difference found between variants with similar mobility (D-G.F. and DJ makes advisable the practice, used throughout our studies, of not pooling variant-containing plasma from different individuals.
The amino acid compositions of transferrins C and D-G.F. are given in Table I. For comparison, the analyses of Parker and Bearn (24), of Bezkorovainy et al. (29), and of Heimberger et al. (30) have been recalculated to the same basis and are included in the table. The differences between our analyses of transferrins C and D-G.F. are not considered significant in view of the reported precision of ~3% for the methods (15) and in view of the variations between individual analyses. In any case, the apparent differences between transferrins C and D-G.F. would not account for the differences in their electrophoretic mobilities. Our results for transferrin C are in good agreement with those of Parker and Bearn (24) and of Heimberger et al.
. , Tyrosine Sakoguchi @ Fuuly 7::
FIG. 8. A, tryptic peptide maps at pH 3.7 of performic acid- oxidized transferrin C. B, tryptic peptide map at pH 3.7 of performic acid-oxidized transferrin D-G. F. C, composite dia- gram of pH 3.7 tryptic peptide maps of performic acid-oxidized transferrin C showing the staining characteristics of the peptides.
by guest on January 13, 2020http://w
ww
.jbc.org/D
ownloaded from
Issue of May 25, 1967 W. E. Roop and F. W. Putnam 2513
(30), differences being essentially in those amino acids for which special techniques are needed, such as half-cystine, or for which extrapolation to zero time is required, such as serine. Although Bezkorovainy et al. (29) used the same techniques, their results are notably different in the amounts of threonine, half-cystine, methionine, tyrosine, and tryptophan; this discrepancy cannot be reconciled.
The peptide map of human transferrin C is shown in Fig. 34. From its amino acid composition 90 to 100 ninhydrin-staining peptides would be expected, of which about 30 should contain arginine, 20 histidine, and 30 tyrosine. The results of different staining techniques are shown in Fig. SC. Although the total number of peptides (approximately 70) and of peptides bearing specific stainable residues (arginyl, approximately 25; histidyl, approximately 20; and tyrosyl, approximately 15) is less than might be expected, the peptide “deficit” is probably due to frequent overlapping of peptides with lesser contributions from enzyme-resistant bonds, staining difficulties, and insolubility or failure to migrate from the origin. The presence of but a single NHz-terminal valine residue per molecule (31) prevents the alternative explanation that the molecule is composed of two identical chains. The total number of ninhydrin-staining pep- tides resolved is increased by electrophoresis of the chroma- tographically developed peptides at pH 6.5 followed by elec- trophoresis of the zone of neutral peptides at pH 3.7.
When transferrin D-G.F. from a Caucasian donor was mapped, a single new peptide spot was observed at pH 3.7 (see Fig. 8B). This peptide moved with the neutral peptides at pH 6.5 and failed to stain for arginine, histidine, or tyrosine. No corre- sponding spot present on the map of transferrin C was absent from that of the variant. It is assumed that the variant peptide is derived from one of two overlapping peptides, from the in- soluble or nonmigrating core, or from a peptide produced from two different parts of the molecule.
On the basis of studies with different mapping conditions, Sutton and Bowman (28) have reported that maps of transferrin DS (but not those of transferrins B1 or Dr) differed reproducibly from the map of transferrin C; 3 variant peptides were found in addition to all the peptides from transferrin C. We believe that electrophoresis at pH 3.7 has increased the resolution of the mapping technique by eliminating the overlapping of neutral peptides and has thereby permitted peptide differences to be shown which would not otherwise be recognized. We believe that the later study by Wang and Sutton (32), with chymotryptic peptides, was done on a different variant than that reported here, first because our variant came from a Caucasian donor and second because, in our hands, transferrin from Negroes having
the same mobility produced a different pattern on peptide mapping than did transferrin D-G.F.
1. SMITHIES, O., B&hem. J., 61, 629 (1955). 2. SMITHIES, O., Nature (London), 180, 1482 (1957). 3. SMITHIES, O., Biochem. J., 71,585 (1959).
WIEME. R. J.. Clin. Chim. Acta. 6.443 (1960). 4. 5. SMITH&S, 0.; CONNELL, G. E:, END DIXON, G. H., Natnre
(London), 196, 232 (1962). 6.
7.
INMAN, J. K., CORYELL, F. C., MCCALL, L. B., SGOURIS, J. T., AND ANDERSON, H. D., Box Sang., 6,34 (1961).
SCHULTZE, H. E., HEIDE, K., AND MULLER, H., Behringwerk- Mitt., 32, 25 (1957).
8.
9.
BOETTCHER, E. W., KISTLER, P., AND NITSCHMANN, H., Nature (London), 181, 490 (1958).
KORINEK, J., PALUSKA, E., AND MACH, O., Clin. Chim. Acta, 6, 388 (1961).
10. SCHEIDEGGER, J. J., Int. Arch. Allergy Appl. Immunol., 7, 103 (1955).
11. POULIK, M. D., .I. Immunol., 82, 502 (1959). 12. GIBLETT, E. R., HICKMAN, C. G., AND SMITHIES, 0.. Nat?lre
I I
(London), 183, 1589 (1959). 13. 14. 15.
LONGSWORTH. L. B.. Chem. Rev. 30, 323 (1942). ALBERTY, R. ‘A., J. ‘Phys. Colloid Chem., 63, 114 (1949). SPACKMAN, D. H., STEIN, W. H., AND MOORE, S., Anal. Chem.,
30, 411 (1958). 16. 17.
18.
HIRS, C. H. W., J.OBiol. Chem., 219, 611 (1956). ANFINSEN, C. B., AQVIST, S. E. G., COOKE, J. P., AND JONS-
SON, B., J. Biol. Chem., 234, 1118 (1959). KATZ. A. M.. DREYER. W. J., AND ANFINSEN. C. B.. J. Bial.
19. 20. 21.
22. 23.
Chem., 234; 2897 (1959). EASLEY, C. W., Biochim. Biophys. Acta, 107, 386 (1965). GIBLETT, E. R., Progr. Med. Genet., 2, 34 (1962). SOBER, H. A., GUTTER, F. J., WYCKOFF, M. M., PETERSON,
E. A., J. Amer. Chem. Sot., 78, 756 (1956). SASS-K• RTSAK, A., AND VARNOSI, J., Fed. Proc., 23, 171 (1964). KELLER, W., AND PENNELL, R. B., J. Lab. Clin. Med., 63, 638
(1959). 24. PARKER, W. C., AND BE.IRN, A. G., J. Exp. Med., 116, 83
(1962).
REFERENCES
25. CANN, J. R., AND PHELPS, R. A., Arch. Biochem. Biophys., 62, 48 (1954).
26. TURNBALL. A., AND GIBLETT, E. R., J. Lab. Clin. Med.. 67. 450 (1961).
I
27. CHARLWOOD, P. A., Biochem. J., 66, 394 (1963). 28. SUTTON. H. E.. AND BOWMAN, B. H.. Proceedinas of the Second
Interrkionai Congress on kuman Genetics, Rim;, 1961, Edi- zioni dell’ Institute “Gregorio Mendel,” Rome, 1963 p. 712.
29. BEZKOROVAINY, A., RAFELSON, M. E., JR., AND LIKHITE, V., Arch. Biochem. Biophys., 103, 371 (1963).
30. HEIMBERGER, N., HEIDE, K., HAUPT, H., AND SCHULTZE, H. E., Clin. Chim. Acta, 10, 293 (1964).
31. ERIKSSON, S., AND SJOQUIST, J., Biochim. Biophys. Acta, 46, 290 (1960).
32. WANG, A., AND SUTTON, H. E., Science (Wash.), 149, 435 (1965).
by guest on January 13, 2020http://w
ww
.jbc.org/D
ownloaded from
Walter E. Roop and Frank W. PutnamGenetic Variant
Purification and Properties of Human Transferrin C and a Slow Moving
1967, 242:2507-2513.J. Biol. Chem.
http://www.jbc.org/content/242/10/2507Access the most updated version of this article at
Alerts:
When a correction for this article is posted•
When this article is cited•
to choose from all of JBC's e-mail alertsClick here
http://www.jbc.org/content/242/10/2507.full.html#ref-list-1
This article cites 0 references, 0 of which can be accessed free at
by guest on January 13, 2020http://w
ww
.jbc.org/D
ownloaded from