pure.uva.nl · fusarium oxysporum from iridaceous crops: analysis of genetic diversity and host...
TRANSCRIPT
UvA-DARE is a service provided by the library of the University of Amsterdam (http://dare.uva.nl)
UvA-DARE (Digital Academic Repository)
Fusarium oxysporum from iridaceous crops: analysis of genetic diversity and hostspecialisationRoebroeck, E.J.A.
Link to publication
Citation for published version (APA):Roebroeck, E. J. A. (2000). Fusarium oxysporum from iridaceous crops: analysis of genetic diversity and hostspecialisation
General rightsIt is not permitted to download or to forward/distribute the text or part of it without the consent of the author(s) and/or copyright holder(s),other than for strictly personal, individual use, unless the work is under an open content license (like Creative Commons).
Disclaimer/Complaints regulationsIf you believe that digital publication of certain material infringes any of your rights or (privacy) interests, please let the Library know, statingyour reasons. In case of a legitimate complaint, the Library will make the material inaccessible and/or remove it from the website. Please Askthe Library: http://uba.uva.nl/en/contact, or a letter to: Library of the University of Amsterdam, Secretariat, Singel 425, 1012 WP Amsterdam,The Netherlands. You will be contacted as soon as possible.
Download date: 29 May 2018
Fusarium oxysporum from iridaceous crops:
analysis of genetic diversity and host specialisation
ACADEMISCH PROEFSCHRIFT
ter verkrijging van de graad van doctor aan de Universiteit van Amsterdam op gezag van Rector Magnificus prof. dr J.J.M. Franse
ten overstaan van een door het college voor promoties ingestelde commissie, in het openbaar te verdedigen in de Aula der Universiteit
op dinsdag 6 juni 2000, te 12.00 uur
door
Eugène Joannes Augustinus Roebroeck
geboren te Maastricht
Promotiecommissie Promotor: prof. dr B.J.C. Cornelissen Co-promotor: dr P.M. Boonekamp Commissieleden: prof. dr H. van den Ende prof. dr A.W. Schram prof. dr ir P.J.G.M. de Wit prof. dr ir L.C. van Loon dr M.A. Haring dr R.P. Baayen Faculteit der Natuurwetenschappen, Wiskunde en Informatica Het onderzoek beschreven in dit proefschrift werd uitgevoerd op het Laboratorium voor Bloembollenonderzoek te Lisse. Druk & omslag: MultiCopy Sassenheim ISBN 90-9013802-1
TABLE OF CONTENT
CHAPTER 1 Introduction 5
CHAPTER 2 Genetic diversity within a collection of isolates of 9
Fusarium oxysporum from iridaceous crops:
Vegetative compatibility groups and physiologic races
CHAPTER 3 Genetic diversity within a collection of isolates of 29
Fusarium oxysporum from iridaceous crops:
RFLP- and AFLP- fingerprints
CHAPTER 4 Parasexual recombination between race 1 and race 2n 45
isolates of Fusarium oxysporum f.sp. iridacearum by
hyphal anastomosis and protoplasts fusion
CHAPTER 5 A dispensable region from a 2.1-Mb chromosome of 63
a race 1 isolate of Fusarium oxysporum f.sp. iridacearum
harbours sequences correlated with pathogenicity
to large-flowered gladiolus ‘Peter Pears’
CHAPTER 6 Identification of a cosmid contig spanning one of the 81
borders of a putative race specific dispensable region
from a race 1 isolate of Fusarium oxysporum f.sp. iridacearum
CHAPTER 7 General discussion 97
REFERENCES 105
SUMMARY 115
SAMENVATTING 119
LIST OF PUBLICATIONS 123

5
CHAPTER 1
Introduction
The soil-borne fungus Fusarium oxysporum f.sp. gladioli (Massey) Snyder & Hansen
(Boerema and Hamers, 1989; Brayford, 1996) causes serious economic losses in the
cultivation of gladiolus (Gladiolus L.) all around the world. Fusarium disease of gladiolus
and its causal agent was first described by Massey (1926). Rotting of the corms, either during
cultivation or in storage, and yellowing of the leaves are the predominant symptoms of this
extensively described disease (McCulloch, 1944; Nelson, 1948; Buxton and Robertson, 1953;
Buxton, 1955a; Forsberg, 1955; Bruhn, 1955; Bald et al., 1971). Infected corms are the main
source of inoculum, although infested soil also plays a role in the spread of the disease. Crop
rotation, avoidance of excess of nitrogen supply (Woltz and Magie, 1975), sanitation of the
planting stock by means of hot-water treatment of cormels (Roebroeck et al., 1991), soil
fumigation and treatment of corms with fungicides are measures applied in practice to control
epidemic spread of the disease. These measures, however, are not always sufficiently
effective. The possibility of biological control of the disease by the application of non-
pathogenic Fusarium strains has been investigated (Roebroeck and Mes, 1992b), but so far
this has not led to commercial application. Routine inspection of gladiolus corms stocks for
the presence of (latent) infection of Fusarium (Roebroeck et al. 1990) can contribute to
maintain disease incidences at acceptably low levels, but requires the implementation of a
sensitive and specific detection assay (De Haan et al., 2000). Although breeding for disease
resistance has had attention for a long time (McClellan and Pryor, 1957), the level of
Fusarium resistance of commercial cultivars can still be significantly improved (Straathof et
al., 1997b).
It was within the context of these last two disease control strategies, corm stock sanitation by
implementation of a specific detection assay and resistance breeding, that the studies
presented in the first part (chapter 2 and 3) of this thesis were initiated. Both strategies
required insight in the genetic diversity of the population of the pathogen. To develop a
reliable detection assay it was necessary to establish which strain(s) of the fungus should be
recognised as pathogenic. For the validation of a specific detection assay, a large collection of
well-characterised field isolates was required. Analysis of the genetic relationships within this
collection should enable assessment of the diversity within the field population of the
pathogen. This should make it possible to identify the target strains as well as the most
closely related non-pathogenic isolates from which the target strains should be distinguished
by the detection assay.
INTRODUCTION
6
To set up an effective resistance-breeding programme an inventory of the existing genetic
diversity within the pathogenic population was also essential. It should enable a rational
choice of testing isolates to screen for disease resistance, representing the genetic diversity
existing in the field as much as possible.
Since the host spectrum of F. oxysporum f.sp. gladioli is not restricted to gladiolus
(McClellan, 1945), other iridaceous crops were also incorporated in our studies. Additional
to serving the purposes mentioned above, these studies could generate knowledge of the
preferences of field isolates for different iridaceous crops. This knowledge has practical
implication for the possibilities of crop succession. Furthermore, elucidation of the genetic
relationships between isolates in a large collection of field isolates from different geographic
region could provide insight in the origin(s) and spread of the pathogenic population(s).
The variation in pathogenicity within the collection of field isolates was studied by
inoculation experiments with several different potential host phenotypes. Except for different
gladiolus hybrids also the other iridaceous crops from which isolates were obtained, were
incorporated. Analysis of the abilities to cause disease on different potential hosts was
performed and led to a classification of all isolates in different physiologic (pathogenic) races
(chapter 2). Initially, genetic relationships were analysed by testing vegetative compatibility
(Puhalla, 1985; Leslie, 1993) between isolates, leading to the classification of all isolates in
different vegetative compatibility groups (VCGs; chapter 2). Comparison of both
classification systems (races and VCGs) enabled a better insight in the structure of the
pathogenic population. This made it possible to select sets of reference isolates for the
development of a specific detection assay (De Haan et al., 2000) as well as for resistance
breeding (Straathof et al., 1997b and 1998).
To get a more detailed insight in the genetic relationships, both within and between VCGs, a
subset of isolates representing all races and all VCGs found was subjected to molecular
analysis (chapter 3). DNA-fingerprints were obtained by restriction fragment length
polymorphism (RFLP) using a multi-copy probe from F. oxysporum f.sp. dianthi (Manicom
et al., 1987) and by the AFLP-technique (Vos et al., 1995).
Two genetically closely related isolates, which showed a clear difference in pathogenicity,
were chosen to study the molecular genetics of host specificity (chapter 4, 5 and 6).
One isolate belonged to the cosmopolitan race 1, predominantly occurring on large-flowered
gladiolus (chapter 2), and was highly pathogenic to the large-flowered test cultivar ‘Peter
Pears’. The other isolate belonged to race 2n, a race found on small-flowered gladiolus, iris
and ixia in The Netherlands (chapter 2), and was not pathogenic to the large-flowered
gladiolus ‘Peter Pears’. Molecular analysis demonstrated a relatively close genetic
relationship between both races and indicated that race 1 might have arisen from race 2n by a
single evolutionary event (chapter 3). The genetics underlying the difference in host-spectrum
between these two races could therefore be relatively simple. Knowledge of the molecular
genetics of host specificity is not only of scientific relevance, but can be used to develop
novel strategies for disease control.
CHAPTER 1
7
Since no indication existed about the nature of the genetics involved (mono-/polygenic,
dominant/recessive) we choose to analyse parasexual progenies of the two isolates. The
possibility to enforce a parasexual cycle in F.oxysporum using auxotrophic UV-mutants had
already been demonstrated (Molnár et al., 1985a). The availability of transformation
techniques to incorporate dominant selectable markers in filamentous fungi (Punt and van
den Hondel, 1992) gave us the opportunity to set up and compare different systems for the
production of parasexual recombinants of the two selected isolates. In chapter 4 is described
how hybrids of the two isolates were obtained both by hyphal anastomosis and by protoplast
fusion using either auxotrophic mutants or antibiotic resistance transformants as parents.
Molecular analysis of fusion products was carried out to obtain evidence for the occurrence
of parasexual recombination. The different fusion systems were compared and the one most
suitable for further analysis of the molecular basis of host-specificity was selected.
Chapter 5 describes pathogenicity tests and extensive molecular analysis of two fusion
populations. Interpretation of the data resulted in the identification of a set of molecular
markers of which the presence was correlated with pathogenicity to ‘Peter Pears’. The
chromosomal location of these markers was determined by Southern analysis using blots of
pulsed field gels (Birren and Lai, 1993) on which intact chromosomes were separated.
In order to clone candidate genes involved in the difference in pathogenicity between the two
parental isolates, markers identified in chapter 5 were used to select clones from a cosmid
library of the parent pathogenic to ‘Peter Pears’ (chapter 6). Amplified cDNA ends (Brady et
al., 1990) from in vitro grown fungus and from infected plant tissue were used to identify
restriction fragments from selected cosmids harbouring coding sequences. The possibility
that these fragments contain putative genes involved in pathogenicity to ‘Peter Pears’ was
investigated by Southern analysis and sequence analysis.


9
CHAPTER 2
Genetic diversity within a collection of isolates of
Fusarium oxysporum from iridaceous crops: Vegetative
compatibility groups and physiologic races E.J.A. ROEBROECK & J.J. MES ABSTRACT
Within a collection of pathogenic field isolates of Fusarium oxysporum from different iridaceaous crops six vegetative compatibility groups (VCG0340 - 0345) were found to be present, of which two (VCG 0344 and 0345) were single-member VCGs. Three pathogenic isolates were self-incompatible. Extensive pathogenicity testing with a subset of isolates representing all VCGs, using two different gladiolus types (large-flowered and small-flowered) and three other iridaceous crops (iris, freesia and crocus), revealed ten distinct virulence patterns. Only VCG 0340 contained isolates with different virulence patterns. The other VCGs contained only one pathotype each. VCG 0340 contained isolates from crocus, which were found to be only pathogenic to crocus. Designation of these isolates as f.sp. croci, as previously proposed by others, would lead to the existence of two formae speciales within one VCG since VCG 0340 also contained isolates from other iridaceous crops which should be classified as f.sp. gladioli. The presence of two formae speciales in one VCG would be an unprecedented situation that we considered undesirable. Furthermore, many of the other isolates, although pathogenic to one or both gladiolus types, showed preferences to other iridaceous crops. In fact only one of the ten pathotypes was found to be generally present in the commonly cultivated large-flowered gladioli. To designate all other pathotypes, with other iridaceous crops as natural hosts, as f.sp. gladioli could be confusing. Therefore it is proposed to assign all pathogenic isolates of F. oxysporum from iridaceous crops to the new forma specialis iridacearum and to considering the different pathotypes as distinct physiologic races within this new forma specialis. For each race a code is suggested expressing its unique virulence pattern on the five differential iridaceous host phenotypes used. The obtained knowledge of the existing genetic variation in our isolate collection can be applied in resistance breeding and in developing a specific detection assay for the presence of latent infections in large-flowered gladiolus corms.
VCGs AND RACES
10
INTRODUCTION
Knowledge of the genetic diversity of a pathogen and especially about the existence of
physiologic races (pathotypes) is of great importance when developing screening assays for
resistance breeding. This knowledge is also essential for the development of specific
detection assays, to be used for diagnostic and inspection purposes. In The Netherlands
research projects both on resistance breeding against Fusarium in gladiolus (Löffler et al.,
1997; Straathof et al., 1997a, 1997b and 1998) and on detection of (latent) Fusarium
infections of gladiolus corms (Roebroeck et al. 1990; Mes et al., 1994a; De Haan et al.,
2000) have been carried out. To support these projects a collection of Fusarium isolates from
gladiolus and other iridaceous crops was build up and analysed for the presence of genetic
variation.
Puhalla (1985) introduced a method for genetic classification of strains of F.oxysporum on
the basis of vegetative compatibility. Heterokaryon formation between two strains was
demonstrated by pairing nitrate non-utilising mutants (nit mutants). When complementation
occurs between two isolates they are classified in the same vegetative compatibility group
(VCG). This technique has been applied to culture collections of many formae speciales of
F. oxysporum (for reviews see: Correll, 1991; Leslie, 1993; Kistler, 1997; Kistler et al.,
1998; Katan, 1999). We applied this technique to our collection of Fusarium isolates from
iridaceous crops.
Roebroeck and Mes (1992a) published results on vegetative compatibility within a collection
of 31 isolates, mainly originating from gladioli grown in The Netherlands. Later this work
was extended with 26 isolates from gladiolus from all over the world (Mes et al., 1994). At
that time only limited attention had been paid to isolates of F. oxysporum from other
iridaceous crops, although since decades they are considered to belong to the forma specialis
gladioli (McClellan, 1945; Apt, 1958; Linderman, 1981). Therefore, we examined additional
isolates from iris, crocus, freesia and ixia. Also isolates obtained from diseased crocus corms
showing so-called 'pseudo-rust' symptoms were incorporated in our studies. Since 'pseudo-
rust' symptoms, caused by certain strains of F. oxysporum, are distinct from those of
'Fusarium rot,' caused by F. oxysporum f.sp. gladioli, Boerema and Hamers (1989)
considered these strains to belong to a separate forma specialis (F. oxysporum f.sp. croci).
For purposes of review all our VCG data, published and unpublished, will be presented in
this chapter.
In our earlier publications (Roebroeck and Mes, 1992a; Mes et al., 1994), pathogenicity tests
were restricted to the so-called small-flowered gladiolus cultivar ‘Nymph’ and the large-
flowered gladiolus cultivar ‘Peter Pears’, revealing two races. All collection isolates have
now been tested against these two differential cultivars. The results of these tests will be
summarised in this chapter. Since isolates from other iridaceous crops were incorporated in
our studies it was desirable also to carry out pathogenicity tests with these crops to get further
insight in differences in host specialisation. A subset of isolates representing all VCGs, both
races sensu Roebroeck and Mes (1992a) and all original hosts were tested for their
CHAPTER 2
11
pathogenicity against small-flowered gladiolus, small-flowered gladiolus, bulbous iris, freesia
and crocus.
MATERIALS AND METHODS
Fungal isolates. Isolates were obtained from the diagnostic unit of the Bulb Research Centre
(LBO, Laboratorium voor Bloembollenonderzoek, Lisse, The Netherlands), the extension
service (DLV, De Landbouw Voorlichting, Lisse, The Netherlands), the Plant Protection
Service (PD, Plantenziektenkundige Dienst, Wageningen, The Netherlands), the Bulb
Inspection Service (BKD, Bloembollenkeuringsdienst, Lisse, The Netherlands), from national
culture collections (CBS, Centraalbureau voor Schimmelcultures, Baarn, The Netherlands
and ATCC, American Type Culture Collection, Rockville, Maryland USA) or from other
research institutes (Elsenburg Agricultural Development Institute, Elsenburg, South Africa;
Indian Institute of Horticultural Research, Bangalore, India; Ornamental Gardening and Plant
Breeding Research Institute, Pruhonice, Czechia; Fusarium Research Centre, Pennsylvania
State University, Pennsylvania, USA; University of Turin, Italy). All isolates were
monospored on potato dextrose agar (PDA) and stored as soil cultures in glass tubes at 4°C.
Morphological examination of isolates was carried out on the low nutrient medium SNA
(Nirenberg, 1976) with a piece of sterile filter paper according to Gerlach and Nirenberg
(1982) or isolates were sent to the CBS in Baarn for identification. Information about
geographic origin and original host genotype was recorded when available. For isolates from
gladiolus distinction was made between two major types: the so-called large-flowered (or
summer-flowering) gladioli (G. x grandiflorus Hort.; also containing the Butterfly and
Primulinus hybrids) and the small-flowered (or winter-flowering) gladioli which contain
Colvillei, Nanus, Ramosus and Tubergenii hybrids. Both types have different African
gladiolus species as ancestors (Ohri and Khoshoo, 1993 and Cohat, 1993). One isolate was
obtained from G. italicus, a European gladiolus species (Van Raamsdonk and De Vries,
1989).
Vegetative compatibility tests. The method developed by Puhalla (1985) and Correll et al.
(1987) as modified by Löffler and Rumine (1991) was used to identify vegetative
compatibility groups. Nitrate non-utilising mutants were obtained by placing plugs of a
PDA-culture of each isolate on Czapek Dox agar (CDA) (Oxoid; Hampshire, UK) containing
5% (w/v) KClO3. Rapidly growing, chlorate resistant sectors were characterised as nit1, nit3
or NitM mutants. At least two phenotypic classes (mostly nit1 and NitM, sometimes nit1 and
nit3) were obtained for each isolate.
Different nit mutants obtained from the same isolate were paired and pairs of mutants giving
the strongest complementation reactions were selected for complementation tests with other
isolates. If no complementation was observed after testing several different nit mutants from
the same isolate, this isolate was considered self-incompatible. Pairings were made on CDA,
incubated at room temperature and scored for complementation. Parings showing no
VCGs AND RACES
12
complementation were left for four weeks before definitively scored as negative. All
complementation tests were performed twice.
All self-compatible isolates from the first 31 isolates investigated (Roebroeck and Mes,
1992a) were paired in all combinations. From each VCGs found in this study two tester
strains were selected. The remaining isolates were tested against these tester strains. Isolates
that did not show complementation reactions with any of the tester strains were tested against
each other in order to find new VCGs.
Pathogenicity tests. Corms of the gladiolus cultivars ‘Peter Pears’ and ‘Nymph’ were
obtained from commercial stocks and stored at 5°C until use. Inoculum consisted of a
conidial suspension prepared from 14-day-old cultures on PDA. Husks of corms were
removed, damaged or diseased corms were discarded, corms were surface-disinfected in
0.8% formaldehyde, rinsed in running tap water, dipped in a conidial suspension and planted
directly in potting soil in 11 cm square pots. Corms dipped in water served as controls. Five
replicates with one corm per pot were used. After 6 weeks plants were lifted. Disease
development of corms was assessed visually on an ordinal scale from 0 (healthy) to 4 (rotten
completely) and shoot length was measured.
Initially an inoculum concentration of 105 conidia ml-1 was used and plants were grown in a
greenhouse at 23-30°C (Roebroeck and Mes, 1992a). In later tests suspensions of 106 conidia
ml-1 were used and plants were grown in a greenhouse with average temperatures during the
day between 20 and 23°C with peaks above 30°C on sunny days. With isolates tested in both
systems similar results were obtained. All collection isolates were tested at least twice against
the two differential gladiolus cultivars.
A set of 22 isolates (listed in table 2) was selected, representing all VCGs, all pathotypes
identified so far (using the two differential gladiolus cultivars) and all original host crops.
This set of isolates was tested on large-flowered gladiolus ‘Peter Pears’, small-flowered
gladiolus ‘Nymph’, bulbous iris ‘Ideal’, freesia ‘Pink Glow’ and crocus ‘Pickwick’. With
each crop three independent greenhouse experiments were carried out. In order to obtain a
more or less normal development of all five crops, while maintaining suitable conditions for
F. oxysporum, greenhouse (minimum-maximum) temperatures were set at 14-18°C during
the first four weeks after planting, followed by a period of four weeks with temperatures set
at 18-22°C.
For each crop the appropriate storage conditions and pretreatments were applied for
cultivation. Corms and bulbs were cleaned and disinfected as described above for gladiolus.
Inoculation took place immediately before planting by dipping corms or bulbs in a conidial
suspension of 106 conidia ml-1. In each experiment 5 corms/bulbs were used per treatment,
planted in 11-cm pots and placed randomly in 5 blocks in the greenhouse. After 8 weeks
plants were lifted, shoot length was measured and severity of symptoms on the corm/bulb
was assessed visually on an ordinal scale from 0 (unaffected) to 5 (rotten completely).
In greenhouse experiments with crocus, symptom development was abnormal and
reproducibility was poor. Therefore it was decided to test pathogenicity to crocus in a field
experiment. Corms of cultivar ‘Pickwick’ were treated and dip-inoculated as described for
CHAPTER 2
13
greenhouse experiments and planted in the field in October. Each treatment was carried out in
three repeats of 80 corms each. Field plots consisted of 4 rows of 80 cm and were randomised
within three blocks. Daughter corms were harvested in the last week of June the following
year, dried and stored at 23°C. After four weeks husks were removed from corms and for
each experimental unit number and freshweight of both healthy and diseased corms were
determined. Since qualitative differences between ‘corm rot’ and ‘pseudo-rust’ symptoms are
known to be particularly well-expressed on crocus cultivar ‘Grote Gele’ (P.J.Muller, personal
communication) 80 corms of this cultivar were inoculated with isolates from crocus and
grown in the field during the same season.
A set of thirteen additional isolates was tested in separate greenhouse experiments on large-
flowered gladiolus ‘Peter Pears’ small-flowered gladiolus ‘Nymph’ bulbous iris ‘Ideal’ and
freesia ‘Pink Glow’. The pathogenicity of these isolates to each of these four genotypes was
judged by comparison with non-inoculated control plants. Comparison of their pathogenicity
to each of the four greenhouse-tested crops with that of other isolates was however
impossible. Eight of the additional isolates could be incorporated in the crocus field
experiment, which made direct comparison with other isolates possible. Isolates belonging to
VCGs not reported in the Netherlands, were excluded form the crocus filed trial for reasons
of quarantine. Three of the additional isolates were not available at the time the crocus field
trial was carried out. In table 2 the twenty-two selected isolates and the thirteen additionally
tested isolates are listed and the origin of each isolate is presented.
Statistical analysis. Pathogenicity tests on the two differential gladiolus cultivars ‘Peter
Pears’ and ‘Nymph’ carried out for all collection isolates, were analysed as described by
Roebroeck and Mes (1992a): For both cultivars, plants inoculated with an isolate were only
compared with control plants. Isolates causing disease symptoms on all five inoculated
plants and shoot length reduction significantly different (P<0.05) from control plants in the
same experiment were considered pathogenic to the cultivar concerned. Isolates pathogenic to
both cultivars were designated race 2, isolates pathogenic to ‘Nymph’ but not to ‘Peter Pears’
were designated race 1 (table 1).
Data from greenhouse experiments with different iridaceous host genotypes, were analysed
for each host genotype separately. Mean shoot length data of the three, independent,
experiments were analysed by analysis of variance with experiments treated as blocks. Mean
corm rot data of the three experiments were analysed by regression analysis after logit
transformation. The same analyses were carried out on the shoot length and corm rot data of
the additional isolates tested only once, but in those cases the experimental blocks were
treated as blocks. Similarly, data from the crocus field experiment were analysed by analysis
of variance, while corm rot data (percentage of diseased corms) were analysed by regression
analysis after logit transformation.
Average relative shoot length data from the four crops tested in the greenhouse and relative
corm yield data from the crocus field experiment, obtained by dividing by values of control
treatments, were used to get insight in the isolate x host genotype interaction. In order to
identify groups of isolates sharing the same virulence patterns two techniques were used.
VCGs AND RACES
14
In the first one the isolate-genotype-matrix was subjected to the clustering procedure of
Corsten and Denis (1990) as described by Löffler et al. (1995) for average disease indices of
isolates of F.oxysporum f.sp. lilii on different genotypes of lily. This procedure identifies
simultaneously groups of unclustered rows and groups of unclustered columns in an
orthogonal two-way table of uncorrelated normally distributed observations with common
variance, such that the interaction between row and column factors is due to interactions
between those groups.
In the second approach, the isolate-genotype-matrix of relative shoot length/corm yield data
was centred both for columns and rows, to remove additive effects, and subjected to principal
component analysis (PCA). The biplot resulting from the PCA gives a graphical
representation in which isolate and crop scores are displayed simultaneously. The first axis
accounts for the largest amount of variation and discriminates best between isolates, followed
by the second axis, perpendicular the first axis, and so on. The isolates’ co-ordinates are
obtained by projecting each data point from the five-dimensional space (for each isolate has
its score on for each of the five crops) on the PCA axes. The host genotypes are presented as
vectors and obtained by projecting the unit vectors of each crop-axis from the five
dimensional space on the PCA axes.
RESULTS
Identification of vegetative compatibility groups. Of the 95 Fusarium isolates from iridaceous
crops examined, two were identified as F.proliferatum (Roebroeck and Mes, 1992a) and two
were identified as F.solani. None of these four isolates was pathogenic to either of both test
cultivars of gladiolus. The remaining 91 isolates were all identified as F. oxysporum. An
overview of these isolates with respect to vegetative compatibility group (VCG), original host
crop and geographic origin is given in table 1.
Compatibility tests of nit-mutants of a first set of 29 F.oxysporum isolates (Roebroeck and
Mes, 1992a) in all possible combinations revealed three distinct vegetative compatibility
group among 25 pathogenic isolates. Following the numbering system of Puhalla (1985),
these were designated VCG 0340, 0341and 0342. The number ‘034’ refers to the position
number of the forma specialis gladioli in the list of Armstrong and Armstrong (1981).
Recently, these codes were listed in an overview of currently described VCGs and are in
agreement with the rules for a standardised system for numbering VCGs proposed by the
authors (Kistler et al., 1998; Katan, 1999; Katan and Di Primo, 1999). One of the 25 isolates
pathogenic to gladiolus was self-incompatible and designated VCG034-, a code suggested by
Jacobson and Gordon (1988).
Within a second set of 26 isolates from gladiolus collected from all over the word (Mes et al.,
1994b), containing 17 pathogenic isolates, fourteen were compatible with tester strains from
VCG 0340, two were self-incompatible (VCG 034-) and one appeared to be a single member
of a new distinct vegetative compatibility group (VCG 0343). Later three additional isolates
belonging to VCG 0343 were obtained. All four isolates of VCG 0343 were isolated from

CHAPTER 2
15
Table 1. Geographic distribution and original host crops of vegetative compatibility groups of Fusarium
oxysporum from iridaceous crops in the collection of the authors.
VCG race1 original host crop2 geographic origin and number of isolates
0340 1 gladiolus lf The Netherlands (14), France (1), Spain (1), Italy (1), Czechia (3), U.S.A. (6), Argentina (1), Brasil (1), India (2), Australia (2) gladiolus eu The Netherlands (1) iris The Netherlands (1) 2 gladiolus sf The Netherlands (3) gladiolus sp Italy (1) ixia The Netherlands (2) iris The Netherlands (4) - crocus The Netherlands (7) 0341 2 gladiolus sf The Netherlands (5) gladiolus lf Italy (1) ixia The Netherlands (1) freesia The Netherlands (2) 0342 2 crocus The Netherlands (3), unknown (1) 0343 13 gladiolus lf Italy (4) 0344 13 freesia The Netherlands (1) 0345 13 freesia The Netherlands (1) 034- 1 gladiolus lf U.S.A. (2) 2 gladiolus sp U.S.A. (1)4 - - gladiolus lf The Netherlands (8), U.S.A. (5), South Africa (2), Japan (1) - - gladiolus sp Italy (1)5,Germany (1)6 1 race designation sensu Roebroeck and Mes (1992a): race 1 isolates were pathogenic to gladiolus ‘Peter Pears’ and gladiolus ‘Nymph’, while race 2 isolates were pathogenic to ‘Nymph’ but not to ‘Peter Pears’ 2 gladiolus lf = large-flowered gladiolus; gladiolus sf = small-flowered gladiolus; gladiolus eu = European gladiolus species; gladiolus sp = gladiolus type unknown 3 race classification questionable, since pathogenicity to gladiolus ‘Peter Pears’ was low
4 isolate from Massey (1926). Accession number ATCC 11851; CBS 151.27
5 isolate from Scurti (1952). Accession number CBS 253.52 6 isolate from Bruhn (1955). Accession number CBS 160.57 diseased large-flowered gladiolus plants grown at different sites in the region of Naples in
Italy.
Complementation tests with a third set of 33 isolates from different iridaceous crops revealed
seven isolates from crocus which were non-pathogenic to gladiolus, but nevertheless
belonged to VCG 0340. Furthermore, two self-compatible isolates from freesia were found
which were incompatible with all tester strains. They were also found to be incompatible with
VCGs AND RACES
16
each other and hence considered single members of two new VCGs (0344 and 0345). The
remaining 22 isolates either belonged to one of the known VCGs (19) or were non-
pathogenic (5).
Within the total set of 91 isolates examined, eighteen non-pathogenic F. oxysporum isolates
from gladiolus were found of which four were self-incompatible. The other fourteen were
self-compatible, but not compatible with testers from the four pathogenic VCGs or with each
other, and hence are single member VCGs. In agreement with the proposal of Kistler et al.
(1998) these isolates were not assigned VCG codes.
Pathogenicity tests with two gladiolus types. Results of pathogenicity tests with the two
differential gladiolus cultivars ‘Peter Pears’ (large-flowered gladiolus) and ‘Nymph’ (small-
flowered gladiolus) led to classification of each isolate as race 1 (pathogenic to both
cultivars), race 2 (pathogenic to ‘Nymph’, but not to ‘Peter Pears’) or non-pathogenic
(Roebroeck and Mes, 1992a). Isolates pathogenic to ‘Peter Pears’, but not to ‘Nymph’, were
not found. Classification of groups of isolates based on the results of these pathogenicity tests
is given in table 1.
In general, race 1 isolates caused complete rot (index 4) of corms of all five test plants of
both cultivars. In the first tests (Roebroeck and Mes, 1992a), when 105 conidia ml-1 were used
as inoculum, shoot length of ‘Peter Pears’ was reduced with 30-90% by race 1 isolates, while
corms of ‘Nymph’ hardly produced any shoots. Later (Mes et al., 1994b and unpublished),
when 106 conidia ml-1 were used, inoculation with race 1 isolates reduced shoot length of
both cultivars with 80-100%.
In all tests, race 2 isolates belonging to VCG 0340 and 0342 typically caused complete rot
(index 4) of corms of all five test plants of ‘Nymph’ and reduced shoot length of this cultivar
with 80-100%. Race 2 isolates belonging to VCG 0341 showed much variation in their
pathogenicity to ‘Nymph’ (shoot length reduction ranged from 20-100%).
One isolate (G71; Mes et al., 1994b), pathogenic to both cultivars and hence classified as race
1, attracted attention, because shoot length reduction and corm rot of corms of both cultivars
inoculated with this isolate were less than when inoculated with other race 1 isolates. The
lower aggressiveness of isolate G71 is probably related to its slow growth rate observed
during cultivation on agar plates.
All four isolates of VCG 0343 only caused little disease on ‘Peter Pears’, while their
pathogenicity to ‘Nymph’ was comparably high to that of race 1 isolates from VCG0340.
Shoot length reduction of ‘Peter Pears’ was about 10 to 20%, while other race 1 isolates gave
a reduction of 80 to 100%. For all four isolates shoot length was significantly lower (P<0.05)
than that of control plants in at least one experiment, but not in all experiments. Corm rot
symptoms of cv. ‘Peter Pears’ caused by these four isolates were never severe (index 1-3).
The two single-member VCG isolates from freesia also showed aberrant behaviour in
pathogenicity. Shoot length reduction was 25-55% for ‘Nymph’ and 10-40% for ‘Peter
Pears’. Corm rot symptoms were highly variable between repeats (index 1-4), but on average
moderate compared to race 1 isolates of VCG 0340. The observed distinction in pathogenic
CHAPTER 2
17
behaviour between isolates of VCG 0343, 0344 and 0345 with race 1 isolates from VCG
0340 made it questionable whether or not these isolates should be assigned to race 1.
In some tests one or two out of five control plants developed disease symptoms owing to the
presence of latent infections, an unfortunate inevitability when using corms from commercial
stocks (Roebroeck et al., 1990). In tests where such a high background level of infection
occurred, cultivars with one or two diseased corms out of the five inoculated were not
considered susceptible to the isolate used. In the few cases where this decision was required,
no significant reduction of shoot length was observed while the reduction of shoot length
caused by obviously pathogenic isolates, causing severe corm rot on five out of five plants,
was highly significant (P<0.001). Moreover, in all these cases, decisions were confirmed
unambiguously by results of repeated trials without high background levels of infection.
Pathogenicity tests with five iridaceous crops. In greenhouse experiments pathogenicity to
four different iridaceous crops (large-flowered gladiolus ‘Peter Pears’, small-flowered
gladiolus ‘Nymph’, bulbous iris ‘Ideal’ and freesia ‘Pink Glow’) was tested in the greenhouse
with a subset of isolates representing all VCGs, both races sensu Roebroeck and Mes (1992a)
and original host crops. A set of twenty-two isolates was tested three times in independent
greenhouse experiments. Later thirteen additional isolates were tested against these four
genotypes in separate greenhouse experiments. Both the isolates of the selected subset as the
additional isolates were tested for pathogenicity to crocus in a single field experiment. Five
isolates however were excluded from the field trial for reasons of quarantine and three
isolates were not available at that time, as indicated in table 2.
Relative shoot length data from the greenhouse tests are given in table 3. The twenty-two
isolates that were tested together could be compared mutually, while of the additionally tested
isolates only the significance of the difference with the control treatment is indicated.
Relative yield data from the field experiment with crocus ‘Pickwick’ are also presented in
table 3.
Corm rot scores from the greenhouse tests are presented in table 4. Disease severity of crocus
is given in the same table as the percentages of diseased corms found in the field experiment.
In table 2, 3 and 4 isolates are grouped on the basis of visual inspection of the dendrogram of
the cluster analysis (figure 1), according to Corsten and Denis (1990), of relative shoot
length/corm yield data from the five different crops and the biplots of the PCA analysis
(figure 2).
Identification of physiologic races. Detailed inspection of both shoot length and corm yield
data (table 3) and disease severity data (table 4) of these groups led to the recognition of
physiologic (pathogenic) races, each displaying a distinct virulence pattern. Since the genetic
background of races is unknown we used numbers in an arithmetic series to designated
phenotypes with different host spectra (Armstrong and Armstrong, 1981). Isolates sharing the
same host spectrum were assigned the same race number. Differentiation based on
quantitative differences in host preference or qualitative differences in disease expression

VCGs AND RACES
18
(differences in colour and shape of symptoms) are indicated by an extension of letters in the
race code.
Race 1 and 1it. The three isolates G2, G15 and Ir7, representing a large group of isolates
from VCG0340, previously designated race 1 (Roebroeck and Mes, 1992a and this chapter
table 1) exhibited pathogenicity to all five iridaceous crops. We propose to retain their
classification as race 1. Differences in pathogenicity between these three isolates were
comparable in all host genotypes (no interaction) and can therefore be considered to represent
differences in aggressiveness within the same race. Isolate G76 (VCG 0343) previously also
designated race 1 (Mes et al., 1994b), was also found to be pathogenic to all five test crops.
Although pathogenicity to crocus ‘Pickwick’ could not be demonstrated in the field due to
quarantine measures, pathogenicity of G76 to crocus under greenhouse conditions was
apparent (indicated with a ‘(+)’ in table 4). In the three greenhouse experiments with
gladiolus ‘Peter Pears’, G76 did not cause a significant reduction of shoot length (figure 1).
This in strong contrast with the three race 1 isolates from VCG 0340. Within some other
experiments (e.g. Mes et al., 1994b), G76 did cause a significant shoot length reduction of
‘Peter Pears’, but this reduction was much smaller than the de reduction caused by the race 1
isolates from VCG0340. Corm rot symptoms caused by G76 on ‘Peter Pears’ were mild
(table 3). Three additional isolates from VCG 0343 (G82, G83, G89A) gave comparable mild
disease symptoms on gladiolus ‘Peter Pears’ (table 3). Their low pathogenicity to ‘Peter
Pears’ makes it useful to classify this group of VCG0343 isolates as a distinct race: race 1it
(the extension ‘it’ refers to Italy, their geographic origin).
Race 2n, 2i and 2c. The isolates previously designated race 2 (table 1; Roebroeck and Mes,
1992a) showed heterogeneity when tested on five iridaceous crops. Race 2 isolates from
VCG 0340 originating from gladiolus (G6 and G18) iris (Ir1, Ir2, Ir3, and Ir8) and ixia (X1
and X2) showed all to be pathogenic on all host genotypes except large-flowered gladiolus
‘Peter Pears’. Results of cluster analysis (figure 1) and PCA (figure 2) separated G6, G18,
Ir3, X1 and X2 from Ir1, Ir2 and Ir8. The first group of isolates is relatively more pathogenic
to gladiolus ‘Nymph’, while the second group displayed relatively more severe symptoms on
iris ‘Ideal’ and crocus ‘Pickwick’. Moreover, qualitative traits (shape and colour) of the corm
rot symptoms on crocus were clearly different for both groups. The virulence pattern of the
additionally tested isolate G24 matched that of the first group. We propose to designate the
first group race 2n (‘n’ for Nanus, since gladiolus Nanus was the first preferential host crop
from which this race was isolated). The second group of isolates all originated from iris and
was therefore designated race 2i (‘i’ from iris). Race 2 isolates from VCG 0342 (Cr1, Cr2,
and Cr5), all originated from crocus and showed a virulence pattern closely related to that of
race 2i (figures 1 and 2). However, yield reduction (table 3) and disease severity (table 4) of
crocus ‘Pickwick’ was significantly higher for these three isolates than for race 2i isolates.
Also the type of corm rot symptoms observed on crocus differed between both groups. Of all
differential crops the disease responses to the additionally tested VCG 0342 isolate Cr9 were
CHAPTER 2
19
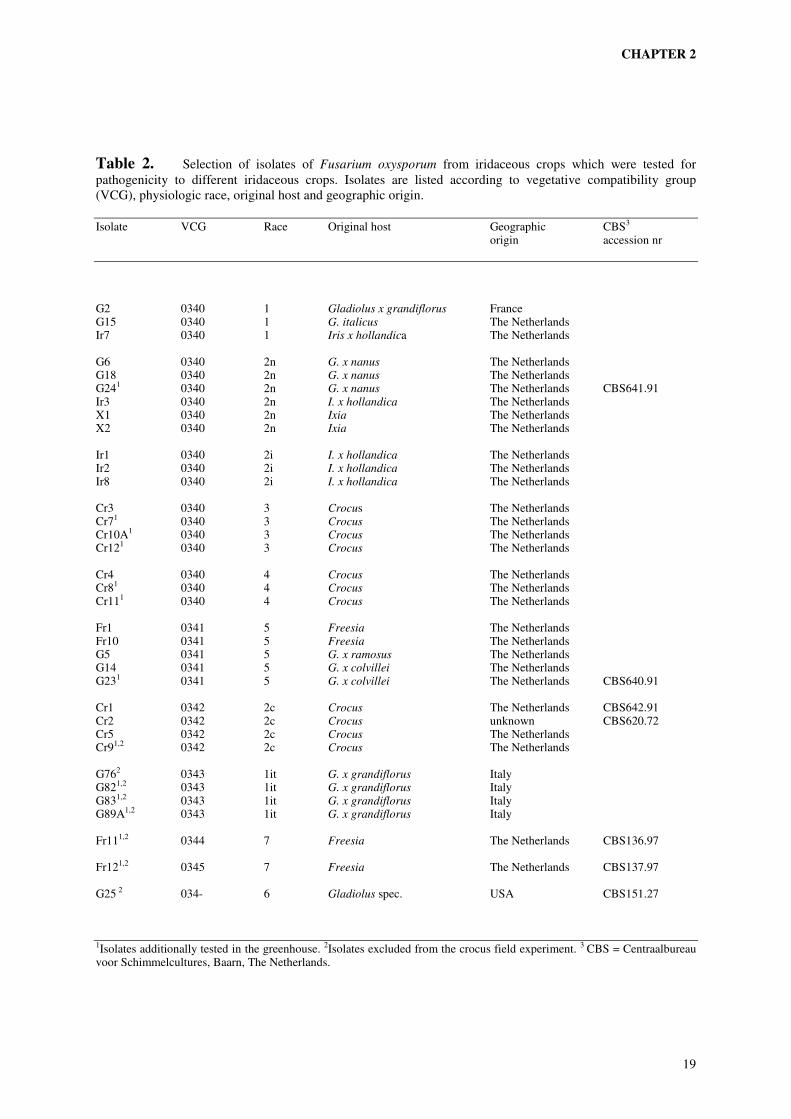
Table 2. Selection of isolates of Fusarium oxysporum from iridaceous crops which were tested for pathogenicity to different iridaceous crops. Isolates are listed according to vegetative compatibility group (VCG), physiologic race, original host and geographic origin.
Isolate VCG Race Original host Geographic CBS3 origin accession nr
G2 0340 1 Gladiolus x grandiflorus France G15 0340 1 G. italicus The Netherlands Ir7 0340 1 Iris x hollandica The Netherlands G6 0340 2n G. x nanus The Netherlands G18 0340 2n G. x nanus The Netherlands G241 0340 2n G. x nanus The Netherlands CBS641.91 Ir3 0340 2n I. x hollandica The Netherlands X1 0340 2n Ixia The Netherlands X2 0340 2n Ixia The Netherlands Ir1 0340 2i I. x hollandica The Netherlands Ir2 0340 2i I. x hollandica The Netherlands Ir8 0340 2i I. x hollandica The Netherlands Cr3 0340 3 Crocus The Netherlands Cr71 0340 3 Crocus The Netherlands Cr10A1 0340 3 Crocus The Netherlands Cr121 0340 3 Crocus The Netherlands Cr4 0340 4 Crocus The Netherlands Cr81 0340 4 Crocus The Netherlands Cr111 0340 4 Crocus The Netherlands Fr1 0341 5 Freesia The Netherlands Fr10 0341 5 Freesia The Netherlands G5 0341 5 G. x ramosus The Netherlands G14 0341 5 G. x colvillei The Netherlands G231 0341 5 G. x colvillei The Netherlands CBS640.91 Cr1 0342 2c Crocus The Netherlands CBS642.91 Cr2 0342 2c Crocus unknown CBS620.72 Cr5 0342 2c Crocus The Netherlands Cr91,2 0342 2c Crocus The Netherlands G762 0343 1it G. x grandiflorus Italy G821,2 0343 1it G. x grandiflorus Italy G831,2 0343 1it G. x grandiflorus Italy G89A1,2 0343 1it G. x grandiflorus Italy Fr111,2 0344 7 Freesia The Netherlands CBS136.97 Fr121,2 0345 7 Freesia The Netherlands CBS137.97 G25 2 034- 6 Gladiolus spec. USA CBS151.27 1Isolates additionally tested in the greenhouse. 2Isolates excluded from the crocus field experiment. 3 CBS = Centraalbureau voor Schimmelcultures, Baarn, The Netherlands.
VCGs AND RACES
20
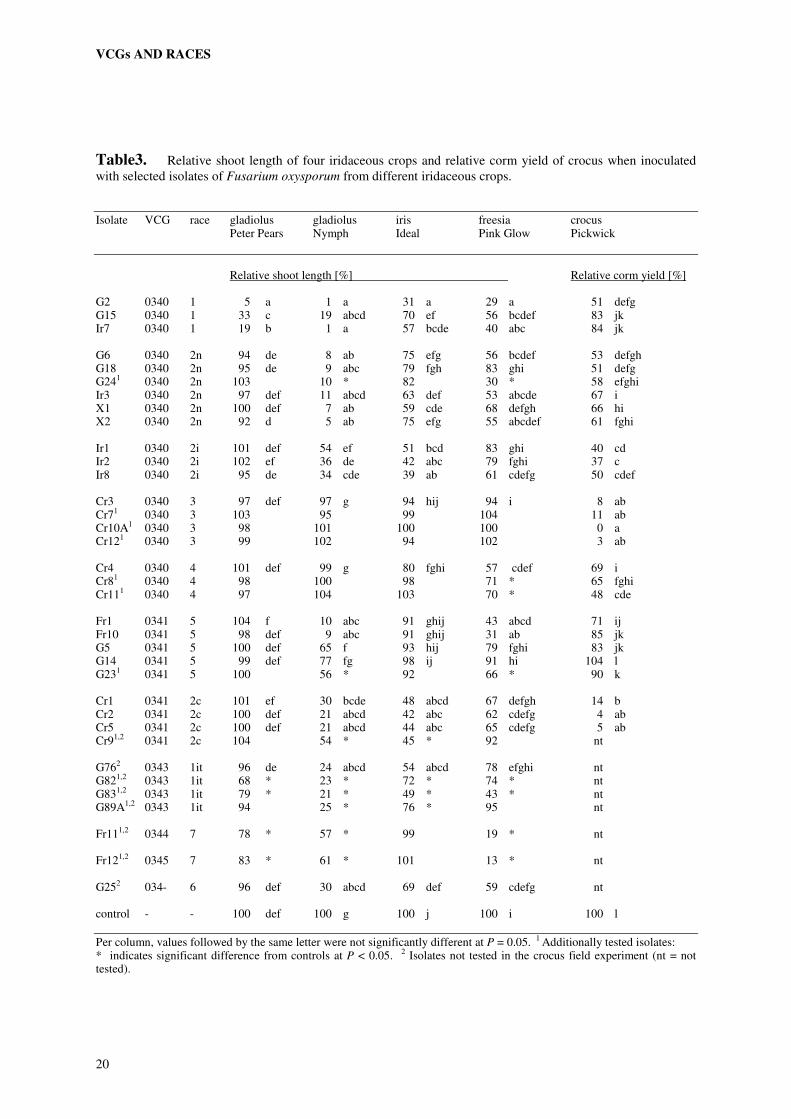
Table3. Relative shoot length of four iridaceous crops and relative corm yield of crocus when inoculated with selected isolates of Fusarium oxysporum from different iridaceous crops.
Isolate VCG race gladiolus gladiolus iris freesia crocus Peter Pears Nymph Ideal Pink Glow Pickwick
Relative shoot length [%] Relative corm yield [%] G2 0340 1 5 a 1 a 31 a 29 a 51 defg G15 0340 1 33 c 19 abcd 70 ef 56 bcdef 83 jk Ir7 0340 1 19 b 1 a 57 bcde 40 abc 84 jk G6 0340 2n 94 de 8 ab 75 efg 56 bcdef 53 defgh G18 0340 2n 95 de 9 abc 79 fgh 83 ghi 51 defg G241 0340 2n 103 10 * 82 30 * 58 efghi Ir3 0340 2n 97 def 11 abcd 63 def 53 abcde 67 i X1 0340 2n 100 def 7 ab 59 cde 68 defgh 66 hi X2 0340 2n 92 d 5 ab 75 efg 55 abcdef 61 fghi Ir1 0340 2i 101 def 54 ef 51 bcd 83 ghi 40 cd Ir2 0340 2i 102 ef 36 de 42 abc 79 fghi 37 c Ir8 0340 2i 95 de 34 cde 39 ab 61 cdefg 50 cdef Cr3 0340 3 97 def 97 g 94 hij 94 i 8 ab Cr71 0340 3 103 95 99 104 11 ab Cr10A1 0340 3 98 101 100 100 0 a Cr121 0340 3 99 102 94 102 3 ab Cr4 0340 4 101 def 99 g 80 fghi 57 cdef 69 i Cr81 0340 4 98 100 98 71 * 65 fghi Cr111 0340 4 97 104 103 70 * 48 cde Fr1 0341 5 104 f 10 abc 91 ghij 43 abcd 71 ij Fr10 0341 5 98 def 9 abc 91 ghij 31 ab 85 jk G5 0341 5 100 def 65 f 93 hij 79 fghi 83 jk G14 0341 5 99 def 77 fg 98 ij 91 hi 104 l G231 0341 5 100 56 * 92 66 * 90 k Cr1 0341 2c 101 ef 30 bcde 48 abcd 67 defgh 14 b Cr2 0341 2c 100 def 21 abcd 42 abc 62 cdefg 4 ab Cr5 0341 2c 100 def 21 abcd 44 abc 65 cdefg 5 ab Cr91,2 0341 2c 104 54 * 45 * 92 nt G762 0343 1it 96 de 24 abcd 54 abcd 78 efghi nt G821,2 0343 1it 68 * 23 * 72 * 74 * nt G831,2 0343 1it 79 * 21 * 49 * 43 * nt G89A1,2 0343 1it 94 25 * 76 * 95 nt Fr111,2 0344 7 78 * 57 * 99 19 * nt Fr121,2 0345 7 83 * 61 * 101 13 * nt G252 034- 6 96 def 30 abcd 69 def 59 cdefg nt control - - 100 def 100 g 100 j 100 i 100 l
Per column, values followed by the same letter were not significantly different at P = 0.05. 1 Additionally tested isolates: * indicates significant difference from controls at P < 0.05. 2 Isolates not tested in the crocus field experiment (nt = not tested).

CHAPTER 2
21
Table 4. Severity of corm or bulb rot symptoms of five genotypes of iridaceous crops after inoculation with selected isolates of Fusarium oxysporum from different iridaceous crops.
Isolate VCG race gladiolus gladiolus iris freesia crocus Peter Pears Nymph Ideal Pink Glow Pickwick
rot index [0-5] % diseased G2 0340 1 4.9 c 5.0 d 5.0 g 4.7 f 41 ij G15 0340 1 4.6 c 5.0 d 4.3 efg 4.5 f 2 a Ir7 0340 1 4.7 c 5.0 d 4.8 g 4.7 f 11 c G6 0340 2n 0.6 a 4.7 d 3.6 defg 4.5 f 44 ij G18 0340 2n 0.4 a 4.9 d 2.1 bcd 3.0 cd 44 ij G241 0340 2n 0.2 4.8 * 3.8 * 5.0 * 37 hgi Ir3 0340 2n 0.5 a 5.0 d 4.6 fg 4.5 f 27 ef X1 0340 2n 0.5 a 4.9 d 4.9 g 4.4 ef 22 de X2 0340 2n 0.5 a 4.9 d 4.2 efg 4.3 def 32 fgh Ir1 0340 2i 0.6 a 4.5 d 5.0 g 3.6 def 53 kl Ir2 0340 2i 0.7 a 4.5 d 5.0 g 3.1 cde 56 l Ir8 0340 2i 0.4 a 4.8 d 5.0 g 4.2 def 45 jk Cr3 0340 3 0.4 a 0.7 a 0.5 a 0.9 ab 87 mn Cr71 0340 3 0.0 0.4 0.0 0.0 84 m Cr10A1 0340 3 0.2 0.8 0.8 0.4 100 p Cr121 0340 3 0.0 1.2 0.0 0.2 95 o Cr4 0340 4 0.6 a 1.3 ab 2.9 cde 3.9 def 29 ef Cr81 0340 4 0.2 0.6 2.6 * 3.8 * 30 fg Cr111 0340 4 0.0 0.8 3.4 * 4.6 * 39 hij Fr1 0341 5 0.7 a 4.7 d 0.7 ab 4.5 f 18 d Fr10 0341 5 0.7 a 4.4 d 0.7 ab 4.7 f 6 b G5 0341 5 0.7 a 2.7 c 0.9 ab 1.9 bc 1 a G14 0341 5 0.4 a 2.0 bc 0.6 a 1.5 ab 1 a G231 0341 5 0.0 3.6 * 1.0 4.0 * 7 bc Cr1 0341 2c 0.5 a 5.0 d 3.3 def 4.2 def 84 m Cr2 0341 2c 0.5 a 4.9 d 4.9 g 4.4 ef 95 o Cr5 0341 2c 0.5 a 4.9 d 5.0 g 4.2 def 91 no Cr91,2 0341 2c 0.0 3.5 * 5.0 * 4.3 * nt (+)3 G762 0343 1it 1.2 b 4.6 d 3.6 defg 2.1 bc nt (+)3 G821,2 0343 1it 1.4 * 4.4 * 3.2 * 3.4 * nt G831,2 0343 1it 1.6 * 4.6 * 5.0 * 4.6 * nt G89A1,2 0343 1it 0.6 4.6 * 3.2 * 2.6 * nt Fr111,2 0344 7 2.6 * 2.0 * 0.0 4.8 * nt Fr121,2 0345 7 3.0 * 2.4 * 0.4 4.8 * nt G252 034- 6 0.7 a 4.9 d 1.4 abc 4.2 def nt (-)3 control - - 0.5 a 1.3 ab 0.3 a 0.4 a 0 a
Per column, values followed by the same letter are not significantly different (P = 0.05). Presented values are predictions from the regression model, retransformed to the original scale. 1 Additionally tested isolates: * indicates significant difference from controls at P<0.05. 2 Isolates not tested in the crocus field experiment (nt = not tested). 3 (+) or (-) indicate pathogenicity to crocus in greenhouse tests

VCGs AND RACES
22
Figure 1. Dendrogram produced by the cluster analysis of isolates and host genotypes according to Corsten and Denis (1990). The analysis was performed on average relative yield data from the three independent greenhouse experiments and from the crocus field experiment. Isolates and host genotype are clustered successively according to similarity exclusively in terms of minimal contribution to variance for interaction. VCG codes are presented in the first column followed by the proposed race codes in parentheses.
Figure 2. Biplots on the first and the second (left) and on the first an the third (right) axis of the principle component analysis (PCA) of the isolate x host genotype interaction. PCA was performed on centred average relative yield data from three independent greenhouse experiments and from the crocus field experiment. Host genotypes are presented as vectors: PP = large-flowered gladiolus ‘Peter Pears’; Ny = small-flowered gladiolus ‘Nymph’; Id = bulbous iris ‘Ideal’; PG = freesia ‘Pink Glow’; Pw = crocus ‘Pickwick’. Groups of isolates considered to belong to the same race are encircled. Of these groups VCG codes followed by the proposed race codes in parentheses are given in bold.
-5 Cr2 Cr3
Cr1 Ir2 Ir8 Ir1
Cr3 Cr4
Ny
G18 G6 X1 X2
Ir3
Fr1 Fr10
G5 G14
G2
G15 Ir7
Con
Pw Id
PG
PP
5
5
-5
0340 (1) 0341 (5)
0341 (5) 0340 (2n)
0340 (2i)
0342 (2c)
0340 (4)
First component: 55.3%
0340 (3)
-5
Cr2Cr3
Cr1
Ir2
Ir8Ir1
Cr3
Cr4
Ny
G18
G6
X1
X2Ir3
Fr1Fr10
G5
G14
G2 G15Ir7
Con
Pw
Id
PG
PP
5
5
-5
0340 (1)
0341 (5)
0340 (2n)0340 (2i)
0340 (3)
0340 (4)
First component: 55.3%
0342 (2c)
G14G5ConCr4G15Ir7G2
X1Ir3X2G6G18Fr10Fr1Ir2Ir1Ir8Cr5Cr2Cr1Cr3
PickwickPeter PearsNymphIdealPink Glow
0341 (5)
0340 (4)
0340 (1)
0340 (2n)
0341 (5)
0340 (2i)
0342 (2c)
0340 (3)
VCG (race) Isolate
CHAPTER 2
23
comparable with those of the other three isolates from this VCG. The VCG 0342 isolates
were designated race 2c (‘c’ from crocus).
Race 3 and 4. Two crocus isolates belonging to VCG 0340 (Cr3, Cr4) were not pathogenic to
gladiolus ‘Peter Pears’ or ‘Nymph’ and should therefore assigned new race numbers. Isolate
Cr3 was only pathogenic to crocus and was designated race 3, while Cr4 also caused disease
in iris and freesia, a host spectrum not observed with any other isolate, and was designated
race 4. Five additionally collected isolates from crocus could be assigned to either race 3
(Cr7, Cr10A and Cr12) or race 4 (Cr8 and Cr11) based on the fact that they had the same
unique set of susceptible hosts (table 3).
All four race 3 isolates caused typical pseudo-rust symptoms on crocus ‘Grote Gele’, while
symptoms caused by race 4 isolates on this cultivar were classified as corm rot (data not
shown). On crocus ‘Pickwick’ both races also caused distinct disease symptoms, but the
symptoms caused by race 3 isolates were not recognised as pseudo-rust. Symptoms on crocus
‘Grote Gele’, caused by race 2c isolates (VCG0342) were distinct from those of both race 3
and race 4 isolates.
Race 5. The isolates from VCG0341 (G5, G14, Fr1 and Fr10) previously designated race 2,
were not pathogenic to bulbous iris ‘Ideal’ in contrast to the other race 2 isolates from VCGs
0340 and 0342 and hence assigned a new race number: race 5. Within this set of four race 5
isolates cluster analysis (figure 1) and PCA (figure 2) differentiated between the two isolates
from gladiolus (G5 and G14) and those from freesia (Fr1 and Fr10) indicating the existence
of interaction between these two pairs and the differential host crops. Inspection of the
underlying data (table 3), however, showed that this interaction is caused by the fact that on
all susceptible crops the two gladiolus isolates are causing less shoot length reduction than
the two freesia isolates, while by definition this difference could not be displayed on the two
non-host crops. Disease severity data (table 4) showed the same. Therefore this interaction
could not be translated in terms of ‘relative differences in host preference’, but only reflects
differences in aggressiveness. The additionally tested VCG 0341 isolate G23 showed the
virulence pattern of an aggressive race 5 isolate.
Race 6. The self-incompatible isolate G25 (VCG 034-), also previously designated race 2,
was not tested on crocus ‘Pickwick’ in the field, but in greenhouse experiments no symptoms
were observed (indicated with a ‘(-)’ in table 4). Therefore its virulence pattern was distinct
from that of one of the other races and this isolates was concerned to belong to a separate
race, designated race 6.
Race 7. As mentioned earlier in this chapter, the two isolates Fr11 (VCG0344) and Fr12
(VCG0345) were pathogenic to both the large-flowered gladiolus ‘Peter Pears’ and the
small-flowered gladiolus ‘Nymph’, but their pathogenicity on these host genotypes was
highly variable within an experiment and on average moderate compared to that of race 1
isolates of VCG0340. Besides the variable but on average moderate pathogenicity to ‘Peter
VCGs AND RACES
24
Pears’ and ‘Nymph’ they did not cause any symptoms on iris ‘Ideal’, while their
pathogenicity to freesia ‘Pink Glow’ was unambiguously high (tables 3 and 4). This virulence
spectrum did not match any of the other spectra described above, indicating that they should
be recognised as a distinct race. To confirm this, the pathogenicity tests were repeated leading
to similar results (data not shown), including the large plant to plant variation in disease
severity on large-flowered gladiolus ‘Peter Pears’ and small-flowered gladiolus ‘Nymph’.
Both isolates were assigned to a new race, which was designated race 7.
DISCUSSION
The results of this study revealed the existence of six vegetative compatibility groups (VCGs)
and ten groups with distinct virulence patterns within a collection of field isolates of
Fusarium oxysporum from iridaceous crops.
Based on the assumptions that sexual reproduction in F.oxysporum is rare or entirely absent
and, as in other ascomycetes (Leslie, 1993), vegetative compatibility is controlled by at least
ten loci (and only isolates isoallelic at all loci are vegetative compatible), isolates belonging
to the same VCG can be considered clonally related (Kistler, 1997; Gordon and Martyn,
1997). Molecular evidence confirming the correspondence of VCGs to clonal lineage has
been reported for many formae speciales (e.g. Kistler et al., 1987 and 1991; Jacobson and
Gordon 1990b; Elias et al., 1993; Manicom and Baayen, 1993). Molecular analyses of our
isolate collection will be presented in chapter 3.
Variation detected by VCG analysis and pathogenicity testing to differential host genotypes
will always describe only a proportion of the variation existing in the field. More VCGs
might be discovered when the collection is expanded. Moreover, detection of variation in
pathogenicity is limited by the set of differential host genotypes used. It should also be
emphasised that, in spite of the fact that test cultivars were chosen because of their
susceptibility to the disease in practice, the fact that an isolate was not pathogenic to the test
cultivar should not be generalised to the represented crop. For example, the fact that the
large-flowered gladiolus ‘Peter Pears’ is resistant against race 2n, should not be generalised
to the statement that race 2n is not pathogenic to large-flowered gladioli. The finding that
some isolates of race 2 sensu Roebroeck and Mes (1992a), now classified as race 2n, 2c and
5, were found non-pathogenic to a larger set of large-flowered gladiolus cultivars indicates
that resistance against these races is widespread in these hybrids. The fact that two isolates
(one of VCG0340 and one of VCG0341), non-pathogenic to ‘Peter Pears’, were isolated from
large-flowered gladiolus in Italy (table 1), however, indicates that some large-flowered
cultivars might exist being susceptible to these races. Alternatively both isolates could have
been present on the plant material as saprophytes or secondary pathogens (one was isolated in
combination with an isolate belonging to VCG 0343).
Geographic distribution. Isolates of VCG0340/race 1 were obtained from gladioli all over the
world (table 1). Presuming a clonal origin of all these isolates, their global distribution must
CHAPTER 2
25
be the result of the worldwide trade in gladiolus corms carrying the fungus. Intercontinental
movement of strains as a result of human activities is also well documented for other formae
speciales (e.g. Ploetz and Correll, 1988 (f.sp. cubense); Jacobson and Gordon, 1990a (f.sp.
melonis); Elias et al., 1993 (f.sp. lycopersici); Rosewich et al., 1998 (f.sp. radicis-
lycopersici)).
Indeed the presence of gladiolus corms with fusarium symptoms in international (Buxton,
1955a) and intercontinental shipments (McCulloch, 1944) has been reported in the past and
also today shipments containing diseased corms are regularly observed by
exporters/importers and inspection services. Whether or not the other races found in VCG
0340 are also globally distributed remains uncertain. Except for one isolate from Italy,
isolates of races 2n, 2i, 3 and 4 were obtained from ixia, iris, crocus and gladiolus Nanus
hybrids grown in the Netherlands (table 1). No efforts were made to obtain samples from
these crops grown elsewhere in the world. The same applies to isolates of VCG 0341, 0342,
0344 and 0345. The limitation of our sampling strategy does not permit definite conclusions
about their geographic distribution.
The four isolates of VCG 0343 were all obtained from large-flowered gladioli grown for
flower production in the area of Naples (Italy). Symptoms were deviant from normal and had
never been observed in any other of the many samples from large-flowered gladioli received
by us or the diagnostic unit of the Bulb Research Centre (P.M. Muller, personal
communication). Planting material was imported from the Netherlands, but shipments from
the same batches to other areas did not show similar problems. It is therefore most likely that
VCG 0343 originates from the area of Naples. Since corms used for flower production are
usually discarded locally and not used for further propagation the risk for spread of this VCG
outside this area is limited.
Forma specialis nomenclature. Translation of the observed variation in vegetative
compatibility and virulence in terms of forma specialis and race classification gave rise to
some difficulties. McClellan (1945) observed that isolates from gladioli were also pathogenic
to crops of nine other genera of the Iridaceae, but that isolates from iris were not pathogenic
to gladiolus (as is the case for race 2i). It was Apt (1958) who, based on cross-inoculation
experiments, proposed to apply the name F. oxysporum f.sp. gladioli to the pathogens of the
genera Gladiolus, Iris and Crocus. Since then, it has been generally accepted that all isolates
of F.oxysporum causing diseases in iridaceous crops belong to the forma specialis gladioli
(Linderman, 1981; Nelson et al., 1981; Boerema and Hamers, 1989; Brayford, 1996). One
exception has been made for isolates causing so-called ‘pseudo-rust’ symptoms in some
cultivars of crocus. These isolates were considered distinct from isolates causing ‘corm rot’
and assigned to F.oxysporum f.sp. croci (Boerema and Hamers, 1989). Our finding that race
3 isolates (capable of causing ‘pseudo-rust’ symptoms) were not pathogenic to any of the
other iridaceous crops tested (table 3) supports the status of these isolates as a separate forma
specialis. However, their vegetative compatibility with isolates pathogenic to gladiolus and
other Iridaceae (VCG 0340) and hence classified as f.sp. gladioli, is at odd with this
classification.
VCGs AND RACES
26
Although the designation of formae speciales by Snyder and Hansen (1940) was not intended
to be a part of the formal taxonomic hierarchy, but only to describe their physiological
capabilities (host specialisation), we consider it inappropriate to assign isolates within the
same VCG (and hence probably clonally related) to different formae speciales. We are not
aware of any report on the co-existence of two formae speciales in one single VCG, even not
in other cases where overlapping host ranges occur within one plant family. Within the
Cruciferae three formae speciales are recognised (Bosland and Williams, 1987) each
consisting of a separate VCG. In the Cucurbitaceae separate studies have been carried out for
isolates of f.sp. cucumerinum (Katan, 1996), f.sp. melonis (Jacobson and Gordon, 1990a and
Katan et al., 1994) and f.sp. niveum (Larkin et al., 1990) and in each forma specialis one or
more distinct VCGs were established. None of these studies reported on vegetative
compatibility between isolates from different formae speciales.
Although one VCG harbouring two separate formae speciales would be undesirable, also the
assignment of the ‘pseudo-rust’ (race 3) isolates to the forma specialis gladioli could be
misleading. Race 3 isolates were found to be not pathogenic to the gladiolus cultivars tested
(tables 1, 2 and 3). The same applied to isolates of race 4, causing corm rot symptoms on
crocus. These were considered to belong to the forma specialis gladioli by Boerema and
Hamers (1989), but maintenance of this classification would be inconsistent with the fact that
gladiolus is not a natural host. On the other hand also their vegetative compatibility with
gladiolus isolates makes it undesirable to accommodate them in a separate subspecific taxon.
To avoid this dilemma all VCG 0340 isolates could be assigned to a new forma specialis
“f.sp. iridacearum” of which the name refers to the common host plant family of all member
isolates. This would be comparable to the view of Gerlagh and Blok (1988) who proposed to
erect the f.sp. cucurbitacearum for all isolates from different cucubitaceous crops.
The isolates of the other VCGs (0341-0345) from iridaceous crops can also be
accommodated in this new f.sp. iridacearum. Again the analogy with the situation in
cruciferous and cucurbitaceous crops is of interest. Armstrong and Armstrong (1952, 1981)
combined the formae speciales of crucifers, but Bosland and Williams (1986) opposed
against this view and reintroduced the three separate formae speciales, based on their findings
that in spite of cross-infectivity in greenhouse trials, host-specificity is maintained in the field
and that host preference corresponded with VCG. Parallel to this, Gerlagh and Blok (1988)
suggested to group the formae speciales in cucurbitaceous crops in one single forma specialis
cucurbitacearum, because of the existence of isolates with overlapping host ranges. The
finding of Kim et al. (1993), that two mtDNA RFLP groups occurred in different formae
speciales of cucurbits supports this idea of one unified forma specialis, but the authors argued
that the fact that the majority of isolates are still highly host-specific justifies the continuation
of the use of formae speciales with separate names.
In spite of the occurrence of cross-infectivity in Cruciferae and Cucurbitaceae, separate
formae speciales are accepted. In both instances, assignment to a specific forma specialis is
based on the host specificity as it occurs in the field and/or relative host preference in
experimental trial. In our collection isolates of VCG 0341 were isolated from gladiolus
Colvillei and Ramosus hybrids, freesia and ixia (table 1). In our greenhouse experiments no
CHAPTER 2
27
preference for one of the two susceptible hosts tested was evident (table 3). Isolates of VCG
0342 were only recovered from crocus (table 1). In the greenhouse experiments however
isolates of VCG 0342 were highly pathogenic to three other crops representing different plant
genera. Therefore, it remains unclear whether crocus is the only natural host crop of this
VCG. If so, this might be explained by two alternative hypotheses: (1) not only physiological
but also ecological specialisation determines the specificity of the fungus to a certain crop.
(2) Spatial separation of the crocus culture from the cultures of the other potential host crops
restricted the spread of this VCG to other crops. Isolates of VCG 0343 were all isolated from
large-flowered gladioli but were much more pathogenic to genotypes of other crops in the
greenhouse test, leaving the question of their natural host(s) obscure. Extensive sampling of
other iridaceous plants cultivated in the Naples area might elucidate this question. Isolates of
VCG 0344 and VCG 0345 were most pathogenic to their original host crop freesia, but since
both are single member VCGs it is impossible to say anything about their geographic
distribution.
In conclusion, our data gave no reason to recognise different formae speciales within our
collection. Maintenance of the forma specialis name gladioli, however, is, besides the already
mentioned arguments considering races 3 and 4, inconsistent with the fact that many isolates
were non-pathogenic to ‘Peter Pears’. Since this cultivar represents the large-flowered
gladioli, to which the forma specialis gladioli is generally associated, the name gladioli is
misleading. We therefore propose to erect a new forma specialis, f.sp. iridacearum,
accommodating all pathogenic F. oxysporum strains from iridaceous crops.
Race nomenclature. The different pathogenic phenotypes revealed in this study can be
classified as physiologic races within f.sp. iridacearum. These races obviously do not refer to
cultivar selectivity within one single plant species, as in f.sp. lycopersici (Jones and Woltz,
1981; Mes et al., 1999) and f.sp. melonis (Mas et al., 1981), where cultivar selectivity is
determined by single dominant resistance genes in the host. It is also different from the
situation in the f.sp. dianthi (Baayen et al., 1997), were the genetic determination is more
complex, but races are still recognised by differential host genotypes within a single plant
genus (Dianthus). Classification of races on the basis of pathogenicity to differential
genotypes belonging to different plant genera within a plant family (Iridaceae) is still in
agreement with Armstrong and Armstrong (1981), but in conflict with the view of Kistler
(1997) who proposed to limit the usage of the term race to describe cultivar-level specificity.
We feel that the use of the new forma specialis name iridacearum will help to make it clear,
that races within this forma speciales do not refer to cultivar-level specificity.
Historic isolates. Although the observed variation might explain the controversial views that
have existed in the past about the taxonomic classification and pathogenic capabilities of
Fusarium from gladiolus (Massey, 1926; Nelson, 1939; McCulloch 1944; Robertson, 1952;
Buxton, 1955a and 1955b, Forsberg 1955), it is impossible to make a reconstruction. From
the isolates used in these studies only one, deposited by Massey (1926) (accession numbers
ATCC 11851; CBS151.27), has been conserved and this isolate was found to be self-

VCGs AND RACES
28
incompatible (table 1). Two other ancient isolates from the CBS collection (accession
numbers 253.52 and 160.57) deposited by Scurti (1952), and Bruhn (1955) respectively were
also found to be self-incompatible (table 1), a feature probably resulting from prolonged
storage, as suggested by Jacobson and Gordon (1990a). Moreover, the latter two isolates were
found to be non-pathogenic to both our differential gladiolus cultivars (table 1), which might
also be a consequence of their prolonged storage, although it can not ruled out that the
genotypes used by both authors were susceptible to these particular isolates, while our test
cultivars are resistant. The isolate from Massey was pathogenic to ‘Nymph’ but not to ‘Peter
Pears’ (table 1). The gladiolus cultivars used by Massey are not available anymore and their
relatedness to the modern large-flowered hybrids is unclear. Whether this isolate would have
been already not pathogenic to cv. ‘Peter Pears’ at the time it was isolated, or that its
pathogenicity has changed during storage remains obscure.
Implications for resistance breeding and detection assays. The observed variation in our
collection is of importance both for resistance breeding and for the development of a
detection assay. To screen for Fusarium-resistance in the gladiolus germplasm a screening
assay using two aggressive race 1 isolates was developed (Löffler et al., 1997). When
resistance against these isolates is found, resistance against the other races should be checked
(Straathof et al., 1998). Mixtures of different races should not be used in resistance assays to
avoid possible effects of cross-protection (Roebroeck and Mes, 1992b). Selected plant
genotypes should also be screened against a larger number of race 1 isolates. Accessions of
G. dalenii, selected for resistance against two race 1 isolates, were also resistant against
isolates of other races in a laboratory assay using 1 cm disks of corm tissue, but were
susceptible to two out of eighteen race 1 isolates, arbitrarily chosen from our collection
(Straathof et al., 1998). In a greenhouse-experiment, however, these two isolates were hardly
pathogenic to these genotypes. Nevertheless, the results of the disk-assay showed that within
the group of isolates assigned to race 1 further variation with respect to host spectrum might
occur. This emphasises once more that detected variation in virulence patterns is always
restricted by the set of differential host genotypes and that the resulting race classification
expresses the difference between isolates assigned to different races rather than the similarity
of isolates assigned to the same race. It also illustrates that conclusions about durability of
resistance (Löffler et al., 1995) can not been drawn from data on variability within a
collection of isolates of the pathogen.
As discussed earlier, race 1 is the predominant pathotype within the culture of large-flowered
gladiolus and occurs worldwide. A method for the detection of latent infections in shipments
of large-flowered gladiolus corms should therefore be able to specifically identify race 1
isolates. Recently a multiplex-PCR-assay based on race 1 specific RAPD-markers was
developed (De Haan et al., 2000).
29
CHAPTER 3 Genetic diversity within a collection of isolates of
Fusarium oxysporum from iridaceous crops: RFLP- and
AFLP- fingerprints
E.J.A. ROEBROECK, J.J. MES, J.W.G. HELDENS & J. VAN DOORN
ABSTRACT
A collection of field isolates of Fusarium from iridaceous crops, previously characterised by vegetative compatibility and pathogenicity (chapter 2), was subjected to genetic analysis using two different molecular techniques. Analysis of restriction fragment polymorphisms (RFLPs) of HindIII digested DNA with an anonymous multi-copy probe from F. oxysporum f.sp. dianthi revealed seven groups with distinct RFLP patterns of variable complexity. VCG 0340 enclosed four of the RFLP groups. VCG 0341, 0342 and 0343 coincided with one RFLP group each. The two single-member VCGs 0344 and 0345, the self-incompatible isolate G25 (VCG 034-) and all non-pathogenic isolates displayed unique RFLP patterns. Analysis of 165 amplified restriction fragments (AFLPs) demonstrated the relatively close relationship between the four distinct RFLP groups within VCG 0340. The observed correlation between AFLP haplotypes, RFLP haplotypes and VCG is consistent with a clonal structure of the population analysed, with all VCGs representing distant clonal lineages of possibly polyphyletic origins. On the basis of AFLP analysis four subclonal lineages could be recognised within VCG 0340. These subclonal lineages coincided with RFLP groups and races. Isolates of the races 2i, 3 and 4 composed three of the subclonal lineages. The race 1 and race 2n isolates shared the same subclonal lineage, but the relatively close relationship of the race 1 isolates within this cluster suggested a common ancestor of race 1 isolates within the race 2n population. In the VCGs 0341, 0342 and 0343 no substructures were evident. Each of these VCGs enclosed closely related isolates belonging to the races 5, 2c and 1it respectively. Although a collection of field isolates will never enclose all genetic variation present in the field, the elucidation of the genetic structure of our collection provides a strong basis for the development of diagnostic tests specific to one of the (sub)clonal lineages (i.e. races or VCGs). It also provides information necessary to make a rational choice of reference isolates, covering as much of the observed genetic diversity as possible, to be used in resistance tests.
RFLP AND AFLP FINGERPRINTS
30
INTRODUCTION
In the second chapter genetic relationships between isolates of a collection of field isolates
from iridaceous crops were assessed by determining vegetative compatibility using nit
mutants. Within our collection six vegetative compatibility groups (VCGs) were found.
Presuming that vegetative compatibility in Fusarium oxysporum is the result of the action of
alleles of several distinct het or vic loci, like in genetically better characterised ascomycetes
(Glass and Kuldau, 1992; Leslie, 1993), and only isolates carrying identical alleles at all these
loci are vegetative compatible. Vegetative compatibility determination reflects genetic
similarities within VCGs, but not the degree of genetic differences between VCGs.
Moreover, a few isolates within our collection were found to be vegetatively self-
incompatible and therefore could not be assigned to a VCG. Molecular fingerprinting
techniques should give insight in the genetic relationships both within and between VCGs,
and will make it possible to determine the genetic association of vegetative self-incompatible
with other isolates in the collection.
Restriction fragment length polymorphisms (RFLPs) of mitochondrial and nuclear DNA have
been used in several formae speciales of Fusarium oxysporum to determine genetic variation
at the DNA level (Kistler et al., 1987 and 1991, Jacobson and Gordon, 1990b; Elias et al.,
1993; Manicom and Baayen, 1993). In their publication on the potential application of
random DNA probes and RFLPs in the taxonomy of the Fusaria, Manicom et al. (1987)
showed that their probe D4, derived from F.oxysporum f.sp. dianthi, gave multiple bands not
only for isolates of the forma specialis dianthi, but also for isolates from lycopersici and
gladioli. Within F.oxysporum f.sp. dianthi each VCG showed to have a distinct RFLP
patterns using probe D4 (Manicom et al., 1990; Manicom and Baayen; 1993). Probe D4 was
therefore chosen to examine RFLPs within our isolate collection. Results of the RFLP
analysis of part of our isolate collection has been published by Mes et al. (1994b), but for
purposes of review all RFLP data (published and unpublished) that we have obtained with
probe D4 will be presented in this chapter.
In 1995 a new PCR-based technique was introduced to detect restriction fragment length
polymorphisms in DNAs of any origin or complexity (Vos et al., 1995). This Amplified
(restriction) Fragment Length Polymorphism (AFLP) technique was developed by Keygene
(Wageningen, The Netherlands). Since the AFLP technique makes it possible to screen many
(50-100) randomly selected restriction fragments simultaneously it provides a relatively easy
way to analyse the genetic relationships in our collection with a high resolution. In fact the
AFLP-technique combines the advantages of RFLP analysis (highly discriminant) and PCR-
based molecular method (labour efficient) discussed by Edel et al. (1995).
MATERIALS AND METHODS
Fungal isolates. Isolates were obtained from various sources listed in chapter 2. All isolates
were monospored on potato dextrose agar (PDA) and stored as soil cultures in glass tubes at
4°C. Our collection of Fusarium oxysporum isolates from iridaceous crops consisted of 73

CHAPTER 3
31
pathogenic and 18 non-pathogenic (chapter 2: table 1) isolates. All pathogenic isolates were
subjected to RFLP analysis with probe D4. Of the 22 non-pathogenic isolates 14 were
analysed. A subset of 35 pathogenic isolates, representing all established VCGs and selected
previously for pathogenicity tests on different iridaceous crops (chapter 2; table 2), were also
subjected to AFLP analysis.
DNA isolation. From one-month-old stationary cultures of 100 ml liquid Czapek Dox
medium (Oxoid; Unipath Ltd, Basingstone, England) in 300 ml Erlenmeyer flasks, incubated
at room temperature, mycelium was collected by filtration, lyophilised, ground with mortar
and pestle in the presence of liquid nitrogen and either used directly or stored in air tight vials
at -20°C. DNA was isolated according to Manicom et al. (1987) using
cetyltrimethylammonium bromide (CTAB), but without repeated extraction in buffer
containing 10% CTAB.
Southern blotting and hybridisation. 3-5µg of total DNA was digested overnight at 37°C with
20 units of HindIII (Boehringer Mannheim GmbH, Mannheim, Germany). Digests were
subjected to electrophoresis on 1% agarose (Pronarose; Hispanagar, Burgos, Spain) in
0.5xTBE buffer (Sambrook et al., 1989) for 4 hours at 4 V.cm-1 or for 16 hours at 1 V.cm-1.
When required, 0.8% agarose and prolonged electrophoresis was applied to separate bands
otherwise poorly resolved. DNA was transferred from the gel to positively charged nylon
membrane (Hybond N+; Amersham International plc, Little Chalfont, England) by Southern
blotting according to the manufacturer’s instructions. Blots were incubated with a
horseradish-peroxidase-labelled probe, treated according to the standard instructions with the
chemiluminescent substrate luminol (ECL nucleic acid labelling and detection system;
Amersham) and exposed to X-ray films (Hyperfilm ECL; Amersham).
Probe D4, a 3400 bp random HindIII fragment from F. oxysporum f.sp. dianthi, was kindly
provided by B.Q. Manicom (Manicom et al., 1987 and 1990). The fragment was ligated into
the HindIII site of the plasmid vector pBR322 and used to transform E.coli strain HB101.
Plasmid DNA was isolated using standard procedures (Sambrook et al., 1989), digested with
HindIII and the insert was separated by gel electrophoresis and purified from the gel using
the Geneclean II kit (Bio101 Inc., La Jolla, CA, USA).
AFLP procedure. AFLP analysis was based on a preliminary procedure received from
Keygene (Wageningen, the Netherlands). The final protocol was published by Vos et al.
(1995). The procedures followed by us resembled the final protocol, but differed in some
details. Oligonucleotides were purchased from Pharmacia Biotech Benelux (Roosendaal, the
Netherlands) or Isogen Bioscience (Maarssen, the Netherlands).
1. Generation and selection of fragments. The restriction enzymes EcoRI (Boehringer
Mannheim, Mannheim, Germany) and MseI (New England Biolabs, Beverly, MA, USA)
were used to digest 0.5 µg of DNA and adapters were ligated to the restriction fragments as
described in the final protocol. The structure of the EcoRI-adapter was:
RFLP AND AFLP FINGERPRINTS
32
5'-biotin-CTCGTAGACTGCGTACC
|||||||||||
CTGACGCATGGTTAA-5'
Note that the top strand was biotinylated and that the bottom strand is three nucleotides
shorter than the sequence in the published protocol. The structure of the MseI-adapter was:
5'-GACGATGAGTCCTGAG
||||||||||||
TACTCAGGACTCAT-5'
Streptavidine Magnasphere beads (Promega, Madison, WI, USA) were used to select
biotinylated DNA fragments. Before use, 10 µl of beads was washed once in 100 µl of STEX
(0.1 M NaCl; 10 mM Tris-HCl; 1 mM EDTA; 0.1%(v/v) Triton X-100; pH8.0), resuspended
in 50 µl of 2 x STEX, added to 50µl of ligation reaction mixture, and incubated for 30 min at
room temperature with gentle agitation. Beads were collected with a magnet. Supernatant was
discarded and beads were washed once with 100 µl of STEX, resuspended in 100 µl of STEX
and transferred to a new tube. Beads were washed twice with 100 µl of STEX, resuspended in
200 µl of T0.1E buffer (10mM Tris-HCl; 0.1 mM EDTA; pH 8.0), transferred to a new tube
and stored at 4°C.
2. Non-selective amplification of template DNA. Preamplification was carried out with non-
selective primers (EcoRI-primer: 5'-AGACTGCGTACCAATTC. MseI-primer: 5'-
CGATGAGTCCTGAGTAA). Both non-selective primers were one nucleotide longer at the
5'-end than in the final protocol. Each reaction mixture consisted of 5 µl of bead suspension,
0.6 µl of both primers (50ng/µl), 0.1 µl of Taq polymerase (AmpliTaq 5 U/µl), 1.6 µl of
dNTPs (2.5 mM each), 2 µl of 10 x PCR-buffer II (100mM Tris-HCl, pH8.3; 500 mM KCl),
1.6 µl of MgCl2 (25 mM) (all from Perkin Elmer Corp, Norwalk, CT, USA) and 8.5 µl of
water. The PCR reaction was performed in a PE-9600 thermal cycler (Perkin Elmer Corp.,
Norwalk, CT, USA) in 36 cycles of 30 s denaturation at 94°C, 30 s annealing at 65-56°C and
1 min extension at 72°C. The annealing temperature in the first cycle was 65°C and was
subsequently reduced each cycle by 0.7°C for the next 12 cycles and finally continued at
56°C for the remaining 23 cycles. To verify the production of secondary template 10 µl of the
reaction mixture was subjected to electrophoresis on a 1.6% agarose gel in 0.5 x TBE buffer
(Sambrook et al., 1989). Amplification product appeared as a smear in the range of 50 to 800
base pairs. The remaining 10 µl was diluted to 500 µl in T0.1E buffer and stored at -20°C.
3. Selective amplification of restriction fragments. Selective amplification was performed
with primers containing two selective nucleotides at the 3'-end. The sequence of the selective
EcoRI-primer was 5'-GACTGCGTACCAATTC.TA and that of the MseI-primers 5'-
GATGAGTCCTGAGTAA.AT/...AA/...TG (selective nucleotides underlined). The EcoRI-
primer was radioactively labelled with [γ-33P]ATP (ICN Pharmaceuticals Inc., Radiochemical
Division, Irvine, CA, USA) according to the final protocol. The diluted preamplification
product was used as template DNA in a second, selective, amplification reaction.

CHAPTER 3
33
Composition of PCR reaction mixture, except for the concentration of the labelled EcoRI-
primer (0.5 µl of 10 ng/µl in 20 µl reaction volume), and temperature profile were equal to
those of the preamplification reaction. Initially, unlabelled selective MseI-primers with one
nucleotide less at the 5'-end were used, resulting in double bands. A 5' G-residue in the
unlabelled primer prevented this problem (Vos et al., 1995).
Reaction products were denaturated in formamide dye and loaded on 5% polyacrylamide gel
as described in the final protocol. Electrophoresis was performed at constant power (55 W)
for ~2 hours and 15 minutes on a SequiGen 21 x 50 cm sequencing gel system (BioRad
Laboratories Inc., Hercules, CA, USA). After electrophoresis gels were transferred to blot
absorbent filter paper (BioRad Laboratories Inc., Hercules, CA, USA), dried on a model 583
gel dryer (BioRad Laboratories Inc., Hercules, CA, USA) and exposed to Biomax MR-1
films (Eastman Kodak company, Rochester, NY, USA.) for 48 hours.
Analysis of banding patterns. Autoradiograms of both RFLP- and AFLP-analyses were
inspected visually on a bench viewer. Bands with different electrophoretic mobilities were
assigned position numbers. For each isolate the absence (0) or presence (1) of a band at each
position was recorded. For the AFLP-analysis bands from reaction with different sets of
selective primers were recorded serially. With the help of a GENSTAT 5 (Payne et al., 1987)
computer programme, Jaccard similarity coefficients were calculated for all possible pairs
using the FSIMILARITY directive, transferred into Sörensen (= 2 x Jaccard/ (1 + Jaccard))
similarity coefficients and from the similarity matrices dendrograms were drawn using the
HCLUSTER directive with average linkage.
In Jaccard (and Sörensen) similarity coefficients, absence of bands at a certain position in
both profiles is not taken into account (if xi = xj = 1, then 1, weight=1; if xi = xj = 0, then 0,
weight = 0 and if xi ≠ xj, then 0, weight=1). In similarity coefficients based on
simplematching (if xi = xj, then 1, weight=1 and if xi ≠ xj, then 0, weight=1) or Euclidean
distance (1-{(xi - xj)/range}2 , weight=1) the absence of bands in both profiles (xi = xj = 0) at
a certain position contributes equally to the similarity coefficient as the presence of bands at a
certain position in both profiles (xi = xj = 1). This implies that the similarity between two
profiles increases when new profiles are added with positions of bands not occurring in the
two profiles compared. It also implies that when a low ratio occurs between the number of
bands composing a pattern and the total number of scored positions most pairs and especially
those with simple patterns will score high similarity coefficients, since at most of positions
both pattern are the same score ( xi = xj=0) even when all bands of both patterns are different.
In our RFLP data set 55 possible positions of bands were scored, while the number of bands
composing a pattern varied from 1 to 16 (figure 1). Jaccard or Sörensen similarity
calculations were therefore considered appropriate to analyse this data set. Initially Sörensen
was preferred above Jaccard (Mes et al., 1994b) since a single change in the length of one
restriction fragment in a multiple banding profile leads to a new profile differing at two
positions. Sörensen accounts for this by weighing similar bands with a factor two. The large
variation in the complexity of banding patterns, however, indicated that differences between
patterns could not simply be interpreted as the sum of restriction fragment length
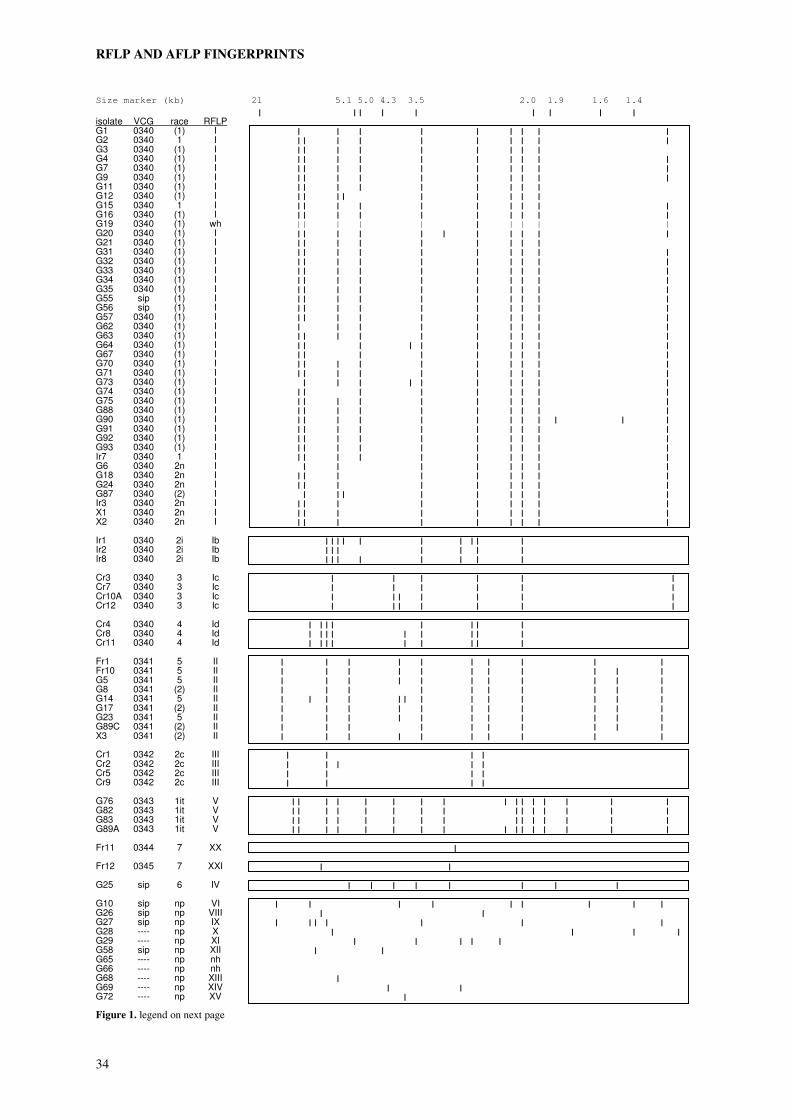
RFLP AND AFLP FINGERPRINTS
34
Size marker (kb) 21 5.1 5.0 4.3 3.5 2.0 1.9 1.6 1.4
| || | | | | | |
isolate VCG race RFLP G1 0340 (1) I | | | | | | | | |
G2 0340 1 I || | | | | | | | | G3 0340 (1) I || | | | | | | | G4 0340 (1) I || | | | | | | | | G7 0340 (1) I || | | | | | | | | G9 0340 (1) I || | | | | | | | | G11 0340 (1) I || | | | | | | | G12 0340 (1) I || || | | | | | G15 0340 1 I || | | | | | | | | G16 0340 (1) I || | | | | | | | | G19 0340 (1) wh || | | | | | | | | G20 0340 (1) I || | | | | | | | | | G21 0340 (1) I || | | | | | | | G31 0340 (1) I || | | | | | | | | G32 0340 (1) I || | | | | | | | | G33 0340 (1) I || | | | | | | | | G34 0340 (1) I || | | | | | | | | G35 0340 (1) I || | | | | | | | | G55 sip (1) I || | | | | | | | | G56 sip (1) I || | | | | | | | | G57 0340 (1) I || | | | | | | | | G62 0340 (1) I | | | | | | | | | G63 0340 (1) I || | | | | | | | | G64 0340 (1) I || | | | | | | | | G67 0340 (1) I || | | | | | | | G70 0340 (1) I || | | | | | | | | G71 0340 (1) I || | | | | | | | | G73 0340 (1) I | | | | | | | | | | G74 0340 (1) I || | | | | | | | G75 0340 (1) I || | | | | | | | | G88 0340 (1) I || | | | | | | | | G90 0340 (1) I || | | | | | | | | | | G91 0340 (1) I || | | | | | | | | G92 0340 (1) I || | | | | | | | | G93 0340 (1) I || | | | | | | | | Ir7 0340 1 I || | | | | | | | | G6 0340 2n I | | | | | | | | G18 0340 2n I || | | | | | | | G24 0340 2n I || | | | | | | | G87 0340 (2) I | || | | | | | | Ir3 0340 2n I || | | | | | | | X1 0340 2n I || | | | | | | | X2 0340 2n I || | | | | | | | Ir1 0340 2i Ib |||| | | | || | Ir2 0340 2i Ib ||| | | | | Ir8 0340 2i Ib ||| | | | | | Cr3 0340 3 Ic | | | | | | Cr7 0340 3 Ic | | | | | | Cr10A 0340 3 Ic | || | | | | Cr12 0340 3 Ic | || | | | | Cr4 0340 4 Id | ||| | || | Cr8 0340 4 Id | ||| | | || | Cr11 0340 4 Id | ||| | | || | Fr1 0341 5 II | | | | | | | | | | Fr10 0341 5 II | | | | | | | | | | | G5 0341 5 II | | | | | | | | | | | G8 0341 (2) II | | | | | | | | | | G14 0341 5 II | | | | || | | | | | | | G17 0341 (2) II | | | | | | | | | | | G23 0341 5 II | | | | | | | | | | | G89C 0341 (2) II | | | | | | | | | | X3 0341 (2) II | | | | | | | | | | Cr1 0342 2c III | | | | Cr2 0342 2c III | | | | | Cr5 0342 2c III | | | | Cr9 0342 2c III | | | | G76 0343 1it V || | | | | | | | || | | | | | G82 0343 1it V || | | | | | | || | | | | | G83 0343 1it V || | | | | | | || | | | | | G89A 0343 1it V || | | | | | | | || | | | | | Fr11 0344 7 XX | Fr12 0345 7 XXI | | G25 sip 6 IV | | | | | | | | G10 sip np VI | | | | | | | | | G26 sip np VIII | | G27 sip np IX | || | | | | G28 ---- np X | | | | G29 ---- np XI | | | | | G58 sip np XII | | G65 ---- np nh G66 ---- np nh G68 ---- np XIII | G69 ---- np XIV | | G72 ---- np XV |
Figure 1. legend on next page
CHAPTER 3
35
Figure 1. (On previous page) Schematic presentation of RFLP patterns observed on Southern blots of total DNA digested with HindIII and probed with probe D4. Positions of size markers (lambda HindIII/EcoRI) are given at the top. For each isolate VCG, race and RFLP group is indicated. For those isolates of which pathogenicity was only tested against the two differential gladiolus cultivars ‘Peter Pears’ and ‘Nymph’ race codes sensu Roebroeck and Mes (1992) (see also chapter 2; table 1) are given between parenthesis are. np = non pathogenic. Of a subset of 35 isolates, of which the pathogenicity to several iridaceous crops was tested, race codes as proposed in chapter 2 are given. Presence of bands was scored by visual examination of autoradiograms and is presented as black bars. Isolates are grouped according to the result of cluster analysis of pair wise Jaccard coefficients. A dendrogram of the RFLP patterns of the subset of 35 isolates is presented in figure 4.
polymorphisms at a fixed number of loci. This challenged the initial choice of Sörensen
similarity coefficient to express the similarity between two isolates. Although Jaccard
similarity coefficients will slightly underestimate the genetic similarity in cases were
differences are caused by a strict restriction fragment polymorphism at a given locus, it was
chosen for reasons of simplicity. Moreover, both similarity coefficients yielded generally the
same dendrogram (except of course for the scaling on the similarity axis).
For the analysis of AFLP data Jaccard similarity coefficients were considered the most
appropriate, since this technique displays presence or absence of restriction fragments rather
than length differences (Vos et al., 1995). Only in very few cases, when a small deletion or
insertion has occurred within an amplified restriction fragment, co-dominant markers are
detected. Similarity based on a large set of AFLP fragments can be considered an accurate
measure of genetic distance since “most of the AFLP fragments correspond to unique
positions on the genome” (Vos et al., 1995) and are randomly distributed. In this respect
AFLP analysis is comparably suited to genetic diversity studies as analysis based on
anonymous, single-copy, RFLP loci (Koenig et al., 1997).
RESULTS
RFLP analysis. Within the collection of 87 isolates subjected to RFLP analysis with probe
D4 in total 55 positions were scored for presence or absence of hybridising bands. The
complexity of the hybridisation patterns varied considerably from one to sixteen bands
(figure 1). When standard conditions and duration of gel electrophoresis were applied, each
position corresponded with approximately 1 mm on the autoradiograms. Application of
standard gel electrophoresis conditions did not always resolve all hybridising fragments
within each pattern and the assessment of difference in positions of (nearly) co-
electrophoresing bands from two different patterns could differ between runs. On the other
hand we experienced that although similar banding patterns were easily recognised at first
glance, even when present on different autoradiograms, subsequent measurement of band
positions (in relation to size marker bands) could lead many times to differences in size
judgement of presumably identical bands. Rerunning of the two samples side by side on the
same gel always confirmed the similarity of the patterns. Therefore, comparison of band

RFLP AND AFLP FINGERPRINTS
36
Figure 2. Restriction fragment length polymorphism observed for the vegetative compatibility groups within Fusarium oxysporum f.sp. iridacearum exemplified by representatives of each RFLP group recognised. Southern blots of total DNA digested with HindIII and probed with D4.
Figure 3. Restriction fragment length polymorphism observed within VCG 0340 of Fusarium oxysporum f.sp. iridacearum. Of RFLP group I reference isolates are presented. Of the RFLP groups Ib, Ic and Id all isolates present in our collection are shown. Southern blot of total DNA digested with HindIII, subjected to electrophoresis for prolonged time and probed with D4.
4.3
1.4
1.6
2.0
3.5
0.9
1.9
5.0
21
5.1
kb
G2
G1
5
G6
Ir3
X1
Ir1
Ir2
Cr3
Cr1
0A
Cr4
Cr1
1
mar
ker
mar
ker
mar
ker
mar
ker
Fr1
Cr1
G7
6
Fr1
1
Fr1
2
G2
5
Race
VCG
2c 5 1it 7 7 6 1 2n 2i 3 4
0340
03
41
03
42
03
43
03
44
03
45
03
4 -
0.8
Iso
late
G2
Ir7
Ir3
X1
X2
Ir1
Ir2
Ir8
Cr3
Cr7
Cr1
0A
Cr1
2
Cr4
Cr8
Cr1
1
Race
Isolate
1 2n 2i 3 4
kb
4.3
3.5
5.0
1.9 2.0
RFLP group I Ib Ic Id
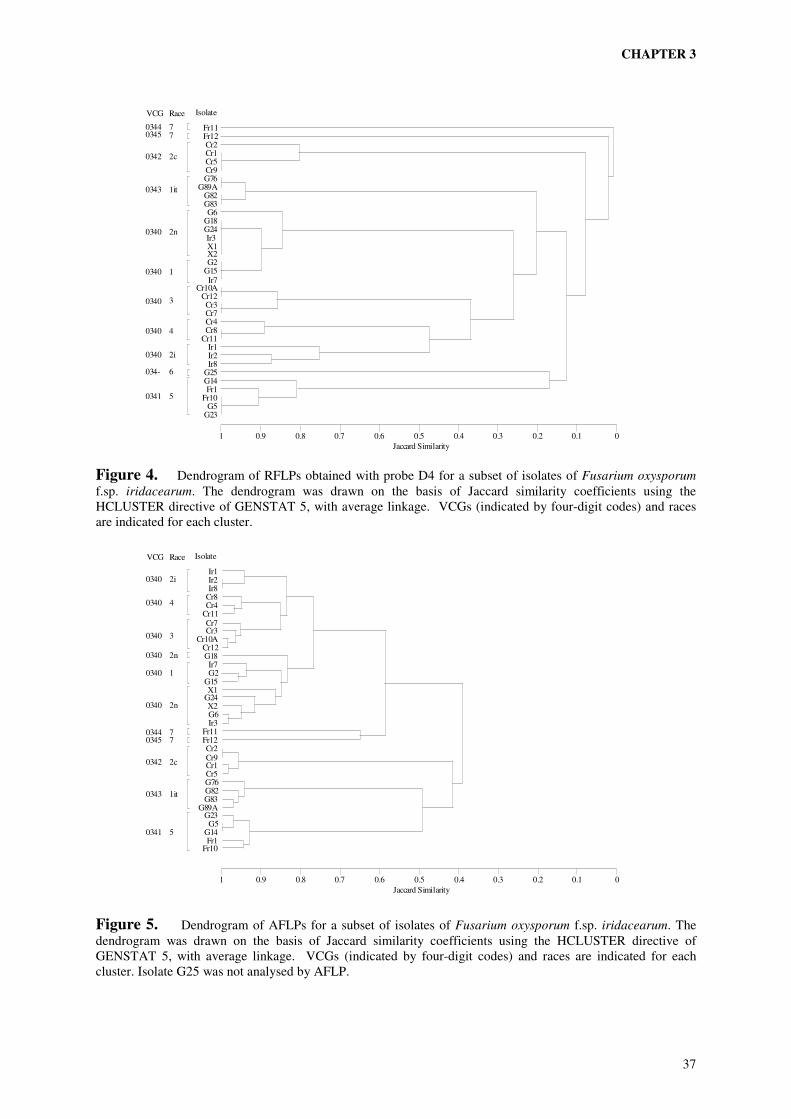
CHAPTER 3
37
Figure 4. Dendrogram of RFLPs obtained with probe D4 for a subset of isolates of Fusarium oxysporum f.sp. iridacearum. The dendrogram was drawn on the basis of Jaccard similarity coefficients using the HCLUSTER directive of GENSTAT 5, with average linkage. VCGs (indicated by four-digit codes) and races are indicated for each cluster.
Figure 5. Dendrogram of AFLPs for a subset of isolates of Fusarium oxysporum f.sp. iridacearum. The dendrogram was drawn on the basis of Jaccard similarity coefficients using the HCLUSTER directive of GENSTAT 5, with average linkage. VCGs (indicated by four-digit codes) and races are indicated for each cluster. Isolate G25 was not analysed by AFLP.
0344 0345
77
0342
0343
2c
1it
0340 2n
0340 1
0340 3
0340 4
0340 2i
0341 5
034- 6
Fr11Fr12Cr2Cr1Cr5Cr9G76
G89AG82G83G6
G18G24Ir3X1X2G2
G15Ir7
Cr10ACr12Cr3Cr7Cr4Cr8
Cr11Ir1Ir2Ir8
G25G14Fr1
Fr10G5
G23
VCG Race Isolate
1 0.9 0.8 0.7 0.6 0.5 0.4 0.3 0.2 0.1 0
Jaccard Similarity
0344 0345
77
0342
0343
2c
1it
0340 2n
0340 1
0340 3
0340 4
0340 2i
0341 5
VCG Race
0340 2n
Cr10A
Fr12
Ir1
Ir8Cr8Cr4
Cr11Cr7Cr3
Cr12G18Ir7G2
G15X1
G24X2G6Ir3
Fr11
Cr2
Cr5G76G82G83
G89AG23
G14Fr1
Fr10
Isolate
Cr9Cr1
G5
Ir2
1 0.9 0.8 0.7 0.6 0.5 0.4 0.3 0.2 0.1 0
Jaccard Similarity
RFLP AND AFLP FINGERPRINTS
38
positions of patterns from different groups was also based on running samples from different
groups in adjacent lanes. Thus, although the final score of presence or absence of bands at
each position (figure 1) was based on repeated analysis of samples in different combinations,
the natural variability and limitation in the resolution of the technique implies the existence of
incidental misjudgements of band position.
All 73 pathogenic isolates yielded patterns of restriction fragments hybridising to probe D4,
although one (G19; VCG 0340) showed very weak hybridisation even after several attempts.
Clustering analysis revealed seven groups of pathogenic isolates. Three pathogenic isolates
(G25, Fr11 and Fr 12) showed single distinctive RFLP patterns. In figure 1 a schematic
representation of the RFLP patterns of all isolates are presented. In figure 1 isolates are
grouped according to the result of the cluster analysis based on Jaccard similarity
calculations. Autoradiograms showing representative patterns of each group are presented in
figure 2. From the fourteen non-pathogenic isolates analysed eleven showed hybridisation to
probe D4, all with distinctive patterns (figure 1). RFLP groups and monotypic RFLP patterns
were numbered in Roman numerals in accordance with Mes et al. (1994b) and are also
presented in figure 1. Hybridisation patterns not described by Mes et al. (1994b) were
assigned new numbers.
VCGs coincide with RFLP groups except for VCG 0340, which apparently contained four
RFLP groups (figure 1). Isolates from iris belonging to race 2i and isolates from crocus
belonging to race 3 and 4 each showed patterns aberrant from that of RFLP group I, which
accommodated both race 1 and race 2n isolates. To express the fact that these three new
RFLP groups belong to the same VCG as group I, they were designated Ib, Ic and Id. Since
these aberrant patterns contained bands which apparently consisted of two or more poorly
resolved fragments, digested DNA of all isolates of these three groups were subjected to
electrophoresis for prolonged time on 0.8% agarose gels together with some reference
isolates from RFLP group I (figure 3).
Two of the self-incompatible pathogenic isolates (G55 and G56) were clustered in RFLP
group I, the third one (G25) showed a unique restriction fragment pattern (RFLP IV) as
already mentioned. A dendrogram drawn from the RFLP data of the subset of 35 pathogenic
isolates (figure 4) illustrates the relationship between RFLP groups, VCGs and races.
AFLP analysis. AFLP analysis of the same subset of 35 pathogenic isolates with three
different sets of selective primers yielded 165 AFLP fragments, which were scored for
presence or absence. Compared to the assessment of band positions on RFLP autoradiograms,
the presence or absence of a band at each position could be scored relatively easily due to the
much higher resolution of the polyacrylamide gel electrophoresis technique. The few
positions where faint bands were observed were ignored. The AFLP-fragments scored were
in the size range of 50 to 400 base pairs. For unknown reason isolate G25 yielded only very
few selectively amplified AFLP-fragments and was therefore excluded from the cluster
analysis. Only twenty-three of the 165 AFLP fragments scored were present in all isolates of
the subset, indicating a high degree of genetic diversity among the isolates. The dendrogram
based on AFLP data (figure 5) revealed 4 groups coinciding with VCGs, while the two
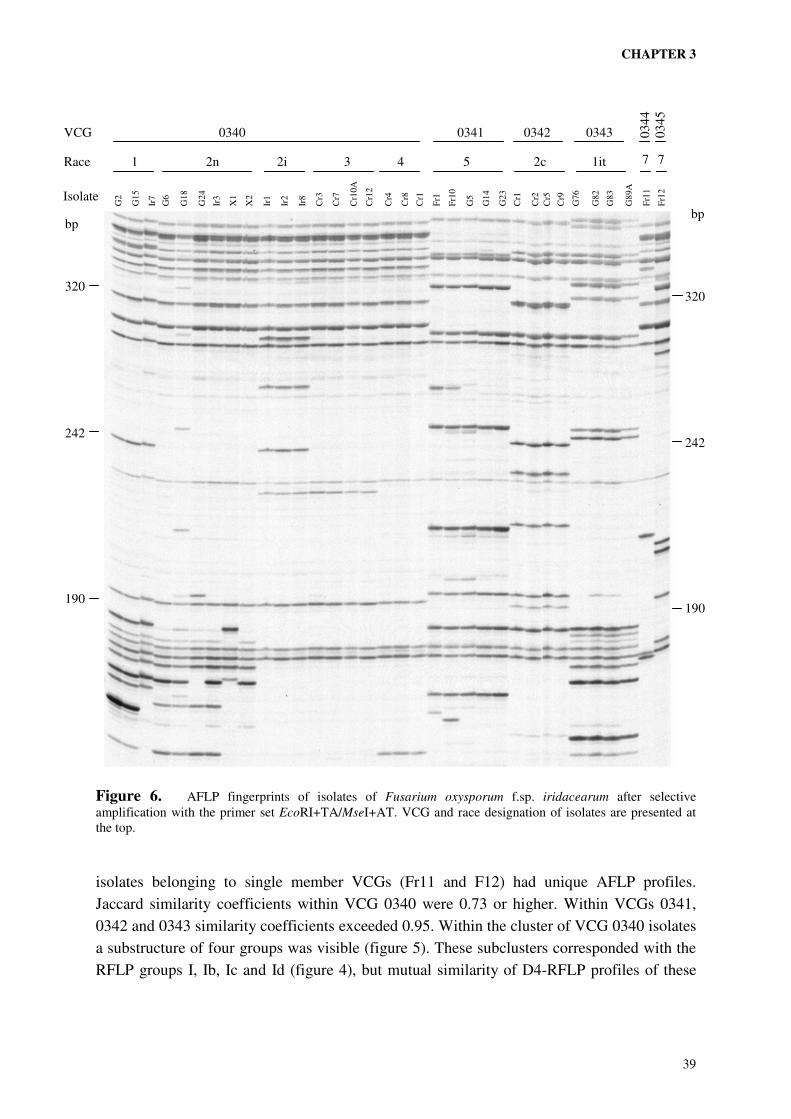
CHAPTER 3
39
Figure 6. AFLP fingerprints of isolates of Fusarium oxysporum f.sp. iridacearum after selective amplification with the primer set EcoRI+TA/MseI+AT. VCG and race designation of isolates are presented at the top.
isolates belonging to single member VCGs (Fr11 and F12) had unique AFLP profiles.
Jaccard similarity coefficients within VCG 0340 were 0.73 or higher. Within VCGs 0341,
0342 and 0343 similarity coefficients exceeded 0.95. Within the cluster of VCG 0340 isolates
a substructure of four groups was visible (figure 5). These subclusters corresponded with the
RFLP groups I, Ib, Ic and Id (figure 4), but mutual similarity of D4-RFLP profiles of these
Isolatee
G2
G15
Ir7
G6
G18
G24
Ir3
X1
X2
Ir1
Ir2
Ir8
Cr3
Cr7
Cr1
0A
Cr1
2
Cr4
Cr8
Cr1
Fr1
Fr1
0
G5
G14
G23
Cr1
Cr2
Cr5
Cr9
G76
G82
G83
G89A
Fr1
1
Fr1
2
Race 1 2n 2i 3 4 5 2c 1it 7 7
VCG 0340 0341 0342 0343 03
44
0
34
5
bp bp
320
242
190
320
242
190
RFLP AND AFLP FINGERPRINTS
40
groups was much lower than that of AFLP profiles. Figure 6 shows the AFLP-fingerprints
obtained with one of the primer sets.
DISCUSSION
Concordance of VCGs, RFLP groups and AFLP groups. In contrast with the situation in F.
oxysporum f.sp. dianthi (Manicom and Baayen, 1993 and Baayen et al. 1997), where all
isolates within a VCG showed similar RFLP patterns with probe D4, we observed the
presence of four different types of RFLP patterns within one single VCG (0340). Within each
of the VCGs 0341, 0342 and 0343 isolates showed similar RFLP patterns. Between VCGs no
similarity of patterns was observed. The two isolates of the single-member VCGs 0344
(Fr11) and 0345 (Fr12) both showed unique patterns, as did the self-incompatible pathogenic
isolate G25. The two self-incompatible isolates G55 and G56 were shown to be closely
associated to RFLP group I of VCG 0340 and can be considered members of this VCG which
have lost their ability of vegetative self-compatibility during prolonged storage in culture
(Jacobson and Gordon, 1990a).
Isolates Fr11 and Fr12 showed very simple hybridisation patterns with probe D4 of one and
two bands respectively. Both isolates were found to be highly pathogenic to freesia ‘Pink
Glow’ (chapter 2), confirming the finding of Manicom and Baayen (1993) for f.sp. dianthi
that simple hybridisation patterns with probe D4 can also occur in pathogenic strains
although complex patterns are more common.
Within the seven D4-RFLP groups in our collection (I, Ib, Ic Id, II, III and V) some variation
in banding patterns occurred but this variation was relatively small compared to the
differences between patterns from different groups (figures 1 and 4). Isolates of each RFLP
group appeared to be genetically closely related and probably represent clonal lineages. The
relationship between the four RFLP groups that was found within VCG 0340 is not clear. The
RFLP groups Ib, Ic and Id are somewhat closer related to each other than to other groups
(figure 4), but their similarity to RFLP group I is low and comparable to the similarity
between group I and group V (VCG 0343). AFLP data, however, unambiguously
demonstrated the relative close relationship of isolates of the four RFLP groups within VCG
0340 (figure 5). The excellent correlation between VCG and AFLP haplotypes is strongly
indicative of a clonal population structure. The finding of four distinct D4-RFLP groups
within VCG 0340 is not inconsistent with the idea of one clonal origin of this VCG, but
might reflect its relatively long evolutionary history. The AFLP data support this notion,
since the genetic diversity in VCG 0340 measured by the AFLP analysis is large compared to
that in other VCGs and the AFLP subclusters in the VCG 0340 coincide with the four D4-
RFLP groups in this VCG.
Even when vegetative incompatibility would have been observed between some of these four
subclusters their clonal relationship would not have been disproved. Changes in one of the
loci controlling vegetative compatibility might occur by genetic drift within a clonal lineage
leading to the splitting off of a new VCG. The occurrence of more than one VCG within
CHAPTER 3
41
clonal lineages of F. oxysporum f.sp. cubense (Koenig et al., 1997) is in line with such a
model. Also the occurrence of a subcluster of VCG 0032 isolates within a larger cluster of
VCG 0030 isolates in f.sp. lycopersici, established by RFLP-analysis (Elias et al., 1993) as
well as RAPD-analysis (Mes et al., 1999), is in accordance with this model. The finding that
VCG 0032 isolates do show very weak complementation reactions with VCG 0030 isolates
after prolonged incubation of complementary nit-mutants (Mes et al., 1999) can be explained
by the idea that changes in vic loci do not necessarily lead to complete loss of vegetative
compatibility. The demonstration of VCG-subgroups in F.oxysporum f.sp. radicis-lycopersici
(Katan et al., 1991) based on differences in the intensity of complementation reaction of nit-
mutants supports this. In our subset of isolates belonging to VCG 0340 we also observed
large quantitative differences of the intensity complementation reactions, but VCG subgroups
could not be established (data not shown).
Evolution of races. The correlation between the AFLP subclusters, RFLP clusters and races
within VCG 0340 indicate that the three groups of isolates characterised as race 2i, 3 and 4
each represent distinct subclonal lineages. The isolates within the subset previously
characterised as race 1 and race 2n formed a fourth subclonal lineage. The isolates belonging
to race 2n displayed the largest variation in AFLP profiles. The three race 1 isolates form a
small cluster with little variation within this AFLP subcluster. Whether this means that not
only these three isolates, but also all other race 1 isolates from our collection have a single
common clonal ancestor within the race 2n population requires extensive AFLP analysis of
these isolates. Within the subset of isolates studied, however, each set of isolates sharing the
same virulence spectrum are (sub)clonally related. In F.oxysporum f.sp. dianthi (Baayen et
al., 1997) also isolates belonging to the same race are clonally related. This in contrast to the
situations in ff.spp. melonis (Jacobson and Gordon, 1990b and 1991; Schroeder and Gordon
1993) and lycopersici (Elias et al., 1993; Mes et al., 1999) , where isolates belonging to the
same race are present in different genetic backgrounds. In these two formae speciales,
however, races are characterised by the single dominant plant resistance gene(s) they have
overcome. This is principally different from the race designation system applied in the ff.spp.
dianthi and iridacearum where races are defined solely on the basis of the virulence pattern
displayed on a set of differential plant genotypes, without knowledge about the plant genes
involved. Therefore it cannot be ruled out that convergent evolution of (some of the) fungal
genes determining the virulence pattern has taken place. Only cloning and molecular
characterisation of these genes in the different races will allow us to draw final conclusions in
this respect. But also in formae speciales where convergent evolution of races seems apparent
(i.e. melonis and lycopersici), molecular evidence is lacking to support the hypothesis that
race formation in different clonal lineages has the same genetic basis.
The observation that race differentiation has occurred within one of the main clonal lineages
(VCG 0340), shows the possibility of the pathogen to change its virulence without sexual
recombination. Development of new races by genetic drift, challenging newly introduced
resistant plant genotypes, might therefore be conceivable. Information about the time scale of
the development of races within VCG 0340 is, however, missing. Gordon and Martyn (1997)
RFLP AND AFLP FINGERPRINTS
42
discussed two recently described situations of F. oxysporum f.sp. melonis in Israel and F.
oxysporum f.sp. lycopersici in California where recent development of one race from another
race within a single VCG might have taken place.
The fact that all 36 of the more recently (after 1979) collected isolates from large flower
gladiolus belong to the cosmopolitan VCG 0340/race 1 and are not related to the isolates
deposited in culture collections in 1927 (G25), 1952 (G26) and 1957 (G27), might indicate
that the observed genetic drift might actually occur within decades. Monitoring of a recently
established pathogenic population of F. oxysporum consisting of a single clonal lineage with
still very little genetic variation, like VCG 0170 of F.oxysporum f.sp. albedinis (Tantaoui et
al., 1996 and Renandez et al., 1997), with a powerful technique as AFLP analysis will
provide information about the possible speed at which genetic diversity within a clonal
lineage arises.
Phylogeny of the forma specialis. RFLP analysis demonstrated little homology between
VCGs indicating a polyphyletic origin of this group of isolates unified by their pathogenicity
to (some) iridaceous crops. Similarity of D4-RFLP patterns between VCGs of f.sp.
iridacearum is comparably low to similarity with D4 patterns of f.sp. dianthi (Manicom and
Baayen, 1993 and Baayen et al., 1997). Also similarity of AFLP profiles is strikingly low.
Only 23 out of 165 AFLP fragments were present in all isolates. An appropriate outgroup,
necessary to draw conclusions about the polyphyletic origin of the forma specialis, however,
is missing. The AFLP-analysis was primarily aiming at elucidating the genetic structure
within VCG 0340, considering the other VCGs as outgroups. The assumption of different
evolutionary origins of VCG is strongly supported by a phylogenetic study based on gene
genealogies in which isolates of the different VCGs from our collection were incorporated
(R.P.Baayen and K. O’Donnell, pers. comm.). Independent evolutionary origins of VCGs
belonging to the same forma specialis have already been demonstrated in other formae
speciales (Koenig et al., 1997; O’Donnell et al., 1998). But, as for race formation within
formae speciales, the molecular genetics underlying pathogenicity to a plant genus or family
in different VCGs remain to be elucidated.
Historic isolates. The self-incompatible pathogenic isolate G25 showed a complex RFLP
pattern not associated with any of the other patterns. Probably this historic isolate, deposited
in 1927 in the ATCC collection (accession number ATCC11851; CBS151.27) by Massey
(1926) belongs to a VCG distinct from the other VCGs, which all consisted of isolates
obtained after 1979. The same might apply to the isolates G26 (CBS 253.52) and G27 (CBS
160.57) deposited by Scurti (1952) and Bruhn (1957), although these isolates were not
pathogenic to our differential gladiolus cultivars (chapter 2). On the other hand, both authors
published their pathogenicity studies, which makes it unlikely that these isolates were non-
pathogens at the time of their isolation. Effects of prolonged storage on vegetative self-
compatibility and pathogenicity have been reported regularly for F.oxysporum. Unfortunately
this makes it impossible to evaluate the dispute on the nature of the causal agent(s) of
Fusarium disease(s) in gladiolus earlier this century (Massey, 1926; Nelson, 1939;
CHAPTER 3
43
McCulloch 1944; Robertson, 1952; Buxton, 1955a and 1955b, Forsberg 1955), but the fact
that RFLP analysis indicates a genetically diverse nature of the three historic isolates in our
collection points out that indeed different authors might have been studying different
populations of the fungus.
Implications for resistance breeding and detection assays. As stated earlier in this thesis,
knowledge of the genetic diversity within the pathogenic population is of great importance to
effectively breed for disease resistance. All known races should be taken in consideration
when developing resistance assays. The finding that all isolates in the subset belonging to the
same race have a (sub)clonal origin and display relatively little genetic diversity as measured
by RFLP and AFLP analysis, makes it conceivable to use one isolate of each race and still
cover most of the genetic variation observed in the collection.
Since race 1 is the predominant pathotype within the culture of large-flowered gladiolus
worldwide, detection of latent infections in shipments of large-flowered gladiolus corms
should be aiming at specifically detecting race 1 isolates. The RFLP and AFLP analyses
presented in this chapter identified race 2n isolates as the closest relatives from which race 1
isolates need to be distinguished. A molecular detection assay therefore requires highly
specific markers, which can discriminate between race 1 and race 2n isolates. When such
markers are found isolates of the other races within VCG 0340 as well as isolates of the other
VCGs and non-pathogenic isolates need also to be checked. At the Bulb Research Centre
(Lisse, The Netherlands) RAPD markers present in race 1, but absent is race 2n were
identified after screening 160 RAPD-primers (Mes et al., 1994a; De Haan et al., 2000). These
race-1-specific RAPD fragments were used to design a multiplex-PCR-assay, which can
discriminate race 1 isolates from all other isolates in our collection of F.oxysporum from
gladiolus and other iridaceous crops.

45
CHAPTER 4
Parasexual recombination between race 1 and race 2n
isolates of Fusarium oxysporum f.sp. iridacearum by
hyphal anastomosis and protoplasts fusion E.J.A. ROEBROECK, J.R. BAO, N. ISASI & J.W.G. HELDENS ABSTRACT
Two relatively closely related isolates, one of race 1 and one of race 2n of Fusarium
oxysporum f.sp. iridacearum were chosen for further study of the genetics underlying host specialisation. Accomplishment of parasexual crosses between these two isolates might make it possible to further study these genetics. In this chapter we report on the development of systems to produce parasexual recombinants between these two isolates. Auxotrophic mutants could be induced by UV-treatment of spores. Fusion of vegetative cells of complementary auxotrophs either by hyphal anastomosis (both isolates belong to the same vegetative compatibility group) or by PEG/Ca-mediated protoplast fusion, yielded prototrophic fusion products, displaying irregular growth at reduced rates. These types of colonies were considered heterokaryotic. From a small proportion of heterokaryotic colonies rapidly growing prototrophic mycelium emerged after prolonged incubation. These products maintained their prototrophic phenotype after sub-culturing and monospore-culturing. RAPD- and AFLP-analysis revealed non-parental combinations of genetic markers in the progeny, indicating that indeed parasexual recombination had occurred. Moreover, the observed reassortment of molecular markers after hyphal anastomosis indicated that also in nature parasexual recombination might play a role in the genetics of this fungus. AFLP analysis revealed polymorphisms between UV-mutants illustrating the presence of many unwanted genetic changes. Since the induced auxotrophies per se led to loss of pathogenicity, it was impossible to check phenotypically whether or not the gene(s) of interests were affected by the UV-treatment. In contrast, transformation of both isolates with plasmids carrying hygromycin B or phleomycin resistance genes resulted in stable antibiotic resistant transformants, which maintained the pathogenic phenotype of the wild type strains. After protoplast fusion of antibiotic resistant transformants, initially irregularly and slowly growing colonies developed on double selective medium. From some of these colonies vigorously growing mycelium emerged, which maintained its double resistant phenotype after sub-culturing and monospore-culturing. Fusion products showed reassortment of molecular markers. Fusion and recombination frequencies varied considerably between different pairs of transgenic parental strains. The best pairings yielded fusion and recombination frequencies high enough to create populations of parasexual recombinants, which subsequently can be used to study the genetics of the difference in host specialisation between race 1 and race 2n of F. oxysporum f.sp. iridacearum.
PARASEXUAL RECOMBINATION
46
INTRODUCTION
Within a collection of pathogenic field isolates of Fusarium oxysporum (Schlecht.: Fr.) from
iridaceous crops six vegetative compatibility groups (VCGs 0340-0345), including two single
member VCGs, were recognised. Within one of these VCGs (VCG 0340) five different
physiologic races were found (chapter 2). AFLP-analysis revealed four subclonal lineages
within VCG 0340, three coinciding with distinct races and one accommodating isolates of
both race 1 and race 2n isolates (chapter 3). These two races can easily be distinguished by
their differential pathogenicity to the large flowered gladiolus cultivar ‘Peter Pears’. This
cultivar is susceptible to race 1, but resistant to race 2n.
Race 1 was found to be distributed world wide within the culture of the economically
important large-flowered gladiolus and is probably the dominant phenotype causing fusarium
disease in this crop (chapter 2). The relatively close relationship between race 1 and race 2n
isolates may indicate that relatively simple genetic changes might have led to change in host
genotype specificity. Moreover, from the even closer mutual relationship of the race 1
isolates within the race 1/race 2n-subcluster it was postulated that race 1 isolates are possibly
the vegetative offspring of one common ancestor, which developed pathogenicity to large
flowered gladiolus. Unravelling the genetics underlying the difference in virulence between
race 1 and race 2n will provide insight in this process. Understanding of the genetics of race
development is desirable in relation to resistance breeding and, moreover, might lead to new
strategies of disease control. Furthermore, when genes involved in host specificity are
identified, they can serve as excellent target DNAs for the development of race specific
detection assays.
Although genetic distances between race 1 and race 2n isolates as measured by AFLP are
relatively small, they can not be considered isogenic, like isolates of race 1 and race 8 of
VCG 0022 of F. oxysporum f.sp. dianthi (Baayen et al., 1997), which show hardly any
difference in AFLP fingerprints (C. Waalwijk, pers. comm.). Race 1 and race 2n isolates of
VCG 0340 shared only about 85% of the 165 AFLP markers screened (chapter 3). A cloning
strategy based on genomic substraction was therefore considered not feasible.
In other formae speciales like ff.spp. melonis and lycopersici, where races are identified by
their ability to overcome single dominant plant resistance genes, it might be speculated that
single dominant fungal avirulence genes determine race specificity. Since the two
differential gladiolus cultivars ‘Peter Pears’ and ‘Nymph’ belong to two different hybrid
groups with different wild Gladiolus species as ancestors (Ohri and Khoshoo, 1983) and are
very difficult to interbreed, knowledge about the plant genetics involved in differential
response the two gladiolus cultivars to race 1 and race 2n is not available. So, no clues were
available about the nature (dominance of virulence or avirulence) or complexity of the
genetics determining the difference in the virulence between race 1 and race 2n. Cloning
strategies based on deletion or complementation were hence considered too risky. Moreover,
a complementation study involving the transformation of a race 1 isolate with a genomic
cosmid bank of a race 2n isolate and vise versa, would involve pathogenicity testing of an
unpractical large number of transformants.
CHAPTER 4
47
A map based cloning strategy might offer a more attractive alternative. However, since
Fusarium oxysporum (Schlecht.: Fr.) is an imperfect fungus, classical genetic analysis of
host specificity of races, involving sexual crosses of isolates from different races, is not
possible. In order to study the genetics underlying the difference in host specialisation
between race 1 and race 2n of F.oxysporum f.sp. iridacearum we choose to set-up a system to
enforce parasexual crosses, comparable with a system suggested for Cladosporium fulvum
(Arnau and Oliver, 1996). Also for F. oxysporum genetic studies via parasexual
recombination might be feasible. Buxton (1956) reported the recovery of recombinants from
forced heterokaryons of complementary auxotrophic mutants from two different races of F.
oxysporum f.sp. pisi. Sanchez et al. (1976) and Sidhu and Webster (1979) were able to
produce heterokaryons from complementary auxotrophic mutants of F.oxysporum f.sp.
lycopersici, but did not report the occurrence of prototrophic recombinants. Later, Molnár et
al. (1985b) did demonstrate the occurrence of recombinant benomyl-resistant phenotypes by
protoplast fusion of auxotrophic mutants from the same wild type strain of F. oxysporum f.sp.
lycopersici. Crosses between different strains, belonging either to different VCGs, different
races or even different formae speciales, were reported by Molnár et al. (1990), who also
showed that parasexual recombination might occur after hyphal anastomosis of auxotrophic
mutants. The use of UV-induced auxotrophies as selection markers has disadvantages like
time-consuming selection procedures because of their recessive nature, possible occurrence
of back-mutations and presence of additional, unwanted, mutations caused by the UV-
treatment. The use of dominant selection markers like antibiotic resistances, introduced by
transformation, offered an attractive alternative in protoplast fusion experiments (Talbot et
al., 1988).
This chapter describes the development of methods to enforce fusions between two isolates
of race 1 and race 2n from VCG 0340, using UV-induced auxotrophies as well as antibiotic
resistances obtained by transformation as selection markers. Practical aspects of both the
production of mutants/transformants carrying selection markers and the production of fusion
products are presented. Pathogenicity tests and molecular analysis of mutant and
transformant strains are required to evaluate their suitability as parents. Molecular analysis of
fusion products was used to determine if recombination occurs and hence the developed
fusion system(s) can be applied to study the genetics of the difference in host specialisation
between the two physiologic races.
MATERIALS AND METHODS
Fungal isolates and culture conditions. Two wild-type strains of Fusarium oxysporum f.sp.
iridacearum, one of race 1 (G2) and one of race 2n (G6), were chosen as ‘parents’ for fusion
experiments. Wild type strains, selected mutants, transformants and fusion products were
monospored and stored as soil cultures in glass tubes at 4°C.
Spore suspensions required for diverse purposes were produced as follows. Spores were
harvested from 2 to 4 weeks old cultures on potato dextrose agar (PDA; Oxoid Unipath Ltd.,
PARASEXUAL RECOMBINATION
48
Basingstone, England) incubated at 27°C in the dark, filtered through Ederol filter no.261
(J.C. Binzer, Hatzfeld/Eder, Germany) to remove mycelial fragments, washed and
resuspended in sterile water. Spore concentration was assessed using a haemocytometer and
suspensions were diluted to the required concentrations.
UV-treatment and selection of auxotrophic mutants. Spore suspensions (100 µl of 103 spores
ml-1) of wild-type strains were plated on 9cm plates with PDA. After removal of lids, plates
were exposed for 5-10 minutes to an UV source (254 nm) at 40 cm distance resulting in
survival percentages between 10% and 50%. After two days at 27°C in the dark colonies
were duplicated plated on CDA (Czapek Dox agar; Oxoid), containing nitrate as sole nitrogen
source, and on PDA. Initially peptone, yeast extract and casein hydrolysate (1 g l-1 each) were
added to the PDA, but later this was found not necessary to enable growth of auxotrophic
mutants. After another two days strains showing no growth on CDA, but normal growth on
PDA were selected, monospored and tested on CDA plated with different nutritional
amendments (1 g l-1). Auxotrophs were designated with a suffix of the concerning nutritional
requirement.
Preparation of protoplasts. One ml of spore suspension (1-5 x 10⁸ spores ml-1) was used to
inoculate 50 ml of potato dextrose broth (PDB; Difco laboratories, Detroit, MI, USA) in 300
ml Erlenmeyer flasks. Cultures were incubated for 16 hours at 27°C in the dark on an orbital
shaker at 150 rotations per minute (rpm) and filtered through Ederol filter no. 261. The
filtrate, mainly containing ungerminated spores, was discarded and the residue was scraped
from the filters with a spatula and transferred to 50-ml tubes. Fresh weights of residues
typically were 200-500 mg. 10 ml of MSM (1M MgSO4; 50mM maleic acid (pH5.8))
containing 5 mg ml-1 NovoZym 234 (Novo Nordisk, Bagsraerd, Denmark) was added and
tubes were vortexed briefly to homogenise suspensions. Tubes were capped and incubated
horizontally for 2 hours at 30°C in an orbital shaker at 60 r.p.m. and filtered through Edelerol
filter no. 261 to remove undigested germtubes and mycelium. After centrifugation for 15 min.
at 1500 g protoplasts floated at the surface of the buffer, while cell wall debris was pelleted.
Using a pipette with 1 ml pipette tips, protoplasts were resuspended by gently stirring and
pipetting up and down the supernatant, without disturbing the pellet. Resuspended protoplasts
were transferred to fresh 50-ml tubes. SNT (1 M Sorbitol; 0.1 M NaCl; 10 mM Tris.HCl (pH
7.4)) was added to 50 ml and tubes were centrifuged for 30 min at 1500 g at 4°C. Pellets were
washed twice with 50 ml SNT, centrifuged for 10 min at 1500 g and finally resuspended in
the appropriate volume of osmotically stabilised buffer, depending on the purpose.
Transformation. A transformation protocol based on Punt and Van den Hondel (1992) was
applied to introduce antibiotic resistance genes as selection markers. Plasmid vectors pAN7.1
and pAN8.1, carrying respectively a hygromycin B resistance gene (hph) from Escherichia
coli and a phleomycin resistance gene (ble) from Streptoalloteichus hindustanus, both
flanked by the gpdA promoter from Aspergillus nidulans upstream and the A. nidulans trpC
CHAPTER 4
49
transcription termination signal downstream, were kindly provided by P.J. Punt and
C.A.M.J.J. van den Hondel (TNO, Rijswijk, the Netherlands). Protoplast suspensions of wild-
type strains (1 ml of 107 pps ml-1) were washed twice with SNTC (1.2 M sorbitol; 3.5 mM
NaCl; 10 mM Tris.HCl (pH 7.5); 50 mM CaCl2) resuspended in 150 ml SNTC and
transferred to 15 ml centrifuge tubes. In a small volume (< 5 µl) 5-10 µg of vector DNA was
added and tubes were left on ice for 30 minutes. In three successive steps 250 µl, 250 µl and
850 µl of 60% PEG-Ca (60% polyethylene glycol Mw 4000, 50 mM CaCl2; 10 mM Tris.HCl;
pH 7.5) was added and suspensions were mixed gently each step by tapping the tubes with a
finger. After incubation on ice for 20 minutes, 8 ml of SNTC was added and mixed gently by
inverting the tubes several times. Tubes were centrifuged for 10 minutes at 1500 g and pellets
were resuspended in 0.5 ml SNTC. Of this suspension 100 ml aliquots were plated on CDA,
osmotically stabilised with 1 M sorbitol, containing either 100 mg ml-1 hygromycin B
(Calbiochem-Novabiochem, La Jolla, CA, USA) or 50 mg ml-1 phleomycin (Cayla, Toulouse,
France). Platings on PDA without sorbitol were used to check presence of spores in the
protoplast preparations. Platings on stabilised PDA without antibiotics were used to assess
regeneration frequencies of protoplasts. Plates were incubated at 27°C in the dark. After 3 to
4 days, fast growing colonies appearing on selective media were transferred to fresh selective
CDA. When the antibiotic resistant phenotype was maintained, monospore cultures were
made on (non-selective) PDA. Antibiotic resistance was assessed by measuring radial growth
and transformants were checked for cross-resistance to the other antibiotic.
Hyphal anastomosis of auxotrophs . Four reservoirs were made in 9-cm CDA plates using a
6-mm cork borer. A 1:1:1:1 mixture of spore suspensions (106 spores ml-1) of both
auxotrophic parental strains, molten CDA and PDA (~50°C) was used to fill the reservoirs
and plates were incubated at 27°C in the dark. From the edges of fast growing colonies,
appearing during an incubation period of 3 weeks, mycelium was transferred to fresh CDA
plates. When prototrophic growth was maintained, monospore isolations were made on PDA
and prototrophy of monospore culture was reconfirmed on CDA.
Protoplast fusion of auxotrophs and transformants. Protoplast suspensions (107 pps ml-1; 0.5
ml each) in SNT of parental strains were mixed and centrifuged at room temperature for 5
min at 1500 g. Supernatant was removed with a pipette and tubes were put on ice. Protoplasts
were resuspended in 1 ml of pre-chilled 30%PEG-Ca (30% polyethylene glycol Mw 4000; 10
mM CaCl2; 10mM Tris-HCl (pH 7.5)) and left on ice for 30 minutes. Tubes were centrifuged
for 5 minutes at 1500g, supernatant was removed and pellets were resuspended in 1 ml of
SNT at 4°C. Samples were left on ice and diluted in cold SNT. After each dilution step
suspension were homogenised by gently pipetting up and down. Platings on PDA without
sorbitol were used to check for the presence of spores in the protoplast preparations. Platings
on stabilised PDA were used to assess regeneration frequencies of protoplasts. In fusion
experiments with auxotrophs, stabilised CDA was used as selective medium. In experiments
with antibiotic resistant transformants as parental strains, stabilised CDA containing both
PARASEXUAL RECOMBINATION
50
hygromycin B (100 mg ml-1) and phleomycin (50 mg ml-1) was applied to select for fusion
products. In all fusion experiments protoplast mixtures treated with SNT instead of 30%PEG-
Ca and separate protoplast suspensions of both parental strains treated either with 30%PEG-
Ca or SNT served as controls. Plates were incubated at 27°C in the dark. Fast growing
colonies appearing on selective media were transferred to fresh plates with selective media
without sorbitol. When selective phenotype (prototrophy or double antibiotic resistance) was
maintained, monospore cultures were made on non-selective PDA and maintenance of
phenotype was checked before fusion products were numbered and stock cultures were
prepared.
DNA isolation. DNA was extracted from isolated fungal protoplasts. Protoplasts were
suspended in 1 ml SNT and centrifuged at 4000 rpm in a microcentrifuge for 5 min at room
temperature. Supernatant was removed using a pipette, 20-50µl of pelleted protoplast
material was resuspended in 200 µl SNT and used for DNA isolation with the Easy-DNATM
Kit (Invitrogen Corp., San Diego, CA, USA), following the DNA isolation and precipitation
paragraphs from the small scale protocol for yeast cells, provided by the manufacturer.
DNA required for RAPD analysis was also isolated via a procedure based on Tennis et al.
(1990). About 50 mg of fresh weight mycelium from 3-4 days old PDB culture was
transferred to 1.5 ml micro tubes and incubated for 1 hour at 65°C in 400 ml of lysis buffer
(50mM EDTA; 50 mM Tris.HCl (pH 7.2); 3% sodium dodecyl sulphate; 2% dithiothreitol).
The buffer was extracted with an equal volume of chloroform: (TE-saturated) phenol:
isoamyl alcohol (25:24:1) and centrifuged for 5 min at 10,000 g. The aqueous phase was
transferred to a fresh tube and DNA was precipitated by adding 0.1 volume of 3M sodium
acetate and 0.6 volume of isopropanol and centrifuged for 5 min at 10,000 g. Supernatant was
removed and the pellet was washed once with cold 70% ethanol, air dried and dissolved in 50
ml T0.1E (10 mM Tris.HCl (pH 8.0); 0.1 mM EDTA).
Southern analysis. 3-5 mg of total DNA was digested with the required restriction enzyme(s)
(Boehringer Mannheim GmbH, Mannheim, Germany), electrophoresed on 0.8-1% agarose
(Pronarose D1; Hispanagar, Burgos, Spain) gels using standard techniques (Sambrook et al.,
1989) and transferred to positively charged nylon membranes (Hybond N+; Amersham
International plc., Little Chalfont, England), using alkaline blotting conditions described by
the manufacturer. After blotting, membranes were briefly washed twice in 2 x SSC
(Sambrook et al., 1989), air dried and used either directly or stored in a dry place at room
temperature between clean sheets of filter paper.
Probes were either digoxigenin-11-dUTP labelled by direct PCR-labelling or labelled with
[α32P] dATP (ICN Pharmaceuticals Inc., Radiochemical Division, Irvine, CA, USA) by
random primed labelling. CDP-StarTM was used as chemiluminescent substrate for alkaline
phosphatase. All materials (except [α32P] dATP) required for labelling, hybridisation,
washing, blocking and signal detection (except for the radioactive label) were obtained from
CHAPTER 4
51
Boehringer Mannheim and procedures were carried out according to the manufacturer’s
instructions.
RAPD analysis. Random amplified polymorphic DNAs (Williams et al., 1990) were
generated using 10-mer oligonucleotide primers obtained from Operon technologies, Inc.,
Alameda, CA, USA (Kit A-H). Primer codes and nucleotide sequences (5' to 3') of the
primers showing polymorphism between the two parental isolates and selected to analyse
fusion products were: OPA-01= CAGGCCCTTC; OPB-14 = TCCGCTCTGG; OPE-20 =
AACGGTGACC; OPF-13 = GGCTGCAGAA; OPG-12 = CAGCTCACGA; OPG-15 =
ACTGGGACTC.
PCR reaction mixtures (final volume 50 ml) consisted of 5 ml of fungal DNA preparation
(50-100 ng), 2 ml of RAPD-primer (10 pmol ml-1), 5 ml of 10 x PCR buffer (15 mM MgCl2;
500 mM KCl; 0.1% (w/v) gelatine; 1% Triton X-100; 100 mM Tris.HCl [pH 9.0]), 2 ml of
dNTPs (2.5 mM each), 0.05 ml of Taq polymerase (SuperTaq 5U/ml; HT Biotechnology
Ltd., Cambridge, England) and 35.95 ml of water. Reaction mixtures were covered with 100
ml of mineral oil and PCR was performed in a Omnigene thermal cycler (Hybaid Ltd.,
Teddington, England) in 35 cycles after initial denaturation for 4 min at 94°C. Each cycle
consisted of 30 s denaturation at 94°C, 40 s annealing at 35°C and 2 min extension
at 72°C. The last cycle had a final extension at 72°C for 10 min. Amplification products were
electrophorised on 1.5% agarose (Pronarose D1) containing 0.5 mg ml-1 ethidium bromide in
0.5 x TBE (Sambrook et al., 1989) at 4-5 V cm-1 for 2 hours and gels were photographed on a
UV trans-illuminator.
AFLP analysis. Digestion of DNA, ligation of adapters and AFLP reactions in two steps were
performed as described by Vos et al. (1995). Preamplification reactions were performed in a
volume of 20 ml with non-labelled primers without selective nucleotides. Preamplification
products were diluted 10-fold with T0.1E (10mM Tris.HCl (pH 8.0); 0.1 mM EDTA) and
stored at -20°C. The second (selective) amplification reactions were performed with primers
containing two selective nucleotides at the 3'-end. EcoRI-primers were radioactively labelled
with [γ33P]ATP. PCR reactions were performed in a PE-9600 thermal cycler (Perkin Elmer
Corp., Norwalk, CT, USA).
Reaction products from selective amplification reactions were denaturated in formamide dye
and analysed on 5% polyacrylamide gels at constant power (55 W) for ~2 hours and 15
minutes on a SequiGen 21 x 50 cm sequencing gel system (BioRad Laboratories Inc.,
Hercules, CA, USA). After electrophoresis gels were transferred to blot absorbent filter paper
(BioRad Laboratories Inc., Hercules, CA, USA), dried on a model 583 gel dryer (BioRad
Laboratories Inc., Hercules, CA, USA) and exposed to Biomax MR-1 films (Eastman Kodak
company, Rochester, NY, USA.) for 48 hours.
Pulsed Field Gel Electrophoresis. Chromosomal DNA preparations were obtained as
follows.: Protoplasts were resuspended in STE (1 M sorbitol; 25 mM Tris.HCl (pH 7.5) ; 50
PARASEXUAL RECOMBINATION
52
mM EDTA) at a concentration of 2-4 x 10⁸ pps ml-1, warmed up to 37°C and mixed with an
equal volume of 1.2% InCert agarose (FMC BioProducts, Rockland, ME, USA) in STE held
at 50°C. Mixtures were pipetted into disposable plug molds (Bio-Rad Laboratories Inc.,
Hercules, CA, USA) and solidified at 4°C for 10 min. Plugs (1.5 x 5 x 10 mm) were pushed
out of molds and transferred to 1.5 ml micro tubes (one plug per tube) containing 1 ml of
NDS digestion buffer (0.5 M EDTA; 0.1 M Tris.HCl (pH 9.5); 1% (w/v) Lauroylsarcosine)
with 0.2 mg ml-1 proteinase K (Birren and Lai, 1993). Plugs were incubated for 48 h at 50°C
with replacement of NDS after 24 h. After two successive washes of at least two hours in 50
mM EDTA (pH 8.0), plugs were stored in 50 mM EDTA (pH8.0) at 4°C for up to 6 months.
Prior to electrophoresis plugs were washed once in electrophoresis buffer and transferred to
wells in 1% Seakem Gold (FMC BioProducts) agarose in 0.5 x TBE (Sambrook et al., 1989).
PFGE was carried out by contour-clamped homogeneous electric field (CHEF)
electrophoresis (Vollrath and Davis, 1987) using the CHEF DR-II system (Bio-Rad
Laboratories). Electrophoresis was performed either at 4°C, 1.5 V cm-1 with switching
intervals increasing from 1200 to 4800 s, during a period of 236 h with replacement of
electrophoresis buffer every two days (10 day run) or at 4°C, 2 V cm-1, switching intervals
from 900-1800 sec for 164 hours (7 day run). As size standards chromosomal DNA
preparations of Saccharomyces cerevisiae and Schizosaccharomyces pombe (FMC
BioProducts) were used. After electrophoresis gels were stained in ethidium bromide (1 ml
ml-1) for 30 min, UV irradiated for 2 minutes to induce nicking of the chromosomal DNA,
de-stained for 1 hour in water, photographed, incubated in alkaline blotting solution (0.4 M
NaOH; 1.5 M NaCl) for 15 minutes and blotted to positively charged nylon membranes
(Hybond N+) for 24-48 h. After blotting, membranes were washed briefly twice in 2 x SSC
(Sambrook et al., 1989) and air dried. Hybridisation experiments were conducted as
described in the paragraph on Southern analysis.
Pathogenicity tests. Spore suspensions of 106 spores ml-1 were used to inoculate corms of the
two differential gladiolus cultivars ‘Peter Pears’, susceptible to race 1 (isolate G2), but
resistant to race 2n (isolate G6) and ‘Nymph’, susceptible to both parental races. Plant
material, inoculation technique and greenhouse conditions were as described for testing of
field isolates (chapter 2). Disease development was scored visually six weeks after planting.
Tests were carried out under quarantine measures.
RESULTS
Fusion of auxotrophs. Auxotrophic UV-mutants were obtained at frequencies of 0.5-1%,
which is comparable to those reported for F. oxysporum f.sp. pisi (Buxton, 1956) and F.
moniliforme (Puhalla and Spieth, 1983). A leucine requiring mutant of isolates G2 (G2leu-)
and an adenine-requiring mutant of isolate G6 (G6ade-) was used in both hyphal anastomosis
and protoplast fusion experiments. In hyphal anastomosis experiments, dense mycelium
developed after several days on the edges of reservoirs, but only on plates to which mixtures
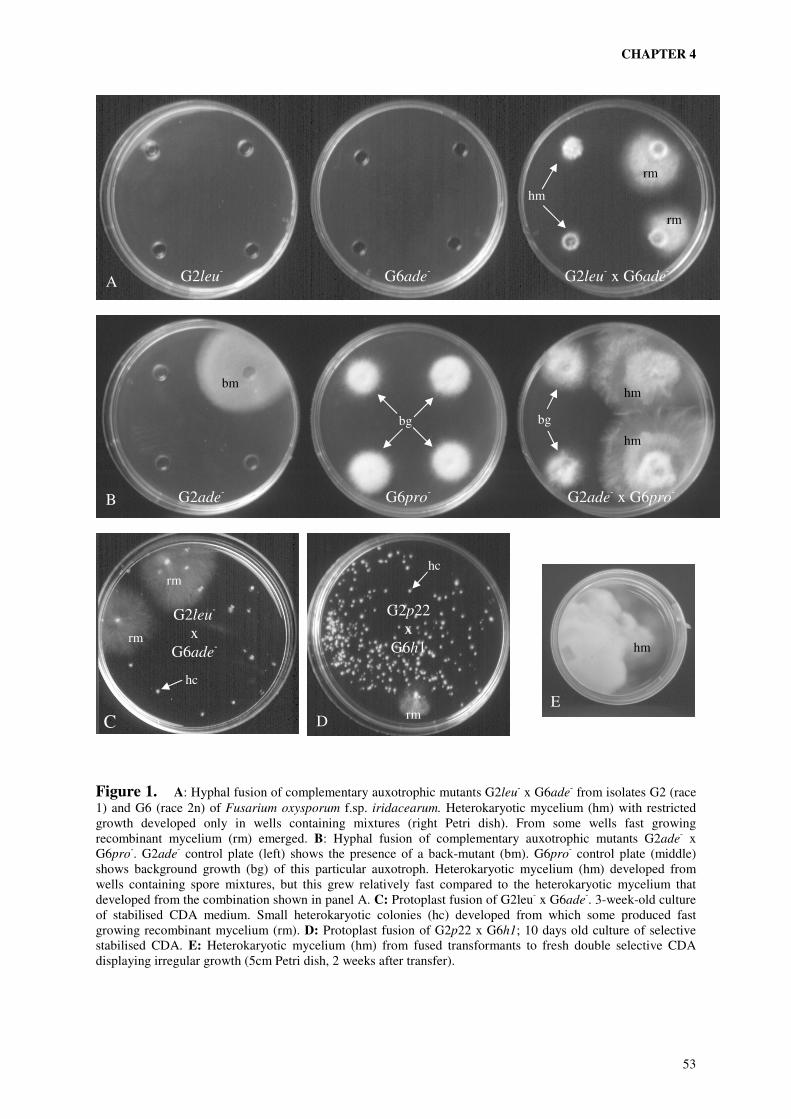
CHAPTER 4
53
Figure 1. A: Hyphal fusion of complementary auxotrophic mutants G2leu- x G6ade
- from isolates G2 (race 1) and G6 (race 2n) of Fusarium oxysporum f.sp. iridacearum. Heterokaryotic mycelium (hm) with restricted growth developed only in wells containing mixtures (right Petri dish). From some wells fast growing recombinant mycelium (rm) emerged. B: Hyphal fusion of complementary auxotrophic mutants G2ade
- x G6pro
-. G2ade- control plate (left) shows the presence of a back-mutant (bm). G6pro
- control plate (middle) shows background growth (bg) of this particular auxotroph. Heterokaryotic mycelium (hm) developed from wells containing spore mixtures, but this grew relatively fast compared to the heterokaryotic mycelium that developed from the combination shown in panel A. C: Protoplast fusion of G2leu- x G6ade
-. 3-week-old culture of stabilised CDA medium. Small heterokaryotic colonies (hc) developed from which some produced fast growing recombinant mycelium (rm). D: Protoplast fusion of G2p22 x G6h1; 10 days old culture of selective stabilised CDA. E: Heterokaryotic mycelium (hm) from fused transformants to fresh double selective CDA displaying irregular growth (5cm Petri dish, 2 weeks after transfer).
A
B
C D
E
G2leu- G2leu
- x G6ade
-
G2ade- G6pro
- G2ade- x G6pro
-
hm
rm
rm
bm
bg bg
hm
hm
hm
G2leu-
x G6ade
-
G2p22
x G6h1
hc
rm
rm
rm
hc
G6ade-
PARASEXUAL RECOMBINATION
54
of both parental strains had been applied. Growth of this mycelium, however, was restricted
and did not extend to more than a few mm’s at the end of the experiments after 3 weeks
(figure 1A). After one week of incubation fast growing colonies, emerging from the dense
mycelium, were observed. In the second and third week faster growing colonies (figure 1A)
occurred and at the end of the experiments one third to one half of the reservoirs had
produced such colonies. In control plates, containing the two parental strains separately,
neither dense mycelium nor fast growing colonies were observed. After transfer to fresh CDA
plates all presumed fusion products maintained their wild type growth rate, as did their
monospore cultures.
Comparable experiments with UV-mutants carrying other auxotrophic markers were less
successful. Some auxotrophic UV-mutants showed leaky growth on CDA or back-mutations
occurred (figure 1B). In contrast to the combination of G2leu- and G6ade
-, other
combinations developed moderately fast growing mycelium emerging from reservoirs
containing spore mixtures (figure 1B). When transferred to fresh CDA plates generally either
no growth or again a moderate growth rate was observed. Moderately fast growing colonies
displayed a more ragged growth than wild types and fast growing prototrophic fusion
products. Only incidentally fast growing colonies were recovered, which maintained their
prototrophic phenotype after monosporing. Also in the intra strain combination of G2leu- and
G2ade- irregularly growing mycelium developed from reservoirs containing mixed spores,
which maintain a growth rate of about 50% of that of the wild type. Spores harvested from
these colonies showed one of both parental auxotrophic phenotypes at unbalanced ratios.
In protoplast fusion experiments with G2leu- and G6ade
- small prototrophic colonies
developed on stabilised CDA plates after 3 days of incubation, only from PEG-treated
protoplast mixtures. Regeneration frequencies of protoplasts varied between 3 and 15%.
Fusion frequencies calculated from number of colonies on selective CDA and non-selective
PDA plates were 2-20%. The prototrophic colonies on stabilised CDA showed strongly
restricted growth, limiting colony diameters to about two millimetres after 3 weeks of
incubation (figure 1C). From some of the restricted colonies fast growing prototrophic
mycelium (figure 1C) developed, starting after about one week. At the end of the
experiments, after 3 weeks, fast growing mycelium had emerged from 2-5% of the small
colonies. Molnár et al. (1985a) reported a fusion frequency of 7% after PEG-treatment of
protoplast of complementary auxotrophs and that about 5% of the hybrid colonies started to
grow vigorously. Fast growing colonies maintained their prototrophic phenotype, when
transferred to fresh CDA plates and after monospore cultures were prepared. From
protoplasts of both parental strains plated separately, or protoplast mixtures without PEG
treatment, prototrophic colonies were never observed on stabilised CDA, indicating that
neither back-mutation nor cross-feeding occurred. Like in the hyphal anastomosis
experiments combinations of UV-mutants carrying other auxotrophic makers were less
successful due to either back-ground growth, back-mutations, instability of prototrophic
phenotypes after transfer or monospore culturing or a combination of these phenomena.
Fusion experiments with G2leu- and G2ade
- resulted in prototrophic colonies on stabilised
CHAPTER 4
55
CDA with a moderate growth rate which was maintained after transfer to fresh CDA plates.
Spores harvested from these fusion products only showed parental auxotrophic phenotypes.
The two auxotrophic mutants G2leu- and G6ade
- showed complete loss of pathogenicity to
both differential gladiolus cultivars, possibly as a direct result from their auxotrophy, since
the few fusion products which were tested simultaneously were found to be pathogenic to
both cultivars (data not shown).
Transformation with selection markers. Transformation of protoplasts of both wild type
strains G2 and G6 with plasmid vectors pAN7.1 (carrying a hygromycin B resistance gene)
and pAN8.1 (carrying a phleomycin resistance gene), resulted in stable transgenic
phenotypes. Transformation efficiency was low, ranging from 0.5 - 5 transformants per mg of
vector DNA, but sufficiently high for our purpose. Most transformants were stable in
phenotype when transferred from selective stabilised medium to fresh selective medium and
after monospore culturing on non-selective medium. Hygromycin B resistant transformants
did not show any reduction in radial growth on CDA with 100 mg ml-1 hygromycin B (radial
growth at 27°C was ~7 mm day-1), while mycelial growth of wild type strains was completely
inhibited. Phleomycin resistant transformants also grew evenly well on CDA with 50 mg ml-1
phleomycin as on plain CDA, while wild type strain were strongly inhibited (radial growth at
27°C was < 1 mm day-1). Tests for cross-resistance against the other antibiotic were always
negative.
Integration of vector DNA into the genome of fungal host strains was demonstrated by
hybridisation of blots from pulsed field gels with vector DNA (figure 2). Randomly labelled
insert DNA from pAN7.1 was used as probe. Due to the presence of the gpdA promoter and
the trpC transcription termination signal in both pAN7.1 and pAN8.1 cross hybridisation
occurred. From the twelve transformants analysed eight showed a signal after hybridisation
of PFGE blots with DIG-labelled vector DNA. In three of these transformants integration was
observed in chromosomes present in chromosomal band III (~ 4.9 Mb), while in another three
transformants vector DNA hybridised to chromosomal band VII (~ 2.8 Mb) (examples in
figure 2). The remaining two displayed integration of vector DNA chromosomal bands I and
V (not shown). PFGE revealed that transformation could induce chromosome length
polymorphism. In one of the twelve transformants analysed by PFGE a change in
electrophoretic karyotype was observed. In transformant G2h12 the chromosomal band VI
(~3.3 Mb) present in the wild type was missing, while a new smaller band (~2.9 Mb)
appeared (figure 2C). Changes in chromosome length provoked by genetic transformation
have also been reported for Nectria haematococca (Kistler and Benny 1992).
Southern blots of digested total DNA demonstrated differences in integration patterns
between different transformants. Both single copy and multicopy integrations, including
tandem repeat integrations, occurred (data not shown), but also transformants possessing
multicopy integrations showed hybridisation of vector DNA only with a single chromosomal
band on PFGE blots (e.g. G6h1 in figure 2), indicating that the multicopy integrations were
not scattered throughout the genome. Inoculation experiments with four transformants of

PARASEXUAL RECOMBINATION
56
each wild type showed no differences in pathogenicity between transformants and wild type
strains.
Protoplast fusion of complementary transformants. Protoplast fusion experiments with
different pairs of antibiotic resistant transformants showed large variation with respect to
regeneration (1-15%), fusion (0.01-2.5%) and recombination (0-1.6%) frequencies. On
selective medium, containing both antibiotics, small colonies were observed after 3 days of
incubation, but only when PEG-treated protoplast mixtures of both parents were plated.
Control treatment sometimes showed some background growth due to the fact that
phleomycin did not result in a 100% inhibition of the hygromycin B resistant parent, but
these colonies developed two to four days later en could easily be distinguished from
presumed fusion products. Colonies presumably resulting from protoplast fusion were
tentatively regarded as heterokaryotic. Like colonies observed after fusion of auxotrophs their
growth was restricted and irregular. Also the emergence of rapidly growing colonies from
some of the restricted colonies resembled the situations described for protoplast fusions of
auxotrophs. These fast growing colonies (figure 1D) maintained their double resistant
phenotype after transfer to fresh selective medium and after monosporing on non-selective
medium and were presumed to be recombinants of both parental strains. On the original Petri
dishes with stabilised double selective regeneration medium, fast growing colonies covered
the plate within a few days, making it impossible to select recombinants emerging later on the
same plate. To increase the number of independent double resistant fast growing fusion
products obtained from each 9 cm Petri dish several 1 x 1 cm agar blocks containing
presumed heterokaryotic colonies were transferred to separate 5 cm Petri dishes containing
CDA without sorbitol but with both antibiotics. From the transferred agar blocks again
irregularly and slow (2-4 mm day-1) growing mycelium emerged (figure 1E). Transfer of
small (~1 x 1 mm) mycelial blocks from the edge of the irregularly growing mycelium often
resulted in loss of the double resistant phenotype. Within two weeks on some of the plates
fast growing sectors appeared, which were transferred to fresh double selective plates on
which they remained their fast growing double resistant phenotype
Presumed recombinant fusion products showed no differences in radial growth rate on CDA
with one, both or any antibiotic (on all media radial growth was ~7 mm day -1 at 27°C).
Hybridisation of PFGE-blots with vector DNA showed the presence of the chromosomal
bands containing vector DNA of both fusion partners within a fusion product (figure 2). The
pair of transformants from which most easily fusion products were obtained, G2p22
(phleomycin resistant) and G6h1 (hygromycin B resistant) showed regeneration frequencies
of 5-15%, fusion frequencies (relative number of small fusion colonies on stabilised CDA
with both antibiotics compared to that on stabilised PDA) of 1% and recombination
frequencies (percentage of small fusion colonies producing fast growing mycelium) of 1.5%.
Progeny from these two parental strains was chosen for further analysis. To anticipate
problems occurring when by chance the gene(s) involved are physically linked to one of the
selection markers, a ‘reciprocal’ crossing was made using the transformants G2h12 and Gp8
as parents. In G2h12 and G6h1 the selection marker gene is inserted in chromosomal band

CHAPTER 4
57
Figure 2. Pulsed field gel electrophoresis of fusion products and parental strains. Panels A and C show gels after electrophoresis (Panel A: 10 day run; Panel C: 7 day run). Panels B and D show the corresponding autoradiograms of blotted PFGE-gels hybridised with labelled vector DNA (insert of pAN7.1). Panels A and B show integration of vector DNA in chromosomal band III of parental strain G2p22 and in chromosomal band VII of G6h1and in both chromosomal bands III and VII of fusion products. Panels C and D show the ‘reciprocal’ situation in the parental strains G2h12 and G6p8. Also note the chromosomal length polymorphism of G2h12 compared to the wild type isolate G2: chromosomal band VI was absent, while a smaller chromosomal band (indicated by the white arrowhead) appeared. Chromosomal bands were numbered from large to small on the basis of the 10 day run (panel A). After the 7-day run, which gave optimal resolution for the medium size chromosomes, the two chromosomes of chromosomal band VIII were resolved.
- IV-
- VI -
- VIII -
- I -
- II -
- III-
- V -
- VII -
- IX -
- X -
G2
G2
G2
p2
2
G6
h1
G6
fusions products G
2
G2
p2
2
G6
h1
G6
fusions products
- VI -
- VIII -
- VII -
- IX -
- X -
I
V
5.7
4.6
3.5
2.2
1.6
Mb
G2
G2
h1
2
G6
p8
G6
fusions products G
2
G2
h1
2
G6
p8
G6
fusions products
5.7
4.6
3.5
2.2
1.6
Mb
B A
C D
PARASEXUAL RECOMBINATION
58
VII, while in G2p22 and G6p8 chromosomal band III hybridised with DNA of the selection
marker gene (figure 2).
RAPD- and AFLP-analysis of fusion products. RAPD analysis of fusion products from
hyphal anastomosis and protoplast fusion of the auxotrophic UV-mutants G2leu- and G6ade
-
and from protoplast fusion of the antibiotic resistant transformants G2p22 and G6h1 showed
the occurrence of non-parental combinations of RAPD markers in the progeny (table 1),
indicating the exchange of genetic material. Also AFLP-markers generated with the primer
set EcoRI+TA/MseI+AT showed reassortment of markers in these progenies. Examples of
amplification products from RAPD-analysis (agarose gel) and AFLP-analysis
(autoradiogram) from fusion products from auxotrophs, displaying reassortment of molecular
markers and illustrating the difference in power of both techniques, are presented in figure 3.
AFLP-analysis also revealed some polymorphisms between wild type isolates and
auxotrophic UV-mutants (figure 3B).
DISCUSSION
Fusion of complementary auxotrophic UV-mutants of the two isolates G2 (race 1) and G6
(race 2n) from F. oxysporum f.sp. gladioli, either by hyphal anastomosis or PEG/Ca-mediated
protoplast fusion led to the development of prototrophic mycelium displaying irregular and
retarded growth. Spores harvested from these fusant colonies only yielded parental
auxotrophic phenotypes. Therefore these colonies were considered heterokaryotic. The
observed variation in growth rate of heterokaryotic colonies on minimal medium depended
on the auxotrophic parents, which was also reported for F. oxysporum f.sp. (radicis)
lycopersici (Sanchez et al., 1976 and Sidhu and Webster, 1979).
Since isolates G2 and G6 are vegetative compatible (chapter 3) it is likely that in the hyphal
fusion experiments prototrophic growth indeed resulted from heterokaryon formation after
anastomosis of the two parental auxotrophs. Nevertheless it could not be ruled out that
aberrant prototrophic mycelium resulted from cross-feeding. Prototrophic growth from
isolated hyphal tip cells would have evidenced heterokaryosis, but transfer of hyphal tips
resulted in loss of prototrophy, as did often transfer of small mycelial blocks from the edges
of these colonies. These findings, however, might be explained by the assumption that
anastomosis between hyphal cells does not occur near the hyphal tips as claimed by Buxton
(1954) , but is confined to the area several millimetres from the edge as concluded by
Hoffman (1967) for F. oxysporum f.sp. callistephi and observed for F. moniliforme by
Puhalla and Spieth (1983). Our finding that the same type of aberrant prototrophic colonies
developed after PEG/Ca protoplast fusion, while control treatments without PEG/Ca did not
show any prototrophic colonies, strongly supports the idea that these colonies should be
considered heterokaryotic. The aberrant growth characteristic might well be the result of
limitation of heterokaryosis to the anastomosed cells and the requirement of continued hyphal
anastomosis to maintain the heterokaryotic colony. Growth of homokaryotic, and hence

CHAPTER 4
59
Table 1. Molecular analysis of fusion products from hyphal anastomosis and protoplast fusion of auxotrophic mutants and from protoplast fusion of antibiotic resistant transformants of isolates G2 (race 1) and G6 (race 2n) of Fusarium oxysporum f.sp. iridacearum by random amplified polymorphic DNAs (RAPD). Presence (+) or absence (-) of amplified RAPD fragments showing polymorphism between the two wild type strains is indicated.
RAPD markers
primer code1 OPA-01 OPF-13 OPF-13 OPG-12 OPG-12 OPB-14 OPE-20 OPG-15 amplicon size (bp) 1150 700 950 600 1200 1600 700 550 Wild types G2 + + + + + - - - G6 - - - - - + + +
Auxotrophic UV -mutants Parental strains
G2leu- + + + + + - - -
G6ade- - - - - - + + +
Hyphal fusion products
+ + + + + - - nt + + + + + - - nt + - + + + + + nt + - + + + - + nt + - + + + - - nt
Protoplast fusion products
+ + + + + - nt + + - + + + + nt + + - + + + - nt + + + + + + + nt + + - + + + - nt + + - + + + + nt + + - + + + - nt + + - + + + + nt + + - + + + - nt + + + - + + - nt + - + + - + + nt +
Antibiotic resistant transformants Parental strains
G2p22 + nt nt + + - nt - G6h1 - nt nt - - + nt + Protoplast fusion products
+ nt nt + + + nt - + nt nt + + + nt + + nt nt + + - nt + + nt nt + + - nt + + nt nt + + - nt - + nt nt + + - nt - - nt nt - + + nt +
1 Codes of primers correspond with those given by the manufacturer (Operon technologies Inc., Alameda, CA, USA); nt = not tested.
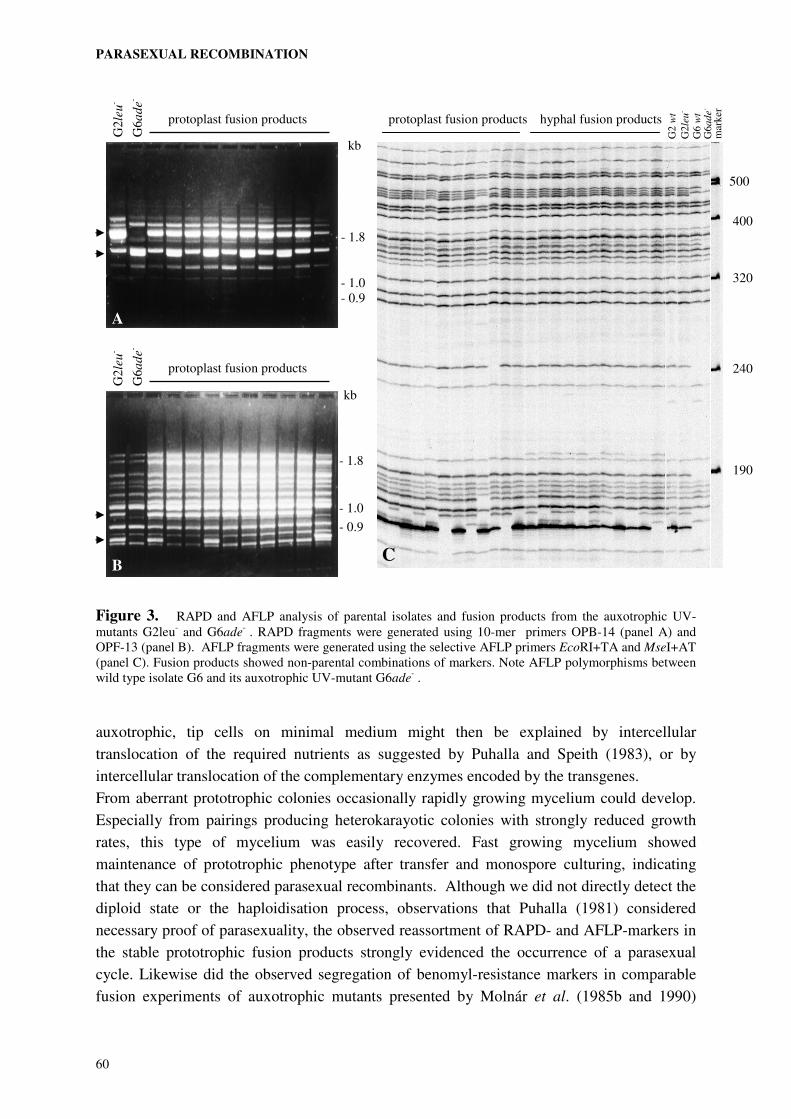
PARASEXUAL RECOMBINATION
60
Figure 3. RAPD and AFLP analysis of parental isolates and fusion products from the auxotrophic UV-mutants G2leu- and G6ade
- . RAPD fragments were generated using 10-mer primers OPB-14 (panel A) and OPF-13 (panel B). AFLP fragments were generated using the selective AFLP primers EcoRI+TA and MseI+AT (panel C). Fusion products showed non-parental combinations of markers. Note AFLP polymorphisms between wild type isolate G6 and its auxotrophic UV-mutant G6ade
- .
auxotrophic, tip cells on minimal medium might then be explained by intercellular
translocation of the required nutrients as suggested by Puhalla and Speith (1983), or by
intercellular translocation of the complementary enzymes encoded by the transgenes.
From aberrant prototrophic colonies occasionally rapidly growing mycelium could develop.
Especially from pairings producing heterokarayotic colonies with strongly reduced growth
rates, this type of mycelium was easily recovered. Fast growing mycelium showed
maintenance of prototrophic phenotype after transfer and monospore culturing, indicating
that they can be considered parasexual recombinants. Although we did not directly detect the
diploid state or the haploidisation process, observations that Puhalla (1981) considered
necessary proof of parasexuality, the observed reassortment of RAPD- and AFLP-markers in
the stable prototrophic fusion products strongly evidenced the occurrence of a parasexual
cycle. Likewise did the observed segregation of benomyl-resistance markers in comparable
fusion experiments of auxotrophic mutants presented by Molnár et al. (1985b and 1990)
G2
leu
-
G6
ad
e-
protoplast fusion products
- 1.8
- 0.9 - 1.0
kb
G2
leu
-
G6
ad
e-
protoplast fusion products
- 1.8
- 1.0
- 0.9
kb
G2
leu
-
G6
ad
e-
G2
wt
G6
wt
mar
ker
protoplast fusion products hyphal fusion products
500
400
320
240
190
A
B C
CHAPTER 4
61
provided strong, although indirect, proof of parasexuality in F.oxysporum. Direct proof of
the parasexual process by cytological observation of karyogamy and haploidisation through
non-meiotic mechanisms might be extremely difficult to provide, since these stages appear to
be transient as already suggested by Hoffmann (1967).
Results from protoplast fusions of complementary antibiotic resistant transformants were
fully in line with those of hyphal and protoplast fusions of auxotrophs. Fusion led initially to
the formation of irregular and slow growing presumably heterokaryotic colonies on double
selective medium. Incidentally fast growing stable double resistant mycelia emerged,
showing reassortment of molecular markers. The observation that fusion products possessed
both parental chromosomes carrying selection marker genes also demonstrated that at least
reshuffling of parental chromosomes occurred. Occurrence of recombination by mitotic
crossing-over, either of homologous or heterologous chromosomes, was not demonstrated or
requires segregation analysis of a larger number of molecular markers in a larger fusion
population.
The observed variations in growth rates of heterokaryotic colonies, protoplast fusion
frequencies and recombination frequencies were not further analysed. Only the best parental
pairs were selected to obtain fusion populations large enough for further work. These
populations might enable the study of linkage between molecular markers (RAPDs, AFLPs)
and the gene(s) involved in the difference in host specialisation between race 1 and race 2n of
F. oxysporum f.sp. iridacearum. Progeny from parasexual crosses of antibiotic resistant
transformants were preferred in this respect, since it was possible to demonstrate maintenance
of the pathogenic phenotype of the transformant strains. Although the observed pathogenicity
of fusion products from auxotrophs suggested that loss of pathogenicity of the auxotrophic
parents was probably due to their auxotrophy per se, a direct test would have been preferable.
Polymorphism of AFLP-markers between wild type strains and UV-mutants indicated that,
beside the desired mutation leading to auxotrophy, probably (many) other genetic changes
have been induced by UV-irradiation. In analogy with this, γ-irradiation of F. oxysporum f.sp.
lycopersici was demonstrated to induce genomic rearrangements of this fungus (Mes et al.,
1999b). Another advantage of the antibiotic resistant transformants was that we were able to
select two pairs of parental transformants, showing ‘reciprocal’ chromosomal integration of
selection marker genes. This will make it possible to find out whether selection marker genes
and the gene(s) of interest are accidentally linked. If so, the chromosome containing the
gene(s) of interest can be identified easily, presuming that the difference in host specialisation
between both races is determined by a single gene (or gene cluster). Otherwise, molecular
marker (AFLP-, RAPD-) analysis of recombinant progeny might make it feasible to identify
the chromosome on which the gene(cluster) is located. When in addition extensive
segregation analysis will make it possible to demonstrate occurrence of mitotic crossing-over,
a map of molecular markers linked to the gene of interest can be constructed and cloning of
the gene might be achieved by chromosome walking (Arneau and Oliver, 1996; An et al.,
1996). However, the frequency of mitotic crossing over will probably be too low. In
Aspergillus nidulans a ‘high’ frequency of mitotic crossing over of 10-3 per diploid nucleus
was reported (Bos, 1996). Considering the presumably transient nature of the diploid state in
PARASEXUAL RECOMBINATION
62
the fusion system described in this chapter, recombination of molecular markers on the same
chromosome by mitotic crossing over will be probably too scarce in the fusion population. In
that case, introduction of selection markers distal on the chromosome of interest are required
to be able to select fusion products in which mitotic crossing over in the particular
chromosome had occurred, comparable to systems for mitotic mapping developed for e.g.
Aspergillus niger (Debets et al., 1993; Bos, 1996).
Alternatively assignment of the gene of interest to a specific chromosome might enable a
complementation based cloning strategy. The molecular size of chromosomes of the two
isolates studied, as estimated by PFGE was 1.7 - 7 Mb (figure 2). This might make it
practically achievable to set up a complementation-based approach. In theory, analysis of
150-700 transformants of both isolates carrying integration of cosmids from a library
constructed from the chromosome of interest from the other isolate should enable
identification of cosmid clones carrying the (a)virulence gene. Such an approach might
however be hampered by the occurrence of changes in pathogenicity resulting from the
integration process rather than from the presence of a functional gene on the integrated
cosmid clone (Kim et al., 1995).
Transgenic antibiotic resistant strains are preferable as parents for the production of
recombinant progeny to analyse the genetics of virulence for reasons given above, but fusion
experiments with auxotrophic UV-mutants showed that exchange of genetic material can take
place after hyphal anastomosis, indicating that horizontal gene transfer or even parasexual
recombination might occur in nature, at least between vegetative compatible strains. When
parasexual recombination under non-selective conditions only occurs between isolates that
belong to the same VCG (Leslie, 1993) and are hence clonally related, the significance of the
parasexual cycle in natural populations will probably be limited (Hoekstra, 1996). However,
several physiologic races can occur within a single VCG (chapter 2), which makes it possible
that new pathotypes might arise from parasexual recombination between races belonging to
the same VCG.
63
CHAPTER 5
A dispensable region from a 2.1-Mb chromosome of a
race 1 isolate of Fusarium oxysporum f.sp. iridacearum
harbours sequences correlated with pathogenicity to large-
flowered gladiolus ‘Peter Pears’
E.J.A. ROEBROECK, J.W.G. HELDENS & J.R. BAO
ABSTRACT Race 1 of Fusarium oxysporum f.sp. iridacearum is pathogenic to the ‘large-flowered’ gladiolus cultivar ‘Peter Pears’, while the genetically closely related race 2n is not. Both races are pathogenic to the ‘small-flowered’ gladiolus ‘Nymph’. Fusion products obtained by fusion of protoplasts of hygromycin B and phleomycin resistant transformants of a race 1 and a race 2n isolate were subjected to phenotypic and genotypic analyses. Pathogenicity tests with ‘Peter Pears’ and ‘Nymph’ revealed that only some fusion products showed one of both parental phenotypes. Many fusion products showed an intermediate phenotype, being highly pathogenic to ‘Nymph’, but displaying reduced pathogenicity to ‘Peter Pears’ at variable levels. This indicated that the difference in pathogenicity to ‘Peter Pears’ is not determined by a single gene, but genetically more complex. AFLP- and RAPD-analysis yielded two groups of markers of which the absence was correlated with complete absence of pathogenicity to ‘Peter Pears’. Markers from both groups could be assigned to a 2.1-Mb chromosome of the race 1 parent. Southern analyses strongly suggested that homologous sequences of (part) of this chromosome are absent in the race 2n parental isolate, indicating that these markers are located on a dispensable region. A 1.6-Mb chromosome present in the race 1 parent, but absent in the race 2n parent, was also found to be correlated with pathogenicity to ‘Peter Pears’. Fusion products possessing both the 1.6-Mb chromosome and the marker groups located on the 2.1-Mb chromosome showed full pathogenicity to ‘Peter Pears’, those missing both were non-pathogenic to ‘Peter Pears’, and fusion products missing one of both showed reduced pathogenicity to variable extents. However, no molecular markers associated with this 1.6-Mb chromosome were found, hampering further analysis. One of the fusion products differed from its race 1 parent only by the absence of one of the two marker groups from the 2.1-Mb chromosome. Southern analyses and PFGE analysis indicated that loss of this marker group probably reflected the occurrence of a deletion of part of the 2.1-Mb chromosome, which resulted from a translocational event during the enforced fusion process. The fact that the concerning fusion product showed reduced pathogenicity to ‘Peter Pears’ suggested the presence of (a) putative pathogenicity gene(s) located on this dispensable region. Some but not all of the corresponding markers were shown to be physically closely linked. The minimum size of the marked region was calculated to be 120 kb.
A DISPENSABLE CHROMOSOMAL REGION FROM RACE 1
64
INTRODUCTION
Race 1 of Fusarium oxysporum (Schlecht. : Fr.) f.sp. iridacearum (f.n.) was found highly
pathogenic to the large-flowered gladiolus ‘Peter Pears’, while race 2n was non-pathogenic to
this cultivar. Both races were pathogenic to small-flowered gladiolus ‘Nymph’ and several
other iridaceous crops (chapter 2). Isolates G2 (race 1) and G6 (race 2n) were chosen to study
the genetics underlying this distinct difference in pathogenicity to ‘Peter Pears’. Since
F.oxysporum is an imperfect fungus, classical genetic analysis of host specificity of
physiologic races, involving sexual crosses of isolates from different races, is not possible.
Therefore, parasexual recombinants, enforced by fusing protoplasts of transgenic strains of
both isolates, carrying two different dominant selection marker genes (resistances against the
antibiotics hygromycin B or phleomycin; Punt and Van den Hondel, 1992) were used to
study these genetics (chapter 4). Phenotypic and molecular analysis of parasexual progenies
might enable the identification of markers linked to race phenotype, presuming that a single
gene or a gene cluster determines this phenotype. Hybridisation of linked markers to
chromosomes separated by pulsed field gel electrophoresis (PFGE; Birren and Lai, 1993) can
subsequently be used to confirm physical linkage of molecular markers (Javerzat et al., 1993;
Xu and Leslie, 1996) and to identify the chromosome on which the gene (cluster)
determining (a)virulence to gladiolus ‘Peter Pears’ is located.
This chapter describes pathogenicity testing and a limited RAPD analysis of two parasexual
progenies obtained by protoplast fusion, as well as an extensive AFLP analysis and PFGE
analysis of a representative subset of fusion products from both populations. Results of these
analyses will show if indeed a single gene(cluster) is responsible for the difference between
G2 and G6 in their pathogenicity to ‘Peter Pears’ and can be assigned to a chromosome.
Moreover, these analyses will give further insight in the nature and frequencies of molecular
events occurring during the parasexual process.
MATERIALS AND METHODS
Fungal material. Wild type strains chosen for this study were G2 (race 1) and G6 (race 2n) of
F.oxysporum f.sp. iridacearum. The transgenic parental strains G2p22 (p = phleomycin
resistant) x G6h1 (h = hygromycin B resistant) and G2h12 x G6p8 were successfully used to
produce double resistant protoplast fusion products (chapter 4). All strains were monospored
and kept as soil cultures at 4°C.
Pathogenicity test. Corms of the two differential gladiolus cultivars ‘Peter Pears’ and
‘Nymph’ were inoculated with the different fusion products as described in chapter 2 with
one modification. Because of the high number of fungal strains, corms were not dipped in a
spore suspension prior to planting, but inoculated by pipetting 1 ml of the spore suspension
on and around corms, which were already put in a planting hole, but not yet covered with
peat soil. Plants were grown in a greenhouse at 25°C under strict quarantine conditions. Each
CHAPTER 5
65
strain was tested on five independent plants of each cultivar. Replicates were randomised in
blocks. Both populations were tested twice in two successive years. Plants inoculated with
transgenic parental strains, wild types and water served as controls. After four weeks shoot
length was measured and independently disease severity was assessed by visually scoring the
amount of discoloured corm tissue on a scale from 0 to 5. Shoot length data were analysed
by analysis of variance. Disease severity data were analysed by regression analysis after logit
transformation. Strains that did not cause any symptoms were excluded from the regression
analysis.
RAPD analysis. Random amplified polymorphic DNAs were generated using 10-mer
oligonucleotide primers obtained from Operon technologies, Inc., Alameda, CA, USA as
described in chapter 4. Primer codes and nucleotide sequences (5' -> 3') of primers were:
OPA-01= CAGGCCCTTC and OPG-12 = CAGCTCACGA.
AFLP analysis. A two step AFLP protocol as described in chapter 3 was used, but with some
modifications in line with the final protocol published by Vos et al. (1995). After digestion
and adapter ligation reaction mixtures (40 µl) were diluted to 500 µl with T0.1E (10 mM
Tris.HCl (pH 8.0); 0.1 mM EDTA), stored at -20°C and used later as template for the
preamplification reaction. The purification step with streptavidine beads, described in chapter
3, was omitted without noticeable changes in results. Preamplification reactions consisted of
20 cycles with annealing only at 56°C (selective AFLP reactions still consisted of 36 cycles
with decreasing annealing temperature during the first 13 cycles) and preamplification
products were diluted 10-fold with T0.1E (instead of 50-fold). The bottom strand of the
EcoRI-adapter and both non-selective primers used were respectively three nucleotides
shorter and one nucleotide longer at their 5'-ends than those given by Vos et al. (1995), as
described in chapter 3.
The two parental wild type strains G2 and G6 were analysed with EcoRI-primers with the
selective nucleotides +AT, +CG and +GA and +TA in combination with all sixteen possible
MseI-primers with two selective nucleotides. Nine primer sets, yielding four to seven
polymorphisms each, were selected for analysis of a subset of 25 fusion products, parental
strains, and wild types. Since AFLP products of this set of samples, generated with a single
primer set, were always analysed on the same gel it was easy to visually score presence or
absence of AFLP fragments.
Cluster analysis. Linkage of AFLP and RAPD markers was analysed by cluster analysis of
segregation profiles. For each marker the absence (0) or presence (1) in each individual of
the fusion populations was recorded and the hence obtained two digit matrix was analysed
with the help of a GENSTAT 5 (Payne et al., 1987) computer programme. Simplematching
similarity coefficients (if xi = xj, then 1, weight=1 and if xi ≠ xj, then 0, weight=1) were
calculated for all possible pairs of markers using the FSIMILARITY directive, and from the
similarity matrix a dendrogram was drawn using the HCLUSTER directive with average
linkage. Results of this cluster analysis were used to group markers with similar segregation

A DISPENSABLE CHROMOSOMAL REGION FROM RACE 1
66
profiles. Likewise, similarity of AFLP profiles of individual fusion products was analysed,
leading to clustering of fusion products with similar AFLP profiles.
Cloning of RAPD- and AFLP-markers. RAPD markers separated by agarose gel
electrophoresis were cut out and purified from the gel using the Geneclean II kit (Bio101
Inc., La Jolla, CA, USA) and finally dissolved in T0.1E. About 1 ng of DNA was reamplified
using the original primer and PCR conditions (chapter 4) except that not 35 but 25 cycli were
applied. A sample of the PCR product was analysed on agarose gel and a volume of the
reaction mixture containing about 10 ng of reamplified marker DNA was ligated into vector
pCR2.1 using the TA Cloning Kit (Invitrogen Corp., San Diego, CA, USA) and used to
transform INVαF’ Escherichia coli cells (One Shot Kit, Invitrogen). Plasmid DNA from
transformed clones was isolated using standard techniques (Sambrook et al., 1989) and
analysed by restriction analysis and by PCR using the original RAPD primer and
amplification conditions.
Developed X-ray films containing AFLP autoradiograms were orientated in their original
position on top of the corresponding gels (dried on absorbent filter paper). AFLP-marker
bands were cut out through the X-ray film. Excised pieces of filter paper were transferred to
micro tubes, soaked in 100 µl of water and incubated for at least 2 h at 4°C. A series of 0.1, 1
and 5 µl was used to reamplify the fragment using the original selective primer set and PCR
conditions except that non-labelled primers were used (30 ng per reaction each). A sample of
the PCR products was analysed on agarose gel and when enough product of approximately
the expected size was produced a volume of the reaction product containing about 10 ng of
marker DNA was ligated into vector pCR2.1 and used to transform E.coli cells as described
for cloning of RAPD-markers. Plasmid DNA from several clones was used as template DNA
in a selective AFLP reaction with the original primer set of which the EcoRI-primer was
radioactively labelled. Reaction products were analysed on sequencing gels alongside
samples of the original AFLP ladder to select the right clones.
Southern analysis. Cloned RAPD and AFLP markers were labelled and used to probe
Southern blots of EcoRI and HindIII digests to estimate their copy number, following
protocols described in chapter 4. Cloned markers were digoxigenin-11-dUTP labelled by
direct PCR-labelling using the original RAPD- or AFLP-primers or [α32P] dATP labelled by
random primed labelling of purified inserts.
Rare cutter digests. DNA preparations from agarose embedded protoplasts identical to those
used for PFGE of intact chromosomes (chapter 4) were used to prepare rare cutter digests.
Agarose plugs were successively washed in 1 ml of TE (10 mM Tris.HCl (pH 8.0); 1 mM
EDTA) and 1 ml of the appropriate digestion buffer for 30 min at 4°C, before they were
digested at 37°C in 1 ml of fresh buffer containing 40 units of the restriction enzymes AscI or
SfiI (New England BioLabs, Inc., Beverly, MA, USA). After 4 hours again 40 units of
restriction enzyme was added and samples were incubated for another 4 hours at 37°C.
Subsequently plugs were washed in 1 ml of 0.5 x TBE (Sambrook et al., 1989) for 30 min at
CHAPTER 5
67
4°C and put on gel (1% Seakem Gold agarose; FMC BioProducts, Rockland, ME, USA).
Rare cutter digests were separated by PFGE on a CHEF DR-II system (Bio-Rad Laboratories
Inc., Hercules, CA, USA) in 0.5 x TBE electrophoresis buffer at 5 V cm-1 at 15°C for 18
hours with switching intervals increasing from 1 to 25 s. As molecular size marker the
Midrange PFG Marker I (New England BioLabs) with a size range of 15-300 kb was used.
PFGE analysis of intact chromosomes. Electrophoretic separation of chromosomes, staining,
photographing and blotting was performed as described in chapter 4. To improve resolution
of the smaller chromosomes gels were run at 10°C, 3 V cm-1 with switching intervals from
300-500 sec for 63 hours (3 day run). Hybridisation experiments with PFGE blots were
carried out as for Southern blots of digested total DNA (chapter 4). To measure relative
differences in intensities of chromosomal bands within a lane, photographs of PFGE-gels
were digitalised and analysed using the computer programme BioImage advanced Quantifier
1-D Match (version 2.1.1; Bio-Image Systems Corp., Ann Arbor, MI, USA).
Cloning of chromosomal fragments. To obtain random clones from a specific chromosomal
band, separated by PFGE, the band of interest was cut out of the gel. Excised pieces of gel
were equilibrated in the appropriate restriction buffer for 8 hours. After 4 hours restriction
buffer was changed. Twenty units of EcoRI and BamHI were added and samples were
incubated overnight at 37°C. Again 20 units of both restriction enzymes were added and
samples were incubated for another 8 hours. DNA was purified from the samples using the
Geneclean II kit (Bio101 Inc., La Jolla, CA, USA) and digested in a small volume of TE
buffer. Digest were ligated into the cloning vector pBluescript II SK+ (Stratagene, La Jolla,
CA, USA) and transformed into E.coli INVαF’ cells, following standard procedures
(Sambrook et al., 1989). Clones containing non-repetitive sequences were selected by
Southern analysis.
RESULTS
Pathogenicity tests. Pathogenicity of two populations of fusion products from isolate G2
(race 1) and isolate G6 (race 2n), both belonging to VCG 0340 of F. oxysporum f.sp.
iridacearum, was tested on the two differential gladiolus cultivars ‘Peter Pears’ (susceptible
to race 1, but resistant to race 2n) and ‘Nymph’ (susceptible to both races). The two
populations were obtained by fusing two different pairs of parental strains, which showed
chromosomal integration of selection markers in a ‘reciprocal’ fashion (chapter 4). In G2p22
x G6p8 vector DNA hybridised to chromosomal band III, while in G2h12 and G6h1 vector
DNA hybridised to chromosomal band VII. Results of pathogenicity tests of fusion products
from G2p22 x G6h1 (population A) and form G2h12 x G6p8 (population B) are presented in
figure 1. Pathogenicity of transformed parental strains was not different from that of wild
types G2 and G6. Phenotypes of fusion products, however could not simply be classified as
either race 1 or race 2n, a result expected when race phenotype is determined by the presence
A DISPENSABLE CHROMOSOMAL REGION FROM RACE 1
68
Figure 1. (On opposite page) Pathogenicity of fusion products and parental strains to the differential
gladiolus cultivars ‘Peter Pears’ and ‘Nymph’. A, C and E: Population A: 40 fusion products of G2p22 and
G6h1. B, D and F: Population B = 24 fusion products of G2h12 and G6p8. Fusion products are presented as
triangles. Solid triangles represent the subset of fusion products subjected to AFLP- and PFGE-analysis. Wild
types are presented as open circles , transformants as solid circles. Water controls are presented as diamonds.
Predictions of disease severity scores as calculated by regression analysis were retransformed to the original
scale (0-5). Corm rot of ‘Peter Pears’ plotted against corm rot of ‘Nymph’ are given in panels A and B. Data
points below the dotted line showed significantly reduced severity of corm symptoms on ‘Peter Pears’ (P<0.05).
Shoot length data are given in panels C and D. Data points above the dotted line had shoot lengths of ‘Peter
Pears’ significantly (p<0.05) larger than the race 1 parents. Relationship between shoot length and corm rot data
on ‘Peter Pears’ is presented in panels E and F. Controls, parental isolates and fusion products of special
interest are labelled.
or absence of a single gene(cluster). Within both populations, fusion products displaying
intermediate phenotypes were found. Their pathogenicity to both cultivars was apparent, but
disease severity on ‘Peter Pears’ was significantly reduced compared to the race 1 parental
strain, while their pathogenicity to ‘Nymph’ was comparable to that of the parental strains. Of
the 40 fusion products from G2p22 x G6h1, 13 showed a phenotype similar to the race 1
parent. Another 11 showed significantly (p<0.05) less reduction in shoot length compared to
race 1, while their corm rot scores were comparable to race 1. Fifteen isolates also caused
corm rot symptoms on ‘Peter Pears’, but these symptoms were significantly (P<0.05) less
severe than those caused by their race 1 parent G2p22. One fusion product (A18) of this
population showed no symptoms on ‘Peter Pears’. Of the 24 fusion products from the
G2h12xG6p8 cross, only one showed a race 1 phenotype. All other fusion products showed
significantly (P<0.05) less severe symptoms on ‘Peter Pears’. One of these (B6) only showed
weak symptoms on few corms of ‘Peter Pears’. Another fusion products (B19) showed no
symptoms at all on ‘Peter Pears’.
RAPD analysis. The two RAPD primers OPA-01 and OPG-12 were selected on the basis of
their ability to discriminate between race 1 isolates and isolates belonging to race 2n or other
races within VCG 0340 of F. oxysporum f.sp. iridacearum (Mes et al., 1994a and De Haan et
al. 2000). Both primers yield a RAPD-fragment present in G2, but absent in G6. The marker
obtained with primer A01 was designated RAPD1 and had an estimated size of 1125 base
pairs, while marker RAPD2 obtained with primer G12 was 600 base pairs in size. All fusion
products of both populations were analysed for the presence of these two RAPD markers.
Marker RAPD2 was found in all fusion products except in A18 (from G2p22 x G6h1) and
B19 (from G2h12 x G6p8), two fusion products showing a true race 2n phenotypes (figure 1).
Marker RAPD1 was also found to be absent in these two fusion products. In all other fusion
products, except B7, this marker was present. Fusion product B7 was highly pathogenic to
‘Nymph’, but showed slight corm rot symptoms on ‘Peter Pears’ (figure 1).

CHAPTER 5
69
0 1 2 3 4 5
Corm rot 'Nymph'
0
1
2
3
4
5
Co
rm r
ot
'Pet
er P
ears
'
0 1 2 3 4 5
Corm rot 'Nymph'
0
1
2
3
4
5
Co
rm r
ot
'Pet
er P
ears
'
0 5 10 15 20 25 30
Shoot length 'Nymph' [cm]
0
10
20
30
40
50
60
70
Sho
ot
leng
th '
Pet
er P
ears
' [cm
]
0 5 10 15 20 25 30
Shoot length 'Nymph' [cm]
10
20
30
40
50
60
70
Sho
ot
leng
th '
Pet
er P
ears
' [cm
]
0 1 2 3 4 5
Corm rot 'Peter Pears'
0
10
20
30
40
50
60
70
Sho
ot
leng
th '
Pet
er P
ears
' [cm
]
0 1 2 3 4 5
Corm rot 'Peter Pears'
10
20
30
40
50
60
70
Sho
ot
leng
th '
Pet
er P
ears
' [cm
]
G2p22 G2wt
G6wt G6h1 A18 water water G6p8 G6wt B19
G2wt G2h12
B7
B6
water
G6wt
G6h1
A18
G2p22
G2wt
water G6wt
G6p8 B19
B6
B7
G2h12
G2wt
water water
G2p22
G2wt
G6h1
G6wt
A18
G2h12
G2wt
B19
G6p8
G6wt
B6
B7
F E
D C
B A
Population A (G2p22 x G6h1) Population B (G2h12 x G6p8)
A DISPENSABLE CHROMOSOMAL REGION FROM RACE 1
70
Southern analysis. Both RAPD marker fragments were cloned. Neither contained HindIII
recognition sites. Hybridisation to Southern blots of HindIII digests of total DNA revealed
the presence of two copies of both fragments in wild type isolate G2 and its transformant, but
neither fragment did hybridise to DNA of G6 or its transformants (figure 2). This proved that
both RAPD markers are the consequence of the complete absence of their template sequences
in G6. The three fusion products which showed absence of one ore both markers, and two
randomly selected fusion products from both populations which were positive for both RAPD
markers, were analysed in the same Southern (figure 2). The two fusion products (A18 and
B19) that missed both RAPD markers showed hybridisation with neither of both fragments
like the G6 parental strains. Fusion product B7, which was positive for marker RAPD2 but
negative for RAPD1 in the PCR, contained one of the two copies of the RAPD2 fragment,
while both copies the RAPD1 fragment were missing.
AFLP analysis. From both fusion populations a representative subset of 25 (presented by
solid triangles in figure 1) strains was subjected to AFLP-analysis with nine different primer
sets. This subset included the three fusion products showing absence of one or both RAPD
markers. To facilitate comparison between marker data and pathogenic phenotypes,
pathogenicity of each strain to ‘Peter Pears’ as presented in figure 1, are also given in figure
3. Disease severity scores on this cultivar are presented as bars at the top of this figure.
In total 528 AFLP fragments were scored, of which 29 were present in G2, but absent in G6
and 10 were present in G6, but absent in G2. Presence or absence of these AFLP markers and
of both RAPD markers within the representative subset of fusion products and parental
strains is presented in figure 3.
Markers with identical segregation patterns were assigned to the same marker group (figure
3, second column). To visualise similarity between marker groups, they were assorted
according to the result of cluster analysis. Likewise, fungal strains with similar marker
profiles as revealed by cluster analysis were assorted.
Six of the G2-AFLP-markers (31, 33, 47, 49, 53 and 63) showed the same segregation profile
as RAPD1 and were designated marker group 1. Marker group 2 consisted of nine G2-AFLP-
markers (1, 3, 7, 13, 19, 62, 51 and 54) and RAPD2. This group differed from marker group 1
only in its presence in fusion product B7. Marker group 3 (G2-AFLP-markers 14, 15, 22, 23,
24, 35, 42, 67 and 69) was found to be present in all fusion products. G2-AFLP-markers 65
and 66 (marker group 4) co-segregated with marker group 3 in all cases except one. The
remaining G2-AFLP-markers (16, 18 and 21) each showed distinct segregation patterns.
Within the set of G6-AFLP-markers seven marker groups (8 to 14; figure 3) were recognised.
G6-AFLP-markers 12 and 17 both showed unique segregation patterns. Segregation patterns
of marker groups 10 and 11 were similar as were the profiles of marker groups 12, 13 and 14.
Beside rearrangement of G2 and G6 markers, also presence of new AFLP fragments and
absence of AFLP fragments present in both parents were observed in 18 of the 25 fusion
products analysed (data not shown). These observations indicate the frequent occurrence of
molecular rearrangements during the fusion process.

CHAPTER 5
71
Figure 2. Southern analysis of parental isolates and a selection of fusion products. HindIII digests of total DNA was probed with cloned marker fragments RAPD1 (panel A) and RAPD2 (panel B). M = molecular size marker (lambda HindIII+EcoRI).
No molecular markers showed linkage to one of the selection markers (presented at the
bottom of figure 3). Such markers would be present in all fusion products from the same
crossing and, considering the reciprocal integration of selection markers in both parental sets,
absent in all fusion products from the other crossing.
Since many fusion products showed significantly reduced pathogenicity to ‘Peter Pears’
(figure 1 and top of figure 3), the correlation between molecular markers and race phenotype
was not obvious. The absence of marker groups 1 and 2 in the two fusion products showing a
true race 2n phenotype, however suggested a correlation between the presence of these
groups and pathogenicity to ‘Peter Pears’.
PFGE analysis. All wild types, parental strains and fusion products subjected to AFLP
analysis were also characterised by pulsed field gel electrophoresis (PFGE). Gels containing
representative strains, displaying all observed chromosomal polymorphisms, are presented in
figure 4.
M A10 A11 B6 A18 B7 B13 B14 B19 G2
wt
G2
p2
2
G2
h1
2
G6
wt
G6
p8
G6
h1
fusion products
4.3 3.5
1.4
1.6
2.0 1.9
5.0
21
5.1
kb
4.3
1.4
1.6
2.0
3.5
1.9
5.0
21
5.1
A
B
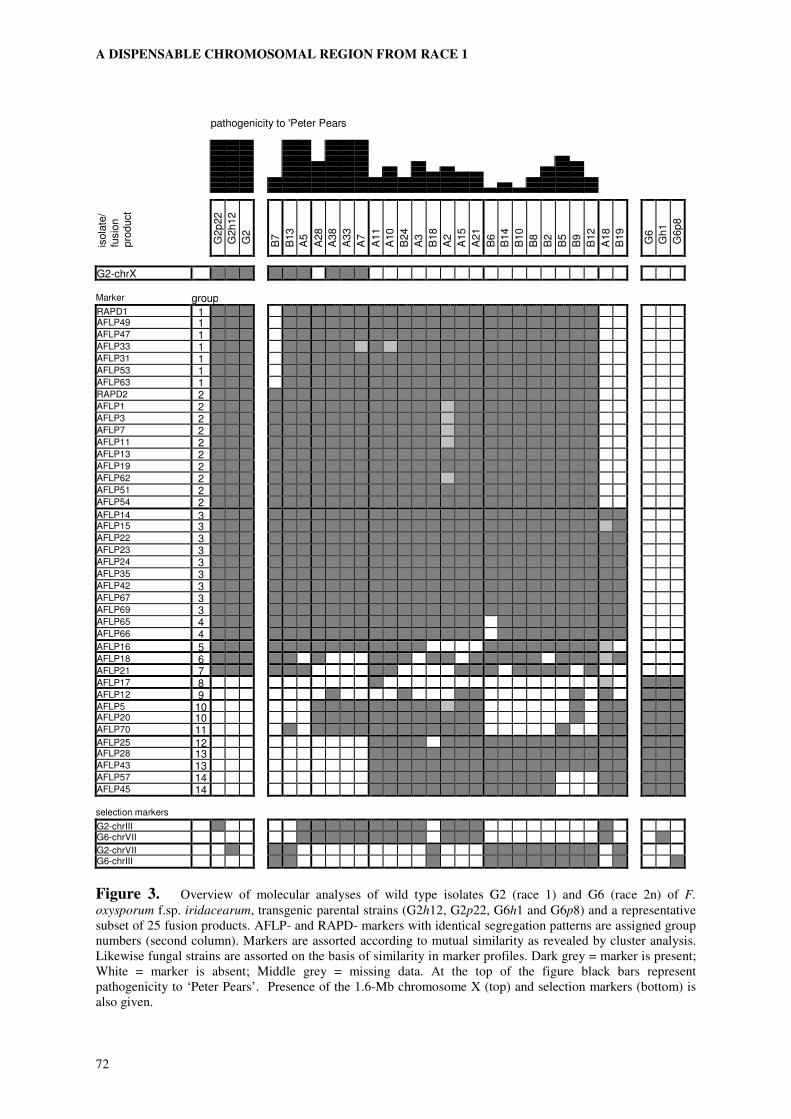
A DISPENSABLE CHROMOSOMAL REGION FROM RACE 1
72
pathogenicity to 'Peter Pears
isola
te/
fusio
n
pro
duct
G2p22
G2h12
G2
B7
B13
A5
A28
A38
A33
A7
A11
A10
B24
A3
B18
A2
A15
A21
B6
B14
B10
B8
B2
B5
B9
B12
A18
B19
G6
Gh1
G6p8
G2-chrX
Marker group
RAPD1 1 AFLP49 1 AFLP47 1 AFLP33 1 AFLP31 1 AFLP53 1 AFLP63 1 RAPD2 2 AFLP1 2 AFLP3 2 AFLP7 2 AFLP11 2 AFLP13 2 AFLP19 2 AFLP62 2 AFLP51 2 AFLP54 2 AFLP14 3 AFLP15 3 AFLP22 3 AFLP23 3 AFLP24 3 AFLP35 3 AFLP42 3 AFLP67 3 AFLP69 3 AFLP65 4 AFLP66 4 AFLP16 5 AFLP18 6 AFLP21 7 AFLP17 8 AFLP12 9 AFLP5 10 AFLP20 10 AFLP70 11 AFLP25 12 AFLP28 13 AFLP43 13 AFLP57 14 AFLP45 14
selection markers
G2-chrIII G6-chrVII G2-chrVII G6-chrIII
Figure 3. Overview of molecular analyses of wild type isolates G2 (race 1) and G6 (race 2n) of F.
oxysporum f.sp. iridacearum, transgenic parental strains (G2h12, G2p22, G6h1 and G6p8) and a representative subset of 25 fusion products. AFLP- and RAPD- markers with identical segregation patterns are assigned group numbers (second column). Markers are assorted according to mutual similarity as revealed by cluster analysis. Likewise fungal strains are assorted on the basis of similarity in marker profiles. Dark grey = marker is present; White = marker is absent; Middle grey = missing data. At the top of the figure black bars represent pathogenicity to ‘Peter Pears’. Presence of the 1.6-Mb chromosome X (top) and selection markers (bottom) is also given.

CHAPTER 5
73
Electrophoretic karyotypes of wild type isolates G2 and G6 showed some striking
differences, especially for the smaller chromosomes. Isolate G2 showed the presence of a 1.6-
Mb chromosomal band (nr. X), which is absent in G6. Presence of this chromosome within
the subset of fusion products was scored and is included in figure 3 (at top of the figure). All
fusion products showing the presence of chromosome X (except fusion product B7) showed
full pathogenicity to ‘Peter Pears’. No chromosome-specific probe was found after testing
several random cloned restriction fragments obtained from isolated DNA of chromosomal
band X. All cloned fragments were of a multicopy nature and present in both G2 and G6
(data not shown).
Chromosomal band IX (2.1 Mb) of G2 showed an intensity which was higher than that of
chromosomal band X. Intensities of both bands, measured by computerised image analysis,
yielded a 2: 1 ratio. Presuming that chromosomal band X consist of a single chromosome it
can be concluded that chromosomal band IX of G2 contained two unresolved chromosomes.
Also after applying electrophoresis conditions with improved resolution at the concerning
size range, these two chromosomes could not be resolved (figure 4C). Chromosomal band IX
of G6 also appeared to consist of two chromosomes (figure 4A and 4B), but in contrast with
chromosomal band IX of G2 these chromosomes could be resolved completely (figure 4C).
The larger of these two chromosomes (IX-a) was of the same size as chromosomal band IX
of G2 (2.1 Mb), while the smaller one (IX-b) had an estimated size of 2.0 Mb.
Transformants showed electrophoretic karyotypes similar to those of wild types except for
G2h12, which missed chromosomal band VI (3.3 Mb), but had an extra band of 2.9 Mb
(figure 4B). The putative deletion of 0.4 Mb, causing this polymorphism, did apparently not
effect viability or pathogenicity of this transformant (figure 1). Of all fusion products from
G2h12 xG6p8 analysed by PFGE, four inherited the 3.3 Mb band, presumably from G6p8,
eight inherited the 2.9 Mb band from G2h12 and one (fusion product 174-6) seemed to have
inherited neither of both (figure 4B).
Some fusion products showed chromosomes with non-parental sizes. Fusion products A11
(figure 4A) as well as A3, A28 and B18 (not shown) showed the presence of a chromosomal
band of approximately 2.5 Mb, which was absent in the parental strains. Fusion products
A10, A15 (figure 4A), B24 (figure 4B), A2 and A10 (not shown) appeared to have extra
bands at the position of band IX (2.1 Mb). Running conditions with higher resolution in this
size range, revealed two separate bands of 2.1 Mb and 2.0 Mb (A15 shown in figure 4C), as
in the parental strain G6h1, but with a ratio of band intensities of 3:1 instead of 1:1. This
might be the result by the occurrence of aneuploidy due to inheritance of the two
(unresolved) 2.1-Mb chromosomes from G2p22 as well as the 2.1-Mb and 2.0 MB
chromosomes of G6h1.
Fusion product B7 displayed a unique novel electrophoretic karyotype of the smaller
chromosomes. Three bands of 1.6 Mb, 1.7 Mb and 2.1 Mb, with an intensity ratio of 1:1:1,
were resolved (figure 4C).
Chromosomal localisation of markers. Marker groups 1 and 2 were the only marker groups
that showed a possible correlation with pathogenicity. Both groups are distinguished only by
A DISPENSABLE CHROMOSOMAL REGION FROM RACE 1
74
their differential presence in fusion product B7. Whether this implies that both groups should
be considered different linkage groups or not, was tested by hybridisation of cloned markers
from both groups to PFGE blots. The two RAPD markers were considered most suitable for
this purpose, because of their relative large molecular size compared to AFLP markers.
Both RAPD fragments hybridised to chromosomal band IX of G2 on PFGE blots and showed
no hybridisation to G6.This means that of each fragment both copies are located on one of the
two chromosomes composing this band, or that both chromosomes contain one copy each.
Hybridisation experiments with PFGE blots demonstrated that in all fusion products of the
subset, except A18, B19 and B7, both RAPD fragments also hybridised to the 2.1-Mb
chromosomal band. In all these cases this chromosomal band existed of at least two non-
resolved chromosomes. RAPD1 did not hybridise to any chromosome of the three
exceptional fusion products. This was expected since in a Southern analysis of HindIII
digested total DNA also no hybridisation signal was observed (figure 2). RAPD2 did also not
hybridise to any chromosome of A18 or B19 as already seen in the Southern analysis shown
in figure 2. In fusion product B7, however, one copy of the RAPD2 sequence is still present
(figure 2). On PFGE blots the RAPD2 clone was observed to hybridise to one of the larger
chromosomes (>2.5 Mb), which were not resolved after a 3-day-run, indicating the
occurrence of a translocational event during the fusion process.
Chromosomal band IX of G2 was excised from a PFGE gel. From this DNA a non-repetitive
1.1 kb EcoRI-BamHI fragment designated G2-IX-1 was cloned, which hybridised both to G2
and G6 DNA. When used as a probe on PFGE blots, this fragment did hybridise to
chromosomal band IX of G2 and to the 2.1-Mb chromosomal band of G6 (IX-a).
Hybridisation results obtained with both RAPD fragments and clone G2-IX-1 could be
explained by the assumption that one of the two chromosomes (IX-a) composing
chromosomal band IX of G2 is homologous to chromosome IX-a of G6 and both hybridise to
G2-IX-1, while the other 2.1-Mb chromosome of G2 (IX-b) contains both copies of both
cloned RAPD fragments. The conclusion that both RAPD markers are located on the same
chromosome implies that markers group 1 and 2 (figure 3) should be considered one linkage
group, corresponding to chromosome IX-b of G2.
Further analysis of marker group 1. Absence of marker group 1 was the only difference
observed between marker profiles of fusion product B7 and G2 (figure 3). The strongly
reduced pathogenicity to ‘Peter Pears’ of B7 might be correlated with the absence of this
marker group. Of the RAPD1 sequence two copies were found present in the G2 genome,
while both copies were absent in G6 and B7 (figure 2). AFLP-markers belonging to marker
group 1 were also cloned. Cloned fragments were probed to Southern blots of EcoRI digests
of total DNA from G2, G6 and of fusion product B7. AFLP33, AFLP47 and AFLP63 each
showed a single hybridising band in G2 but did not hybridise to G6 or B7. From these results
we concluded that these AFLPs are a consequence of the complete absence of their sequences
in G6 and B7, as was the case for RAPD1. AFLP53 showed a more complex hybridisation
pattern. In G2 three bands were found, of which one was missing in B7 and two were missing
in G6, indicating that the observed PCR-product in the AFLP analysis was
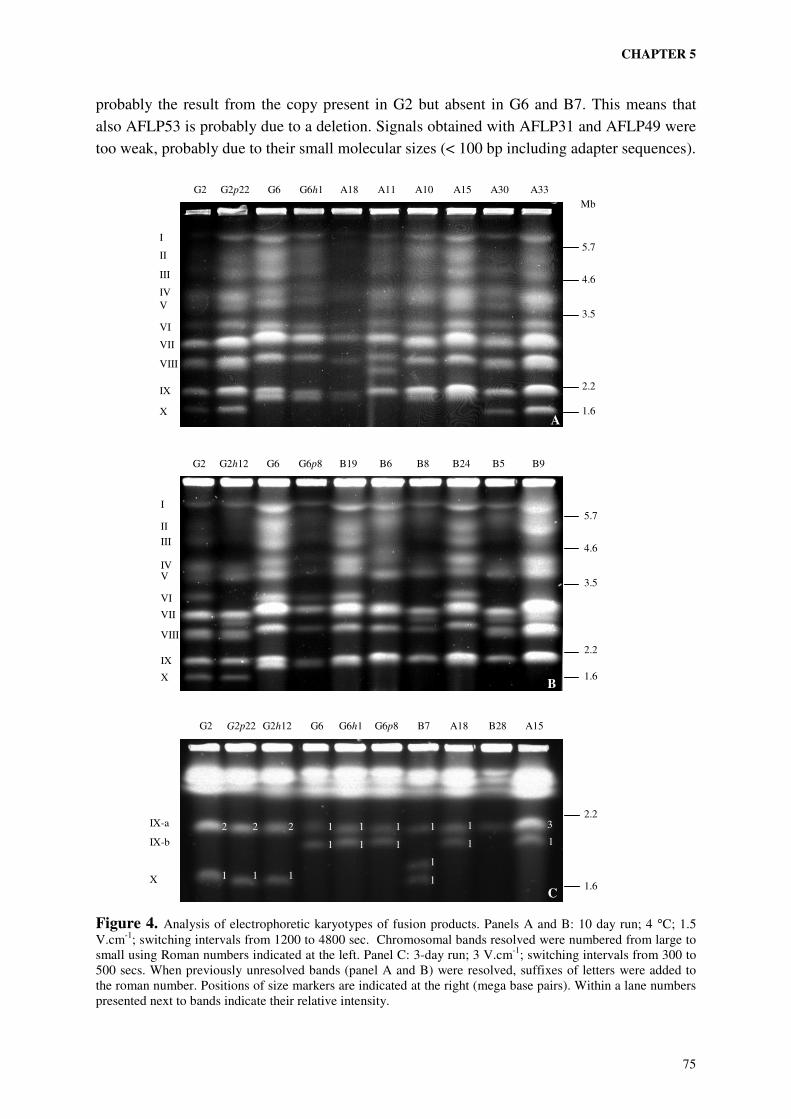
CHAPTER 5
75
probably the result from the copy present in G2 but absent in G6 and B7. This means that
also AFLP53 is probably due to a deletion. Signals obtained with AFLP31 and AFLP49 were
too weak, probably due to their small molecular sizes (< 100 bp including adapter sequences).
Figure 4. Analysis of electrophoretic karyotypes of fusion products. Panels A and B: 10 day run; 4 °C; 1.5 V.cm-1; switching intervals from 1200 to 4800 sec. Chromosomal bands resolved were numbered from large to small using Roman numbers indicated at the left. Panel C: 3-day run; 3 V.cm-1; switching intervals from 300 to 500 secs. When previously unresolved bands (panel A and B) were resolved, suffixes of letters were added to the roman number. Positions of size markers are indicated at the right (mega base pairs). Within a lane numbers presented next to bands indicate their relative intensity.
G2 G2p22 G2h12 G6h1 G6p8 G6 B28 B7 A18 A15
IX-a
IX-b
X
2.2
1.6
3
1
1
1
2
1
1
1
1
1
2
1
2
1
1
1
1
1
1
C
2.2
1.6
4.6
3.5
5.7
G2 G2h12 B6 G6 B5 B8 B24 B9 G6p8 B19
I
II
III
IV V
VI
VII
VIII
IX
X B
2.2
1.6
4.6
3.5
5.7
Mb
G2 G2p22 A11 G6 A30 A10 A15 A33 G6h1 A18
I
II
III
IV
V
VI
VII
VIII
IX
X A
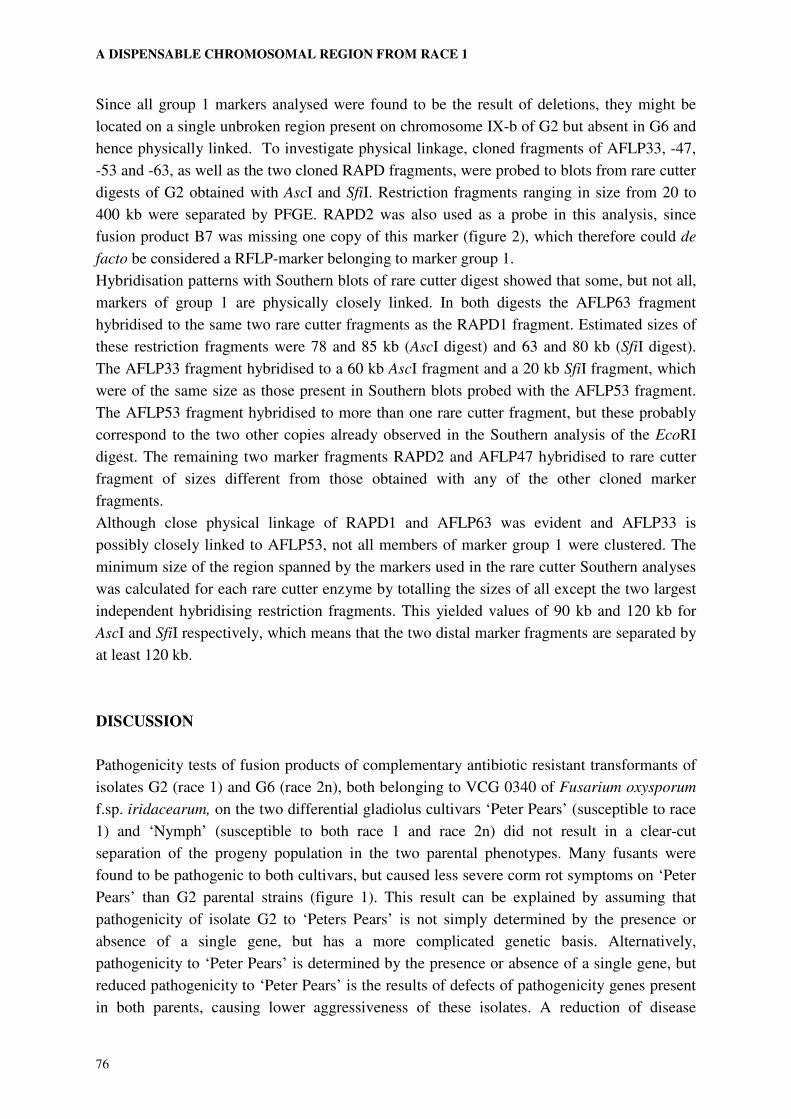
A DISPENSABLE CHROMOSOMAL REGION FROM RACE 1
76
Since all group 1 markers analysed were found to be the result of deletions, they might be
located on a single unbroken region present on chromosome IX-b of G2 but absent in G6 and
hence physically linked. To investigate physical linkage, cloned fragments of AFLP33, -47,
-53 and -63, as well as the two cloned RAPD fragments, were probed to blots from rare cutter
digests of G2 obtained with AscI and SfiI. Restriction fragments ranging in size from 20 to
400 kb were separated by PFGE. RAPD2 was also used as a probe in this analysis, since
fusion product B7 was missing one copy of this marker (figure 2), which therefore could de
facto be considered a RFLP-marker belonging to marker group 1.
Hybridisation patterns with Southern blots of rare cutter digest showed that some, but not all,
markers of group 1 are physically closely linked. In both digests the AFLP63 fragment
hybridised to the same two rare cutter fragments as the RAPD1 fragment. Estimated sizes of
these restriction fragments were 78 and 85 kb (AscI digest) and 63 and 80 kb (SfiI digest).
The AFLP33 fragment hybridised to a 60 kb AscI fragment and a 20 kb SfiI fragment, which
were of the same size as those present in Southern blots probed with the AFLP53 fragment.
The AFLP53 fragment hybridised to more than one rare cutter fragment, but these probably
correspond to the two other copies already observed in the Southern analysis of the EcoRI
digest. The remaining two marker fragments RAPD2 and AFLP47 hybridised to rare cutter
fragment of sizes different from those obtained with any of the other cloned marker
fragments.
Although close physical linkage of RAPD1 and AFLP63 was evident and AFLP33 is
possibly closely linked to AFLP53, not all members of marker group 1 were clustered. The
minimum size of the region spanned by the markers used in the rare cutter Southern analyses
was calculated for each rare cutter enzyme by totalling the sizes of all except the two largest
independent hybridising restriction fragments. This yielded values of 90 kb and 120 kb for
AscI and SfiI respectively, which means that the two distal marker fragments are separated by
at least 120 kb.
DISCUSSION
Pathogenicity tests of fusion products of complementary antibiotic resistant transformants of
isolates G2 (race 1) and G6 (race 2n), both belonging to VCG 0340 of Fusarium oxysporum
f.sp. iridacearum, on the two differential gladiolus cultivars ‘Peter Pears’ (susceptible to race
1) and ‘Nymph’ (susceptible to both race 1 and race 2n) did not result in a clear-cut
separation of the progeny population in the two parental phenotypes. Many fusants were
found to be pathogenic to both cultivars, but caused less severe corm rot symptoms on ‘Peter
Pears’ than G2 parental strains (figure 1). This result can be explained by assuming that
pathogenicity of isolate G2 to ‘Peters Pears’ is not simply determined by the presence or
absence of a single gene, but has a more complicated genetic basis. Alternatively,
pathogenicity to ‘Peter Pears’ is determined by the presence or absence of a single gene, but
reduced pathogenicity to ‘Peter Pears’ is the results of defects of pathogenicity genes present
in both parents, causing lower aggressiveness of these isolates. A reduction of disease
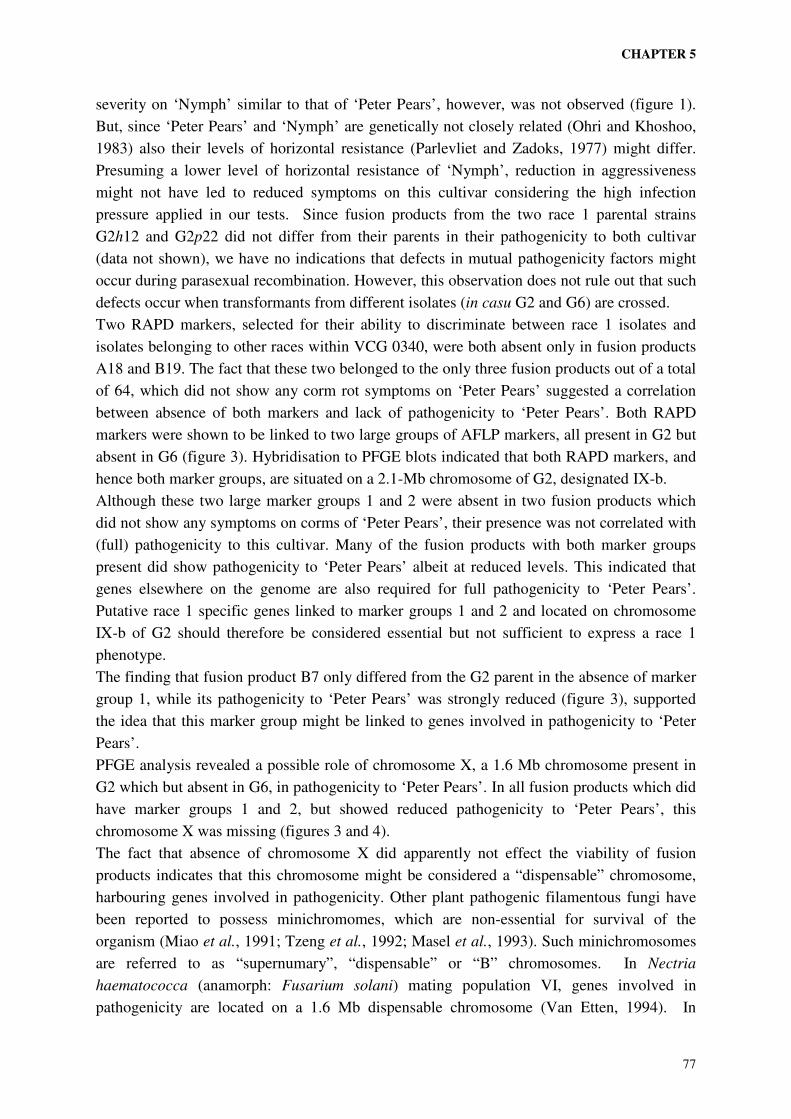
CHAPTER 5
77
severity on ‘Nymph’ similar to that of ‘Peter Pears’, however, was not observed (figure 1).
But, since ‘Peter Pears’ and ‘Nymph’ are genetically not closely related (Ohri and Khoshoo,
1983) also their levels of horizontal resistance (Parlevliet and Zadoks, 1977) might differ.
Presuming a lower level of horizontal resistance of ‘Nymph’, reduction in aggressiveness
might not have led to reduced symptoms on this cultivar considering the high infection
pressure applied in our tests. Since fusion products from the two race 1 parental strains
G2h12 and G2p22 did not differ from their parents in their pathogenicity to both cultivar
(data not shown), we have no indications that defects in mutual pathogenicity factors might
occur during parasexual recombination. However, this observation does not rule out that such
defects occur when transformants from different isolates (in casu G2 and G6) are crossed.
Two RAPD markers, selected for their ability to discriminate between race 1 isolates and
isolates belonging to other races within VCG 0340, were both absent only in fusion products
A18 and B19. The fact that these two belonged to the only three fusion products out of a total
of 64, which did not show any corm rot symptoms on ‘Peter Pears’ suggested a correlation
between absence of both markers and lack of pathogenicity to ‘Peter Pears’. Both RAPD
markers were shown to be linked to two large groups of AFLP markers, all present in G2 but
absent in G6 (figure 3). Hybridisation to PFGE blots indicated that both RAPD markers, and
hence both marker groups, are situated on a 2.1-Mb chromosome of G2, designated IX-b.
Although these two large marker groups 1 and 2 were absent in two fusion products which
did not show any symptoms on corms of ‘Peter Pears’, their presence was not correlated with
(full) pathogenicity to this cultivar. Many of the fusion products with both marker groups
present did show pathogenicity to ‘Peter Pears’ albeit at reduced levels. This indicated that
genes elsewhere on the genome are also required for full pathogenicity to ‘Peter Pears’.
Putative race 1 specific genes linked to marker groups 1 and 2 and located on chromosome
IX-b of G2 should therefore be considered essential but not sufficient to express a race 1
phenotype.
The finding that fusion product B7 only differed from the G2 parent in the absence of marker
group 1, while its pathogenicity to ‘Peter Pears’ was strongly reduced (figure 3), supported
the idea that this marker group might be linked to genes involved in pathogenicity to ‘Peter
Pears’.
PFGE analysis revealed a possible role of chromosome X, a 1.6 Mb chromosome present in
G2 which but absent in G6, in pathogenicity to ‘Peter Pears’. In all fusion products which did
have marker groups 1 and 2, but showed reduced pathogenicity to ‘Peter Pears’, this
chromosome X was missing (figures 3 and 4).
The fact that absence of chromosome X did apparently not effect the viability of fusion
products indicates that this chromosome might be considered a “dispensable” chromosome,
harbouring genes involved in pathogenicity. Other plant pathogenic filamentous fungi have
been reported to possess minichromomes, which are non-essential for survival of the
organism (Miao et al., 1991; Tzeng et al., 1992; Masel et al., 1993). Such minichromosomes
are referred to as “supernumary”, “dispensable” or “B” chromosomes. In Nectria
haematococca (anamorph: Fusarium solani) mating population VI, genes involved in
pathogenicity are located on a 1.6 Mb dispensable chromosome (Van Etten, 1994). In
A DISPENSABLE CHROMOSOMAL REGION FROM RACE 1
78
Cochliobolus carbonum (Ahn and Walton, 1996) genes involved in the synthesis of he host
specific HC-toxin are located on a large (>0.5 Mb) dispensable portion of a chromosome.
Although PFGE analysis strongly suggested that chromosome X is of a dispensable nature,
molecular evidence for the presence of dispensable sequences on this chromosome is lacking,
since G2-AFLP-markers co-segregating with chromosome X were not found (figure 3).
When chromosome X contains mostly repetitive DNA and few (dispensable) genes, a feature
thought to be common to B chromosomes (Kistler and Miao, 1992), this could explain the
lack of AFLP markers on this chromosome. The finding that no chromosome specific clones
could be obtained from chromosome X is in line with this idea. The variation in
electrophoretic karyotypes observed within collections of field isolates (Boehm et al., 1994)
and after protoplast fusion (figure 4), however, illustrates the flexibility in chromosome
architecture of F.oxysporum. The absence of the 1.6-Mb chromosomal band in G6 or one of
the fusion products does therefore not necessarily imply the absence of homologues of
sequences present on this chromosome. They might be (partly) present in one of the larger
chromosomes. The complete lack of markers on chromosome X hampers further analysis of
this chromosome.
Marker groups 1 and 2 (figure 3) provided a better starting point for further work aiming at
cloning genes involved in pathogenicity to ‘Peter Pears’. Hybridisation experiments revealed
that both marker groups are linked and located on one of the two unresolved 2.1-Mb
chromosomes composing chromosomal band IX of G2 (designated chromosome IX-b).
Hybridisation experiments indicated the absence of homologous sequences in G6. Presuming
that the ratio (15/528) between the number of AFLP markers in group 1 and 2 and the total
number of scored AFLP fragments is indicative for the proportion of the genome covered by
these markers, they would represent a region of 1.4 Mb, but it can not be ruled out that they
span the entire chromosome or that they are clustered on a much smaller region.
Segregation of marker group 1 and marker group 2 was only observed in fusion product B7
(figure 3). Lack of hybridisation of most of the cloned marker fragments from group 1 to
DNA of fusion product B7 can be explained by the occurrence of a deletion in chromosome
IX-b. This might be the result of chromosomal breakage and healing (Zolan, 1995). In that
case, the novel 1.7-Mb chromosome present in fusion product B7 (figure 4C) would be the
remnant of chromosome IX-b. The cloned RAPD2 fragment, of which one of the two copies
is still present in B7 (figure 3), however, did not hybridise to this 1.7-Mb chromosome of B7.
This means that the loss of marker group 1 is the result of a more complex translocation event
(Zolan, 1995) and the 0.4 Mb difference between the IX-b chromosome of G2 and the novel
1.7-Mb chromosome of B7 is not indicative for the size of the region harbouring the group 1
markers.
Also in other fusion products novel electrophoretic karyotypes were observed (figure 4),
indicating that chromosomal rearrangements occur frequently during the enforced fusion
process. The finding of many de novo AFLP markers in most of the fusion products further
illustrated the frequent occurrence of genomic rearrangements (e.g. translocations or
transpositions).

CHAPTER 5
79
The fact that (besides the presence of the phleomycin resistance selection marker) absence of
marker group 1 was the only detected difference in marker profile between fusion product B7
and its G2h12 parent, while pathogenicity to ‘Peter Pears’ of this fusion product was strongly
reduced (figure 1), supported the hypothesis that markers of group 1 are probably linked to
(a) gene(s) involved in pathogenicity to ‘Peter Pears’. Southern analysis of rare cutter digests
of G2, using cloned marker fragments of group 1 as probes showed that, although some of the
markers are physically closely linked, the total region spanned by this marker group is at least
120 kb in size. Nevertheless cloning of the gene(s) of interest might be feasible. When the
cloned marker fragments from group 1 are used to screen a cosmid bank of isolate G2,
selected cosmid clones containing a substantial part of the marked region can be obtained.
These cosmids clones can subsequently be analysed for the presence of transcribed sequences
by hybridisation with cDNA from infected tissue. Sequence analysis, followed by data bank
screening, might enable the identification of genes putatively involved in pathogenicity to
‘Peter Pears’.
The data presented in this chapter led to the working hypothesis that chromosome IX-b of G2
contains dispensable sequences harbouring (a) gene(s) with an essential role in the
pathogenicity of race 1 of F. oxysporum f.sp. iridacearum to ‘Peter Pears’. It should however
be emphasised that the presented data only provide circumstantial evidence. The working
hypothesis assumes that virulence and not avirulence is the dominant factor determining the
difference in pathogenicity between G2 (race 1) and G6 (race 2n). Although we found no
evidence for the existence of determinants of avirulence, it can not be ruled out that they
exist. Putative virulence gene(s) located on chromosome IX-b are not the only determinants
of pathogenicity to ‘Peter Pears’. Genes present on chromosome X are probably also
involved. Furthermore, the large group of fusion products with intermediate levels of
pathogenicity to ‘Peter Pears’ showed significant variation in pathogenicity levels which can
not be explained by absence or presence of marker group 1 and 2 and chromosome X.
Due to the frequent occurrence of complicating genomic rearrangements, analysis of enforced
parasexual recombinants has shown to be not an effective experimental tool to unravel the
unexpectedly complex genetics underlying the difference in pathogenicity to ‘Peter Pears’
between isolate G2 (race 1) and G6 (race 2). Nevertheless, a dispensable region on
chromosome IX-b of isolate G2 was identified which contained (a) gene(s) putatively
involved in pathogenicity of this race 1 isolate to ‘Peter Pears’. Cloning and functional
analysis of these genes will be necessary to prove that they are indeed required for full
pathogenicity of isolate G2 to ‘Peter Pears’.

81
CHAPTER 6
Identification of a cosmid contig spanning one of the
borders of a putative race specific dispensable region from
a race 1 isolate of Fusarium oxysporum f.sp. iridacearum E.J.A. ROEBROECK & J.W.G. HELDENS ABSTRACT A cosmid library of race 1 isolate G2 (pathogenic to gladiolus ‘Peter Pears’) of F. oxysporum f.sp. iridacearum was screened with cloned RAPD- and AFLP-marker fragments. These fragments were present in race 1 isolate G2, but absent in race 2n isolate G6 (not pathogenic to ‘Peter Pears’) and fusion product B7 (strongly reduced in pathogenicity to ‘Peter Pears’) and were located on a putative dispensable region of a 2.1-Mb chromosome of G2. Several cosmids clones were selected and restriction fragments carrying transcribed sequences were identified by hybridisation with labelled cDNA-ends isolated both from in vitro grown mycelium as well as from infected gladiolus corm tissue. Two restriction fragments from a single cosmid clone were arbitrarily chosen for cloning and sequence analysis. In contrast with the two marker fragments present on the same cosmid, both cloned fragments appeared to be also present in G6 (race 2n) and fusion product B7 and were hence not carrying G2 specific genes. The concerning cosmid is possibly located at one of the borders of the putative dispensable region. Further analysis of this cosmid and three overlapping cosmids will elucidate whether this is indeed the case and might reveal coding sequences present at the dispensable part of this contig. Both cloned fragments contained repetitive sequences, which were probably transposable elements as judged on sequence homologies, and were found to be distributed throughout the genome. Relative intensities of hybridisation signals on PFGE-blots suggested that the 2.0 Mb chromosome IX-b of G6 is possibly the homologue of the 2.1-Mb chromosome IX-b of G2 on which the investigated G2 specific markers are located. The same blots supported the idea that the non-parental 1.7-Mb chromosome of fusion product B7 is likely to be the product of a recombination event between chromosome IX-b of the G2 parent and one of the larger chromosomes.
COSMID CONTIG
82
INTRODUCTION
Race 1 and race 2n of Fusarium oxysporum (Schlecht.: Fr) f.sp. iridacearum (n.f.) can be
discriminated by their difference in pathogenicity to the large flowered gladiolus cultivar
‘Peter Pears’. Race 1 is pathogenic to ‘Peter Pears’ and race 2n is not, while both races are
pathogenic to the small-flowered gladiolus ‘Nymph’ (chapter 2). Isolates of both races belong
to a group of relatively closely related isolates within VCG 0340 (chapter 3). To further
analyse the genetics underlying the difference between race 1 and race 2n in their
pathogenicity to ‘Peter Pears’, parasexual crosses between two isolates of either race were
carried out, using protoplast fusions of stable transformants carrying different selectable
marker genes (chapter 4). Analysis of parasexual recombinants from transformants of isolates
G2 (race 1) and G6 (race 2n) revealed the existence of a linkage group consisting of two
RAPD- and fifteen AFLP-markers present in G2, but absent in G6 and fusion products with a
race 2n phenotype. Hybridisation of two of the marker fragments showed they were located
on a 2.1-Mb chromosome of G2. The marker sequences did not hybridise to G6 DNA. Seven
of the seventeen markers were also absent in fusion product B7, which was strongly reduced
in its pathogenicity to ‘Peter Pears’. The absence of these markers was the only observed
difference in marker profile between fusion product B7 and the parental G2 transformant,
after more than 500 markers had been screened. On the basis of Southern analysis using rare
cutter digests, it was hypothesised that these markers span a region of at least 120 kb of the
2.1-Mb chromosome. During the parasexual recombination process leading to fusion product
B7 this region was apparently lost. Southern analysis after pulsed field gel electrophoresis
(PFGE) of intact chromosomes, indicated that this deletion probably resulted from a
translocation event (chapter 5), a phenomenon also observed in other fungi (Zolan, 1995).
Considering the strongly reduced pathogenicity to ‘Peter Pears’ of fusion product B7 and the
fact that the concerning markers are part of the linkage group of 17 markers whose absence
was correlated with the race 2n phenotype, it was hypothesised that the region lost in B7
probably contains (a) gene(s) necessary for full pathogenicity to ‘Peter Pears’ (chapter 5).
This chapter describes how some of the seven markers, which were absent in B7, were
successfully used to select cosmid clones from a G2 library. Representatively amplified
cDNA ends (Brady et al., 1990; Brady and Iscove, 1993), obtained from mRNA isolated
from in vitro grown mycelium of isolate G2 and from diseased corm tissue of ‘Peter Pears’
infected with isolate G2, were subsequently used to identify fragments within selected
cosmid clones containing transcribed sequences. Two of such fragments were subcloned and
sequenced. Their specificity for race 1 was evaluated by Southern analysis.
MATERIALS AND METHODS
Cosmid library construction and screening. A cosmid library of total DNA of isolate G2 was
constructed by Clonetech Laboratories Inc. (Palo Alto, CA, USA). Fractionated genomic
DNA (30-48 kb) was ligated into the BamHI cloning site of cosmid vector pWE15,
CHAPTER 6
83
transduced to Escherichia coli strain NM554 and stored at -70°C. Before use the titre of the
library was checked, and about 104 cells were plated in duplo on Ø 14 cm plates with LB-
agar (Sambrook et al., 1989) containing 50 µg ml-1 ampicillin. Plates were cooled for 30
minutes at 4°C and colonies were lifted using nylon membranes (Boehringer Mannheim,
Mannheim, Germany). Membranes were processed according to the manufacturer’s
instructions. Cloned RAPD- and AFLP-fragments were digoxigenin-labelled as described in
chapter 5 and used to hybridise to the colony lifts. Original plates were orientated on the
autoradiograms and colonies showing signal were transferred with toothpicks to vials
containing 5 ml of fresh LB broth with 50 µg ml-1 ampicillin. After overnight incubation at
37°C on a rotary shaker at 225 rpm cultures were diluted and plated on Ø 9 cm plates to
obtain about 100 colonies per plate. Colony lifting and hybridisation procedures were
repeated and one of the single colonies showing hybridisation was isolated, subcultured and
stored on beads (Protect bacterial preservers, Technical Service Consultants Ltd., Heywood,
England).
Analysis of cosmid clones. Cosmid DNA was isolated from the selected clones using a
Qiagen plasmid isolation kit (Qiagen Inc., Chatsworth, CA, USA) and tested for the presence
of the concerning RAPD- or AFLP- fragment. Cosmid DNA was digested with HindIII,
subjected to electrophoresis on 0.8% agarose, blotted to positively charged membranes and
hybridised with digoxigenin labelled probes as described in chapter 5. In this way presence of
the marker fragment used to pick up the clone from the cosmid library was confirmed. For
those marker fragments hybridising to more than one HindIII fragments in digests of total
fungal DNA (chapter 5) it was assessed which copy of the marker sequence was present.
Fungal material for RNA isolation. Isolate G2 was cultured in vitro in a minimum medium
containing 1 gram KH2PO4, 1 gram KNO3, 0.5 gram MgSO4.7H2O, 0.5 gram KCl, 0.2 gram
glucose and 0.2 gram saccharose per litre (Nirenberg, 1976). The medium was inoculated
with approximately 108 spores from a two-week-old culture on potato dextrose agar (PDA;
Oxoid Unipath Ltd., Basingstone, England) and incubated at 27°C on a rotary shaker at 150
rpm for 3 days. Mycelium was harvested by filtration with Ederol filter no.261 (J.C. Binzer,
Hatzfeld/Eder, Germany).
Corms of gladiolus cultivar ‘Peter Pears’ were obtained from commercial stocks and stored at
5°C until use. Husks of corms were removed, damaged or diseased corms were discarded,
corms were surface-disinfected in 0.8% formaldehyde and rinsed in sterile water. Slices of
corm tissue approximately 1 cm in height were obtained by transversally sectioning of corms
with a sterile knife. Slices were placed in Petri dishes on wetted filter paper discs and
inoculated by spreading 50 µl of a spore suspension of isolate G2 (106 spores ml-1) on the
upper surface and incubated at 27°C. After 2, 3, 4 and 7 days corm slices were sampled.
Clearly diseased (brown/rotten) tissue was removed and approximately 1-mm thick samples
of tissue directly adjacent to the clearly diseased zone, containing the fungal colonisation
front, were harvested. At day 2 the upper 1 mm was harvested, at day 3 the layer between 2
and 3 mm, at day 4 the layer between 4 and 5 mm was harvested. At day 7, however, slices
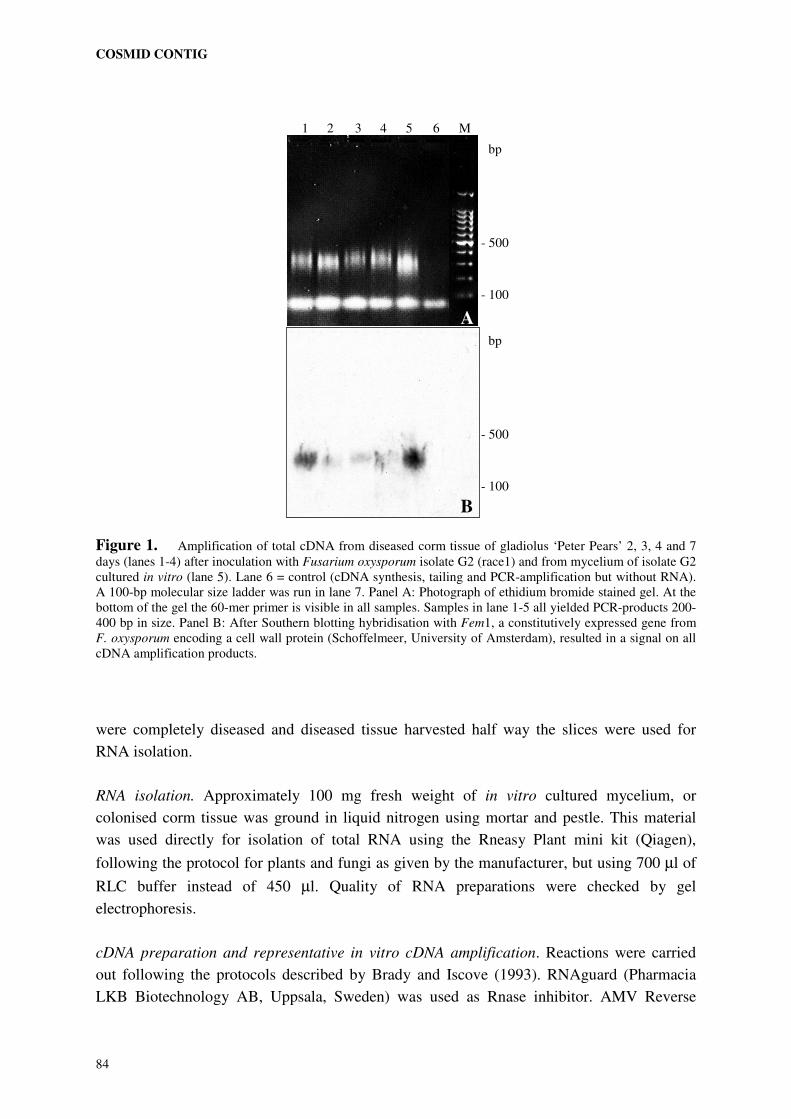
COSMID CONTIG
84
Figure 1. Amplification of total cDNA from diseased corm tissue of gladiolus ‘Peter Pears’ 2, 3, 4 and 7 days (lanes 1-4) after inoculation with Fusarium oxysporum isolate G2 (race1) and from mycelium of isolate G2 cultured in vitro (lane 5). Lane 6 = control (cDNA synthesis, tailing and PCR-amplification but without RNA). A 100-bp molecular size ladder was run in lane 7. Panel A: Photograph of ethidium bromide stained gel. At the bottom of the gel the 60-mer primer is visible in all samples. Samples in lane 1-5 all yielded PCR-products 200-400 bp in size. Panel B: After Southern blotting hybridisation with Fem1, a constitutively expressed gene from F. oxysporum encoding a cell wall protein (Schoffelmeer, University of Amsterdam), resulted in a signal on all cDNA amplification products.
were completely diseased and diseased tissue harvested half way the slices were used for
RNA isolation.
RNA isolation. Approximately 100 mg fresh weight of in vitro cultured mycelium, or
colonised corm tissue was ground in liquid nitrogen using mortar and pestle. This material
was used directly for isolation of total RNA using the Rneasy Plant mini kit (Qiagen),
following the protocol for plants and fungi as given by the manufacturer, but using 700 µl of
RLC buffer instead of 450 µl. Quality of RNA preparations were checked by gel
electrophoresis.
cDNA preparation and representative in vitro cDNA amplification. Reactions were carried
out following the protocols described by Brady and Iscove (1993). RNAguard (Pharmacia
LKB Biotechnology AB, Uppsala, Sweden) was used as Rnase inhibitor. AMV Reverse
B
A
1 2 3 4 5 M 6
- 500
- 100
bp
- 500
- 100
bp

CHAPTER 6
85
Transcriptase and Terminal Deoxynucleotidyl Transferase were from Gibco BRL Life
Technologies (Rockville, Maryland, USA) and PCR reagents were from Perkin Elmer Corp.
(Norwalk, CT, USA).
Approximately 1 µg of total RNA was used to produce first-strand cDNA. After 15 minutes
the reverse transcriptase was stopped by heating to 65°C for 10 minutes. Subsequently 3'
poly(dA) tails were added to the cDNA strands using terminal transferase. After this step the
resulting DNA is defined at both ends, enabling PCR amplification using a single oligo(dT)-
containing primer. PCR products were checked by agarose gel electrophoresis and contained
typically DNA in the size range of 200-500 base pairs (figure 1A). Gels were blotted to
positively charged nylon membranes as described in chapter 3 and hybridised with a cloned
cDNA of the Fem1 gene from F. oxysporum f.sp. lycopersici, which was kindly provided by
E. Schoffelmeer (University of Amsterdam, the Netherlands). This gene had been shown to
be constitutively expressed not only in F. oxysporum f.sp. lycopersici, but also in isolate G2
(race 1) of F.oxysporum f.sp. iridacearum (E. Schoffelmeer, pers. comm.). Hybridisation of
the Fem1 cDNA clone to amplified cDNA ends from both in vitro cultured mycelium and
infected gladiolus corm tissue (figure 1B), showed that indeed cDNA ends from fungal origin
were present at a detectable level.
Table 1. Approximate sizes (kb) of hybridising HindIII fragments present in the two wild type parental isolates G2 (race 1) and G6 (race 2n) of Fusarium oxysporum f.sp. iridacearum, fusion product B7 and selected cosmid clones. # = number of independent cosmids obtained. * = cosmids also contained the 7.5-kb HindIII fragment hybridising to RAPD1.
marker G2 G6 B7 cosmid(s) # lane no in Fig.2
RAPD1 7.5 - - 7.5 2 1 and 2 6.0 - - 0
RAPD2 2.8 - - 0 2.0 - 2.0 2.0 8 1.2 1
AFLP33 12 - - 12 1
AFLP47 5.0 - - 0
AFLP53 3.5 3.5 3.5 0 1.5 - - 0 1.3 - 1.3 0 9.0 1 5.5 2
AFLP63 3.4 - - 3.4 1* 3 4.5 1* 4
COSMID CONTIG
86
Cloning and analysis of transcriptionally active sequences from cosmids clones. Cosmid
DNA preparations were digested with different pairs of restriction enzymes. Digests obtained
with XhoI and EcoRI showed a more or less even distribution of restriction fragments in the
size range from 0.5 to 5 kb well separated from the 8.1 kb cosmid vector DNA (figure 2A)
and this set of restriction enzymes was selected for further work.
XhoI/EcoRI digests of selected cosmid clones were subjected to electrophoresis and blotted.
Blots were hybridised with labelled pools of cDNA ends from both in vitro cultured
mycelium and infected gladiolus corm tissue. Hybridising restriction fragments were
considered to contain transcribed sequences. From one of the cosmid clones, containing
copies of the markers AFLP63 and RAPD1, two restriction fragments hybridising to cDNA
were cloned in pBluescript II SK+ (Stratagene, La Jolla, CA, USA) and transformed into
E.coli INVαF’ cells, following standard procedures (Sambrook et al., 1989). Cloned
fragments were digoxigenin labelled by PCR (Boehringer Mannheim, Mannheim, Germany),
using the universal UP (CACACAGGAAACAGCTATGACC) and DOWN
(CGTTGTAAAACGACGGCCAGTG) primers, according to the manufacturer’s instructions.
Probing to Southern blots of digests of total DNA and of chromosomes separated by PFGE
was performed as described in chapter 4.
Sequence analysis. Cloned fragments were double stranded sequenced by BaseClear (Leiden,
The Netherlands). Sequence data were analysed using the computer programme DNA
StriderTM (version 1.3f4).
RESULTS
Cosmid library screening. Sizes of HindIII fragments hybridising to the cloned marker
fragments which were used as probes to screen the cosmid library are listed in table 1,
showing the observed polymorphisms between isolate G2, G6 and fusion product B7. Two
cloned AFLP fragments, which did not give a clear hybridisation signal due to their small
sizes, are not listed in table 1. Of RAPD2, belonging to the linkage group of 17 markers and
located on the 2.1-Mb chromosome IX-b of isolate G2, but not to the seven markers absent in
B7, one of the two copies was missing in B7 (figure 2 in chapter 5 and table 1 this chapter).
The missing copy could therefore be considered an RFLP marker present in the region that
was lost in B7. For this reason RAPD2 was added to the markers used to screen the cosmid
library. Sizes of the HindIII fragment from the selected cosmids hybridising to the respective
cloned markers are also presented in table 1. In some cases, sizes of hybridising HindIII
fragment within selected cosmids did not correspond with size(s) observed in total DNA of
isolate G2, indicating that the concerning marker sequence was located at one of the ends of
the insert in the cosmid.
Despite extensive screening the 2.8-kb HindIII fragment containing the copy of RAPD2
which is absent in B7, could not be selected. Nine cosmids were picked up with RAPD2, of
which eight contained the 2.0-kb HindIII fragment that is still present in B7. One cosmid

CHAPTER 6
87
clone contained a 1.2-kb HindIII fragment hybridising to RAPD2 (table 1). Comparison of
restriction profiles (not shown) of this last cosmid with profiles of the other eight RAPD2
containing cosmids showed high levels of similarity. Therefore no indication existed that this
cosmid possibly contains the other copy of this marker. Also of RAPD1 only one of the two
copies was picked up from the cosmid library. Both cosmids selected with RAPD1 contained
the 7.5-kb HindIII fragment. Two more cosmids, selected with AFLP63 also contained this
7.5-kb HindIII fragment hybridising to RAPD1. The other copy (6.0 kb HindIII fragment) of
RAPD1 was not found.
Only one of the three HindIII fragments hybridising to AFLP53 in G2 was missing in fusion
product B7 (table 1). A cosmid clone containing this fragment could however not be
identified. The three cosmid clones selected with this marker fragment all contained aberrant
sizes of HindIII fragment hybridising to the probe. With AFLP33 a single cosmid clone,
containing a HindIII fragment of the correct size (12 kb), was selected. With AFLP47 no
positive clones could be identified, possibly due to the small size of this fragment (120 base
pairs, including adapter sequences).
Figure 2. Southern analysis of a contig of four cosmids clones from Fusarium oxysporum f.sp. iridacearum isolate G2 (race 1). Panel A: EcoRI/XhoI-digests after agarose-gel electrophoresis. pWE15 vector DNA is visible at the top of the gel (arrowhead 1). Arrowhead 2 indicates restriction fragment, present in all four cosmids on which marker RAPD1 was located, as identified by Southern analysis (blot not shown). Arrowhead 3 indicates restriction fragment, present in the cosmids shown in lane 3 and 4, on which marker AFLP63 was located, as identified by Southern analysis (blot not shown). Panel B: Blot showing hybridisation with labelled cDNA-ends from in vitro cultured mycelium of G2. Panel C: Same as panel B, but after hybridisation with cDNA-ends from G2-infected corm tissue. Fragments, which were arbitrarily chosen to be cloned, are indicated by arrowheads 4 and 5. Hybridisation of the cloned fragments is shown for the 2.8-kb fragment in panel D and for the3.6-kb fragment in panel E. The 2.8-kb fragment cross-hybridised with another restriction fragment from the same cosmid, which was also present in the other three cosmids of the contig.
1
2 4
5
3
1 2 3 4 1 2 3 4 1 2 3 4 1 2 3 4 1 2 3 4
4 4 4
5 5 5
M
21
4.3 3.5
2.0
1.9
1.6
1.4
5.1 5.0
kb
B A C D E
COSMID CONTIG
88
Amplification of cDNA from in vitro cultured mycelium and from infected corm tissue. From
100 mg fresh weight of either mycelium or corm tissue harvested at the colonisation front
from infected gladiolus corm tissue, typically 5-10 µg of total RNA was isolated. Quality of
RNA preparations was checked by agarose gel electrophoresis (not shown). 1 µg of RNA
was subsequently used to synthesise incomplete first strand cDNA, followed by poly(A)
tailing and PCR amplification. Amplification products were analysed on agarose gels as
illustrated in figure 1A. Gels were blotted and probed with cloned Fem1 cDNA (E.
Schoffelmeer, University of Amsterdam), resulting in a hybridisation signal, both with
material obtained from mycelium as with material from infected corm tissue (figure 1B),
demonstrating that cDNA of fungal origin was present at detectable levels in preparations
from infected plant material. Amplification product from uninfected corm material did not
show hybridisation (not shown).
Detection of restriction fragment of cosmid clones containing transcribed sequences. The two
cosmids clones selected with RAPD1 and the two selected with AFLP63 were digested with a
mixture of the restriction enzymes EcoRI and XhoI and subjected to electrophoresis (figure
2A). The fragments that hybridised to the marker fragment are indicated in figure 2A (blots
not shown). Hybridisation patterns obtained with labelled populations of cDNA-ends derived
from mycelium and infected tissue are shown in figure 2B and 2C respectively. Fragments
hybridising with cDNA-ends from both sources were observed, indicating that the restriction
fragments concerned contain genes that were expressed both in vitro and in planta. No bands
were found hybridising with cDNA-ends from infected corm tissue only. Such finding would
have been indicative for the presence of fungal genes induced during infection. Two
restriction fragments from the cosmid clone containing AFLP63 and RAPD1 (lane 3),
containing genes expressed both in vitro and in planta were arbitrarily chosen for further
analysis. Restriction analysis with both restriction enzymes separately revealed that the 3.6-
kb fragment, which showed a strong signal (figure 2C) was an EcoRI-EcoRI fragment, while
the 2.8-kb fragment turned out to be a XhoI-XhoI fragment. Both fragments were cloned,
labelled and probed to the original Southern blots of double digested cosmids (figure 2D and
E). The 3.6-kb fragment only hybridised to itself (figure 2E), while the 2.8-kb fragment also
cross-hybridised to a 2-kb fragment, present in all four cosmids (figure 2D).
The cosmid clone selected with AFLP 33 was analysed in the same way. Within this cosmid
a single restriction fragment was found hybridising with cDNA ends from in vitro grown
fungus, while no hybridising bands were found when cDNA ends from infected tissue was
used (not shown).
Race specificity of cloned fragments. Hybridisation of the cloned fragments to EcoRI/XhoI
digested total DNA of G2, G6, transformants and fusion products showed that the 2.8-kb
fragment contained (a) highly repetitive sequence(s) (figure 3A). Hybridising bands of 2.8 kb
appeared to be present in all strains, including G6 and fusion product B7. The cloned 3.6-kb
fragment was also found to hybridise to more than one band although the number of
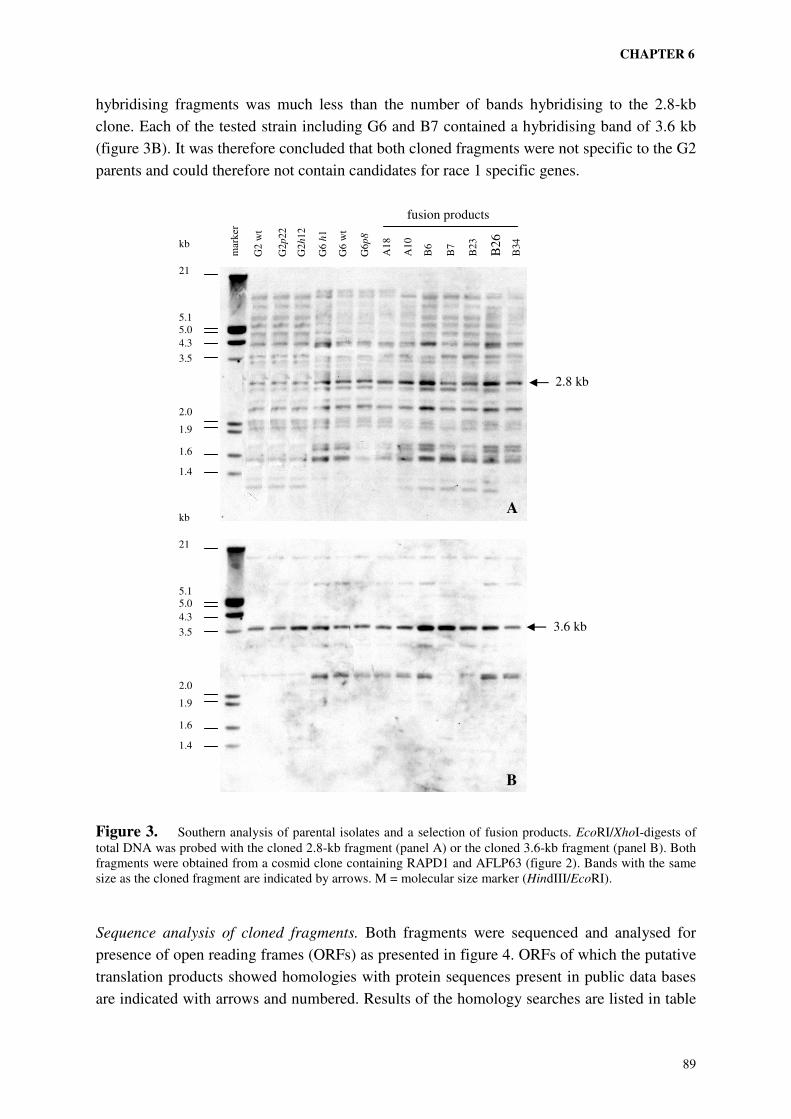
CHAPTER 6
89
hybridising fragments was much less than the number of bands hybridising to the 2.8-kb
clone. Each of the tested strain including G6 and B7 contained a hybridising band of 3.6 kb
(figure 3B). It was therefore concluded that both cloned fragments were not specific to the G2
parents and could therefore not contain candidates for race 1 specific genes.
Figure 3. Southern analysis of parental isolates and a selection of fusion products. EcoRI/XhoI-digests of total DNA was probed with the cloned 2.8-kb fragment (panel A) or the cloned 3.6-kb fragment (panel B). Both fragments were obtained from a cosmid clone containing RAPD1 and AFLP63 (figure 2). Bands with the same size as the cloned fragment are indicated by arrows. M = molecular size marker (HindIII/EcoRI).
Sequence analysis of cloned fragments. Both fragments were sequenced and analysed for
presence of open reading frames (ORFs) as presented in figure 4. ORFs of which the putative
translation products showed homologies with protein sequences present in public data bases
are indicated with arrows and numbered. Results of the homology searches are listed in table
G2
wt
G2
p22
G2
h12
G6
wt
G6
h1
G6
p8
mar
ker
A1
8
A1
0
B6
B7
B23
B2
6
B34
21
4.3
3.5
2.0
1.9
1.6
1.4
5.1 5.0
kb
21
4.3
3.5
2.0
1.9
1.6
1.4
5.1 5.0
kb
2.8 kb
3.6 kb
fusion products
A
B
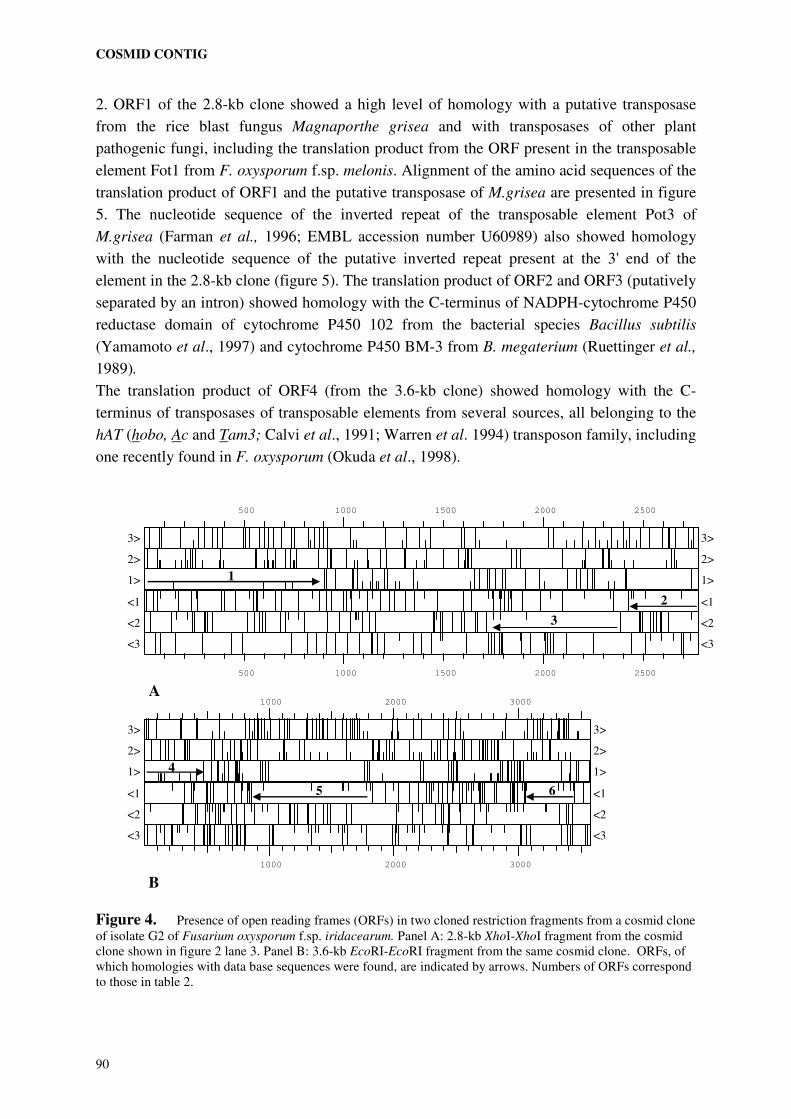
COSMID CONTIG
90
2. ORF1 of the 2.8-kb clone showed a high level of homology with a putative transposase
from the rice blast fungus Magnaporthe grisea and with transposases of other plant
pathogenic fungi, including the translation product from the ORF present in the transposable
element Fot1 from F. oxysporum f.sp. melonis. Alignment of the amino acid sequences of the
translation product of ORF1 and the putative transposase of M.grisea are presented in figure
5. The nucleotide sequence of the inverted repeat of the transposable element Pot3 of
M.grisea (Farman et al., 1996; EMBL accession number U60989) also showed homology
with the nucleotide sequence of the putative inverted repeat present at the 3' end of the
element in the 2.8-kb clone (figure 5). The translation product of ORF2 and ORF3 (putatively
separated by an intron) showed homology with the C-terminus of NADPH-cytochrome P450
reductase domain of cytochrome P450 102 from the bacterial species Bacillus subtilis
(Yamamoto et al., 1997) and cytochrome P450 BM-3 from B. megaterium (Ruettinger et al.,
1989).
The translation product of ORF4 (from the 3.6-kb clone) showed homology with the C-
terminus of transposases of transposable elements from several sources, all belonging to the
hAT (hobo, Ac and Tam3; Calvi et al., 1991; Warren et al. 1994) transposon family, including
one recently found in F. oxysporum (Okuda et al., 1998).
Figure 4. Presence of open reading frames (ORFs) in two cloned restriction fragments from a cosmid clone of isolate G2 of Fusarium oxysporum f.sp. iridacearum. Panel A: 2.8-kb XhoI-XhoI fragment from the cosmid clone shown in figure 2 lane 3. Panel B: 3.6-kb EcoRI-EcoRI fragment from the same cosmid clone. ORFs, of which homologies with data base sequences were found, are indicated by arrows. Numbers of ORFs correspond to those in table 2.
500
500
1000
1000
1500
1500
2000
2000
2500
2500
3> 3>
2> 2>
1> 1>
<1 <1
<2 <2
<3 <3
1000
1000
2000
2000
3000
3000
3> 3>
2> 2>
1> 1>
<1 <1
<2 <2
<3 <3
B
A
1
2
3
4
5 6
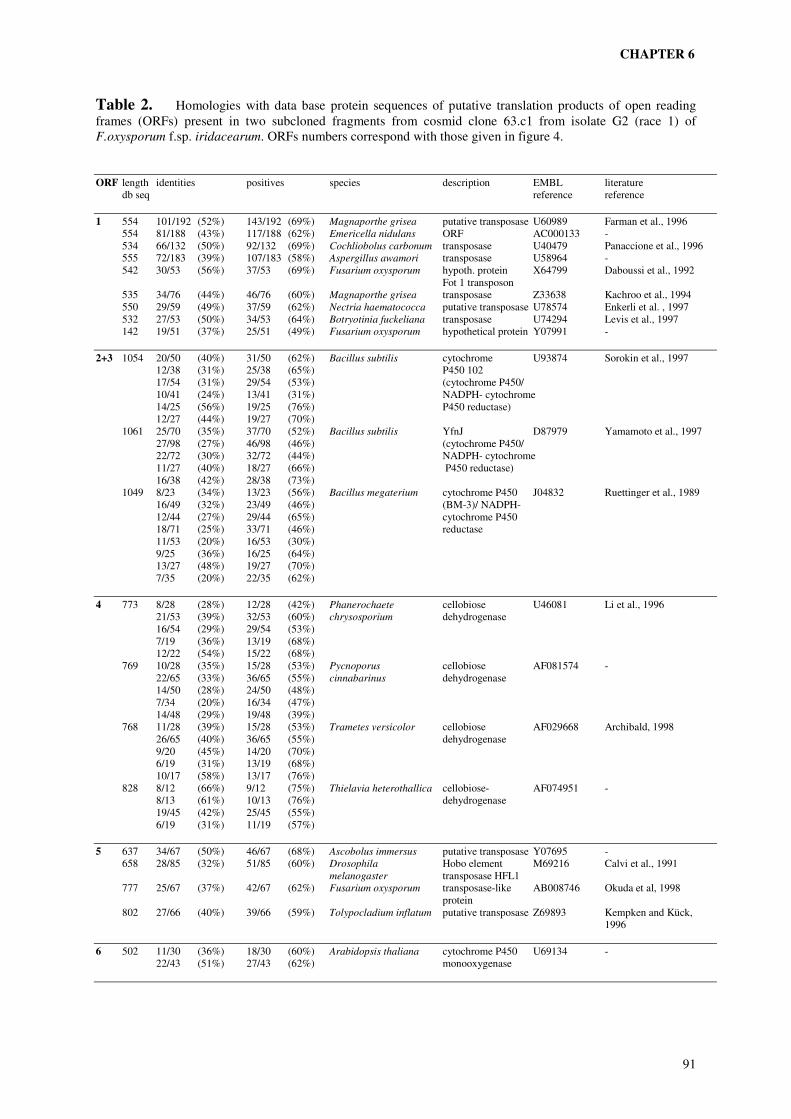
CHAPTER 6
91
Table 2. Homologies with data base protein sequences of putative translation products of open reading frames (ORFs) present in two subcloned fragments from cosmid clone 63.c1 from isolate G2 (race 1) of F.oxysporum f.sp. iridacearum. ORFs numbers correspond with those given in figure 4. ORF length identities positives species description EMBL literature
db seq reference reference
1 554 101/192 (52%) 143/192 (69%) Magnaporthe grisea putative transposase U60989 Farman et al., 1996 554 81/188 (43%) 117/188 (62%) Emericella nidulans ORF AC000133 - 534 66/132 (50%) 92/132 (69%) Cochliobolus carbonum transposase U40479 Panaccione et al., 1996 555 72/183 (39%) 107/183 (58%) Aspergillus awamori transposase U58964 - 542 30/53 (56%) 37/53 (69%) Fusarium oxysporum hypoth. protein X64799 Daboussi et al., 1992
Fot 1 transposon 535 34/76 (44%) 46/76 (60%) Magnaporthe grisea transposase Z33638 Kachroo et al., 1994 550 29/59 (49%) 37/59 (62%) Nectria haematococca putative transposase U78574 Enkerli et al. , 1997 532 27/53 (50%) 34/53 (64%) Botryotinia fuckeliana transposase U74294 Levis et al., 1997 142 19/51 (37%) 25/51 (49%) Fusarium oxysporum hypothetical protein Y07991 -
2+3 1054 20/50 (40%) 31/50 (62%) Bacillus subtilis cytochrome U93874 Sorokin et al., 1997 12/38 (31%) 25/38 (65%) P450 102 17/54 (31%) 29/54 (53%) (cytochrome P450/ 10/41 (24%) 13/41 (31%) NADPH- cytochrome 14/25 (56%) 19/25 (76%) P450 reductase)
12/27 (44%) 19/27 (70%) 1061 25/70 (35%) 37/70 (52%) Bacillus subtilis YfnJ D87979 Yamamoto et al., 1997
27/98 (27%) 46/98 (46%) (cytochrome P450/ 22/72 (30%) 32/72 (44%) NADPH- cytochrome
11/27 (40%) 18/27 (66%) P450 reductase) 16/38 (42%) 28/38 (73%)
1049 8/23 (34%) 13/23 (56%) Bacillus megaterium cytochrome P450 J04832 Ruettinger et al., 1989 16/49 (32%) 23/49 (46%) (BM-3)/ NADPH- 12/44 (27%) 29/44 (65%) cytochrome P450 18/71 (25%) 33/71 (46%) reductase 11/53 (20%) 16/53 (30%) 9/25 (36%) 16/25 (64%) 13/27 (48%) 19/27 (70%) 7/35 (20%) 22/35 (62%)
4 773 8/28 (28%) 12/28 (42%) Phanerochaete cellobiose U46081 Li et al., 1996 21/53 (39%) 32/53 (60%) chrysosporium dehydrogenase
16/54 (29%) 29/54 (53%) 7/19 (36%) 13/19 (68%) 12/22 (54%) 15/22 (68%)
769 10/28 (35%) 15/28 (53%) Pycnoporus cellobiose AF081574 - 22/65 (33%) 36/65 (55%) cinnabarinus dehydrogenase 14/50 (28%) 24/50 (48%) 7/34 (20%) 16/34 (47%) 14/48 (29%) 19/48 (39%)
768 11/28 (39%) 15/28 (53%) Trametes versicolor cellobiose AF029668 Archibald, 1998 26/65 (40%) 36/65 (55%) dehydrogenase 9/20 (45%) 14/20 (70%) 6/19 (31%) 13/19 (68%) 10/17 (58%) 13/17 (76%)
828 8/12 (66%) 9/12 (75%) Thielavia heterothallica cellobiose- AF074951 - 8/13 (61%) 10/13 (76%) dehydrogenase 19/45 (42%) 25/45 (55%) 6/19 (31%) 11/19 (57%)
5 637 34/67 (50%) 46/67 (68%) Ascobolus immersus putative transposase Y07695 - 658 28/85 (32%) 51/85 (60%) Drosophila Hobo element M69216 Calvi et al., 1991
melanogaster transposase HFL1 777 25/67 (37%) 42/67 (62%) Fusarium oxysporum transposase-like AB008746 Okuda et al, 1998
protein 802 27/66 (40%) 39/66 (59%) Tolypocladium inflatum putative transposase Z69893 Kempken and Kück, 1996
6 502 11/30 (36%) 18/30 (60%) Arabidopsis thaliana cytochrome P450 U69134 - 22/43 (51%) 27/43 (62%) monooxygenase
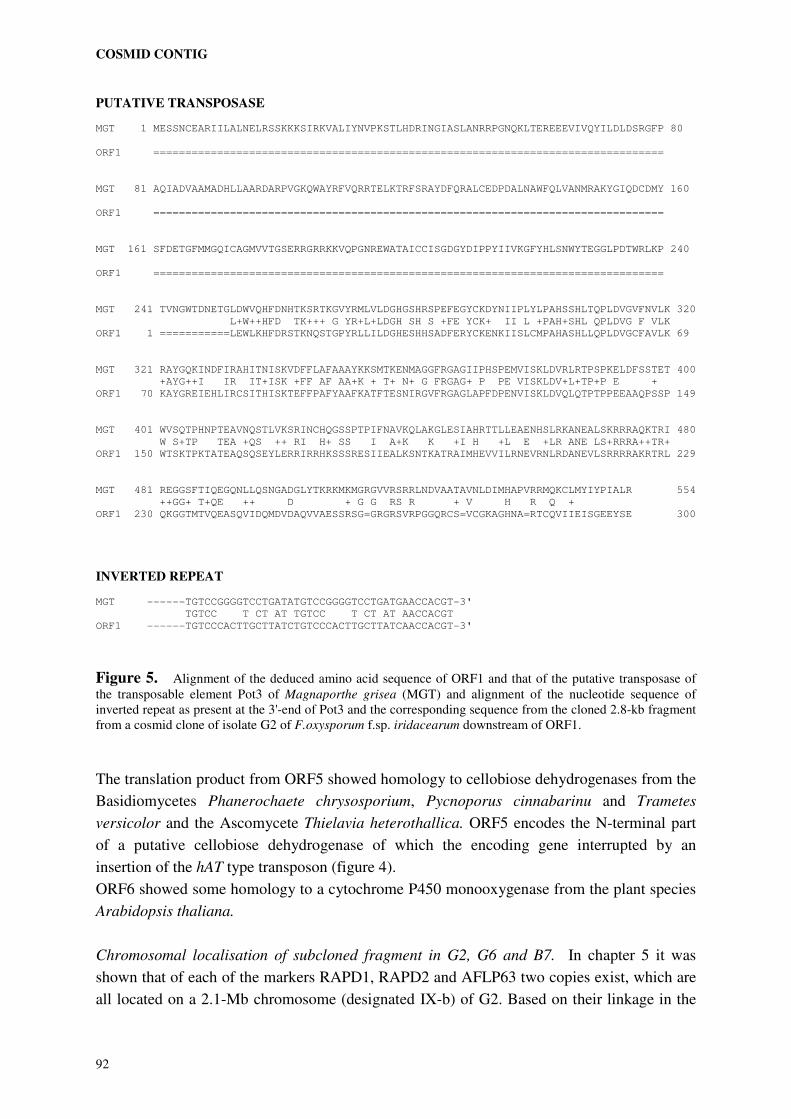
COSMID CONTIG
92
PUTATIVE TRANSPOSASE
MGT 1 MESSNCEARIILALNELRSSKKKSIRKVALIYNVPKSTLHDRINGIASLANRRPGNQKLTEREEEVIVQYILDLDSRGFP 80
ORF1 ================================================================================
MGT 81 AQIADVAAMADHLLAARDARPVGKQWAYRFVQRRTELKTRFSRAYDFQRALCEDPDALNAWFQLVANMRAKYGIQDCDMY 160
ORF1 ================================================================================
MGT 161 SFDETGFMMGQICAGMVVTGSERRGRRKKVQPGNREWATAICCISGDGYDIPPYIIVKGFYHLSNWYTEGGLPDTWRLKP 240
ORF1 ================================================================================
MGT 241 TVNGWTDNETGLDWVQHFDNHTKSRTKGVYRMLVLDGHGSHRSPEFEGYCKDYNIIPLYLPAHSSHLTQPLDVGVFNVLK 320
L+W++HFD TK+++ G YR+L+LDGH SH S +FE YCK+ II L +PAH+SHL QPLDVG F VLK
ORF1 1 ===========LEWLKHFDRSTKNQSTGPYRLLILDGHESHHSADFERYCKENKIISLCMPAHASHLLQPLDVGCFAVLK 69
MGT 321 RAYGQKINDFIRAHITNISKVDFFLAFAAAYKKSMTKENMAGGFRGAGIIPHSPEMVISKLDVRLRTPSPKELDFSSTET 400
+AYG++I IR IT+ISK +FF AF AA+K + T+ N+ G FRGAG+ P PE VISKLDV+L+TP+P E +
ORF1 70 KAYGREIEHLIRCSITHISKTEFFPAFYAAFKATFTESNIRGVFRGAGLAPFDPENVISKLDVQLQTPTPPEEAAQPSSP 149
MGT 401 WVSQTPHNPTEAVNQSTLVKSRINCHQGSSPTPIFNAVKQLAKGLESIAHRTTLLEAENHSLRKANEALSKRRRAQKTRI 480
W S+TP TEA +QS ++ RI H+ SS I A+K K +I H +L E +LR ANE LS+RRRA++TR+
ORF1 150 WTSKTPKTATEAQSQSEYLERRIRRHKSSSRESIIEALKSNTKATRAIMHEVVILRNEVRNLRDANEVLSRRRRAKRTRL 229
MGT 481 REGGSFTIQEGQNLLQSNGADGLYTKRKMKMGRGVVRSRRLNDVAATAVNLDIMHAPVRRMQKCLMYIYPIALR 554
++GG+ T+QE ++ D + G G RS R + V H R Q +
ORF1 230 QKGGTMTVQEASQVIDQMDVDAQVVAESSRSG=GRGRSVRPGGQRCS=VCGKAGHNA=RTCQVIIEISGEEYSE 300
INVERTED REPEAT
MGT ------TGTCCGGGGTCCTGATATGTCCGGGGTCCTGATGAACCACGT-3'
TGTCC T CT AT TGTCC T CT AT AACCACGT
ORF1 ------TGTCCCACTTGCTTATCTGTCCCACTTGCTTATCAACCACGT-3'
Figure 5. Alignment of the deduced amino acid sequence of ORF1 and that of the putative transposase of the transposable element Pot3 of Magnaporthe grisea (MGT) and alignment of the nucleotide sequence of inverted repeat as present at the 3'-end of Pot3 and the corresponding sequence from the cloned 2.8-kb fragment from a cosmid clone of isolate G2 of F.oxysporum f.sp. iridacearum downstream of ORF1.
The translation product from ORF5 showed homology to cellobiose dehydrogenases from the
Basidiomycetes Phanerochaete chrysosporium, Pycnoporus cinnabarinu and Trametes
versicolor and the Ascomycete Thielavia heterothallica. ORF5 encodes the N-terminal part
of a putative cellobiose dehydrogenase of which the encoding gene interrupted by an
insertion of the hAT type transposon (figure 4).
ORF6 showed some homology to a cytochrome P450 monooxygenase from the plant species
Arabidopsis thaliana.
Chromosomal localisation of subcloned fragment in G2, G6 and B7. In chapter 5 it was
shown that of each of the markers RAPD1, RAPD2 and AFLP63 two copies exist, which are
all located on a 2.1-Mb chromosome (designated IX-b) of G2. Based on their linkage in the
CHAPTER 6
93
fusion population the other 14 AFLP makers were presumed to be also located on this
chromosome. Considering the ratio of the number of AFLP markers in this linkage group and
the total number of AFLP markers screened (15/528) and an estimated genome size of
approximately 50 Mb it could be possible that a homologue of chromosome IX-b of G2 is
completely missing in the G6. The observed presence in G6 (figure 3) of the two cloned
restriction fragments from a cosmid containing RAPD1 and AFLP63 is in conflict with this
idea. Probing (parts of) the two cloned fragments to PFGE-blots of intact chromosomes was
carried out to get information about the chromosomal location of these fragments both in G2
and G6. Fusion product B7 was also incorporated in this analysis in an attempt to gain more
information about the fate of the remaining part of chromosome IX-b of G2 in this particular
fusion product.
A PFGE-gel containing G2, G6 and their transformants used in the fusion experiment to
produce B7 are shown in figure 6. Chromosomal bands are numbered as in chapter 5. The
2.1-Mb chromosomal band IX of G2 consists of two unresolved chromosomes designated IX-
a and IX-b (chapter 5). In G6 a double band of two partly resolved chromosomes is visible at
the same position in the gel. The largest of the two bands contains a single 2.1-Mb
chromosome (IX-a) which is likely the homologue of chromosome IX-a of G2 as judged by
hybridisation with a chromosome IX-a specific probe (chapter 5). In fusion product B7 this
chromosome IX-a is also present. The smaller 2.0-Mb chromosome of the double band in G6
was designated IX-b (figure 6A), but we had found no evidence so far that this chromosome
is homologous to chromosome IX-b of G2.
The 1.6-Mb chromosome X is present in G2 and B7, but absent in G6. Fusion product B7
contains an extra, non-parental, chromosomal band of 1.7 Mb that was designated IX-c. The
fact that this chromosome did not hybridise to the RAPD2 fragment (chapter 5), of which one
copy is still present in B7, indicated that this chromosome is not simply the remnant of
chromosome IX-b of G2 which resulted from an event of chromosome breakage and repair
(Zolan, 1995) during which the region containing the seven markers missing in B7 (including
RAPD1 and AFLP63) was lost. RAPD2 hybridised to the larger unresolved chromosomes of
B7, suggesting the occurrence of crossing-over between chromosome IX-b of G2 and one of
the larger chromosomes.
Hybridisation of a PFGE blot with the complete 2.8-kb fragment revealed that the highly
repetitive sequence present in this clone (figure 3A), which is likely the Pot3-like
transposable element, is distributed throughout the genome (figure 6B). Chromosomal band
IX of G2 showed a relatively strong hybridisation signal, indicating a high copy number of
this element in chromosomes IX-a/b of G2. Also chromosome IX-b of G6 and IX-c of B7
showed a strong hybridisation signal. This could mean that indeed chromosome IX-b of G6 is
the homologue of chromosome IX-b of G2 and that the non-parental chromosome IX-c of B7
contains sequences derived from chromosome IX-b. To obtain stronger evidence for this
hypothesis a single copy probe from chromosome IX-b of G2 which is also present in G6 and
B7 is required. A single copy sequence present on one of the two cloned fragments might
deliver such a probe. ORF 5 present in the 3.6-kb clone (figure 4), that was identified as part
of a putative cellobiose dehydrogenase gene, was considered to be a good candidate.

COSMID CONTIG
94
Therefore this sequence was subcloned and used to probe the same PFGE-blot (figure 6C).
Surprisingly a hybridisation pattern was found which was similar to that obtained with the
2.8-kb clone (figure 6B) containing the Pot3-like transposable element. A striking difference
between both hybridisation patterns, however, was that in isolate G2 a relatively weak signal
was obtained on the 2.1-Mb chromosomal band of G2. The 1.7-Mb chromosome of fusion
product B7 did show a relatively strong signal with the ORF5 subclone, indicating that the
responsible sequences should have come from other parts of the genome. As already
mentioned, we previously (chapter 5) observed that the RAPD2 fragment (from chromosome
IX-b of the G2 parent) hybridised to one of the larger chromosomes of B7. For reasons of
comparison the RAPD2 fragment was also hybridised to the PFGE-blot used in the
hybridisation experiments described here. Again no hybridisation signal was observed with
the 1.7-Mb chromosome or any of the other smaller chromosomes of fusion product B7,
while some signal was obtained from the unresolved larger chromosomes (figure 6D).
Figure 6. Pulsed field gel electrophoresis of fusion product B7 and parental strains. Panel A shows PFGE gels run at 4 C, 2 V cm-1, switching intervals from 900-1800 sec for 164 hours. Panels B, C and D show autoradiograms of the PFGE-gel hybridised with the cloned 2.8-kb fragment the ORF5 subclone of the 3.6-kb fragment and the RAPD2 fragment respectively. Chromosomes are numbered using Roman numerals according to chapter 4 figure 2 and chapter 5 figure 4.
G2
wt
G2
h1
2
G6
wt
G6
p8
B7
G2
wt
G2
h1
2
G6
wt
G6
p8
B7
A B
VIII
X
IX
VII
VI
I…V
D C
- 2.2 Mb
- 1.6 Mb
- 3.5 Mb
- 2.2 Mb
- 1.6 Mb
- 3.5 Mb
CHAPTER 6
95
DISCUSSION
Several clones from a cosmid library of isolate G2 (race 1) were isolated, using RAPD- and
AFLP-fragments marking a putative dispensable region of G2 as probes. Despite extensive
screening we were unable to extract cosmids covering all polymorphic copies of all marker
fragments from the cosmid library (table 1). This was partly due to the practical limitations
of the used technique: some AFLP marker fragments were too small to obtain a reliable
signal. Some selected cosmid clones contained HindIII fragments aberrant from those
identified by Southern analysis with total DNA, which made it unclear which copy was
present (table 1). Of both cloned RAPD fragments only one of the two copies was found in
the cosmid library (table 1). This can not be the result of differences in DNA methylation in
F.oxysporum and E.coli, since digestion with HindIII is not affected by methylation. So, for
unknown reasons, copies of these RAPD markers were not proportionally represented in the
library. Of RAPD2 only the copy which is still present in fusion product B7, and therefore
not of primary interest, was found within a large number of cosmid clones selected with this
marker (table 1).
Two cosmids were selected containing both one copy of RAPD1 and one copy of AFLP63.
This finding proved the close physical linkage of these markers, which had already been
demonstrated by the finding that both marker fragments hybridised to AscI and SfiI rare cutter
fragments of the same size (chapter 5). Two other cosmids were found which contained the
same copy of RAPD1, but not AFLP63. Restriction fragments hybridising to labelled cDNA-
ends from in vitro grown mycelium of G2 were found present on all four cosmids (figures
2B). Some of these fragments also hybridised to cDNA-ends from G2-infected corm tissue,
indicating that they carry genes also transcribed in planta. Two of these fragments, both from
the same cosmid, were arbitrarily chosen for cloning and sequence analysis. Southern
analysis, however revealed that both cloned fragments were present not only in G2, but also
in G6 and fusion product B7 (figures 3A and 3B). The two cloned fragments hence contained
sequences of chromosome IX-b of G2 of which homologues are present in G6 and B7. This
means that the possibility that the entire chromosome IX-b of G2 is a dispensable
chromosome which is completely absent in G6 and partly absent in fusion product B7 can be
ruled out.
Hybridisation of the complete cloned 2.8-kb fragment to a PFGE-blot (figure 6B) showed
presence in many chromosomes, illustrating that the repetitive sequence present in this cloned
fragment is scattered all over the genome. The relative intensity of the hybridisation signals
on the different chromosomal bands, however, suggested that the slightly smaller
chromosome IX-b of G6 might be the homologue of chromosome IX-b of G2. It also
suggested that in fusion product B7 the non-parental 1.7-Mb chromosome is partly
homologous to chromosome IX-b of G2. Hybridisation signals on PFGE-blots obtained with
a subclone from the clone 3.6-kb fragment (figure 6C), however indicated that this 1.7-Mb
chromosome also inherited sequences from another part of the genome. Together with the
observation that the RAPD2 fragment, of which one copy is still present in B7, is not located
on this 1.7-Mb chromosome (figure 6D), this suggested that recombination between
COSMID CONTIG
96
chromosome IX-b of G2 and one of the larger chromosomes had occurred, leading to a large
deletion (loss of marker group 1) and two recombinant chromosomes of which the 1.7-Mb
chromosome is one. To obtain further evidence that indeed the 2.0 Mb chromosome IX-b of
G6 is the homologue of the 2.1-Mb chromosome IX-b of G2, and to further characterise the
recombination between chromosome IX-b of G2 and one of the larger chromosomes resulting
in the 1.7-Mb chromosome of B7, single copy clones from these chromosomes are required.
Sequence analysis of the cloned 2.8-kb fragment revealed the presence of a large part of a
Pot3-like transposon (Farman et al., 1996) belonging to the Fot1 family (Daboussi et al.,
1992; Kachroo et al., 1994; Levis et al., 1997). The complex hybridisation patterns (figure
3A and figure 6B) obtained with the 2.8-kb clone are probably due to the presence of this
transposable element. The relatively high level of homology to the M. grisea transposon Pot3
(MGR586) (Farman et al., 1996) suggests that this element belongs to the MGR586
subfamily within the Fot1-like family (Levis et al., 1997). The other subfamily contains
elements as Fot1 (from F.oxysporum; EMBL X64799), Flipper (from B. cinerea; EMBL
U74294) and Pot2 (from M.grisea; EMBL Z33638). This means that not only in M.grisea
these two subfamilies can coexist in the same fungus, but that they also coexist in
F.oxysporum, supporting the hypothesis of Levis et al. (1997) that an ancient duplication
gave rise to these two subfamilies. The cloned 3.6-kb fragment contained part of another
inverted repeat transposon (table 2). This element showed homologies to the family of hAT
transposons, which have been discovered in many plant and animal species (Calvi et al.,
1991) and which have more recently also been detected in fungi (Kempen and Kück, 1996)
including F.oxysporum (Okuda et al., 1998). Transposons might very well serve as sites for
recombination between heterologous chromosomes (Zolan, 1995). The recombination event,
which had led to the formation of the non-parental 1.7Mb chromosome in fusion product B7,
might well be an example of this.
Since the two cloned restrictions fragments from one of the cosmid clones were both present
in G6 and B7, while the two marker fragments RADP1 and AFLP63 present on the same
cosmid were absent in G6 or B7, this cosmid possibly spans the border of the putative
dispensable region. Both cloned fragments were absent in any of the three other cosmids also
containing RAPD1 (figure 2D and 2E). This indicates that both cloned fragments are located
distal from RAPD1 and AFLP63 on this contig of four cosmids. This end of the contig
harbouring both cloned fragments might therefore fall just outside the border of the putative
dispensable region from chromosome IX-b of G2, while the remaining part including RAPD1
and AFLP63 does represent one of ends of this dispensable region. Alignment of the four
cosmid clones should enable the construction of a map covering probably over 60 kb.
Hybridisation studies with subclones from different map positions will reveal whether indeed
the contig can be divided into two parts, one present and one absent in G6 and B7.
Transcribed sequences present in the latter part would then be good candidates for G2 (race
1) specific genes.
97
CHAPTER 7
General discussion Knowledge on the genetic diversity of pathogens and on the molecular biology of host
specificity is required for effective resistance breeding, development of detection assays for
sanitation purposes, rational improvement of existing disease control methods and for the
development of novel control strategies.
The first goal of the research presented in this thesis was to elucidate the genetic structure of
a population of field isolates of the pathogenic fungus Fusarium oxysporum from gladiolus
and other iridaceous crops. Phenotypic and genotypic analysis delivered the desired
knowledge of genetic diversity of the pathogen in terms of the existence of pathogenic races
and their mutual genetic relationships. This knowledge was required for resistance breeding
(Straathof et al., 1997a, 1997b and 1998) and for developing a detection assay that can be
applied in diagnostics and in certification programs (De Haan et al., 2000).
Furthermore, the results of the work described in the first part of this thesis formed the basis
for research on the molecular biology of host specificity within Fusarium oxysporum of
iridaceous crops. The second part of this thesis described the work undertaken to identify
(one of the) genes determining the difference in host specificity between two of the
pathogenic races identified in the first part.
VCGs of F.oxysporum pathogenic to iridaceous crops are not monophyletic
The isolates of F. oxysporum from different iridaceous crops analysed in this study displayed
much variation. On the basis of differences in host preference ten physiologic (pathogenic)
races were recognised and complementation studies with nit mutants revealed six different
vegetative compatibility groups (VCGs) (chapter 2). Since the perfect (sexual) stage of F.
oxysporum has never been found, sexual reproduction is probably sparse if not absent in this
fungus, preventing meiotic recombination of the loci determining vegetative
(in)compatibility. As a result VCGs in F.oxysporum should represent clonal lineages. That
this indeed is the case is strongly supported by molecular analysis of isolate collections of
many other formae speciales. The data we obtained by RFLP- and AFLP fingerprinting also
showed that isolates belonging to the same VCG are clonally related. Furthermore, the low
similarity between AFLP fingerprints of the different VCGs from iridaceous crops suggested
that they might have evolutionary independent origins. A recent study of gene genealogies in
a large set of isolates from eight different formae speciales, including isolates from all VCGs
from iridaceous crops, strongly supported this idea (Baayen et al., 2000). The six VCGs from
GENERAL DISCUSSION
98
iridaceous crops represent five distinct evolutionary lineages and are not closer related to
each other than to VCGs from other formae speciales.
Accommodating evolutionary distinct lineages in one formae specialis can be misleading.
O’Donnell et al. (1998), who demonstrated the polyphyly of the formae speciales cubense
and melonis, put forward that this challenges the forma specialis naming system since “it
potentially obscures the communication of critical information concerning the genetic
diversity”. The practical importance of the recognition of genetic diversity in pathogenic
forms of F. oxysporum at least requires that besides the forma specialis name always a VCG
code is presented. Since the coding system of VCGs in F. oxysporum is internationally co-
ordinated (Kister et al., 1998; Katan, 1999; Katan and Di Primo, 1999), VCG codes
unambiguously refers to a defined and recognised genetic group. Therefore the VCG code
should be used to indicate the taxonomic entity, while the forma specialis name should be
added to indicate to which plant genus or plant family the given VCG has found to be
pathogenic.
Genetic basis of formae speciales
Since it is very likely now that pathogenicity to iridaceous crops has evolved independently
in different lineages, the question arises whether those lineages share a similar genetic basis
for pathogenicity to iridaceous crops or that in each lineage different genes are responsible
for pathogenicity to Iridaceae. In this respect it should be mentioned that, although the
different lineages have their pathogenicity to iridaceous crops in common, they differ
substantially in their host preference. This means that at least pathogenicity to iridaceous
crops is not a simple trait encoded by a single dominant gene, but that more genes are
involved that may differ between VCGs. Without identifying the responsible genes it is
impossible to assess whether parallel evolution, sexual recombination or horizontal gene
transfer has led to the development of pathogenicity to iridaceous crops in distinct lineages.
Cloning, characterisation and comparison of the responsible genes in the different lineages
requires extensive research, but is the only way to elucidate how pathogenicity has evolved in
these different lineages and what the similarities and the differences are.
So far no genes involved in determining the host range (forma specialis) of F. oxysporum
have been cloned. Assuming that pathogenicity to a certain host species is a dominant trait
acquired by a saprophytic strain, the most obvious cloning strategy is by disrupting the
responsible genes either by transposon tagging (Migheli, 1999) or by restriction enzyme-
mediated integration of plasmid DNA (Shi et al., 1995; Bölker et al., 1995). As soon as
research of such kind results in the identification of genes determining host specificity in one
of the lineages, the presence of homologous genes in the other lineages can be tested. An
alternative approach might be to carry out extensive AFLP analysis of field isolates from the
different VCGs from Iridaceae and a large set of isolates from VCGs from other host plant
families in order to find forma specialis specific markers. These markers can subsequently be
used to find genes specific to VCGs pathogenic to iridaceous crops.
CHAPTER 7
99
Genetic basis of physiologic races
Within our collection of isolates from iridaceous crops we have identified one VCG (0340)
harbouring five distinct physiologic (pathogenic) races (chapter 2). Although Kistler (1997)
suggests to limit usage of the term race to cultivar-level specialisation (e.g. as in f.sp.
lycopersici) an alternative term to describe the situation as we have encountered in VCG
0340 (i.e. differences in host specialisation at the crop/genus level within a clonal population)
does not exist. To use different forma specialis names, based on crop reference, could be an
alternative, but can be misleading because the designation of different formae speciales
within a single VCG is unprecedented. On the other hand, the finding that isolates with strong
differences in host preferences or host specialisation (at the plant genus level) do exist within
one VCG is very interesting scientifically. The clonal relationship between the different races
suggest that the underlying genetics might be simple, but in analogy with the discussion on
the genetics determining pathogenicity at the forma specialis level, understanding the
genetics underlying host specialisation within a VCG also requires cloning and
characterisation of the responsible genes.
A detailed phylogenetic analysis of the races within VCG 0340 would enable the construction
of an evolutionary tree within this VCG. Baayen et al. (2000) show close concordance of
sequence-based and AFLP-based phylogenetic trees. The presence of a subcluster of race 1
isolates as it appears within a larger group of race 2n isolates in the cluster analysis of AFLP
fingerprint might therefore be interpreted as an indication that race 1 has evolved from race
2n by a single evolutionary event. An extensive parsimony analysis of AFLP fingerprints
involving more primer sets and more race 1 isolates could further substantiate this hypothesis.
It would also give a picture of the evolutionary relationships between the other races within
VCG0340. If the resolution of conventional AFLP fingerprints (Vos et al., 1995) is not strong
enough for this analysis, an AFLP analysis based on the highly active transposable SINE
element Foxy, which was found to be present in many strain of F. oxysporum including a race
1 isolate from VCG0340 can be a powerful alternative (Mes et al., 2000)
Although a phylogenetic study of VCG0340 can provide clues as to how races have evolved
within this VCG, cloning the responsible genes from all races will be necessary to fully
elucidate the underlying genetics. So far no genes determining host-specificity of physiologic
races of F.oxysporum have been cloned. In F.oxysporum f.sp. lycopersici, where races are
determined by the single dominant plant resistance gene (R-gene) they have overcome,
strong circumstantial evidence has accumulated to hypothesise that cultivar-specificity of
races within this forma specialis (Mes et al., 1999a) is based on avirulence genes in a gene-
for-gene manner. Whether the occurrence of the same races in different VCGs (Elias et al.,
1993) is based on changes in the same avirulence genes, however, awaits cloning and
characterisation of these genes from the concerning isolates from different VCGs.
GENERAL DISCUSSION
100
The choice of race 1 and race 2n from VCG0340 to analyse the genetics of differences in
host-specificity of physiologic races
As mentioned above cloning and characterisation of genes responsible for host-specificity of
physiologic races is required to understand the molecular basis of race development. Within
our collection of field isolates from iridaceous crops only in VCG0340 distinct races could be
recognised. Since these races were recognised not on the basis of cultivar-specificity, but on
the basis of differences in crop-specificity or -preference plant genetics could not provide
clues as to the nature or the complexity of the genetics determining their specificity. Cluster
analysis of AFLP fingerprints in VCG 0340, however, suggested that each race possibly
originated from a single evolutionary event. The underlying genetics might therefore be
relatively simple.
We chose to perform parasexual crosses between two isolates from two different races in
VCG0340 in order to study the genetics of the difference in host-specificity. The two selected
isolates, G2 and G6, represented race 1 and race 2n respectively. They were chosen for a
number of reasons. They showed a black-and-white difference in pathogenicity to the large-
flowered gladiolus ‘Peter Pears’, while their pathogenicity to the other differential genotypes
was comparable (chapter 2). Since the main interest in resistance breeding in iridaceous
crops is in large-flowered gladiolus, studying the difference between these two isolates was
thought to have the largest chance to eventually contribute to new breeding strategies in this
crop. Isolates of both races showed almost identical RFLP patterns using the multi-copy
probe D4 from F.oxysporum f.sp. dianthi (chapter 3). At the time the two isolates G2 and G6
were selected to set up parasexual crossings RFLP data from other races within VCG 0340
had not been generated. These data and the later generated AFLP data (chapter 3) showed
that within VCG0340 race 1 and race 2n are relatively closely related, supporting the initial
choice of parental isolates. The AFLP data even suggested that a single evolutionary event
might have resulted in the development of race 1 from a race 2n ancestor, while for all other
combinations of two races in VCG 0340 no clues for a possible linear evolutionary
relationship existed.
Relevance of parasexual recombination in F.oxysporum in the natural situation
In chapter 4 we could show the occurrence of a parasexual recombination between the two
selected parental isolates under forced conditions in the laboratory. This provided us with the
desired tool to study the genetics of the difference in host-specificity. Also others (Molnár et
al., 1985b and 1990) have shown parasexual recombination in F. oxysporum under laboratory
conditions, but evidence that it also occurs under natural condition has so far not been
reported. The finding that parasexual recombination does not require protoplast fusion, but
also takes place after hyphal anastomosis (Molnár et al., 1990 and chapter 4) nevertheless
makes it likely that is occurs in nature. When the occurrence of parasexual recombination is
restricted to individuals that can easily form viable heterokaryotic mycelium (i.e. individuals
CHAPTER 7
101
belonging to the same VCG) its contribution to genetic diversity will be limited, since in a
strictly vegetatively propagating population these individuals are closely related. However,
when under natural conditions parasexual recombination leads to duplications, deletions
and/or translocations, as we observed after enforced protoplast fusion of two isolates (chapter
5), its impact on evolution within a VCG can still be significant. Although the occurrence of
viable heterokaryotic mycelium after fusion of two cells from individuals of different VCGs
is prevented by vegetative incompatibility mechanism, it might occur at very low frequencies
(Molnár et al., 1990), allowing exchange of genomic DNA between individuals of
F.oxysporum of different VCGs.
In ascomycetes vegetative incompatibility has evolved as a mechanism to prevent the
formation of viable heterokaryons between individuals originating from a sexual crossing
(Leslie, 1993; Leslie and Keller, 1996). In a native situation the primary function of
vegetative compatibility is probably simply to establish a network of hyphae in a colony
arising from a single ascospore. The advantage of a network above a branched structure of a
colony of a filamentous organism is that the integrity of the individual will be maintained
when somewhere in the colony a hyphae is broken. In a branched structure each break will
lead to the separation of the colony in two individual parts. The advantage of maintenance of
integrity of the individual colony would be the maintenance of either distribution of
metabolites and/or maintenance of communication between the cells of a colony. These
advantages are much more likely to be the evolutionary driving force for hyphal anastomosis,
rather than the allowance of parasexual recombination between two different individuals
from the same VCG.
Parasexual recombination as a tool to study molecular genetics of host-specificity
Although the importance of parasexual recombination in nature might be limited, the finding
that it occurs under laboratory conditions (chapter 4) provided us with a tool to analyse the
genetics of the difference in host specificity between the two selected isolates G2 (race 1,
pathogenic to both the large-flowered gladiolus ‘Peter Pears’ and the small-flowered
gladiolus ‘Nymph’) and G6 (race 2n, pathogenic only to ‘Nymph’). When starting these
experiments we anticipated that the difference in the host specificity of the two parental
strains, i.e. pathogenicity for ‘Peter Pears’, was determined by the presence of a single
dominant pathogenicity gene in the race 1 parent or, alternatively by a single dominant
avirulence gene in the race 2n parent. Parasexual recombination would result in reshuffling
of chromosomes leading to fusion products showing one of both parental phenotypes. Marker
analysis in combination with pulsed field electrophoresis of intact chromosomes would make
it possible to identify the chromosome on which the pathogenicity (or avirulence) gene was
located. Although recombination of the chromosome of interest might occur via spontaneous
mitotic crossing-over during the enforced parasexual process, this would be probably at low
frequencies (Bos, 1996). To get closer to the genes of interest via a map based approach high
frequencies of crossing over in the chromosome are required. This might be achieved by
GENERAL DISCUSSION
102
insertion of the two selectable markers in this chromosome as has been done for Aspergillus
niger (Debets et al., 1993). An alternative strategy, depending on the size of the chromosome
of interest would be to construct a chromosome specific cosmid library and to transform this
to the other parental isolate.
Analysis of the host-specificity of a population of parasexual recombinants of isolates G2
(race 1) and G6 (race 2n) revealed that only few fusion products showed a pathogenic
phenotype similar to one of both parents. Many showed an intermediate phenotype, being
fully pathogenic to ‘Nymph’ like both parental isolates, but displaying reduced pathogenicity
to ‘Peter Pears’ compared to the race 1 parental isolate (chapter 5). This finding showed that
full pathogenicity to ‘Peter Pears’ can not be the result of the presence of a single dominant
pathogenicity gene (or the absence of a single dominant avirulence gene), but is genetically
more complex. A representative set of 25 fusion products was subjected to extensive AFLP
analysis and PFGE in order to identify markers that could be linked to pathogenicity. The
finding that not all chromosomes could be resolved by PFGE, the occurrence of loss of (parts
of) chromosomes and duplication of chromosomes, as well as crossing-over between
heterologous chromosomes strongly complicated the analysis. Genetic analysis of parasexual
recombinants between isolates of two races could therefore not lead to the identification of a
single chromosome carrying the gene(s) responsible for the difference in pathogenicity to
‘Peter Pears’.
A dispensable genomic region associated with pathogenicity
Despite the complications encountered a large set of AFLP- and RAPD-markers could be
identified of which the presence was associated with pathogenicity to large-flowered
gladiolus ‘Peter Pears’. Southern analysis with cloned marker fragments revealed that they
possibly represent a dispensable part of the genome of the race 1 parent. Since only markers
of which the presence was positively correlated with pathogenicity to ‘Peter Pears’ it is most
likely that pathogenicity to ‘Peter Pears’ is encoded by dominant pathogenicity genes rather
than by the absence of an avirulence gene. This would be analogous to the situation in
Cochliobolus carbonum (Ahn and Walton, 1996) where all genes encoding the enzymes
necessary for the synthesis of the host-specific HC-toxin are located on a large (>0.5 Mb)
dispensable region of the genome of this pathogenic fungus. It also resembles the situation in
Nectria haematococca (anamorph: Fusarium solani) where genes responsible for the
pathogenicity to pea (Pisum sativum) are located on a 1.6-Mb dispensable chromosome. It
was remarkable that the Fot1-like transposable element that was found to be present in the
close vicinity of two markers from the putative dispensable region of the race 1 isolate,
showed homology to transposable elements present in the dispensable regions of both
Cochliobolus carbonum (Panaccione et al., 1996) and Nectria heamatococca (Enkerli et al.,
1997) (chapter 6: table 2). It needs however to be emphasised that this element is probably
present in many copies scattered all over the genome (chapter 6: figures 3 and 6) of both the
race 1 and the race 2n parent. Since this type of transposable elements are widespread in
CHAPTER 7
103
pathogenic fungi its association with dispensable regions carrying pathogenicity genes might
well be accidental.
If indeed the genes involved in pathogenicity of race 1 to ‘Peter Pears’ are located on a
dispensable genomic region, the putative single evolutionary event which had led to the
formation of race 1 from a race 2n isolate (chapter 3) might have been the horizontal transfer
of this region. Analysis of all race 1 and race 2n isolates from our collection for the presence
of the markers associated with this dispensable region could provide support for this. In fact
the two RAPD-markers associated with the putative dispensable region of isolate G2 (race 1)
were selected, because both were found to be present in a large set of race 1 field isolates, but
absent in race 2n isolates (De Haan et al., 2000 and unpublished results).
In an attempt to clone pathogenicity genes from the putative dispensable region of race 1
(chapter 6) two fragments from a cosmid clone containing two of the markers from this
region were arbitrarily chosen from a set of cosmid fragment hybridising with amplified c-
DNA ends from in vitro grown mycelium and infected corm tissue of ‘Peter Pears’. Both
fragments were sequenced, but unfortunately these sequences were also present in the race 2n
parent and hence could not contain race-1-specific pathogenicity genes. The fact that a single
cosmid clone contained sequences present in both parents, but also sequence present in the
race 1 and absent in the race 2n parent, challenged the hypothesis of the race 1 specific
dispensable region carrying pathogenicity genes. It could however be that the concerning
cosmid clone spans the border of the dispensable region. Further analysis of this cosmid and
the other three overlapping cosmid clones (chapter 6) might therefore still lead to the
identification of genes present in the race 1 isolate G2, but absent in the race 2n isolate G6.
Some of the other fragments that gave a (weak) hybridisation signal with amplified cDNA
ends (chapter 6: figure 2) might contain such genes.


105
REFERENCES
Ahn J-H and Walton JD (1996) Chromosomal organisation of TOX 2, a complex locus
controlling host-selective toxin biosynthesis in Cochliobolus carbonum. The Plant Cell
8: 887-897.
An Z, Farman ML, Budde A, Taura S, Leong SA (1996) New cosmid vectors for library
construction, chromosomal walking and restriction mapping in filamentous fungi. Gene
176: 93-96.
Apt WJ (1958) Studies on the Fusarium diseases of bulbous ornamental crops. Ph.D. Thesis,
Washington State University, Pullman, 88 pp.
Archibald FS (1998) Cloning and sequencing of a gene encoding cellobiose dehydrogenase
from Trametes versicolor. Gene 210: 211-219
Armstrong GM and Armstrong JK (1952) Physiologic races of Fusaria causing wilts of the
Cruciferae. Phytopathology 42: 255-257.
Armstrong GM and Armstrong JK (1981) Formae speciales and races of Fusarium
oxysporum causing wilt diseases. In: Nelson PE, Toussoun TA and Cook RJ (eds),
Fusarium: diseases, biology and taxonomy. Pennsylvania State University Press,
University Park, Pennsylvania, pp 391-399
Arnau J and Oliver RP (1996) Genetic analysis in the imperfect fungus Cladosporium fulvum.
The development of a map-based strategy for the cloning of genes in pathogenicity. In:
Bos CJ (ed), Fungal Genetics, Principles and Practice (Mycology series ; 13; Ed:
P.A.Lemke) Marcel Dekker, Inc., New York, pp 349-361.
Baayen RP, van Dreven F, Krijger MC and Waalwijk C (1997) Genetic diversity in Fusarium
oxysporum f.sp. dianthi and Fusarium redolens f.sp. dianthi. European Journal of Plant
Pathology 103: 395-408
Baayen RP, O’Donnell K, Waalwijk C, Bonants PJM, Cigelnik E and Roebroeck EJA (2000)
Gene genealogies and AFLP analysis within the Fusarium oxysporum complex identify
monophyletic and non-monophyletic formae speciales causing wilt and rot disease.
Phytopathology, accepted for publication
Bald JG, Suzuki T and Doyle A (1971) Pathogenicity of Fusarium oxysporum to Easter lily,
narcissus and gladiolus. Annals of applied Biology 67: 331-342
Birren B and Lai C (1993) Pulsed field gel electrophoresis. A practical guide. Academic
Press, San Diego. 253 pp
Boehm EWA, Ploetz RC and Kistler HC (1994) Statistical analysis of electrophoretic
karyotype variation among vegetative compatibility groups of Fusarium oxysporum
f.sp. cubense. Molecular Plant-Microbe Interactions.
Boerema GH and Hamers MEC (1989) Checklist for scientific names of common parasitic
fungi. Series 3b: Fungi on bulbs: Amaryllidaceae and Iridaceae. Netherlands Journal of
Plant Pathology 95: Supplement 3
REFERENCES
106
Bölker M, Böhnert HU, Braun KH, Görl J and Kahnmann R (1995) Tagging pathogenicity
genes in Ustilago maydis by restriction enzyme-mediated integration (REMI).
Molecular and General Genetics 248: 547-552
Bos CJ (1996) Somatic Recombination. In: Bos CJ (ed), Fungal Genetics, Principles and
Practice (Mycology series ; 13; Ed: P.A.Lemke). Marcel Dekker, Inc., New York, pp
73-95.
Bosland PW and Williams PH (1987) An evaluation of Fusarium oxysporum from crucifers
based on pathogenicity, isozyme polymorphism, vegetative compatibility, and
geographic origin. Canadian Journal of Botany 65: 2067-2073
Brady G, Barbara M and Iscove NN (1990) Representative in vitro cDNA amplification from
individual hemopoietic cells and colonies. Methods in molecular and cellular biology 2:
17-25
Brady G and Iscove NN (1993) Construction of cDNA libraries from single cells. Methods in
enzymology 225: 611-623
Brayford D (1996) Fusarium oxysporum f.sp. gladioli. IMI descriptions of fungi and bacteria
No. 1266. Mycopathologia 133: 47-48
Bruhn C (1955) Untersuchungen über die Fusarium-Krankheit der Gladiolen (Erreger:
Fusarium oxysporum Schl. f. gladioli [Massey] Snyder und Hansen).
Phytopathologisch Zeitschrift 25: 1-38
Buxton EW and Robertson NF (1953) The Fusarium yellows disease of gladiolus. Plant
Pathology 2: 61-64
Buxton EW (1954) Heterocaryosis and variability in Fusarium oxysporum f. gladioli
(Snyder & Hansen). Journal of General Micobiology. 10: 71-84
Buxton EW (1955a) Fusarium diseases of gladiolus. Transactions of the British mycological
Society 38: 193-201
Buxton EW (1955b) The taxonomy and variation in culture of Fusarium oxysporum from
gladiolus. Transactions of the British mycological Society 38: 202-212
Buxton EW (1956) Heterokaryosis and parasexual recombination in pathogenic strains of
Fusarium oxysporum. Journal of General Micobiology 15: 133-139
Calvi BR, Hong TJ, Findley SD and Gelbart WM (1991) Evidence for a common
evolutionary origin of inverted repeat transposons in Drosophila and plants: hobo,
Activator, and Tam3. Cell 66: 465-471
Correll JC (1991) The relationship between formae speciales, races and vegetative
compatibility groups in Fusarium oxysporum. Phytopathology 81: 1061-1064.
Corsten LCA and Denis JB (1990) Structuring interaction in two-way tables by clustering.
Biometrics 46: 207-215
Daboussi M-J, Langin T and Brygoo Y (1992) Fot1, a new family of fungal transposable
elements. Molecular and General Genetics 232: 12-16
Debets F, Swart K, Hoekstra RF and Bos CJ (1993) Genetic maps of eight linkage groups of
Aspergillus niger based on mitotic mapping. Currents Genetics 23: 47-53

REFERENCES
107
De Haan LAM, Numansen A, Roebroeck EJA and Van Doorn J (2000.) PCR detection of
Fusarium oxysporum f.sp. gladioli race 1, causal agent of Gladiolus yellows disease,
from infected corms. Plant Pathology 49: 89-100
Elias KS, Zamir D, Lichtman-Pleban T, and Katan T (1993) Population structure of Fusarium
oxysporum f.sp. lycopersici: Restriction fragment length polymorphisms provide
genetic evidence that vegetative compatibility groups is an indicator of evolutionary
origin. Molecular Plant Microbe Interaction 6: 565-572
Enkerli J, Bhatt G, Covert SF (1997) Nht1, a transposable element cloned from a dispensable
chromosome in Nectria haematococca; Molecular Plant Microbe Interaction 10 :742-
749
Farman ML, Taura S, Leong SA (1996) The Magnaporthe grisea DNA fingerprinting probe
MGR 586 contains the 3'end of an inverted repeat transposon; Molecular and General
Genetics 251:675-681
Fernandez D, Ouinten M, Tantaoui and Geiger JP (1997) Molecular records of micro-
evolution within the Algerian population of Fusarium oxysporum f.sp. albedinis during
its spread to new oases. European Journal of Plant Pathology 103: 485-490.
Forsberg JL (1955) Fusarium disease of gladiolus: Its causal agent. Illenois Natural History
Survey Bulletin 26: 447-503
Gerlach W and Nirenberg HI (1982) The genus Fusarium - a pictorial atlas. Mitteilungen aus
der Biologischen Bundesanstalt für Land- und Forstwirtschaft, Berlin-Dalhem 209:1-
409
Gerlagh M and Blok WJ (1988) Fusarium oxysporum f.sp. cucurbitacearum n.f. embracing
all formae speciales of F. oxysporum attacking cucubitaceous crops. Netherlands
Journal of Plant Pathology 94: 17-31
Glass NL and Kuldau GA (1992) Mating type and vegetative incompatibility in filamentous
ascomycetes. Annual Review of Phytopathology 30: 201-224
Gordon TR and Martyn RD (1997) The evolutionary biology of Fusarium oxysporum.
Annual Review of Phytopathology 35: 111-128
Hoekstra RF (1996) Horizontal transmission in fungal populations. In: Bos CJ (ed), Fungal
Genetics, Principles and Practice (Mycology series ; 13; Ed: P.A.Lemke). Marcel
Dekker, Inc., New York, pp 337-348
Jacobson DJ and Gordon TR (1988) vegetative compatibility and self-incompatibility within
Fusarium oxysporum f.sp. melonis. Phytopathology 78: 668-672
Jacobson DJ and Gordon TR (1990a) Further investigations of vegetative compatibility
within Fusarium oxysporum f.sp. melonis. Canadian Journal of Botany 68: 1245-1248
Jacobson DJ and Gordon TR (1990b) Variability of mitochondrial DNA as an indicator of
relationships between populations of Fusarium oxysporum f.sp. melonis. Mycological
Research 94: 734-744
Javerzat JP, Jacquier C and Barreau C (1993) Assignment of linkage groups to the
electrophoretically-separated chromosomes of the fungus Podospora ansinera. Current
Genetics 24: 219-222
REFERENCES
108
Jones JP and Woltz SS (1981) Fusarium-incited diseases of tomato and potato and their
control. In: Nelson PE, Toussoun TA and Cook RJ (eds), Fusarium: diseases, biology
and taxonomy. Pennsylvania State University Press, University Park, Pennsylvania, pp
157-168
Kachroo P, Leong SA, Chattoo BB (1994) Pot2, an inverted repeat transposon from the rice
blast fungus Magnaporthe grisea; Molecular and General Genetics 245:339-348
Katan T (1996) Vegetative-compatibility groups in populations of Fusarium oxysporum in
Israel. Phytoparacitica 24:139 (Abstract)
Katan, T (1999) Current status of vegetative compatibility groups in Fusarium oxysporum.
Phytoparasitica 27: 51-64
Katan, Y and Di Primo P (1999) Current status of vegetative compatibility groups in
Fusarium oxysporum: Supplement (1999) Phytoparasitica 27: 273-277
Katan T, Katan J, Gordon TR and Pozniak D (1994) Physiologic races and vegetative
compatibility groups of Fusarium oxysporum f.sp. melonis in Israel. Phytopathology
84: 153-157
Katan T, Zamir D, Sarfatti M and Katan J (1991) Vegetative compatibility groups and
subgroups in Fusarium oxysporum f.sp. radicis-lycopersici. Phytopathology 81: 255-
262
Kempken F and Kück U (1996) Restless, an active Ac-like transposon from the fungus
Tolypocladium inflatum: structure, expression, and al ternative RNA splicing.
Molecular and Cellular Biology 16: 6563-6572
Kim DH, Martyn RD and Magill CW (1993) Mitochondrial DNA (mtDNA) - Relatedness
among formae speciales of Fusarium oxysporum in the cucurbitaceae. Phytopathology
83: 91-97
Kim DH, Magill CW, Martyn RD (1995) Transformation of plant pathogenic fungus,
Fusarium oxysporum f.sp. niveum, to hygromycin B resistance and altered
pathogenicity. Mol. Cells 5: 658-667.
Kistler HC, Bosland PW, Benny U, Leong S and Williams PH (1987) Relatedness of strains
of Fusarium oxysporum from crucifers measured by examination of mitochondrial and
ribosomal DNA. Phytopathology 77: 1289-1293.
Kistler HC, Momol EA and Benny U (1991) Repetitive genomic sequences for determining
relatedness among strains of Fusarium oxysporum. Phytopathology 81: 331-336
Kistler HC, and Benny U (1992) Autonomisly replication plasmids and chromosome
rearrangements during transformation in Nectria haematococca. Gene 117: 81-86
Kistler HC and Miao VPW (1992) New modes of genetic change in filamentous fungi.
Annual Review of Phytopathology 30: 131-152
Kistler HC, Benny U, Boehm EWA and Katan T (1995) Genetic duplication in Fusarium
oxysporum. Current genetics 28: 173-176.
Kistler HC (1997) Genetic diversity in the plant-pathogenic fungus Fusarium oxysporum.
Phytopathology 87: 474-479
Kistler HC, Alabouvette C, Baayen RP, Bentey S, Brayford D, Coddington, A, Correll J,
Daboussi M-J, Elias K, Fernandez D, Gordon TR, Katan T, Kim HG, Leslie JF, Martyn
REFERENCES
109
RD, Migheli Q, Moore NY, O’Donell K, Ploetz RC, Rutherford MA, Summerell B,
Waalwijk C and Woo S (1998) Systematic numbering of vegetative compatibility
groups in the plant pathogenic fungus Fusarium oxysporum. Phytopathology 88: 30-32
Larkin RP, Hopkins DL and Martin FN (1990) Vegetative compatibility within Fusarium
oxysporum f.sp. niveum and its relationship to virulence, aggressiveness, and race.
Canadian Journal of Microbiology 36: 352-358
Leslie JF (1993) Fungal vegetative compatibility. Annual Review of Phytopathology 31: 127-
151
Leslie JF and Zeller KA (1996) Heterokaryon incompatibility in fungi-more than just another
way to die. J. Genet. 75: 415-424
Levis C, Fortini D, Brygoo Y (1997) Flipper, a mobile Fot1-like transposable element in
Botrytis cinerea. Molecular and General Genetics 254:674-680
Li B, Nagalla SR, Renganathan V (1996) Cloning of a cDNA encoding cellobiose
dehydrogenase, a hemoflavoenzyme from Phanerochaete chrysosporium. Applied and
Environmental Microbiology 62:1329-1335
Linderman RG (1981) Fusarium diseases of flowering crops. In: Nelson PE, Toussoun TA
and Cook RJ (eds), Fusarium: diseases, biology and taxonomy. Pennsylvania State
University Press, University Park, Pennsylvania, pp 129-141
Löffler HJM and Rumine P (1991) Virulence and vegetative compatibility of Dutch and
Italian isolates of Fusarium oxysporum f.sp. lilii. Journal of Phytopathology 132: 12-20
Löffler HJM, Straathof ThP, Mouris JR and Baayen RP (1995) Durability of resistance in lily
to basal rot: evaluation of virulence and aggressiveness among isolates of Fusarium
oxysporum f.sp. lilii.European Journal of Plant Pathology 101: 261-271
Löffler HJM, Straathof ThP, Van Rijbroek PCL and Roebroeck EJA (1997) Fusarium
resistance in Gladiolus: The development of a screening Assay. Journal of
Phytopathology 145: 465-468
Manicom BQ, Bar-Joseph M, Rosner A, Vigodsky-Haas H and Kotze JM (1987) Potential
application of random DN probes and restriction fragment length polymorphisms in the
taxonomy of the Fusaria. Phytopathology 77: 669-672
Manicom BQ and Baayen RP (1993) Restriction fragment length polymorphisms in
Fusarium oxysporum f.sp. dianthi and other fusaria from Dianthus species. Plant
Pathology 42: 851-857
Manulis S, Kogan N, Reuven M and Ben-Yephet Y (1994) Use of the RAPD technique for
identification of Fusarium oxysporum f.sp. dianthi from carnation. Phytopathology 84:
98-101
Massey LM (1922) Fusarium rot of gladiolus (Abstract). Phytopathology 12: 53
Massey LM (1926) Fusarium rot of gladiolus corms. Phytopathology 16: 509-523.
McClellan WD (1945) Pathogenicity of the vascular Fusarium of gladiolus to some
additional iridaceous plants. Phytopathology 35: 921-930
McClellan WD and Pryor RL (1957) Susceptibility of gladiolus varieties to Fusarium,
Botrytis and Curvularia. Plant Disease Reporter 41: 47-50.
REFERENCES
110
McCulloch L (1944) A vascular disease of gladiolus caused by Fusarium. Phytopathology 34:
263-287.
Mas P, Molot PM and Risser G (1981) Fusarium wilt of muskmelon. In: Nelson PE,
Toussoun TA and Cook RJ (eds), Fusarium: diseases, biology and taxonomy.
Pennsylvania State University Press, University Park, Pennsylvania, pp 169-177
Masel AM, Irwin JAG and Manners JM (1993) Mini-chromosomes of Colletotrichum spp.
Infecting several hosts species in various countries. Mycological Research 97: 852-856.
Migheli Q, Laugé R, Daviere J-M, Gerlinger C, Kaper F, Langin T and Daboussi M-J (1999)
Transposition of the autonomous Fot1 element in the filamentous fungus Fusarium
oxysporum. Genetics 151: 1005-1013
Mes JJ, Van Doorn J, Roebroeck EJA and Boonekamp PM (1994a) Detection and
identification of Fusarium oxysporum f.sp. gladioli by RFLP and RAPD analysis. In:
Schots A, Dewey FM and Oliver R (eds), Modern assays for plant pathogenic fungi:
Identification, detection and quantification (pp 63-68). CAB international, Oxford
Mes JJ, Van Doorn J, Roebroeck, EJA, Van Egmond E, Van Aartrijk J and Boonekamp PM
(1994b) Restriction fragment length polymorphisms, races and vegetative compatibility
groups within a world wide collection of Fusarium oysporum f.sp. gladioli. Plant
Pathology 43: 362-370
Mes JJ, Weststeijn EA, Herlaar F, Lambalk JJM, Wijbrandi J, Haring MA and Cornelissen
BJC(1999a) Biological and molecular characterization of Fusarium oxysporum f.sp.
lycopersici divides race 1 into separate virulence groups. Phytopathology 89: 156-160.
Mes JJ, Wit R, Testerink, CS, de Groot F, Haring MA and Cornelissen BJC(1999b) Loss of
avirulence and reduced pathogenicity of a gamma-irradiated mutant of Fusarium
oxysporum f.sp. lycopersici. Phytopathology 89: 1131-1137
Mes JJ, Haring MA and Cornelissen BJC (2000) Foxy: An active family of short interspersed
nuclear element from Fusarium oxysporum. Molecular and General Genetics. In Press
Miao VPW, Covert SF and VanEtten HD (1991) A fungal gene for antibiotic resistance on a
dispensable (“B”) chromosome. Science 254: 1773-1776.
Molnár A, Pesti M and Hornok L (1985a) Isolation, Regeneration, and fusion of Fusarium
oxysporum protoplasts. Acta Phytopathologica Academiae Scientiarum Hungarica 20:
175-182.
Molnár A, Hornok L and Pesti M (1985b) The high level of benomyl tolerance in Fusarium
oxysporum is determined by the synergistic interaction of two genes. Experimental
mycology 9: 326-333
Molnár A, Sulyok L and Hornok L (1990) Parasexual recombination between vegetative
incompatible strains in Fusarium oxysporum. Mycological Research 94: 393-398
Nelson R (1939) Two new diseases of gladioli. Gladiolus annual 1939: 32-36
Nelson PE, Horst RK and Woltz SS (1981) Fusarium diseases of ornamental plants. In:
Nelson PE, Toussoun TA and Cook RJ (eds), Fusarium: diseases, biology and
taxonomy. Pennsylvania State University Press, University Park, Pennsylvania, pp 121-
128
REFERENCES
111
Nirenberg HI (1976) Untersuchungen über die morphologische und biologische
Differenzierung in der Fusarium-sektion Liseola. Mitteilungen aus der Biologischen
Bundesanstalt für Land- und Forstwirtschaft, Berlin-Dalhem 169: 1-117
Ohri D and Khoshoo TN (1983) Cytogenetics of garden gladiolus IV. Origin and evolution of
ornamental taxa. Proceedings of the Indian National Scientific Academy B49: 279-294
Okuda M, Ikeda K, Namiki F, Nishi K and Tsuge T (1998) Tfo1: an Ac-like transposon from
the plant pathogenic fungus Fusarium oxysporum. Molecular and General Genetics
258: 599-607
Panaccione DG, Pitkin JW, Walton J and Annis SL (1996) Transposon-like sequences at the
TOX2 locus of the plant-pathogenic fungus Cochliobolus carbonum. Gene 176: 103-
109
Parlevliet JE and Zadoks JC (1977) The integrated concept of disease resistanc: a new view
including horizontal and vertical resistance in plants. Euphytica 26: 5-21
Ploetz RC and Correll JC (1988) Vegetative compatibility among races of Fusarium
oxysporum f.sp. cubense. Plant Disease 72: 325-328
Puhalla JE (1981) Genetic consideration of the genus Fusarium. In: Nelson PE, Toussoun TA
and Cook RJ (eds), Fusarium: diseases, biology and taxonomy. Pennsylvania State
University Press, University Park, Pennsylvania, pp 291-305
Puhalla JA and Spieth PT (1983) Heterokaryosis in Fusarium moniliforme. Experimental
Mycology 7: 328-335
Puhalla JE (1985) Classification of strains Fusarium oxysporum on the basis of vegetatative
compatibility. Canadian Journal of Botany 63: 179-183
Punt PJ and van den Hondel CAMJJ (1992) Transformation of filamentous fungi based on
hygromycin B and phleomycin resistance markers. Methods in Enzymology 216: 447-
457
Robertson NF (1952) Further Investigations of the “Fusarium yellows” disease of gladioli.
Gladiolus Annual 1952: 26-31
Roebroeck EJA, Groen NPA and Mes JJ (1990) Detection of latent Fusarium oxysporum in
gladiolus corms. Acta Horticulturae 266: 469-476
Roebroeck EJA and Mes JJ (1992a) Physiological races and vegetative compatibility groups
within Fusarium oxysporum f.sp. gladioli. Netherlands Journal of Plant Pathology 98:
57-64
Roebroeck EJA and Mes JJ (1992b) Biological control of Fusarium in gladiolus with non-
pathogenic Fusarium isolates. Acta Horticulturae 325: 769-779
Rosewich UL, Pettway RE, Kistler HC and Katan T (1998) Populations genetics and
micoevolution of Fusarium oxysporum f.sp. radicis-lycopersici populations from
Florida and Europe. Phytopathology 88: S77 (Abstract)
Ruettinger RT, Wen LP and Fulco AJ (1989) Coding nucleotide, 5' regulatory, and deduced
amino acid sequences of P-450BM-3, a single peptide cytochrome P-450:NADPH-P-
450 reductase from Bacillus megaterium. Journal of Biological Chemistry 264: 10978-
10995
REFERENCES
112
Sambrook J, Fritsch EF and Maniatis T (1982) Molecular cloning. A laboratory manual. 2nd
edition. Cold Spring Harbor Laboratory Press, Cold Spring Harbor, NY, USA.
Sanchez LE, Leary JV and Endo RM (1976) Heterokaryosis in Fusarium oxysporum f.sp.
lycopersici. Journal of General Micobiology 93: 219-226
Schoeder DT, Gordon TR (1993) An assessment of relatedness of subpopulations within
Fusarium oxysporum f.sp. melonis based on DNA fingerprinting. Phytopathology 83:
1346-1347 (Abstract)
Scurti, J (1952) Contributo alla conoscenza del giallume dei gladioli. Ann. Sper. Agr. 6:
1705-1714
Shi Z, Christian D and Leung H (1995) Enhanced transformation in Magnaporthe grisea by
restriction enzym mediated integration of plasmid DNA. Phytopathology 85: 329-333
Sidhu GS and Webster JM (1979) A study of heterokaryosis and its influence in Fusarium
oxysporum lycopersici. Canadian Journal of Botany 57: 548-555
Skinner DZ, Budde AD and Leong SA (1991) Molecular karyotype analysis of fungi. In:
Bennett JW and Lasure LL (eds), More gene manipulation in fungi. Acadamic Press,
Inc, San Diego, pp 87-103
Snyder WC and Hansen HN (1940) The species concept in Fusarium. American Journal of
Botany 27: 64-67
Sorokin A, Bolotin A, Purnelle B, Hilbert H, Lauber J,Dusterhoft A, Ehrlich SD (1997)
Sequence of the Bacillus subtilis genome region in the vicinity of the lev operon reveals
two new extracytoplasmic function RNA polymerase sigma factors SigV and SigZ.
Microbiology 143:2939-2943
Straathof ThP, Jansen J, Roebroeck EJA and Löffler HJM (1997a) Fusarium resistance in
Gladiolus: Selection in seedling populations. Plant Breeding 116: 283-286
Straathof, ThP, Löffler HJM, Roebroeck EJA and Linfield, CA (1997b) Breeding for
Resistance to Fusarium oxysporum in flower bulbs. Acta Horticulturae 430: 477-486
Straathof ThP, Roebroeck EJA and Löffler HJM (1998) Studies on Fusarium-Gladiolus
Interactions. Journal of Phytopathology 146: 83-88
Tantaoui A, Ouinten M, Geiger JP and Frenandez D (1996) Characterization of a single
clonal lineage of Fusarium oxysporum f.sp. albedinis causing Bayoud disease of date
palm in Morocco. Phytopathology 86: 787-792.
Tzeng T-H, Lynglolm LK , Ford CF and Bronson (1992) A restriction fragment length
polymorphism map and electrophoretic karyotype of the fungal maize pathogen
Cochliobolus heterostrophus. Genetics 139: 81-96
Van Etten H, Funnell-Baerg D, Wasmann C and McCluskey K (1994) Location of
pathogenicity genes on dispensable chromosomes in Nectria haematococca MPVI.
Antony van Leeuwenhoek Journal of Microbiology and Serology 65: 263-267
Van Raamsdonk LWD and De Vries T (1989) Biosystematic studies in European species of
Gladiolus (Iridaceae) Plant Systematics and Evolution 165: 189-198
REFERENCES
113
Vos P, Hogers R, Bleeker M, Reijans M, Van de Lee Th, Hornes M, Frijters A, Pot J,
Peleman J, Kuiper M and Zabeau M (1995) AFLP: a new technique for DNA
fingerprinting. Nucleic Acids Research 23: 4407-4414
Warren WD, Atkinson PW and O’Brochta, 1994. The Hermes transposable element from the
house fly, Musca domestica, is a short inverted repeat-type element of the hobo, Ac and
Tam3 (hAT) element family. Molecular and General Genetics 244: 1-8
Williams JG, Kubelik, AR, Livak KJ, Rafalski JA and Tingey SV (1990) DNA
polymorphisms amplified by arbitrary primers are useful as genetic markers. Nucleic
Acids Reasearch 28: 6531-6535
Yamamoto H, Uchiyama S, Nugroho FA and Sekiguchi J (1997) A 23.4 kb segment at the 69
degree - 70 degree region of the Bacillus subtilis genome. Microbiology 143:1317-1320
Xu J-R and Leslie JF (1996) A genetic map of Gibberella fujikuroi mating population A
(Fusarium moniliforme). Genetics 143: 175-189.
Zolan ME (1995) Chromosome-length polymorphism in fungi. Micobiological Reviews 59:
686-698

115
SUMMARY
The fungus Fusarium oxysporum causes serious economic losses in the cultivation of
gladiolus around the world. Crop rotation, avoidance of excess of nitrogen supply, hot-water
treatment of cormels, certification of corm lots on the basis of visual inspection and
fungicides treatment of planting material are control measures used to control the disease.
These measures, however, are not always sufficiently effective. Resistance breeding can
strongly contribute to a better control of the disease. Improvement of the certification system
requires implementation of a specific detection assay that reveals the presence of non-visible,
latent infections of the disease. Both resistance breeding and the developments of a specific
detection assay require insight in the genetic variation of the pathogen. In the first part
(chapter 2 and 3) of this thesis the characterisation of a large collection of field isolates in
terms of differences in host specialisation and genetic relationships is described. In the
second part (chapter 4,5 and 6) a further study on the molecular genetics underlying the
difference in host specialisation of two closely related isolates is described. Knowledge on
the molecular biology of host specificity might be used in the development of (molecular)
resistance breeding strategies, in further development of highly specific detection assays, in
rational improvement of existing disease control methods and in the development of novel
control strategies.
Almost one hundred field isolates of Fusarium oxysporum from gladiolus and other
iridaceous crops (iris, freesia, crocus, ixia), all considered to belong to the forma specialis
gladioli, were analysed for vegetative compatibility and for differences in host spectrum
(chapter 2). Also isolates obtained from diseased crocus corms showing so-called ‘ pseudo-
rust’ symptoms and considered to belong to a separate forma specialis (F. oxysporum f.sp.
croci) were incorporated in this study. When isolates are able to form a viable heterokaryotic
mycelium after fusion of hyphae (anastomosis) they are ‘vegetative compatible’. Within
F.oxysporum vegetative compatible isolates are generally considered to be closely related.
Vegetative compatibility between all isolates of the collection was determined by
complementation tests using different nitrate non-utilising mutants. In this way six vegetative
compatibility groups (VCG 0340-0345) were found to be present, of which two were single-
member VCGs. Some isolates were ‘self-incompatible’ and could therefore not be assigned
to one of the VCGs.
A subset of thirty-five isolates, representing all VCGs and all original host crops, were tested
for pathogenicity on small-flowered gladiolus, large-flowered gladiolus, iris, crocus and
freesia. Per crop one cultivar was used. These pathogenicity tests revealed the occurrence of
ten distinct pathotypes, each with its own virulence spectrum on the five host genotypes.
VCG 0340 contained several pathotypes, while the other VCGs contained one pathotype
each.
The ‘pseudo-rust’ isolates from crocus (F.oxysporum f.sp. croci) formed one of the
pathotypes within VCG 0340 and were pathogenic to crocus only. The other pathotypes
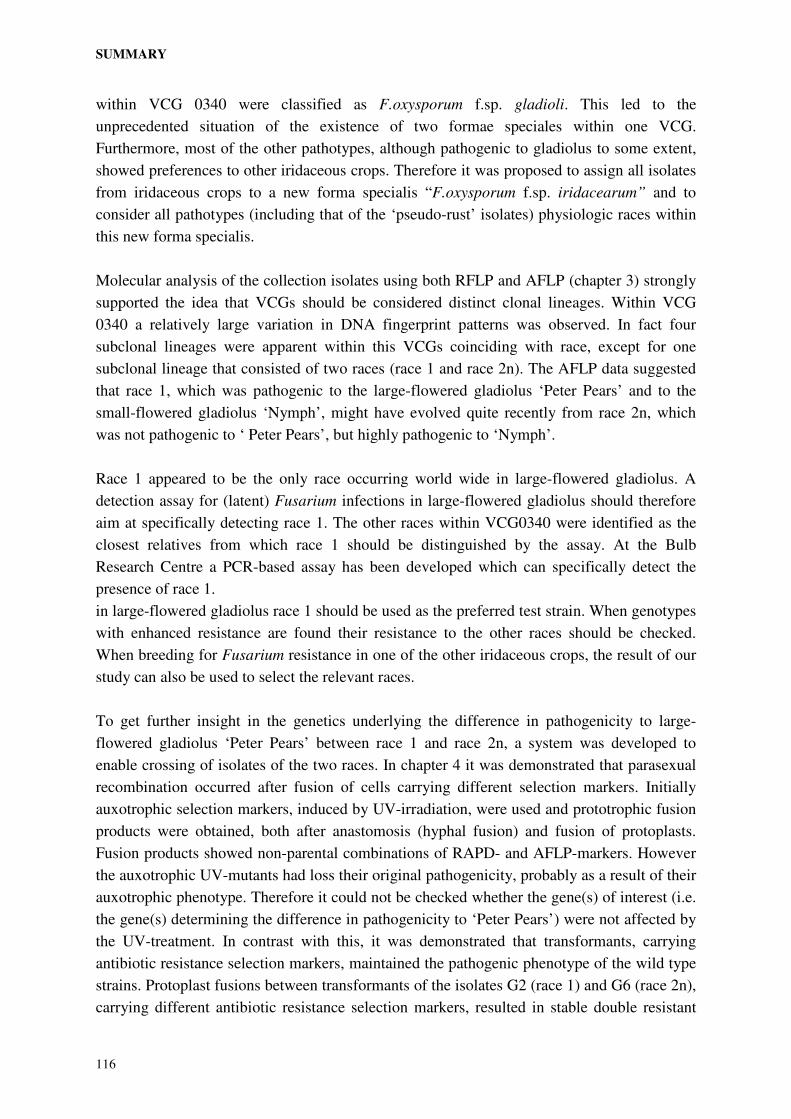
SUMMARY
116
within VCG 0340 were classified as F.oxysporum f.sp. gladioli. This led to the
unprecedented situation of the existence of two formae speciales within one VCG.
Furthermore, most of the other pathotypes, although pathogenic to gladiolus to some extent,
showed preferences to other iridaceous crops. Therefore it was proposed to assign all isolates
from iridaceous crops to a new forma specialis “F.oxysporum f.sp. iridacearum” and to
consider all pathotypes (including that of the ‘pseudo-rust’ isolates) physiologic races within
this new forma specialis.
Molecular analysis of the collection isolates using both RFLP and AFLP (chapter 3) strongly
supported the idea that VCGs should be considered distinct clonal lineages. Within VCG
0340 a relatively large variation in DNA fingerprint patterns was observed. In fact four
subclonal lineages were apparent within this VCGs coinciding with race, except for one
subclonal lineage that consisted of two races (race 1 and race 2n). The AFLP data suggested
that race 1, which was pathogenic to the large-flowered gladiolus ‘Peter Pears’ and to the
small-flowered gladiolus ‘Nymph’, might have evolved quite recently from race 2n, which
was not pathogenic to ‘ Peter Pears’, but highly pathogenic to ‘Nymph’.
Race 1 appeared to be the only race occurring world wide in large-flowered gladiolus. A
detection assay for (latent) Fusarium infections in large-flowered gladiolus should therefore
aim at specifically detecting race 1. The other races within VCG0340 were identified as the
closest relatives from which race 1 should be distinguished by the assay. At the Bulb
Research Centre a PCR-based assay has been developed which can specifically detect the
presence of race 1.
in large-flowered gladiolus race 1 should be used as the preferred test strain. When genotypes
with enhanced resistance are found their resistance to the other races should be checked.
When breeding for Fusarium resistance in one of the other iridaceous crops, the result of our
study can also be used to select the relevant races.
To get further insight in the genetics underlying the difference in pathogenicity to large-
flowered gladiolus ‘Peter Pears’ between race 1 and race 2n, a system was developed to
enable crossing of isolates of the two races. In chapter 4 it was demonstrated that parasexual
recombination occurred after fusion of cells carrying different selection markers. Initially
auxotrophic selection markers, induced by UV-irradiation, were used and prototrophic fusion
products were obtained, both after anastomosis (hyphal fusion) and fusion of protoplasts.
Fusion products showed non-parental combinations of RAPD- and AFLP-markers. However
the auxotrophic UV-mutants had loss their original pathogenicity, probably as a result of their
auxotrophic phenotype. Therefore it could not be checked whether the gene(s) of interest (i.e.
the gene(s) determining the difference in pathogenicity to ‘Peter Pears’) were not affected by
the UV-treatment. In contrast with this, it was demonstrated that transformants, carrying
antibiotic resistance selection markers, maintained the pathogenic phenotype of the wild type
strains. Protoplast fusions between transformants of the isolates G2 (race 1) and G6 (race 2n),
carrying different antibiotic resistance selection markers, resulted in stable double resistant
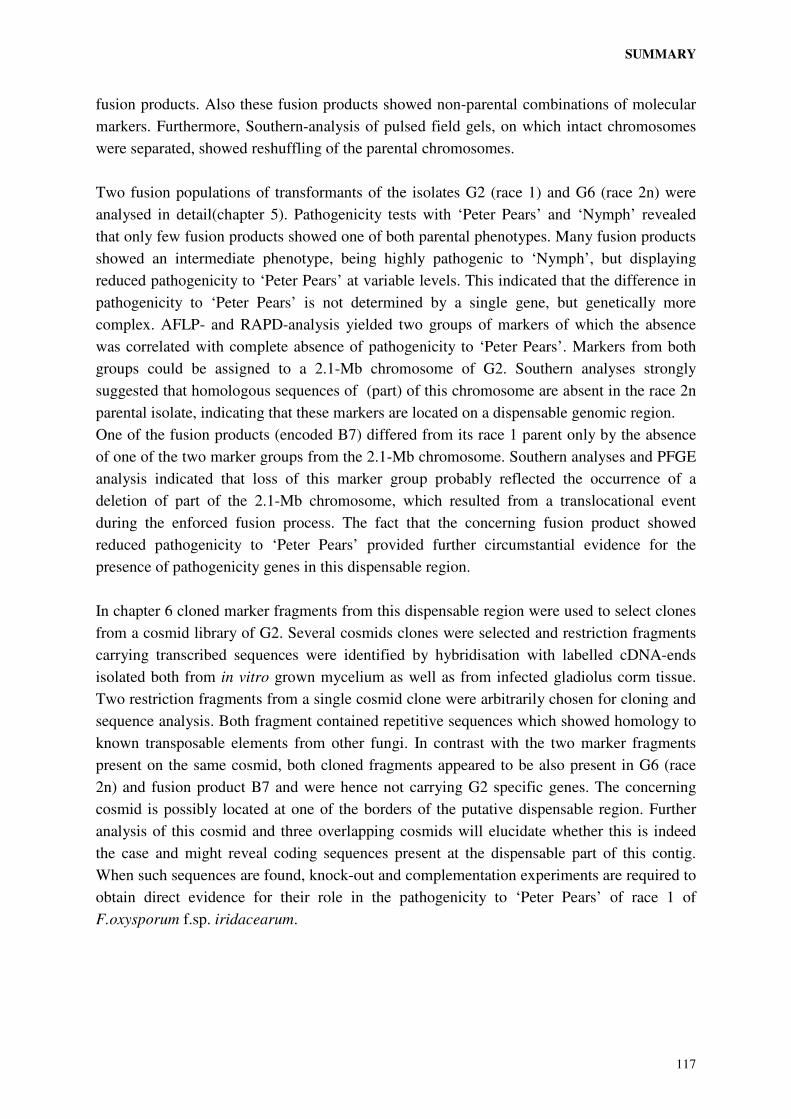
SUMMARY
117
fusion products. Also these fusion products showed non-parental combinations of molecular
markers. Furthermore, Southern-analysis of pulsed field gels, on which intact chromosomes
were separated, showed reshuffling of the parental chromosomes.
Two fusion populations of transformants of the isolates G2 (race 1) and G6 (race 2n) were
analysed in detail(chapter 5). Pathogenicity tests with ‘Peter Pears’ and ‘Nymph’ revealed
that only few fusion products showed one of both parental phenotypes. Many fusion products
showed an intermediate phenotype, being highly pathogenic to ‘Nymph’, but displaying
reduced pathogenicity to ‘Peter Pears’ at variable levels. This indicated that the difference in
pathogenicity to ‘Peter Pears’ is not determined by a single gene, but genetically more
complex. AFLP- and RAPD-analysis yielded two groups of markers of which the absence
was correlated with complete absence of pathogenicity to ‘Peter Pears’. Markers from both
groups could be assigned to a 2.1-Mb chromosome of G2. Southern analyses strongly
suggested that homologous sequences of (part) of this chromosome are absent in the race 2n
parental isolate, indicating that these markers are located on a dispensable genomic region.
One of the fusion products (encoded B7) differed from its race 1 parent only by the absence
of one of the two marker groups from the 2.1-Mb chromosome. Southern analyses and PFGE
analysis indicated that loss of this marker group probably reflected the occurrence of a
deletion of part of the 2.1-Mb chromosome, which resulted from a translocational event
during the enforced fusion process. The fact that the concerning fusion product showed
reduced pathogenicity to ‘Peter Pears’ provided further circumstantial evidence for the
presence of pathogenicity genes in this dispensable region.
In chapter 6 cloned marker fragments from this dispensable region were used to select clones
from a cosmid library of G2. Several cosmids clones were selected and restriction fragments
carrying transcribed sequences were identified by hybridisation with labelled cDNA-ends
isolated both from in vitro grown mycelium as well as from infected gladiolus corm tissue.
Two restriction fragments from a single cosmid clone were arbitrarily chosen for cloning and
sequence analysis. Both fragment contained repetitive sequences which showed homology to
known transposable elements from other fungi. In contrast with the two marker fragments
present on the same cosmid, both cloned fragments appeared to be also present in G6 (race
2n) and fusion product B7 and were hence not carrying G2 specific genes. The concerning
cosmid is possibly located at one of the borders of the putative dispensable region. Further
analysis of this cosmid and three overlapping cosmids will elucidate whether this is indeed
the case and might reveal coding sequences present at the dispensable part of this contig.
When such sequences are found, knock-out and complementation experiments are required to
obtain direct evidence for their role in the pathogenicity to ‘Peter Pears’ of race 1 of
F.oxysporum f.sp. iridacearum.

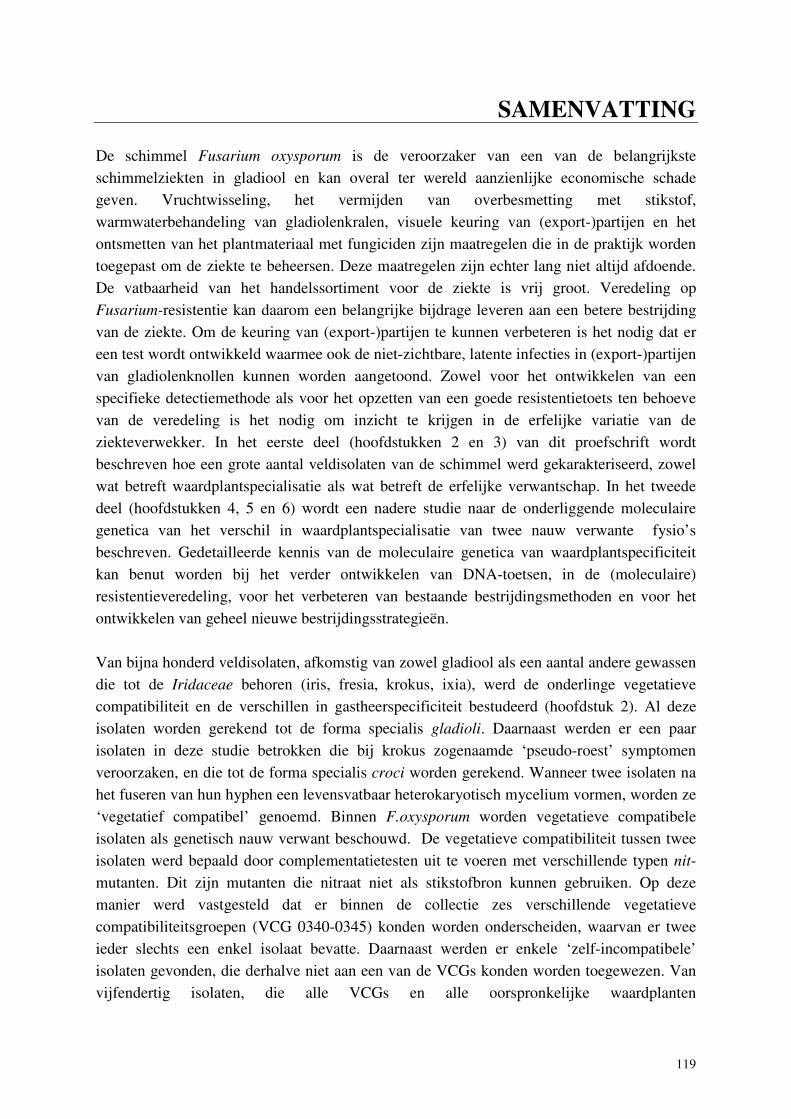
119
SAMENVATTING
De schimmel Fusarium oxysporum is de veroorzaker van een van de belangrijkste
schimmelziekten in gladiool en kan overal ter wereld aanzienlijke economische schade
geven. Vruchtwisseling, het vermijden van overbesmetting met stikstof,
warmwaterbehandeling van gladiolenkralen, visuele keuring van (export-)partijen en het
ontsmetten van het plantmateriaal met fungiciden zijn maatregelen die in de praktijk worden
toegepast om de ziekte te beheersen. Deze maatregelen zijn echter lang niet altijd afdoende.
De vatbaarheid van het handelssortiment voor de ziekte is vrij groot. Veredeling op
Fusarium-resistentie kan daarom een belangrijke bijdrage leveren aan een betere bestrijding
van de ziekte. Om de keuring van (export-)partijen te kunnen verbeteren is het nodig dat er
een test wordt ontwikkeld waarmee ook de niet-zichtbare, latente infecties in (export-)partijen
van gladiolenknollen kunnen worden aangetoond. Zowel voor het ontwikkelen van een
specifieke detectiemethode als voor het opzetten van een goede resistentietoets ten behoeve
van de veredeling is het nodig om inzicht te krijgen in de erfelijke variatie van de
ziekteverwekker. In het eerste deel (hoofdstukken 2 en 3) van dit proefschrift wordt
beschreven hoe een grote aantal veldisolaten van de schimmel werd gekarakteriseerd, zowel
wat betreft waardplantspecialisatie als wat betreft de erfelijke verwantschap. In het tweede
deel (hoofdstukken 4, 5 en 6) wordt een nadere studie naar de onderliggende moleculaire
genetica van het verschil in waardplantspecialisatie van twee nauw verwante fysio’s
beschreven. Gedetailleerde kennis van de moleculaire genetica van waardplantspecificiteit
kan benut worden bij het verder ontwikkelen van DNA-toetsen, in de (moleculaire)
resistentieveredeling, voor het verbeteren van bestaande bestrijdingsmethoden en voor het
ontwikkelen van geheel nieuwe bestrijdingsstrategieën.
Van bijna honderd veldisolaten, afkomstig van zowel gladiool als een aantal andere gewassen
die tot de Iridaceae behoren (iris, fresia, krokus, ixia), werd de onderlinge vegetatieve
compatibiliteit en de verschillen in gastheerspecificiteit bestudeerd (hoofdstuk 2). Al deze
isolaten worden gerekend tot de forma specialis gladioli. Daarnaast werden er een paar
isolaten in deze studie betrokken die bij krokus zogenaamde ‘pseudo-roest’ symptomen
veroorzaken, en die tot de forma specialis croci worden gerekend. Wanneer twee isolaten na
het fuseren van hun hyphen een levensvatbaar heterokaryotisch mycelium vormen, worden ze
‘vegetatief compatibel’ genoemd. Binnen F.oxysporum worden vegetatieve compatibele
isolaten als genetisch nauw verwant beschouwd. De vegetatieve compatibiliteit tussen twee
isolaten werd bepaald door complementatietesten uit te voeren met verschillende typen nit-
mutanten. Dit zijn mutanten die nitraat niet als stikstofbron kunnen gebruiken. Op deze
manier werd vastgesteld dat er binnen de collectie zes verschillende vegetatieve
compatibiliteitsgroepen (VCG 0340-0345) konden worden onderscheiden, waarvan er twee
ieder slechts een enkel isolaat bevatte. Daarnaast werden er enkele ‘zelf-incompatibele’
isolaten gevonden, die derhalve niet aan een van de VCGs konden worden toegewezen. Van
vijfendertig isolaten, die alle VCGs en alle oorspronkelijke waardplanten

SAMENVATTING
120
vertegenwoordigden, werd de pathogeniteit voor groot-bloemige gladiool, klein-bloemige
gladiool, iris, fresia en krokus onderzocht. Per gewas werd één cultivar gebruikt. Op basis
van dat onderzoek konden tien pathotypen worden onderscheiden, ieder met een eigen
virulentie-spectrum ten aanzien van de vijf waardplanten. Binnen VCG 0340 konden
verschillende pathotypen worden onderscheiden, terwijl de ander VCGs ieder maar één
pathotype bevatte. De ‘pseudo-roest’ isolaten van krokus (F.oxysporum f.sp. croci) waren
alleen pathogeen voor krokus en vormden een van de pathotypen binnen VCG 0340. De
andere pathotypen binnen VCG 0340 werden als F.oxysporum f.sp. gladioli geclassificeerd.
Hierdoor ontstond de situatie dat er binnen één VCG twee formae speciales voorkwamen.
Ook een aantal van de andere pathotypen, hoewel wel in enige mate pathogeen voor gladiool,
vertoonde een duidelijke voorkeur voor een van de ander gewassen. Daarom werd
voorgesteld alle isolaten uit iridaceeën toe te wijzen aan een nieuwe forma specialis
“F.oxysporum f.sp. iridacearum” en alle onderscheidde pathotypen (inclusief dat van de
‘pseudo-roest’ isolaten) als fysiologische rassen (fysio’s) binnen deze nieuwe forma specialis
te beschouwen.
Moleculaire karakterisering van de veldisolaten, waarbij zowel RFLP- als AFLP-analyse
werd gebruikt (hoofdstuk 3), bevestigde het idee dat VCGs kunnen worden beschouwd al
klonale lijnen. Binnen VCG 0340 was de variatie in de DNA-profielen relatief groot. Binnen
deze VCG konden in feite vier subklonale lijnen worden onderscheiden die samenvielen met
de fysio’s, behalve dan dat binnen een van de subklonale lijnen twee fysio’s (fysio 1 en fysio
2n) voorkwamen. De resultaten van de AFLP-analyse suggereerden dat fysio 1, dat
pathogeen is voor de zowel de groot-bloemige gladiool ‘Peter Pears’ als de klein-bloemige
gladiool ‘Nymph’, relatief recent ontstaan is uit fysio 2n, dat niet pathogeen is voor ‘Peter
Pears’, maar wel voor ‘Nymph’.
Fysio 1 bleek het enige fysio te zijn dat wereldwijd algemeen voorkomt in groot-bloemige
gladiool. Een detectietoest voor (latente) infecties in groot-bloemige gladiolenknollen zal
zich dus moeten richten op het specifiek detecteren van dit fysio. De andere fysio’s binnen
VCG 0340 bleken niet pathogeen te zijn voor de groot-bloemige gladiool ‘Peter Pears’, maar
zijn wel nauw verwant aan fysio 1. Een fysio-1-specifieke detectietoets zal fysio 1 van deze
nauw verwantte Fusarium-stammen moeten kunnen onderscheiden. Inmiddels is op het
Laboratorium van Bloembollen Onderzoek een PCR-toets ontwikkeld die specifiek de
aanwezigheid van fysio 1 kan aantonen.
Voorts kon uit de resultaten van dit onderzoek worden geconcludeerd dat, bij het uitvoeren
van resistentietoetsen bij de veredeling van groot-bloemige gladiolen, in eerste instantie fysio
1 gebruikt dient te worden. Van geselecteerde lijnen kan vervolgens de resistentie tegen de
andere fysio’s gecontroleerd worden. Voor veredeling op Fusarium-resistentie in de andere
gewassen kan eveneens op basis van de verkregen resultaten een selectie van relevante
fysio’s gemaakt worden.
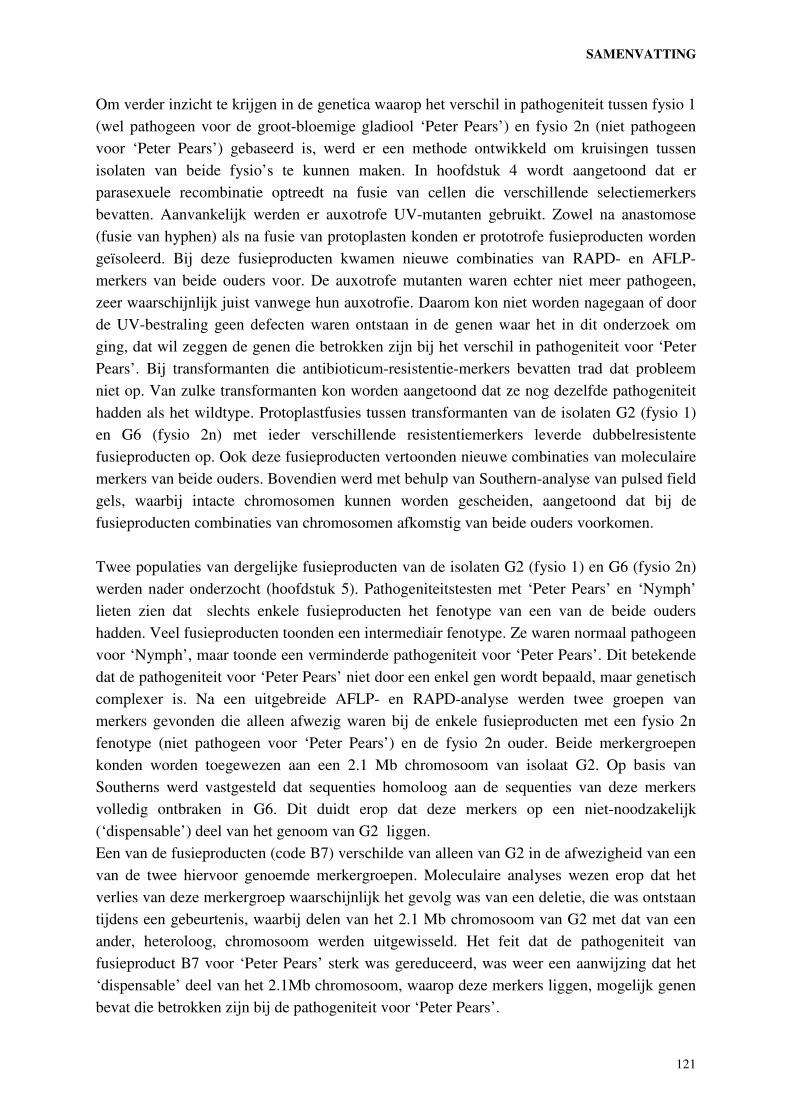
SAMENVATTING
121
Om verder inzicht te krijgen in de genetica waarop het verschil in pathogeniteit tussen fysio 1
(wel pathogeen voor de groot-bloemige gladiool ‘Peter Pears’) en fysio 2n (niet pathogeen
voor ‘Peter Pears’) gebaseerd is, werd er een methode ontwikkeld om kruisingen tussen
isolaten van beide fysio’s te kunnen maken. In hoofdstuk 4 wordt aangetoond dat er
parasexuele recombinatie optreedt na fusie van cellen die verschillende selectiemerkers
bevatten. Aanvankelijk werden er auxotrofe UV-mutanten gebruikt. Zowel na anastomose
(fusie van hyphen) als na fusie van protoplasten konden er prototrofe fusieproducten worden
geïsoleerd. Bij deze fusieproducten kwamen nieuwe combinaties van RAPD- en AFLP-
merkers van beide ouders voor. De auxotrofe mutanten waren echter niet meer pathogeen,
zeer waarschijnlijk juist vanwege hun auxotrofie. Daarom kon niet worden nagegaan of door
de UV-bestraling geen defecten waren ontstaan in de genen waar het in dit onderzoek om
ging, dat wil zeggen de genen die betrokken zijn bij het verschil in pathogeniteit voor ‘Peter
Pears’. Bij transformanten die antibioticum-resistentie-merkers bevatten trad dat probleem
niet op. Van zulke transformanten kon worden aangetoond dat ze nog dezelfde pathogeniteit
hadden als het wildtype. Protoplastfusies tussen transformanten van de isolaten G2 (fysio 1)
en G6 (fysio 2n) met ieder verschillende resistentiemerkers leverde dubbelresistente
fusieproducten op. Ook deze fusieproducten vertoonden nieuwe combinaties van moleculaire
merkers van beide ouders. Bovendien werd met behulp van Southern-analyse van pulsed field
gels, waarbij intacte chromosomen kunnen worden gescheiden, aangetoond dat bij de
fusieproducten combinaties van chromosomen afkomstig van beide ouders voorkomen.
Twee populaties van dergelijke fusieproducten van de isolaten G2 (fysio 1) en G6 (fysio 2n)
werden nader onderzocht (hoofdstuk 5). Pathogeniteitstesten met ‘Peter Pears’ en ‘Nymph’
lieten zien dat slechts enkele fusieproducten het fenotype van een van de beide ouders
hadden. Veel fusieproducten toonden een intermediair fenotype. Ze waren normaal pathogeen
voor ‘Nymph’, maar toonde een verminderde pathogeniteit voor ‘Peter Pears’. Dit betekende
dat de pathogeniteit voor ‘Peter Pears’ niet door een enkel gen wordt bepaald, maar genetisch
complexer is. Na een uitgebreide AFLP- en RAPD-analyse werden twee groepen van
merkers gevonden die alleen afwezig waren bij de enkele fusieproducten met een fysio 2n
fenotype (niet pathogeen voor ‘Peter Pears’) en de fysio 2n ouder. Beide merkergroepen
konden worden toegewezen aan een 2.1 Mb chromosoom van isolaat G2. Op basis van
Southerns werd vastgesteld dat sequenties homoloog aan de sequenties van deze merkers
volledig ontbraken in G6. Dit duidt erop dat deze merkers op een niet-noodzakelijk
(‘dispensable’) deel van het genoom van G2 liggen.
Een van de fusieproducten (code B7) verschilde van alleen van G2 in de afwezigheid van een
van de twee hiervoor genoemde merkergroepen. Moleculaire analyses wezen erop dat het
verlies van deze merkergroep waarschijnlijk het gevolg was van een deletie, die was ontstaan
tijdens een gebeurtenis, waarbij delen van het 2.1 Mb chromosoom van G2 met dat van een
ander, heteroloog, chromosoom werden uitgewisseld. Het feit dat de pathogeniteit van
fusieproduct B7 voor ‘Peter Pears’ sterk was gereduceerd, was weer een aanwijzing dat het
‘dispensable’ deel van het 2.1Mb chromosoom, waarop deze merkers liggen, mogelijk genen
bevat die betrokken zijn bij de pathogeniteit voor ‘Peter Pears’.
SAMENVATTING
122
Om dergelijke kandidaat-pathogeniteitsgenen in handen te krijgen werden gekloneerde
merkerfragmenten van de betreffende merkergroep gebruikt als probes, om klonen te
selecteren van een cosmidebank van isolaat G2 (hoofdstuk 6). Op deze wijze werden er
enkele cosmiden geselecteerd. Van deze cosmiden werden restrictiefragmenten met
coderende sequenties geïdentificeerd door hybridisatie met gelabelde cDNA-uiteinden,
afkomstig zowel van in vitro gekweekte schimmelmateriaal als van geïnfecteerde
gladiolenknollen. Er werden een aantal restrictiefragmenten gevonden die hybridiseerde met
beide typen probe-materiaal. Twee fragmenten, beide gelegen op hetzelfde cosmide, werden
willekeurig gekozen voor een nadere analyse. Ze werden gekloneerd en de basevolgorde
ervan werd bepaald. Beide fragmenten bleken repetitieve sequenties te bevatten die
homologie vertoonden met bekende transposon-elementen uit andere schimmels. In
tegenstelling tot twee merkerfragmenten die op hetzelfde cosmide lagen bleken beide
gekloneerde restrictiefragmenten echter wèl aanwezig te zijn in G6. Mogelijk overspant het
betreffende cosmide de rand van het ‘dispensable’ gebied. Verdere analyse van deze cosmide
en drie andere, er gedeeltelijk mee overlappende, cosmiden is nodig om te kunnen bewijzen
dat dit inderdaad het geval is. Dan zal ook blijken of er in het ‘dispensable’ deel van het 2.1
Mb chromosoom van G2 coderende sequenties aanwezig zijn. Als zulke sequenties worden
gevonden, dan zal door het gericht uit- en aanschakelen ervan via moleculaire weg kunnen
worden vastgesteld of ze een rol spelen in de pathogeniteit voor ‘Peter Pears’ van fysio 1 van
F.oxysporum f.sp. iridacearum.

123
LIST OF PUBLICATIONS
Roebroeck EJA, De Greeff RJM and Koster AThJ (1987) Effects of temperature and
humidity on parameters related to the wound response of lily bulb scales and their role
in control of Penicillium decay in combination with a treatment with captan. Med. Fac.
Landbouww. Rijksuniversiteit. Gent, 52 (3b): 1305-1310.
Roebroeck EJA and De Greeff RJM (1987) Histological and biochemical aspects of the
wound healing response of scales from lily bulbs and their possible role in the defence
against infection by Penicillium spp. Acta Botanica Neerlandica, 36: 326. (Abstract)
Hoffman R, Roebroeck E and Heale JB (1988) Effects of ethylene biosynthesis in carrot
slices on 6-methoxylellein accumulation and resistance to Botrytis cinerea. Physiologia
Plantarum 73: 71-76.
Roebroeck EJA, Groen NPA and Mes JJ (1990) Detection of latent Fusarium oxysporum in
gladiolus corms. Acta Horticulturae 266: 469-476
Pennock-Vos MG, Roebroeck EJA and Skrzypczak Cz (1990) Preliminary results on
biological control of Botrytis cinerea in forced tulips. Act Horticulturae 266: 425-428
Roebroeck EJA, Jansen MJW and Mes JJ (1991) A mathematical model describing the
combined effect of exposure time and temperature of hot-water treatment on survival of
gladiolus cormels. Annals of applied Biology 119: 89-96
Roebroeck EJA and Mes JJ (1992) Biological control of Fusarium in gladiolus with non-
pathogenic Fusarium isolates. Acta Horticulturae 325: 769-779
Roebroeck EJA and Mes JJ (1992) Classification of isolates of Fusarium oxysporum f.sp.
gladioli on the basis of patogenicity and vegetative compatibility. Acta Horticulturae
325: 743 (Abstract)
Roebroeck EJA and Mes JJ (1992) Physiological races and vegetative compatibility groups
within Fusarium oxysporum f.sp. gladioli. Netherlands Journal of Plant Pathology 98:
57-64
Mes JJ, Roebroeck EJA and Van Doorn J (1992) Pathogenicity, vegetative compatibility and
restriction-fragment length polymorphism in Fusarium oxysporum f.sp. gladioli. Acta
Botanica Neerlandica 41: 360 (Abstract)
Van Doorn J and Roebroeck EJA (1993) Xanthomonas campestris pv. hyacinthi: Cause of
yellow disease in Hyacinthus. In: Swings JG and Civerolo EL (eds), Xanthomonas (pp
83-91) Chapman & Hall, London etc.
Mes JJ, Van Doorn J, Roebroeck EJA and Boonekamp PM (1994) Detection and
identification of Fusarium oxysporum f.sp. gladioli by RFLP and RAPD analysis. In:
Schots A, Dewey FM and Oliver R (eds), Modern assays for plant pathogenic fungi:
Identification, detection and quantification (pp 63-68). CAB international, Oxford
Mes JJ, Van Doorn J, Roebroeck EJA, Van Egmond E, Van Aartrijk J and Boonekamp PM
(1994) Restriction fragment length polymorphisms, races and vegetative compatibility
groups within a world wide collection of Fusarium oysporum f.sp. gladioli. Plant
Pathology 43: 362-370

LIST OF PUBLICATIONS
124
Roebroeck E en Heldens J (1996) Genetische analyse van fysio's van Fusarium oxysporum
in Iridaceeën. Gewasbescherming, 27 (1), 34 (Abstract).
Löffler HJM, Straathof ThP, Van Rijbroek PCL and Roebroeck EJA (1997) Fusarium
resistance in Gladiolus: The development of a screening Assay. Journal of
Phytopathology 145: 465-468
Straathof ThP, Jansen J, Roebroeck EJA and Löffler HJM (1997) Fusarium resistance in
Gladiolus: Selection in seedling populations. Plant Breeding 116: 283-286
Straathof, ThP, Löffler HJM, Roebroeck EJA and Linfield, CA (1997). Breeding for
Resistance to Fusarium oxysporum in flower bulbs. Acta Horticulturae 430: 477-486
Straathof ThP, Roebroeck EJA and Löffler HJM (1998) Studies on Fusarium-Gladiolus
Interactions. Journal of Phytopathology 146: 83-88
Baayen RP, Förch MG, Waalwijk C, Bonants PJM, Löffler HJM and Roebroeck EJA (1998)
Pathogenic, genetic and molecular characterisation of Fusarium oxysporum f.sp. lilii.
European Journal of Plant Pathology 104: 887-894
Baayen RP, O’Donnell K, Waalwijk C, Bonants PJM, Cigelnik E and Roebroeck EJA
(1999) Phylogeny of VCGs and formae speciales of F.oxysporum and F. redolens.
Phytoparasitica 27: 71 (Abstract)
De Haan LAM, Numansen A, Roebroeck EJA and Van Doorn J (2000.) PCR detection of
Fusarium oxysporum f.sp. gladioli race 1, causal agent of Gladiolus yellows disease,
from infected corms. Plant Pathology 49: 89-100
Baayen RP, O’Donnell K, Waalwijk C, Bonants PJM, Cigelnik E and Roebroeck EJA
(2000) Gene genealogies and AFLP analysis within the Fusarium oxysporum complex
identify monophyetic and non-monophyletic formae speciales causing wilt and rot
disease. Phytopathology, accepted for publication