purecircle” or the...
TRANSCRIPT
1
PureCircle Limited
(“PureCircle” or the “Company”)
Interim results for the six months ended 31 December 2016
PureCircle (LSE: PURE) the world’s largest producer and marketer of high purity stevia today announces its unaudited interim results for the six month period from 1 July 2016 to 31 December 2016 (“1H FY17”). These results should be seen in the context of PureCircle being denied access to a market that represented a third of its revenues in 2016 as a result of PureCircle being on the US Customs & Border Protection (CBP) Withhold Release Order (WRO) list. After an extensive investigation into this issue, CBP have confirmed the removal of PureCircle from the WRO list on 30 January 2017. Whilst sales to the US have now resumed it will take some time to rebuild the previous momentum in this region.
HIGHLIGHTS - Sales were $47.2m, a decrease of 13.4%, as a direct consequence of the CBP action. Sales outside
of the US increased 10%. - Gross margin decreased 15.5% to $19.1m, with gross margin % down 1.2 points to 40.4%. - Adjusted EBITDA decreased 33.3% to $9.0m. - Net profit decreased $5.7m to a Net loss of $0.7m, generating a loss per share of $0.39 cents per
share. - Net cash from operations decreased 37.2% to $5.4m. - Net debt increased 73.8% to $80.1m. - Completion of our $42.0m production facility expansion in Kuala Lumpur. SUMMARY OF FINANCIALS
Period ended 31 December (USD’m) 1H FY17 1H FY16 Change
Sales 47.2 54.5 -13.4%
Gross margin Gross margin %
19.1 40.4%
22.6 41.6%
-15.5% -2.9%
Operating profit** 5.5 10.7 -48.6%
Adjusted EBITDA** 9.0 13.5 -33.3%
Net (loss)/ earnings for the financial period (0.7) 5.0 >-100%
(Loss)/ Earnings Per Share (fully diluted) (0.39) 2.88 >-100%
Net assets 192.5 188.0 2.4%
Operating cash flow before working capital changes 4.7 13.0 -63.8%
Net cash from Operating activities 5.4 8.6 -37.2%
Net debt 80.1 46.1 73.8%
Headroom** 74.6 72.7 2.6% ** Operating profit, adjusted EBITDA and headroom are non-GAAP alternative performance measures and are laid out on page 14 and
15. The full profit and loss account is detailed on page 5. The unaudited financial statements comprising the statement of comprehensive income and cash flow statements for the six months to 31 December 2016 (“1H FY17”) along with the statement of financial position and statement of equity as at 31 December 2016 are set out on pages 5 to 9, together with the unaudited financial statements comparatives of comprehensive income and cash flow statements for the six months to 31 December 2015 (“1H FY16”) along with the statement of financial position and statement of equity as at 31 December 2015.
Sales: Sales of $47.2m decreased 13.4% over 1H FY16 ($54.5m). Outside of the US, growth has primarily been driven by Europe and Latin America and reflects the continued positive mix benefit of the growth of Value Added and Breakthrough products. Our innovation continues to enable new Food and Beverage adoption of stevia and support continued roll-outs of products already launched.
2
Gross margin: Gross margin decreased $3.5m or 15.5% to $19.1m. Gross margin percentage of 40.4% was 1.2 percentage points (2.9%) lower than 1H FY16 (41.6%). This decline is primarily driven by lower margins on Basic Ingredients.
Adjusted EBITDA: Declined by $4.5m (-33.3%) versus the prior year. This reduction reflects $3.5m lower gross margins as a result of reduced sales and additional investment in the Sales and Marketing capability.
Net Result after Tax: 1H FY17 net result of $0.7m loss represented a $5.7m reduction on 1H FY16, of which $3.9m is accounted for by adverse foreign exchange movements.
(Loss)/ Earnings Per Share (LPS/EPS): the Group recorded a Loss Per Share of -$0.39 (1H FY16: EPS of $2.88) in 1H FY17, on a fully diluted basis.
Operating cash flow before working capital: the Group generated $4.7m of Operating cash flow before working capital in 1H FY17, $8.3m lower than the comparative period in 1H FY16, offset by an improvement in working capital of $5.3m. Net debt: Net debt of $80.1m (1H FY16: 46.1) has increased due to the investment in the expanded factory facility and decreased profitability in H1.
Headroom: The Group closed 1H FY17 with cash and bank facility headroom of $75m (1H FY16: $73m). BUSINESS DEVELOPMENTS
Market: Global obesity and diabetes epidemics continue to worsen with more than 600 million people now estimated to be obese and 415 million estimated to have diabetes, rising to an estimated 640 million by 2040. Public debate and calls for regulatory action to address these public health issues are increasing, particularly concerning the use of added sugar. At the same time, consumers are actively seeking natural sustainable ingredients, as opposed to using artificial ingredients. Most experts agree that these trends are likely to continue, and in fact, may further accelerate. Continued progress in regulatory approvals for stevia are also driving wider availability. In November 2015, India was the last major market to approve the use of stevia as a F&B ingredient, which means that globally more than 5 billion consumers now have access to products using stevia. In early 2016, Brazil approved the use of stevia as an ingredient permitted to be mixed with sugar and China and Indonesia approved the use of stevia-based flavors, opening up significant additional market potential. Importantly, all 40+ steviol glycosides are found safe for F&B applications according to US FDA and JECFA, further opening up market potential for our innovation pipeline. These trends continue to drive increased adoption of stevia by the food and beverage industry across a wider range of Food and Beverage (F&B) categories. Mintel data shows that by end CY2016 more than 11,000 F&B products had been launched in the world containing stevia since 2011, with a 5-year CAGR of 36%. These launches span all regions of the world, across both developed and developing markets. In addition, these launches span a wide range of food and beverage categories, with the strongest growth across beverages, dairy and snacks. Notably, many of these launches have been in high-awareness brands. The F&B products already launched using stevia are estimated to have the potential to support an industry with market size of more than $1billion when those products are fully rolled out and mature. The pace of F&B adoption to-date, particularly in mainstream products, coupled with consumer concerns about obesity, provide confidence that the stevia market will develop to such a size.
3
Innovation: PureCircle continues to lead stevia innovation with new products and applications designed to meet identified market needs and unlock further demand to help moderate calories naturally. We are leading the industry with category-specific taste solutions, beginning with Sigma-Dairy and Sigma Tea and added Sigma-Beverage this past November. We continued the global rollout of Zeta family of ingredients, which enable great tasting product formulations with deeper calorie reductions, with the most sugar-like tasting glycosides such as Reb M and D.
With our strong diversified customer base, our unique breadth of product innovation and application support, our global supply chain and customer support infrastructure already established, PureCircle continues to retain and build further market leadership. Production capacity expansion: The construction of the $42m expanded refinery is complete, which effectively doubles our capacity, and includes a dedicated line, specifically designed for the Zeta family of ingredients. This additional capacity allows PureCircle to take advantage of the potential sustained long term growth of the market, ensuring we meet anticipated future increased volume demand and further sustain market share.
Leaf: We have increased our investment in R&D to develop proprietary stevia strains to maximize steviol glycoside content. In addition, we continue to invest in order to enable us to expand leaf supply from Latin America and Africa. Management and systems: We continue to invest in management and information systems. On 1 November 2016, we announced the recruitment of Mr. Gary Juncosa as Chief Operating Officer. Gary will drive the optimization and management of the company’s global operations. This includes leaf sourcing, manufacturing, customer service and sustainability endeavours. In 1H FY17 we completed the implementation of the Growers module in Paraguay and Kenya of Oracle JD Edwards ERP system. Implementation of additional modules are scheduled to come on stream progressively in 2H FY17 and FY18. Board of Directors: Effective today, Peter Lai will retire as Non-Executive Director of the Company, after nine years in the role. Mr Lai will continue to work for the Group in a part-time consultancy capacity, focusing on China. Mr. John Gibney, a Non-Executive Director of the Company, will replace Mr. Lai as Audit Committee Chairman with effect from the same date. The Company’s board now comprises five non-executive and two executive directors. Commenting on Mr Lai’s retirement from the Board, Paul Selway-Swift, Chairman of PureCircle, said: “We are grateful to Peter for his significant contribution over the last nine years as a Director and as Chairman of the Audit Committee. The Company has made significant progress over the period of Peter’s stewardship; I would like to thank him on behalf of the Board for his contribution to the success of the Company. The Board is pleased that he has agreed to continue his long term involvement with the Group so we can continue to benefit from his experience and insights, particularly in China. “John will make an excellent Chairman of the Audit Committee. His breath of experience makes him ideal for this role and I am confident we will benefit greatly from his stewardship.”
4
Commenting on the 1H FY17 trading, the Group CEO Magomet Malsagov said: “I am particularly proud of the 1H FY17 results where despite being unable to service the US market, we delivered a set of results which demonstrate our resilience as a business and our expanding global footprint. During 1H FY17 all the key industry trends have continued to develop in favour of stevia. Regulators and F&B companies in all regions are being challenged to find solutions to obesity and diabetes. The emergence of sugar taxes in some countries has accelerated the search for solutions. In 1H FY17 we continued to develop our proprietary product innovation and I am delighted that our expanded production facility is ready to ensure our strong project pipeline. With access to all markets available, our strong customer relationships and the increased demand for stevia solutions by the global F&B industry, the Company is confident of significant medium to long term growth in sales and profitability”. Contacts
PureCircle Limited www.purecircle.com Magomet Malsagov, CEO via Redleaf Rakesh Sinha, CFO Redleaf Communications [email protected] Emma Kane Rebecca Sanders-Hewett
+44 20 7382 4747
David Ison A presentation to analysts will take place at 9:30am today in London. Please contact Redleaf
Communications at [email protected] for details on how to connect via a conference call
facility.
A recorded audio webcast of the presentation to analysts will be made available from 2pm today at
www.purecircle.com/investors.
This announcement is available on the Company’s website www.purecircle.com. A short video of the recent launch of our expanded refinery is available here. NOTES TO EDITORS PureCircle is the world's leading producer of high-purity stevia ingredients for the global food and beverage industry. Its mission is to encourage healthier diets around the world through the supply of natural ingredients to the global food and beverage industry. Its vision is to lead the global expansion of stevia as the next mass volume, natural-origin sweetener. PureCircle has offices around the world with the global headquarters in Kuala Lumpur, Malaysia. The Business was founded in 2002. PureCircle’s shares are listed on the Main Market of the London Stock Exchange and trade under the ticker symbol PURE. For more information, visit: www.purecircle.com.
5
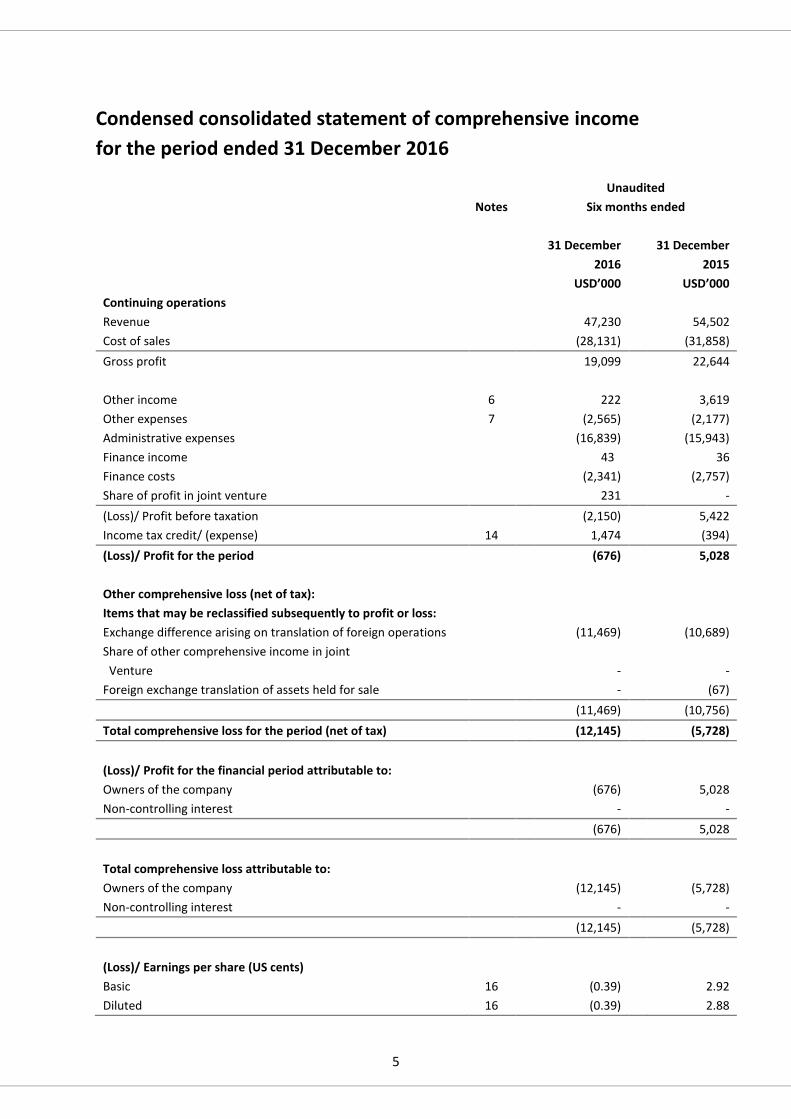
Condensed consolidated statement of comprehensive income
for the period ended 31 December 2016
Unaudited Notes Six months ended
31 December 31 December 2016 2015 USD’000 USD’000
Continuing operations
Revenue 47,230 54,502
Cost of sales (28,131) (31,858)
Gross profit 19,099 22,644
Other income 6 222 3,619
Other expenses 7 (2,565) (2,177)
Administrative expenses (16,839) (15,943)
Finance income 43 36
Finance costs (2,341) (2,757)
Share of profit in joint venture 231 -
(Loss)/ Profit before taxation (2,150) 5,422
Income tax credit/ (expense) 14 1,474 (394)
(Loss)/ Profit for the period (676) 5,028
Other comprehensive loss (net of tax):
Items that may be reclassified subsequently to profit or loss:
Exchange difference arising on translation of foreign operations (11,469) (10,689)
Share of other comprehensive income in joint
Venture - -
Foreign exchange translation of assets held for sale - (67)
(11,469) (10,756)
Total comprehensive loss for the period (net of tax) (12,145) (5,728)
(Loss)/ Profit for the financial period attributable to:
Owners of the company (676) 5,028
Non-controlling interest - -
(676) 5,028
Total comprehensive loss attributable to:
Owners of the company (12,145) (5,728)
Non-controlling interest - -
(12,145) (5,728)
(Loss)/ Earnings per share (US cents)
Basic 16 (0.39) 2.92
Diluted 16 (0.39) 2.88
6
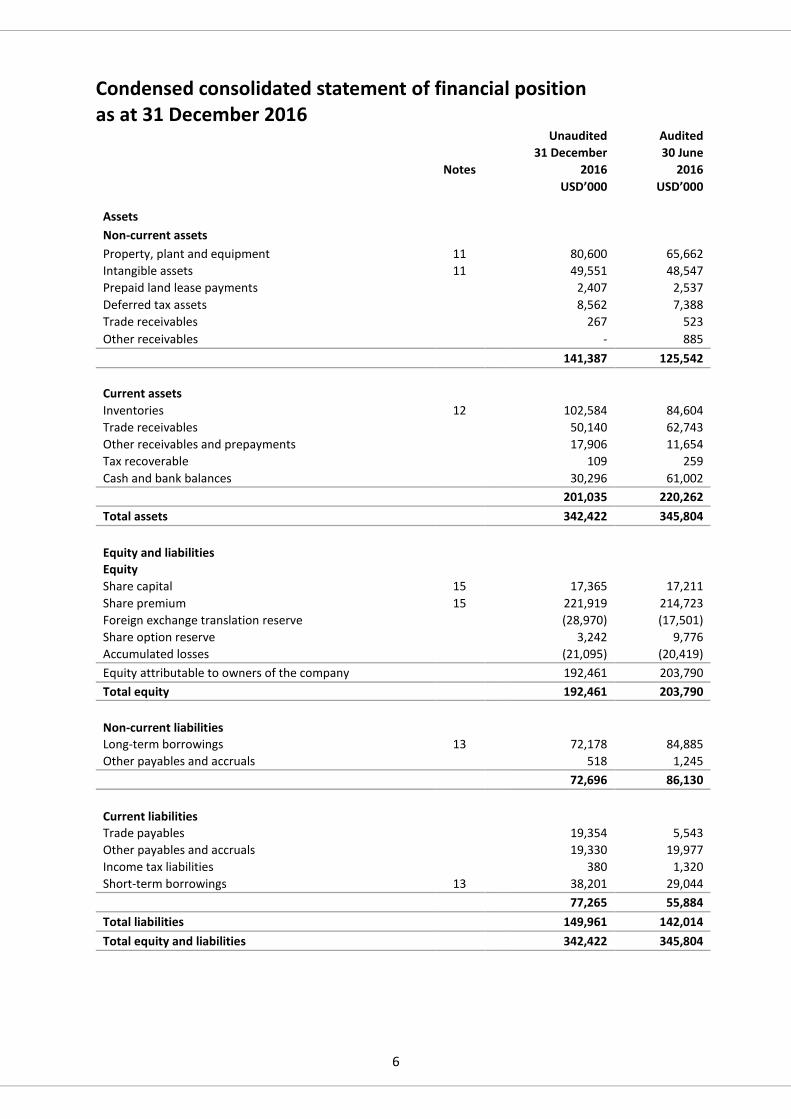
Condensed consolidated statement of financial position as at 31 December 2016
Unaudited Audited 31 December 30 June Notes 2016 2016
USD’000 USD’000
Assets
Non-current assets
Property, plant and equipment 11 80,600 65,662
Intangible assets 11 49,551 48,547
Prepaid land lease payments 2,407 2,537
Deferred tax assets 8,562 7,388
Trade receivables 267 523
Other receivables - 885
141,387 125,542
Current assets
Inventories 12 102,584 84,604
Trade receivables 50,140 62,743
Other receivables and prepayments 17,906 11,654
Tax recoverable 109 259
Cash and bank balances 30,296 61,002
201,035 220,262
Total assets 342,422 345,804
Equity and liabilities
Equity
Share capital 15 17,365 17,211
Share premium 15 221,919 214,723
Foreign exchange translation reserve (28,970) (17,501)
Share option reserve 3,242 9,776
Accumulated losses (21,095) (20,419)
Equity attributable to owners of the company 192,461 203,790
Total equity 192,461 203,790
Non-current liabilities
Long-term borrowings 13 72,178 84,885
Other payables and accruals 518 1,245
72,696 86,130
Current liabilities
Trade payables 19,354 5,543
Other payables and accruals 19,330 19,977
Income tax liabilities 380 1,320
Short-term borrowings 13 38,201 29,044
77,265 55,884
Total liabilities 149,961 142,014
Total equity and liabilities 342,422 345,804
7
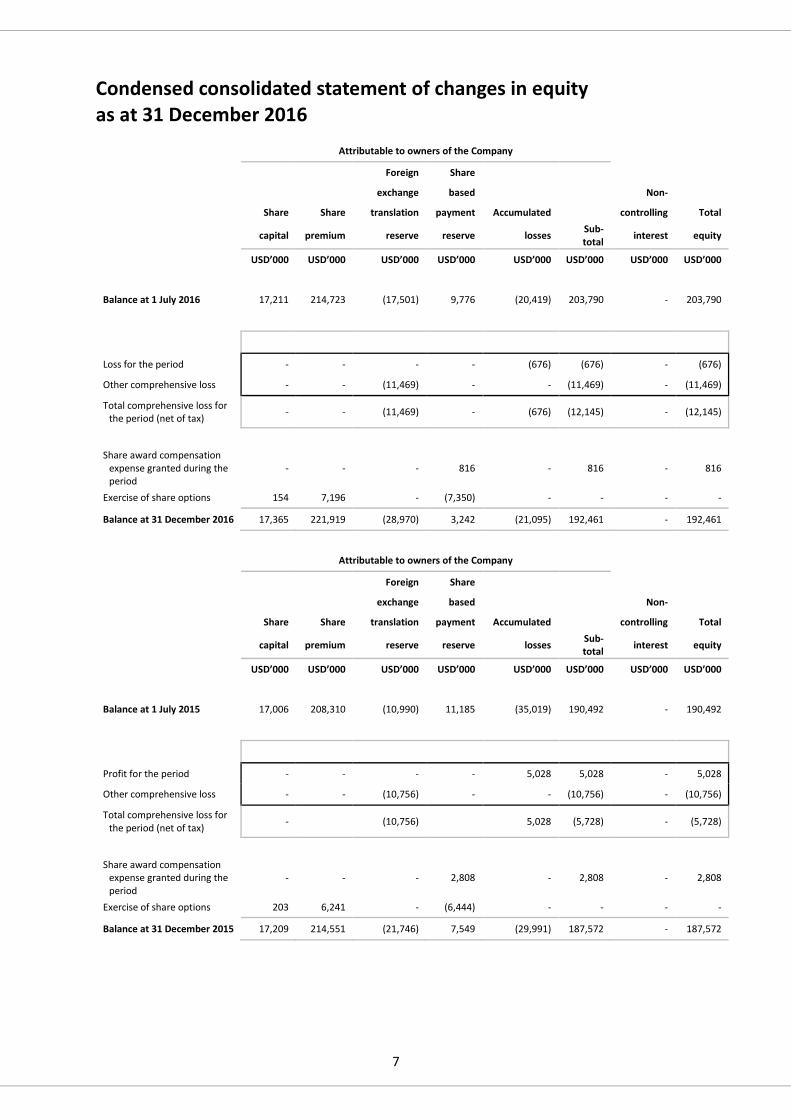
Condensed consolidated statement of changes in equity as at 31 December 2016
Attributable to owners of the Company
Foreign Share
exchange based Non-
Share Share translation payment Accumulated controlling Total
capital premium reserve reserve losses Sub-total
interest equity
USD’000 USD’000 USD’000 USD’000 USD’000 USD’000 USD’000 USD’000
Balance at 1 July 2016 17,211 214,723 (17,501) 9,776 (20,419) 203,790 - 203,790
Loss for the period - - - - (676) (676) - (676)
Other comprehensive loss - - (11,469) - - (11,469) - (11,469)
Total comprehensive loss for the period (net of tax)
- - (11,469) - (676) (12,145) - (12,145)
Share award compensation expense granted during the period
- - - 816 - 816 - 816
Exercise of share options 154 7,196 - (7,350) - - - -
Balance at 31 December 2016 17,365 221,919 (28,970) 3,242 (21,095) 192,461 - 192,461
Attributable to owners of the Company
Foreign Share
exchange based Non-
Share Share translation payment Accumulated controlling Total
capital premium reserve reserve losses Sub-total
interest equity
USD’000 USD’000 USD’000 USD’000 USD’000 USD’000 USD’000 USD’000
Balance at 1 July 2015 17,006 208,310 (10,990) 11,185 (35,019) 190,492 - 190,492
Profit for the period - - - - 5,028 5,028 - 5,028
Other comprehensive loss - - (10,756) - - (10,756) - (10,756)
Total comprehensive loss for the period (net of tax)
- (10,756) 5,028 (5,728) - (5,728)
Share award compensation expense granted during the period
- - - 2,808 - 2,808 - 2,808
Exercise of share options 203 6,241 - (6,444) - - - -
Balance at 31 December 2015 17,209 214,551 (21,746) 7,549 (29,991) 187,572 - 187,572
8
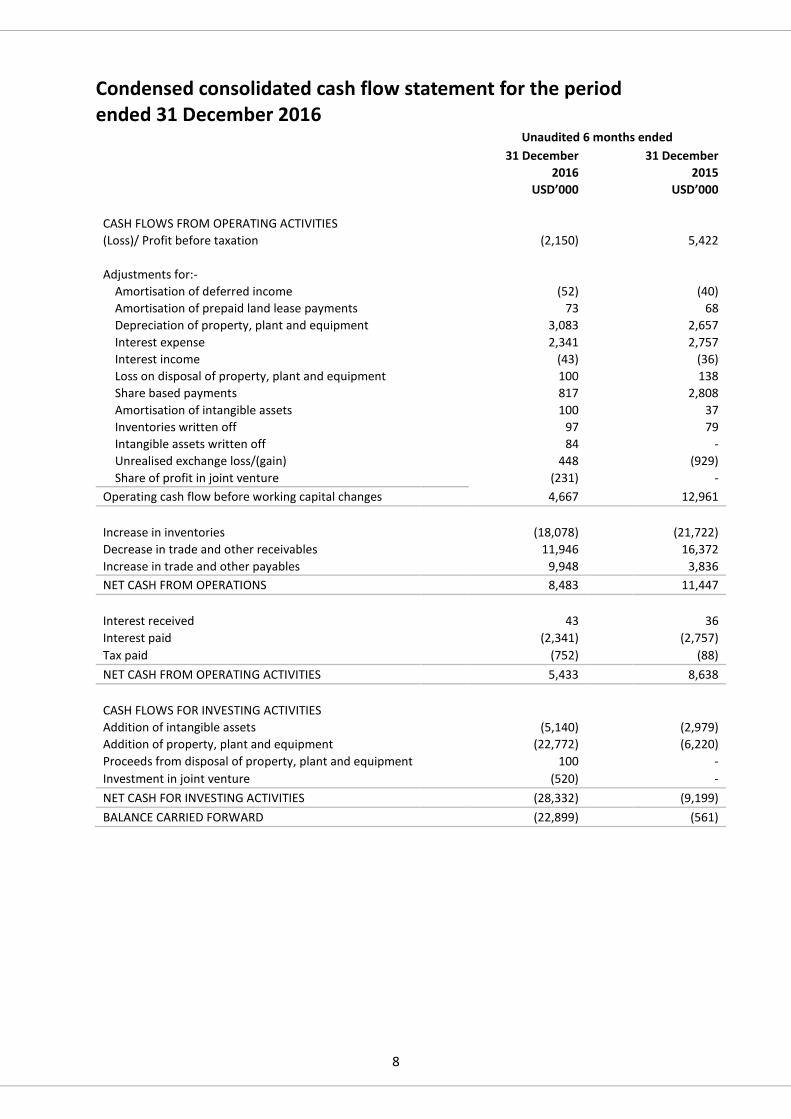
Condensed consolidated cash flow statement for the period ended 31 December 2016
Unaudited 6 months ended 31 December 31 December 2016 2015 USD’000 USD’000
CASH FLOWS FROM OPERATING ACTIVITIES
(Loss)/ Profit before taxation (2,150) 5,422
Adjustments for:-
Amortisation of deferred income (52) (40)
Amortisation of prepaid land lease payments 73 68
Depreciation of property, plant and equipment 3,083 2,657
Interest expense 2,341 2,757
Interest income (43) (36)
Loss on disposal of property, plant and equipment 100 138
Share based payments 817 2,808
Amortisation of intangible assets 100 37
Inventories written off 97 79
Intangible assets written off 84 -
Unrealised exchange loss/(gain) 448 (929)
Share of profit in joint venture (231) -
Operating cash flow before working capital changes 4,667 12,961
Increase in inventories (18,078) (21,722)
Decrease in trade and other receivables 11,946 16,372
Increase in trade and other payables 9,948 3,836
NET CASH FROM OPERATIONS 8,483 11,447
Interest received 43 36
Interest paid (2,341) (2,757)
Tax paid (752) (88)
NET CASH FROM OPERATING ACTIVITIES 5,433 8,638
CASH FLOWS FOR INVESTING ACTIVITIES
Addition of intangible assets (5,140) (2,979)
Addition of property, plant and equipment (22,772) (6,220)
Proceeds from disposal of property, plant and equipment 100 -
Investment in joint venture (520) -
NET CASH FOR INVESTING ACTIVITIES (28,332) (9,199)
BALANCE CARRIED FORWARD (22,899) (561)
9
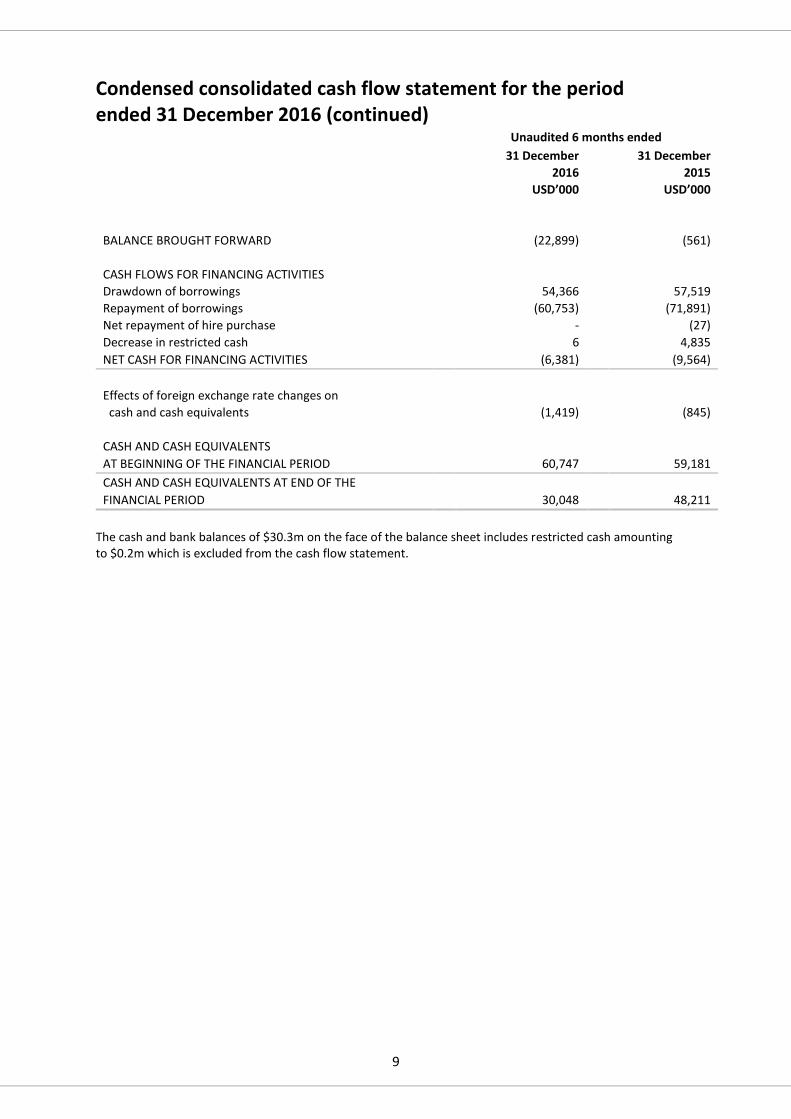
Condensed consolidated cash flow statement for the period ended 31 December 2016 (continued)
Unaudited 6 months ended 31 December 31 December 2016 2015 USD’000 USD’000
BALANCE BROUGHT FORWARD (22,899) (561)
CASH FLOWS FOR FINANCING ACTIVITIES
Drawdown of borrowings 54,366 57,519
Repayment of borrowings (60,753) (71,891)
Net repayment of hire purchase - (27)
Decrease in restricted cash 6 4,835
NET CASH FOR FINANCING ACTIVITIES (6,381) (9,564)
Effects of foreign exchange rate changes on
cash and cash equivalents (1,419) (845)
CASH AND CASH EQUIVALENTS
AT BEGINNING OF THE FINANCIAL PERIOD 60,747 59,181
CASH AND CASH EQUIVALENTS AT END OF THE
FINANCIAL PERIOD 30,048 48,211
The cash and bank balances of $30.3m on the face of the balance sheet includes restricted cash amounting to $0.2m which is excluded from the cash flow statement.
10
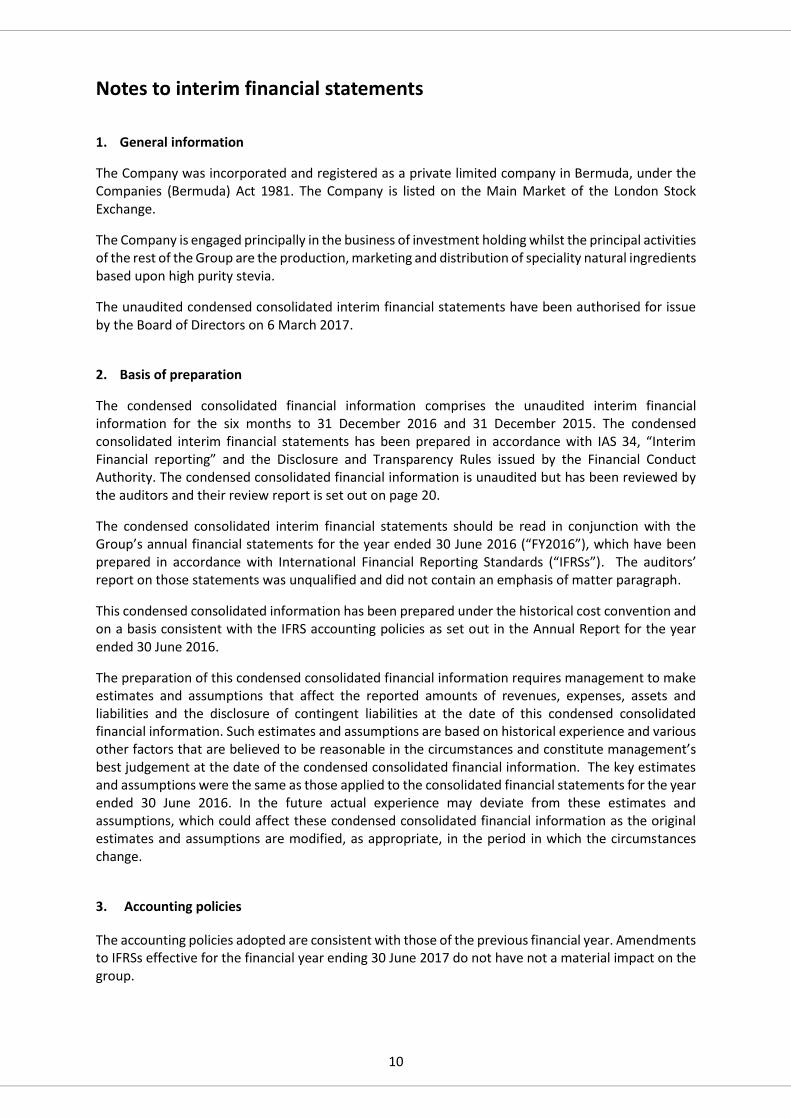
Notes to interim financial statements
1. General information
The Company was incorporated and registered as a private limited company in Bermuda, under the Companies (Bermuda) Act 1981. The Company is listed on the Main Market of the London Stock Exchange.
The Company is engaged principally in the business of investment holding whilst the principal activities of the rest of the Group are the production, marketing and distribution of speciality natural ingredients based upon high purity stevia.
The unaudited condensed consolidated interim financial statements have been authorised for issue by the Board of Directors on 6 March 2017.
2. Basis of preparation
The condensed consolidated financial information comprises the unaudited interim financial information for the six months to 31 December 2016 and 31 December 2015. The condensed consolidated interim financial statements has been prepared in accordance with IAS 34, “Interim Financial reporting” and the Disclosure and Transparency Rules issued by the Financial Conduct Authority. The condensed consolidated financial information is unaudited but has been reviewed by the auditors and their review report is set out on page 20.
The condensed consolidated interim financial statements should be read in conjunction with the Group’s annual financial statements for the year ended 30 June 2016 (“FY2016”), which have been prepared in accordance with International Financial Reporting Standards (“IFRSs”). The auditors’ report on those statements was unqualified and did not contain an emphasis of matter paragraph.
This condensed consolidated information has been prepared under the historical cost convention and on a basis consistent with the IFRS accounting policies as set out in the Annual Report for the year ended 30 June 2016.
The preparation of this condensed consolidated financial information requires management to make estimates and assumptions that affect the reported amounts of revenues, expenses, assets and liabilities and the disclosure of contingent liabilities at the date of this condensed consolidated financial information. Such estimates and assumptions are based on historical experience and various other factors that are believed to be reasonable in the circumstances and constitute management’s best judgement at the date of the condensed consolidated financial information. The key estimates and assumptions were the same as those applied to the consolidated financial statements for the year ended 30 June 2016. In the future actual experience may deviate from these estimates and assumptions, which could affect these condensed consolidated financial information as the original estimates and assumptions are modified, as appropriate, in the period in which the circumstances change.
3. Accounting policies
The accounting policies adopted are consistent with those of the previous financial year. Amendments to IFRSs effective for the financial year ending 30 June 2017 do not have not a material impact on the group.
11
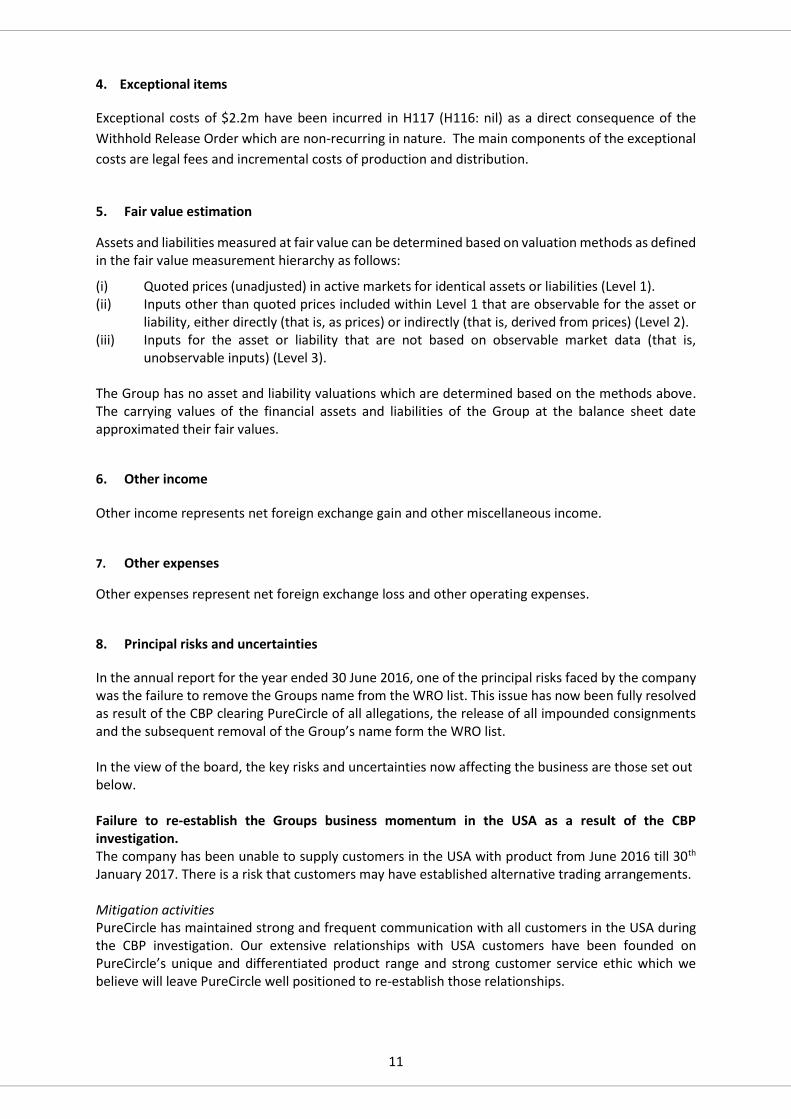
4. Exceptional items
Exceptional costs of $2.2m have been incurred in H117 (H116: nil) as a direct consequence of the
Withhold Release Order which are non-recurring in nature. The main components of the exceptional
costs are legal fees and incremental costs of production and distribution.
5. Fair value estimation
Assets and liabilities measured at fair value can be determined based on valuation methods as defined in the fair value measurement hierarchy as follows:
(i) Quoted prices (unadjusted) in active markets for identical assets or liabilities (Level 1). (ii) Inputs other than quoted prices included within Level 1 that are observable for the asset or
liability, either directly (that is, as prices) or indirectly (that is, derived from prices) (Level 2). (iii) Inputs for the asset or liability that are not based on observable market data (that is,
unobservable inputs) (Level 3).
The Group has no asset and liability valuations which are determined based on the methods above. The carrying values of the financial assets and liabilities of the Group at the balance sheet date approximated their fair values.
6. Other income
Other income represents net foreign exchange gain and other miscellaneous income.
7. Other expenses
Other expenses represent net foreign exchange loss and other operating expenses.
8. Principal risks and uncertainties
In the annual report for the year ended 30 June 2016, one of the principal risks faced by the company was the failure to remove the Groups name from the WRO list. This issue has now been fully resolved as result of the CBP clearing PureCircle of all allegations, the release of all impounded consignments and the subsequent removal of the Group’s name form the WRO list. In the view of the board, the key risks and uncertainties now affecting the business are those set out below. Failure to re-establish the Groups business momentum in the USA as a result of the CBP investigation. The company has been unable to supply customers in the USA with product from June 2016 till 30th January 2017. There is a risk that customers may have established alternative trading arrangements. Mitigation activities PureCircle has maintained strong and frequent communication with all customers in the USA during the CBP investigation. Our extensive relationships with USA customers have been founded on PureCircle’s unique and differentiated product range and strong customer service ethic which we believe will leave PureCircle well positioned to re-establish those relationships.
12
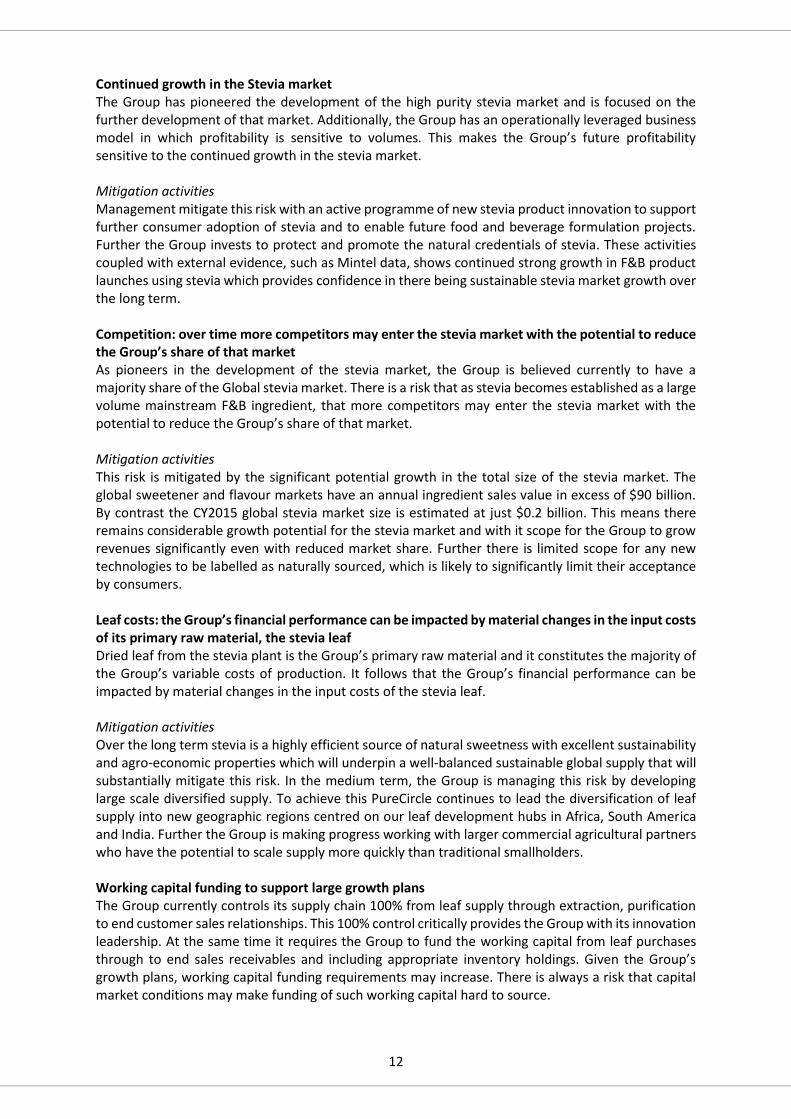
Continued growth in the Stevia market The Group has pioneered the development of the high purity stevia market and is focused on the further development of that market. Additionally, the Group has an operationally leveraged business model in which profitability is sensitive to volumes. This makes the Group’s future profitability sensitive to the continued growth in the stevia market. Mitigation activities Management mitigate this risk with an active programme of new stevia product innovation to support further consumer adoption of stevia and to enable future food and beverage formulation projects. Further the Group invests to protect and promote the natural credentials of stevia. These activities coupled with external evidence, such as Mintel data, shows continued strong growth in F&B product launches using stevia which provides confidence in there being sustainable stevia market growth over the long term. Competition: over time more competitors may enter the stevia market with the potential to reduce the Group’s share of that market As pioneers in the development of the stevia market, the Group is believed currently to have a majority share of the Global stevia market. There is a risk that as stevia becomes established as a large volume mainstream F&B ingredient, that more competitors may enter the stevia market with the potential to reduce the Group’s share of that market. Mitigation activities This risk is mitigated by the significant potential growth in the total size of the stevia market. The global sweetener and flavour markets have an annual ingredient sales value in excess of $90 billion. By contrast the CY2015 global stevia market size is estimated at just $0.2 billion. This means there remains considerable growth potential for the stevia market and with it scope for the Group to grow revenues significantly even with reduced market share. Further there is limited scope for any new technologies to be labelled as naturally sourced, which is likely to significantly limit their acceptance by consumers. Leaf costs: the Group’s financial performance can be impacted by material changes in the input costs of its primary raw material, the stevia leaf Dried leaf from the stevia plant is the Group’s primary raw material and it constitutes the majority of the Group’s variable costs of production. It follows that the Group’s financial performance can be impacted by material changes in the input costs of the stevia leaf. Mitigation activities Over the long term stevia is a highly efficient source of natural sweetness with excellent sustainability and agro-economic properties which will underpin a well-balanced sustainable global supply that will substantially mitigate this risk. In the medium term, the Group is managing this risk by developing large scale diversified supply. To achieve this PureCircle continues to lead the diversification of leaf supply into new geographic regions centred on our leaf development hubs in Africa, South America and India. Further the Group is making progress working with larger commercial agricultural partners who have the potential to scale supply more quickly than traditional smallholders. Working capital funding to support large growth plans The Group currently controls its supply chain 100% from leaf supply through extraction, purification to end customer sales relationships. This 100% control critically provides the Group with its innovation leadership. At the same time it requires the Group to fund the working capital from leaf purchases through to end sales receivables and including appropriate inventory holdings. Given the Group’s growth plans, working capital funding requirements may increase. There is always a risk that capital market conditions may make funding of such working capital hard to source.
13
Mitigation activities The Group manages its working capital growth risk actively through a suite of ongoing policies. These include operational policies to ensure balance between supply purchases, inventory holdings and forecast sales cash flows; that maintains appropriate gross cash and facility headroom availability at all times; and that works actively to build and maintain bank and equity relationships Concentrated production capacity As pioneers in the development of the stevia industry it is inevitable that for a certain period in its development the Group’s production capacity will be concentrated into specific facilities. This situation will continue until such time as demand volumes warrant the construction of more diversified production capacity. During this period the Group is at risk of catastrophic event impacting either of its production facilities. Mitigation activities The Group manages this risk actively through a variety of policies and practices. The Group has a policy of holding high levels of finished goods specifically and inventory generally relative to sales levels; and management work closely with larger customers to ensure that their inventory holdings are appropriate; the production facilities are designed on a modular basis so as to reduce the likelihood of any one event impacting more than a proportion of the total facility Management: As pioneers in the development of the stevia industry, the Group is reliant upon the performance of highly skilled personnel including its senior management team Stevia is a relatively new industry, in consequence the talent pool of management with the skills and experience of working in the stevia market is smaller than that in other more established industries. Mitigation activities The Group manages this risk by ongoing investment in senior management retention programmes for all key managers, including the Group’s Long Term Incentive Programme (LTIP). Managing growth: the Group has significant growth plans, which will require more complex execution skills and processes The Group has grown significantly (by over 205%) across the last five years and has plans to continue to do so. With such levels of growth comes the challenges of managing a more complex business including a diverse customer base and an expanded product portfolio. Mitigation activities The Group manages these risks by investing heavily in appropriately skilled senior management and in global management information systems including the roll out of Oracle’s JD Edwards global Enterprise Resource Planning (ERP) management information system. Managing health and safety The Group operates in the food ingredient industry and operates a food grade supply chain, including large production facilities. As a result health and safety considerations are a significant operating factor for the Group’s business. Mitigation activities The Group manages its health and safety requirements actively through a combination of strategy,
design, policy and process management. The Group’s strategy is to be in full compliance with all health
and safety requirements at all times across the Group; our supply chain, including production
configuration, is designed to support this strategy and operating policies and processes are structured
to re-inforce compliance on an ongoing basis.
14
Liquidity
Due to the temporary impact on our earnings caused by the WRO and the increased level of net debt,
the risk of covenant breach has increased in the period. As at 31 December we confirm that we are
fully compliant with all of our financing covenants and expect to remain so in the foreseeable future.
Mitigating activities
Management mitigates this risk through closely monitoring net debt and taking actions to improve
the Group’s working capital. The Group has a disciplined forecasting process to monitor compliance
with the covenants in place.
The removal of PureCircle from the US CBP WRO list in January 2017 means the Group now has
unrestricted access to the US market. Refer to mitigating activities above relating to re-establishing
the Group’s momentum in the US market.
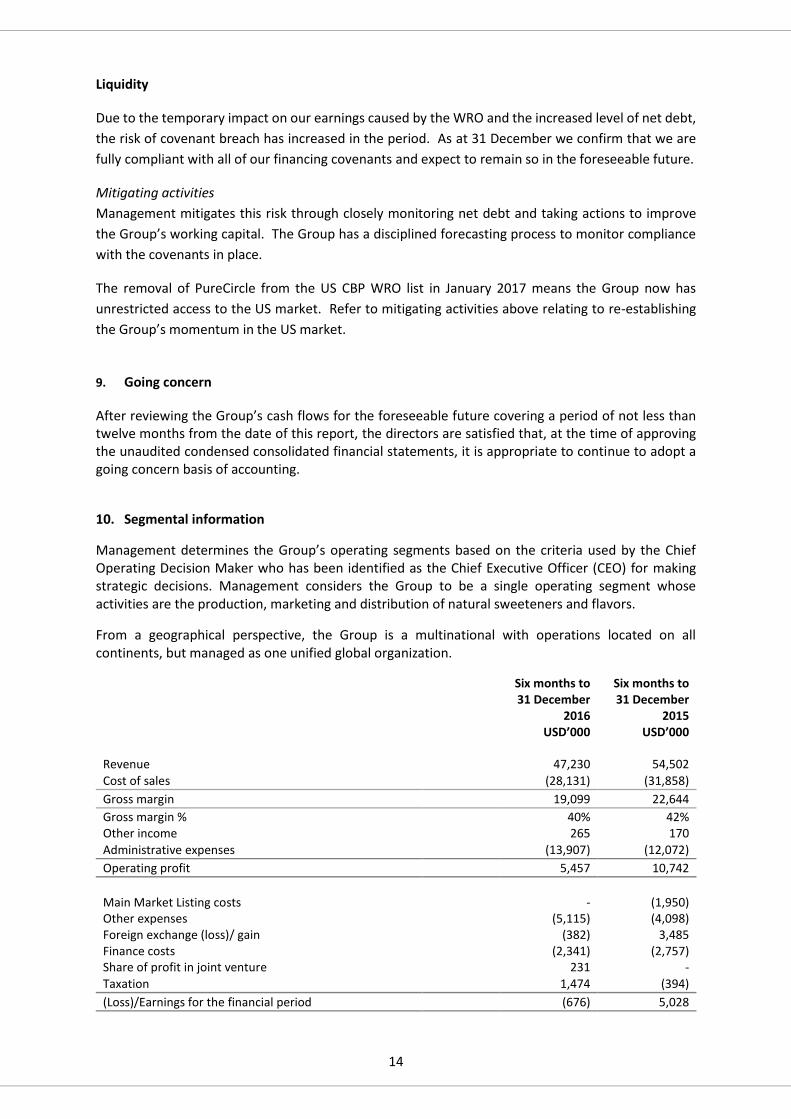
9. Going concern
After reviewing the Group’s cash flows for the foreseeable future covering a period of not less than twelve months from the date of this report, the directors are satisfied that, at the time of approving the unaudited condensed consolidated financial statements, it is appropriate to continue to adopt a going concern basis of accounting.
10. Segmental information
Management determines the Group’s operating segments based on the criteria used by the Chief Operating Decision Maker who has been identified as the Chief Executive Officer (CEO) for making strategic decisions. Management considers the Group to be a single operating segment whose activities are the production, marketing and distribution of natural sweeteners and flavors.
From a geographical perspective, the Group is a multinational with operations located on all continents, but managed as one unified global organization.
Six months to 31 December
Six months to 31 December
2016 2015 USD’000 USD’000
Revenue 47,230 54,502
Cost of sales (28,131) (31,858)
Gross margin 19,099 22,644
Gross margin % 40% 42% Other income 265 170
Administrative expenses (13,907) (12,072)
Operating profit 5,457 10,742
Main Market Listing costs - (1,950) Other expenses (5,115) (4,098) Foreign exchange (loss)/ gain (382) 3,485 Finance costs (2,341) (2,757) Share of profit in joint venture 231 -
Taxation 1,474 (394)
(Loss)/Earnings for the financial period (676) 5,028
15
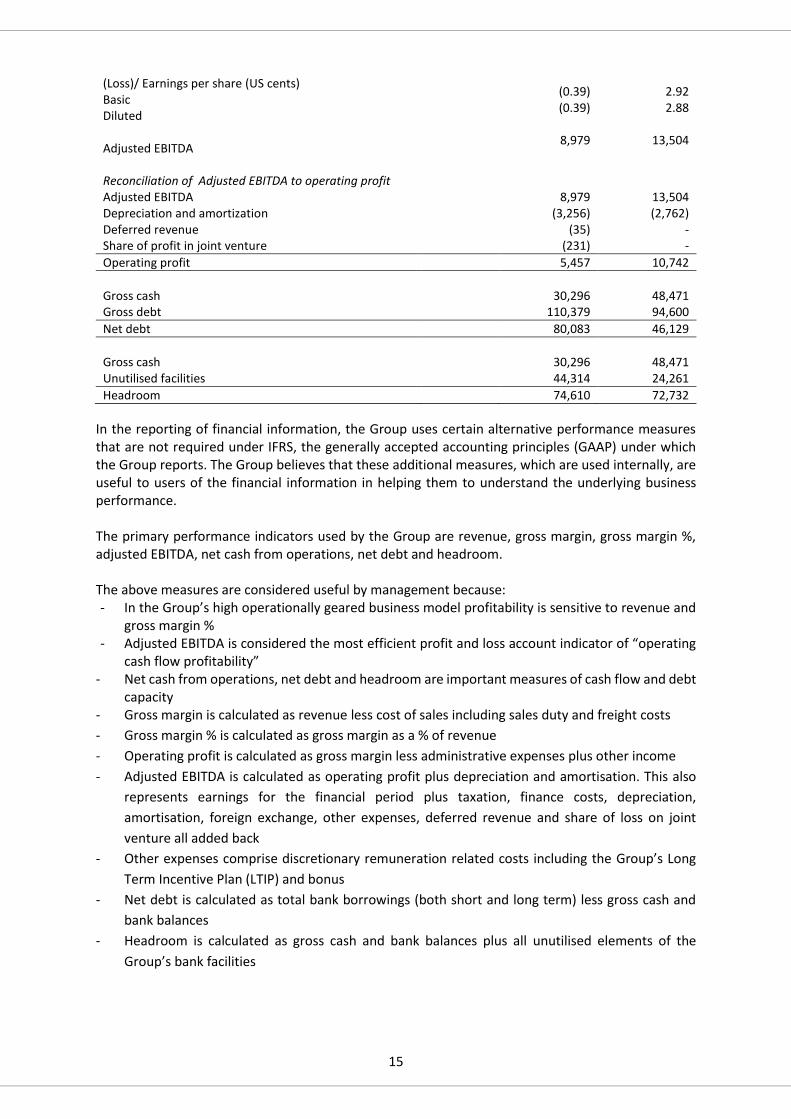
(Loss)/ Earnings per share (US cents) Basic Diluted Adjusted EBITDA
(0.39) (0.39)
8,979
2.92 2.88
13,504
Reconciliation of Adjusted EBITDA to operating profit Adjusted EBITDA 8,979 13,504 Depreciation and amortization (3,256) (2,762) Deferred revenue (35) - Share of profit in joint venture (231) -
Operating profit 5,457 10,742
Gross cash 30,296 48,471 Gross debt 110,379 94,600
Net debt 80,083 46,129
Gross cash 30,296 48,471 Unutilised facilities 44,314 24,261
Headroom 74,610 72,732
In the reporting of financial information, the Group uses certain alternative performance measures that are not required under IFRS, the generally accepted accounting principles (GAAP) under which the Group reports. The Group believes that these additional measures, which are used internally, are useful to users of the financial information in helping them to understand the underlying business performance. The primary performance indicators used by the Group are revenue, gross margin, gross margin %, adjusted EBITDA, net cash from operations, net debt and headroom. The above measures are considered useful by management because: - In the Group’s high operationally geared business model profitability is sensitive to revenue and
gross margin % - Adjusted EBITDA is considered the most efficient profit and loss account indicator of “operating
cash flow profitability” - Net cash from operations, net debt and headroom are important measures of cash flow and debt
capacity - Gross margin is calculated as revenue less cost of sales including sales duty and freight costs
- Gross margin % is calculated as gross margin as a % of revenue
- Operating profit is calculated as gross margin less administrative expenses plus other income
- Adjusted EBITDA is calculated as operating profit plus depreciation and amortisation. This also
represents earnings for the financial period plus taxation, finance costs, depreciation,
amortisation, foreign exchange, other expenses, deferred revenue and share of loss on joint
venture all added back
- Other expenses comprise discretionary remuneration related costs including the Group’s Long
Term Incentive Plan (LTIP) and bonus
- Net debt is calculated as total bank borrowings (both short and long term) less gross cash and
bank balances
- Headroom is calculated as gross cash and bank balances plus all unutilised elements of the
Group’s bank facilities
16
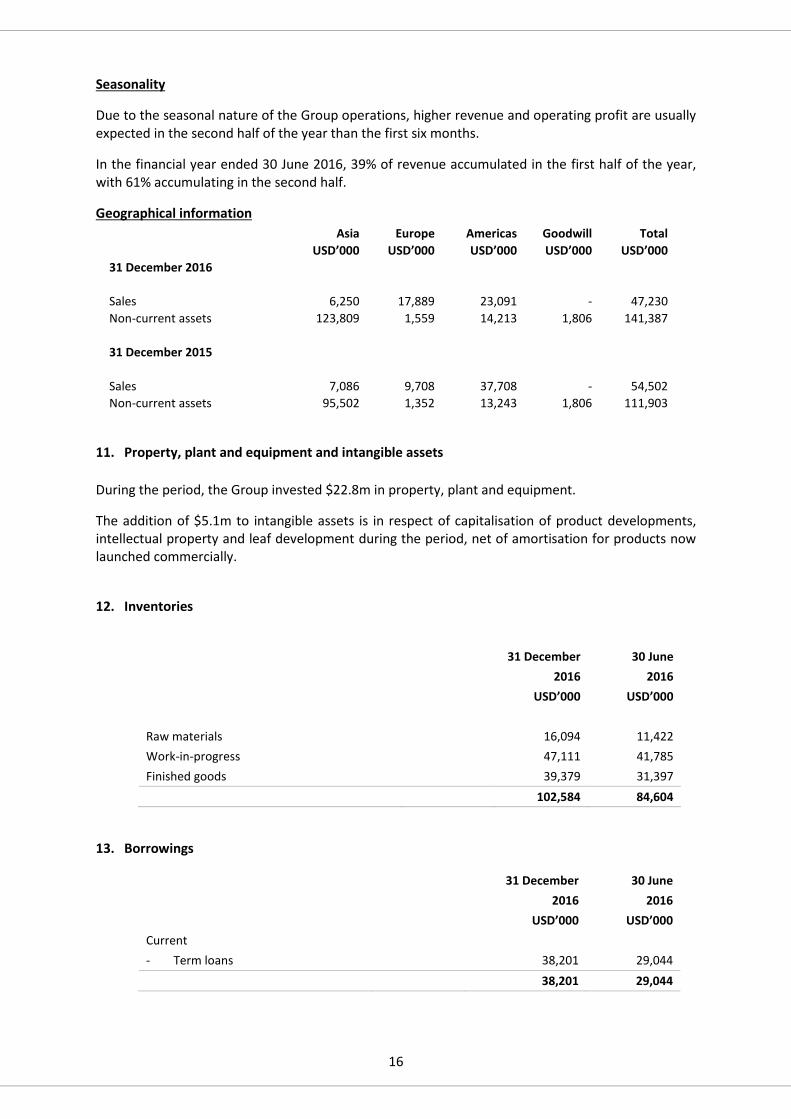
Seasonality
Due to the seasonal nature of the Group operations, higher revenue and operating profit are usually expected in the second half of the year than the first six months.
In the financial year ended 30 June 2016, 39% of revenue accumulated in the first half of the year, with 61% accumulating in the second half.
Geographical information Asia Europe Americas Goodwill Total USD’000 USD’000 USD’000 USD’000 USD’000
31 December 2016
Sales 6,250 17,889 23,091 - 47,230
Non-current assets 123,809 1,559 14,213 1,806 141,387
31 December 2015
Sales 7,086 9,708 37,708 - 54,502
Non-current assets 95,502 1,352 13,243 1,806 111,903
11. Property, plant and equipment and intangible assets
During the period, the Group invested $22.8m in property, plant and equipment.
The addition of $5.1m to intangible assets is in respect of capitalisation of product developments, intellectual property and leaf development during the period, net of amortisation for products now launched commercially.
12. Inventories
31 December 30 June 2016 2016 USD’000 USD’000
Raw materials 16,094 11,422
Work-in-progress 47,111 41,785
Finished goods 39,379 31,397 102,584 84,604
13. Borrowings
31 December 30 June 2016 2016 USD’000 USD’000
Current
- Term loans 38,201 29,044 38,201 29,044
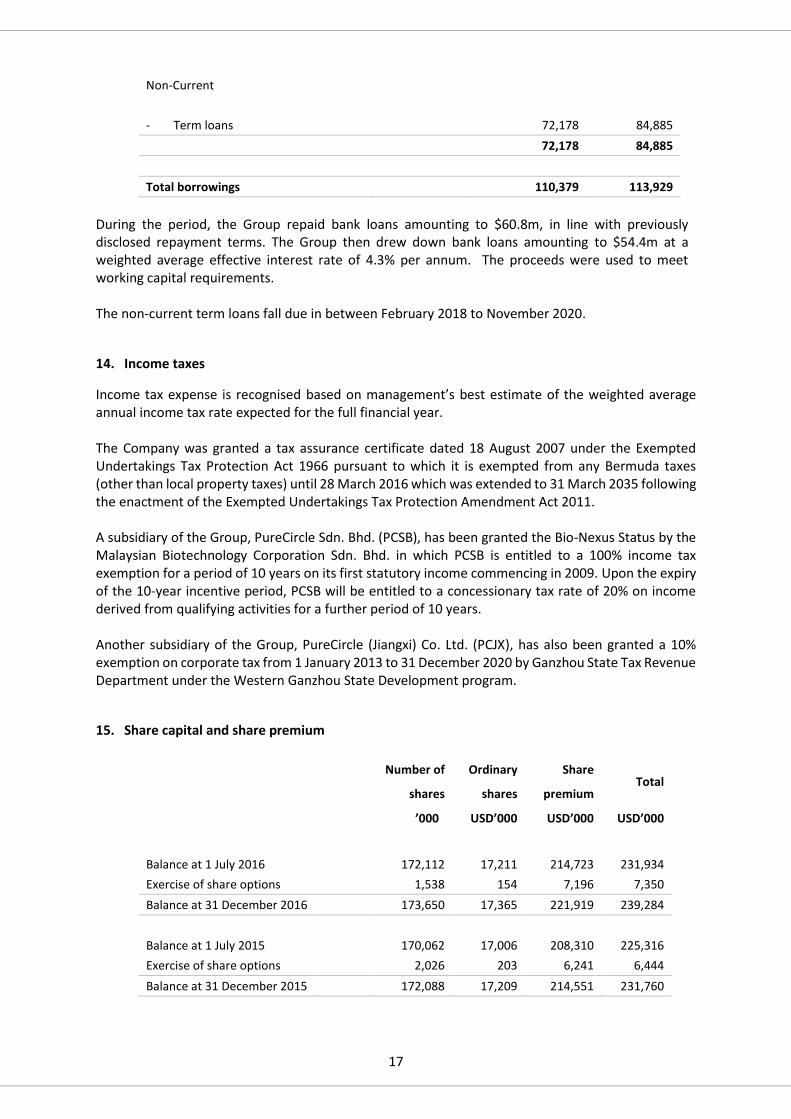
17
Non-Current
- Term loans 72,178 84,885 72,178 84,885
Total borrowings 110,379 113,929
During the period, the Group repaid bank loans amounting to $60.8m, in line with previously disclosed repayment terms. The Group then drew down bank loans amounting to $54.4m at a weighted average effective interest rate of 4.3% per annum. The proceeds were used to meet working capital requirements. The non-current term loans fall due in between February 2018 to November 2020.
14. Income taxes
Income tax expense is recognised based on management’s best estimate of the weighted average annual income tax rate expected for the full financial year.
The Company was granted a tax assurance certificate dated 18 August 2007 under the Exempted Undertakings Tax Protection Act 1966 pursuant to which it is exempted from any Bermuda taxes (other than local property taxes) until 28 March 2016 which was extended to 31 March 2035 following the enactment of the Exempted Undertakings Tax Protection Amendment Act 2011.
A subsidiary of the Group, PureCircle Sdn. Bhd. (PCSB), has been granted the Bio-Nexus Status by the Malaysian Biotechnology Corporation Sdn. Bhd. in which PCSB is entitled to a 100% income tax exemption for a period of 10 years on its first statutory income commencing in 2009. Upon the expiry of the 10-year incentive period, PCSB will be entitled to a concessionary tax rate of 20% on income derived from qualifying activities for a further period of 10 years.
Another subsidiary of the Group, PureCircle (Jiangxi) Co. Ltd. (PCJX), has also been granted a 10% exemption on corporate tax from 1 January 2013 to 31 December 2020 by Ganzhou State Tax Revenue Department under the Western Ganzhou State Development program.
15. Share capital and share premium
Number of
shares
Ordinary
shares
Share
premium Total
’000 USD’000 USD’000 USD’000
Balance at 1 July 2016 172,112 17,211 214,723 231,934
Exercise of share options 1,538 154 7,196 7,350
Balance at 31 December 2016 173,650 17,365 221,919 239,284
Balance at 1 July 2015 170,062 17,006 208,310 225,316
Exercise of share options 2,026 203 6,241 6,444
Balance at 31 December 2015 172,088 17,209 214,551 231,760
18
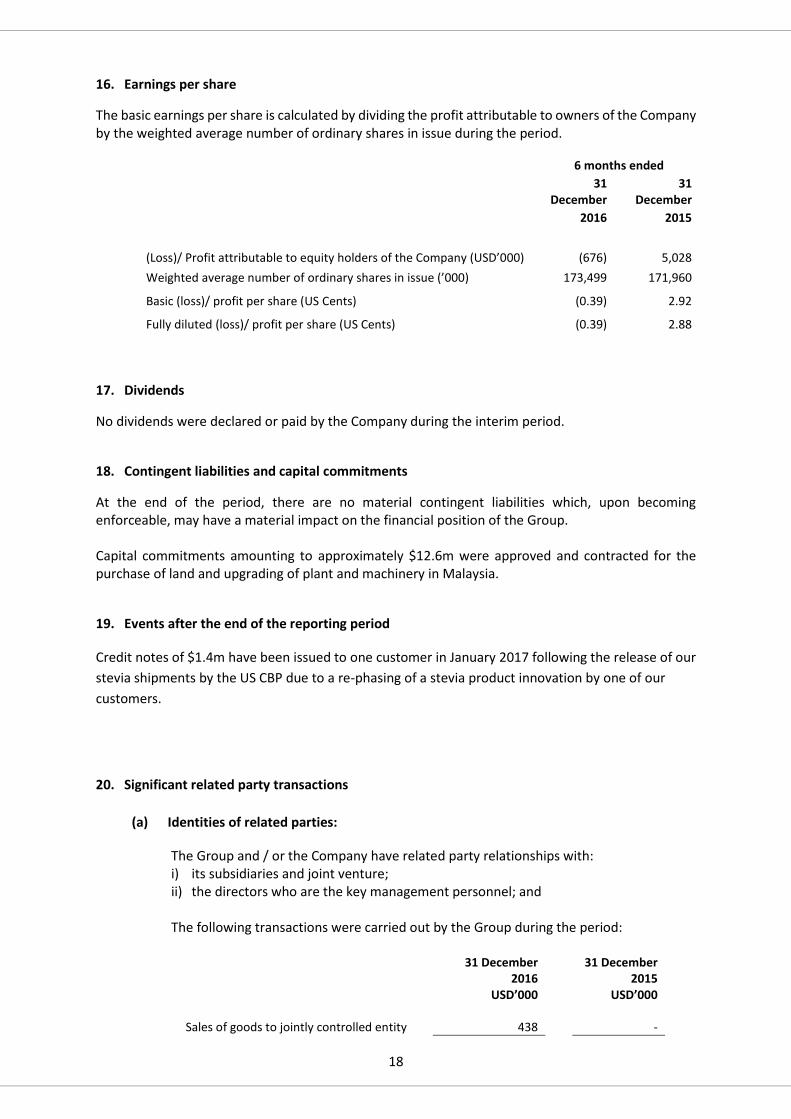
16. Earnings per share
The basic earnings per share is calculated by dividing the profit attributable to owners of the Company by the weighted average number of ordinary shares in issue during the period.
6 months ended
31
December 31
December 2016 2015
(Loss)/ Profit attributable to equity holders of the Company (USD’000) (676) 5,028
Weighted average number of ordinary shares in issue (’000) 173,499 171,960
Basic (loss)/ profit per share (US Cents) (0.39) 2.92
Fully diluted (loss)/ profit per share (US Cents) (0.39) 2.88
17. Dividends
No dividends were declared or paid by the Company during the interim period.
18. Contingent liabilities and capital commitments
At the end of the period, there are no material contingent liabilities which, upon becoming enforceable, may have a material impact on the financial position of the Group.
Capital commitments amounting to approximately $12.6m were approved and contracted for the purchase of land and upgrading of plant and machinery in Malaysia.
19. Events after the end of the reporting period
Credit notes of $1.4m have been issued to one customer in January 2017 following the release of our
stevia shipments by the US CBP due to a re-phasing of a stevia product innovation by one of our
customers.
20. Significant related party transactions
(a) Identities of related parties:
The Group and / or the Company have related party relationships with: i) its subsidiaries and joint venture; ii) the directors who are the key management personnel; and
The following transactions were carried out by the Group during the period:
31 December 31 December 2016 2015
USD’000 USD’000
Sales of goods to jointly controlled entity 438 -
19
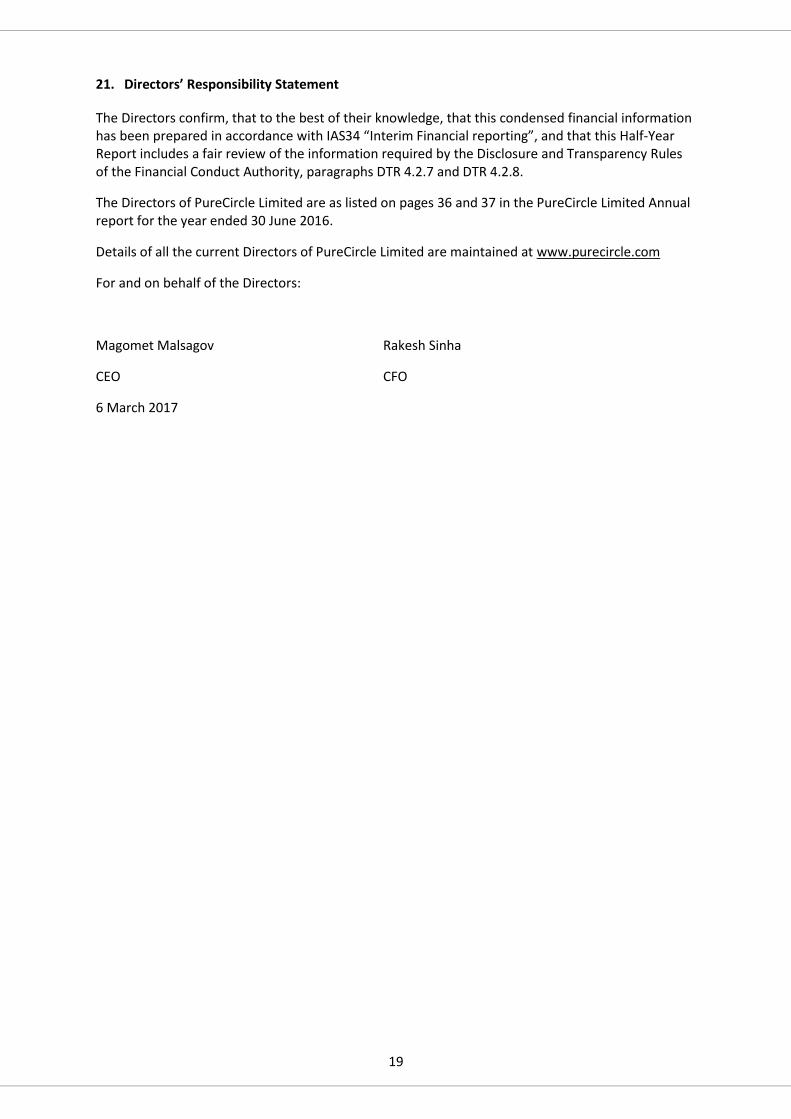
21. Directors’ Responsibility Statement
The Directors confirm, that to the best of their knowledge, that this condensed financial information has been prepared in accordance with IAS34 “Interim Financial reporting”, and that this Half-Year Report includes a fair review of the information required by the Disclosure and Transparency Rules of the Financial Conduct Authority, paragraphs DTR 4.2.7 and DTR 4.2.8.
The Directors of PureCircle Limited are as listed on pages 36 and 37 in the PureCircle Limited Annual report for the year ended 30 June 2016.
Details of all the current Directors of PureCircle Limited are maintained at www.purecircle.com
For and on behalf of the Directors:
Magomet Malsagov Rakesh Sinha
CEO CFO
6 March 2017
20
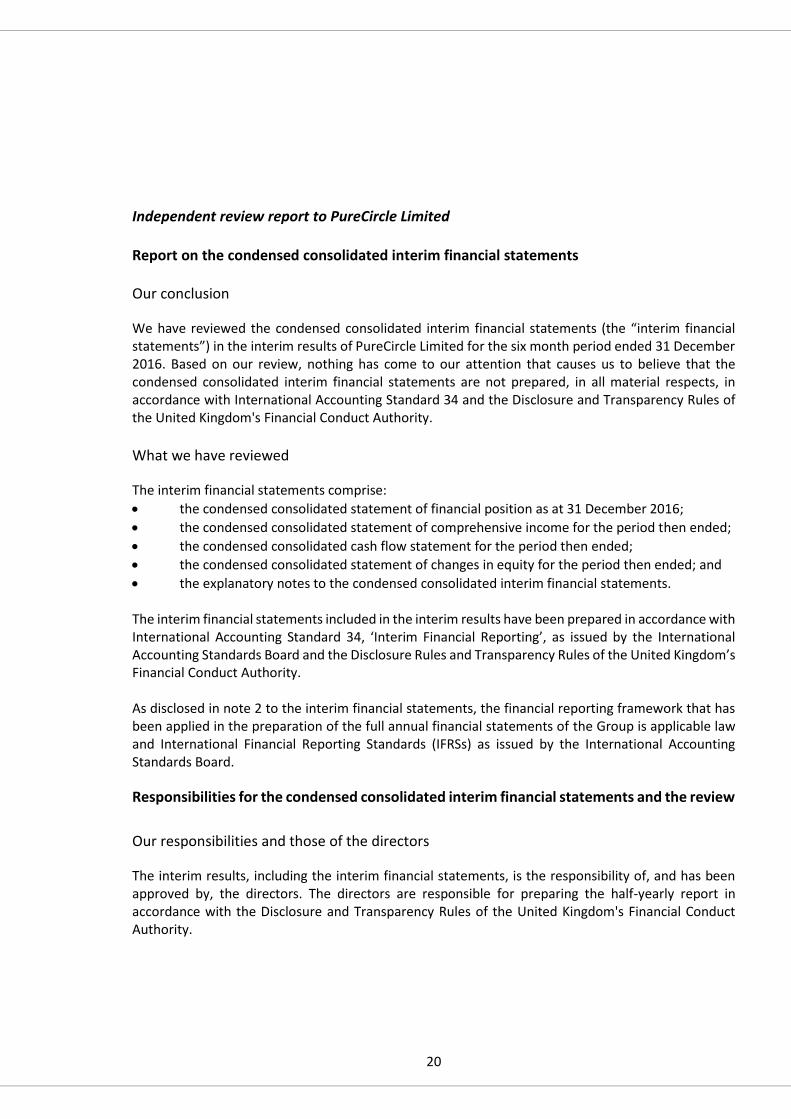
Independent review report to PureCircle Limited Report on the condensed consolidated interim financial statements
Our conclusion
We have reviewed the condensed consolidated interim financial statements (the “interim financial statements”) in the interim results of PureCircle Limited for the six month period ended 31 December 2016. Based on our review, nothing has come to our attention that causes us to believe that the condensed consolidated interim financial statements are not prepared, in all material respects, in accordance with International Accounting Standard 34 and the Disclosure and Transparency Rules of the United Kingdom's Financial Conduct Authority.
What we have reviewed
The interim financial statements comprise:
the condensed consolidated statement of financial position as at 31 December 2016;
the condensed consolidated statement of comprehensive income for the period then ended;
the condensed consolidated cash flow statement for the period then ended;
the condensed consolidated statement of changes in equity for the period then ended; and
the explanatory notes to the condensed consolidated interim financial statements. The interim financial statements included in the interim results have been prepared in accordance with International Accounting Standard 34, ‘Interim Financial Reporting’, as issued by the International Accounting Standards Board and the Disclosure Rules and Transparency Rules of the United Kingdom’s Financial Conduct Authority. As disclosed in note 2 to the interim financial statements, the financial reporting framework that has been applied in the preparation of the full annual financial statements of the Group is applicable law and International Financial Reporting Standards (IFRSs) as issued by the International Accounting Standards Board.
Responsibilities for the condensed consolidated interim financial statements and the review
Our responsibilities and those of the directors
The interim results, including the interim financial statements, is the responsibility of, and has been approved by, the directors. The directors are responsible for preparing the half-yearly report in accordance with the Disclosure and Transparency Rules of the United Kingdom's Financial Conduct Authority.
21
Our responsibility is to express to the company a conclusion on the condensed consolidated interim financial statements in the half-yearly report based on our review. This report, including the conclusion, has been prepared for and only for the company for the purpose of complying with the Disclosure and Transparency Rules of the Financial Conduct Authority and for no other purpose. We do not, in giving this conclusion, accept or assume responsibility for any other purpose or to any other person to whom this report is shown or into whose hands it may come save where expressly agreed by our prior consent in writing.
What a review of condensed consolidated financial statements involves We conducted our review in accordance with International Standard on Review Engagements (UK and Ireland) 2410, ‘Review of Interim Financial Information Performed by the Independent Auditor of the Entity’ issued by the Auditing Practices Board for use in the United Kingdom. A review of interim financial information consists of making enquiries, primarily of persons responsible for financial and accounting matters, and applying analytical and other review procedures. A review is substantially less in scope than an audit conducted in accordance with International Standards on Auditing (UK and Ireland) and, consequently, does not enable us to obtain assurance that we would become aware of all significant matters that might be identified in an audit. Accordingly, we do not express an audit opinion. We have read the other information contained in the interim results and considered whether it contains any apparent misstatements or material inconsistencies with the information in the interim financial statements. PricewaterhouseCoopers LLP Chartered Accountants 6 March 2017 London Notes: (a) The maintenance and integrity of the PureCircle Limited website is the responsibility of the
directors; the work carried out by the auditors does not involve consideration of these matters and, accordingly, the auditors accept no responsibility for any changes that may have occurred to the financial statements since they were initially presented on the website.
(b) Legislation in the United Kingdom governing the preparation and dissemination of financial
statements may differ from legislation in other jurisdictions.

22
Shareholder Information
Internet Investors and corporate stakeholders www.purecircle.com Health professionals, customers, policy makers, consumers www.globalsteviainstitute.com Investors Relations Requests for copies of the annual reports published in 2016 and previous years or other investor relations matters should be addressed to PureCircle office: [email protected] Share Registrar In Jersey (Shares) Computershare Investor Services (Channel Islands) Limited PO Box 83, Ordnance House, 31 Pier Road St Helier Jersey JE4 8PW Channel Islands. In the UK (Depository Interests) Computershare Investor Services plc The Pavillions, Bridgwater Road Bristol BS13 8AE, United Kingdom. 0120B7/py