purcell et al. 2010 - psychological revie · psychological review neurally constrained modeling of...
TRANSCRIPT

Psychological Review
Neurally Constrained Modeling of Perceptual Decision MakingBraden A. Purcell, Richard P. Heitz, Jeremiah Y. Cohen, Jeffrey D. Schall, Gordon D. Logan, and
Thomas J. Palmeri
Online First Publication, September 6, 2010. doi: 10.1037/a0020311
CITATION
Purcell, B. A., Heitz, R. P., Cohen, J. Y., Schall, J. D., Logan, G. D., & Palmeri, T. J. (2010,
September 6). Neurally Constrained Modeling of Perceptual Decision Making. Psychological
Review. Advance online publication. doi: 10.1037/a0020311

Neurally Constrained Modeling of Perceptual Decision Making
Braden A. Purcell, Richard P. Heitz, Jeremiah Y. Cohen, Jeffrey D. Schall,Gordon D. Logan, and Thomas J. Palmeri
Vanderbilt University
Stochastic accumulator models account for response time in perceptual decision-making tasks byassuming that perceptual evidence accumulates to a threshold. The present investigation mapped thefiring rate of frontal eye field (FEF) visual neurons onto perceptual evidence and the firing rate of FEFmovement neurons onto evidence accumulation to test alternative models of how evidence is combinedin the accumulation process. The models were evaluated on their ability to predict both response timedistributions and movement neuron activity observed in monkeys performing a visual search task.Models that assume gating of perceptual evidence to the accumulating units provide the best account ofboth behavioral and neural data. These results identify discrete stages of processing with anatomicallydistinct neural populations and rule out several alternative architectures. The results also illustrate the useof neurophysiological data as a model selection tool and establish a novel framework to bridgecomputational and neural levels of explanation.
Keywords: perceptual decision making, stochastic accumulator models, mental chronometry, frontal eye field
Mathematical psychology has converged on a general frame-work to explain the time course of perceptual decisions. Modelsthat assume perceptual information accumulates to a responsethreshold provide excellent accounts of decision-making behavior(Bogacz, Brown, Moehlis, Holmes, & Cohen, 2006; Nosofsky &Palmeri, 1997; Palmeri, 1997; Ratcliff & Rouder, 1998; Ratcliff &Smith, 2004; Smith & Van Zandt, 2000; Usher & McClelland,2001). These accumulator models entail at least two distinct pro-cesses: (a) A stimulus must be encoded with respect to the currenttask to represent perceptual evidence, and (b) some mechanismmust accumulate that evidence to reach a decision. Models thatassume very different decision-making architectures can account formany of the same behavioral phenomena (S. Brown & Heathcote,2005; S. D. Brown & Heathcote, 2008; Ratcliff & Smith, 2004).Recently, the observation that the pattern of activity of certain neurons
resembles an accumulation to threshold (Hanes & Schall, 1996)sparked a synthesis of mathematical psychology and neurophysiology(Beck et al., 2008; Boucher, Palmeri, Logan, & Schall, 2007;Bundesen, Habekost, & Kyllingsbaek, 2005; Carpenter, Reddi, &Anderson, 2009; Ditterich, 2006b; Mazurek, Roitman, Ditterich, &Shadlen, 2003; Niwa & Ditterich, 2008; Ratcliff, Cherian, & Seg-raves, 2003; Ratcliff, Hasegawa, Hasegawa, Smith, & Segraves,2007; Schall, 2004; Wang, 2002; Wong, Huk, Shadlen, & Wang,2007; Wong & Wang, 2006). This synthesis is powerful becauseneurophysiology can constrain key assumptions about the represen-tation of perceptual evidence, the mechanisms that accumulate evi-dence to threshold, and how the two interact.
In this article, we describe a modeling approach that assumes avisual-to-motor cascade in which perceptual evidence drives anaccumulator that initiates a behavioral response. We make thecrucial assumption that the evidence representation and the accu-mulation of evidence can be identified with the spike dischargerates of distinct populations of neurons. These neural representa-tions can be used to distinguish among alternative models ofperceptual decision making. We distinguished models by the qual-ity of their fits to distributions of response times (RTs) and theirpredictions of neuronal dynamics that accumulate to a threshold toproduce a response. A model in which the flow of information toa leaky integrator is gated between perceptual processing andevidence accumulation provides the best account of both behav-ioral and neural data, while feed-forward inhibition and lateralinhibition are less important parameters.
Accumulator Models of Decision Processes
Evidence accumulation must be preceded by the perceptualencoding of stimuli according to the current task and potentialresponses to produce the evidence that accumulates. Perceptualencoding takes time, and this delays the start of the accumulation(see Figure 1). Perceptual processing time has traditionally been
Braden A. Purcell, Richard P. Heitz, Jeremiah Y. Cohen, Jeffrey D.Schall, Gordon D. Logan, and Thomas J. Palmeri, Department of Psychol-ogy, Vanderbilt University.
This work was supported by the Temporal Dynamics of Learning Center(SBE-0542013), a National Science Foundation (NSF) Science of LearningCenter; Robin and Richard Patton through the E. Bronson Ingram Chair inNeuroscience; NSF Grants BCS-0218507, BCS-0446806, and BCS-0646588; Air Force Office of Scientific Research Grant FA9550-07-1-0192; a grant from the James S. McDonnell Foundation; and NationalInstitutes of Health Grants RO1-MH55806, RO1-EY13358, P30-EY08126, and P30-HD015052. We thank G. Woodman for sharing codefor the neurophysiological analyses and the Vanderbilt Advanced Centerfor Computing for Research and Education for access to the high-perfor-mance computing cluster (http://www.accre.vanderbilt.edu/research).
Correspondence concerning this article should be addressed to ThomasJ. Palmeri, Department of Psychology, Vanderbilt University, PMB407817, 2301 Vanderbilt Place, Nashville, TN 37240-7817. E-mail:[email protected]
Psychological Review © 2010 American Psychological Association2010, Vol. ●●, No. ●, 000–000 0033-295X/10/$12.00 DOI: 10.1037/a0020311
1

estimated as a free parameter (e.g., Ratcliff & Smith, 2004). Theproduct of perceptual processing is known as drift rate and is oftenestimated as a free parameter that is allowed to vary betweenstimulus conditions and to vary between and within trials (Ratcliff& Rouder, 1998; but see Ashby, 2000; Logan & Gordon, 2001;Nosofsky & Palmeri, 1997; Palmeri, 1997; Palmeri & Tarr, 2008).Many models assume that drift rate is constant over the course ofa trial (Ashby, 2000; Nosofsky & Palmeri, 1997; Ratcliff &Rouder, 1998), but other models assume that it varies within a trial(Ditterich, 2006a, 2006b; Heath, 1992; Lamberts, 2000; Smith,1995, 2000; Smith & Ratcliff, 2009; Smith & Van Zandt, 2000).Systematic variability in RT across stimulus conditions is gener-ally attributed to systematic variability in drift rate. Many modelsalso allow the starting point (baseline) of the accumulation and thethreshold to vary across stimulus conditions (S. Brown & Heath-cote, 2005; Ratcliff & Rouder, 1998) and propose different sourcesof intertrial and intratrial variability (e.g., Ratcliff & Smith, 2004).
Alternative models propose different mechanisms for how evi-dence is combined and accumulated to a threshold (reviewed byBogacz et al., 2006; Smith & Ratcliff, 2004). Independent racemodels and their discrete analogue independent counter modelsassume that evidence for each response accumulates indepen-dently; the first accumulator to reach threshold determines whichresponse is made (Smith & Van Zandt, 2000; Vickers, 1970). Driftdiffusion models (Ratcliff, 1978; Ratcliff & Rouder, 1998) andtheir discrete analogue random walk models (Laming, 1968; Link& Heath, 1975; Nosofsky & Palmeri, 1997; Palmeri, 1997) assumethat perceptual evidence in favor of one response simultaneouslycounts as evidence against competing responses. Competing accu-mulator models (Usher & McClelland, 2001) assume that accu-mulators’ support for alternative responses is mutually inhibitory;as evidence in favor of one response grows, it inhibits alternativeresponses more strongly in a winner-take-all fashion (Grossberg,1976b). These alternative models can vary in other respects, suchas whether integration of evidence is perfect or leaky.
Different accumulator models make many different assumptionsabout the representation of perceptual evidence and the mecha-nisms that use it. We asked whether the assumptions that arenecessary to account for behavioral data are consistent with neu-rophysiological data by systematically evaluating major modelassumptions within a modeling framework in which both modelinputs and outputs are neurally constrained. Our approach is validif and only if the data are from neurons that instantiate theperceptual processing and evidence accumulation in question, thatis, if the linking propositions (Schall, 2004; Teller, 1984) that mapmodel components to brain structures are valid. In the next section,
we review support for the hypothesis that certain neurons inparticular brain structures implement the perceptual processingand evidence accumulation proposed by these models.
Neural Basis of Perceptual Decisions
The past 10 years have witnessed a new focus of research on theneurophysiological basis of decisions about where and when tomove the eyes (Glimcher, 2003; Gold & Shadlen, 2007; Schall,2003; Smith & Ratcliff, 2004). Three major structures have beenstudied most extensively: the frontal eye field (FEF), the superiorcolliculus (SC), and the lateral intraparietal area (LIP). Thesestructures are densely interconnected and comprise a diversity ofneuron types. We focus on two major subpopulations of neurons,those with tonic responses to visual stimuli and no saccade-relatedmodulation, termed visual neurons, and those with a very weakmodulation after stimulus presentation but pronounced growth ofdischarge rate preceding saccade production, termed movementneurons (also referred to as buildup neurons). Tonic visual neuronsare found in FEF, SC, and LIP, while movement neurons are foundin FEF and SC, but much less frequently in LIP.
FEF and SC receive converging projections from numerousvisual cortical areas (see Figure 2; Schall, Morel, King, & Bullier,1995; Sparks, 1986). FEF and SC movement neurons issue com-mands to brainstem nuclei to execute saccadic eye movements(Scudder, Kaneko, & Fuchs, 2002; Sparks, 2002). FEF and SC arealso connected with brain regions implicated in cognitive control,including medial frontal and dorsolateral prefrontal cortex (Schall& Boucher, 2007; Schall, Morel, et al., 1995; Stanton, Bruce, &Goldberg, 1995) and the basal ganglia (Goldman-Rakic & Porrino,1985; Hikosaka & Wurtz, 1983). Thus, these areas lie at the
Figure 2. Connectivity between visual cortical areas and the oculomotorsystem. Middle temporal (MT), visual area V4, visual area TEO, visualarea TE, and lateral intraparietal area (LIP) project to the frontal eye field(FEF). LIP and FEF project to the superior colliculus (SC). FEF and SCproject to the brainstem saccade generator. Not pictured are connectionsbetween prefrontal cortex and FEF, from LIP to SC, and from the sub-stantia nigra pars reticulata of the basal ganglia to SC and to FEF via themediodorsal nucleus of the thalamus.
Figure 1. Stochastic accumulator model illustration.
2 PURCELL ET AL.
junction between perceptual and motor processing and are ana-tomically situated to influence the decision to move the eyes(Munoz & Schall, 2003).
In monkeys performing visual search, tonic visual neurons mod-ulate their activity to select the target (see Figure 3B); this has beenobserved in FEF (Schall & Hanes, 1993), SC (Basso & Wurtz,1997; McPeek & Keller, 2002), and LIP (Ipata, Gee, Goldberg, &Bisley, 2006; Thomas & Pare, 2007). The selection process isindependent of movement production (Juan, Shorter-Jacobi, &Schall, 2004; Murthy, Ray, Shorter, Schall, & Thompson, 2009;Murthy, Thompson, & Schall, 2001; Sato & Schall, 2003; Schall,Hanes, Thompson, & King, 1995; Thompson, 2005; Thompson,Bichot, & Schall, 1997; Thompson, Hanes, Bichot, & Schall,1996). Tonic visual neurons in FEF, SC, and LIP are hypothesizedto represent the behavioral relevance of an object in their receptivefield (Findlay & Gilchrist, 1998; Goldberg, Bisley, Powell, &Gottlieb, 2006; Thompson & Bichot, 2005). The findings support-ing this hypothesis include the observation that the time course andmagnitude of selection (the difference in activity when a target vs.a distractor is in a visual neuron’s receptive field) depend ontarget–distractor similarity (Bichot & Schall, 1999; Sato, Murthy,Thompson, & Schall, 2001; Sato, Watanabe, Thompson, & Schall,2003), set size (Basso & Wurtz, 1997; Cohen, Heitz, Woodman, &Schall, 2009b), and task contingencies (Sato & Schall, 2003;Thompson, Bichot, & Sato, 2005; Zhou & Thompson, 2009).
Movement neurons in FEF and SC initiate a saccade when theirspike rate reaches a threshold (see Figure 3C; J. W. Brown, Hanes,Schall, & Stuphorn, 2008; Dorris, Pare, & Munoz, 1997; Everling& Munoz, 2000; Fecteau & Munoz, 2003; Hanes, Patterson, &Schall, 1998; Hanes & Schall, 1996; Murthy et al., 2009; Pare &Hanes, 2003; Ratcliff et al., 2003, 2007; Sparks & Pollack, 1977;Woodman, Kang, Thompson, & Schall, 2008). The time when
movement neuron activity begins increasing and the rate at whichit grows to threshold account for random variability in RT (Hanes& Schall, 1996; Thompson & Schall, 2000; Woodman et al.,2008). The time when movement neuron activity begins increasingaccounts for changes in RT when the difficulty of a perceptualdecision is manipulated (Woodman et al., 2008). This activity hasbeen associated with the dynamics of accumulator models(Boucher et al., 2007; Carpenter, 1999; Carpenter et al., 2009;Carpenter & Williams, 1995; Ratcliff et al., 2003, 2007). However,the neural source of the variability in accumulation time is notidentified (but see Bundesen et al., 2005). Visual neurons are oftenassumed to represent a source of input that drives movementneurons to threshold (Bruce & Goldberg, 1985; Carpenter, Reddi,& Anderson, 2009; Hamker, 2005b; Heinzle, Hepp, & Martin,2007; Schiller & Koerner, 1971), but this assumption has not beenrigorously evaluated.
Another line of research has identified a representation of per-ceptual evidence for a motion direction discrimination task withthe activity of neurons in visual area MT (middle temporal; Dit-terich, Mazurek, & Shadlen, 2003; Shadlen, Britten, Newsome, &Movshon, 1996) and the evidence accumulation process with thegrowth of activity in LIP (Roitman & Shadlen, 2002; reviewed byGold & Shadlen, 2007). The findings that support this claiminclude the stimulus-dependent growth of activity of LIP neurons(A. K. Churchland, Kiani, & Shadlen, 2008; Roitman & Shadlen,2002), the effects of MT and LIP microstimulation on performance(Ditterich et al., 2003; Hanks, Ditterich, & Shadlen, 2006; Salz-man, Britten, & Newsome, 1990; Salzman, Murasugi, Britten, &Newsome, 1992), and the effects of motion pulse stimuli onbehavior and LIP activity (Huk & Shadlen, 2005). Models basedon these linking propositions provide a reasonably clear account ofperformance in terms of neural processes and statistical principles
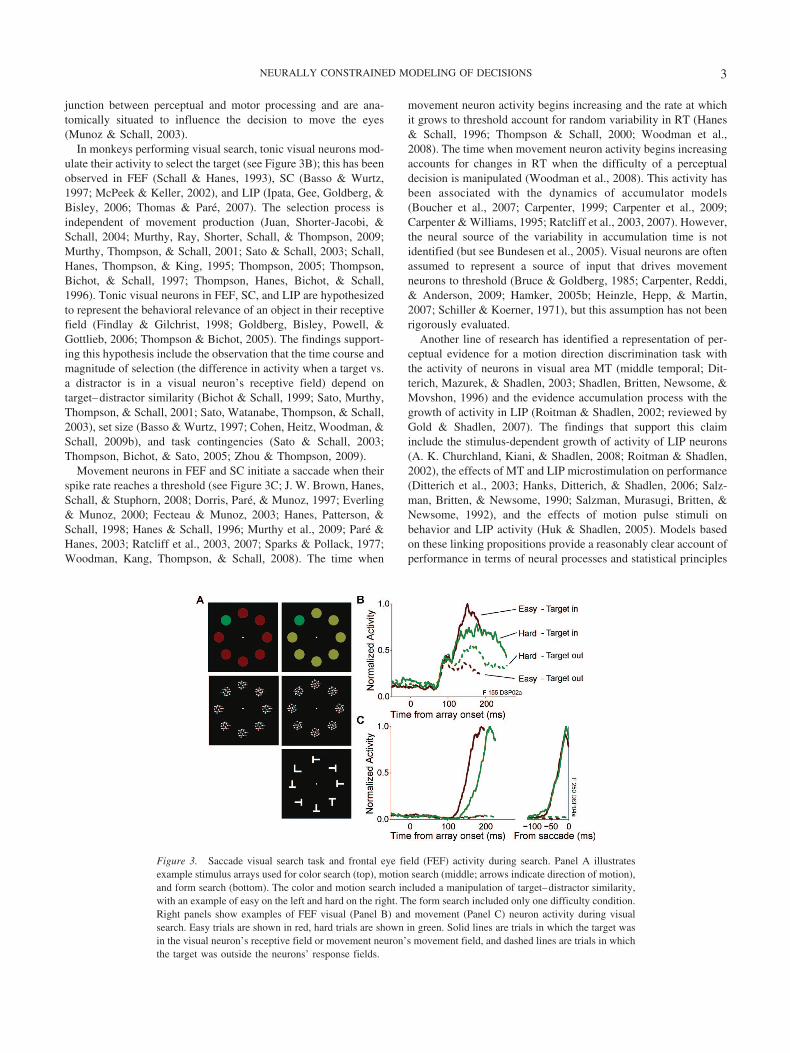
Figure 3. Saccade visual search task and frontal eye field (FEF) activity during search. Panel A illustratesexample stimulus arrays used for color search (top), motion search (middle; arrows indicate direction of motion),and form search (bottom). The color and motion search included a manipulation of target–distractor similarity,with an example of easy on the left and hard on the right. The form search included only one difficulty condition.Right panels show examples of FEF visual (Panel B) and movement (Panel C) neuron activity during visualsearch. Easy trials are shown in red, hard trials are shown in green. Solid lines are trials in which the target wasin the visual neuron’s receptive field or movement neuron’s movement field, and dashed lines are trials in whichthe target was outside the neurons’ response fields.
3NEURALLY CONSTRAINED MODELING OF DECISIONS

(Beck et al., 2008; Ditterich, 2006b; Lo & Wang, 2006; Mazureket al., 2003; Wang, 2002). However, the activity of neurons in MTand other early visual areas is more dependent on stimulus featuresthan task performance (Law & Gold, 2008). Also, LIP does notinitiate saccades (Pare & Wurtz, 2001; Wurtz, Sommer, Pare, &Ferraina, 2001). Some additional processing is necessary to initiatethe final choice to act. For saccade generation, FEF and SCmovement neurons are the most likely candidates. Thus, we pro-pose that a different set of linking propositions is necessary toexplain the full duration of the decision process.
We explored a range of accumulator models based on twolinking propositions: (a) Perceptual evidence is associated with theactivity of visual neurons in FEF, and (b) the accumulation of thatevidence is associated with the growth of activity to a threshold bymovement neurons in FEF. While this model is based on dataobtained from FEF, we believe that the signals produced by FEFvisual neurons correspond to counterparts in LIP and SC. Otherinvestigators have described the tonic visual neurons in LIP asintegrating sensory signals from extrastriate cortex (Gold &Shadlen, 2007). In this study, we focused on the accumulationprocess occurring in FEF movement neurons that lead to theinitiation of the response, and therefore, we consider the visualneurons as the source of perceptual evidence. Similarly, we believethat the signals produced by FEF movement neurons correspond tocounterparts in SC.
Overview
At the heart of our theory are the linking propositions thatperceptual evidence is reflected in the firing rates of FEF visualneurons and the accumulation of evidence is reflected in the firingrates of FEF movement neurons. We used a novel modelingapproach to test the validity of these assumptions. Rather thanmodeling neural inputs to an accumulator, we used observed visualneuron firing rates as the evidence that was accumulated over time.Figures 4 and 5 illustrate the approach. Visual neuron activity was
recorded from the FEF of monkeys performing a visual searchtask. Neurons with the target in their receptive field drove anaccumulator representing a saccade to the target, and neurons witha distractor in their receptive field drove a response to a distractor.The models predicted a saccadic response when an accumulatorunit activity reached a fixed threshold. Saccadic RT was the timeto reach the threshold plus the brief oculomotor ballistic time. Ifvisual neuron activity is the perceptual evidence, then the modelshould correctly predict the observed RT distributions. If move-ment neuron activity is the accumulation of evidence, then theaccumulator model dynamics should predict the movement neurondynamics observed in neurophysiological recordings (e.g.,Boucher et al., 2007; Ditterich, 2006b; Ratcliff et al., 2003, 2007).
In the next section, we give the details of the experimental andmodeling methodology and present the behavioral and neural datato be predicted. Following the methods, we ask whether visualneuron activity is sufficient to predict behavior and, if so, whatarchitectural assumptions for signal transformation are required.Several models provide a good fit, while others can be ruled outbecause they fail to predict behavior. We then ask whether thesame models can predict the dynamics of movement neurons usingthe same parameters that fit the behavior. The models with con-ventional parameters of leakage, feed-forward inhibition, and lat-eral inhibition fail. However, models in which the flow of infor-mation from visual neurons to movement neurons is gated providethe best account of behavior and neural data; feed-forward andlateral inhibition are not necessary. We conclude by discussing theimplications of these results for theories of decision making andneural function.
Behavioral and Neurophysiological Methodsand Results
We analyzed behavioral and neurophysiological data fromawake behaving monkeys that have been the basis of previouspublications (Bichot, Thompson, Rao, & Schall, 2001; Cohen,
Figure 4. Simulation methods. Spike trains were recorded from frontal eye field visual neurons during asaccade search task. Trials were sorted into two populations according to whether the target (top) or distractors(bottom) were within the neuron’s response field. N spike trains were randomly sampled from each populationto generate a normalized activation function that served as model input on a given simulated trial.
4 PURCELL ET AL.
Heitz, et al., 2009b; Cohen et al., 2007; Sato et al., 2001; Schall,Sato, Thompson, Vaughn, & Juan, 2004; Thompson et al., 2005;Woodman et al., 2008). In this section, we describe how thebehavioral and neural data were collected and analyzed and sum-marize the primary observations. Then, we turn to a detaileddiscussion of the modeling methods and results that are the focusof our new efforts.
Behavioral Training and Testing Methods
Five macaque monkeys (Macaca radiata, Macaca mulatta)were trained to perform a visual search task in which reward wascontingent upon a single saccade from fixation to a singleton targetamong a set of distractors. Animals were required to maintainfocus on a central fixation point at the start of each trial. After avariable delay (�600 ms), the fixation point vanished, and thesearch array appeared. Monkeys were rewarded if their first sac-cade was directed to the target. The array consisted of one targetand seven distractors randomly located at eight isoeccentric loca-tions equally spaced around the fixation point. During testing, theeccentricity of the array was adjusted depending on the receptivefield properties of isolated neurons. The animal had one opportu-nity to make a saccade to and maintain fixation on the target forreward.
Figure 3A illustrates the search arrays. Three sets of stimuliwere used: a set in which the target was defined by color (Satoet al., 2001), a set in which the target was defined by directionof motion within a circular aperture of moving dots (Sato et al.,2001), and a set in which the target differed from distractors inshape (Cohen, Heitz, et al., 2009b). The color and motionsearch tasks included easy and hard conditions determined bytarget– distractor similarity. For the color search task, the easycondition required a saccade to a green target among reddistractors, while the hard condition required a saccade to agreen target among yellow-green distractors; on other sessions,monkeys searched for red among green or red among yellow-
red distractors. For the motion search task, the easy conditionrequired a saccade to a target in which 100% of the dots movedto the right among distractors in which 100% of the dots movedto the left. The hard condition required a saccade to a targetwith only 50%– 60% of the dots moving in a particular direc-tion; on other sessions, the opposite set of dot motion directionsfor targets and distractors was used. Easy and hard conditionswere randomly interleaved within each session. For the formsearch task, the target was a T among rotated distractor Ls; onother sessions, an opposite set of targets and distractors wasused. No target– distractor similarity manipulation was includedin the form search for Monkey Q, although it also took place inthe context of other manipulations not analyzed here. Thedifficulty of this task has been established in humans (Duncan& Humphreys, 1989), and animal performance corresponded toperformance in the hard condition of the color and motionsearch tasks (Cohen, Heitz, et al., 2009b), therefore we labelthese data as another kind of hard search in all figures andtables. Monkey F performed the color search task. Monkeys Land O performed the motion search task. Monkey M performedboth color (Mc) and motion (Mm) search during separate re-cording sessions that are distinguished in the model fits describedbelow. Monkey Q performed form search. Only movement neurons,no visual neurons, were recorded from Monkey O.
Behavioral Results
We were primarily interested in the distribution of saccadic RTsfor the various search conditions. Each data set was fitted individ-ually; Table 1 summarizes the observed behavior by monkey andtask. In addition, we fitted a pooled data set that combined acrossData Sets F, L, Mc, and Mm; observed RT quantiles for theindividual data sets were averaged using a standard Vincentizingprocedure (Ratcliff, 1979). Figure 6 displays the cumulative RTdistributions for each animal and for the pooled RT distribution.Analyses of individual monkeys and the pooled data revealed a
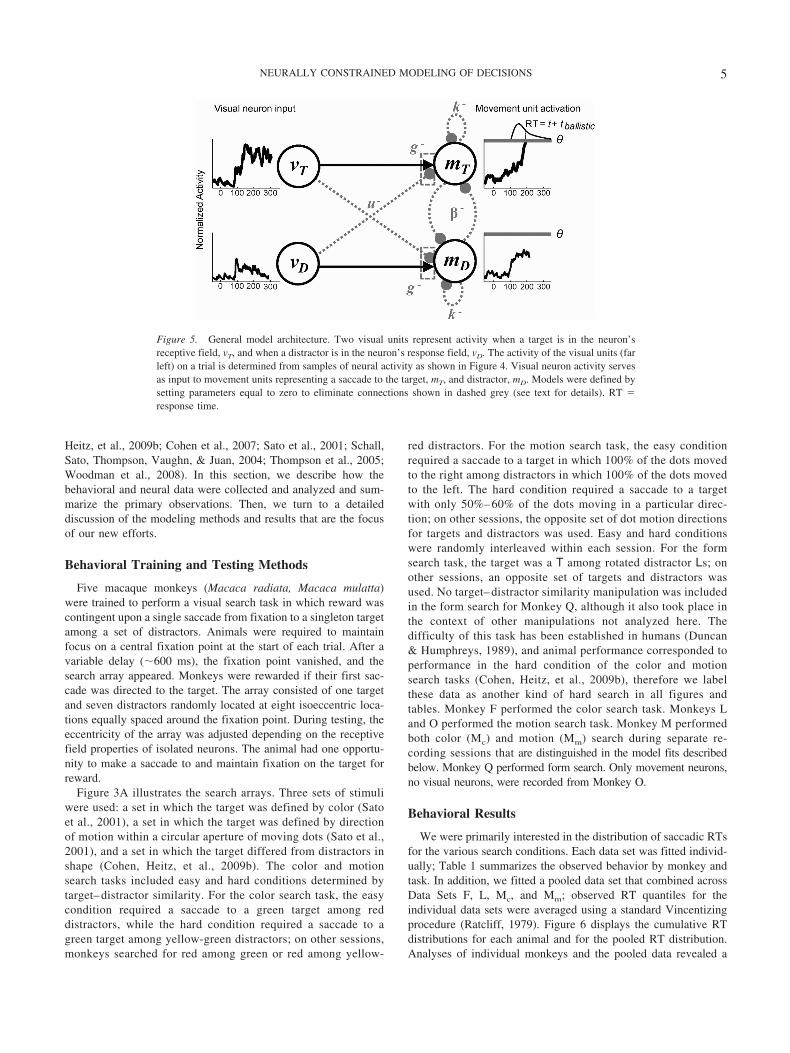
Figure 5. General model architecture. Two visual units represent activity when a target is in the neuron’sreceptive field, vT, and when a distractor is in the neuron’s response field, vD. The activity of the visual units (farleft) on a trial is determined from samples of neural activity as shown in Figure 4. Visual neuron activity servesas input to movement units representing a saccade to the target, mT, and distractor, mD. Models were defined bysetting parameters equal to zero to eliminate connections shown in dashed grey (see text for details). RT �response time.
5NEURALLY CONSTRAINED MODELING OF DECISIONS

significant difference in mean RT for easy versus hard search, allpaired t(22) � 7.79, p � .05.
Neurophysiological Methods and Analyses
Single-unit neurophysiological recordings in the FEF of behav-ing monkeys were made using procedures that have been describedin detail elsewhere (Schall, Hanes, et al., 1995; Thompson et al.,1996). Before being tested on the visual search task, animalsperformed a memory-guided saccade task to characterize the re-sponse properties of the isolated neuron and define it as a visualneuron, movement neuron, or other neuron (Bruce & Goldberg,1985). Animals were trained to fixate a central point while aperipheral target was flashed in the receptive field for 80 ms. Thetask required animals to maintain fixation for 400–1,000 ms afterthe fixation spot disappeared. For reward, the animal made asaccade to the remembered location of the target after the fixationspot disappeared.
Neural activity during a memory-guided saccade task was usedto classify neurons. Neurons were classified as visual neurons iftheir firing rate rapidly increased in response to the presentation ofthe visual stimulus in their receptive field but showed no increase
in activation prior to a saccade. Neurons were classified as move-ment neurons if their activity remained at baseline in response tothe presentation of the visual stimulus but showed an increase inactivation prior to a saccade within their movement field, the areaof the visual field to which a saccade is executed when activityreaches threshold.
FEF neurons have heterogeneous response properties (Bruce& Goldberg, 1985), and two groups of visually responsiveneurons were excluded from our analyses. First, FEF visuo-movement neurons that show both visual and movement-relatedactivity were excluded. There is neurophysiological (Murthy etal., 2009; Ray, Pouget, & Schall, 2009) and biophysical (Cohen,Pouget, Heitz, Woodman, & Schall, 2009) evidence that visuo-movement neurons are a distinct class of neurons apart frompure visual and movement neurons. The simulations presentedin this article are limited to pure visual and pure movementneurons because the distinction between these populations iswell established both functionally (Murthy et al., 2009; Thomp-son, 2005; Thompson et al., 1997) and anatomically (Pouget etal., 2009; Segraves, 1992). We also conducted simulations inwhich visuomovement neurons were included, and the keymodel predictions were unchanged. Nevertheless, there is evi-dence that visuomovement neurons may reflect a corollarydischarge to update visual processing (Ray et al., 2009), and soit remains an open question to what degree visuomovementneurons can be functionally grouped with either pure visual orpure movement neurons. Second, FEF phasic visual neuronsthat show a brief visual response to a stimulus that does notselect the location of the target were excluded from our analyses(Bruce & Goldberg, 1985; Thompson et al., 1996). This as-sumes that the neurons that signal relevant stimuli are theneurons that contribute most strongly to preparation of a re-sponse (e.g., Bichot, Thompson, et al., 2001; Ghose & Harrison,2009; Purushothaman & Bradley, 2005; but see Shadlen et al.,1996). A visual neuron was said to select the target if the areaunder the receiver-operating characteristic (ROC) curve calcu-lated from trials in which a target was in the neuron’s receptive
Table 1Mean Response Times and Percent Correct
Monkey(task)
Easy search Hard search
Mean RT inms (SD)
%Correct
Mean RT inms (SD)
%Correct
F (color) 187 (38.9) 95.8 228 (67.6) 70.3L (motion) 266 (30.1) 98.6 314 (72.9) 94.5Mm (motion) 228 (32.2) 88.2 271 (67.0) 73.3Mc (color) 209 (21.4) 97.1 349 (96.0) 78.7Q (form) — — 373 (161.7) 85.6Pooled 210 (43.9) 94.4 274 (87.4) 75.7
Note. Dashes indicate that the animal did not perform an easy version ofthis task. RT � response time.
Figure 6. Observed behavioral data. Cumulative distribution of correct response times (RTs). RTs from easytrials are red, hard are green. Each panel indicates a different data set. Monkey F (color search), L (motionsearch), M (Mc � color, Mm � motion search), pooled (Vincentized RT distribution from F, L, and M), and Q(form search).
6 PURCELL ET AL.

field and trials in which a distractor was in the neuron’sreceptive field reached 0.70 prior to the mean saccade RT ineither difficulty condition (Thompson et al., 1996). We alsoexplored simulations that included neurons that did not reach0.70 in ROC area. Larger samples of trials were necessary tosignal the location of the target, but major conclusions wereunaffected.
Inclusion criteria for movement neurons were as follows: Allneurons that showed a sharp increase in activity immediatelypreceding the saccade during the memory-guided search task wereincluded in the movement neuron analyses. We also included asmall number of movement neurons that showed a minimal visualresponse but predominately responded immediately prior to sac-cade. Movement neurons recorded with less than 30 correct be-havioral trials were not included.
We also adopted several trial-specific inclusion criteria: (a)Only trials in which a saccade was correctly made to the targetwere included1; (b) trials in which the animal broke fixationearly, failed to maintain fixation on the target, or shifted gazeaway from the search array entirely were not included in thesesimulations (�0.7% total trials); (c) trials in which the animalanticipated the target location (RT � 100 ms) or the animal didnot respond within a time window (RT � 2,000 ms) wereexcluded from analysis (�0.03% of total trials); and (d) trials inwhich a distractor fell within the neuron’s receptive field butthe target appeared in an adjacent location were excluded fortwo reasons: First, FEF receptive fields are irregularly shaped,and it is difficult to guarantee that the target is completelyoutside the neuron’s receptive field. Second, a subset of visualneurons exhibits enhanced suppression of stimuli at the borderof the receptive field, and the effect of this inhibition will beinconsistent across different neurons (Schall & Hanes, 1993;Schall, Hanes, et al., 1995; Schall et al., 2004).
Neurophysiological Results
A total of 64 visual neurons met the inclusion criteria out-lined above (11 neurons from F, three from L, six from Mm,four from Mc, and 40 from Q).2 Figure 3B shows the responseof a representative visual neuron during easy and hard visualsearch. Visual neurons typically show an initial indiscriminateresponse to both target and distractor in their receptive fieldafter a search array appears. However, over time, visual neuronactivity evolves to signal the location of the target before asaccade is generated. Across neurons, target selection isachieved by a decrease of the response evoked by distractorsand the maintenance or enhancement of the response evoked bya target. Divergence between target and distractor activity isdelayed, and the difference is slower to evolve for hard searchthan for easy search (Bichot & Schall, 1999; Cohen, Heitz, etal., 2009b; Sato et al., 2001). Activity patterns were similarduring color, motion, and form search. Of primary interest iswhether visual neuron activity is sufficient to be the represen-tation of perceptual evidence that is accumulated by movementneurons.
Sixty-one movement neurons met the inclusion criteria de-scribed above (34 neurons from F, five from L, five from Mm,four from Mc, three from O, and 10 from Q). Figure 3C showsthe activity of a representative movement neuron during the
easy and hard conditions of the visual search task when asaccade was made to the target. The figure illustrates thecharacteristic buildup of movement neuron activity prior to asaccade to a target. There is often little activity of movementneurons that would signal a saccade to a distractor, althoughthis varies across neurons. When trials are aligned on the timeof saccade initiation, activity rises to a constant threshold levelimmediately prior to the eye movement. This pattern holdsacross difficulty conditions. Further quantitative analyses ofboth movement neurons and simulated model accumulators arereported later in this article.
Modeling Methodology
A fundamental innovation of our approach was to use the actualspike rate of recorded neurons as the input to alternative accumu-lator models. For each monkey, visual neuron activity recordedduring individual trials of the visual search tasks was divided intotwo populations (see Figure 4). The first population consisted oftrials that were recorded when the target fell in the neuron’sreceptive field. The second population consisted of trials that wererecorded when a distractor fell in the neuron’s receptive field. Foreach simulated trial, we randomly sampled, with replacement, Nspike trains from the population of trials in which the target fell ina neuron’s receptive field—the input to the accumulator for adecision to saccade to the target location—and N trials from thepopulation of trials in which a distractor fell in a neuron’s recep-tive field—the input to the accumulator for a decision to saccade
1 The task is relatively simple, and there were very few error trials,particularly in the easy condition. To evaluate the model’s predictions oferrors, populations of trials would need to be split into the following twopopulations: (a) trials in which the target appeared in the neuron’s receptivefield but a saccade was made to another distractor and (b) trials in whicha distractor appeared in a neuron’s receptive field and a saccade was madeto that location. The number of error trials that met these criteria was verylow in most of these data sets, making simulations where visual neuronactivity drives accumulator models impossible. We should note that FEFvisual neurons do select the location of the distractor to which an erroneoussaccade is made during saccade search tasks (Cohen, Heitz, Woodman, &Schall, 2009a; Thompson et al., 2005; but see Trageser, Monosov, Zhou, &Thompson, 2008). This is in agreement with the predictions of our frame-work.
2 Our simulations randomly sampled trials of activity with replacement.Each data set provided a sufficiently large number of trials from which tosample when the target was in the neuron’s receptive field (easy: F, 883;L, 267; Mm, 432; Mc, 177; pooled, 1,759; hard: F, 635; L, 271; Mm, 451;Mc, 195; Q, 5,696; pooled, 1,552) and when a distractor was in theneuron’s receptive field (easy: F, 2,202; L, 501; Mm, 730; Mc, 746; pooled,4,179; hard: F, 1,586; L, 517; Mm, 778; Mc, 689; Q, 11,724; pooled, 3,570).The complete data sets for L and M were not large, L: 11 neurons total (fivevisual), Mm: 18 neurons total (seven visual), Mc: 11 neurons total (sixvisual), but there were no consistent differences between these data setsand other data sets that used a larger population of neurons (F, Q, pooled).One data set, Mc, consistently fit the data worse than other data sets. Thismay have been due to lower trial numbers.
7NEURALLY CONSTRAINED MODELING OF DECISIONS

to the distractor location.3 The number of trials sampled from eachpopulation was varied systematically from N � 1 to 24. Fits werenot improved by increasing N above this range, which reflects ourchoice to only sample from visual neurons that select the locationof the target (e.g., Bichot, Thompson, et al., 2001).4
We generated an average activation function (spike densityfunction) from the collection of spike train trials by convolving thespikes with a kernel resembling a postsynaptic potential (Thomp-son et al., 1996). This visual neuron activation function was theinput to each accumulator on a simulated trial. Trials from multipleneurons were combined into a single average activation function.The tonic firing rates of FEF neurons are highly variable, thereforewe weighted the input from each neuron by the reciprocal of itsmaximum firing rate. The result was a normalized activationfunction for visual neuron input for target and distractor with amaximum of 1 and minimum of 0. This computation was neces-sary so that contributions were not overly weighted by neurons thatdischarged, on average, at a much higher rate. It is plausible thatthe brain implements a similar normalization operation (Gross-berg, 1976a; Heeger, 1992).
Visual neuron activity was recorded throughout the durationof the visual search task. Each simulated trial began 300 ms beforethe presentation of the visual search array while the animal fixatedthe center of the screen. The models were active from this pointuntil the saccade decision was made; in other words, input flowedcontinuously throughout the simulation. Starting simulations at aconstant time prior to the appearance of the search array eliminatedthe need for free parameters that would determine the initial valueof the accumulator (the starting point, or baseline), the duration ofperceptual processing (predecision time, or the time when theaccumulation begins), and any parameters that would govern howthose values vary across trials and conditions. Instead, intratrialchanges depended entirely on the nonstationary input functionderived from the recorded visual neuron activity (see Figures 3Band 4). This also allowed us to explore predicted model dynamicsfrom before the search array onset until the saccade was made,which had important implications for model selection.
Visual neurons were classified according to the object in theirreceptive field, but this classification is meaningful only up until asaccade is made and gaze shifts. This raises the question, Whatshould be done with the firing rates for neurons on trials in whicha saccade occurred before the model reached threshold? Simplydropping postsaccade activity inflated variability in the visualsignals and caused simulations to terminate without any response,which causes problems for the fit routine where initial parametersmay predict very long RTs. Our solution was to extrapolate visualneuron activity beyond the time when a saccade was made whenthat particular neuron was recorded on a particular trial with alonger RT. The distribution of interspike intervals for corticalneurons is approximately Poisson (Rodieck, Kiang, & Gerstein,1962), so we generated spike trains according to a homogeneousPoisson process with a rate parameter equal to the mean spike ratein the interval 20 ms to 10 ms prior to a saccade. Essentially, thisextended the neuronal spike train at a constant rate. Importantly,for well-fitting models that predicted the observed range of RTs,these extrapolated portions of visual neuron input contributed littleto the predicted model activation.
On each simulated trial, the model input consisted of two visualactivations: vT (t), activation from visual neurons with the targets in
their receptive field, and vD(t), activation from visual neurons withdistractors in their receptive field. The visual neuron inputs variedacross time and across trials because of the random sampling fromrecorded neurophysiological trials. Each model consisted of twomovement units: mT (t), activation of a movement neuron repre-senting a saccade to the target, and mD(t), activation a modelmovement neuron representing a saccade to a distractor. RT was
3 In our simulations, we used two accumulators (target vs. distractor)rather than eight (one for each stimulus in the array) or far more than eight(total number of accumulating neurons thought to reside in FEF). Essen-tially, we have assumed that input driven by each distractor (nonadjacentto the neuron’s receptive field) is pooled into a single unit that races againstthe target-driven activity. This assumption was necessary for these data setsbecause increasing the number of accumulators would decrease the popu-lations of trials from which model input could be sampled, and the numberof neurons and trials from these previously recorded physiology sessionswas already rather limited. In other words, for most of the individual datasets, there were not sufficient trials to simulate a model in this way. Thedata sets we used all included a fixed set of eight stimuli and alwayscontained a target, so models did not need to predict changes in RT orneural activity with set size. Because the neuron shows maximal activationwhen the target is in its receptive field, it is unlikely that model predictionswould qualitatively change by including multiple competitors. In addition,the vast majority of accumulator model applications have been in thecontext of two-alternative forced-choice tasks, so this framework alsoallows us to relate more directly to that broader family of models. Toensure that our conclusions do not depend critically on modeling only twolocations, we simulated preliminary versions of the models using anaccumulator for multiple locations using the data set, Q, that containedenough trials to sample activity for multiple distractors. The behavioral andneural predictions of the model were qualitatively similar when multipleaccumulators were used.
4 How many neurons contribute to a perceptual decision is an openquestion. The range of the sampled trials used in our simulations isconsistent with the findings of other studies examining reliability of neuralcoding (e.g., Bichot, Thompson, et al., 2001; Ghose & Harrison, 2009).One possible explanation for the small number of sampled neurons is thatdecisions may be preferentially based on neurons that most reliably signalthe relevance of a stimulus (Purushothaman & Bradley, 2005). Even so,these estimates may seem very low relative to the total number of neuronsin a given brain region. This may be explained in two ways: First, phasicvisual neurons that do not select the target may contribute to the pooledresponse that ultimately drives movement neurons. We tested models thatincluded sampling from both selective visual neurons and nonselectivevisual neurons that do not reach 0.70 in ROC area. Not surprisingly, largersamples were needed for the model to reliably select the correct location ofthe target. Second, the benefits of pooling across many neurons may belimited by correlated noise between neurons (Shadlen et al., 1996). Thiswould put an upper limit on the signal-to-noise ratio of the pooled visualneuron signal, which would be reflected in a relatively low number ofsampled trials required in the simulations. While noise correlations be-tween individual FEF visual neurons are relatively weak (�0.1; Bichot,Thompson, et al., 2001; Cohen et al., 2010), even small correlations canhave profound effects on pooled activity across a large number of neurons(Cohen et al., 2010; Shadlen et al., 1996). Note that for our simulations, thepooled visual activity across our trials was necessarily independent becausethe neurons were not recorded simultaneously; therefore, we refrain fromdrawing strong conclusions about the size of the actual neuronal pool basedon the present analyses. Future simulations using simultaneously recordedpairs of neurons or simulating spike trains with correlated noise could shedlight on this issue.
8 PURCELL ET AL.

given by the first movement unit to reach a threshold, �. Simulat-ing thousands of trials with different samples of vT (t) and vD(t) ledto different trajectories for mT and mD that predicted a distributionof saccade RTs.
Several basic assumptions were shared by all models. All pa-rameters were fixed across conditions because easy and hardsearch arrays were interleaved. All between-condition variabilitywas due solely to observed changes in the visual neuron inputs.Movement unit activation was rectified to be greater than zerobecause we identified movement unit activity with neuronal firingrate, which cannot be negative. All models compared movementunit activity to a threshold, �, whose value was optimized to fitbehavior. In the following section, we discuss different models thatinclude additional parameters that determine movement neuroncomputations. The first movement unit to reach threshold deter-mined whether a saccade was made to the target or distractor. Thetime when threshold was reached plus a brief ballistic time was theRT. We did not explicitly model activity that followed thresholdcrossings, but the latency between movement neurons reachingthreshold and the generation of a saccade is �15 ms in primates(Scudder et al., 2002). This represents the time necessary for thebrainstem mechanisms to initiate a saccadic eye movement. There-fore, the RT predicted for each simulated trial was defined as thetime from target onset to the time when threshold was crossed plusa constant ballistic time, tballistic, which was constrained to fallwithin an interval of 10–20 ms.
We adopted standard model fitting techniques to find values ofparameters that provided the best fit to the behavioral data. For agiven set of parameter values, we generated 5,000 simulated trialsto produce predicted RT distributions for both difficulty condi-tions. All models were fit to behavioral data using the Simplexroutine (Nelder & Mead, 1965) implemented in MATLAB (TheMathWorks). We used a Pearson chi-square statistic to quantifythe discrepancies between the observed and predicted cumulativecorrect RT distributions (Ratcliff & Tuerlinckx, 2002; Van Zandt,2000):
�2 � N�i
�Oi � Pi�2
Pi. (1)
The summation over i indexes RT bins defined by the quantiles ofthe observed RT distribution corresponding to the cumulativeprobabilities of 0.1, 0.3, 0.5, 0.7, and 0.9. Oi are the observedproportion of RTs, Pi are the predicted proportion of RTs withinthe bins, and N is the total number of data points in the observedRT distribution. With these quantiles, the six Oi are 0.1, 0.2, 0.2,0.2, 0.2, and 0.1. Pi are the predicted proportion of RTs fallingwithin each bin, which varies with the values of the variousparameters. The probabilities are converted to frequencies bymultiplying by the observed number of data points, N. The chi-square increases with the difference between the predicted RTdistribution and the observed RT distribution. We counted thenumber of predicted responses falling within the correct RT dis-tribution (Van Zandt, 2000); therefore, the fit routine maximizedthe proportion of correct responses in addition to matching thedistribution of observed RTs.
Simplex finds values of free parameters that minimize thechi-square. Five data sets from individual monkeys were fittedseparately (F, L, Mc, Mm, and Q), and a pooled data set that
combined across monkeys and stimulus sets was also fitted (F, L,Mm, and Mc). For data sets with an easy and hard condition, bothdifficulty conditions were fitted simultaneously by summing theindividual chi-square statistics for the two conditions. For eachmodel and data set, we ran the Simplex routine using �40 differentstarting points that were distributed across a reasonable range ofparameter space to mitigate the problem of finding local minimaduring the parameter search. This was done in parallel on thehigh-performance computing cluster supported by the VanderbiltAdvanced Center for Computing for Research and Education.
With only two RT distributions, one for easy search and one forhard search, it did not seem sensible to engage in extensivequantitative tests of model fits. Our goal was instead to findmodels that provided an acceptable fit to behavior that would laterbe compared to neural data. To quantify an acceptable fit, wecomputed a standard R2 fit statistic from the observed and pre-dicted RT percentiles: R2 � 1 (SSerror/SStotal). SSerror was givenby squaring the deviation between the observed and predictedpercentiles. SStotal was given by squaring the deviations betweenthe observed percentiles and the mean across difficulty conditions.We used a simple heuristic of R2 � 90% as an acceptable accountof behavior. We also included a fit statistic, X2, in which observedproportions were multiplied by 100 rather than the number ofobservations, thus they were not true frequencies (Ratcliff &Smith, 2004). This statistic facilitated comparisons of fit acrossdata sets because the number of observations varied across indi-viduals.
Although we emphasize the use of neural data for model selec-tion, we also compared models on their account of behavior.Standard hierarchical model testing proved problematic for severalreasons when running these simulations,5 so we developed analternative benchmark for when a difference in X2 values wasdeemed to be too large. To do this, we used the best fittingparameters for a given model to simulate 5,000 RT distributions(each containing 5,000 simulated RTs) that only differed in theinitial random number seed. An X2 statistic was computed for eachsimulation. We then calculated a distribution of differences in X2
values between runs differing only in the randomly sampled in-puts. We compared the difference in fit between two tested models(Xdiff
2 � XModel 12 XModel 2
2 ) to these distributions to compute a pvalue, and the 95th percentile of the distribution was used as an
5 First, these tests are limited to nested models, yet many of the modelcomparisons we wished to make are between models that are not nestedand that have the same number of free parameters. Second, the power ofthese tests increases with sample size, so one may attain significancesimply by running a large number of simulated trials (Busemeyer &Diederich, 2010). Finally, even with 5,000 simulated trials per condition,the difference between two runs of a model using the exact same parametervalues but differing in the random number seed at the start of a runproduces chi-square differences that can well exceeded the critical chi-square value for nested models differing in one parameter. We consideredboth parametric bootstrapping (Wagenmakers, Ratcliff, Gomez, & Iverson,2004) and increasing the number of simulated trials in each model by anorder of magnitude. However, these approaches were not feasible given thecomputational demands of Monte Carlo simulations. Ultimately, our em-phasis is on neural predictions made by models with an acceptable behav-ioral fit, not on detailed quantitative contrasts of the behavioral fits them-selves.
9NEURALLY CONSTRAINED MODELING OF DECISIONS
adjusted critical chi-square (Xcrit2 ); calculations using the true chi-
square were qualitatively identical. This gave us a conservative X2
difference that we might expect from chance if the data wereproduced by the same model that differed only in random factors.Clearly, this approach does not have the statistical rigor of some-thing like parametric bootstrapping, which would require compet-ing models to be fitted 5,000 times. However, that approach wasintractable with our current hardware.
Accounting for Response Times
Given the tight constraints imposed on the models, the firstquestion to answer is whether RT distributions can be predictedfrom the responses of FEF visual neurons. If so, then what com-putations are necessary and sufficient? To address these questions,we fit several stochastic models to the RT distributions observedduring the saccade visual search task. We selected models toevaluate assumptions about the mechanisms thought necessary topredict behavior.
Nonintegrated Models
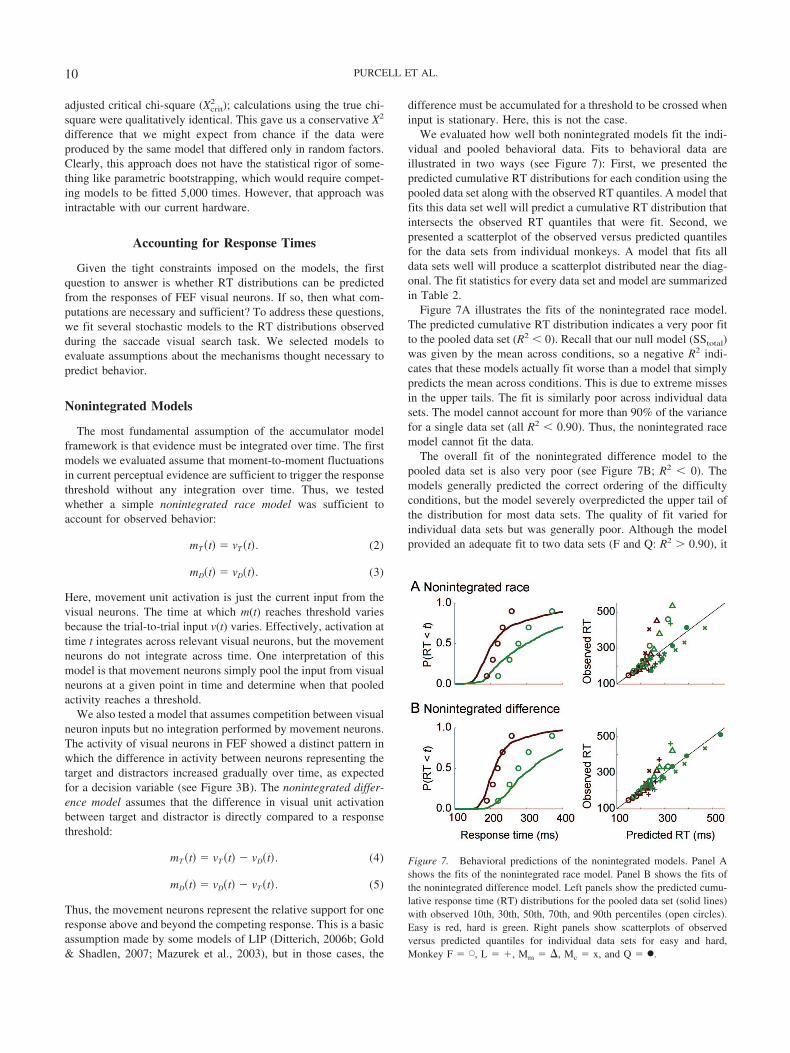
The most fundamental assumption of the accumulator modelframework is that evidence must be integrated over time. The firstmodels we evaluated assume that moment-to-moment fluctuationsin current perceptual evidence are sufficient to trigger the responsethreshold without any integration over time. Thus, we testedwhether a simple nonintegrated race model was sufficient toaccount for observed behavior:
mT �t� � vT �t�. (2)
mD�t� � vD�t�. (3)
Here, movement unit activation is just the current input from thevisual neurons. The time at which m(t) reaches threshold variesbecause the trial-to-trial input v(t) varies. Effectively, activation attime t integrates across relevant visual neurons, but the movementneurons do not integrate across time. One interpretation of thismodel is that movement neurons simply pool the input from visualneurons at a given point in time and determine when that pooledactivity reaches a threshold.
We also tested a model that assumes competition between visualneuron inputs but no integration performed by movement neurons.The activity of visual neurons in FEF showed a distinct pattern inwhich the difference in activity between neurons representing thetarget and distractors increased gradually over time, as expectedfor a decision variable (see Figure 3B). The nonintegrated differ-ence model assumes that the difference in visual unit activationbetween target and distractor is directly compared to a responsethreshold:
mT �t� � vT �t� � vD�t�. (4)
mD�t� � vD�t� � vT �t�. (5)
Thus, the movement neurons represent the relative support for oneresponse above and beyond the competing response. This is a basicassumption made by some models of LIP (Ditterich, 2006b; Gold& Shadlen, 2007; Mazurek et al., 2003), but in those cases, the
difference must be accumulated for a threshold to be crossed wheninput is stationary. Here, this is not the case.
We evaluated how well both nonintegrated models fit the indi-vidual and pooled behavioral data. Fits to behavioral data areillustrated in two ways (see Figure 7): First, we presented thepredicted cumulative RT distributions for each condition using thepooled data set along with the observed RT quantiles. A model thatfits this data set well will predict a cumulative RT distribution thatintersects the observed RT quantiles that were fit. Second, wepresented a scatterplot of the observed versus predicted quantilesfor the data sets from individual monkeys. A model that fits alldata sets well will produce a scatterplot distributed near the diag-onal. The fit statistics for every data set and model are summarizedin Table 2.
Figure 7A illustrates the fits of the nonintegrated race model.The predicted cumulative RT distribution indicates a very poor fitto the pooled data set (R2 � 0). Recall that our null model (SStotal)was given by the mean across conditions, so a negative R2 indi-cates that these models actually fit worse than a model that simplypredicts the mean across conditions. This is due to extreme missesin the upper tails. The fit is similarly poor across individual datasets. The model cannot account for more than 90% of the variancefor a single data set (all R2 � 0.90). Thus, the nonintegrated racemodel cannot fit the data.
The overall fit of the nonintegrated difference model to thepooled data set is also very poor (see Figure 7B; R2 � 0). Themodels generally predicted the correct ordering of the difficultyconditions, but the model severely overpredicted the upper tail ofthe distribution for most data sets. The quality of fit varied forindividual data sets but was generally poor. Although the modelprovided an adequate fit to two data sets (F and Q: R2 � 0.90), it
Figure 7. Behavioral predictions of the nonintegrated models. Panel Ashows the fits of the nonintegrated race model. Panel B shows the fits ofthe nonintegrated difference model. Left panels show the predicted cumu-lative response time (RT) distributions for the pooled data set (solid lines)with observed 10th, 30th, 50th, 70th, and 90th percentiles (open circles).Easy is red, hard is green. Right panels show scatterplots of observedversus predicted quantiles for individual data sets for easy and hard,Monkey F � E, L � , Mm � �, Mc � x, and Q � ●.
10 PURCELL ET AL.
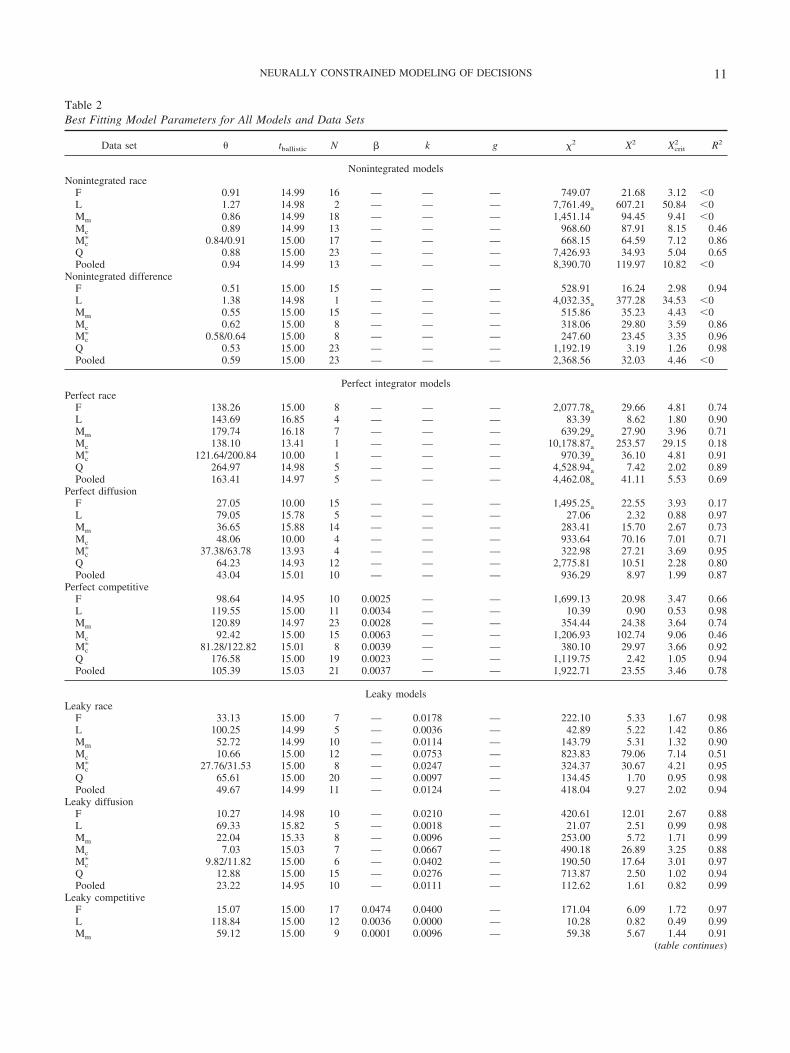
Table 2Best Fitting Model Parameters for All Models and Data Sets
Data set � tballistic N � k g �2 X2 Xcrit2 R2
Nonintegrated modelsNonintegrated race
F 0.91 14.99 16 — — — 749.07 21.68 3.12 �0L 1.27 14.98 2 — — — 7,761.49a 607.21 50.84 �0Mm 0.86 14.99 18 — — — 1,451.14 94.45 9.41 �0Mc 0.89 14.99 13 — — — 968.60 87.91 8.15 0.46Mc
� 0.84/0.91 15.00 17 — — — 668.15 64.59 7.12 0.86Q 0.88 15.00 23 — — — 7,426.93 34.93 5.04 0.65Pooled 0.94 14.99 13 — — — 8,390.70 119.97 10.82 �0
Nonintegrated differenceF 0.51 15.00 15 — — — 528.91 16.24 2.98 0.94L 1.38 14.98 1 — — — 4,032.35a 377.28 34.53 �0Mm 0.55 15.00 15 — — — 515.86 35.23 4.43 �0Mc 0.62 15.00 8 — — — 318.06 29.80 3.59 0.86Mc
� 0.58/0.64 15.00 8 — — — 247.60 23.45 3.35 0.96Q 0.53 15.00 23 — — — 1,192.19 3.19 1.26 0.98Pooled 0.59 15.00 23 — — — 2,368.56 32.03 4.46 �0
Perfect integrator modelsPerfect race
F 138.26 15.00 8 — — — 2,077.78a 29.66 4.81 0.74L 143.69 16.85 4 — — — 83.39 8.62 1.80 0.90Mm 179.74 16.18 7 — — — 639.29a 27.90 3.96 0.71Mc 138.10 13.41 1 — — — 10,178.87a 253.57 29.15 0.18Mc
� 121.64/200.84 10.00 1 — — — 970.39a 36.10 4.81 0.91Q 264.97 14.98 5 — — — 4,528.94a 7.42 2.02 0.89Pooled 163.41 14.97 5 — — — 4,462.08a 41.11 5.53 0.69
Perfect diffusionF 27.05 10.00 15 — — — 1,495.25a 22.55 3.93 0.17L 79.05 15.78 5 — — — 27.06 2.32 0.88 0.97Mm 36.65 15.88 14 — — — 283.41 15.70 2.67 0.73Mc 48.06 10.00 4 — — — 933.64 70.16 7.01 0.71Mc
� 37.38/63.78 13.93 4 — — — 322.98 27.21 3.69 0.95Q 64.23 14.93 12 — — — 2,775.81 10.51 2.28 0.80Pooled 43.04 15.01 10 — — — 936.29 8.97 1.99 0.87
Perfect competitiveF 98.64 14.95 10 0.0025 — — 1,699.13 20.98 3.47 0.66L 119.55 15.00 11 0.0034 — — 10.39 0.90 0.53 0.98Mm 120.89 14.97 23 0.0028 — — 354.44 24.38 3.64 0.74Mc 92.42 15.00 15 0.0063 — — 1,206.93 102.74 9.06 0.46Mc
� 81.28/122.82 15.01 8 0.0039 — — 380.10 29.97 3.66 0.92Q 176.58 15.00 19 0.0023 — — 1,119.75 2.42 1.05 0.94Pooled 105.39 15.03 21 0.0037 — — 1,922.71 23.55 3.46 0.78
Leaky modelsLeaky race
F 33.13 15.00 7 — 0.0178 — 222.10 5.33 1.67 0.98L 100.25 14.99 5 — 0.0036 — 42.89 5.22 1.42 0.86Mm 52.72 14.99 10 — 0.0114 — 143.79 5.31 1.32 0.90Mc 10.66 15.00 12 — 0.0753 — 823.83 79.06 7.14 0.51Mc
� 27.76/31.53 15.00 8 — 0.0247 — 324.37 30.67 4.21 0.95Q 65.61 15.00 20 — 0.0097 — 134.45 1.70 0.95 0.98Pooled 49.67 14.99 11 — 0.0124 — 418.04 9.27 2.02 0.94
Leaky diffusionF 10.27 14.98 10 — 0.0210 — 420.61 12.01 2.67 0.88L 69.33 15.82 5 — 0.0018 — 21.07 2.51 0.99 0.98Mm 22.04 15.33 8 — 0.0096 — 253.00 5.72 1.71 0.99Mc 7.03 15.03 7 — 0.0667 — 490.18 26.89 3.25 0.88Mc
� 9.82/11.82 15.00 6 — 0.0402 — 190.50 17.64 3.01 0.97Q 12.88 15.00 15 — 0.0276 — 713.87 2.50 1.02 0.94Pooled 23.22 14.95 10 — 0.0111 — 112.62 1.61 0.82 0.99
Leaky competitiveF 15.07 15.00 17 0.0474 0.0400 — 171.04 6.09 1.72 0.97L 118.84 15.00 12 0.0036 0.0000 — 10.28 0.82 0.49 0.99Mm 59.12 15.00 9 0.0001 0.0096 — 59.38 5.67 1.44 0.91
(table continues)
11NEURALLY CONSTRAINED MODELING OF DECISIONS

failed to fit the remaining individual data sets (L, Mm, and Mc:R2 � 0.86). We conclude that the nonintegrated difference modelcannot fit the behavioral data.
Discussion
Visual neurons in FEF are hypothesized to combine feature infor-mation from early visual areas to represent the visual salience ofobjects (e.g., Carpenter et al., 2009; Hamker, 2005a; Thompson &Bichot, 2005); therefore, it was possible that temporal integration isunnecessary. The nonintegrated models assume that a response isinitiated when the perceptual evidence given by FEF visual neuronactivity crosses some threshold. In other words, this hypothesizes thatmovement neurons simply pool visual neuron inputs and compare thatpooled activity level directly to a response threshold but do notintegrate that activity over time. However, these models failed toaccount for behavior regardless of whether the absolute level ofactivity or a difference in activity was compared to threshold. Someadditional mechanism is required to account for behavior. Previousmodeling studies strongly suggest temporal integration.
Perfect Integrator Models
We next evaluated three models that assume perfect integrationof visual neuron inputs. Formally, we characterized each of theseperfect integrator models with specific parameterizations of thefollowing equations,
dmT �t� �dt
�vT �t� � u � vD�t� � � � mD�t�� � �dt
�T, (6)
dmD�t� �dt
�vD�t� � u � vT �t� � � � mT �t�� � �dt
�D, (7)
that specify the change in activation of the movement unit repre-senting a decision to move the eyes to a target (mT) or a distractor(mD) at each time step, dt (dt/ was set to 1 ms in all simulations).Movement units perfectly integrated visual activity (vT and vD)with respect to time and initiated a saccade when activationreached the threshold, �, after the ballistic time, tballistic.
Inhibitory interactions among response alternatives could beimplemented at two levels: (a) Competition between visual neuron
Table 2 (continued)
Data set � tballistic N � k g �2 X2 Xcrit2 R2
Leaky models (continued)
Mc 22.63 15.01 24 0.0517 0.0296 — 365.16 33.11 3.49 0.81Mc
� 47.31/57.59 15.00 5 0.0005 0.0117 — 218.22 20.57 3.22 0.97Q 65.65 15.00 20 0.0000 0.0097 — 133.94 1.10 0.68 0.99Pooled 28.91 15.00 12 0.0151 0.0211 — 102.00 1.56 0.77 0.99
Gated modelsGated race
F 11.66 15.00 9 — 0.0126 0.4616 317.63 6.87 1.92 0.98L 56.14 15.00 7 — 0.0000 0.3767 53.48 4.13 1.52 0.96Mm 11.63 15.00 24 — 0.0083 0.5435 100.23 8.00 2.26 0.98Mc 12.32 15.00 8 — 0.0242 0.4385 1,127.52 76.47 8.38 0.61Mc
� 36.90/54.26 14.99 5 — 0.0067 0.2527 342.98 23.85 3.85 0.97Mc
�� 48.22 15.00 5 — 0.0037 0.2225/0.4125 195.00 15.02 2.78 0.99Q 21.59 15.00 19 — 0.0002 0.5850 272.78 2.61 1.13 0.99Pooled 17.18 15.03 22 — 0.0003 0.5782 190.94 2.33 1.17 0.99
Gated diffusionF 7.04 14.99 11 — 0.0172 0.1335 488.20 13.78 3.05 0.98L 57.25 14.85 4 — 0.0000 0.1524 51.21 2.10 0.91 0.97Mm 9.36 14.99 10 — 0.0024 0.2600 84.80 10.49 2.63 0.89Mc 3.19 15.00 8 — 0.0308 0.3612 486.18 28.95 3.60 0.91Mc
� 7.65/11.78 15.00 6 — 0.0229 0.1496 279.16 20.92 3.15 0.97Mc
�� 10.53 14.99 15 — 0.0001 0.2117/0.3772 211.29 10.74 3.30 0.98Q 15.28 14.99 13 — 0.0050 0.2000 365.39 2.42 1.07 0.99Pooled 16.72 14.99 11 — 0.0037 0.18 146.64 1.58 0.90 0.99
Gated competitiveF 11.31 15.00 9 0.0077 0.0088 0.4748 302.49 6.75 2.02 0.97L 58.22 15.00 6 0.0036 0.0000 0.3409 52.57 3.44 1.36 0.99Mm 12.39 15.00 18 0.0136 0.0053 0.5449 84.82 5.66 1.81 0.92Mc 10.29 15.01 11 0.0012 0.0388 0.3748 591.52 75.48 8.06 0.53Mc
� 44.95/61.04 14.98 5 0.0000 0.0075 0.1566 335.65 21.41 3.46 0.95Mc
�� 52.16 15.01 5 0.0000 0.0050 0.2383/0.4238 192.83 15.71 3.52 0.98Q 21.20 15.00 19 0.0016 0.0001 0.5850 246.14 2.84 1.24 0.99Pooled 16.81 14.99 20 0.0000 0.0007 0.5768 149.88 2.35 1.11 0.98
Note. �2 indicates the goodness of fit between predicted and observed response time (RT) and distributions on the easy (if performed) and hard searchtasks. X2 indicates the same goodness of fit but is not dependent on the number of observations to facilitate comparison across datasets. Xcrit
2 indicates themaximum difference in fit that would be expected by chance. R2 indicates the proportion of variance in RT accounted for by the models. All modelspredicted � 90% accuracy for every data set except those with �2 values noted with a subscript a (a). Mc
� indicates a version of the model in which thethreshold, �, was free to vary between conditions. Mc
�� indicates a version of the model in which the gate parameter, g, was free to vary between conditions.Dashes indicate that a parameter was fixed to zero for this model.
12 PURCELL ET AL.

inputs that were determined by the parameter u correspond tofeed-forward inhibition (e.g., Hamker, 2005b) or (b) competitionbetween movement units that were determined by a parameter �correspond to lateral inhibition (e.g., Usher & McClelland, 2001).We evaluated a perfect race model (u � � � 0), in which each unitindependently accumulates the activity of a visual neuron repre-senting the object in its receptive field; this corresponds to previ-ous models of two-alternative forced-choice tasks (Smith & VanZandt, 2000; Vickers, 1970). We evaluated a perfect diffusionmodel (u � 1, � � 0), in which evidence for one response issimultaneously counted as evidence against the competing re-sponse; this is a neurally plausible implementation of a one-dimensional diffusion process. As a result, movement units inte-grate the difference between visual neuron inputs (similar to thedifference operation proposed by Ditterich, 2006a; Mazurek et al.,2003). Finally, we evaluated a perfect competitive model (u � 0,� free to vary), in which lateral inhibition between response unitsat a given time point depends on the current activation of that unitweighted by �; this corresponds to models that implement winner-take-all dynamics through mutually inhibitory units (similar toUsher & McClelland, 2001; see also Wang, 2002, for a detailedneurophysiological implementation).
We included a Gaussian noise term, �, for both accumulatingunits with a mean of zero and a standard deviation of �. In mostimplementations of stochastic accumulator models, the only intra-trial variability comes from this noise term. However, in our case,there was substantial noise inherent in the input, vT and vD, becauseinput was derived directly from spike trains that are inherently noisy.Thus, we parsed noise into two components: exogenous noise that isinherent in the visual neuron input and endogenous noise that is
intrinsic to the movement units given by �. We explored versions ofthese models with various levels of endogenous noise, but addingnoise did not strongly affect most predictions. Therefore, for thesemodels, we assumed that all noise was due to the visual neuroninput by fixing � � 0 in all cases. We explore models withendogenous noise later in this article.
The fits of the perfect integrator models to the RT distributionsare shown in the left panels of Figure 8, and details are given inTable 2. By our criterion, the overall fit was very poor for the raceand competitive models (race R2 � 0.69, competitive R2 � 0.78)because they severely underestimated between-condition variabil-ity. The diffusion model provided a slightly better account of thepooled data set than the race and competitive models (R2 � 0.87)but still underestimated between-condition variability and missedthe upper tail of the hard RT distribution. All models failed to meetour benchmark of accounting for 90% of the variance. The fits tothe individual data sets were also poor for each of the perfectintegrator models (see Figure 9, left panels). The poor fit can besummarized in the low average R2 (R2) across data sets (race R2 �0.69, diffusion R2 � 0.71, competitive R2 � 0.76). In general, themodel fits the data sets of individual monkeys poorly, althoughthere is some variability across data sets.
Discussion
Integration appears to be necessary, but models assuming per-fect integration could not predict the observed behavior. Why didthese models fail when similar models have been successful inaccounting for richer sets of data? The models failed because, inour approach, visual neuron activity is input to accumulator units
Figure 8. Behavioral predictions of the perfect (left panels), leaky (middle panels), and gated (right panels)accumulator models to the pooled data set. Each panel shows the predicted cumulative response time (RT)distributions for the pooled data set (solid lines) with observed 10th, 30th, 50th, 70th, and 90th percentiles (opencircles). Easy is red, hard is green.
13NEURALLY CONSTRAINED MODELING OF DECISIONS

continuously over time. There is no mechanism to limit the rate ofaccumulation prior to the onset of the stimulus array. Visualneurons do not discriminate the target until late in the trial, whichmeans that units accumulate noise for the majority of the trial.Stimulus-dependent differences in the model inputs have little timeto impact the accumulation. Some mechanism is necessary to limitthe rate of accumulation until a decision is made.
Several plausible mechanisms could be implemented to limit therate of input to the accumulator units. Many accumulator modelscircumvent this problem by assuming that the start of the accu-mulation is delayed relative to the onset of the stimulus. It isplausible that some external signal initiates the accumulationsometime after the stimulus onset. However, a more complete andparsimonious explanation is that some mechanism limits the rateof flow from visual to movement neuron activity until a relevantsignal is present. In the following sections, we evaluate two simplemechanisms that perform that function.
Leaky Accumulator Models
We first asked whether leaky integration could improve modelperformance. Leakage in these models is implemented as self-inhibition of a unit that scales with the activation of the unit at agiven point in time. We considered leaky versions of the racemodel, diffusion model, and competitive model as follows:
dmT �t� �dt
�vT �t� � u � vD�t� � � � mD�t� � k � mT �t�� � �dt
�T,
(8)
dmD�t� �dt
�vD�t� � u � vT �t� � � � mT �t� � k � mT �t�� � �dt
�D.
(9)
Here, k is the leakage constant, and all other variable are asdescribed earlier. Leakage is inherently inhibitory, so k is con-strained to be greater than zero. As with the perfect integratormodels, we evaluated a leaky race model (u � � � 0), a leakydiffusion model (u � 1, � � 0), and a leaky competitive model(u � 0, � free to vary). We report values where leakage wasoptimized to fit behavior, and we also explored the effect ofvarying the value of the leakage constant incrementally whilefinding best fitting values of the other parameters. As before, wefound that adding small amounts of endogenous noise did notaffect model predictions, so it was fixed to zero (� � 0).
The fits of the leaky models to the pooled data set are shown inFigure 8 (center panels). In contrast to the perfect integratormodels, all leaky integrator models provided a good account of thepooled data set (all R2 � 0.90). This improvement in fit, relativeto perfect integrator counterparts, was significant for all threemodels (all Xdiff
2 � 7.36, all p � .05). The leaky models also fitnearly all individual data sets very well (see Figure 9; all R2 �0.90, except Mc). In general, the fit of the leaky integrator modelwas significantly better than that of the perfect integrator models.For the race model, the improvement in fit was significant for alldata sets (all Xdiff
2 � 3.38, all p � .05); for the diffusion model, theimprovement was significant for most (four out of five) individualdata sets (all Xdiff
2 � 2.27, all p � .05, except L, Xdiff2 � 0.19, p �
.72); and for the competitive model, this improvement was signif-
Figure 9. Behavioral predictions of the perfect (left panels), leaky (middle panels), and gated (right panels)accumulator models to all data sets. Each panel shows a scatterplot of the observed versus predicted responsetime (RT) quantiles that were fit by the data. Easy is red, hard is green. Monkey F � E, L � , Mm � �, Mc �x, and Q � ●.
14 PURCELL ET AL.

icant for most (four out of five) individual data sets (all Xdiff2 �
1.32, all p � .05, except L, Xdiff2 � 0.08, p � .88). Across models,
only the Mc data set was fit poorly, which we attribute to low trialnumbers. To summarize, the leaky integrator models fit the pooleddata and nearly all data sets very well, and the improvement overthe perfect integrator models was nearly always significant.
We also compared behavioral fits between the leaky race, leakydiffusion, and leaky competitive models, but differences in fitacross these models were not consistent enough to draw strongconclusions about the nature of interactions among response units.Leaky integrator models that assume different forms of competi-tion seem able to predict behavior equally well, at least for thebehavioral data set we tested.
Discussion
Unlike perfect integrators, models that assume leaky integrationpredicted the observed behavior. Here, leakage is advantageousbecause it asymptotically limits the accumulation of perceptualevidence prior to a decision. Visual neuron inputs are approxi-mately constant in the absence of a stimulus, so accumulatoractivity reaches a lower asymptote when the rate of decay isapproximately equal to the input. Following the presentation of thesearch array, visual neuron inputs increase, so the accumulatorsbegin to increase again until an upper asymptote is reached. If thethreshold is placed between the lower and upper asymptotes, thenthe model will predict a baseline firing rate that increasesto threshold when the visual neuron inputs increase. In otherwords, the leak is constant throughout the trial, but it is the levelof input that changes. Thus, leakage provides one way to limit therate of accumulation in the presence of dynamic neural inputs.
Leakage limits the rate at which evidence is accumulated, butevidence still flows continuously to accumulator units. Thesemodels assume that visual neurons represent relevant perceptualevidence while movement neurons simultaneously accumulate thatevidence over time. Alternatively, a pure discrete stage modelwould assume that the accumulation of evidence does not beginuntil perceptual processing is complete, when a representation ofperceptual evidence is achieved. This assumption is made bymodels in which the drift rate is constant and the accumulationbegins some delay following the presentation of the stimulus.However, this assumption seems at odds with our neurally con-strained framework in which perceptual evidence is defined by aneural representation that evolves continuously over time. In thefollowing section, we evaluate a new set of models assuming thatthe start of the accumulation is not determined by a fixed delayfrom the stimulus onset but, like leakage, depends on the level ofvisual input flowing into the accumulator. In contrast to leakage,input is gated prior to reaching the accumulator until it exceeds aparticular level. In this way, these simple models represent aneurally plausible implementation of discrete stages.
Gated Accumulator Models
We tested gated models of perceptual decision making thatassume dynamic visual neuron input exactly like the continuousflow models described so far but where a gate parameter controlsthe minimum level of visual neuron input needed to modulate
activity of the movement units. Formally, the following equationsdefined the gated models:
dmT �t� �
dt
��vT �t� � u � vD�t� � g� � k � mT �t� � � � mD�t�� � �dt
�T,
(10)
dmD�t� �
dt
��vD�t� � u � vT �t� � g� � k � mD �t� � � � mT �t�� � �dt
�D.
(11)
The gate parameter, g, is a constant inhibition applied to the visualneuron input that drives the accumulators. Mathematically, this isequivalent to constraining the total input to be greater than g foraccumulation to begin. Once g is exceeded, it continues to besubtracted from the visual inputs but does not scale with the levelof the accumulation. The term (vT (t) u � vD(t) g) is constrainedto be � 0 because the gate is applied to the input, not themovement units themselves. In all fits, g was a free parameter thatwas constrained to be greater than zero. We evaluated a gated racemodel (u � � � 0), a gated diffusion model (u � 1, � � 0), anda gated competitive model (u � 0, � free to vary).6
Like the earlier models, we have a term for intrinsic Gaussiannoise with a mean of zero and standard deviation, �. As before, wefound that including noise did not impact behavioral predictions.However, if m(t) starts at zero and g is high enough to suppressinput to zero, then there is nothing to accumulate, so the modelspredicted little to no baseline activation. Most FEF movementneurons have a small tonic baseline firing rate (Bruce & Goldberg,1985; Schall, 1991; Segraves & Goldberg, 1987); therefore, weincluded an endogenous noise term to represent stochastic ele-ments in movement neuron activity or the neural circuit. Lowlevels of intrinsic noise (� � 0.2) accumulate in movement units,and low levels of leakage cause activation to asymptote at arelatively invariable baseline that is well below threshold. Thismeans that the baseline level of activity is primarily due to intrinsicnoise but that the rise of activation to threshold is primarily due tomodulations in the visual neuron inputs.
The fits of the gated models to the pooled behavioral data areshown in Figure 8. All three gated models provided an excellentaccount of the pooled data set (race R2 � 0.99, diffusion R2 �0.99, competitive R2 � 0.98). Compared to their leaky coun-terparts, only the gated race model fit significantly better thanits leaky counterpart (race Xdiff
2 � 6.94, p � .05), whereas thefit was not significantly different for the other models (diffusionXdiff
2 � 0.02, p � .96; competitive Xdiff2 � 0.81, p � .16).
On average, all three gated models accounted for the individualdata sets very well (see Figure 9; race R2 � 0.92, diffusionR2 � 0.95, competitive R2 � 0.90), with the exception of Mc.The change in fit between the leaky race and gated race models
6 Working simulations of the accumulator models described in thisarticle can be downloaded from http://catlab.psy.vanderbilt.edu/wp-content/uploads/PurcellHeitzCohenLoganSchallPalmeri_PublicCode.zip
15NEURALLY CONSTRAINED MODELING OF DECISIONS

was not significant for most (four out of five) individual datasets (Xdiff
2 � 2.78, p � .09), except Mm for which the leakymodels fit slightly, but significantly, better (Xdiff
2 � 2.70, p �.02). The change in fit between the leaky diffusion and gateddiffusion models was not significant for most (four out of five)individual data sets (Xdiff
2 � 2.02, p � .25), except Mm for whichthe leaky models fit significantly better (Xdiff
2 � 4.73, p � .001).The leaky competitive models fit significantly better than the gatedmodels for most (three out of five) individual data sets (Xdiff
2 �1.74, p � .05), but two data sets were not significantly different (Fand Mm, both Xdiff
2 � 0.64, p � .50). In general, the gated andleaky models fit the data equally well. As with the leaky models,we also compared the models against one another but found littleevidence to support one form of competition over another.
For all of the models tested so far, the fits to the Monkey Mcolor search data set (Mc) were poor relative to the other data sets(see Figure 9 [x symbols] and Table 2). In particular, models oftenunderestimated the RT difference between easy and hard condi-tions. This is most likely because the Mc data set included fewertrials than the other data sets, and therefore, the population of spiketrains from which inputs were sampled was not variable enough topredict observed variability in behavior. We also explored somepotential process-oriented explanations. One possibility is that themonkey was able to rapidly adapt its criterion depending on thedifficulty of the search task. Indeed, fits were improved for allmodels if we allowed the threshold to increase for the hard relativeto the easy condition (see Table 2, Mc
*). Another possibility is thatthe gate parameter could be strategically adjusted for the easy andhard conditions. Fits of this elaborated model were also substan-tially improved (see Table 2, Mc
**). This may indicate that the gateconstant can be selectively modified to adapt behavior, but data inwhich animals are able to modify their performance across blockswill be necessary to evaluate more rigorously this hypothesis.
Discussion
A primary goal of these simulations was to determine whethervisual neuron dynamics could serve as a neural representation ofperceptual evidence. Models that assume leaky or gated integrationprovide an excellent account of the distributions of saccade RTs. Itmay be seen as quite surprising that any of the models successfullyaccounted for observed RT distributions. From a modeling stand-point, the use of raw neural inputs dramatically reduces the numberof free parameters that would typically be optimized to fit behav-ior. Indeed, the impact of these neural constraints is illustrated bythe models that could not adequately fit behavior. Furthermore,from a neurophysiological standpoint, the full neural circuitryrequired for saccade control is complex and incompletely under-stood. Yet, by assuming a simple connection between visual andmovement neurons, these models capture essential characteristicsof behavior. Visual neuron activity during search is sufficient toserve as input to the accumulation decision process thought to beinstantiated in movement neurons.
Another goal of these simulations was to determine the mech-anisms that are necessary to predict behavior from the neuralrepresentation of evidence in FEF visual neurons. The perfect andleaky integrator models assume a continuous flow of informationfrom visual processing to evidence accumulation. In contrast, thegated models assume that gating inhibition prevents the integration
of evidence early in the trial when no information is present in thesignal (i.e., when the visual neurons have not yet selected thelocation of the target). In other words, the gate acts as a thresholdon the evidence that must be reached before the accumulationprocess can begin. Despite the important theoretical distinction,there was little evidence to distinguish the gated and leaky modelsbased on behavioral fits alone. We turned to the neurophysiologyto resolve this mimicry.
Thus far, we used neurophysiological recordings from visualneurons to constrain the perceptual evidence driving models ofdecision making and contrasted models on their ability to accountfor observed behavior. If the link between movement neurons andthe accumulation of evidence is valid, then accumulator unitsshould predict the observed neural dynamics. In the next section,we quantify and compare the dynamics of movement neuronsrecorded in FEF with dynamics of predicted model accumulatoractivity. Models that predict both neural and behavioral datashould be selected in favor of models that predict only behavior.
Accounting for Movement Neuron Dynamics
The goal of the following analyses was to compare quantita-tively the dynamics of the model accumulator units with move-ment neuron activity. Note that the movement neuron activity is aprediction of the model, not a fit to data. The parameters thatoptimized fits to the behavior were used to generate predictedactivity trajectories. These trajectories were then analyzed usingthe same algorithms applied to the FEF movement neurons.
Analysis of Movement Neuron Dynamics
Woodman et al. (2008) analyzed how movement neuron activityvaried with RT in monkeys performing visual search with stimulisupporting more or less efficient search. Following their method-ology, trials in which a saccade was made correctly to a target inthe neuron’s movement field were sorted by RT and grouped intobins of 10 trials. A spike density function was generated for eachbin of 10 trials (see Figure 10A). We calculated four characteristicsof each spike density function: (a) time of onset of activity, (b)growth rate, (c) baseline discharge rate, and (d) threshold dis-charge rate (see Figure 10B). The onset, growth rate, and baselinewere calculated from spike density functions generated from trialsof spike trains that were aligned on the time of the presentation ofthe search array. To calculate the onset of activation, we used asliding-window algorithm (20 ms to 20 ms) that moved back-ward in 1-ms increments from 15 ms before the time of saccadeinitiation. The onset of activation was given when the followingthree criteria were met: (a) Activity no longer increased accordingto a Spearman correlation (� � .05) within the window around thecurrent time, (b) activity at that time was less than activity duringthe 20 ms preceding saccade onset, and (c) as the window wasmoved backward in time, the correlation remained nonsignificantfor 20 ms. The growth rate was calculated by dividing the differ-ence between the threshold activity level and the activity level atthe time of onset by the difference between the time of saccade andthe time of activity onset. Baseline activity was calculated as theaverage activity in the 200 ms prior to the appearance of the searcharray. Threshold was measured using a spike density function thatwas generated by aligning trials on the time of saccade for each RT
16 PURCELL ET AL.

group. The threshold activity was computed as the average activitylevel of a neuron in the interval 20 to 10 ms relative to saccade(J. W. Brown, Hanes, et al., 2008; Hanes & Schall, 1996).
Figure 10B shows scatterplots of each neural activity measure-ment versus RT for each bin for one characteristic neuron. Wecomputed the correlation (r) between each measure of neuralactivity for the trials in each bin and the mean RT for each bin.This neuron shows a strong correlation between the onset ofactivity and RT for both difficulty conditions (reasy � 0.91, rhard �0.94, p � .05). However, the correlation with RT was not signif-icant for growth rate (reasy � 0.35, rhard � 0.26, both p � .29),baseline (reasy � 0.12, rhard � 0.23, both p � .59), andthreshold (reasy � 0.12, rhard � 0.12, both p � .72). Figure 10Csummarizes the results for the entire population of movementneurons that were analyzed. Since there were no major qualitativedifferences, results were combined across individual monkeys andtasks. Table 3 summarizes the mean correlation and percentage ofsignificant correlations (� � .05) for the entire set of neurons.Most notably, a high percentage of neurons showed a significantpositive correlation between the time of onset of activity and RT inboth difficulty conditions (r�easy � 0.53 [54.9%], p � .05; r�hard �0.72 [68.9%], p � .05). However, there was little or no corre-lation between baseline (r�easy � 0.11 [3.9%], p � .05; r�hard �
0.05 [1.6%], p � .05), and threshold (r�easy � 0.12 [9.8%], p �.05; r�hard � 0.06 [13.1%], p � .05) for the vast majority ofneurons. Some neurons did show a significant correlation betweengrowth rate and RT (r�easy � 0.22 [3.9%], p � .05; r�hard � 0.14[6.6%], p � .05), but the relationship was far weaker than thatobserved between the onset and RT. These observations are inagreement with previous reports that when stimuli vary in discrim-ination difficulty, RT correlates most strongly with the onset ofneural activity (Thompson & Schall, 2000; Woodman et al., 2008),correlates less strongly with the growth rate of neural activity(Hanes & Schall, 1996), and does not vary with the baseline orthreshold in this task.
We also measured activity of movement neurons when a dis-tractor was in their movement field and a saccade was made toanother location. We compared this activity with the activity of thesame neuron when a target was in its movement field. We aver-aged activity in the time interval when threshold on movementneuron activity would be reached (20 to 10 ms prior to sac-cade). We calculated a distractor/target (D/T) ratio:
D/ T ratio �Din � B
Tin � B. (12)
Figure 10. Movement neuron activity. A: Activity for a representative movement neuron from fast and slowtrials (average activity from 10 consecutive trials at the 0.1 and 0.9 response time [RT] quantiles). B: Scatterplotsof neural measurements plotted versus RT. Insets illustrate the pattern of activity implicated by a significantcorrelation. C: Mean correlation across all movement neurons. Percentages of neurons with significant corre-lation are shown below. D: Mean distractor/target (D/T) ratio. Error bars are 95% confidence intervals. Easytrials are in red, hard trials in green. Fast trials are in black, slow trials in grey. Inset illustrates calculation. sp/s �spikes per second.
17NEURALLY CONSTRAINED MODELING OF DECISIONS

Tin is the activity of the movement neuron when the target wasin its movement field prior to the saccade, Din is the activitywhen the distractor was in its movement field, and B is thebaseline activity of the neuron (see Figure 10D). We onlyincluded movement neuron activity responding to distractorsthat were not adjacent to the target to ensure distractors andtargets were in different receptive and movement fields and toavoid local suppressive zones surrounding the receptive andmovement fields of neurons in FEF (Schall, Hanes, et al., 1995;Schall et al., 2004). Thus, the D/T ratio represents activity whena saccade was made to a distant location in the visual field.
The D/T ratio was interpreted as the level of evidence accumu-lated for a saccade to the distractor relative to the threshold at thetime a decision was made (i.e., the threshold was crossed). Apositive value indicated that accumulated evidence supporting adistractor was still present although the response was made to thetarget. A negative value indicated that accumulated evidence sup-porting a distractor response was suppressed or decayed belowbaseline at the time a decision was made, which was present in asmall number of neurons. A ratio near zero indicated that accu-mulated evidence supporting the distractor either remained atbaseline for the duration of the trial or increased but then decayedto baseline level by the time the decision was made.
On average, movement neurons showed slightly elevated activ-ity when a response was made to a target opposite their receptivefield. Figure 10D shows 95% confidence intervals around themean observed D/T ratio across the neurons (Measy � 0.15,Mhard � 0.18). For both easy and hard, this ratio was significantlygreater than zero, teasy(50) � 2.90, thard(60) � 3.31, both p � .05,and significantly less than 1.0, teasy(50) � 16.42, thard(60) �18.36, both p � .05. There was no significant difference betweeneasy and hard conditions in this ratio, paired t(50) � 1.68, p � .05(excluding Data Set Q, which had no easy condition). Table 4(right column) summarizes these results.
Analysis of Model Dynamics
We conducted the same analyses on the movement unit trajec-tories predicted by each model, calculating onset, baseline, growthrate, threshold, and D/T ratio. The results in the previous sectionestablished five benchmark criteria that the models must satisfy topredict movement neuron activity. For targets in the movementfield, they should predict (a) a strong positive correlation betweenthe onset of activation and RT, (b) a weak inverse correlationbetween growth rate and RT, and zero correlation between RT andthe (c) baseline or (d) threshold. Finally, for distractors in themovement field, they should predict (e) a D/T ratio that is close tozero. Later, we quantify additional characteristics of the trajecto-ries, but these five criteria proved most useful for model selectionpurposes.
Model unit accumulation was defined in terms of spike rate(normalized to arbitrary measurement units). Our simulation meth-ods allowed us to generate thousands of simulated trials (each witha predicted RT and activation pattern), whereas only �120 trials ofspike activity were analyzed from each neuron from trials in whichthe target was in the neuron’s movement field. To have commen-surate statistical comparisons of models and neurophysiology, ouranalyses of model dynamics were performed in the following way:(a) We generated 120 simulated trials to approximate the averagenumber of trials of observed movement neuron activity, (b) wenormalized and rescaled the model trajectories from those trials bythe approximate average observed threshold across neurons, (c) wegenerated one spike train for each trial according to a time-inhomogeneous Poisson process with the rate given by the modelactivation trajectory for that trial, (d) we binned the simulatedspike trains into groups of 10 trials according to the predicted RT,and (e) we generated an activation function (in spikes per second[sp/s]) from the predicted spikes exactly as was done for the actualspikes. These steps were repeated 500 times to obtain a distribution
Table 3Movement Neuron and Model Dynamics: Mean Correlation With Response Time (Percentage of Significant Correlationsin Parentheses)
Onset Growth rate Baseline Threshold
Neural data and modelpredictions Easy Hard Easy Hard Easy Hard Easy Hard
Neural dataMovement neurons 0.53 (54.9) 0.72 (68.9) 0.22 (11.5) 0.14 (9.8) 0.11 (3.9) 0.05 (1.6) 0.12 (9.8) 0.06 (13.1)
Perfect integrator modelsRace 0.58 (60.6) 0.67 (75.1) 0.03 (4.3) 0.02 (2.9) 0.82 (98.6) 0.82 (97.2) 0.02 (3.0) 0.01 (2.6)Diffusion 0.46 (37.7) 0.64 (67.6) 0.10 (7.0) 0.07 (6.5) 0.68 (78.6) 0.67 (73.5) 0.02 (2.6) 0.02 (1.9)Competitive 0.60 (62.6) 0.71 (81.5) 0.05 (2.8) 0.03 (2.8) 0.78 (94.9) 0.79 (96.6) 0.03 (2.8) 0.02 (3.0)
Leaky modelsRace 0.72 (85.1) 0.79 (92.4) 0.13 (6.5) 0.10 (3.8) 0.36 (22.6) 0.30 (18.2) 0.06 (4.2) 0.05 (3.8)Diffusion 0.58 (57.2) 0.76 (87.0) 0.16 (6.6) 0.11 (5.6) 0.26 (21.6) 0.26 (17.9) 0.10 (5.8) 0.09 (4.4)Competitive 0.61 (66.4) 0.72 (85.0) 0.07 (3.9) 0.06 (3.4) 0.57 (59.0) 0.56 (58.8) 0.02 (3.6) 0.01 (3.1)
Gated modelsRace 0.67 (71.9) 0.83 (96.0) 0.22 (13.3) 0.11 (7.0) 0.04 (5.2) 0.05 (5.4) 0.10 (6.0) 0.10 (4.4)Diffusion 0.63 (68.1) 0.84 (96.0) 0.24 (9.2) 0.16 (6.2) 0.07 (6.4) 0.09 (7.3) 0.08 (4.5) 0.10 (5.5)Competitive 0.67 (70.8) 0.83 (95.8) 0.19 (11.3) 0.10 (5.2) 0.11 (6.9) 0.06 (5.2) 0.09 (5.4) 0.09 (4.4)
Note. Percentages of neurons/simulations with a significant correlation were calculated with � � .05. Observed data combine across animals. Predicteddata are averaged across data sets. See Figures 11, 12, and 13 for plots of individual data sets. Data from Monkey Q are included in the hard condition.A subset of the neural data was previously published (Woodman, Kang, Thompson, & Schall, 2008).
18 PURCELL ET AL.
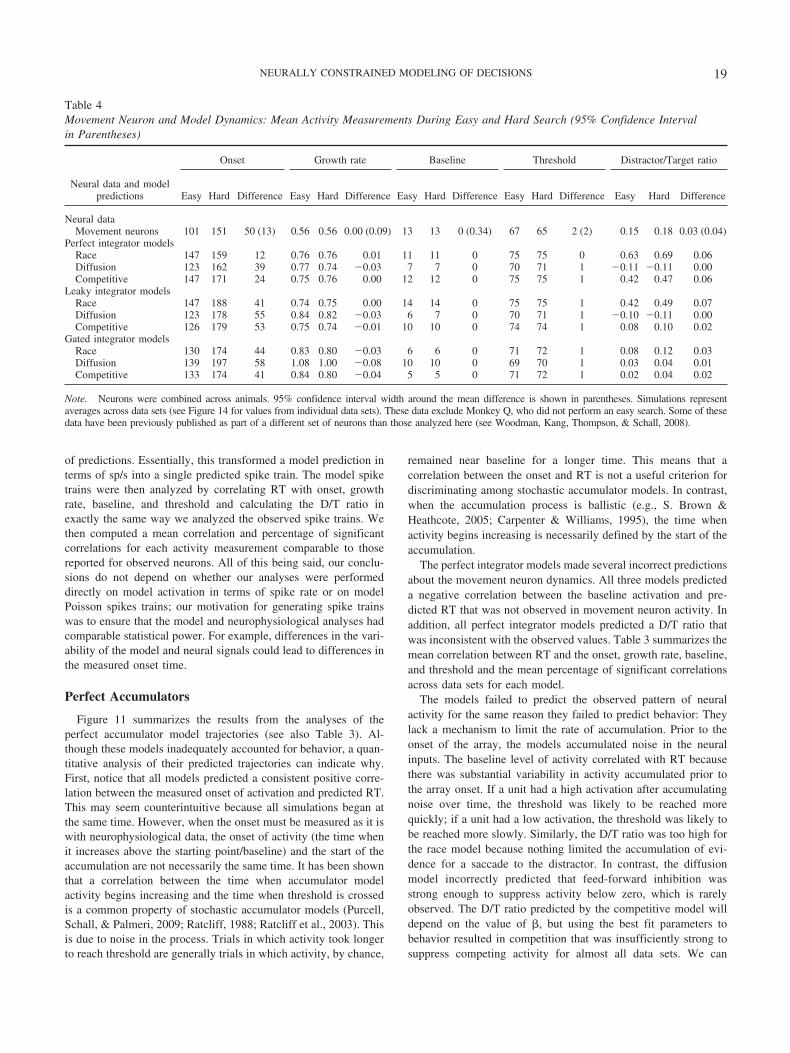
of predictions. Essentially, this transformed a model prediction interms of sp/s into a single predicted spike train. The model spiketrains were then analyzed by correlating RT with onset, growthrate, baseline, and threshold and calculating the D/T ratio inexactly the same way we analyzed the observed spike trains. Wethen computed a mean correlation and percentage of significantcorrelations for each activity measurement comparable to thosereported for observed neurons. All of this being said, our conclu-sions do not depend on whether our analyses were performeddirectly on model activation in terms of spike rate or on modelPoisson spikes trains; our motivation for generating spike trainswas to ensure that the model and neurophysiological analyses hadcomparable statistical power. For example, differences in the vari-ability of the model and neural signals could lead to differences inthe measured onset time.
Perfect Accumulators
Figure 11 summarizes the results from the analyses of theperfect accumulator model trajectories (see also Table 3). Al-though these models inadequately accounted for behavior, a quan-titative analysis of their predicted trajectories can indicate why.First, notice that all models predicted a consistent positive corre-lation between the measured onset of activation and predicted RT.This may seem counterintuitive because all simulations began atthe same time. However, when the onset must be measured as it iswith neurophysiological data, the onset of activity (the time whenit increases above the starting point/baseline) and the start of theaccumulation are not necessarily the same time. It has been shownthat a correlation between the time when accumulator modelactivity begins increasing and the time when threshold is crossedis a common property of stochastic accumulator models (Purcell,Schall, & Palmeri, 2009; Ratcliff, 1988; Ratcliff et al., 2003). Thisis due to noise in the process. Trials in which activity took longerto reach threshold are generally trials in which activity, by chance,
remained near baseline for a longer time. This means that acorrelation between the onset and RT is not a useful criterion fordiscriminating among stochastic accumulator models. In contrast,when the accumulation process is ballistic (e.g., S. Brown &Heathcote, 2005; Carpenter & Williams, 1995), the time whenactivity begins increasing is necessarily defined by the start of theaccumulation.
The perfect integrator models made several incorrect predictionsabout the movement neuron dynamics. All three models predicteda negative correlation between the baseline activation and pre-dicted RT that was not observed in movement neuron activity. Inaddition, all perfect integrator models predicted a D/T ratio thatwas inconsistent with the observed values. Table 3 summarizes themean correlation between RT and the onset, growth rate, baseline,and threshold and the mean percentage of significant correlationsacross data sets for each model.
The models failed to predict the observed pattern of neuralactivity for the same reason they failed to predict behavior: Theylack a mechanism to limit the rate of accumulation. Prior to theonset of the array, the models accumulated noise in the neuralinputs. The baseline level of activity correlated with RT becausethere was substantial variability in activity accumulated prior tothe array onset. If a unit had a high activation after accumulatingnoise over time, the threshold was likely to be reached morequickly; if a unit had a low activation, the threshold was likely tobe reached more slowly. Similarly, the D/T ratio was too high forthe race model because nothing limited the accumulation of evi-dence for a saccade to the distractor. In contrast, the diffusionmodel incorrectly predicted that feed-forward inhibition wasstrong enough to suppress activity below zero, which is rarelyobserved. The D/T ratio predicted by the competitive model willdepend on the value of �, but using the best fit parameters tobehavior resulted in competition that was insufficiently strong tosuppress competing activity for almost all data sets. We can
Table 4Movement Neuron and Model Dynamics: Mean Activity Measurements During Easy and Hard Search (95% Confidence Intervalin Parentheses)
Onset Growth rate Baseline Threshold Distractor/Target ratio
Neural data and modelpredictions Easy Hard Difference Easy Hard Difference Easy Hard Difference Easy Hard Difference Easy Hard Difference
Neural dataMovement neurons 101 151 50 (13) 0.56 0.56 0.00 (0.09) 13 13 0 (0.34) 67 65 2 (2) 0.15 0.18 0.03 (0.04)
Perfect integrator modelsRace 147 159 12 0.76 0.76 0.01 11 11 0 75 75 0 0.63 0.69 0.06Diffusion 123 162 39 0.77 0.74 0.03 7 7 0 70 71 1 0.11 0.11 0.00Competitive 147 171 24 0.75 0.76 0.00 12 12 0 75 75 1 0.42 0.47 0.06
Leaky integrator modelsRace 147 188 41 0.74 0.75 0.00 14 14 0 75 75 1 0.42 0.49 0.07Diffusion 123 178 55 0.84 0.82 0.03 6 7 0 70 71 1 0.10 0.11 0.00Competitive 126 179 53 0.75 0.74 0.01 10 10 0 74 74 1 0.08 0.10 0.02
Gated integrator modelsRace 130 174 44 0.83 0.80 0.03 6 6 0 71 72 1 0.08 0.12 0.03Diffusion 139 197 58 1.08 1.00 0.08 10 10 0 69 70 1 0.03 0.04 0.01Competitive 133 174 41 0.84 0.80 0.04 5 5 0 71 72 1 0.02 0.04 0.02
Note. Neurons were combined across animals. 95% confidence interval width around the mean difference is shown in parentheses. Simulations representaverages across data sets (see Figure 14 for values from individual data sets). These data exclude Monkey Q, who did not perform an easy search. Some of thesedata have been previously published as part of a different set of neurons than those analyzed here (see Woodman, Kang, Thompson, & Schall, 2008).
19NEURALLY CONSTRAINED MODELING OF DECISIONS

therefore reject these models on the basis of both poor behavioralfits and poor neural predictions.
Leaky Accumulators
Figure 12 illustrates the results of the leaky accumulator modelsand the mean correlations and percentage of significant correla-tions (see also Table 3). Although leakage improved behavioralfits, it did not sufficiently improve neural predictions. For all threeleaky models, the inverse correlation with the baseline was re-duced, but not eliminated, and the mean predicted correlationsgenerally fell outside the observed confidence interval. Further-more, all three models incorrectly predicted the magnitude of theD/T ratio. The race model predicted that distractor-related activitywould reach a much greater level than was observed. As before,the diffusion model predicted that distractor-related activity wassuppressed below baseline, which was not observed. Finally, thepredictions of the competitive model varied across data sets, whichreflects differences in the best fitting � parameter, but most pre-dictions fell outside the confidence interval around the meanobserved D/T ratio.
We hypothesized that leakage would eliminate the negativecorrelation between the baseline of activity and RT by causingmodel activation to reach a lower asymptote prior to stimulusonset, but a consistent correlation was still observed. The thresholdand leakage parameters were constant across simulations, butvariability in the neural inputs prior to stimulus onset led tovariability in the level at which activity reached the lower asymp-tote. If the distribution of baseline activity was sufficiently largerelative to the threshold, then it was likely to correlate with RT.This was the case for each of the leaky accumulator models.
It is possible that the best fitting parameters could be adjustedsuch that the neural predictions were improved without compro-mising the fits to behavior. Variability in an accumulator wasinversely related to the magnitude of leakage, therefore increasingleakage could eliminate the inverse correlation between baselineactivity and RT. We tried fitting each leaky accumulator modelwhile systematically varying the leakage term in small incrementsand finding the best fitting values of the threshold (�) and tballistic
parameters. However, even small changes in the leakage constantaway from its best fitting value resulted in extremely poor ac-counts of the behavioral data. This is because increasing leakagedecreased the upper asymptote on model dynamics, which re-stricted the range at which the threshold could be placed and stillcapture variability in RT. Thus, although the leaky models ac-counted well for the behavioral data, they failed to predict theobserved pattern of neural results.
Gated Accumulators
Figure 13 illustrates the gated accumulator models’ predictionsof neural activity (see also Table 3). In contrast to previousmodels, there was no significant correlation with baseline orthreshold. Furthermore, the gated models also predicted D/T ratiosthat generally fell within the 95% confidence interval of theobserved mean value. These observations aligned closely with theobserved neurophysiology.
The gated models predicted the neural data well because theyassumed that integration did not begin until the visual inputsexceeded the gate. For nearly all gated models, the value of thegate parameter that optimized behavioral fits was sufficiently highthat the start of the accumulation was delayed until visual neuron
Figure 11. Simulation results: perfect accumulator models. The left panels plot the sample trajectories for therace (Panel A), diffusion (Panel B), and competitive (Panel C) models. The left panels plot model activation fromfast and slow trials (average activity from 10 consecutive trials at the 0.1 and 0.9 response time [RT] quantiles).The center panels plot the mean correlation for simulated data. The right panels plot the mean predicteddistractor/target (D/T) ratio. Brackets are 95% confidence intervals around observed mean values. Symbolsindicate Data Sets F (E), L (), Mm (�), Mc (x), Q (●), and pooled (▫). Easy trials are in red, hard trials in green.
20 PURCELL ET AL.

inputs elevated in response to the stimulus. Across all data sets andgated models, only three data sets (Q, race; Mm, diffusion; Q,competitive) initially predicted a gating value that was too low tosuppress the early accumulation of evidence, but unlike leakage, thisvalue could be increased without a major impact on behavioralpredictions because the upper asymptote of the accumulation will notbe affected. Thus, all variability in the baseline activity was due solelyto the minimal Gaussian noise added to our model, which was too lowto predict a significant correlation with RT. Thus, although the gatedand leaky models predicted indistinguishable accounts of the behav-ioral data, the gated models provided a superior account of theobserved pattern of movement neuron activity.
The gated model met our benchmark criteria for both the be-havioral and neural activity. We followed these results with aseries of additional analyses of the movement neuron and gatedmodel dynamics. Thus far, we have shown that the models pre-dicted the relationship between measurements of activity andrandom (within-condition) variability in RT. Next, we askedwhether the models could accurately predict how activity variedacross difficulty conditions. We computed the average onset,growth rate, baseline, and threshold within each difficulty condi-tion across all neurons (see Table 4, top). Only the onset wassignificantly different between the easy and hard conditions(paired t � 7.58, p � .001; this observation was previouslyreported in Woodman et al., 2008). The difference in onset be-tween easy and hard conditions was correlated with the differencein mean RT between easy and hard (r � .53, p � .001). Bycontrast, growth rate, threshold, and baseline did not significantlyvary across conditions (all t � 1.02, all p � .31), and the difference
in those measures did not correlate with the difference in RT (allr � 0.11, all p � .44).
All three gated models successfully predicted the magnitude of thedifference in onset of activation between conditions without predict-ing other differences (see Figure 14 and Table 4). The averagedifference between conditions across data sets for all measurements(onset, growth rate, baseline, threshold, and D/T ratio) was not sig-nificantly different than the average difference for the movementneurons (race, diffusion, competitive; all t � 1.91, all p � .06).Importantly, the predicted timing of the onset closely corresponded tothe observed ranges. The models slightly overpredicted the absolutevalues of the onset and growth rate, but the match was still very goodconsidering that these were not fitted values.
It is possible that the gated integrators were flexible enough topredict the basic pattern of behavioral and neural data regardless ofthe specific computational architecture. We tested one additionalmodel that implemented competition between visual neuron inputsusing a normalization operation rather than a subtraction. Thisnormalized model divided the input to each accumulator by thesum of the input to both accumulators at each given time step. Thisis a common assumption of stochastic accumulator models thatreduces the number of free parameters (Bogacz et al., 2006;Ratcliff et al., 2007; Usher & McClelland, 2001). As evidence forone alternative grows larger, evidence for the second unit mustnecessarily be reduced. We evaluated two normalized modelsusing the pooled data set, a normalized race without competition(� � 0), and a normalized competitive model (� free to vary). Instark contrast to the other accumulator models, all versions of thenormalized model (perfect, leaky, and gated) failed to account for
Figure 12. Simulation results: leaky accumulator models. The left panels plot the sample trajectories for therace (Panel A), diffusion (Panel B), and competitive (Panel C) models. The left panels plot model activation fromfast and slow trials (average activity from 10 consecutive trials at the 0.1 and 0.9 response time [RT] quantiles).The center panels plot the mean correlation for simulated data. The right panels plot the mean predicteddistractor/target (D/T) ratio. Brackets are 95% confidence intervals around observed mean values. Symbolsindicate Data Sets F (E), L (), Mm (�), Mc (x), Q (●), and pooled (▫). Easy trials are in red, hard trials in green.
21NEURALLY CONSTRAINED MODELING OF DECISIONS

the behavioral data (all R2 � 0.40). The models failed because thenormalization constrained the total input for both units to sum to aconstant (1.0) at all times, thus if the input to one accumulator waslow, the other was necessarily high. This was true both before theonset of the search array and at the time the threshold was crossed.Therefore, any value of leakage or gate that was strong enough tolimit the accumulation prior to the array onset was also too strong
during the decision. We can rule out this architecture when takingprestimulus activation levels into account.
General Discussion
Stochastic accumulator models explain how perceptual evidenceis used to make a decision but do not explain the mechanisms that
Figure 13. Simulation results: gated accumulator models. The left panels plot the sample trajectories for therace (Panel A), diffusion (Panel B), and competitive (Panel C) models. The left panels plot model activation fromfast and slow trials (average activity from 10 consecutive trials at the 0.1 and 0.9 response time [RT] quantiles).The center panels plot the mean correlation for simulated data. The right panels plot the mean predicteddistractor/target (D/T) ratio. Brackets are 95% confidence intervals around observed mean values. Symbolsindicate Data Sets F (E), L (), Mm (�), Mc (x), Q (●), and pooled (▫). Easy trials are in red, hard trials in green.
Figure 14. Mean onset, growth rate, baseline, and threshold. Observed data are shown with brackets indicating95% confidence intervals around the mean. Predicted data are shown using symbols. Easy is red, hard is green.Monkey F � E, L � , Mm � �, Mc � x, and Q � ●. sp/s � spikes per second.
22 PURCELL ET AL.

give rise to that perceptual evidence. This has begun to change,with models that explain the mechanisms that cause the drift rate(Ashby, 2000; S. D. Brown, Marley, Donkin, & Heathcote, 2008;Bundesen et al., 2005; Lamberts, 2000; Logan, 2002; Nosofsky &Palmeri, 1997; Palmeri, 1997). More elaborate models have beendeveloped based on psychophysical and neurophysiological prin-ciples that utilize changes in drift over time (Smith, 1995; Smith &Ratcliff, 2009). Here, we took a different approach. We assumedthat the firing rate of a specific neuronal population was the inputto an accumulator network. Our simulations produced three keyresults. First, most fundamentally, we showed that accumulatormodels that use visual neuron activity as input were sufficient toaccount for observed variability in behavior during a saccadevisual search task. Second, we showed that although models maymake indistinguishable predictions of behavior, they make differ-ent predictions about the characteristics of neural activity. Finally,we showed that to account for both behavioral and neural data,models must assume that the flow of perceptual evidence to theaccumulator is gated. These results have broad implications forcognitive modeling techniques, theories of perceptual decisionmaking, and mechanisms of neural function.
Decision-Making Mechanisms
A primary goal was to use the constraints imposed by neuraldata to determine the mechanisms underlying perceptual decisions.A basic assumption of accumulator models is that evidence isintegrated over time to make decisions (e.g., Ratcliff & Smith,2004). Several arguments have been put forth for the necessity ofintegration in perceptual decision making. Integration is necessaryfor statistically optimal decisions (Bogacz et al., 2006; E. Brown etal., 2005), but monkeys and humans may not always performoptimally. We tested two models that did not assume integrationand found that neither model predicted observed RT variability.These results add converging support for temporal integration ofevidence. In addition, the failure of models without integrationimplies that some additional stage during which integration takesplace is necessary to produce a response. Neurophysiologicalevidence for distinct stages of processing instantiated by differentpopulations of neurons in FEF has also been demonstrated inmonkeys performing stop signal and target step tasks (J. W.Brown, Hanes, et al., 2008; Hanes et al., 1998; Murthy et al.,2009).
Models assuming perfect integration failed to predict behavior.They failed because the neural firing rates provide a continuousrepresentation of evidence starting before the onset of the searcharray. Visual neurons discriminate the target �110 ms after thestimulus onset, so the model units accumulate only noise for themajority of the trial. In this framework, a continuous representa-tion of the perceptual evidence signal requires some mechanism tolimit the flow of perceptual evidence until a signal is present in theneural inputs. We showed that leakage and gating are effective.Other mechanisms that explicitly start the accumulation (e.g.,Wong et al., 2007; Larsen & Bogacz, 2010) and that reset theaccumulation after threshold is crossed (e.g., Logan & Gordon,2001) may also work.
Unlike perfect integrators, models assuming leaky integrationaccounted well for observed behavior. In previous comparisonsbetween perfect and leaky integrators, the best fits to behavior
were found when leakage was near zero (Boucher et al., 2007;Ratcliff & Smith, 2004). In other cases, leakage has been includedto explain limited accuracy despite extended decision time (Buse-meyer & Townsend, 1993; Smith & Vickers, 1989; Usher &McClelland, 2001), that is, the upper asymptote of the activationfunction after stimulus presentation. In our case, leakage wascritical to limit the accumulation of perceptual evidence prior to adecision, that is, the lower asymptote or baseline prior to stimuluspresentation. As expected, leakage limited the rate of accumulationuntil visual neuron activity increased, and behavioral fits improvedsignificantly. Surprisingly, however, leaky models predicted acorrelation between the movement neuron baseline activity andRTs that was not observed in the data and could not be eliminatedby manipulating the leakage parameter. Thus, models assumingonly leaky integration cannot account for the pattern of neural data.
Gated models include a constant inhibition that prevents theflow of evidence until it exceeds a critical level. The leaky andgated models accounted for behavior equally well, but only thegated accumulator models accounted for both behavior and neuralactivity. These models support a theory of perceptual decisionmaking in which evidence is continuously represented in oneneural population but the decision process is carried out by adistinct population of neurons after there is sufficient support for aparticular response.
Neural and Mental Chronometry
Classes of neurons can be distinguished anatomically, morpho-logically, and neurophysiologically, and the activity of these pop-ulations can be mapped onto distinct stages of mental processing(Schall, 2004; Shallice, 1988). Our union of neurophysiology andcognitive computational modeling can shed light on the stages ofprocessing that comprise RT during simple perceptual tasks. Apure discrete model assumes that perceptual processing has com-pleted before transmitting the output and that the accumulationdoes not begin processing that output until perceptual processingof evidence is complete (Sternberg, 1969, 2001). Alternatively, apure continuous model would assume that both stages operate inparallel and that information is transmitted continuously from onestage to the next (Eriksen & Schultz, 1979; McClelland, 1979).Most accumulator models assume that the encoding and categori-zation of perceptual evidence and the accumulation of that evi-dence take place during discrete stages whose durations sum.
By assuming that evidence about target location is representedin the firing rates of visual neurons in FEF, we make an explicitcommitment to a continuous representation of information, that is,a small grain size of evidence (Miller, 1982, 1988). This allows forthe possibility of continuous transmission to subsequent stages butdoes not require it. Our perfect and leaky accumulator modelsassume pure continuous transmission of evidence to movementneurons, but a gating mechanism is necessary to account for theneural data. When optimized to fit behavior, the gate parameterprevents the accumulation until a signal is present in the perceptualinput. This essentially decomposes RT into two stages: an initialstage in which the perceptual evidence representation is stillemerging and no accumulation takes place, and a later stage inwhich the accumulation begins and a decision is made. This issimilar to the two-stage model of Carpenter et al. (2009), whichproposes an initial diffusion process that detects stimulus features,
23NEURALLY CONSTRAINED MODELING OF DECISIONS

followed by a ballistic rise to threshold that initiates the response.Here, visual neuron activity is represented continuously over time,but it can only influence the subsequent decision stage when itexceeds the level of gate. Therefore, the gated models instantiatethe basic assumptions of the accumulator model framework, dis-crete perceptual processing followed by an accumulation of evi-dence, in a simple neurally plausible network.
Previous work has used single-unit activity from FEF, SC, andLIP neurons to divide RT into processing stages. The time requiredfor these visual neurons to select the target has been identified withthe time required to perceptually process a stimulus. When searchis easy, this time is relatively short and has less variability(Thompson et al., 1996). When search is more difficult, this timeis longer and accounts for a larger portion, but not all, of RTvariability (Bichot, Rao, & Schall, 2001; Cohen, Heitz, et al.,2009b; Ipata et al., 2006; McPeek & Keller, 2002; Sato et al.,2001; Thomas & Pare, 2007). Movement neuron activity is alsoassociated with a distinct stage of motor preparation (J. W. Brown,Hanes, et al., 2008; Bruce & Goldberg, 1985; Carpenter et al.,2009; Dorris et al., 1997; Hanes et al., 1998; Hanes & Schall,1996; Murthy et al., 2009). However, it has been difficult todetermine how these processes interact. We have shown that thestages of processing instantiated in visual and movement neuronactivity can be interpreted in the context of the accumulator modelframework as a simple feed-forward visual-to-motor network.
Movement neurons have previously been used to explore thediscrete versus continuous flow of information, but results havebeen contradictory. In one study, the onset of activity increasedwith target–distractor similarity; this was interpreted as discreteinformation flow (Woodman et al., 2008; see also Mouret &Hasbroucq, 2000). In another study, the activity of accumulatorunits representing the distractor was elevated when it was moresimilar to the target; this was interpreted as continuous informationflow (Bichot, Rao, & Schall, 2001; see also Miller, Riehle, &Requin, 1992; Riehle, Kornblum, & Requin, 1994). Studies of thelateralized readiness potential, the voltage difference betweenevent-related potentials over motor cortex contralateral and ipsi-lateral to the effector, also suggest partial activation in the move-ment preparation stage (Gratton, Coles, Sirevaag, Eriksen, &Donchin, 1988; Osman, Bashore, Coles, Donchin, & Meyer,1992). The gated accumulator model can potentially reconcilethese results. The onset increases with RT because activity takeslonger to reach the gate. However, partial transfer of informationoccurs if activity temporarily exceeds the gate but may decaybefore the response threshold is crossed.
Studies of movement-related scalp potentials and single-unitactivity suggest that subjects may adjust their behavior by chang-ing the amount of partial information transferred between stageswhen speed or accuracy is emphasized (Bichot, Rao, & Schall,2001; Coles, Henderikus, Smid, Scheffers, & Otten, 1996; Gratton,Coles, & Donchin, 1992; Low & Miller, 2001). Accumulatormodels traditionally assume that organisms adapt their responsethreshold to trade off speed and accuracy (e.g., Simen, Cohen, &Holmes, 2006), but there is currently no evidence for thresholdchanges in single-neuron recordings from movement-related neu-rons. We speculate that the gate parameter could be adjusted todetermine whether partial information is used, which would pro-vide a way to strategically adapt RT (Pouget et al., 2010). Apotential source of cognitive control is the basal ganglia, which are
proposed to play a role in gating the initiation of saccades (J. W.Brown, Bullock, & Grossberg, 2004; Hikosaka, Takikawa, &Kawagoe, 2000). The gating can be adapted to modify perfor-mance (Frank, 2006). In our model, if a task emphasizes accuracy,the gate parameter can be raised so that the onset of movementneuron activity is delayed until the magnitude of visual selection islarge. If the task emphasizes speed, then the gate parameter can belowered, and perceptual evidence will be continuously accumu-lated. Therefore, manipulations of speed and accuracy could beevident in the baseline and onset of activity instead of in thethreshold. Recent evidence from fMRI studies suggests that ma-nipulations of speed and accuracy cause changes in the baselineactivity of areas related to response preparation (Forstmann et al.,2008; Ivanoff, Branning, & Marois, 2008; van Veen, Krug, &Carter, 2008), but it is not yet known how these manipulationsaffect the activity of FEF neurons.
The nature of single-unit data limits strong assertions about purediscrete versus continuous transmission. One interpretation ofthese results is that the entire population of visual neurons repre-senting an object must exceed the level of the gate for anymovement neurons to begin accumulating evidence for a saccadeto that object. This global gating of visual inputs would representa pure discrete model (e.g., Sternberg, 1969, 2001). Alternatively,individual movement neurons may begin accumulating only afterthe particular visual neuron inputs to that neuron first exceed thegate. This local gating of visual inputs would represent a contin-uous, or at least discrete, asynchronous model (Miller, 1982). Thiscould be ultimately resolved empirically by simultaneously record-ing movement neurons that represent the same saccade vector andcomparing the timing of their onset. This issue could also beaddressed theoretically using spiking network models (e.g. Furman& Wang, 2008; Wang, 2002; Wong et al., 2007; Wong & Wang,2006), in which the connections between individual neurons can bemanipulated. However, this requires data and a level of modelingbeyond the scope of the present report.
Relation to Other Models
Previous modeling work has incorporated neurophysiology intothe accumulator model framework, but our approach is novel inthree ways. First, neural data constrained both model inputs andoutputs. Previous investigations fitted accumulator models to be-havior and then compared the predicted trajectories with neuralactivity (Boucher et al., 2007; Ratcliff et al., 2003, 2007), butmodel input (drift rate) was defined by free parameters. Otherinvestigations used accumulated spike rates to predict RT but didnot compare model and neural output (e.g., Bundesen et al., 2005;Cook & Maunsell, 2002; Oram, 2005). Our models integrateneural data to make predictions, and we compare those predictionswith neural data. Second, we went beyond a qualitative account ofthe movement neuron activity and quantified several ways inwhich model activation and neuron activity varied within andacross stimulus conditions (see also Boucher et al., 2007). Third,by using neural data, our input representation of perceptual evi-dence was defined continuously at all times. Consequently, ourmodels needed to account for activity throughout a trial, from priorto the stimulus array until the saccade was made. This requirementhad implications that were critical for ruling out certain modelarchitectures.
24 PURCELL ET AL.

A different approach to modeling has aimed to provide asystem-level account of saccade generation that includes FEF, SC,and LIP (for a review, see Girard & Berthoz, 2005). Several ofthese models propose connections between visual and movementneurons (J. W. Brown et al., 2004; Hamker, 2005b; Hamker &Zirnsak, 2006; Mitchell & Zipser, 2003). This approach to mod-eling is advantageous in that interactions across multiple brainareas may be taken into account and the dynamics of those areasexplored under a variety of tasks. Connections between visual andmovement neurons were also proposed by Heinzle et al. (2007),who developed a detailed spiking network model of local FEFcircuitry that includes connections between visual and movementneuron connections. One advantage of our simplified architectureis that it allowed us to contrast alternative mechanisms mediatingthe visual-to-movement transformation, which could later be in-corporated into larger scale models and models including realisticpopulations of spiking neurons. Other models have also proposeda gating inhibition that prevents movement neurons from rampingup until visual neuron activity is sufficient (Hamker, 2005b; Hei-nzle et al., 2007) or withholds a preplanned movement duringcountermanding (Boucher et al., 2007; Lo, Boucher, Pare, Schall,& Wang, 2009; Lo & Wang, 2006). In most of these models,however, inhibition is either dependent on the level of movementneuron activity or it is applied directly to the movement neurons.A key conclusion of our simulations is that inhibition must beindependent of the level of movement neuron activity to predictboth neural and behavioral observations. If this is the case, then adirect inhibition of the movement neurons themselves may causethe models to predict a zero baseline, which is rarely observed. Weaddress this in our models by applying the gate specifically to themodel input from the visual neurons, which provides a parsimo-nious and neurally plausible explanation for the observed patternof data. We reached this conclusion by fitting our models tobehavior and predicting neural dynamics. This was possible be-cause we chose a level of complexity appropriate to draw conclu-sions about abstract theories of decision making and guide thedevelopment of biologically plausible models.
We used the saccade visual search task to evaluate accumulatormodels because it contains the necessary components to constitutea perceptual decision: stimuli with interpretations relevant to al-ternative behaviors (Schall, 2001). Our goal was to address spe-cific decision-making mechanisms; therefore, we did not expandthe model to address important aspects of search behavior (e.g.,set-size manipulations and target-absent trials). That being said,our proposed mechanism for visual-to-motor interactions doeshave implications for more complete models of search. Manyvisual search models include a salience map that represents ex-plicitly the perceptual evidence for and against different stimulibeing the target defined by the task contingencies (Bundesen et al.,2005; Findlay & Walker, 1999; Wolfe, 2007). FEF, SC, and LIPvisual neurons have been associated with a neural instantiation ofthe hypothetical saliency map (Findlay & Gilchrist, 1998; Gold-berg et al., 2006; Thompson & Bichot, 2005). For saccade deci-sions, our model assumes that the saliency map is the representa-tion of perceptual evidence supporting a saccade to that location invisual space (see also Hamker, 2005a). When this evidence ex-ceeds the gate, it feeds into an accumulator producing a particularresponse. In the saccade visual search task, the response is asaccade to the location of the target, and the accumulation is
accomplished by movement neuron activity. There is evidence thatan accumulation to response threshold may operate in motor cortexfor manual responses (Lecas, Requin, Anger, & Vitton, 1986; butsee M. M. Churchland, Yu, Ryu, Santhanam, & Shenoy, 2006).Detailed theories have been developed to explain the formation ofthe saliency map (Bundesen et al., 2005; Itti & Koch, 2001). Tomore completely connect our proposed decision-making modelswith models of search, the gated accumulator models will need tobe fitted to a data set in which the number of stimuli in the searcharray is varied across trials. Of particular interest is whetherchanges in the visual inputs alone would be sufficient to predictchanges in behavior due to changes in the number of stimuli orwhether additional parameters and the number of accumulatingunits will need to vary (Cohen, Heitz, et al., 2009b). Althoughmuch work remains, this suggests a foundation to begin bridgingaccumulator models of perceptual decisions with models of searchand eye movements in a manner compatible with neurophysiolog-ical observations.
Inhibitory Interactions
We tested neural implementations of race (Logan & Cowan,1984), diffusion (Ratcliff, 1978), and competitive (Usher &McClelland, 2001) models that assume different inhibitory inter-actions between accumulators. Often, these models cannot bedistinguished using behavioral data alone (Ratcliff & Smith, 2004;Van Zandt, Colonius, & Proctor, 2000; Van Zandt & Ratcliff,1995), and some are formally equivalent under certain assumptions(Bogacz et al., 2006). We expected that neural constraints imposedby our framework would distinguish among these models. Somemodels with perfect or leaky integration made distinguishablepredictions, but none predicted both behavioral and neural data. Incontrast, all gated integrators predicted the behavioral and neuraldata, but there was no reason to prefer one model over another.The various forms of gated models were difficult to distinguishbecause the visual inputs only affected the accumulation of evi-dence for a brief time before the threshold was reached.
These results show that the simplest gated model, the indepen-dent gated race, is sufficient to account for the observed pattern ofneural and behavioral data. However, there are several reasons tobelieve that some form of inhibitory interaction may be operatingthat is not revealed by our relatively limited behavioral data.Inhibitory interactions are necessary to optimize the rate of reward(Bogacz et al. 2006), and feed-forward inhibition allows accumu-lators to approximate a log likelihood decision variable whenneuronal activity indicates support for alternative hypotheses(Gold & Shadlen 2007). Neurophysiological data also provideevidence for competition among FEF and SC neurons. Thereappears to be a local center-surround inhibition between �20% ofneurons in FEF and SC (McPeek & Keller, 2002; Schall, Hanes, etal., 1995; Schall et al., 2004), but the long-range interactions weconsidered in our simulations are less well understood. Micro-stimulation of FEF in one hemisphere can reduce firing rates in theopposite hemisphere (Schlag, Dassonville, & Schlag-Rey, 1998),but microstimulation could activate both visual and movementneurons. Thus far, however, experimental results concerning theprecise nature of interactions have been inconclusive.
The nature of inhibitory interactions among response alterna-tives may be resolved with neurophysiological experiments. The
25NEURALLY CONSTRAINED MODELING OF DECISIONS
diffusion and competitive models make different predictions aboutthe relative level of activity recorded simultaneously from visualand movement neuron representing the same or different objects.The diffusion model predicts that activity for visual neurons rep-resenting an object should vary inversely with the activity ofmovement neuron representing the alternative object in the timeinterval prior to reaching threshold because increased visual neu-ron will lead to decreased movement neuron activity. The com-petitive model predicts that activity of movement neurons repre-senting alternative responses will vary inversely during the sametime interval because activation of one response should lead todecreased activation of the alternative response. Behavioral tasksthat require more complex stimulus–response mapping may alsorequire competitive interactions that are not apparent in the visualsearch task that we used. For example, tasks that dissociate the cueand response locations (Sato & Schall, 2003) or involve dynami-cally changing search arrays (Murthy et al., 2009) have beenshown to require inhibition of the previously prepared response(Camalier et al., 2007; Verbruggen, Schneider & Logan, 2008),which could be due to feed-forward or lateral inhibition.
Neural Mechanisms
Our model predicts a functional connection between visual andmovement neurons. This relationship has long been hypothesized(Bruce & Goldberg, 1985; Schiller & Koerner, 1971) but has notbeen tested as it was here. Most directly, this could be interpretedas local topographic projections from FEF and SC visual neuronsto movement neurons, but empirical evidence for intrinsic connec-tions between functionally defined neuronal populations is diffi-cult to obtain (for evidence from rat SC, see Ozen, Augustine, &Hall, 2000), and behavioral data demonstrate that these connec-tions cannot be hardwired (e.g., Hallett & Lightstone, 1976; Mays& Sparks, 1980). Eye movements are guided by a distributednetwork of structures (Wurtz et al., 2001). LIP visual neuronsproject to FEF and SC (Ferraina, Pare, & Wurtz, 2002; Pare &Wurtz, 1997). FEF visual and movement neurons project to SC,although reports vary on the proportion of visual versus motorsignals (Segraves & Goldberg, 1987; Sommer & Wurtz, 2000),and saccades elicited by microstimulation of FEF are impairedwhen SC is inactivated (Hanes & Wurtz, 2001). An ascendingpathway through the mediodorsal thalamus also carries informa-tion from SC to FEF (Lynch, Hoover, & Strick, 1994), but inac-tivation of SC does not decrease FEF movement neuron activity(Berman, Joiner, Cavanaugh, & Wurtz, 2009). The visual-to-motortransformation described in our model most likely represents avisual selection process that is distributed across these structuresand culminates in the activation of FEF and SC movement neu-rons, as well as long-lead burst neurons in the brainstem thatinitiate the actual saccade (Scudder, 1988).
Our model predicts that some gating mechanism intervenesbetween visual and movement neurons. A potential neurophysio-logical source is the basal ganglia, which are hypothesized to gatethe preparation of motor responses (J. W. Brown et al., 2004;Frank, 2006). This gating would be reflected in the activity of FEFand SC neurons. The substantia nigra pars reticulata of the basalganglia sends inhibitory projections to SC (Hikosaka & Wurtz,1983) and to FEF via the mediodorsal thalamus (Goldman-Rakic& Porrino, 1985). A recent model has proposed that these projec-
tions serve a gating function (Lo & Wang, 2006), but the gate isapplied directly to movement neurons and they do not distinguishamong visual and movement neurons. Other models have positeda gating function of FEF and SC fixation neurons (Boucher et al.,2007; Heinzle et al., 2007; Lo et al., 2009). Fixation neuronsmaintain a high baseline firing rate during fixation and reduce theiractivity prior to the onset of a saccade (Dorris et al., 1997; Haneset al., 1998; Pare & Hanes, 2003; but see Hafed, Goffart, &Krauzlis, 2009; Krauzlis, Basso, & Wurtz, 1997). Finally, Shea-Brown, Gilzenrat, and Cohen (2008) proposed that the release ofneuromodulators may correspond to an increase in gain on adecision variable; they implemented such a mechanism in a simpletwo-layer network where threshold crossings in the first layer leadto increased gain in the second layer, which has potential parallelsto our gated visual-to-movement network. Ultimately, the currentdata and simulations do not allow a strong claim about the sourceof the gating inhibition, but we note that there are known mech-anisms that could implement this simple function.
Although we have implemented the gating mechanism as aconstant value throughout a simulated trial, evidence suggests thatit may be more dynamic. Specifically, some FEF visual andmovement neurons exhibit a pause in discharge rate prior to thevisual or movement response (Sato & Schall, 2001). Across cor-tical areas, a preexcitatory dip of activity has been attributed to aresetting of neural integration (Mazurek et al., 2003) and decreasedactivity in cortical afferents due to the division of attention amongstimuli (Furman & Wang, 2008; Wong et al., 2007), but noconclusive data exist to indicate the neurophysiological mecha-nisms responsible for this. Our model could explain the dip as atransient rise in the level of gating inhibition following array onset.The goal of the present report was to distinguish models accordingto predictions of a set of observed neurophysiological data inwhich a dip was uncommon, and it is not clear that augmenting themodels with a transient rise in gate would aid in model selection,so we must leave the exploration of possible explanations for thisphenomenon to future model developments.
Linking Propositions
Linking propositions are statements that map unobservable cog-nitive states onto observable neural states (Schall, 2004; Teller,1984). Conclusions drawn from the association between modelsand neurophysiology are only as valid as the linking propositionsupon which they are based. Identifying valid linking propositionsis a complex issue, particularly when the models have been pri-marily developed in an abstract mathematical framework, ratherthan from neurobiological observations. This is apparent whenconsidering the mapping of a single accumulator process ontoneuronal activity in the oculomotor circuit. Many FEF, SC, andLIP neurons have similar properties. For example, in monkeysperforming visual search, the visual neurons in FEF, LIP, and SCall seem to perform the same selection process at approximatelythe same time (e.g., McPeek & Keller, 2002; Schall & Hanes,1993; Thomas & Pare, 2007). However, these are heterogeneousstructures, and the diversity of cell types within and across FEF,SC, and LIP must be recognized (Barash, Bracewell, Fogassi,Gnadt, & Andersen, 1991; Bruce & Goldberg, 1985; Horwitz &Newsome, 1999). Thus, the accumulation process may map ontomultiple brain areas, but it is doubtful that it maps onto all neurons
26 PURCELL ET AL.

in any particular area. Here, we drew an important theoreticaldistinction between visual neurons (perceptual evidence) andmovement neurons (evidence accumulation) located within FEF.
Previous work has identified accumulator models with tonicvisual neurons in LIP and FEF (Gold & Shadlen, 2007). LIPneuron activity has been described as integrating sensory evidencefrom early visual areas (e.g., area MT), and this has been modeledas an accumulation to a threshold (Ditterich, 2006b; Mazurek etal., 2003; Wang, 2002). However, unlike visual neurons in oculo-motor areas, the activity of MT neurons is most closely linked tothe immediate stimulus features independent of the task at hand(Law & Gold, 2008). Furthermore, LIP does not initiate the re-sponse. LIP does not contain many movement neurons (Wurtz etal., 2001), and their response is more dependent on visual stimu-lation (Pare & Wurtz, 2001). LIP neurons do not project directly tothe brainstem saccade generator; the final command to move theeyes must be relayed through FEF or SC movement neurons(Sparks, 2002). Finally, many models of an LIP accumulatorinclude substantial delays prior to and following the accumulationthat are modeled as a constants (e.g., Mazurek et al., 2003). Undercertain conditions, however, these stages may account for variabil-ity in RT. The accumulation to threshold movement neurons inFEF and SC is one example (Hanes & Schall, 1996). Hence, thedecision to act cannot end in LIP.
Conclusions
Computational models can explain neuronal function in terms ofcognitive processes. Since the identification of both visual andmovement neurons in FEF and SC, it has been assumed that thevisual information flows directly to movement neurons (Bruce &Goldberg, 1985; Schiller & Koerner, 1971). The identification ofmovement neuron activity with an accumulation to threshold sug-gested a natural framework to investigate this assumption morerigorously. Models using actual visual neuron activity as inputpredicted not only the variability in observed behavior but also thedynamics of movement neuron activity. This union of cognitivemodeling and neurophysiology strengthens the interpretation ofvisual neuron activity as a representation of perceptual evidence ofsaccade target location and the interpretation of movement neuronactivity as the accumulation of that evidence.
Neurophysiology can also inform the development of cognitivemodels. By using observed neural spike times in the model eval-uation, we eliminated assumptions that govern all properties ofmodel input. Perhaps most important is the demonstration that thisneurally constrained approach to modeling actually works. Vari-able neural signals can be used as input to cognitive models tomake accurate predictions about observed behavior. Furthermore,we showed that the constraints imposed by neurophysiology canbe used to rule out models that make indistinguishable predictionsabout behavior. Our framework is relatively simple and flexibleenough to be extended to other models of search and decisionmaking.
References
Ashby, F. G. (2000). A stochastic version of general recognition theory.Journal of Mathematical Psychology, 44, 310–329.
Barash, S., Bracewell, R. M., Fogassi, L., Gnadt, J. W., & Andersen, R. A.
(1991). Saccade-related activity in the lateral intraparietal area: I. Tem-poral properties; comparison with area 7a. Journal of Neurophysiology,66, 1095–1108.
Basso, M. A., & Wurtz, R. H. (1997, September 4). Modulation of neuronalactivity by target uncertainty. Nature, 389, 66–69.
Beck, J. M., Ma, W. J., Kiani, R., Hanks, T., Churchland, A. K., Roitman,J., . . . Pouget, A. (2008). Probabilistic population codes for Bayesiandecision making. Neuron, 60, 1142–1152.
Berman, R. A., Joiner, W. M., Cavanaugh, J., & Wurtz, R. H. (2009).Modulation of presaccadic activity in the frontal eye field by the superiorcolliculus. Journal of Neurophysiology, 101, 2934–2942.
Bichot, N. P., Rao, S. C., & Schall, J. D. (2001). Continuous processing inmacaque frontal cortex during visual search. Neuropsychologia, 39,972–982.
Bichot, N. P., & Schall, J. D. (1999). Effects of similarity and history onneural mechanisms of visual selection. Nature Neuroscience, 2, 549–554.
Bichot, N. P., Thompson, K. G., Rao, S. C., & Schall, J. D. (2001).Reliability of macaque frontal eye field neurons signaling saccade tar-gets during visual search. Journal of Neuroscience, 21, 713–725.
Bogacz, R., Brown, E., Moehlis, J., Holmes, P., & Cohen, J. D. (2006). Thephysics of optimal decision making: A formal analysis of models ofperformance in two-alternative forced-choice tasks. Psychological Re-view, 113, 700–765.
Boucher, L., Palmeri, T. J., Logan, G. D., & Schall, J. D. (2007). Inhibitorycontrol in mind and brain: An interactive race model of countermandingsaccades. Psychological Review, 114, 376–397.
Brown, E., Gao, J., Holmes, P., Bogacz, R., Gilzenrat, M., & Cohen, J. D.(2005). Simple neural networks that optimize decisions. InternationalJournal of Bifurcation Chaos in Applied Sciences and Engineering, 15,803–826.
Brown, J. W., Bullock, D., & Grossberg, S. (2004). How laminar frontalcortex and basal ganglia circuits interact to control planned and reactivesaccades. Neural Networks, 17, 471–510.
Brown, J. W., Hanes, D. P., Schall, J. D., & Stuphorn, V. (2008). Relationof frontal eye field activity to saccade initiation during a countermandingtask. Experimental Brain Research, 190, 135–151.
Brown, S., & Heathcote, A. (2005). A ballistic model of choice responsetime. Psychological Review, 112, 117–128.
Brown, S. D., & Heathcote, A. (2008). The simplest complete model ofchoice response time: Linear ballistic accumulation. Cognitive Psychol-ogy, 57, 153–178.
Brown, S. D., Marley, A. A. J., Donkin, C., & Heathcote, A. (2008). Anintegrated model of choices and response times in absolute identifica-tion. Psychological Review, 115, 396–425.
Bruce, C. J., & Goldberg, M. E. (1985). Primate frontal eye fields: I. Singleneurons discharging before saccades. Journal of Neurophysiology, 53,603–635.
Bundesen, C., Habekost, T., & Kyllingsbaek, S. (2005). A neural theory ofvisual attention: Bridging cognition and neurophysiology. PsychologicalReview, 112, 291–328.
Busemeyer, J. R., & Diederich, A. (2010). Cognitive modeling. Los An-geles, CA: Sage.
Busemeyer, J. R., & Townsend, J. T. (1993). Decision field theory: Adynamic-cognitive approach to decision making in an uncertain envi-ronment. Psychological Review, 100, 432–459.
Camalier, C. R., Gotler, A., Murthy, A., Thompson, K. G., Logan, G. D.,Palmeri, T. J., & Schall, J. D. (2007). Dynamics of saccade targetselection: Race model analysis of double step and search step saccadeproduction in human and macaque. Vision Research, 47, 2187–2211.
Carpenter, R. H. S. (1999). Visual selection: Neurons that make up theirminds. Current Biology, 9, R595–R598.
Carpenter, R. H. S., Reddi, B. A. J., & Anderson, A. J. (2009). A simple
27NEURALLY CONSTRAINED MODELING OF DECISIONS

two-stage model predicts response time distributions. Journal of Phys-iology, 587, 4051–4062.
Carpenter, R. H. S., & Williams, M. L. L. (1995, September 7). Neuralcomputation of log likelihood in control of saccadic eye movements.Nature, 377, 59–62.
Churchland, A. K., Kiani, R., & Shadlen, M. N. (2008). Decision-makingwith multiple alternatives. Nature Neuroscience, 11, 693–702.
Churchland, M. M., Yu, B. M., Ryu, S. I., Santhanam, G., & Shenoy, K. V.(2006). Neural variability in premotor cortex provides a signature ofmotor preparation. Journal of Neuroscience, 26, 3697–3712.
Cohen, J. Y., Crowder, E. A., Heitz, R. P., Subraveti, C. R., Thompson,K. G., Woodman, G. F., & Schall, J. D. (2010). Cooperation andcompetition among frontal eye field neurons during visual target selec-tion. Journal of Neuroscience, 30, 3227–3238.
Cohen, J. Y., Heitz, R. P., Woodman, G. F., & Schall, J. D. (2009a).Frontal eye field activity before form visual search errors. Journal ofVision, 9(8), 759.
Cohen, J. Y., Heitz, R. P., Woodman, G. F., & Schall, J. D. (2009b). Neuralbasis of the set-size effect in frontal eye field: Timing of attention duringvisual search. Journal of Neurophysiology, 101, 1699–1704.
Cohen, J. Y., Pouget, P., Heitz, R. P., Woodman, G. F., & Schall, J. D.(2009). Biophysical support for functionally distinct cell types in thefrontal eye field. Journal of Neurophysiology, 101, 912–916.
Cohen, J. Y., Pouget, P., Woodman, G. F., Subraveti, C. R., Schall, J. D.,& Rossi, A. F. (2007). Difficulty of visual search modulates neuronalinteractions and response variability in the frontal eye field. Journal ofNeurophysiology, 98, 2580–2587.
Coles, M. G. H., Henderikus, G., Smid, M., Scheffers, M. K., & Otten, L. J.(1996). Mental chronometry and the study of human information pro-cessing. In M. Rugg & M. Coles (Eds.), Electrophysiology of mind:Event-related brain potentials and cognition (pp. 86–131). New York,NY: Oxford University Press.
Cook, E. P., & Maunsell, J. H. R. (2002). Attentional modulation ofbehavioral performance and neuronal responses in middle temporal andventral intraparietal areas of macaque monkey. Journal of Neuroscience,22, 1994–2004.
Ditterich, J. (2006a). Evidence for time-variant decision making. EuropeanJournal of Neuroscience, 24, 3628–3641.
Ditterich, J. (2006b). Stochastic models of decisions about motion direc-tion: Behavior and physiology. Neural Networks, 19, 981–1012.
Ditterich, J., Mazurek, M. E., & Shadlen, M. N. (2003). Microstimulationof visual cortex affects the speed of perceptual decisions. Nature Neu-roscience, 6, 891–898.
Dorris, M. C., Pare, M., & Munoz, D. P. (1997). Neuronal activity inmonkey superior colliculus related to the initiation of saccadic eyemovements. Journal of Neuroscience, 17, 8566–8579.
Duncan, J., & Humphreys, G. W. (1989). Visual search and stimulussimilarity. Psychological Review, 96, 433–458.
Eriksen, C. W., & Schultz, D. W. (1979). Information processing in visualsearch: A continuous flow conception and experimental results. Percep-tion & Psychophysics, 25, 249–263.
Everling, S., & Munoz, D. P. (2000). Neuronal correlates for preparatoryset associated with pro-saccades and anti-saccades in the primate frontaleye field. Journal of Neuroscience, 20, 387–400.
Fecteau, J. H., & Munoz, D. P. (2003). Exploring the consequences of theprevious trial. Nature Reviews Neuroscience, 4, 435–443.
Ferraina, S., Pare, M., & Wurtz, R. H. (2002). Comparison of cortico-cortical and cortico-collicular signals for the generation of saccadic eyemovements. Journal of Neurophysiology, 87, 845–858.
Findlay, J. M., & Gilchrist, I. D. (1998). Eye guidance and visual search.In G. Underwood (Ed.), Eye guidance in reading and scene perception(pp. 295–312). Amsterdam, the Netherlands: Elsevier.
Findlay, J. M., & Walker, R. (1999). A model of saccade generation based
on parallel processing and competitive inhibition. Behavioral and BrainSciences, 22, 661–674.
Forstmann, B. U., Dutilh, G., Brown, S., Neumann, J., von Cramon, D. Y.,Ridderinkhof, K. R., & Wagenmakers, E. J. (2008). Striatum and pre-SMA facilitate decision-making under time pressure. Proceedings of theNational Academy of Sciences, USA, 105, 17538–17542.
Frank, M. J. (2006). Hold your horses: A dynamic computational role forthe subthalamic nucleus in decision making. Neural Networks, 19,1120–1136.
Furman, M., & Wang, X. J. (2008). Similarity effect and optimal control ofmultiple-choice decision making. Neuron, 60, 1153–1168.
Ghose, G. M., & Harrison, I. T. (2009). Temporal precision of neuronalinformation in a rapid perceptual judgment. Journal of Neurophysiology,101, 1480–1493.
Girard, B., & Berthoz, A. (2005). From brainstem to cortex: Computationalmodels of saccade generation circuitry. Progress in Neurobiology, 77,215–251.
Glimcher, P. W. (2003). The neurobiology of saccadic decision making.Annual Review of Neuroscience, 26, 133–179.
Gold, J. I., & Shadlen, M. N. (2007). The neural basis of decision making.Annual Review of Neuroscience, 30, 535–574.
Goldberg, M. E., Bisley, J. W., Powell, K. D., & Gottlieb, J. (2006).Saccades, salience and attention: The role of the lateral intraparietal areain visual behavior. Progress in Brain Research, 155, 157–175.
Goldman-Rakic, P. S., & Porrino, L. J. (1985). The primate mediodorsal(MD) nucleus and its projection to the frontal lobe. Journal of Compar-ative Neurology, 242, 535–560.
Gratton, G., Coles, M. G. H., & Donchin, E. (1992). Optimizing the use ofinformation: Strategic control of activation of responses. Journal ofExperimental Psychology: General, 121, 480–506.
Gratton, G., Coles, M. G. H., Sirevaag, E. J., Eriksen, C. W., & Donchin,E. (1988). Pre- and poststimulus activation of response channels: Apsychophysiological analysis. Journal of Experimental Psychology: Hu-man Perception and Performance, 14, 331–344.
Grossberg, S. (1976a). Adaptive pattern classification and universal recod-ing: I. Parallel development and coding of neural feature detectors.Biological Cybernetics, 23, 121–134.
Grossberg, S. (1976b). Adaptive pattern classification and universal recod-ing: II. Feedback, expectation, olfaction, illusions. Biological Cybernet-ics, 23, 187–202.
Hafed, Z. M., Goffart, L., & Krauzlis, R. J. (2009, February 13). A neuralmechanism for microsaccade generation in the primate superior collicu-lus. Science, 323, 940–943.
Hallett, P. E., & Lightstone, A. D. (1976). Saccadic eye movementstowards stimuli triggered by prior saccades. Vision Research, 16, 99–106.
Hamker, F. H. (2005a). The emergence of attention by population-basedinference and its role in distributed processing and cognitive control ofvision. Journal for Computer Vision and Image Understanding, 100,64–106.
Hamker, F. H. (2005b). The reentry hypothesis: The putative interaction ofthe frontal eye field, ventrolateral prefrontal cortex, and areas V4, IT forattention and eye movement. Cerebral Cortex, 15, 431–447.
Hamker, F. H., & Zirnsak, M. (2006). V4 receptive field dynamics aspredicted by a systems-level model of visual attention using feedbackfrom the frontal eye field. Neural Networks, 19, 1371–1382.
Hanes, D. P., Patterson, W. F., & Schall, J. D. (1998). Role of frontal eyefields in countermanding saccades: Visual, movement, and fixationactivity. Journal of Neurophysiology, 79, 817–834.
Hanes, D. P., & Schall, J. D. (1996, October 18). Neural control ofvoluntary movement initiation. Science, 274, 427–430.
Hanes, D. P., & Wurtz, R. H. (2001). Interaction of the frontal eye field andsuperior colliculus for saccade generation. Journal of Neurophysiology,85, 804–815.
28 PURCELL ET AL.

Hanks, T. D., Ditterich, J., & Shadlen, M. N. (2006). Microstimulation ofmacaque area LIP affects decision-making in a motion discriminationtask. Nature Neuroscience, 9, 682–689.
Heath, R. A. (1992). A general nonstationary diffusion model for two-choice decision-making. Mathematical Social Sciences, 23, 283–309.
Heeger, D. J. (1992). Normalization of cell responses in cat striate cortex.Visual Neuroscience, 9, 181–197.
Heinzle, J., Hepp, K., & Martin, K. A. C. (2007). A microcircuit model ofthe frontal eye fields. Journal of Neuroscience, 27, 9341–9353.
Hikosaka, O., Takikawa, Y., & Kawagoe, R. (2000). Role of the basalganglia in the control of purposive saccadic eye movements. Physiolog-ical Reviews, 80, 953–978.
Hikosaka, O., & Wurtz, R. H. (1983). Visual and oculomotor functions ofmonkey substantia nigra pars reticulata: IV. Relation of substantia nigrato superior colliculus. Journal of Neurophysiology, 49, 1285–1301.
Horwitz, G. D., & Newsome, W. T. (1999, May 14). Separate signals fortarget selection and movement specification in the superior colliculus.Science, 284, 1158–1161.
Huk, A. C., & Shadlen, M. N. (2005). Neural activity in macaque parietalcortex reflects temporal integration of visual motion signals duringperceptual decision making. Journal of Neuroscience, 25, 10420–10436.
Ipata, A. E., Gee, A. L., Goldberg, M. E., & Bisley, J. W. (2006). Activityin the lateral intraparietal area predicts the goal and latency of saccadesin a free-viewing visual search task. Journal of Neuroscience, 26,3656–3661.
Itti, L., & Koch, C. (2001). Computational modeling of visual attention.Nature Reviews Neuroscience, 2, 194–203.
Ivanoff, J., Branning, P., & Marois, R. (2008). fMRI evidence for a dualprocess account of the speed-accuracy tradeoff in decision-making.PLoS One, 3, e2635. doi:10.1371/journal.pone.0002635
Juan, C. H., Shorter-Jacobi, S. M., & Schall, J. D. (2004). Dissociation ofspatial attention and saccade preparation. Proceedings of the NationalAcademy of Sciences, USA, 101, 15541–15544.
Krauzlis, R. J., Basso, M. A., & Wurtz, R. H. (1997, June 13). Sharedmotor error for multiple eye movements. Science, 276, 1693–1695.
Lamberts, K. (2000). Information-accumulation theory of speeded catego-rization. Psychological Review, 107, 227–260.
Laming, D. R. J. (1968). Information theory of choice-reaction times. NewYork, NY: Academic Press.
Larsen, T., & Bogacz, R. (2010). Initiation and termination of integrationin a decision process. Neural Networks, 23, 322–333.
Law, C.-T., & Gold, J. I. (2008). Neural correlates of perceptual learningin a sensory-motor, but not a sensory, cortical area. Nature Neuro-science, 11, 505–513.
Lecas, J. C., Requin, J., Anger, C., & Vitton, N. (1986). Changes inneuronal activity of the monkey precentral cortex during preparation formovement. Journal of Neurophysiology, 56, 1680–1702.
Link, S. W., & Heath, R. A. (1975). A sequential theory of psychologicaldiscrimination. Psychometrika, 40, 77–105.
Lo, C. C., Boucher, L., Pare, M., Schall, J. D., & Wang, X. J. (2009).Proactive inhibitory control and attractor dynamics in countermandingaction: A spiking neural circuit model. Journal of Neuroscience, 29,9059–9071.
Lo, C. C., & Wang, X. J. (2006). Cortico–basal ganglia circuit mechanismfor a decision threshold in reaction time tasks. Nature Neuroscience, 9,956–963.
Logan, G. D. (2002). An instance theory of attention and memory. Psy-chological Review, 109, 376–400.
Logan, G. D., & Cowan, W. B. (1984). On the ability to inhibit thought andaction: A theory of an act of control. Psychological Review, 91, 295–327.
Logan, G. D., & Gordon, R. D. (2001). Executive control of visualattention in dual-task situations. Psychological Review, 108, 393–434.
Low, K. A., & Miller, J. (2001). The usefulness of partial information:
Effects of go probability in the choice/nogo task. Psychophysiology, 36,288–297.
Lynch, J. C., Hoover, J. E., & Strick, P. L. (1994). Input to the primatefrontal eye field from the substantia nigra, superior colliculus, anddentate nucleus demonstrated by transneuronal transport. ExperimentalBrain Research, 100, 181–186.
Mays, L. E., & Sparks, D. L. (1980). Dissociation of visual and saccade-related responses in superior colliculus neurons. Journal of Neurophys-iology, 43, 207–232.
Mazurek, M. E., Roitman, J. D., Ditterich, J., & Shadlen, M. N. (2003). Arole for neural integrators in perceptual decision making. CerebralCortex, 13, 1257–1269.
McClelland, J. L. (1979). On the time relations of mental processes: Anexamination of systems of processes in cascade. Psychological Review,86, 287–330.
McPeek, R. M., & Keller, E. L. (2002). Saccade target selection in thesuperior colliculus during a visual search task. Journal of Neurophysi-ology, 88, 2019–2034.
Miller, J. (1982). Discrete versus continuous stage models of humaninformation processing: In search of partial output. Journal of Experi-mental Psychology: Human Perception and Performance, 8, 273–296.
Miller, J. (1988). Discrete and continuous models of human informationprocessing: Theoretical distinctions and empirical results. Acta Psycho-logica, 67, 191–257.
Miller, J., Riehle, A., & Requin, J. (1992). Effects of preliminary percep-tual output on neuronal activity of the primary motor cortex. Journal ofExperimental Psychology: Human Perception and Performance, 18,1121–1138.
Mitchell, J. F., & Zipser, D. (2003). Sequential memory-guided saccadesand target selection: A neural model of the frontal eye fields. VisionResearch, 43, 2669–2695.
Mouret, I., & Hasbroucq, T. (2000). The chronometry of single neuronactivity: Testing discrete and continuous models of information process-ing. Journal of Experimental Psychology: Human Perception and Per-formance, 26, 1622–1638.
Munoz, D. P., & Schall, J. D. (2003). Concurrent distributed control ofsaccades. In W. C. Hall & A. K. Moschovakis (Eds.), The oculomotorsystem: New approaches for studying sensorimotor integration (pp.55–82). Boca Raton, FL: CRC Press.
Murthy, A., Ray, S., Shorter, S. M., Schall, J. D., & Thompson, K. G.(2009). Neural control of visual search by frontal eye field: Effects ofunexpected target displacement on visual selection and saccade prepa-ration. Journal of Neurophysiology, 101, 2485–2506.
Murthy, A., Thompson, K. G., & Schall, J. D. (2001). Dynamic dissocia-tion of visual selection from saccade programming in frontal eye field.Journal of Neurophysiology, 86, 2634–2637.
Nelder, J. A., & Mead, R. (1965). A simplex method for function mini-mization. Computer Journal, 7, 308–313.
Niwa, M., & Ditterich, J. (2008). Perceptual decisions between multipledirections of visual motion. Journal of Neuroscience, 28, 4435–4445.
Nosofsky, R. M., & Palmeri, T. J. (1997). An exemplar-based random walkmodel of speeded classification. Psychological Review, 104, 266–300.
Oram, M. W. (2005). Integrating neuronal coding into cognitive models:Predicting reaction time distributions. Network: Computation in NeuralSystems, 16, 377–400.
Osman, A., Bashore, T. R., Coles, M. G. H., Donchin, E., & Meyer, D. E.(1992). On the transmission of partial information: Inferences frommovement-related brain potentials. Journal of Experimental Psychol-ogy: Human Perception and Performance, 18, 217–232.
Ozen, G., Augustine, G. J., & Hall, W. C. (2000). Contribution of super-ficial layer neurons to premotor bursts in the superior colliculus. Journalof Neurophysiology, 84, 460–471.
Palmeri, T. J. (1997). Exemplar similarity and the development of auto-
29NEURALLY CONSTRAINED MODELING OF DECISIONS

maticity. Journal of Experimental Psychology: Learning, Memory, andCognition, 23, 324–354.
Palmeri, T. J., & Tarr, M. J. (2008). Object recognition and long-termvisual memory for objects. In S. Luck & A. Hollingsworth (Eds.), Visualmemory (pp. 163–207). Oxford, England: Oxford University Press.
Pare, M., & Hanes, D. P. (2003). Controlled movement processing: Supe-rior colliculus activity associated with countermanded saccades. Journalof Neuroscience, 23, 6480–6489.
Pare, M., & Wurtz, R. H. (1997). Monkey posterior parietal cortex neuronsantidromically activated from superior colliculus. Journal of Neurophys-iology, 78, 3493–3497.
Pare, M., & Wurtz, R. H. (2001). Progression in neuronal processing forsaccadic eye movements from parietal cortex area LIP to superiorcolliculus. Journal of Neurophysiology, 85, 2545–2562.
Pouget, P., Logan, G. D., Palmeri, T. J., Boucher, L., Pare, M., & Schall,J. D. (2010). The neural basis of adaptive response time adjustment.Manuscript submitted for publication.
Pouget, P., Stepniewska, I., Crowder, E. A., Leslie, M. W., Emeric, E. E.,Nelson, M. J., & Schall, J. D. (2009). Visual and motor connectivity andthe distribution of calcium-binding proteins in macaque frontal eye field:Implications for saccade target selection. Frontiers in Neuroanatomy,3(2). doi:10.3389/neuro.05.002.2009
Purcell, B. A., Schall, J. D., & Palmeri, T. J. (2009). Relating neurophys-iology and drift diffusion models. In N. Taatgen & H. van Rijn (Eds.),Proceedings of the Thirty-First Annual Conference of the CognitiveScience Society (pp. 171–176). Amsterdam, the Netherlands: CognitiveScience Society.
Purushothaman, G., & Bradley, D. C. (2005). Neural population code forfine perceptual decisions in area MT. Nature Neuroscience, 8, 99–106.
Ratcliff, R. (1978). Theory of memory retrieval. Psychological Review, 85,59–108.
Ratcliff, R. (1979). Group reaction time distributions and an analysis ofdistribution statistics. Psychological Bulletin, 86, 446–461.
Ratcliff, R. (1988). Continuous versus discrete information processing:Modeling accumulation of partial information. Psychological Review,95, 238–255.
Ratcliff, R., Cherian, A., & Segraves, M. (2003). A comparison of macaquebehavior and superior colliculus neuronal activity to predictions frommodels of two-choice decisions. Journal of Neurophysiology, 90, 1392–1407.
Ratcliff, R., Hasegawa, Y. T., Hasegawa, R. P., Smith, P. L., & Segraves,M. A. (2007). Dual diffusion model for single-cell recording data fromthe superior colliculus in a brightness-discrimination task. Journal ofNeurophysiology, 97, 1756–1774.
Ratcliff, R., & Rouder, J. N. (1998). Modeling response times for two-choice decisions. Psychological Science, 9, 347–356.
Ratcliff, R., & Smith, P. L. (2004). A comparison of sequential samplingmodels for two-choice reaction time. Psychological Review, 111, 333–367.
Ratcliff, R., & Tuerlinckx, F. (2002). Estimating parameters of the diffu-sion model: Approaches to dealing with contaminant reaction times andparameter variability. Psychonomic Bulletin & Review, 9, 438–481.
Ray, S., Pouget, P., & Schall, J. D. (2009). Functional distinction betweenvisuomovement and movement neurons in macaque frontal eye fieldduring saccade countermanding. Journal of Neurophysiology, 102,3091–3100.
Riehle, A., Kornblum, S., & Requin, J. (1994). Neuronal coding ofstimulus–response association rules in the motor cortex. NeuroReport, 5,2462–2464.
Rodieck, R. W., Kiang, N. Y. S., & Gerstein, G. L. (1962). Some quanti-tative methods for the study of spontaneous activity of single neurons.Biophysical Journal, 2, 351–368.
Roitman, J. D., & Shadlen, M. N. (2002). Response of neurons in the
lateral intraparietal area during a combined visual discrimination reac-tion time task. Journal of Neuroscience, 22, 9475–9489.
Salzman, C. D., Britten, K. H., & Newsome, W. T. (1990, July 12).Cortical microstimulation influences perceptual judgements of motiondirection. Nature, 346, 174–177.
Salzman, C. D., Murasugi, C. M., Britten, K. H., & Newsome, W. T.(1992). Microstimulation in visual area MT: Effects on direction dis-crimination performance. Journal of Neuroscience, 12, 2331–2355.
Sato, T., Murthy, A., Thompson, K. G., & Schall, J. D. (2001). Searchefficiency but not response interference affects visual selection in frontaleye field. Neuron, 30, 583–591.
Sato, T. R., & Schall, J. D. (2001). Pre-excitatory pause in frontal eye fieldresponses. Experimental Brain Research, 139, 53–58.
Sato, T. R., & Schall, J. D. (2003). Effects of stimulus–response compat-ibility on neural selection in frontal eye field. Neuron, 38, 637–648.
Sato, T. R., Watanabe, K., Thompson, K. G., & Schall, J. D. (2003). Effectof target–distractor similarity on FEF visual selection in the absence ofthe target. Experimental Brain Research, 151, 356–363.
Schall, J. D. (1991). Neuronal activity related to visually guided saccadesin the frontal eye fields of rhesus monkeys: Comparison with supple-mentary eye fields. Journal of Neurophysiology, 66, 559–579.
Schall, J. D. (2001). Neural basis of deciding, choosing and acting. NatureReviews Neuroscience, 2, 33–42.
Schall, J. D. (2003). Neural correlates of decision processes: Neural andmental chronometry. Current Opinion in Neurobiology, 13, 182–186.
Schall, J. D. (2004). On building a bridge between brain and behavior.Annual Review of Psychology, 55, 23–50.
Schall, J. D., & Boucher, L. (2007). Executive control of gaze by thefrontal lobes. Cognitive, Affective, & Behavioral Neuroscience, 7, 396–412.
Schall, J. D., & Hanes, D. P. (1993, December 2). Neural basis of saccadetarget selection in frontal eye field during visual search. Nature, 366,467–469.
Schall, J. D., Hanes, D. P., Thompson, K. G., & King, D. J. (1995).Saccade target selection in frontal eye field of macaque: I. Visual andpremovement activation. Journal of Neuroscience, 15, 6905–6918.
Schall, J. D., Morel, A., King, D. J., & Bullier, J. (1995). Topography ofvisual cortex connections with frontal eye field in macaque: Conver-gence and segregation of processing streams. Journal of Neuroscience,15, 4464–4487.
Schall, J. D., Sato, T. R., Thompson, K. G., Vaughn, A. A., & Juan, C. H.(2004). Effects of search efficiency on surround suppression duringvisual selection in frontal eye field. Journal of Neurophysiology, 91,2765–2769.
Schiller, P. H., & Koerner, F. (1971). Discharge characteristics of singleunits in superior colliculus of the alert rhesus monkey. Journal ofNeurophysiology, 34, 920–936.
Schlag, J., Dassonville, P., & Schlag-Rey, M. (1998). Interaction of the twofrontal eye fields before saccade onset. Journal of Neurophysiology, 79,64–72.
Scudder, C. A. (1988). A new local feedback model of the saccadic burstgenerator. Journal of Neurophysiology, 59, 1455–1475.
Scudder, C. A., Kaneko, C. R., & Fuchs, A. F. (2002). The brainstem burstgenerator for saccadic eye movements. Experimental Brain Research,142, 439–462.
Segraves, M. A. (1992). Activity of monkey frontal eye field neuronsprojecting to oculomotor regions of the pons. Journal of Neurophysiol-ogy, 68, 1967–1985.
Segraves, M. A., & Goldberg, M. E. (1987). Functional properties ofcorticotectal neurons in the monkey’s frontal eye field. Journal ofNeurophysiology, 58, 1387–1419.
Shadlen, M. N., Britten, K. H., Newsome, W. T., & Movshon, J. A. (1996).A computational analysis of the relationship between neuronal and
30 PURCELL ET AL.
behavioral responses to visual motion. Journal of Neuroscience, 16,1486–1510.
Shallice, T. (1988). From neuropsychology to mental structure. Cam-bridge, England: Cambridge University Press.
Shea-Brown, E., Gilzenrat, M. S., & Cohen, J. D. (2008). Optimization ofdecision making in multilayer networks: The role of locus coeruleus.Neural Computation, 20, 2863–2894.
Simen, P., Cohen, J. D., & Holmes, P. (2006). Rapid decision thresholdmodulation by reward rate in a neural network. Neural Networks, 19,1013–1026.
Smith, P. L. (1995). Psychophysically principled models of visual simplereaction time. Psychological Review, 102, 567–593.
Smith, P. L. (2000). Stochastic dynamic models of response time andaccuracy: A foundational primer. Journal of Mathematical Psychology,44, 408–463.
Smith, P. L., & Ratcliff, R. (2004). Psychology and neurobiology of simpledecisions. Trends in Neurosciences, 27, 161–168.
Smith, P. L., & Ratcliff, R. (2009). An integrated theory of attention anddecision making in visual signal detection. Psychological Review, 116,283–317.
Smith, P. L., & Van Zandt, T. (2000). Time-dependent Poisson countermodels of response latency in simple judgment. British Journal ofMathematical & Statistical Psychology, 53, 293–315.
Smith, P. L., & Vickers, D. (1989). Modeling evidence accumulation withpartial loss in expanded judgment. Journal of Experimental Psychology:Human Perception and Performance, 15, 797–815.
Sommer, M. A., & Wurtz, R. H. (2000). Composition and topographicorganization of signals sent from the frontal eye field to the superiorcolliculus. Journal of Neurophysiology, 83, 1979–2001.
Sparks, D. L. (1986). The neural translation of sensory signals into com-mands for the control of saccadic eye movements: The role of primatesuperior colliculus. Physiological Reviews, 66, 118–171.
Sparks, D. L. (2002). The brainstem control of saccadic eye movements.Nature Reviews Neuroscience, 3, 952–964.
Sparks, D. L., & Pollack, J. G. (1977). The neural control of saccadic eyemovements: The role of the superior colliculus. In B. Brooks & F.Bajandas (Eds.), Eye movements (pp. 179–219). New York, NY: PlenumPress.
Stanton, G. B., Bruce, C. J., & Goldberg, M. E. (1995). Topography ofprojections to posterior cortical areas from the macaque frontal eyefields. Journal of Comparative Neurology, 353, 291–305.
Sternberg, S. (1969). The discovery of processing stages: Extensions ofDonders’ method. Acta Psychologica, 30, 276–315.
Sternberg, S. (2001). Separate modifiability, mental modules, and the useof pure and composite measures to reveal them. Acta Psychologica(Amsterdam), 106, 147–246.
Teller, D. Y. (1984). Linking propositions. Vision Research, 24, 1233–1246.
Thomas, N. W. D., & Pare, M. (2007). Temporal processing of saccadetargets in parietal cortex area LIP during visual search. Journal ofNeurophysiology, 97, 942–947.
Thompson, K. G. (2005). Dissociation of selection from saccade program-ming. In L. Itti, G. Rees, & J. K. Tsotsos (Eds.), Neurobiology ofattention (pp. 124–129). San Diego, CA: Elsevier.
Thompson, K. G., & Bichot, N. P. (2005). A visual salience map in theprimate frontal eye field. Progress in Brain Research, 147, 251–262.
Thompson, K. G., Bichot, N. P., & Sato, T. R. (2005). Frontal eye fieldactivity before visual search errors reveals the integration of bottom-upand top-down salience. Journal of Neurophysiology, 93, 337–351.
Thompson, K. G., Bichot, N. P., & Schall, J. D. (1997). Dissociation of
visual discrimination from saccade programming in macaque frontal eyefield. Journal of Neurophysiology, 77, 1046–1050.
Thompson, K. G., Hanes, D. P., Bichot, N. P., & Schall, J. D. (1996).Perceptual and motor processing stages identified in the activity ofmacaque frontal eye field neurons during visual search. Journal ofNeurophysiology, 76, 4040–4055.
Thompson, K. G., & Schall, J. D. (2000). Antecedents and correlates ofvisual detection and awareness in macaque prefrontal cortex. VisionResearch, 40, 1523–1538.
Trageser, J. C., Monosov, I. E., Zhou, Y., & Thompson, K. G. (2008). Aperceptual representation in the frontal eye field during covert visualsearch that is more reliable than the behavioral report. European Journalof Neuroscience, 28, 2542–2549.
Usher, M., & McClelland, J. L. (2001). The time course of perceptualchoice: The leaky, competing accumulator model. Psychological Re-view, 108, 550–592.
van Veen, V., Krug, M. K., & Carter, C. S. (2008). The neural andcomputational basis of controlled speed-accuracy tradeoff during taskperformance. Journal of Cognitive Neuroscience, 20, 1952–1965.
Van Zandt, T. (2000). How to fit a response time distribution. PsychonomicBulletin & Review, 7, 424–465.
Van Zandt, T., Colonius, H., & Proctor, R. W. (2000). A comparison oftwo response time models applied to perceptual matching. PsychonomicBulletin & Review, 7, 208–256.
Van Zandt, T., & Ratcliff, R. (1995). Statistical mimicking of reaction timedata: Single-process models, parameter variability, and mixtures. Psy-chonomic Bulletin & Review, 2, 20–54.
Verbruggen, F., Schneider, D. W., & Logan, G. D. (2008). How to stop andchange a response: The role of goal activation in multitasking. Journalof Experimental Psychology: Human Perception and Performance, 34,1212–1228.
Vickers, D. (1970). Evidence for an accumulator model of psychophysicaldiscrimination. Ergonomics, 13, 37–58.
Wagenmakers, E. J., Ratcliff, R., Gomez, P., & Iverson, G. J. (2004).Assessing model mimicry using the parametric bootstrap. Journal ofMathematical Psychology, 48, 28–50.
Wang, X. J. (2002). Probabilistic decision making by slow reverberation incortical circuits. Neuron, 36, 955–968.
Wolfe, J. M. (2007). Guided Search 4.0: Current progress with a model ofvisual search. In W. Gray (Ed.), Integrated models of cognitive systems(pp. 99–119). New York, NY: Oxford University Press.
Wong, K. F., Huk, A. C., Shadlen, M. N., & Wang, X. J. (2007). Neuralcircuit dynamics underlying accumulation of time-varying evidenceduring perceptual decision making. Frontiers in Computational Neuro-science, 1, 1–11.
Wong, K. F., & Wang, X. J. (2006). A recurrent network mechanism oftime integration in perceptual decisions. Journal of Neuroscience, 26,1314–1328.
Woodman, G. F., Kang, M. S., Thompson, K., & Schall, J. D. (2008). Theeffect of visual search efficiency on response preparation: Neurophysi-ological evidence for discrete flow. Psychological Science, 19, 128–136.
Wurtz, R. H., Sommer, M. A., Pare, M., & Ferraina, S. (2001). Signaltransformations from cerebral cortex to superior colliculus for the gen-eration of saccades. Vision Research, 41, 3399–3412.
Zhou, H.-H., & Thompson, K. G. (2009). Cognitively directed spatialselection in the frontal eye field in anticipation of visual stimuli to bediscriminated. Vision Research, 49, 1205–1215.
Received September 1, 2009Revision received March 22, 2010
Accepted March 30, 2010 �
31NEURALLY CONSTRAINED MODELING OF DECISIONS