punjab development statistics 2008
DESCRIPTION
BUREAU OF STATISTICSGOVERNMENT OF THE PUNJABLAHORETRANSCRIPT

2008
PunjabDevelopmentDevelopment
Statistics
BUREAU OF STATISTICSGOVERNMENT OF THE PUNJAB
LAHORE

PREFACE
Punjab Development Statistics is an annual publication of the
Punjab Bureau of Statistics which is being brought out since 1972. The
present edition is the 34th in the series. It provides important statistics in
respect of social, economic and financial sectors of the economy at
aggregate as well as sectoral levels. This publication contains data on almost
all sectors of the Provincial economy with their break-up by Tehsil and
District as far as possible. It also includes some national data on important
subjects like Major Crops, Foreign Trade, Labour Force & Employment,
National Accounts, Population, Prices and Transport etc. It also contains a
'Statistical Abstract’ which gives a comparative picture of information on
almost all Socio-economic sectors of Pakistan and the Punjab. Every effort
has been made to include the latest available data in this publication. It is
hoped that this publication will be useful to the policy makers, planners,
researchers, Nazims, DCOs and other users of socio-economic data in public
as well as private sectors.
I am thankful to various Provincial Departments / Agencies /
Federal Ministries / Divisions for supplying the required data to the Bureau of
Statistics. Without their help, it would have not been possible to release this
publication in time. I would like to thank staff members of the Punjab Bureau
of Statistics for their invaluable support and hard work to bring out this
report.
Suggestions for further improvement will be welcome.
(Dr. Shujat Ali) Chief Economist Planning & Development Board, Government of the Punjab, Lahore.

- = Nil or Insignificant
N.A. = Not Available
n.a. = Not Applicable
TR: = Traces
N.R. = Not Reported
R.E. = Revised Estimates
B.E. = Budget Estimates
FATA = Federally Administered Tribal Areas
MSCFD = Million Standard Cubic Feet Per Day
(p) = Provisional
(r) = Revised
N = Nitrogenous Fertilizer
P 2 O 5 = Phosphatic Fertilizer
K = Potash
Rs. = Rupees
One Lac = 1,00,000 = 100 Thousand
Ten Lacs = 10,00,000 = 1 Million
One Crore = 1,00,00,000 = 10 Million
iii
SYMBOLS AND EQUIVALENTS
Note :- In some tables, totals may not tally with the sum of their component items due to independent rounding off of totals and their component items.

1 Inch = 2.539 Centimetres
1 Foot = 0.305 Metre
1 Yard = 0.914 Metre
1 Furlong = 0.201 Kilometre
1 Mile = 1.609 Kilometres
1 Nautical Mile = 1.852 Kilometres
1 Centimetre = 0.39 Inch
1 Metre = 3.2808 Feet
1 Metre = 1.09361 Yards
1 Kilometre = 4.97095 Furlongs
1 Kilometre = 0.62 Mile
1 Kilometre = 0.54 Nautical Mile
1 Cubic Metre = 35.314724 Cubic Feet
1 Square Kilometre = 0.386102 Square Mile
1 Square Kilometre = 247.1047 Acres
1 Acre = 0.405 Hectare
1 Hectare = 2.4711 Acres
1 Chattank = 0.058 Kilogram
1 Seer = 0.933 Kilogram
1 Lb. = 0.454 Kilogram
1 Maund = 37.324 Kilograms
1 Tonne = 26.792 Maunds
iv
METRIC CONVERSION TABLE
LENGTH
AREA
WEIGHT

1 Tonnes = 0.984 Tons
1 Metric Ton (2205 Lbs.) = 1000 Kilograms
1 Long Ton (2240 Lbs.) = 1016 Kilograms
1 Short Ton (2000 Lbs.) = 907 Kilograms
1 Ounce = 0.028 Kilogram
1 Kilogram = 17.147 Chattanks
1 Kilogram = 1.07 Seers
1 Kilogram = 2.2046 Lbs.
1 Kilogram = 0.027 Maund
1 Kilogram = 0.00098 Long Ton
1 Kilogram = 0.0011 Short Ton
1 Kilogram = 35.273 Ounces
1 Bale = 375 Lbs.
1 Bale = 170 Kgs.
1 Pint = 0.568 Litre
1 Gallon (Imp.) = 4.546 Litres
1 Gallon (U.S.) = 3.785 Litres
1 Litre = 1.761 Pints
1 Litre = 0.22 Gallon (Imp.)
1 Litre = 0.264 Gallon (U.S.)
v
VOLUME

Table No. T i t l e P a g e
No.
- Statistical Abstract 1-13
- Administrative Units, Government of the Punjab, As on 31st December, 2007. 14
- Police Stations / Posts, Mauzas, Urban/Rural Union Councils, and Cantonment Boards by District, The Punjab, As on 31st December, 2007. 15
- Administrative Departments, their Attached Departments and Autonomous Bodies, The Punjab, As on 31st December, 2007. 16-20
- Names of Tehsils by District, The Punjab, As on 31st December, 2007. 21-23
I - AGRICULTURE
Explanatory Notes on Agriculture Section 25-27
i) Land Utilization & Agricultural Farms
1 Land Utilization Statistics, The Punjab: 1997-98 to 2005-06 28-29
2 Land Utilization Statistics by District, The Punjab: 2005-06 30-31
3 Number and Area of Farms by Size of Farm, The Punjab: 2000 Census 324 Private Farms and Farm Area by Tenure and Size of Farm The Punjab: 2000 Census 32
ii) Agricultural Inputs
5 Temperature at Selected Centres, The Punjab: 1997 to 2006 33
6 Rainfall at Selected Stations, The Punjab: 1997 to 2006 34
7 Region-wise Length of Channels and Drains, The Punjab: 2005-06 358 Canal Withdrawals, The Punjab: 1997-98 to 2006-07 369 Monthly Sales of Fertilizers by Type, The Punjab: 2005-06 and 2006-07 37-38
10 Sales of Fertilizers by District, The Punjab: 2002-03 to 2006-07 39
11 Availability and Off- take of Fertilizers, The Punjab: 2005-06 and 2006-07 40
12 Prices of Various types of Fertilizers: 2005 to 2006 4113 Nutrient Contents Present in Various Types of Fertilizers 42
vi
LIST OF TABLES

Table No. T i t l e P a g e
No. 14 Distribution of Indigenous Improved Seeds by Crop,
The Punjab 1997-98 to 2006-07 4315 Use of Plant Protection Measures on Important Crops by Size of Farm
The Punjab: 2000 Census 44
16 Area Treated with Pesticides by Crop, The Punjab: 1998-99 to 2006-07 45
iii) Tubewells
17 Number of Diesel and Electric Tubewells Installed by Ownership The Punjab: 1996-97 to 2005-06 45
18 Number of Diesel and Electric Tubewells Installed by Ownership and District, The Punjab: 2005-06 46
19 Number of Private Tubewells/Lift Pumps and Area Irrigated by them by District, The Punjab: 2004 Census 47
20 Number of Private Tubewells by Installation Period and Area The Punjab: 1994 to 2004 Censuses 48
21 Number of Tubewells Installed/Electrified and Pumping in SCARP Areas The Punjab: 2005 to 2007 49
22 Pumpage Capacity and Actual Pumpage of SCARP-II Tubewells by Crop Season and Scheme, The Punjab: 1997-98 to 2006-07 50
23 Pumpage Capacity and Actual Pumpage of SCARP-III Tubewells by Crop Season and Scheme, The Punjab: 1997-98 to 2006-07 51-52
iv) Tractors
24 Number of Tractors by Ownership and District, The Punjab: 1994 and 2004 Censuses 53
25 Number of Private Tractors by Purchase Periods and District The Punjab: 1994 to 2004 Censuses 54
26 Number of Private Tractor Owners, Tractors and Period of Work by District, The Punjab: 1994 and 2004 Censuses 55
27 Number of Private Tractors and Area Covered by them by Area during the last 12 Months, The Punjab: 1994 and 2004 Censuses 56
28 Number of Tractors (Private and Government) by Make and District The Punjab: 2004 Census (March) 57
29 Number of Tractors, by Make and District, The Punjab: 2004-05 58
30 Number of Threshers, Harvestors and Cutter-binders by District The Punjab: 2005-06 59
31 Number of Tractors Imported in Pakistan: 1997-98 to 2006-07 60
vii

Table No. T i t l e P a g e
No.
v) Agricultural Institutional Credit, Area & Production etc.
32 Agricultural Loans Disbursed by Type by the Zarai Taraqiati Bank of Pakistan, The Punjab: 1997-98 to 2006-07 60
33 Number of Loanees and Loans Advanced According to Size of Holdings by Zarai Taraqiati Bank of Pakistan in The Punjab: 1997-98 to 2006-07 61
34 Loans Disbursed by Purpose by Zarai Taraqiati Bank of Pakistan in The Punjab: 2002-03 to 2006-07 62
35 Loans Advanced to Farmers by Five Commercial Banks in The Punjab: 1997-98 to 2006-07 62
36 Agricultural Co-operative Societies, their Membership and Loans Advanced / Recovered by Provincial Co-operative Bank, The Punjab: 1997-98 to 2006-07 63
37 Taccavi Loans Allocated, Disbursed and Recovered The Punjab: 1997-98 to 2006-07 64
38 Cropped Area by Crop, The Punjab: 2006-07 64-6539 Number of Mauzas and Cropped Area by District, The Punjab: 2006-07 6640 Area Sown Irrigated and un-Irrigated by Mode of Irrigation
The Punjab: 1997-98 to 2006-07 6741 Area Sown Irrigated and un-Irrigated by Mode of Irrigation and District,
The Punjab: 2006-07 6842 Area Sown-Total and Irrigated-Under Important Crops,
The Punjab: 1997-98 to 2006-07 6943 Area Sown Under Major Crops by Mode of Irrigation,
The Punjab: 1997-98 to 2006-07 70-7144 Kharif and Rabi Acreage by Crop-Total and Irrigated,
The Punjab: 2004-05 to 2006-07 7345 Production of Important Crops, Total and Irrigated,
The Punjab: 1997-98 to 2006-07 74-7546 Per Hectare Yield of Important Crops, Total and Irrigated
The Punjab: 1997-98 to 2006-07 76-7747 Kharif and Rabi Acreage Failed by Crop-Total and Irrigated,
The Punjab: 2004-05 to 2006-07 7848 Area and Production of Wheat and Rice by Variety,
The Punjab: 1997-98 to 2006-07 7949 Area Sown-Total & Irrigated-under Wheat by District,
The Punjab: 2004-05 to 2006-07 8050 Area Sown under Rice by District, The Punjab: 2002-03 to 2006-07 81
viii

Table No. T i t l e P a g e
No.
51 Area Sown under Cotton by District, The Punjab: 2002-03 to 2006-07 82
52 Area Sown under Sugarcane by District, The Punjab: 2002-03 to 2006-07 83
53 Wheat Production-Total and Irrigated-by District, The Punjab: 2004-05 to 2006-07 8454 Rice (Cleaned) Production by District, The Punjab: 2002-03 to 2006-07 8555 Cotton Production by District, The Punjab: 2002-03 to 2006-07 86
56 Sugarcane Production by District, The Punjab: 2002-03 to 2006-07 87
57 Area and Production of Various Oil Seeds, The Punjab: 1997-98 to 2006-07 88
58 Area and Production of Kharif Fruit, The Punjab: 2002-03 to 2006-07 89
59 Area and Production of Rabi Fruit, The Punjab: 2002-03 to 2006-07 90
60 Area and Production of Kharif Vegetables, The Punjab: 2002-03 to 2006-07 91
61 Area and Production of Rabi Vegetables, The Punjab: 2002-03 to 2006-07 92
62 Area and Production of Potato and Onion, The Punjab: 1997-98 to 2006-07 93
63 Water Table Depths, Pakistan and The Punjab: 2006 and 2007 93
64 Area and Production of Important Crops, Pakistan and The Punjab: 2005-06 and 2006-07 94-95
65 Area and Production of Pulses, Condiments and Fodder The Punjab: 2004-05 to 2006-07 96
66 Area of Major and Minor Crops, The Punjab: 2002-03 to 2006-07 9767 Output of Major / Minor Crop The Punjab: 2002-03 to 2006-07 98
II- BANKING
68 Liabilities and Assets of The State Bank of Pakistan- Issue Department, 2003 to 2007 99
69 Liabilities and Assets of The State Bank of Pakistan –Banking Department, 2003 to 2007 100
70 Components of Monetary Assets, Pakistan: 2003 to 2007 10171 Gold and Foreign Exchange Reserves and Special Drawing Rights
Pakistan:1998 to 2007 10272 Classification of Scheduled Banks Advances and Deposits Distributed
by Size of Account: 2003 to 2008 103
ix
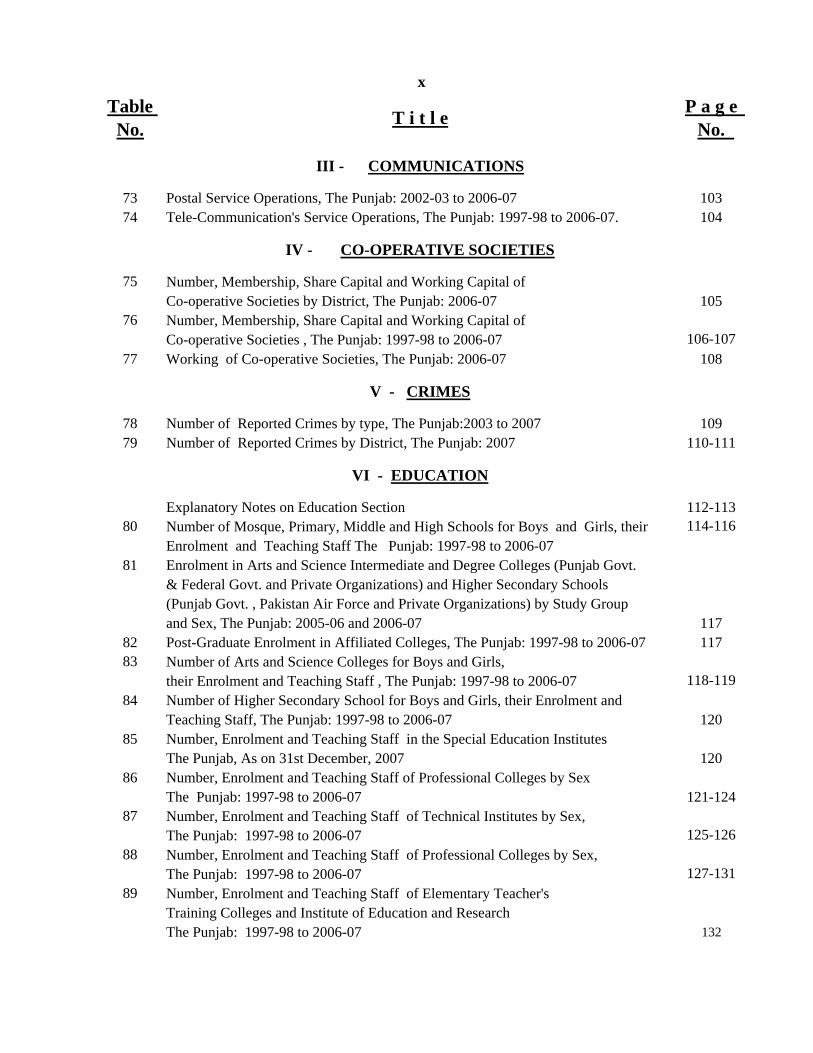
Table No. T i t l e P a g e
No.
III - COMMUNICATIONS
73 Postal Service Operations, The Punjab: 2002-03 to 2006-07 10374 Tele-Communication's Service Operations, The Punjab: 1997-98 to 2006-07. 104
IV - CO-OPERATIVE SOCIETIES
75 Number, Membership, Share Capital and Working Capital ofCo-operative Societies by District, The Punjab: 2006-07 105
76 Number, Membership, Share Capital and Working Capital ofCo-operative Societies , The Punjab: 1997-98 to 2006-07 106-107
77 Working of Co-operative Societies, The Punjab: 2006-07 108
V - CRIMES
78 Number of Reported Crimes by type, The Punjab:2003 to 2007 10979 Number of Reported Crimes by District, The Punjab: 2007 110-111
VI - EDUCATION
Explanatory Notes on Education Section 112-11380 Number of Mosque, Primary, Middle and High Schools for Boys and Girls, their 114-116
Enrolment and Teaching Staff The Punjab: 1997-98 to 2006-0781 Enrolment in Arts and Science Intermediate and Degree Colleges (Punjab Govt.
& Federal Govt. and Private Organizations) and Higher Secondary Schools (Punjab Govt. , Pakistan Air Force and Private Organizations) by Study Group and Sex, The Punjab: 2005-06 and 2006-07 117
82 Post-Graduate Enrolment in Affiliated Colleges, The Punjab: 1997-98 to 2006-07 11783 Number of Arts and Science Colleges for Boys and Girls,
their Enrolment and Teaching Staff , The Punjab: 1997-98 to 2006-07 118-11984 Number of Higher Secondary School for Boys and Girls, their Enrolment and
Teaching Staff, The Punjab: 1997-98 to 2006-07 12085 Number, Enrolment and Teaching Staff in the Special Education Institutes
The Punjab, As on 31st December, 2007 12086 Number, Enrolment and Teaching Staff of Professional Colleges by Sex
The Punjab: 1997-98 to 2006-07 121-12487 Number, Enrolment and Teaching Staff of Technical Institutes by Sex,
The Punjab: 1997-98 to 2006-07 125-12688 Number, Enrolment and Teaching Staff of Professional Colleges by Sex,
The Punjab: 1997-98 to 2006-07 127-13189 Number, Enrolment and Teaching Staff of Elementary Teacher's
Training Colleges and Institute of Education and ResearchThe Punjab: 1997-98 to 2006-07 132
x

Table No. T i t l e P a g e
No. 90 Number of Govt. Mosque Schools, their Enrolment and Teaching Staff
by District, The Punjab: 2006-07 13391 Number of Govt. Primary Schools for Boys and Girls, their Enrolment and
Teaching Staff by District, The Punjab: 2006-07 13492 Number of Govt. Middle Schools for Boys and Girls, their Enrolment
and Teaching Staff by District, The Punjab: 2006-07 13593 Number of Govt. High Schools for Boys and Girls, their Enrolment
and Teaching Staff by District, The Punjab: 2006-07 13694 Board-Wise Number of Students Appeared and Passed by Study Group
and Sex in Secondary School Certificate Examination, The Punjab: 2007 (Annual) 13795 Number of Regular and Private Students Passed by Study Group, Sex
and Grade in 8 Boards of Intermediate and Secondary Education in Secondary School Certificate Examination, The Punjab: 2007 (Annual) 138
96 Number of Higher Secondary Schools (Punjab and Federal Govt. and Private Organizations) for Boys and Girls, their Enrolment (XI-XII Classes) and Teaching Staff by District, The Punjab: 2006-07 139
97 Number of Arts and Science Intermediate and Degree Colleges (Punjab & Federal Govt. and Private Organizations) for Boys and Girls, their Enrolment and Teaching Staff by District, The Punjab: 2006-07 140
98 Number of Arts and Science Intermediate Colleges (Punjab & Federal Govt.and Private Organizations ) for Boys and Girls, their Enrolmentand Teaching Staff by District, The Punjab: 2006-07 141
99 Number of Arts and Science Degree Colleges (Punjab & Federal Govt. and Private Organizations) for Boys and Girls, their Enrolment and Teaching Staff by District, The Punjab: 2006-07 142
100 Number, Enrolment and Teaching Staff of Technical Institutes / Elementary Teacher's Training Colleges by Sex and Area, The Punjab: 2006-07 143-144
101 Enrolment and Estimated Population Eligible at Various Stages of Educationby Grades and Sex at Primary, Middle, High, Higher Secondary and CollegesStage (I-XIV Classes), The Punjab: 2006-07 145-147
102 Population (10 years and Above) by Educational Attainment Sexand Area, The Punjab:1998 Census 148
103 Literacy Ratios by Sex and Area, (Population aged 10 Years and Above) The Punjab: 1998 Census and 2005-06 148-149
104 Literacy Ratios by District, The Punjab: 1981 and 1998 Censuses 150
VII - FISHERIES
105 Fish Production (Quantity and Value) by Area, The Punjab 1512002-03 to 2006-07
xi

Table No. T i t l e P a g e
No.
VIII - FOODGRAINS
Explanatory Notes on Foodgrains Statistics Section 152106 Procurement of Wheat by Food Department on Voluntary
Basis by District, The Punjab: 2003-04 to 2007-08 153107 Total Procurement of Wheat by Pakistan Agricultural Storage and Services
Corporation and Food Department, The Punjab: 1998-99 to 2007-08 154108 Stock Position of Wheat in Government Reserves on the First of
Every Month, The Punjab: 2003-04 to 2007-08 154109 Wheat Imports into Pakistan and Receipts of Imported Wheat
in The Punjab: 1997-98 to 2006-07 155110 Sugar Production and Stocks, The Punjab: 1997-98 to 2006-07 155111 Off-take ( Releases) of Wheat by District, The Punjab: 2002-03 to 2006-07 156112 Foodgrains Storage Capacity (Functional) with Food Department by District
The Punjab, As on 30th June, 2007 157
IX - FOREIGN TRADE
Explanatory Notes on Foreign Trade Section 158113 Index Number of Quantum of Exports and Imports by Group
Pakistan: 2002-03 to 2006-07 159114 Balance of Trade, Pakistan: 1997-98 to 2006-07 160-161115 Exports and Imports by Economic Category, Pakistan: 1997-98 to 2006-07 160116 Exports by Commodity Group, Pakistan: 2002-03 to 2006-07 162-163117 Imports by Commodity Group, Pakistan: 2002-03 to 2006-07 164-165118 Pakistan's Imports by Principal Country: 2002-03 to 2006-07 166119 Pakistan's Exports by Principal Country: 2002-03 to 2006-07 167
X - FORESTRY
Explanatory Notes on Forest Statistics Section 168-169120 Forest Area by Administrative Jurisdiction and Enactment
The Punjab: 2006-07 170-171121 Area Under Forest (Compact) by Forest Circle, The Punjab
2002-03 to 2006-07 172122 Timber and Firewood Production (Quantity and Value), The Punjab
1997-98 to 2005-06 173
xii

Table No. T i t l e P a g e
No.
XI - FUEL AND POWER
Explanatory Notes on Fuel and Power Section 174-176123 Crude Oil and Gas Production in Pakistan and The Punjab: 1997-98 to 2006-07 177124 Gas Consumption by Consumer Group, The Punjab: 1997-98 to 2006-07 178-179125 Sui Northern Gas Transmission System, The Punjab: 1997-98 to 2006-07 178126 Installed Generating Capacity of Power Stations, National Grid WAPDA
2002-03 to 2006-07 180127 Villages / Settlements Electrified by Province, Pakistan
1997-98 to 2006-07 181128 New Electricity Connections Given and Applications Pending with
WAPDA by Consumer Group The Punjab: 1997-98 to 2006-07 182129 Electricity Consumers, Units Sold and Revenue Assessed, WAPDA System,
The Punjab: 1997-98 to 2006-07 183-184
XII - HEALTH
Explanatory Notes on Health Section 185130 Health Institutions and Their Bed Strength, The Punjab: 2003 to 2007 186-87131 Health Institutions and Their Bed Strength by Administrative Control
The Punjab: As on 01.01.2007 188132 Number of Registered Medical Personnel by Gender
The Punjab: 1998 to 2007 189133 Number of Registered Nurses, Lady Health Visitors, Midwives and Naib/Dais,
The Punjab: 1998 to 2007 189134 Health Facilities per Million Population. The Punjab: 1998 to 2007 190135 Health Institutions by Tehsil, The Punjab: As on 1.1.2007 191-194136 Hospitals by Management Group and District, The Punjab As on 1.1.2007 195137 Patients Treated by various Health Institution, The Punjab 1998 to 2007 196138 Patients Treated in Hospitals by Management Group and District
The Punjab: 2007 197139 Indoor/Outdoor Patients Treated in Hospitals by Management and District,
The Punjab: 2007 198
XIII - HOUSING & HOUSEHOLD INCOME/EXPENDITURE
140 Number of Households Units by District, The Punjab: 1981 and 1998 Housing Censuses 199
141 Housing Units by Number of Rooms and Household Size. Urban and Rural Areas, Pakistan, 1998 Housing Census. 200-201
142 Housing Units by Number of Rooms and Household Size Urban and Rural Areas, The Punjab: 1998 Housing Census. 202-203
xiii

Table No. T i t l e
P a g e No.
143 Housing Units by Tenure, Period of Construction, Urban and Rural Areas Pakistan and The Punjab: 1998 Housing Census. 204
144 Housing Units by Material used in Outer Walls and Roofs Urban and Rural Areas Pakistan and The Punjab: 1998 Housing Census. 205
145 Housing Units by Source of Drinking Water, Lighting and Cooking Fuel used Urban and Rural Areas, Pakistan and The Punjab: 1998 Housing Census. 206-207
146 Housing Units by Kitchen Bath Rooms and Latrine Facilities in Urban Areas Pakistan and The Punjab: 1998 Housing Census. 208-209
XIV - LABOUR FORCE & EMPLOYMENT
147 Population (10 Years and Above) by Activity, Sex and Area The Punjab: 2005-06 210
148 Population (10 Years and Above) Working and Looking for Work by Major Occupation Group and Area, The Punjab: 2005-06 210
149 Civilian Labour Force Participation Rates of Male PopulationThe Punjab 1997-98 to 2005-06 211
150 Percentage Distribution of Civilian Labour Force by Sex, Pakistan1997-98 to 2005-06 211
151 Total Number of Sanctioned Posts by Basic Pay Scale in the Budget Estimates The Punjab Government: 2006-07 and 2007-08 212
152 Number of Registered Factories and their Employment Level by DistrictThe Punjab: 2001 and 2004 213
153 Number of Registered Factories and their Employment Level by MajorIndustry Group, The Punjab: 2001 and 2004 214
XV - LIVESTOCK
154 Number of Livestock, The Punjab: 1986, 1990, 1996, 2000 and 2006 Censuses 215155 Number of Cattle and Buffaloes by District, The Punjab: 1996, 2000 and 2006
Censuses 216156
Number of Sheep and Goats by District, The Punjab:1996, 2000 and 2006 Censuses217
157 Number of Work Animals by District, The Punjab: 2006 Census 218158 Number of Veterinary Hospitals, Dispensaries and Centers by District 219
The Punjab: 2006-07159 Animals Vaccinated, Treated and Castrated, The Punjab: 1997-98 to 2006-07 220160 Veterinary Hospitals, Dispensaries and Centers, The Punjab 1997-98 to 2006-07 220-221161 Animals Slaughtered in Recognized and Un-Recognized Slaughter Houses 222
by Type, The Punjab: 1997-98 to 2006-07 162 Animals Slaughtered in Recognized and Un-Recognized Slaughter Houses
by Type and District, The Punjab: 2006-07 223
xiv

Table No. T i t l e P a g e
No. 163 Establishment of Private Poultry Farms by District, The Punjab: 2006-07 224164 Poultry Production Status in Private Sector, The Punjab: 2004-05 to 2006-07 225165 Performance of Government Poultry Farms, The Punjab: 2002-03 to 2006-07 226
XVI - MANUFACTURING INDUSTRIES
Explanatory Notes on Manufacturing Industries Section 227-230166 Performance of Vegetable Ghee Industry, The Punjab: 1997-98 to 2006-07 231167 Performance of Sugar Industry, The Punjab: 1997-98 to 2006-07 232168 Performance of Beverages Industry, The Punjab: 1997-98 to 2006-07 233169 Performance of Cigarettes Industry, The Punjab: 1997-98 to 2006-07 234170 Performance of Cotton Textile Industry, The Punjab: 1997-98 to 2006-07 235171 Performance of Jute Textile Industry, The Punjab: 1997-98 to 2006-07 236172 Performance of Woollen Textile Industry, The Punjab: 1997-98 to 2006-07 237173 Performance of Leather Tanning Industry, The Punjab: 1997-98 to 2006-07 238174 Performance of Footwear Industry, The Punjab: 1997-98 to 2006-07 239175 Performance of Paper and Paper Board Industry, The Punjab
1997-98 to 2006-07 240176 Performance of Chemical Industry, The Punjab: 1997-98 to 2006-07 241177 Performance of Fertilizers Industry, The Punjab: 1997-98 to 2006-07 242178 Performance of Cement Industry, The Punjab: 1997-98 to 2006-07 243179 Performance of Re-rolled Steel Industry, The Punjab: 1997-98 to 2006-07 244180 Performance of Bicycle Industry, The Punjab: 1997-98 to 2006-07 245181 Performance of Diesel Engines Industry, The Punjab: 1997-98 to 2006-07 246182 Performance of Electric Fans Industry, The Punjab: 1997-98 to 2006-07 247183 Performance of Electric Motors Industry, The Punjab: 1997-98 to 2006-07 248184 Performance of Electric Transformers Industry, The Punjab: 1997-98 to 2006-07 249185 Performance of Tractors Industry, The Punjab: 1997-98 to 2006-07 250186 Summary Statistics of Census of Manufacturing Industries, The Punjab
1989-90 to 2000-01 251187 Summary Statistics of Census of Manufacturing Industries by Major Industry
Group, The Punjab: 2000-01 252-253188 Summary Statistics of Census of Manufacturing Industries by District
The Punjab: 2000-01 254189 Number of Registered Factories by District, The Punjab: 2001 and 2004 255190 Number of Registered Factories by Major Industry Group,
The Punjab 2001 and 2004 256191 Production of Major Manufactured Items, Pakistan and The Punjab: 2006-07 257-58192 Industry-wise Loans Disbursed by Pakistan Industrial Credit and Investment
Corporation Limited in the Punjab: 2002-03 to 2006-07 259193 Industry-wise loans Disbursed by Industrial Development Bank of Pakistan
In The Punjab: 2001-02 to 2006-07 260
xv

Table No. T i t l e P a g e
No.
XVII - MINING
194 Minerals Production, The Punjab: 2002-03 to 2006-07 261195 Minerals Production by District, The Punjab: 2006-07 262
XVIII - NATIONAL ACCOUNTS
196 Gross National Products, Pakistan: 2005-06 to 2007-08 263197 Net National Products, Pakistan: 2004-05 to 2006-07 264198 Gross Domestic Products Sectoral Growth Rates, Pakistan
2003-04 and 2007-08 265199 Sectoral Shares in Real Gross Domestic Product Pakistan
2002-03 and 2006-07 266
XIX - POPULATION
Explanatory Notes on Population Section 267200 Area, Population, Percentage of Area and Population, Density and
Annual Growth Rate by Province, Pakistan 1951, 1961, 1972, 1981and 1998 Censuses 268-70
201 Estimated Population of Pakistan and The Punjab:1998 to 2008 268202 Estimated Population by Area and Sex, The Punjab: 1998 to 2008 269203 Area and Population by Tehsil, The Punjab: 1951, 1961, 1972, 1981
and 1998 Censuses 271-274204 Estimated Population by District, The Punjab: 2002 to 2008 275-276205 Number of Urban / Rural Union Councils and Their Population by Tehsil / Town
The Punjab: 1998 and 2008 277-280206 Population by Tehsil and Sex, The Punjab: 1981 and 1998 Censuses 281-284207 Area, Population and Density by District, The Punjab: 1981 and 1998 Censuses 285208 Population by Age-Group (15 Years and Above) Marital Status and Sex
The Punjab: 1998 Census 286-287209 Population by Age Group, The Punjab:1998 Censuses 288-289210 Population by Religion and Area, The Punjab: 1998 Census 290211 Disabled Population by Nature of Disability and Sex, The Punjab 1998 Census 290212 Population of Major Cities, The Punjab: 1981, 1998, 2007 and 2008 291-292213 Population of Urban Union Councils by Tehsils, The Punjab: 1998
(Census) and 2008 (Estimated) 293-307214 Population of Rural Union Councils by Tehsils, The Punjab: 1998
(Census) and 2008 (Estimated) 308-340
xvi

Table No. T i t l e P a g e
No.
XX - PRICES
Explanatory Notes on Prices Section 341-342215 Average Retail Prices of Nine Essential Commodities, The Punjab
1997-98 to 2007-08 (Upto April) 343216 Ex-Depot Sale Prices of P.O.L items in Pakistan : 2003 to 01.05.2008 344217 Combined Consumer Price Index Numbers by Commodity Group
Pakistan: 1997-98 to 2006-07 345218 Index Numbers of Wholesale Prices by Commodity Group,
Pakistan: 1997-98 to 2006-07 346-347219 Inflation Rates in Pakistan: 1996-97 to 2006-07 348-349220 Spot Bullion Quotations at Lahore: 1997-98 to 2006-07 350221 Weekly Exchange Rates of U. S. Dollar: 2007 351-352222 Monthly Average Wholesale Prices of Wheat, The Punjab: 2006-07 353223 Monthly Average Wholesale Prices of Rice (Basmati), The Punjab: 2006-07 353224 Monthly Average Wholesale Prices of American Kappas, The Punjab
2005-06 and 2006-07 (Cotton Season) 354225 Monthly Average Wholesale Prices of Gram (Whole), The Punjab: 2006-07 354226 Procurement/Support Prices of Agricultural Commodities,
The Punjab 2001-02 to 2007-08 355227 Number of Market Committees, Grain and Vegetable Markets,
The Punjab : 2002-03 to 2006-07 355228 Region-wise Number of Utility Stores in Urban and Rural Areas,
The Punjab: 2004 to 31.12.2007 355
XXI - PUBLIC FINANCE
229 Revenue and Capital Receipts (Summary) of The Punjab: 2006-07 and 2007-08 356230 Revenue Expenditure (Summary) by Important Heads,
The Punjab: 2006-07 and 2007-08 357231 Total Capital Disbursements of The Punjab: 2006-07 and 2007-08 358232 Total Size of Annual Development Programmes and Sources of
their Financing, The Punjab: 1998-99 to 2007-08 359233 Sector-wise Annual Development Programmes, The Punjab 2006-07 and 2007-08 360-361
XXII - ROADS AND ROAD ACCIDENTS
234 Road Length by Type under National Highway Authority and Highway Department, The Punjab: 1997-98 to 2006-07 362-363
235 Metalled Road Length by Type and District, under National Highway Authority and Highway Department, The Punjab As on 30th June, 2007 364
236 Expenditure on Construction and Maintenance of Roads Maintained by Highway Department, The Punjab 1997-98 to 2006-07 365
237 Number of Road Accidents and Casualties, The Punjab: 1998 to 2007 365
xvii

Table No. T i t l e P a g e
No. 238 Number of Road Accidents and Casualties by District
The Punjab: As on 31st December, 2007 366
XXIII - TRANSPORT
239 Pakistan Railway's Locomotives, Freight and Passengers 2002-03 to 2006-07 367240 Pakistan Railway's Passengers and Freight Traffic 1997-98 to 2006-07 368241 Rail Passengers by Class: 1997-98 to 2006-07 368242 Commodities Carried by Type by Pakistan Railway 2002-03 to 2006-07 369-370243 Number of Motor Vehicles `On Road' by Type The Punjab
1998 to 2000 and Motor Vehicles Registered 2001 to 2007 371244 Number of Motor Vehicles Registered by Type and District
The Punjab: As on 30th June, 2007 371-372
XXIV - MISCELLANEOUS
245 House Building Finance Corporation's Loans Sanctioned for Housing Purposes, The Punjab: 1997-98 to 2006-07 373
246 Prisoners and Authorized Accommodation in 32 Jails by DistrictThe Punjab: As on 05.04.2008 373
247 Newspapers and Periodicals by Frequency and LanguageThe Punjab: 1998 to 2007 374
XXV - ZAKAT
248 Number of Zakat Committees by District, The Punjab: 2006-07 375249 Disbursement of Zakat Fund and Number of Beneficiaries
The Punjab: 2004-05 to 2006-07 376- Telephone Numbers of Bureau of Statistics 2-Begum Road, Lahore 377- Addresses and Telephone Numbers of Field Offices, Bureau of Statistics 378- Addresses of District Statistical Cells, Bureau of Statistics 379
xviii

Unit 2006-07 2007-08% Change in 2007-08 over
2006-07
1
A. At Current Factor Cost (MP) Million Rupees 8881696 10712180 20.6
i) Agriculture -do- 1698000 2016950 18.8
ii) Manufacturing -do- 1566123 1892778 20.9
iii) Wholesale and Retail Trade -do- 1433337 1760491 22.8
iv) Public Administration and Defence -do- 475871 577554 21.4
v) Services -do- 766208 923324 20.5
vi) Construction -do- 213655 277141 29.7
vii) Other Sectors -do- 1433458 4558986 47.6
-do- 158481 233986 18.5
Rupees 56153 66548 18.5
B. At Constant Factor Cost Million of 1999-00 (MP) Rupees 5578005 5926089 6.2
i) Agriculture -do- 1132041 1148871 1.5
ii) Manufacturing -do- 987576 1040863 5.4
iii) Wholesale and Retail Trade -do- 883487 939752 6.4
iv) Public Administration and Defence -do- 322981 358116 10.9
v) Services -do- 522486 571443 9.4
vi) Construction -do- 127616 146962 15.2
vii) Other Sectors -do- 1601818 1720082 7.4
-do- 82878 103961 25.4
Rupees 35266 36815 4.4
Statistical Abstract
Gross National Product
Net Factor Income from Abroad
Net Factor Income from Abroad
PART - A - PAKISTAN
Item
Per Capita Gross Income at Current Factor Cost
Per Capita Gross Income at Constant Factor Cost

Unit 2005-06 2006-07% Change in 2006-07 over
2005-06
2.
A. Exports Million Rupees 984841 1029312 4.5
i) Rice -do- 69325 68286 -1.5
ii) Raw Cotton (Excluding Linters) -do- 4080 3048 -25.3
iii) Cotton Fabrics -do- 126195 122863 -2.6
iv) Carpets, Carpeting Rugs and Mats -do- 15398 14148 -8.1
v) Cotton Yarn -do- 82794 86588 4.6
vi) Petroleum Products -do- 49438 52043 5.3
vii) Leather -do- 17505 19474 11.2
viii) Articles of Apparal Clothing & Accessories -do- 78413 83952 7.1
ix) Fish and Fish Preparations -do- 11624 11419 -1.8
x) Fruit, Vegetables and Preparations thereof -do- 9929 11292 13.7
xi) Guar and Guar Products -do- 1109 520 -53.1
xii) Tarpaulin and other Canvas Goods -do- 2330 4188 79.7
xiii) Towels -do- 35180 36525 3.8
xiv) Sports Goods -do- 20560 17483 -15.0
xv) Surgical Instruments -do- 9762 11571 18.5
xvi) Leather Clothes and Accessories -do- 43247 33591 -22.3
xvii) Molasses -do- 2612 1704 -34.8
xviii) Footwear -do- 8694 6941 -20.2
xix) Synthetic Textile Fabrics -do- 11991 25463 112.4
xx) Knit Wear -do- 104839 118877 13.4
xxi) Others -do- 279816 299336 7.0
Item
Exports and Imports
2
Statistical Abstract - Contd.

Unit 2005-06 2006-07% Change in 2006-07 over
2005-06
B. Imports Million Rupees 1711158 1851806 8.2
i) POL -do- 399667 444610 11.2
ii) Machinery -do- 364908 405675 11.2
iii) Transport Equipment -do- 133480 140466 5.2
iv) Iron & Steel -do- 81840 72241 -11.7
v) Fertilizers (Manufactured) -do- 40787 27109 -33.5
vi) Edible Oils (Palm Oil and Soyabean Oil) -do- 44212 57996 31.2
vii) Synthetic & Artificial Silk Yarn -do- 14204 18089 27.4
viii) Tea -do- 13336 12965 -2.8
ix) Medicinal Products -do- 20091 26038 29.6
x) Chemicals (excluding Fertilizers & Medicines) -do- 189472 213807 12.8
xi) Paper & Paper Products -do- 15377 18096 17.7
xii) Synthetic Fibre -do- 15612 14249 -8.7
xiii) Milk & Milk Food for Infants -do- 1149 1498 30.4
xiv) Tyres & Tubes -do- 9296 9174 -1.3
xv) Others -do- 367727 389793 6.0
Item
3
Statistical Abstract -Contd.

Unit 2005-06 2006-07 % Change Over Previous Year
3 Million Rupees 3406905 4065155 19.3
i) Currency in Circulation -do- 740390 840181 13.5
ii) Total Scheduled Banks Deposits -do- 2661584 3217962 20.9
iii) Other Deposits with State Bank of Pakistan -do- 4931 7012 42.2
-do- 195501 207312 6.0
4 Wholesale Price Index of Pakistanby Commodity Group (Base: 2000-01 = 100) Index 2005-06 2006-07
i) General -do- 136.68 146.17 6.9
ii) Food -do- 133.78 145.68 8.9
iii) Raw Materials -do- 121.93 138.85 13.9
iv) Fuel, Lighting & Lubricants -do- 174.57 184.13 5.5
v) Manufactures -do- 116.35 119.92 3.1
vi) Building Materials -do- 144.18 151.82 5.3
5 Index 131.64 142.21 8.0
% 7.92 8.03 1.4
(As on 30th June) (i+ii+iii)
4
Item
Monetary Assets-IMF Basis
Consumer Price Index (CPI)
Residents Foreign Currency Account Deposits
Inflation rate (based on CPI)
Statistical Abstract -Contd.

5
Statistical Abstract -Contd.
Year/Period Unit Pakistan Punjab % Share of Punjab
Item
PART - B - PAKISTAN AND PUNJAB
Agriculture
62004 Number 401663 331905 82.6
i) Private -do- -do- 400446 331273 82.7
ii) Government -do- -do- 1217 632 51.9
Ownership-Total (i)+(ii)Number of Tractors by
ii) Government -do- -do- 1217 632 51.9
-do- Thousand Hectares 12336 8421 68.3
7 2005-06 Number 957916 845573 88.3
i) Electric -do- -do- 128823 74895 58.1
ii)
Area Covered by Private Tractors (All House holds)
Number of Tubewells-Total
ii) Diesel -do- -do- 829093 770678 93.0
8 2006-07Thousand Nutrient
Tons3672 2381 64.8
9
A. 2000 Thousand 6620 3864 58.4
Agricultural Farms & Their Area
Farm by Size - Total
Fertilizers Sales
i) Government Farms -do- -do- 0.2 0.1 50.0
ii) Private Farms -do- -do- 6620 3864 58.4
-do- -do- 1290 704 54.6
-do- -do- 1099 617 56.1
under 0.5 Hectares
0.5 to under 1.0 "
-do- -do- 1425 844 59.2
-do- -do- 967 598 61.8
-do- -do- 891 536 60.2
-do- -do- 580 368 63.4 5.0 to under 10.0 "
1.0 to under 2.0 "
2.0 to under 3.0 "
3.0 to under 5.0 "
-do- -do- 261 149 57.1
-do- -do- 78 37 47.4
-do- -do- 15 6 40.0
-do- -do- 14 5 35.760.0 Hectares & Above
10.0 to under 20.0 "
20.0 to under 40.0 "
40.0 to under 60.0 "

6
Statistical Abstract -Contd.
Year/Period Unit Pakistan Punjab % Share of Punjab
B. 2000 Thousand 6620 3864 58.4Private Farms by Tenure- Total
Item
Owner Farms -do- -do- 5134 3037 59.2
Owner-cum-Tenant Farms -do- -do- 559 424 75.8
Tenant Farms -do- -do- 927 403 43.5
C. -do- Thousand Hectares 20438 11262 55.1
do do 31 27 87 1Government Farms Area
i)
ii)
iii)
Farms Area by Tenure-Total
-do- -do- 31 27 87.1
-do- -do- 20407 11235 55.1
Owner Operated -do- -do- 14961 7790 52.1
Owner-cum-Tenant Operated -do- -do- 2964 2185 73.7
Tenant Operated -do- -do- 2482 1260 50.8
Private Farms Area
Government Farms Area
i)
ii)
iii) p
10
Geographical Area 2005-06 Thousand Hectares 79610 20630 25.9
Total Area Reported (iii + vi) -do- -do- 57070 17836 31.3
Land Utilization
)
i)
ii)
Cultivated Area (iv +v) -do- -do- 22050 12625 57.3
Net Sown Area -do- -do- 15580 10986 70.5
Current Fallow -do- -do- 6470 1639 25.3
Un-Cultivated Area (vii+viii+ix) -do- -do- 35020 5211 14.9
iv)
v)
vi)
iii)
Forest Area -do- -do- 4020 495 12.3
Culturable Waste -do- -do- 8120 1698 20.9
Not Available for Cultivation -do- -do- 22880 3018 13.2
Area Sown More than once -do- -do- 7550 5697 75.5
vii)
viii)
ix)
x)
Total Cropped Area (iv+x) -do- -do- 23130 16683 72.1
11 2006-07 -do- 19590 14063 71.8Irrigated Area - Total
xi)

7
Statistical Abstract -Contd.
Year/Period Unit Pakistan Punjab % Share of Punjab
12
Statistical Abstract -Contd.
Item
Production of Principal Crops
Wheat 2006-07 Thousand Tonnes 23295 17853 76.6
Rice (Basmati) -do- -do-2736 2494
91.2
Rice (Medium & Coarse) -do- -do-2703 582
21.5
i)
ii)
iii)
Cotton -do- `000' Bales 12856 10350 80.5
Jowar -do- Thousand Tonnes 180 101 56.1
Maize -do- -do- 3088 2162 70.0
v)
vi)
iv)
Bajra -do- -do- 238 217 91.2
Gram -do- -do- 838 728 86.9
Sugarcane -do- -do- 54742 37542 68.6
viii)
ix)
vii)
Barley -do- -do- 93 35 37.6
Rape & Mustard -do- -do- 256 120 46.9
13
Thousand
x)
xi)
Production of Principal Fruit
Mango 2006-07 Thousand Tonnes 1719 1356 78.9
Banana -do- -do- 151 8 5.3
Guava -do- -do- 555 234 42.2
D t d d 426 43 10 1
i)
ii)
iii)
i ) Dates -do- -do- 426 43 10.1
Apple -do- -do- 348 4 1.1
Citrus -do- -do- 1472 1401 95.2
iv)
v)
vi)

8
Statistical Abstract -Contd.
Year/Period Unit Pakistan Punjab % Share of Punjab
14
A-Thousand
Educational Institutions
i)
Item
Education
Primary Schools* - Total 2006-07 Thousand Number 158 50 31.6
Male -do- -do- 97 28 28.9
Female -do- -do- 61 22 36.1Middle Schools-Total -do- -do- 43 7 16.3Male -do- -do- 22 3 13.6
ii)
i)
Female -do- -do- 21 4 19.0High Schools-Total -do- -do- 25 5 20.0Male -do- -do- 17 3 17.6
Female -do- -do- 8 2 25.0
Intermediate and Degree Colleges - Total -do- Number 2996 694 23.2
iii)
iv)g do Number 2996 694 23.2
Male -do- -do- 1924 354 18.4
Female -do- -do- 1072 340 31.7
B-Primary Stage (I to V Grades ) Total 2006-07 Thousand 16834 5826 34.6
Enrolmenti)
Male -do- -do- 6360 3203 50.4
Female -do- -do- 10474 2623 25.0Middle Stage (VI to VIII Grades) -Total -do- -do- 5262 2098 39.9
Male -do- -do- 3093 1210 39.1
Female -do- -do- 2169 888 40.9
ii)
Female do do 2169 888 40.9High Stage (IX & X Grades ) Total -do- -do- 2133 902 42.3
Male -do- -do- 1251 534 42.7
Female -do- -do- 882 368 41.7
Intermediate & Degree Colleges (XI t XIV G d ) T t l
iii)
iv)
(XI to XIV Grades) Total -do- -do- 854 698 81.7
Male -do- -do- 426 299 70.2
Female -do- -do- 428 399 93.2
* Includes Mosque Schools.

Statistical Abstract -Contd
9
Year/Period Unit Pakistan Punjab % Share of Punjab
15
Wh P 2006 0 Thousand 4422 3838 86 8
Foodgrains
Statistical Abstract -Contd.
Item
i) Wheat Procurement 2006-07 Thousand Tonnes 4422 3838 86.8
16
Crude Oil
a) Fields 2006-07 Number 110 21 19.1
Fuel and Power
i)
i)
b) Production -do- `000' Barrels 24615 7856 31.9
Gas
a) Fields do- Number 102 14 13.7
Milli
ii)
b) Production do- Million Cubic Feet 1413578 68608 4.9
Villages/Settlements Electrified -do- Cmm.Nos. 117499 67020 57.0
17
A-
Health
Health Institutions
iii)
Hospitals2007
(as on Ist Jan.)
Nos. 945 325 34.4
Dispensaries -do- -do- 4755 1260 26.5
B- Medical Personnel
i)
ii)
Registered Doctors2007
(as on 31st Dec.)
Cmm.Nos. 135892 55760 41.0
Doctors (MBBS) -do- -do- 127697 52531 41.1
Dentists (BDS) -do- -do- 8195 3229 39.4
i)
Nurses -do- -do- 60516 40700 67.3
Lady Health Visitors -do- -do- N.A. 7750 n.a.
ii)
iii)

10
Statistical Abstract Contd
Year/Period Unit Pakistan Punjab % Share of Punjab
18.
Statistical Abstract -Contd.
Item
Production of Major Manufactured Items
Cotton Yarn* 2006-07 Million Kgs. 2241 936 41.8
Cotton Cloth -do- Million Sq.
i)
ii)Metres 1013 421 41.6
Sugar ** -do-000' Tonnes 3526 2163 61.3
Vegetable Ghee -do- -do- 1174 564 48.0
iii)
iv)
Fertilizers -do- -do- 5936 3992 67.3
Cement -do- -do- 22739 8882 39.1
C ti S d d d 242 240 99 2
v)
vi)
ii) Caustic Soda -do- -do- 242 240 99.2
Sulphuric Acid -do- -do- 95 41 43.2
Sida Ash -do- -do- 331 331 100.0
vii)
viii)
ix)
Paper and Paper Board -do- -do- 542 426 78.6
Cigarettes -do- Million Nos. 65980 29902 45.3
* I Li M t ** I l d S d d f S C S B t d G
x)
xi)
* In Linear Metres. ** Includes Sugar produced from Sugar Cane, Sugar Beet and Gur.

11
Statistical Abstract -Contd.
Year/Period Unit Pakistan Punjab % Share of Punjab
19.
Statistical Abstract -Contd.
Item
Livestock
Cattle 2006 Thousand Nos. 29559 14412 48.8
Buffaloes -do- -do- 27335 17747 64.9
Sheep do do 26488 6362 24 0
i)
ii)
iii) Sheep -do- -do- 26488 6362 24.0
Goats -do- -do- 53787 19831 36.9
Camels, Horses, Donkeys etc. -do- -do- 5689 2657 46.7
iii)
iv)
v)
20.
Coal 2006-07 Thousand Tonnes 3565 517 14.5
Gypsum -do- -do- 620 412 66.5
i)
Mineral Production
ii)
Limestone -do- -do- 25601 12113 47.3
Fireclay -do- -do- 346 326 94.2
21 1998P l ti b A d S T t l
iii)
iv)
21. 1998 (Census)
Thousand Persons 132352 73621 55.6
A) -do- -do- 43036 23019 53.5
B) -do- -do- 89316 50602 56.7
Population by Area and Sex Total (A)+(B) or (i)+(ii)
Urban
Rural
i) -do- -do- 68874 38094 55.3
ii) -do- -do- 63478 35527 56.0
Note :- "Sources" of Data have been given on pages 12 & 13
Male
Female

I.
II.
1 Gross National Product at Current &Constant Factor Cost
2 Exports and Imports
3 Monetary Assets
4 Wholesale Price Index
5 Consumer Price Index
6 Tractors
7. Tubewells
8. Fertilizers Sales
9. Agricultural Farms and Area
10. Land Utilization
11. Total Irrigated Area
12 Production of Principal Crops
13 Production of Principal Fruit
14 Education
SOURCE OF INFORMATION
12
Federal Bureau of Statistics, Islamabad.
State Bank of Pakistan, Karachi.
Federal Bureau of Statistics, Karachi.
Federal Bureau of Statistics, Islamabad.
SECTORS/SUB-SECTORS
-d0-
FOR PAKISTAN
Sources of data have been given in the Tables of respectivesections of the Publication.
Pakistan Economic Survey, 2007-08
-do-
-d0-
Ministry of Food, Agriculture and Livestock (MINFAL),Govt. of Pakistan, Islamabad. "Agricultural Statistics ofPakistan: 2006-07".
Agricultural Census Organization, Statistics Division, Govt.of Pakistan, Lahore, "Pakistan Census of Agriculture 2000".
-do-
FOR PUNJAB
-do-
Ministry of Food, Agriculture and Livestock (MINFAL),Govt. of Pakistan, Islamabad. "Agricultural Statistics ofPakistan: 2006-07".
Agricultural Census Org. Govt. of Pakistan, LahorePakistan Census of Agricultural Machinery, 2006.

15
i) Wheat Procurement
16
Crude Oil & Gas
17 a) Pakistan Medical & Dental Council, Islamabad.
b) Pakistan Nursing Council, Islamabad.
c) Federal Bureau of Statistics, lslamabad.
18
19
20
21
13
Directorate General of Petroleum Concessions, Islamabad.
Pakistan Economic Survey: 2007-08
SOURCE OF INFORMATION
Mineral Production
Population
Production of Manufactured Items
Monthly Statistical Bulletin, October, 2007.
Livestock Census-2006. Agricultural Census Organization,Statistics Division Govt. of Pakistan, Lahore.
Federal Bureau of Statistics, Islamabad.
1998 Population Census extracted from the Publications ofPopulation Census Organization, Islamabad.
SECTORS/SUB-SECTORS
Foodgrains
Fuel and Power
Health
Livestock

Sl. No. Number
1 41
2 86
3 73
4 35
5 131
6 5
7 38
8 25914
9 3464
i) Urban Union Councils 974
ii) Rural Union Councils 2490
10 20
11 648
12 200
14ADMINISTRATIVE UNITS
GOVERNMENT OF THE PUNJAB
(As on 31st December, 2007)
Police Stations
Police Posts
Tehsils
Towns in 5 City Districts
Unit
Mauzas
Union Councils - Total
Cantonment Boards
City Districts
Administrative Departments
Attached Departments (Includes 5 Special Institutions)
Autonomous Bodies
Districts

Total Urban Rural
The Punjab 648 200 25914 3464 974 2490 20
Bahawalpur 22 6 916 107 29 78 1Bahawalnagar 19 - 1118 118 23 95 -R. Y. Khan 26 4 1370 122 25 97 -
D. G. Khan 15 4 828 59 8 51 -Layyah 7 1 726 44 6 38 -Muzaffargarh 20 9 984 93 13 80 -Rajanpur 13 8 534 44 8 36 -
Faisalabad 35 11 842 289 123 166 -Jhang 19 13 1083 128 29 99 1T. T. Singh 11 3 544 82 16 66 -
Gujranwala 30 11 837 188 92 96 1Gujrat 20 8 1085 117 30 87 1Hafizabad 9 4 422 42 11 31 -Mandi Baha-ud-Din 11 3 433 65 10 55 -Narowal 13 5 1316 74 10 64 -Sialkot 26 3 1579 124 32 92 1
Lahore 77 16 360 150 122 28 2Kasur 18 8 642 113 26 87 -Okara 17 2 933 114 26 88 1Nankana 13 4 470 68 11 57 -Sheikhupura 12 2 620 101 34 67 -
Multan 27 1 537 129 61 68 1Khanewal 16 3 679 100 17 83 -Lodhran 10 - 436 73 11 62 -Pakpattan 10 3 580 63 9 54 -Sahiwal 15 4 531 89 14 75 -Vehari 17 - 779 89 15 74 -
Rawalpindi 25 33 1238 175 56 119 5Attock 14 14 455 72 13 59 3Chakwal 11 4 461 68 8 60 -Jhulem 11 5 595 54 12 42 2
Sargodha 25 3 850 161 40 121 1Bhakkar 9 2 557 42 9 33 -Khushab 8 1 318 51 13 38 -Mianwali 17 2 256 56 12 44 -
Cantt. Boards
Source:- i) For Police Stations and Police Posts: Assistant Inspector General of Police (Dev.) Punjab, Lahore. ii) For Mauzas: Bureau of Statistics, Punjab, Lahore.
15Police Stations/Posts, Mauzas, Urban/Rural Union Councils, and Cantonment Boards
By District, The Punjab: As on 31st December, 2007 (Number)
iii) For Union Councils: LG&RD Department, Govt. of the Punjab, Lahore.
Police Stations
Police Posts MauzasDistrict
Union Councils

Sl. No Department
1 Agriculture 1 Dir. Gen. Agri. (Extension) Punjab 1 Punjab Agri. Research Board.
2 Director General, Agri. (Field) Punjab 2 Punjab Seed Corporation
3 Dir. Gen. Agri. (Research) Punjab 3 University of Agri. Faisalabad
4 Dir. Gen. Agri. (Water Management) Punjab
4 University of Arid Agriculture Rawalpindi
2 Auqaf, Religious Affairs & Minorities - Punjab Auqaf Organization
3 Chief Minster's Inspection Team - -
4 Colonies - Punjab Land Commission
5 Consolidation of Holdings - -
6 Commerce & Investment -
7 Communications & Works
1 Chief Architect, Punjab -
2 Chief Eng. Buildings, North Zone
3 Chief Eng. Buildings, South Zone
4 Chief Eng. Highways, North Zone
5 Chief Eng. Highways, South Zone
6 Chief Eng. District Support and Monitoring
8 Co-operatives Registrar, Co-operative Societies, Punjab. Punjab Co-operative Board for Liquidation.
9 Education* 1 Dir. Public Instructions (Elementary Education) Punjab
1 University of the Punjab,Lahore.
2 Dir. Public Instructions (Secondary Education) Punjab
2 University of Engg. &Technology, Lahore
3 Dir., Public Instructions (Colleges), Punjab. 3 Bahauddin Zikaria University, Multan.
4 Director Physical Education 4 Islamia University, Bahawalpur.
5 Dir. Gen. Public Libraries, Punjab 5 Board of Int. & Secondary Education, Bahawalpur.
6 Programe Director, Teachers Training Programe, Directorate of Staff Development, Punjab
6 Board of Int. & Secondary Education, D.G.Khan.
7 Board of Int. & Secondary Education, Faisalabad.
8 Board of Int. & Secondary Education, Gujranwala
* Contd….
ADMINISTRATIVE DEPARTMENTS, THEIR ATTACHED DEPARTMENTS AND AUTONOMOUS BODIES THE PUNJAB (AS ON 31ST DECEMBER, 2007)
Excludes Autonomous Educational Institutions.
16
Head of Attached Department Autonomous Bodies

Sl. No. Department
9 Board of Int. & SecondaryEducation, Lahore
10 Board of Int. & SecondaryEducation, Multan
11 Board of Int. & SecondaryEducation, Rawalpindi
12 Board of Int. & SecondaryEducation, Sargodha
13 Children Library Complex Lahore14 Institute of Education and Research
University of the Punjab, Lahore15 Punjab Education
Foundation, Lahore16 Punjab Text Book Board, Lahore
10 Environment Protection D. G. Environment Protection -Agency, Punjab.
11 Excise & Taxation Director General, Excise & Taxation Punjab -
12 Finance 1 Provl. Dir. Local Fund Audit -
2 Chief Inspector of Treasuries and Accounts
13 Food 1 Director Food, Punjab -2 Cane Comissioner, Punjab
14 Forestry, Wildlife & Fisheries
1 Chief Conservator of Forests (P&E) Central Zone Lahore
2 Chief conservator of Forests (North Zone) Rawalpindi
3 Chief Conservator of Forests (South Zone), Multan
4 Director General, Fisheries, Punjab5 Director General, Wildlife & Parks,
15 Governor’s Secretariat - -16 Health * 1 Dir. Gen. Health Services, Punjab 1 Provincial Quality Control Board
2 Dir. General Nursing, Punjab 2 Punjab Health Foundation3 Punjab Nursing Council 4 Punjab Nursing Examination Board5 Punjab Pharmacy Council6 Punjab State Med. Faculty
17 Home 1 Commissioner, Afghan Refugees, Punjab Bureau for Child Protection and 2 Dir. Civil Defence, Punjab Welfare
3 Dir. Reclamation and Probation, Punjab4 Inspector Gen. of Police, Punjab5 Inspector Gen. of Prisons, Punjab
Contd…...* Excludes Medical Colleges and Teaching Hospitals, which have also been given Autonomous Status by the Government.
Head of Attached Department
ADMINISTRATIVE DEPARTMENTS, THEIR ATTACHED DEPARTMENTS AND AUTONOMOUS BODIES THE PUNJAB (AS ON 31ST DECEMBER, 2007)
Autonomous Bodies
17

Sl. No. Department
18 1 Faisalabad Dev. Authority2 Gujranwala Dev. Authority
2 Chief Eng. Public Health Eng. 3 Lahore Dev. AuthorityPunjab (South Zone) 4 Multan Dev. Authority
3 5 Rawalpindi Dev. Authority6 Improvement Trust, Murree7 Improvement Trust, Sargodha8 Parks and Horticulture Authority,
Lahore19 Industries 1 Dir. of Industries, Punjab 1 Punjab Small Industries Corporation.
2 Controller, Printing & Stationery, Punjab 2 Board of Technical Education, Punjab
3 The Punjab Industrial Estate and Management Company.
Special Institution4 The Faisalabad Industrial Estate and
Management Company.Technical Education and Vocational Training Authority (TEVTA)
20 1 Dir. Gen., Archaeology, Punjab 1 Punjab Council of Arts2 Dir. Gen., Public Relations, Punjab 2 Lahore Museum
3 Bahawalpur Museum
4 Nazria-e-Pakistan Foundation.
5 Pakistan Movement Workers Trust.
6 Bab-e-Pakistan Trust 7 The Punjab Journalists Housing
Foundation8 The Punjab Institute of Language, Art
and Culture21 Information Technology - -
22 Irrigation & Power 1 Chief Eng. Irri., Bahawalpur
2 Chief Eng. Irri., Faisalabad3 Chief Eng. Irri., Multan4 Chief Eng. Irri., Sargodha5 Chief Eng. (Irri.), Lahore6 Chief Eng. Irri., (Dev.) Lahore7 Chief Eng. Irri., (Floods & Drainage),
Lahore8 Chief Eng. Irri., (Planning & Review),
Lahore9 Chief Eng. (Research), Lahore
10 Chief Eng. Irri., (Coord.) Lahore11 Director Land Reclamation, Punjab
Contd....
Housing, Urban Development & Public Health Engineering
Punjab Engineering Academy,Niaz Beg, Lahore
Autonomous Bodies
Chief Eng. Public, Health Eng. Punjab (North Zone)
Head of Attached Department
18ADMINISTRATIVE DEPARTMENTS, THEIR ATTACHED DEPARTMENTS AND AUTONOMOUS BODIES
THE PUNJAB (AS ON 31ST DECEMBER, 2007)
Director General, Housing and Physical Planning
Information, Culture & Youth Affairs
1

Sl. No. Department
23 Labour and Human Resource
1 Chairman, Minimum Wages Board, Punjab
1 Commissioner, Punjab Employee’s Social Security Institutions
2 Dir. Labour Welfare, Punjab 2 Punjab Workers Welfare Board.24 Law Parliamentary
Affairs & Human Rights1 Administrator General & Official Trustee,
Punjab The Punjab Judicial Academy
2 Advocate General, Punjab3 The Solicitor to Govt. of the Punjab4 Chief Public Defender, Punjab
25 Literacy & Non Formal Basic Education - -
26 Livestock & Dairy Development
1 Director General Livestock (Ext.), Punjab 1 Punjab Livestock, Poultry & Dairy Development Board
2 Director General Livestock (Research), Punjab
2 Society for the Prevention of Cruelty to Animals (S.P.C.A.).
27 Local Government & Community
1 Chairman Local Councils Election Authority, Lahore
1 Punjab Local Govt.Commission
Development 2 Dir. Gen. of Katchi Abadies 2 Punjab Local Government Board.3 Dir. General, Local Govt. & Community
Development, Punjab28 Management &
Professional DevelopmentDirector General, Punjab Institute of Management & Professional Development
-
29 Mines & Minerals 1 Director General of Mines & Minerals Punjab Minerals Development 2 Chief Inspector of Mines Corporation
30 Planning and Development
1 Dir. Gen. Agency for Barani Areas Development (ABAD)
1 Punjab Economic Research Institute
2 Dir. Gen. Bureau of Statistics, Punjab 2 Cholistan Development Authority
3 Dir. Gen. Monitoring & Evaluation 3 Punjab Information Technology Board
31 Population Welfare Director General Population Welfare -
32 Public Prosecution Prosecutor General, Punjab -33 Relief & Crisis
ManagementDirector Gen. Relief and Crisis Management -
34 Revenue Director, Land Records, Punjab -
35 Services and General 1 Dir. Anti-Corruption Establishment, 1 N.I.P.A.Administration Punjab 2 Punjab Govt. Employee’s Welfare
2 Dir. General Protocol, Punjab Fund Board3 Punjab Govt. Employee’s Benevolent
Fund Board4 The Punjab Govt. Servents Housing
Foundation.Contd....
Head of Attached Department Autonomous Bodies
ADMINISTRATIVE DEPARTMENTS, THEIR ATTACHED DEPARTMENTS AND AUTONOMOUS BODIES THE PUNJAB (AS ON 31ST DECEMBER, 2007)
19
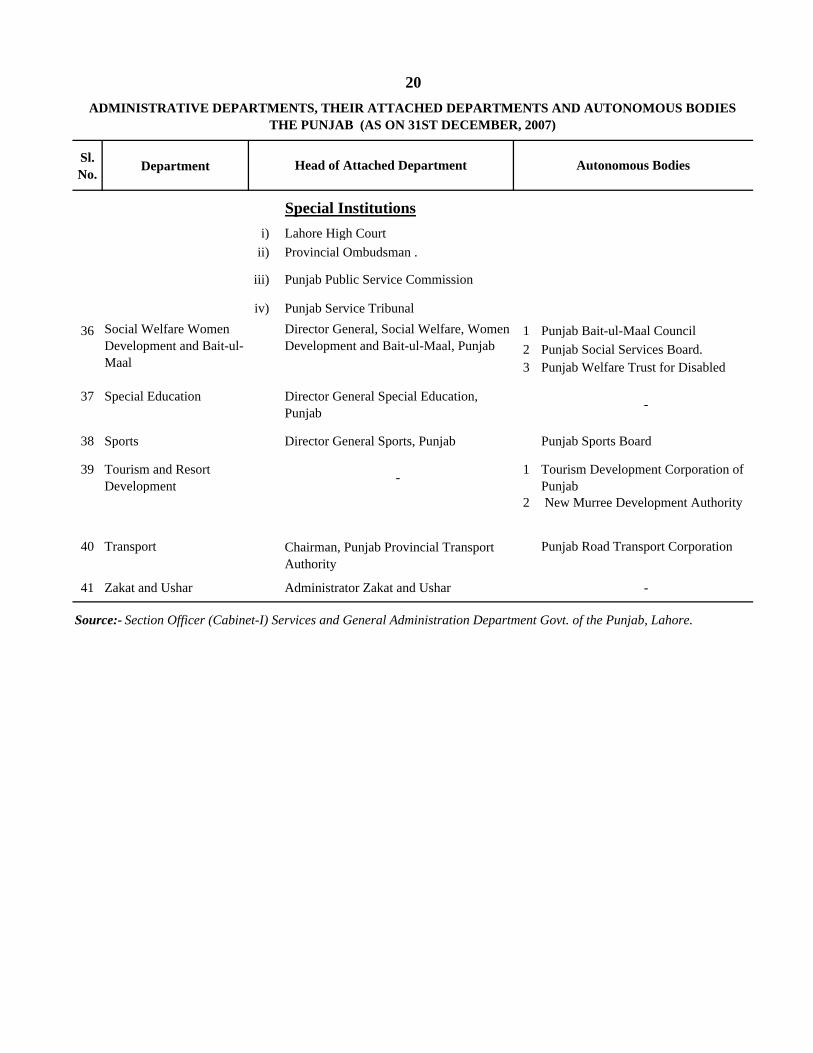
Sl. No. Department
Special Institutionsi) Lahore High Court
ii) Provincial Ombudsman .
iii) Punjab Public Service Commission
iv) Punjab Service Tribunal
36 1 Punjab Bait-ul-Maal Council2 Punjab Social Services Board.3 Punjab Welfare Trust for Disabled
37 Special Education Director General Special Education, Punjab -
38 Sports Director General Sports, Punjab Punjab Sports Board
39 Tourism and Resort Development - 1 Tourism Development Corporation of
Punjab2 New Murree Development Authority
40 Transport Chairman, Punjab Provincial Transport Authority
Punjab Road Transport Corporation
41 Zakat and Ushar Administrator Zakat and Ushar -
Source:- Section Officer (Cabinet-I) Services and General Administration Department Govt. of the Punjab, Lahore.
Autonomous Bodies
ADMINISTRATIVE DEPARTMENTS, THEIR ATTACHED DEPARTMENTS AND AUTONOMOUS BODIES THE PUNJAB (AS ON 31ST DECEMBER, 2007)
20
Director General, Social Welfare, Women Development and Bait-ul-Maal, Punjab
Social Welfare Women Development and Bait-ul-Maal
Head of Attached Department

21
NAMES OF TEHSILS BY DISTRICT, THE PUNJAB
The Punjab Faisalabad City Distt.
Bahawalpur Distt. Chak Jhumra Town
(AS ON 31ST DECEMBER, 2007)
TEHSILTEHSIL
Ahmadpur EastBahawalpur cityBahawalpur Sadar Faisalabad SadarHasilpurKhairpur Tamewali Jaranwala TownYazman Sammundri Town
Faisalabad CityIqbal TownJinnah TownLyallpur TownMadina Town
Yazman Sammundri TownBahawalnagar Distt. Tandlianwala TownBahawalnagar Jhang Distt.Chishtian Ahmadpur SialFort Abbas ChiniotHaroonabad Jhang Minchinabad ShorkotMinchinabad ShorkotRahim Yar Khan Distt. Toba Tek Singh Distt.Khanpur Gojra Liaquatpur KamaliaRahim Yar Khan Toba Tek SinghSadiqabad Gujranwala City Distt.D. G. Khan Distt.D. G. Khan Gujranwala CityTaunsa Gujranwala SadarLayyah Distt.Chobara Naushera Virkan TownKaror Kamoke Town
Aroop TownKhialli Shahpur TownNandipur TownQila Dedar Singh Town
Karor Kamoke TownLayyah Wazirabad TownMuzaffargarh Distt. Gujrat Distt.Alipur GujratJatoi KharianKot Addu Sarai Alamgir Muzaffargarh Hafizabad DisttMuzaffargarh Hafizabad Distt.Rajanpur Distt. HafizabadJampur Pindi BhattianRajanpurRojhan
Contd.....

22NAMES OF TEHSILS BY DISTRICT, THE PUNJAB
TEHSIL
Okara Distt.
Malakwal DepalpurMandi Baha d Din Okara
(AS ON 31ST DECEMBER, 2007)
TEHSIL
Mandi Baha-ud-Din Distt.
Mandi Baha-ud-Din Okara Phalia Renala KhurdNarowal Distt. Sheikhupura Distt.Narowal Ferozewala Shakargarh MuridkeSialkot Distt. SharaqpurSialkot Distt. SharaqpurDaska SheikhupuraPasrur Multan City Distt.SambrialSialkot Multan City Lahore City Distt. Multan Sadar
Boosan TownMumtazabad TownShah Rukan-e-Alam TownSh Sh h T
Jalapur PirwalaShujabad
Lahore Cantt. Khanewal Distt. Lahore City Jahanian
Sher Shah TownAziz Bhatti TownData Ganj Bakhsh TownGulberg TownIqbal TownNishtar TownRavi Town
KabirwalaKhanewalMian ChannuLodhran Distt.
Kasur Distt. Dunyapur
Ravi TownSammunabad TownShalimar TownWagha Town
Chunian Karor PaccaKasur Lodhran Kot Rahda Kishan Pakpattan Distt.Pattoki ArifwalaNankana Distt. PakpattanS fd b d S hi l Di ttSafdarabad Sahiwal Distt.Shahkot ChichawatniSangla Hill Sahiwal Nankana
Contd......

NAMES OF TEHSILS BY DISTRICT, THE PUNJAB
23
TEHSIL
Vehari Distt. Jhelum Distt.B l Di
(AS ON 31ST DECEMBER, 2007)
TEHSIL
,
Burewala DinaMailsi JhelumVehari Pind Dadan Khan
Rawalpindi City Distt. SohawaGujar Khan Town Sargodha Distt.Kahuta Town BhalwalKallar Syedan Town Kot MomanKotli Sattian Town SahiwalMurree Town SargodhaTaxila Town ShahpurTaxila Town ShahpurPothohar Town SillanwaliRawal Town Bhakkar Distt.Attock Distt. BhakkarAttock Darya KhanFateh Jang Kalur Kot
Rawalpindi
Fateh Jang Kalur KotHazro MankeraHassanabdal Khushab Distt.Jand KhushabPindi Gheb Nurpur
Chakwal Distt. QaidabadChakwal Mianwali Distt.Choa Saiden Shah Isa KhelKalar Kahar MianwaliTalagang Piplang g pSource: - Board of Revenue, Punjab, Lahore.

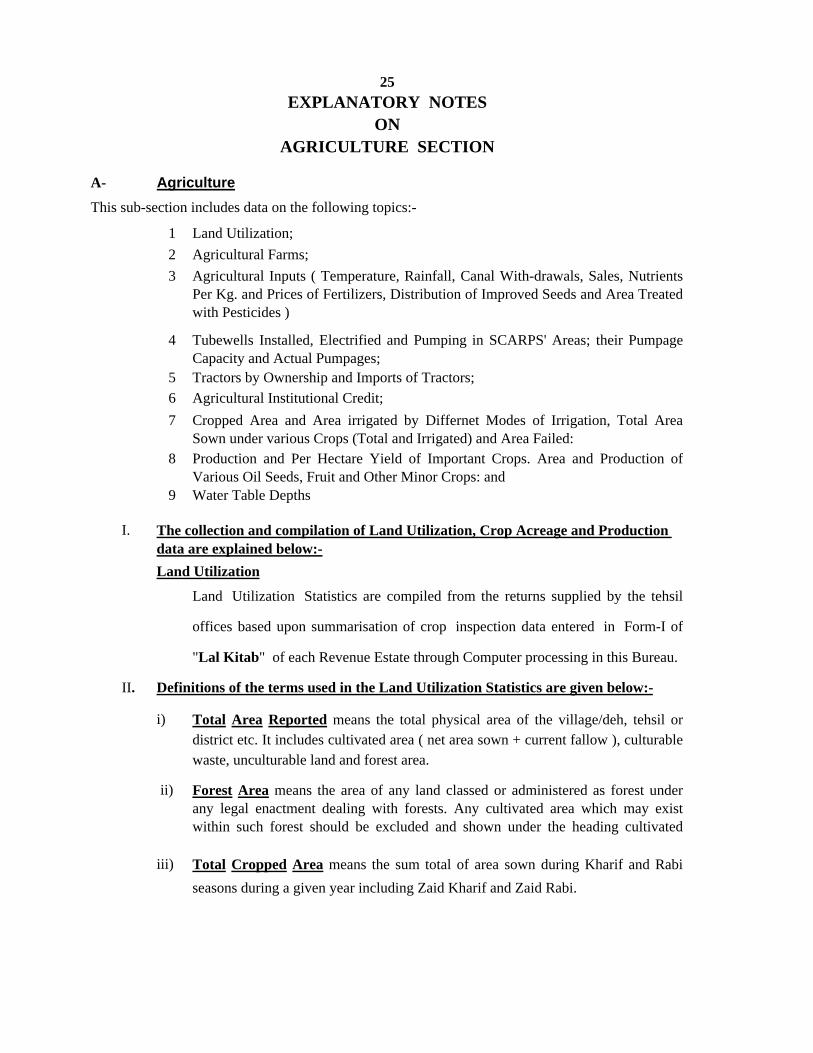
A-
1 Land Utilization;2 Agricultural Farms;3 Agricultural Inputs ( Temperature, Rainfall, Canal With-drawals, Sales, Nutrients
Per Kg. and Prices of Fertilizers, Distribution of Improved Seeds and Area Treatedwith Pesticides )
4 Tubewells Installed, Electrified and Pumping in SCARPS' Areas; their PumpageCapacity and Actual Pumpages;
5 Tractors by Ownership and Imports of Tractors;6 Agricultural Institutional Credit;7 Cropped Area and Area irrigated by Differnet Modes of Irrigation, Total Area
Sown under various Crops (Total and Irrigated) and Area Failed:8 Production and Per Hectare Yield of Important Crops. Area and Production of
Various Oil Seeds, Fruit and Other Minor Crops: and9 Water Table Depths
I.
Land Utilization Statistics are compiled from the returns supplied by the tehsil
offices based upon summarisation of crop inspection data entered in Form-I of
"Lal Kitab" of each Revenue Estate through Computer processing in this Bureau.
II.
i) Total Area Reported means the total physical area of the village/deh, tehsil ordistrict etc. It includes cultivated area ( net area sown + current fallow ), culturablewaste, unculturable land and forest area.
ii) Forest Area means the area of any land classed or administered as forest underany legal enactment dealing with forests. Any cultivated area which may existwithin such forest should be excluded and shown under the heading cultivated
iii) Total Cropped Area means the sum total of area sown during Kharif and Rabiseasons during a given year including Zaid Kharif and Zaid Rabi.
25EXPLANATORY NOTES
ONAGRICULTURE SECTION
Agriculture
Definitions of the terms used in the Land Utilization Statistics are given below:-
This sub-section includes data on the following topics:-
The collection and compilation of Land Utilization, Crop Acreage and Production data are explained below:-Land Utilization
iv) Not Available For Cultivation means the land absolutely barren, roads, canals,tanks, beds of rivers, torrents and ravines, sites of villages, houses, hills,mountains, sand dunes and all land devoted to uses alien to agriculture.
(v) Culturable Waste means all cultivable land not actually cultivated. It should
include all grazing and other land not included under forest.
(vi) Cultivated Area means the land currently being used for agricultural purposes,
including land under crops, orchards as well as current fallow. It is the area net
sown plus current fallow.
(vii) Current Fallow means the part of the cultivated area which has not been used for
cropping during the year under reference but for which the total vacant period does
not exceed three crop seasons. The land remaining vacant for more than three
successive seasons should be shown under the head 'cultivable waste'
(viii) Net Area Sown means the area which has been sown at least once in a year. Itwill include area under crops, fruit, vegetables etc.
(ix) Area Sown More Than Once means the difference between the total cropped
26
III. Area Under Crops
Census of Crop Acreagte is conducted by the Revenue Patwaries, twice a year,
one for Kharif Season and other for Rabi Season in all about 25914 Mauzas of the
Punjab Province and 201 Mauzas of Islamabad. The Mauza-wise Crop Acreage Returns
(Goshwara Jinswars) prepared manually by the Patwaries, are collected by the Bureau of
Statistics, through Director Land Records from the Tehsildars. These returns are checked
by the Bureau for completeness of coverage, edited, coded and entered in Computer.
Credibility checks are applied at mauza level with the help of the Computer. Errors of
coverage, Statistics is improved. these statistics are utilized by the Agriculture
Department in the preparation of final production estimates. It may, however, be
mentioned that 'Zaid Rabi' crops like Tabacco and Onion are not fully covered through
this census as separate crop inspection is carried for these crops. The manually compiled
acreage of these crops by the Revenue staff is, therefore, used for preparation of the final
estimates of these crops.

B-
IV.
V.
27
Kharif and Rabi Crop Seasons run from April to September and October to March r
The sums and averages and extreme ( maximum & minimum ) values of all the
Meteorological Observations are also worked out by the scrutinising staff. On the basis
of these monthly values over a long period of 30 years the normal values are worked out.
Limitations
The timely availability of statistics depends on two factors, first, the receipt ofreports from the Field Staff and secondly, their tabulation at the Provincial level. As faras the acreage under various crops is concerned, the Bureau of Statistics has been tryingto reduce the time-lag by collecting mauza-wise Goshwara Jinswars directly from theRevenue Field Staff through Director Land Records and by minimizing the tabulationtime. The centralized collection and tabulation has reduced tabulation time appreciably.
Most of the agricultural statistics are by-products of the administrative activitiesof the Revenue Department. Since the collection of Statistics is not primary aim of theRevenue Department, the system has not provided for quality control on statisticsderived from its records. The compilation of figures at all levels is done manually whichundoubtedly contains errors of coverage, classifications, summations etc.
Meteorology
Census of Crop Acreage is conducted by the Revenue Patwaries, twice a year,one for Kharif Season and other for Rabi Season in all about 25914 Mauzas of thePunjab Province and 201 Mauzas of Islamabad. The Mauza-wise Crop AcreageReturns (Goshwara Jinswars) prepared manually by the Patwaries, are collected by theBureau of Statistics, through Director Land Records from the Tehsildars. These returns
h k d b th B f l t f dit d d d d t d i
For Wheat, Cotton, Rice, Maize and Sugarcane, the Agriculture Departmentconducts Random Crop-Cutting Surveys. The observed data of these Surveys are editedin the light of available data on weather conditions, availability of water, use of fertilizersand other agricultural inputs. The Survey Estimates of yield-rates are then modified andutilized to prepare 'Official' production Estimates.
For other crops, the yield-rates are estimated on the basis of farmers opinionsurveys and edited with the help of data on inputs, rainfall and weather conditions etc.The yield-rates thus arrived at are then applied to estimate the 'Official' estimates of totalout-turn of the respective crops.
The Meteorological Observations recorded daily at different hours are copiedby the Observers in Monthly Meteorological Register and this Register is sent toRegional Centre at 46-Gulberg Road, Lahore in the first week of each succeeding month.These Registers are then thoroughly scrutinized by the trained Meteorological Staff atLahore and corrections are applied, where ever necessary.
Production of Crops

Total Net Sown
Current Fallow Total
Cultur-able
WasteForest
Area not Available
for Cultivation
1 2=(3+6) 3=(4+5) 4 5 6=7 to 9 7 8 9 10=4+11 11
1996-97 17512 12221 11232 989 5291 1643 489 3159 15914 4682
1997-98 17573 12228 11168 1060 5345 1689 485 3171 15963 4795
1998-99 17563 12265 11209 1056 5298 1725 483 3090 15804 4595
1999-00 17565 12347 11193 1154 5218 1667 484 3067 16004 4811
2000-01 17609 12348 11009 1339 5261 1610 494 3157 16057 5048
2001-02 17608 12428 11037 1391 5180 1715 496 2969 16104 5067
2002-03 17606 12534 10954 1580 5072 1593 512 2967 15962 5008
2003-04 17618 12553 10914 1639 5065 1543 506 3016 16412 5498
2004-05 17618 12553 10914 1639 5065 1543 506 3016 16412 5498
2005-06 17836 12625 10986 1639 5211 1698 495 3018 16683 5697
Source :-
Year ReportedArea
Cultivated Area Un-Cultivated Area
Revenue Department, Govt. of the Punjab Lahore.
28
Cropped Area Total
Area Sown More than once
AGRICULTURE
Table 1:- Land Utilization Statistics, The Punjab(Thousand Hectares)

29
LAND UTILIZATION THE PUNJAB: 2005 - 06
GEOGRAPHICAL AREA = 20.63 MILLION HECTARES
LAND UTILIZATION THE PUNJAB: 2005 06
10.99( 53.3% )
1.64 ( 7.9%)( )
1.70( 8.2%)
3 02
2.79(13.6)%
0.493.02
( 14.6%)( 2.4% )
1. NET 3. CULTURABLEWASTE
2. CURRENTFALLOW
6. NON-REPORTED AREA5. AREA NOT
AVAILABLE FOR CULTIVATION
4. FOREST

AGRICULTURETable 2 :- Land Utilization Statistics by District
Total Net Sown Current Fallow
1 The Punjab 17836 12625 10986 1639
2 Bahawalpur 627 407 372 353 Bahawalnagar 730 595 538 574 Rahim Yar Khan 817 640 583 57
5 Dera Ghazi Khan 934 428 272 1566 Layyah 628 484 374 1107 Muzaffargarh 831 449 411 388 Rajanpur 762 388 267 121
9 Faisalabad 584 516 513 310 Jhang 952 692 653 3911 Toba Tek Singh 327 259 252 7
12 Gujranwala 369 307 288 1913 Gujrat 321 255 232 2314 Hafizabad 235 189 154 3515 Mandi Baha-ud-Din 269 218 166 5216 Narowal 232 189 186 317 Sialkot 293 247 245 2
18 Lahore 178 114 104 1019 Kasur 397 338 334 420 Nankana 373 286 227 5921 Okara 439 342 337 522 Sheikhupura 451 365 288 7723 Multan 379 302 254 4824 Khanewal 429 368 352 1625 Lodhran 280 249 239 1026 Pakpattan 273 247 241 627 Sahiwal 320 260 257 328 Vehari 437 393 383 10
29 Rawalpindi 525 232 181 5130 Attock 692 318 214 10431 Chakwal 669 319 248 7132 Jhelum 359 125 92 33
33 Sargodha 585 509 486 2334 Bhakkar 813 720 574 14635 Khushab 655 469 382 8736 Mianwali 577 358 270 88
37 Islamabad 94 48 17 31
Sl. No. District Reported Area
Cultivated Area
30

Total Culturable Waste Forest
Not Available for
CultivationTotal Kharif Rabi
5211 1698 495 3018 16683 7608 9075 5697 1
221 70 4 147 692 340 352 323 2136 44 0 92 775 382 393 237 3177 100 6 71 863 452 411 280 4
506 109 20 377 364 179 185 91 5144 110 5 29 477 158 319 102 6382 213 35 134 681 323 358 270 7374 212 7 155 320 167 153 54 8
67 1 1 65 694 340 354 180 9260 161 5 94 960 397 563 307 10
68 30 6 32 391 182 209 140 11
62 20 4 38 549 278 271 262 1267 17 12 38 282 119 163 51 1346 26 0 20 326 159 167 172 1450 12 5 33 350 175 175 184 1543 2 4 37 273 121 152 86 1646 2 6 38 433 211 222 188 17
63 5 1 57 188 94 94 84 1859 6 6 47 512 264 248 178 1987 58 0 29 343 164 179 117 2098 44 2 52 612 307 305 276 2186 33 7 46 460 229 231 173 2276 49 0 27 540 271 269 286 2361 26 6 29 591 298 293 235 2431 3 1 27 430 229 201 190 2526 5 1 20 393 189 204 152 2659 14 5 40 442 214 228 185 2744 4 0 40 651 334 317 267 28
294 102 69 123 230 106 124 48 29373 23 73 277 230 67 163 16 30350 34 58 258 260 100 160 12 31234 56 45 133 104 40 64 12 32
76 24 0 52 706 318 388 220 3394 23 36 35 777 191 586 203 34
186 31 41 114 435 84 351 54 35219 26 13 180 321 112 209 51 36
46 3 11 32 28 14 14 11 37
Un-Cultivated Area Cropped AreaArea Sown More Than
Once
Sl. No.
Source:- Bureau of Statistics, Punjab, Lahore
31AGRICULTURE
The Punjab: 2005-06(Thousand Hectares)

`000' Number
% With Total
% With Total
% With Total
3864.2 100 100 100
0.1 - 0.2 0.2
3864.1 100 99.8 99.8
Under 0.5 703.6 18.2 1.8 1.8
0.5 to Under 1 617.3 16.0 4.1 4.3
1 to Under 2 844.2 21.8 10.3 10.9
2 to Under 3 597.9 15.5 12.5 13.0
3 to Under 5 536.4 13.9 18.5 19.0
5 to Under 10 368.4 9.5 21.5 21.5
10 to Under 20 149.0 3.9 16.5 16.0
20 to Under 40 36.7 1.0 8.1 7.7
40 to Under 60 5.7 0.1 2.3 2.0
60 and above 4.9 0.1 4.2 3.6
Total OwnerOwner-
cum Tenant
Tenant Total Owner Owner-cum Tenant Tenant
3827.4 3012.8 414.7 399.9 10326 7188.8 1958.9 1178.3
Under 0.5 703.6 652.7 7.3 43.6 201.1 184.2 2.4 14.5
0.5 to Under 1 617.3 534.6 24.9 57.8 459.4 396.2 18.7 44.5
1 to Under 2 844.2 681.8 77.8 84.6 1166.8 935.8 112.6 118.4
2 to Under 3 597.9 444.0 78.9 75 1403.9 1037.6 191.3 175.0
3 to Under 5 536.4 366.0 97.5 72.9 2081.5 1415.6 379.3 286.6
5 to Under 10 368.4 230.9 88.2 49.3 2422.3 1510.9 604.6 306.8
10 to Under 20 149.0 95.0 38.0 16.0 1858.6 1173.0 498.8 186.8
40 to Under 60 5.7 4.1 1.2 0.4 263.1 190.8 54.0 18.3
60 and above 4.9 3.7 0.9 0.3 469.3 344.7 97.2 27.4
32
Total
Farms Farms Area Cultivated Area
211.3
2221.4
1645.8
789.9
18.3
10295.3
AGRICULTURE
Table 3 :- Number and Area of Farms by Size of Farm,
(Area in Thousand Hectares)
Total
10313.6
Private Farms – Total
11262
26.8
Size of Farm (Hectares)
1955.0
191.3
443.7
1124.4
1341.7
263.1
2081.5
2422.3
1858.6
909.2
Number of Farms ( `000' )
469.3 370.8
The Punjab: 2000 Census of Agriculture
Size of Farm ( Hectares )
Farm Area ( `000' Hectares )
Table 4 :- Private Farms and Farm Area by Tenure and Size of Farm
Source :- Agricultural Census Organization, Govt. of Pakistan, Lahore. "Census of Agriculture, 2000".
Source :- Agricultural Census Organization, Govt. of Pakistan, Lahore. "Census of Agriculture, 2000".
The Punjab: 2000 Census of Agriculture
Total
All Farms
Government Farms
1403.9
11235.2
201.1
459.4
1166.8

1997 31.6 28.2 29.3 28.8 32.2 28.6 30.1 30.9 27.1 29.5 30.3 27.81998 33.1 32.4 31.1 30.6 33.8 30.6 31.8 32.7 28.9 31.6 32.2 29.31999 33.7 33.9 31.9 31.4 33.6 31.1 32.1 33.2 29.8 32.8 33.1 30.0
2000 33.7 33.7 31.9 31.2 33.8 30.9 32.4 33.3 29.8 32.2 32.8 29.82001 33.7 33.5 31.3 31.6 33.7 30.7 32.2 32.8 30.2 31.8 32.4 29.92002 36.6 34.7 32.0 31.8 34.3 31.1 32.5 33.4 30.1 32.3 32.9 30.6
2003 33.5 32.9 31.0 30.2 33.3 29.9 31.1 32.7 28.8 31.2 31.9 29.02004 34.2 33.8 31.8 31.4 34.2 30.8 32.3 33.1 29.5 32.3 32.6 30.12005 32.7 32.5 30.7 30.3 32.4 29.9 17.0 18.1 28.3 30.8 31.6 29.1
2006 33.5 33.1 31.4 30.9 33.2 30.6 31.8 32.9 29.3 30.1 32.5 29.9
1997 17.7 15.3 16.6 16.7 16.9 18.6 16.6 17.8 14.3 17.3 17.6 16.11998 18.2 19.4 17.3 17.1 17.7 19.3 17.1 18.6 14.8 17.7 18.3 16.61999 18.0 19.6 18.0 17.8 18.3 19.7 17.6 18.9 15.5 18.4 18.8 17.2
2000 18.7 19.2 17.6 17.4 18.2 19.4 17.6 18.6 15.5 18.1 18.6 16.92001 18.0 18.7 17.7 16.9 18.3 19.5 17.6 18.8 15.4 18.0 18.7 16.72002 19.0 19.6 18.2 17.8 18.6 20.1 17.9 19.0 15.5 18.1 18.8 16.9
2003 18.3 18.7 17.7 17.5 18.0 19.5 17.1 18.5 14.9 18.0 18.3 16.72004 19.9 19.9 18.1 17.8 18.8 20.3 18.1 19.1 15.4 18.6 19.0 17.12005 18.4 18.3 17.0 17.1 17.9 19.4 30.7 31.7 14.6 17.5 17.9 16.4
2006 17.5 19.6 18.3 18.3 19.4 20.3 18.2 19.6 16.0 18.4 19.2 17.8
33
MEAN OF MAXIMUM
MEAN OF MINIMUM
Mianwali Multan Sargodha ShorkotRawalpindi / Islamabad
AGRICULTURETable 5 :- Temperature at Selected Centres, The Punjab
(Centigrades)
Bahawalpur Bahawalnagar Faisalabad Jhelum Khanpur Lahore SialkotCentreYear

Station Year/ Month
Baha-walpur
Bahawal-nagar
Faisal-abad Jhelum Khan-
pur Lahore Mian-wali
Mul-tan Murree Rawal-
pindiSar-
godhaShor-kot
Sial-kot
1997 304 340 807 1336 125 1233 699 264 2307 1414 629 481 1388
1998 159 267 332 961 62 493 760 136 1973 1412 411 295 1037
1999 121 172 188 628 96 474 592 177 1897 1012 373 107 646
2000 79 171 212 841 20 558 424 82 1484 999 451 202 900
2001 182 272 372 747 98 536 458 298 1317 1178 612 265 792
2002 42 104 274 533 9 334 302 101 1264 931 530 91 545
2003 185 331 379 962 271 628 538 160 1521 1247 424 375 1603
2004 150 179 377 859 24 495 477 191 1485 1027 363 186 914
2005 197 201 518 662 86 652 712 301 1616 973 645 327 625
2006 168 174 444 1233 147 752 425 155 1692 1598 481 205 865
2006
January 0.2 7.2 8.3 67.2 2.0 18.9 13.0 1.7 192.0 70.0 4.0 5.0 26.2
February 0.0 0.0 12.5 20.3 0.0 4.9 23.0 12.2 80.1 27.0 7.0 9.0 10.7
March 37.8 14.0 31.1 11.1 25.5 42.1 53.0 55.4 53.2 61.0 18.0 28.0 27.8
April 12.6 7.0 0.0 13.5 2.8 1.0 17.0 1.2 46.2 19.0 10.0 3.0 0.5
May 0.0 5.0 15.4 33.2 1.0 22.4 40.0 1.6 55.1 76.0 72.0 1.0 26.4
June 16.0 70.8 35.5 64.0 27.8 87.9 2.0 9.9 138.5 126.0 29.0 26.0 52.6
July 5.0 36.5 57.4 485.3 0.0 185.5 84.0 1.6 376.0 504.0 47.0 40.0 314.3
August 72.5 2.0 123.4 371.1 67.0 145.7 122.0 32.7 311.1 418.0 146.0 32.0 84.0
September 4.0 3.0 85.6 38.8 0.0 157.6 3.5 1.0 143.9 52.0 32.0 0.0 194.4
November 5.0 4.0 9.0 25.0 2.0 9.0 28.0 3.0 73.6 20.0 11.0 26.0 8.1
December 14.6 24.3 46.2 85.4 19.3 30.8 26.0 31.2 172.2 133.0 77.0 32.0 38.5
Source :- Director, Regional Meteorological Centre, Lahore.
AGRICULTURE
Table 6 :- Rainfall at Selected Stations, The Punjab
34
(Millimetres)

RegionMain
Canals & Branches
Major Distrib-utories
Minor Distrib-utories
Sub- Total
Supply Escape
ChannelsSub-Total Drains Grand
Total
1 2 3 4 5=3+4 6 7=2+5+6 8 9=7+8
THE PUNJAB 3801 11609 7464 19073 247 23121 6533 29654
Bahawalpur 805 2355 1508 3863 79 4747 232 4979
D.G.Khan 428 961 605 1566 2 1996 100 2096
Faisalabad 557 1699 699 2398 38 2993 1520 4513
Lahore 572 1739 1149 2888 75 3535 1315 4850
Multan 776 2480 1776 4256 26 5058 1526 6584
Sargodha 661 2270 1687 3957 27 4645 1840 6485
Development Zone (Small Dams) 2 105 40 145 - 147 - 147
Source:- Irrigation and Power Department, Govt. of the Punjab, Lahore. One Canal Mile = 5000 Feet.
35
AGRICULTURE
Table 7:- Region Wise Length of Channels and Drains, The Punjab: 2005-06
(Canal Miles)

Year (April-March)
All Canals (Punjab)
Five Linked Canals
M.R. Link
(Inter-nal)
Haveli Canals
Panjnad Canals
Central Bari Doab
Canals
Sutlej Valley Canals
Thal Canals
Taunsa Canals C.R.B.C.
Kharif
1997-98 32.80 10.48 0.21 2.20 3.54 0.64 7.99 2.66 5.08 -
1998-99 36.41 11.27 0.74 2.46 3.86 0.81 9.87 2.70 4.70 -
1999-00 37.97 12.29 0.72 2.44 3.64 0.83 10.38 2.70 4.97 -
2000-01 32.57 10.69 0.41 2.02 3.24 0.82 8.95 2.28 4.16 -
2001-02 28.71 9.33 0.25 1.83 2.90 0.65 7.81 2.06 3.77 0.11
2002-03 33.79 10.84 0.75 2.08 3.18 0.83 8.75 2.53 4.52 0.31
2003-04 37.47 12.10 0.64 2.27 3.88 0.87 9.78 2.74 4.75 0.44
2004-05 32.03 10.41 0.59 1.97 3.39 0.71 8.46 2.30 3.75 0.45
2005-06 38.01 11.50 0.86 2.25 4.38 0.84 10.17 2.81 4.74 0.49
2006-07 36.32 11.16 0.67 2.20 4.04 0.80 9.68 2.67 4.58 0.52
Rabi
1997-98 18.41 6.72 0.02 1.13 1.78 0.40 4.59 2.22 1.55 -
1998-99 20.01 7.69 0.31 1.33 1.82 0.55 4.83 2.10 1.38 -
1999-00 16.91 7.07 - 0.95 1.37 0.60 3.91 1.83 1.18 -
2000-01 12.01 5.37 - 0.61 0.88 0.47 2.55 1.21 0.92 -
2001-02 11.71 4.45 0.38 0.59 1.01 0.51 2.88 0.94 0.81 0.14
2002-03 14.83 5.75 - 0.89 1.45 0.43 3.28 1.45 1.28 0.30
2003-04 17.91 6.98 - 0.89 1.96 0.53 4.04 1.66 1.47 0.38
2004-05 12.13 4.51 - 0.59 1.44 0.40 2.73 1.13 1.07 0.26
2005-06 17.07 7.08 - 1.00 1.71 0.54 3.92 1.44 1.00 0.38
2006-07 17.11 6.10 0.04 0.93 1.63 0.47 4.14 1.76 1.71 0.33
Source:- Directorate of Water Resource Management, WAPDA, Lahore.
AGRICULTURE
Table 8 :- Canal Withdrawals, The Punjab(Million Acre Feet)
36
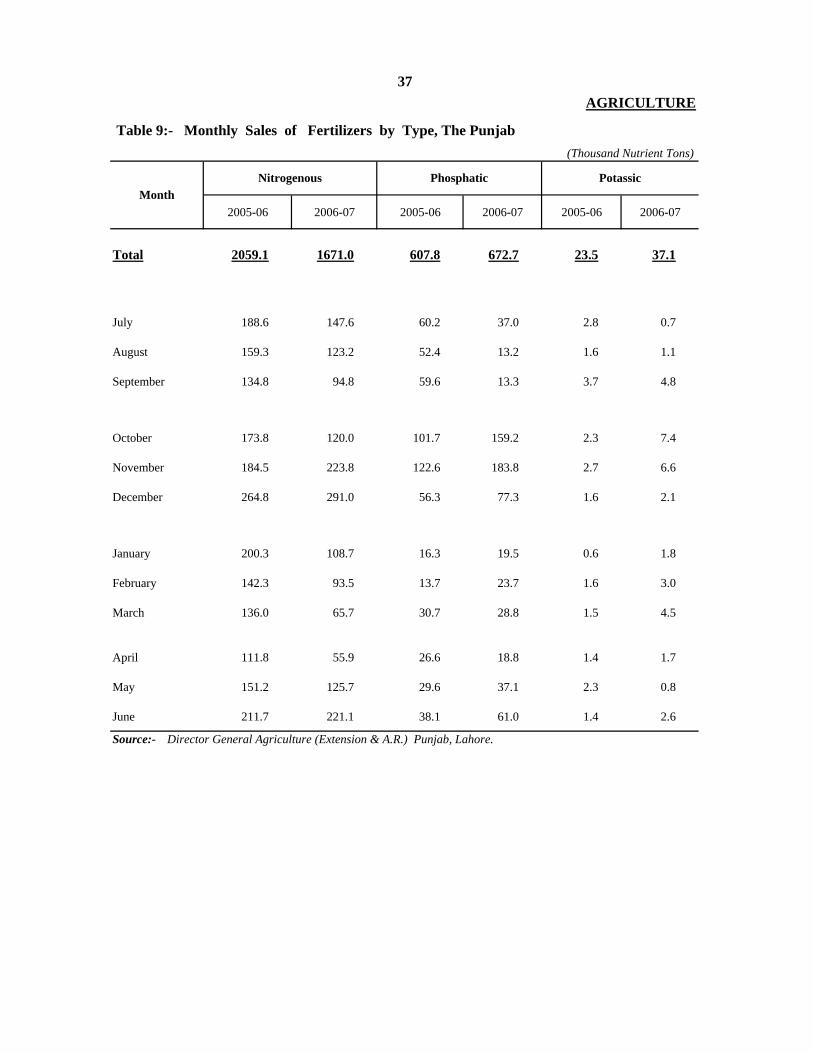
2005-06 2006-07 2005-06 2006-07 2005-06 2006-07
Total 2059.1 1671.0 607.8 672.7 23.5 37.1
July 188.6 147.6 60.2 37.0 2.8 0.7
August 159.3 123.2 52.4 13.2 1.6 1.1
September 134.8 94.8 59.6 13.3 3.7 4.8
October 173.8 120.0 101.7 159.2 2.3 7.4
November 184.5 223.8 122.6 183.8 2.7 6.6
December 264.8 291.0 56.3 77.3 1.6 2.1
January 200.3 108.7 16.3 19.5 0.6 1.8
February 142.3 93.5 13.7 23.7 1.6 3.0
March 136.0 65.7 30.7 28.8 1.5 4.5
April 111.8 55.9 26.6 18.8 1.4 1.7
May 151.2 125.7 29.6 37.1 2.3 0.8
June 211.7 221.1 38.1 61.0 1.4 2.6
37AGRICULTURE
Table 9:- Monthly Sales of Fertilizers by Type, The Punjab(Thousand Nutrient Tons)
Source:- Director General Agriculture (Extension & A.R.) Punjab, Lahore.
MonthNitrogenous Phosphatic Potassic

38
SALES OF FERTILIZERS BY TYPESALES OF FERTILIZERS BY TYPETHE PUNJAB
NITROGENOUS2059
( 76.5% )
06-2005
PHOSPHATIC608
POTASSIC23
( 0.9%) 608( 22.6% )
( )
07-2006TOTAL :2381 Thousand N. Tons
NITROGENOUS1671
( 70.2% )
POTASSIC37
( 1.6%)PHOSPHATIC
673( 28.2% )

District 2002-03 2003-04 2004-05 2005-06 2006-07
The Punjab 1954 2149 2481 2590 2292
Bahawalpur 114 114 153 150 126Bahawalnagar 93 110 121 119 107Rahim Yar Khan 168 170 235 220 174
D.G. Khan 48 53 67 64 62Layyah 48 59 49 62 56Muzaffargarh 87 90 103 103 104Rajanpur 54 63 70 73 74
Faisalabad 91 100 104 127 87Jhang 99 97 120 140 97T.T. Singh 49 63 60 61 48
Gujranwala 69 72 83 89 80Gujrat 22 20 26 26 102Hafizabad 41 51 47 57 42Mandi Baha-ud-Din 35 41 48 56 32Narowal 27 45 47 55 38Sialkot 32 36 40 39 36
Lahore 51 57 40 63 41Kasur 78 88 87 94 68NankanaOkara 93 94 135 146 86Sheikhupura 78 101 109 100 79
Multan 117 114 152 172 169Khanewal 92 104 112 126 97Pakpattan 68 71 80 78 69Sahiwal 75 76 95 87 89Vehari 102 129 143 144 105
Rawalpindi 7 10 14 11 108Attock 8 8 8 11 8Chakwal 4 4 3 3 3Jhelum 1 3 2 2 3
Sargodha 60 58 78 65 53Bhakkar 21 23 25 24 26
Khushab 8 10 9 9 8Mianwali 14 15 16 14 15Source:- Director General Agriculture (Extension & A.R.) Punjab, Lahore.
39AGRICULTURE
Table 10:- Sales of Fertilizers by District, The Punjab(Thousand Nutrient Tons)
( Included in Sheikhupura District )

Total Nitrogenous Phosphatic Potassic
1 Opening Stock As on 01.07.2005 92491 29882 58166 4443
2 Total Receipt 2808538 2119509 655092 33937
3 Total Availability (1+2) 2901029 2149391 713258 38380
4 Total Off -Take 2690422 2059213 607903 23306
5 Closing Stock As on 30.06.2006 (3-4) 210607 90178 105355 15074
1 Opening Stock As on 01.07.2006 210607 90178 105355 15074
2 Total Receipt 2330487 1631784 661633 37070
3 Total Availability (1+2) 2541094 1721962 766988 52144
4 Total Off -Take 2380897 1671020 672733 37144
5 Closing Stock As on 30.06.2007 (3-4) 160197 50942 94255 15000
Source:- Director General Agriculture (Extension & A.R.) Punjab Lahore.
Item
2006-07
2005-06
40AGRICULTURETable 11:- Availability and Off-Take of Fertilizers, The Punjab
(Nutrient Tons)

Effective date of price UREA CAN NP SSP (P) SSP (G) TSP ZS (WHITE)
(a)
16-01-2004 429 275 575 265 320 510 17017-02-2004 429 280 585 270 325 510 17005-03-2004 434 280 585 270 325 510 17006-03-2004 434 280 585 275 330 510 17002-04-2004 439 280 585 275 330 510 17024-04-2004 439 280 595 275 330 510 17003-06-2004 443 280 595 275 330 510 17015-06-2004 451 280 595 275 330 510 17001-07-2004 459 288 603 275 330 510 17015-07-2004 463 288 603 275 330 510 17019-07-2004 463 288 593 275 330 510 17016-08-2004 445 288 593 275 330 510 17025-10-2004 450 288 593 275 330 510 17001-11-2004 450 288 593 275 330 510 17018-11-2004 450 288 593 275 330 510 17019-11-2004 450 288 593 285 340 510 17016-12-2004 450 293 599 285 340 510 170
12-01-2005 450 293 599 295 340 510 17027-01-2005 450 293 599 295 350 510 17003-02-2005 460 293 599 295 350 510 17008-02-2005 465 293 599 295 350 510 17009-02-2005 465 293 599 295 350 510 17022-02-2005 465 298 605 295 350 510 17016-03-2005 465 298 615 295 350 510 17019-03-2005 470 298 615 295 350 510 17007-04-2005 475 298 615 295 350 510 17019-04-2005 475 298 615 295 350 510 17001-07-2005 484 298 615 305 360 510 17021-07-2005 484 298 615 315 370 510 17018-08-2005 484 340 650 315 370 510 17031-12-2005 484 340 650 325 380 510 145
01-01-2006 500 340 650 325 380 510 14516-04-2006 510 340 650 325 380 510 14501-07-2006 520 340 650 325 380 510 14505-07-2006 525 340 650 325 380 510 14501-10-2006 525 340 650 227 271 510 145
41
Note:- DAP, SOP & NPK is not available with NFC.Source:- National Fertilizer Marketing Limited, Regional Office, Lahore.
AGRICULTURE
Table 12:- Prices of Various Types of Fertilizers(Rs. Per Bag of 50 Kgs.)
(a) Zinc Sulphate price is Rs. 170 per bag of 5 kg).

N P2 O5 K N P2 O5 K
I.
i) Ammonium Sulphate (Indig.) 21 - - 10.5 - -
ii) Ammonium Nitrate (Indig.) 26 - - 13.0 - -
iii) Ammonium Sulphate
Nitrate (Imp.) 26 - - 13.0 - -
iv) Urea (Indig. + Imp.) 46 - - 23.0 - -
II.
i) Single Super Phosphate - 18 - - 9.0 -
ii) Triple Super Phosphate - 46 - - 23.0 -
III.
Sulphate of Potash (Imp.) - - 50 - - 25.0
IV.
i) Nitrophos (23 : 23) 23 23 - 11.5 11.5 -
ii) Di-Ammonium Phosphate 18 46 - 9.0 23.0 -
iii) Mono Ammonium Phosphate 11 48 - 5.5 24.0 -
iv) NPK 10 : 20 : 20 10 20 20 5.0 10.0 10.0
v) NPK 13 : 13 : 21 13 13 21 6.5 6.5 10.5
vi) NPK 20 : 13 : 13 20 13 13 10.0 6.5 6.5
Nitrogenous Fertilizers
Potassic Fertilizers
Compound Fertilizers
42AGRICULTURE
Source:- Director General Agriculture (Extension & A.R.) Punjab Lahore.
Name of Fertilizer
Table 13 :- Nutrient Contents Present in Various Types of Fertilizers
Percentage of Nutrients Present
Nutrients Present in Per Bag of 50 Kg. ( in Kg.)
Phosphatic Fertilizers

Year Total Wheat Paddy Cotton Maize Gram Potato
1997-98 61434 54940 1243 4382 7 62 800
1998-99 70189 64747 1050 3611 220 264 297
1999-00 62271 56911 1336 3557 269 122 76
2000-01 71955 64427 767 5500 300 126 835
2001-02 71062 64157 1559 4256 103 87 900
2002-03 70285 63548 1241 4205 86 117 1088
2003-04 67451 60740 1780 3600 132 204 995
2004-05 57308 51170 2338 2570 188 115 927
2005-06 43674 37715 1978 3277 192 47 465
2006-07 55027 49475 2131 2281 80 60 1000Source:- Director( Marketing) Punjab Seed Corporation, Lahore.
43AGRICULTURE
Table 14 :- Distribution of Indigenous Improved Seeds by Crop, The Punjab
(Metric Tons)

Hectares% of Total Cropped
AreaWheat Cotton Sugar-
cane Rice Maize Onion Potato Tobacco Orchards
15884678 3753519 24 17 73 16 37 18 14 50 21 29
14414 2970 21 37 91 14 27 22 - 13 100 34
15870264 3750549 24 17 73 16 37 18 14 50 21 29
Under 0.5 333382 46178 14 9 64 8 19 1 2 13 16 33
0.5 to Under 1 759771 142743 19 12 69 8 26 4 8 38 13 32
1 to Under 2 1879372 389139 21 15 70 10 30 8 10 36 9 26
2 to Under 3 2183783 493218 23 17 72 12 34 11 14 36 18 23
3 to Under 5 3087382 716517 23 17 72 13 37 15 9 46 17 22
5 to Under 10 3365014 865096 26 20 75 16 40 24 11 39 31 25
10 to Under 20 2400197 610357 25 18 76 21 42 30 26 53 18 29
20 to Under 40 1086619 271752 25 19 72 22 46 43 20 57 47 42
40 to Under 60 294105 77905 26 20 72 30 41 46 3 50 6 34
60 and above 480655 137650 29 20 72 24 49 60 9 79 48 39
Source:- Agricultural Census Organization, Government of Pakistan , Lahore " Pakistan Census of Agriculture - 2000 .
All Farms
Government Farms
Private Farms-Total
44AGRICULTURE
Table 15 :- Use of Plant Protection Measures on Important Crops by Size of Farm, The Punjab: 2000 Census
Total Cropped Area (Hectares)
Area Covered by Plant Protection Percentage of Cropped Area Covered by Plant Protection Measures
Size of Farm (Hectares)
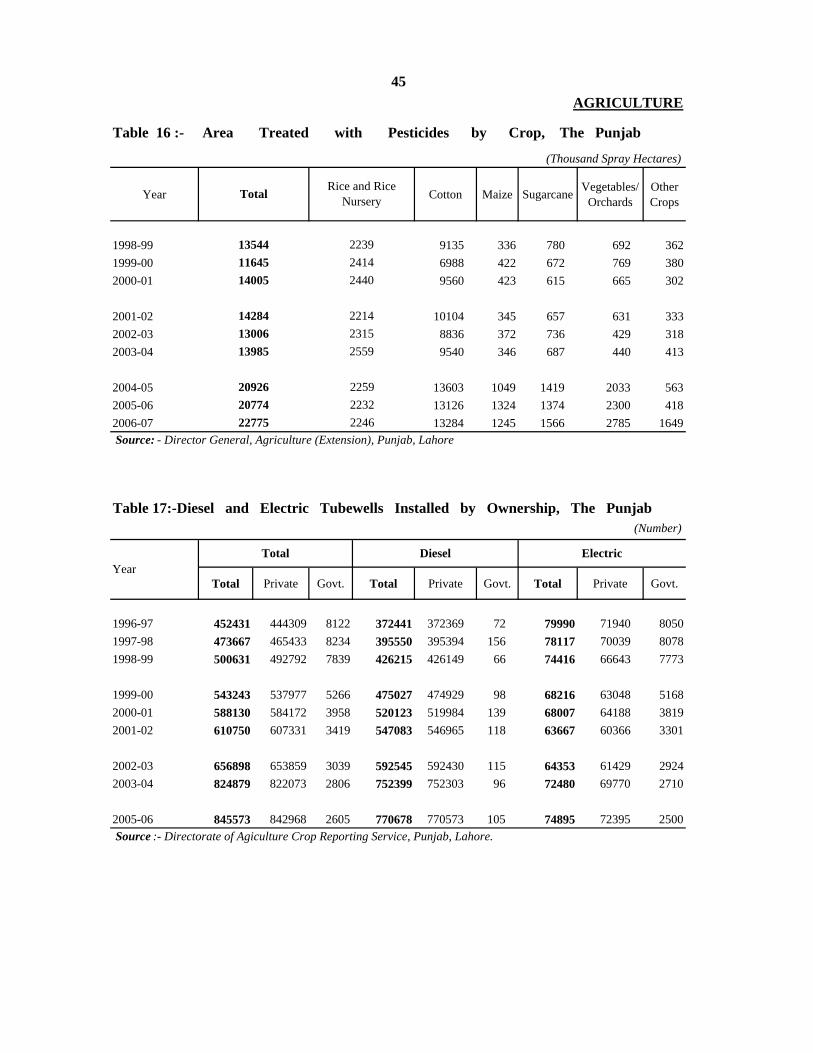
Year Cotton Maize Sugarcane Vegetables/ Orchards
Other Crops
1998-99 9135 336 780 692 3621999-00 6988 422 672 769 3802000-01 9560 423 615 665 302
2001-02 10104 345 657 631 3332002-03 8836 372 736 429 3182003-04 9540 346 687 440 413
2004-05 13603 1049 1419 2033 5632005-06 13126 1324 1374 2300 4182006-07 13284 1245 1566 2785 1649
Total Private Govt. Total Private Govt. Total Private Govt.
1996-97 452431 444309 8122 372441 372369 72 79990 71940 80501997-98 473667 465433 8234 395550 395394 156 78117 70039 80781998-99 500631 492792 7839 426215 426149 66 74416 66643 7773
1999-00 543243 537977 5266 475027 474929 98 68216 63048 51682000-01 588130 584172 3958 520123 519984 139 68007 64188 38192001-02 610750 607331 3419 547083 546965 118 63667 60366 3301
2002-03 656898 653859 3039 592545 592430 115 64353 61429 29242003-04 824879 822073 2806 752399 752303 96 72480 69770 2710
2005-06 845573 842968 2605 770678 770573 105 74895 72395 2500 Source :- Directorate of Agiculture Crop Reporting Service, Punjab, Lahore.
YearTotal Diesel
224622775
(Number)
Electric
Source: - Director General, Agriculture (Extension), Punjab, Lahore
Table 17:-Diesel and Electric Tubewells Installed by Ownership, The Punjab
20774 2232
13985
20926 2259
2559
1428413006
Table 16 :- Area Treated with Pesticides by Crop, The Punjab
2239
23152214
(Thousand Spray Hectares)
Rice and Rice NurseryTotal
45
24402414
135441164514005
AGRICULTURE

Total Private Govt. Total Private Govt. Total Private Govt.
The Punjab 858267 855716 2551 776903 776817 86 81364 78899 2465
Bahawalpur 20002 19709 293 17866 17854 12 2136 1855 281Bahawalnagar 26582 26582 - 25395 25395 - 1187 1187 -R. Y. Khan 42989 42671 318 40598 40598 - 2391 2073 318
D. G. Khan 11274 11274 - 10750 10750 - 524 524 -Layyah 45952 45929 23 45667 45666 1 285 263 22Muzaffargarh 45447 44394 1053 44005 44005 - 1442 389 1053Rajanpur 12606 12606 - 12206 12206 - 400 400 -
Faisalabad 27850 27799 51 25150 25147 3 2700 2652 48Jhang 51832 51826 6 41551 41546 5 10281 10280 1Toba Tek Singh 16464 16406 58 14493 14493 - 1971 1913 58
Gujranwala 56229 56221 8 49060 49060 - 7169 7161 8Gujrat 25191 25191 - 23091 23091 - 2100 2100 -Hafizabad 26521 26490 31 24307 24307 - 2214 2183 31Mandi Baha-ud-Din 43335 43334 1 42994 42994 - 341 340 1Narowal 40122 40122 - 39753 39753 - 369 369 -Sialkot 64543 64526 17 61562 61560 2 2981 2966 15
Lahore 5377 5233 144 3651 3651 - 1726 1582 144Kasur 18175 18173 2 11288 11288 - 6887 6885 2Nankana 22834 22754 80 20043 20043 - 2791 2711 80Okara 32605 32585 20 27862 27859 3 4743 4726 17Sheikhupura 24888 24888 - 22087 22087 - 2801 2801 -Multan 16721 16700 21 14833 14830 3 1888 1870 18Khanewal 23492 23440 52 19670 19670 - 3822 3770 52Lodhran 12374 12360 14 10520 10520 - 1854 1840 14Pakpattan 14670 14613 57 9444 9423 21 5226 5190 36Sahiwal 15113 15054 59 12353 12349 4 2760 2705 55Vehari 18162 18155 7 13848 13847 1 4314 4308 6
Rawalpindi 1181 1176 5 966 961 5 215 215 -Attock 590 574 16 480 480 - 110 94 16Chakwal 2028 2027 1 2004 2004 - 24 23 1Jhelum 5338 5338 - 4850 4850 - 488 488 -
Sargodha 36581 36576 5 35382 35382 - 1199 1194 5Bhakkar 32484 32424 60 31898 31877 21 586 547 39Khushab 8388 8282 106 8183 8183 - 205 99 106Mianwali 10327 10284 43 9093 9088 5 1234 1196 38
46AGRICULTURE
Table 18:-Diesel and Electric Tubewells Installed by Ownership and District
The Punjab: 2005-06(Number)
Source:- Directorate of Agriculture Crop Reporting Service, Punjab, Lahore.
Total Diesel ElectricDistrict

TotalBelonging to Tubewell/Lift Pump owners
Belong-ing to others
TotalBelonging to Tubewell/Lift Pump Owners
Belong-ing to Others
The Punjab 828805 6060 5850 4483 1362 6245 4841 1400
Bahawalpur 18954 44 199 134 65 207 140 67Bahawalnagar 25426 139 270 202 68 269 205 64R.Y.Khan 40837 45 358 273 84 368 274 94(Cholistan) 158 - 2 1 1 2 1 1
D.G.Khan 15630 399 93 88 4 104 99 5Layyah 44117 5 191 178 13 241 226 15Muzafargarh 48037 60 243 220 23 282 252 30Rajanpur 15423 284 131 116 15 123 109 14
Faisalabad 27093 73 273 133 140 275 141 134Jhang 51292 37 389 285 104 437 332 105T.T.Singh 15586 1 140 83 56 146 90 56
Gujranwala 50191 65 250 247 3 259 256 3Gujrat 23580 155 61 49 12 82 61 20Hafizabad 25566 1 152 151 1 161 160 1Mandi Baha-ud-Din 43116 - 164 155 8 176 167 9Narowal 35946 357 96 90 6 99 93 6Sialkot 58768 640 184 168 16 191 173 18
Lahore 5829 109 58 52 7 62 55 7Kasur 18687 114 193 141 51 206 155 51NankanaOkara 31910 6 328 276 52 337 284 52Sheikhupura 46949 289 280 259 21 290 268 22Multan 15474 86 224 163 61 230 168 62Khanewal 18719 38 280 148 132 264 147 117Lodhran 10103 1 175 109 66 178 109 69Pakpattan 13873 - 176 111 65 179 113 66Sahiwal 15737 4 219 110 109 225 114 111Vehari 16877 22 286 161 124 295 176 119
Rawalpindi 904 420 3 3 - 4 4 -Attock 3147 1091 8 7 1 9 8 1Chakwal 3481 926 6 5 1 10 8 1Jhelum 4999 389 10 8 2 23 15 8
Sargodha 35164 6 178 167 11 220 205 14Bhakkar 29978 33 127 118 9 153 141 11Khushab 8287 165 24 20 4 35 29 7Mianwali 8910 48 79 52 27 103 63 40(Islamabad) 57 8 - - - - - -
47AGRICULTURE
Table 19:-Private Tubewells/Lift Pumps and Area Irrigated by them by District The Punjab : 2004 Census of Agricultural Machinary
Source:- Agricultural Census Organization Statistics Division, Government of Pakistan, Lahore.
DistrictRabi 2003-04
Area Irrigated ( ‘000’ Hectares )
Kharif 2003Lift Pumps (Num-
ber)
Tube-Wells
(Number)
( I n c l u d e d i n S h e i k h u p u r a D i s t r i c t )

District1994
or Before
1995 1996 1997 1998 1999 2000 2001 2002 20032004 (Upto
March)
The Punjab 326460 51562 53781 48822 67980 63260 68937 62730 37955 29872 2270
Bahawalpur 7409 1188 1206 1243 1578 1525 1851 1466 840 564 84Bahawalnagar 7231 1674 1625 1767 2445 2563 3071 2523 1477 970 79R.Y.Khan 12569 2381 2346 2289 3812 3462 5080 4511 2595 1696 94(Cholistan) 25 7 9 12 20 16 24 23 12 10 -
D. G. Khan 5179 1145 1327 1218 1643 1664 1309 1113 566 411 55Layyah 18723 3188 3637 3378 3691 3415 2789 2701 1380 1056 159Muzafargarh 12279 2940 4013 3229 5273 4259 5951 4718 2887 2304 183Rajanpur 4750 913 1488 1350 1876 1265 1591 1177 555 406 52
Faisalabad 8595 1716 1496 1530 2463 2648 3099 2917 1676 883 72Jhang 23545 3366 3368 3027 3667 3661 3473 3430 1892 1691 172T.T.Singh 5836 1148 906 966 1292 1255 1378 1420 851 515 19
Gujranwala 23444 3218 3190 2796 3629 3509 3246 3361 1999 1628 171Gujrat 9440 1515 1643 1554 1871 1646 2020 1766 1110 966 49Hafizabad 12537 1462 1680 1403 1772 1863 1553 1662 1009 587 38M. Bahauddin 17766 2951 3631 3249 3700 3791 2673 2929 1533 1133 60Narowal 14103 2453 2908 2413 2972 2876 2766 2274 1515 1581 85Sialkot 26159 3563 3601 2971 4003 3882 4699 4129 2862 2708 191
Lahore 3505 385 317 230 354 285 245 268 132 100 8Kasur 10404 953 752 661 1136 1078 1303 1152 694 513 41NankanaOkara 13555 1664 1736 1559 2672 2413 2662 2571 1671 1367 40Sheikhupura 17624 3410 3505 3258 4756 3756 3777 3275 1761 1717 110
Khanewal 9444 1016 903 661 1260 1092 1383 1253 919 721 67Lodhran 6538 682 329 337 520 414 470 326 211 241 35Pakpattan 7165 892 673 639 937 784 924 702 470 638 49Sahiwal 6189 1113 807 809 1452 1250 1338 1341 859 535 44Vehari 10736 983 731 689 792 676 711 633 477 406 43
Rawalpindi 386 32 39 44 53 38 65 73 76 93 5Attock 1268 167 126 111 176 210 236 222 294 308 29Chakwal 839 241 201 201 326 315 373 356 287 325 17Jhelum 2414 291 252 252 337 259 330 310 313 228 13
Sargodha 9344 2179 2174 2353 3323 3704 4017 4192 2318 1506 54Bhakkar 12176 1843 2146 1563 2489 1981 2574 2339 1582 1165 120Khushab 2278 451 531 569 851 953 910 767 523 438 16Mianwali 2977 431 480 489 837 746 1042 826 606 460 16(Islamabad) 28 1 5 2 2 6 4 4 3 2 -
Division, Government of Pakistan, Lahore.Source:- 1994 and 2004 Agricultural Machinery Census, Agricutural Census Organization, Statistics
48AGRICULTURETable 20:- Private Tubewells by Year of Installation and by District, The Punjab
(Number)
(Included in Sheikhupura District)

Installed / Electrified Pumping Installed /
Electrified Pumping Installed / Electrified Pumping
Grand Total 2509 1824 2518 1832 2518 1832
SCARP-II(Chaj Doab) 821 792 830 800 830 800
Saline Zone Tubewell 781 752 790 760 790 760
Rasul Qadirabad Link 40 40 40 40 40 40
SCARP -III (Lower Thal) 1688 1032 1688 1032 1688 1032
Alipur 570 515 570 515 570 515
Kot Addu 525 517 525 517 525 517
Rangpur 593 - 593 - 593 -
49
2006 2007
ii) For SCARP-III,Superintending Engineer, SCARP- III, Multan.
AGRICULTURE
(As on 30th June)
(Number)
Place
Table 21:- Tubewells Installed / Electrified and Pumping in SCARP Areas The Punjab
Note:- i) All the Tubewells in Scarp-I Project have been permanently closed.
iii) All the Tubewells of SCARP-IV have been closed Permanently as per policy of the Government.Source:- i) For SCARP-II, Superintending Engineer, SCARP-II, Sargodha.
ii) All the Tubewells in Sweet Water Zone, Mona and Shahpur Unit-I have been permanently closed under transition programme.
2005

Total Kharif Rabi Total Kharif Rabi
1. Rasul Qadirabad Link
1997-98 60 30 30 13 8 5
1998-99 60 30 30 13 7 6
1999-00 55 30 25 14 11 3
2000-01 60 30 30 12 5 7
2001-02 59 30 29 19 9 10
2002-03 59 30 29 18 11 7
2003-04 60 30 30 19 11 8
2004-05 59 30 29 27 15 12
2005-06 59 30 29 24 12 12
2006-07 57 30 27 18 11 7
2. Saline Zone Tubewells
1997-98 577 288 289 126 64 62
1998-99 571 289 282 132 70 62
1999-00 548 277 271 141 67 74
2000-01 544 268 276 120 61 59
2001-02 579 284 295 126 61 65
2002-03 592 296 296 120 60 60
2003-04 593 297 296 136 70 66
2004-05 582 292 290 116 60 56
2005-06 592 293 299 122 57 65
2006-07 550 302 248 107 64 43
50
(Thousand Acre Feet)
Scheme/YearInstalled Capacity (a) Actual Pumpage (b)
Table 22 :- Pumpage Capacity and Actual Pumpage of SCARP-II Tubewellsby Crop Season and Scheme, The Punjab.
Note:- Tubewells in Sweet Water Zone, Mona and Shahpur Unit-I have been closed permanently under transition programme.
Source:-The Superintending Eng., SCARP-II Circle, Irrigation & Power Deptt.Govt. of the Punjab, Sargodha.
a) On the basis of designed capacity and 22 working hours per tubewell per day for six months. b) On the basis of existing capacity and actual working hours for six months.

Total Kharif Rabi Total Kharif Rabi
SCARP-III1. (Lower Thal)
1997-98 3812 1912 1900 569 258 3111998-99 3812 1912 1900 529 258 2711999-00 3824 1912 1912 555 209 346
2000-01 3812 1912 1900 607 308 2992001-02 3812 1912 1900 636 259 3772002-03 3812 1912 1900 661 320 341
2003-04 3812 1912 1900 778 372 4062004-05 3812 1912 1900 500 199 3012005-06 3812 1912 1900 600 200 400
2006-07 3812 1912 1900 600 200 400
2. Kot Addu
1997-98 1222 613 609 262 123 1391998-99 1222 613 609 243 113 1301999-00 1226 613 613 309 107 202
2000-01 1222 613 609 411 199 2122001-02 1222 613 609 460 185 2752002-03 1222 613 609 447 215 232
2003-04 1222 613 609 459 207 2522004-05 1222 613 609 343 143 2002005-06 1222 613 609 400 140 260
2006-07 1222 613 609 400 140 260
3. Ali Pur
1997-98 1224 614 610 129 54 751998-99 1224 614 610 114 55 591999-00 1228 614 614 104 33 71
2000-01 1224 614 610 154 67 872001-02 1224 614 610 176 74 1022002-03 1224 614 610 214 105 109
2003-04 1224 614 610 319 165 1542004-05 1224 614 610 157 56 1012005-06 1224 614 610 200 60 140
2006-07 1224 614 610 200 60 140
51AGRICULTURE
Table 23 : - Pumpage Capacity and Actual Pumpage of SCARP-III Tubewellsby Crop Season and Scheme, The Punjab
(Thousand Acre Feet)
Scheme/YearInstalled Capacity (a) Actual Pumpage (b)

Total Kharif Rabi Total Kharif Rabi
4. Rangpur
1997-98 1366 685 681 178 81 97
1998-99 1366 685 681 172 90 82
1999-00 1370 685 685 142 69 73
2000-01 1366 685 681 42 42 *
2001-02 1366 685 681 * * *
2002-03 1366 685 681 * * *
2003-04 1366 685 681 * * *
2004-05 1370 685 685 * * *
2005-06 1366 685 681 * * *
2006-07 1366 685 681 * * *
52
Source:- Superintending Engineer, SCARP-III, Irrigation and Power Department, Govt. of the Punjab, Multan.
* All the Tubewells have been closed under Transition Programme .
Table 23 : - Pumpage Capacity and Actual Pumpage of SCARP-III Tubewells
AGRICULTURE
by Crop Season and Scheme,The Punjab – Concld.( Thousand Acre Feet )
Scheme/YearInstalled Capacity (a) Actual Pumpage (b)
(b) On the basis of existing capacity and actual working hours for six months. (a) On the basis of designed capacity and 20 working hours per Tubewell per day for six months.

Govern-ment
The Punjab 599
Bahawalpur 53Bahawalnagar 19R.Y.Khan 31(Cholistan) -
D. G. Khan 11Layyah 12Muzafargarh 14Rajanpur 5
Faisalabad 31Jhang 10T.T.Singh 6
Gujranwala 13Gujrat 5Hafizabad 11M. Baha ud din 15Narowal 7Sialkot 12
Lahore 7Kasur 17NankanaOkara 13Sheikhupura 15
Khanewal 56Lodhran 4Pakpattan 12Sahiwal 49Vehari 23
Rawalpindi 10Attock 13Chakwal 13Jhelum 12
Sargodha 44Bhakkar 12Khushab 5Mianwali 6(Islamabad) 33545
63152927
1302678144923
1254714052
57366356
4699
1137614947
1102691288732
12361
577211996
(Included in Sheikhupura District)
577912013
25
140257376556068745737
112994073
154211379111377
49284705
578
148471633619566
702
44556851
636963282939
130707826
91328744
1259614075
5746
574412373
1138914962
11082
11383
14038738155716889
686311313
4078
1545213801
149001635519597
702
4466
32321725
-
8
12262611
18
6145
30
201210
1-
35
11
5191
6
454
3943-
142329
7
1854
7910413327472003
1109910386
305235143566
767510159
702060573243
4369
45618298
2933387427577572
1056681027369
8426
454
99461043513505
195
2881374669982619
1865
7942416527642028
1112910394
306435403592
771010177
708160613248
45868309
2945388427587572
1061781117370
84324389
2895376970272626
Source:- 1994 and 2004 Agricultural Machinery Census, Agricutural Census Organization, Statistics
Area 1994 Census (Sept.)
Private Total
99851043913508
195
Private
323167204024
Division, Government of Pakistan, Lahore.
53
2004 Census (March)
AGRICULTURE
Total
204631
Government
607
Table 24 :- Tractors by Ownership and by District, The Punjab
322568
(Number)

Area 1994 or Before 1995 1996 1997 1998 1999 2000 2001 2002 2003
2004 upto
March
The Punjab 108666 17875 16912 13346 23151 21816 31710 30662 28840 35176 3146
Bahawalpur 4343 1056 884 672 1335 1032 1565 1237 994 1456 271Bahawalnagar 4474 1135 995 593 985 975 1735 1447 1417 2300 282R.Y.Khan 6402 1082 932 802 1442 1323 1823 1894 1934 1844 90(Cholistan) 145 30 41 35 49 47 86 74 59 99 37
D. G. Khan 601 172 264 172 374 339 555 597 614 715 55Layyah 2174 480 299 200 519 379 738 748 549 658 110Muzafargarh 2663 470 691 460 851 860 1392 1272 901 1592 150Rajanpur 550 57 116 166 313 340 624 639 531 608 129
Faisalabad 6877 921 692 802 1093 872 1182 1082 721 1114 70Jhang 5190 736 791 689 1065 1042 1062 1190 1013 940 90T.T.Singh 4732 672 531 401 682 552 912 1082 772 982 60
Gujranwala 3794 736 699 471 910 947 1137 1569 1762 1830 168Gujrat 2641 410 340 250 511 421 721 691 651 661 80Hafizabad 1223 308 288 278 347 546 594 623 829 504 20M. Bahauddin 2412 431 560 310 520 531 461 460 591 570 30Narowal 1375 381 311 300 371 542 532 632 442 792 60Sialkot 3359 631 623 321 701 915 1471 1230 1343 1531 208
Lahore 2640 191 221 211 412 301 341 602 381 442 30Kasur 4594 442 563 392 784 836 1034 1054 875 1344 80NankanaOkara 3731 521 581 411 771 530 1201 941 1222 1372 100Sheikhupura 4801 650 800 630 1071 869 1425 1260 1642 1730 69
Multan 3064 462 471 401 482 582 902 762 653 802 130Khanewal 3794 624 615 446 784 695 924 882 833 1288 139Lodhran 3481 589 439 439 599 439 769 738 728 819 90Pakpattan 3017 512 322 312 382 432 925 873 844 1034 80Sahiwal 4293 771 421 471 991 861 1312 1211 1082 1082 60Vehari 5048 854 834 602 884 833 1126 1225 1074 1477 90
Rawalpindi 2120 308 326 209 367 401 594 421 485 457 48Attock 2187 361 270 240 492 532 492 511 533 663 70Chakwal 2263 362 322 271 423 453 674 573 443 503 30Jhelum 1151 180 150 149 219 279 189 180 150 249 30
Sargodha 4292 620 669 500 960 890 1340 1220 1070 1420 40Bhakkar 2030 290 360 250 561 450 912 912 892 1092 70Khushab 1872 259 189 288 438 378 388 278 339 496 -Mianwali 1070 160 281 191 421 350 510 520 450 668 80(Islamabad) 263 11 21 11 42 42 62 32 21 42 -
(Number)
Division, Government of Pakistan, Lahore.
(Included in Sheikhupura District)
Source:- 1994 and 2004 Agricultural Machinery Census, Agricutural Census Organization, Statistics
Table 25 :- Private Tractors by Purchase Periods and by District, The Punjab
54AGRICULTURE

Days Per Year Hours Per Day Days Per
YearHours Per
Day
The Punjab 202344 198 6 319897 170 6
Bahawalpur 9946 195 6 14847 169 6Bahawalnagar 10435 197 5 16336 158 5R.Y. Khan 13505 189 6 19566 154 6(Cholistan) 195 133 5 702 176 6
D.G. Khan 2881 184 7 4455 149 6Layyah 3746 206 6 6851 163 6Muzaffargarh 6998 190 7 11299 173 7Rajanpur 2619 206 8 4073 165 7
Faisalabad 10566 204 5 15421 197 5Jhang 8102 213 6 13791 212 6T.T. Singh 7369 207 5 11377 143 5
Gujranwala 8426 184 7 14025 142 6Gujrat 4369 197 6 7376 169 6Hafizabad 2933 192 7 5560 169 6Mandi Baha-ud-Din 3874 188 5 6874 162 5Narowal 2757 173 6 5737 153 5Sialkot 7572 169 6 12361 128 6
Lahore 4561 213 6 5772 182 5Kasur 8298 215 6 11996 209 5NankanaSheikhupura 10159 204 6 14947 193 6
Multan 5995 207 7 8705 177 6Khanewal 7020 190 7 11026 151 6Lodhran 6057 175 6 9128 158 6Pakpattan 3243 203 6 8732 161 6Sahiwal 11099 192 5 12547 156 5Vehari 10386 199 7 14052 166 6
Rawalpindi 3052 182 5 5736 176 4Attock 3514 199 5 6356 168 5Chakwal 3566 186 4 6315 197 4Jhelum 1854 191 5 2927 184 5
Sargodha 7910 205 6 13026 195 5Bhakkar 4133 222 6 7814 149 5Khushab 2747 201 5 4923 139 6Mianwali 2003 218 6 4699 153 6(Islamabad) 454 211 5 545 149 5Source:- Agricultural Census Organization, Statistics Division, Government of Pakistan, Lahore.
Average Use of Tractor Time
Table 26 :- Private Tractor Owners, Tractors and Period of work by District The Punjab
1994 Census (Sept.) 2004 Census (March)
District
(Number)
Number of Tractors
Average Use of Tractor TimeNumber of
Tractors
55AGRICULTURE
( Included in Sheikhupura District )

TotalBelonging to Tractor Owners
Belonging to Others Total
Belonging to Tractor Owners
Belonging to Others
The Punjab 199860 7171 2996 4175 316326 8041 3692 4349Bahawalpur 9946 305 137 168 14847 254 153 101Bahawalnagar 10435 357 170 187 16336 427 212 215R.Y. Khan 13505 433 238 195 19566 429 248 181(Cholistan) 195 4 2 2 702 10 5 5
D.G. Khan 2881 350 75 275 4455 143 63 80Layyah 3746 256 58 198 6851 219 105 114Muzaffargarh 6998 244 129 115 11299 355 167 188Rajanpur 2619 235 123 112 4073 288 71 217
Faisalabad 10566 319 95 224 15421 527 122 405Jhang 8102 288 119 169 13791 493 207 286T.T. Singh 7369 206 65 141 11377 217 93 124
Gujranwala 8426 171 103 68 14025 227 140 87Gujrat 4369 115 32 83 7376 125 41 84Hafizabad 2933 77 47 30 5560 136 81 55Mandi Baha-ud- 3874 105 43 62 6874 158 57 101Narowal 2757 67 27 40 5737 112 47 65Sialkot 7572 173 62 111 12361 165 84 81
Lahore 4561 114 55 59 5772 95 66 29Kasur 8298 366 130 236 11996 294 150 144NankanaOkara 7675 274 169 105 11376 328 190 138
Multan 5995 205 117 88 8705 256 136 120Khanewal 7020 303 116 187 11026 245 147 98Lodhran 6057 163 91 72 9128 185 128 57Pakpattan 3243 102 53 49 8732 200 94 106Sahiwal 11099 500 134 366 12547 297 111 186Vehari 10386 315 160 155 14052 344 173 171
Rawalpindi 3052 107 20 87 5736 142 33 109Attock 3514 191 80 111 6356 189 63 126Chakwal 3566 114 42 72 6315 148 54 94Jhelum 1854 64 11 53 2927 58 15 43
Sargodha 7910 186 119 67 13026 296 154 142Bhakkar 4133 210 86 124 7814 351 138 213Khushab 2747 118 55 63 4923 193 84 109Mianwali 2003 97 31 66 4699 131 58 73(Islamabad) 454 37 2 35 545 4 2 2
AGRICULTURETable 27:- Private Tractors and Area Covered by them by District
During Last 12 Months, The Punjab
AreaArea Covered (`000’ Hectares) Area Covered (`000’ Hectares)
56
Tractor (No)
1994 Census (September) 2004 Census (March)
Source:- 1994 and 2004 Agricultural Machinery Census, Agricutural Census Organization, Statistics
(Included in Sheikhupura District)
Division, Government of Pakistan, Lahore.
(Number)
Tractor (No)

The Punjab 331905 151531 21259 140225 1840 95 11755 5200
Bahawalpur 14900 4143 328 10025 56 2 83 263Bahawalnagar 16355 10487 298 4187 139 4 991 249R.Y. Khan 19597 7792 1646 9516 33 2 140 468(Cholistan) 702 251 5 438 2 - 3 3
D.G. Khan 4466 1734 139 1898 10 - 640 45Layyah 6863 3455 99 2139 50 28 1075 17Muzaffargarh 11313 2947 153 7922 24 1 109 157Rajanpur 4078 1187 26 2788 6 - 35 36
Faisalabad 15452 5104 2549 6943 72 4 669 111Jhang 13801 4731 4409 4288 41 2 213 117T.T. Singh 11383 9568 193 1352 88 2 103 77
Gujranwala 14038 11991 647 701 145 7 176 371Gujrat 7381 2432 70 4658 39 4 123 55Hafizabad 5571 2598 1837 718 25 3 268 122Mandi Baha-ud-Din 6889 2274 169 3230 45 3 1121 47Narowal 5744 4305 190 1023 43 6 24 153Sialkot 12373 10952 232 784 79 3 54 269
Lahore 5779 5341 182 162 28 - 16 50Kasur 12013 9294 527 1327 144 2 492 227NankanaOkara 11389 5343 1086 3377 63 - 1175 345Sheikhupura 14962 9899 756 3753 150 3 161 240Multan 8738 2235 70 6307 7 - 6 113Khanewal 11082 3585 143 7018 33 2 58 243Lodhran 9132 897 46 8060 6 - 31 92Pakpattan 8744 5268 316 1930 137 1 908 184Sahiwal 12596 9237 613 2145 80 1 79 441Vehari 14075 3788 953 8659 79 1 335 260
Rawalpindi 5746 1357 22 4191 9 2 137 28Attock 6369 578 22 5538 7 - 148 76Chakwal 6328 585 114 5272 28 1 229 99Jhelum 2939 537 135 2141 17 1 93 15
Sargodha 13070 2974 1001 8357 71 8 530 129Bhakkar 7826 1929 622 3675 50 1 1483 66Khushab 4928 1460 1479 1918 26 - 27 18Mianwali 4705 1075 177 3427 7 1 12 6(Islamabad) 578 198 5 358 1 - 8 8
Bye-Larus Others
57AGRICULTURE
Massey Ferguson Ford Fiat
( Included in Sheikhupura District )
Table 28 :- Tractors ( Private & Government ) by Make and DistrictThe Punjab: 2004 -Census of Agricultural Machinary
IMT Intern-ational
Source:- Agricultural Census Organization, Statistics Division, Government of Pakistan, Lahore.
(Number)
District Total

District Total Fiat (640)
Fiat (480)
Massey Ferguson
Inter- National
Bye- Larus
Ford 4000/ 4600
Ford 3000/ 3600
Others
The Punjab 328370 33655 94529 138591 1260 13078 12962 22009 12286
Bahawalpur 16185 2371 6773 4836 37 361 545 604 658Bahawalnagar 16920 957 3449 10369 22 1068 189 265 601R. Y. Khan 20328 2221 7086 8292 13 110 819 742 1045
D. G. Khan 4205 389 849 1912 39 721 141 123 31Layyah 7258 1043 1399 3017 157 897 396 125 224Muzaffargarh 12941 1848 5676 4322 27 176 183 182 527Rajanpur 6786 1004 2763 2305 57 202 171 64 220
Faisalabad 15359 2166 4855 4194 70 754 1675 1217 428Jhang 13774 1033 2982 5068 47 246 1818 2307 273Toba Tek Singh 9968 283 1115 7963 13 81 109 140 264
Gujranwala 13891 374 582 11495 60 236 266 312 566Gujrat 7444 729 3792 2525 6 137 44 64 147Hafizabad 5880 266 510 2604 75 311 948 1057 109Mandi Baha-ud- 6812 860 2353 2260 35 979 95 101 129Narowal 5999 314 638 4643 32 26 97 65 184Sialkot 12423 91 574 11181 2 43 78 143 311
Lahore 4752 3 198 4288 6 16 125 61 55Kasur 13295 473 862 269 - 604 409 8951 1727NankanaOkara 11491 882 2193 5384 63 1366 390 693 520Sheikhupura 14540 1346 2670 8261 81 225 745 748 464
Multan 9763 1374 4281 3502 7 26 109 122 342Lodhran 9430 1480 5787 845 3 243 391 237 444Pakpattan 10418 725 1555 5289 97 1123 402 487 740Sahiwal 12234 372 1687 8397 29 89 402 597 661Vehari 14443 1431 6877 3963 3 377 396 711 685
Rawalpindi 5616 241 3295 1691 14 210 62 72 31Attock 5638 579 3688 1099 1 185 9 2 75Chakwal 6152 441 4443 653 37 220 84 57 217Jhelum 2806 1576 471 459 127 73 72 7 21
Sargodha 13686 1913 6516 3032 61 577 561 668 358Bhakkar 8257 1963 1860 2135 28 1367 410 409 85Khushab 4256 866 1039 1065 1 2 673 565 45Mianwali 5420 2041 1711 1273 10 27 148 111 99Source:- Directorate of Agriculture Crop Reporting Service, Punjab Lahore
( Included in Sheikhupura District )
AGRICULTURE58
(Number)
Table 29:- Tractors by Make and District, The Punjab : 2004-05
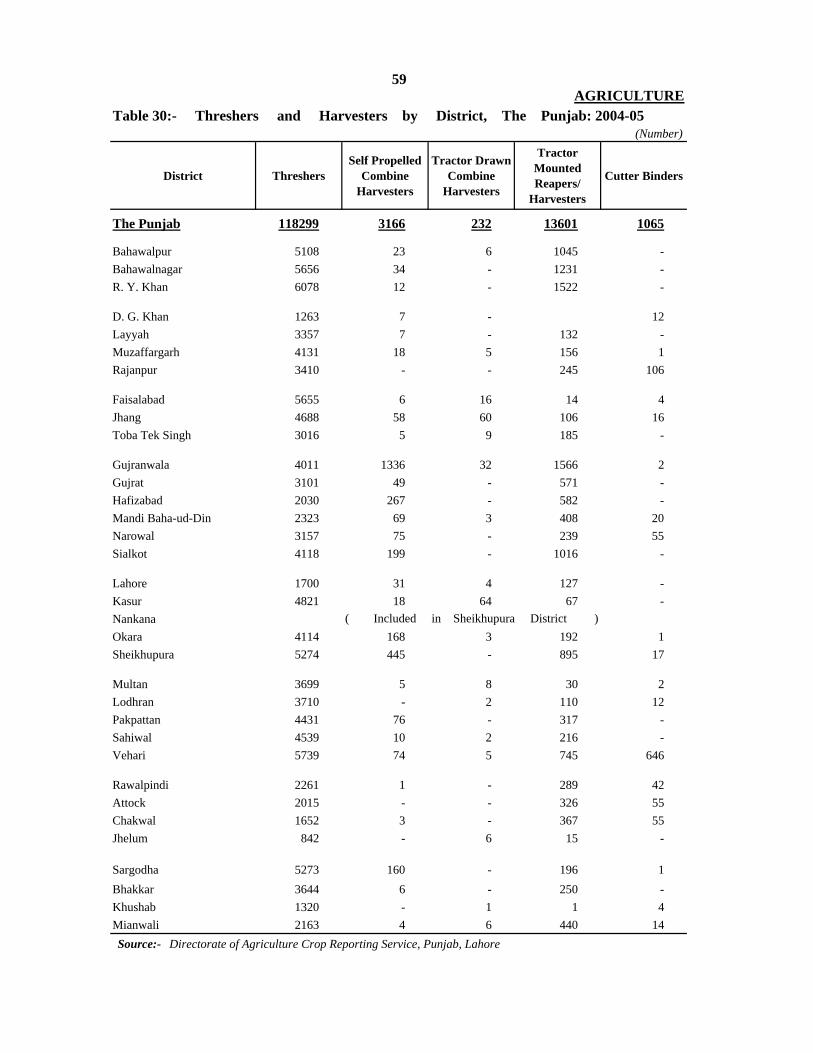
District ThreshersSelf Propelled
Combine Harvesters
Tractor Drawn Combine
Harvesters
Tractor Mounted Reapers/
Harvesters
Cutter Binders
The Punjab 118299 3166 232 13601 1065
Bahawalpur 5108 23 6 1045 -Bahawalnagar 5656 34 - 1231 -R. Y. Khan 6078 12 - 1522 -
D. G. Khan 1263 7 - 12Layyah 3357 7 - 132 -Muzaffargarh 4131 18 5 156 1Rajanpur 3410 - - 245 106
Faisalabad 5655 6 16 14 4Jhang 4688 58 60 106 16Toba Tek Singh 3016 5 9 185 -
Gujranwala 4011 1336 32 1566 2Gujrat 3101 49 - 571 -Hafizabad 2030 267 - 582 -Mandi Baha-ud-Din 2323 69 3 408 20Narowal 3157 75 - 239 55Sialkot 4118 199 - 1016 -
Lahore 1700 31 4 127 -Kasur 4821 18 64 67 -NankanaOkara 4114 168 3 192 1Sheikhupura 5274 445 - 895 17
Multan 3699 5 8 30 2Lodhran 3710 - 2 110 12Pakpattan 4431 76 - 317 -Sahiwal 4539 10 2 216 -Vehari 5739 74 5 745 646
Rawalpindi 2261 1 - 289 42Attock 2015 - - 326 55Chakwal 1652 3 - 367 55Jhelum 842 - 6 15 -
Sargodha 5273 160 - 196 1Bhakkar 3644 6 - 250 -Khushab 1320 - 1 1 4Mianwali 2163 4 6 440 14
59AGRICULTURE
Table 30:- Threshers and Harvesters by District, The Punjab: 2004-05
Source:- Directorate of Agriculture Crop Reporting Service, Punjab, Lahore
( Included in Sheikhupura District )
(Number)

Y e a r
1997-98
1998-99
1999-00
2000-01
2001-02
2002-03
2003-04
2004-05
2005-06
2006-07
Y e a r Total Loans Long Term Medium Term Short Term
1 2=(3+4+5) 3 4 5
1997-98 16877 4748 1251 10878
1998-99 22176 4620 530 17026
1999-00 17690 5925 474 11291
2001-02 21123 4483 609 16031
2002-03 22490 3695 846 17949
2003-04 23320 2740 1165 19415
2004-05 29085 3510 1319 24256
2005-06 38261 2766 1180 34315
2006-07 45313 3036 1068 41209
(Million Rupees)
Source:- Zarai Taraqiati Bank Limited, Islamabad.
Source:- Federal Bureau of Statistics, Statistics Division, Islamabad.
Table 32 :-Agricultural Loans Disbursed by Type by the Zarai Taraqiati Bank
* Including 470659 Tractors imported upto 1996-97
(Number)
526860
552930
568471
582471
60
Limited in The Punjab
AGRICULTURETable 31 :- Tractors Imported in Pakistan
During the Year Cumulative Number
481911
505247
607780
610347
11252
23336
21613
26070
593891
600434
7346
2567
15541
14000
11420
6543

Up to 5.06
Hectares
Over 5.06 to 20.24 Hectares
Over 20.24 to 40.48 Hectares
Over 40.48
Hectares
1997-98 263754 7302 171119 73599 10367 1367
1998-99 368167 5978 256940 89264 10434 5551
1999-00 303977 2202 224033 66213 7863 3666
2000-01 345148 2648 262419 70279 7008 2794
2001-02 359819 530 280300 69182 7410 2397
2002-03 371485 358 293963 66654 7167 3343
2003-04 379550 767 309346 61034 6010 2393
2004-05 371325 685 303699 58701 5987 2253
2005-06 362003 686 293401 58555 6421 2940
2006-07 326556 490 263253 53804 6059 2950
1997-98 16877 1772 6788 6886 1212 219
1998-99 22176 531 11565 8313 1133 634
1999-00 17690 131 10446 5969 750 394
2000-01 19590 142 12226 6310 645 267
2001-02 21123 10 13614 6301 733 465
2002-03 22490 10 14692 6735 712 341
2003-04 23320 28 16008 6411 620 253
2004-05 29085 32 20034 7976 748 295
2005-06 38261 34 24846 11800 1070 511
2006-07 45313 43 29046 14356 1236 632
61AGRICULTURE
Table 33 :- Number of Loanees and Loans Advanced According to Size of Holdings
by Zarai Taraqiati Bank Limited in The Punjab
I. Number of Loanees
II. Loans Advanced (Million Rupees )
Year Total Loanees Landless Loanees
Category of Owners by Size of Holdings

2002-03 2003-04 2004-05 2005-06 2006-07
Total 22490 23320 29085 38261 45313
1 Seed/Seedlings 5326 6338 8306 4158 755
2 Fertilizers 8310 8029 10430 6665 1098
3 Tractors, Power Tillers and Attachments
2751 2013 2689 2348 2903
4 Tubewells, Power Pumps and Engines 489 404 597 322 109
5 Poultry, Dairy, Farming and Animal Husbandry
811 1202 1472 1357 1157
6 Inland and Marine Fisheries 1 1 8 7 19
7 Cold Storage/Godown 207 183 105 40 12
8 Others 4595 5150 5478 23364 39260
Source:- Zarai Taraqiati Bank Limited, Islamabad.
1997-98
1998-99
1999-00
2000-01
2001-02
2002-03
2003-04
2004-05
2005-06
2006-07
*
Source :- State Bank of Pakistan, Karachi.
62
Table 35:-Loans Advanced to Farmers by Five Big Commercial Banks* in The Punjab(Million Rupees )
Year
Purpose
AGRICULTURETable 34 :- Loans Disbursed by Purpose by Zarai Tqraqiati Bank Limited
in The Punjab(Million Rupees)
United Bank Ltd.
66122
15247
24279
39098
55212
6023
7423
11395
Amount
3144
It induces Allied Bank, Habib Bank, Muslim Commerical Bank, National Bank and
4249

Societies Societies Individuals
1997-98 37845 1474 36711 20 36392 25
1998-99 37892 1474 24851 65 24781 42
1999-00 34726 1454 27294 74 25904 58
2000-01 33727 1445 26967 80 28074 60
2001-02 34130 1398 26343 168 25342 79
2002-03 32983 1387 40105 377 39639 185
2003-04 32637 1236 5613 2867 * 5241 1264
2004-05 28343 1130 6836 2251 6729 944
2005-06 27892 1081 6106 1409 5979 1572
2006-07 27615 1058 7953 3029 7803 1601
Advanced/Recovered by Provincial Co-operative Bank, The Punjab ( Million Rupees)
63
AGRICULTURE
Table 36:- Agricultural Co-operative Societies, their Membership & Loans
Loans Recovered
Source:- Registrar, Co-operative Societies, Punjab, Lahore.
Individuals
Loans Advanced
* The increase in individual loan is due to Micro Financing.
Societies (Number)
Membership (‘000’)Year

Total Act XIX of 1883
Act XVII of 1958 Total Act XIX
of 1883Act XVII of 1958 Total Act XIX
of 1883Act XVII of 1958
1997-98 6475 1850 4625 6475 1850 4625 5802 2132 36701998-99 6475 1850 4625 6475 1850 4625 7937 2652 52851999-00 6300 1850 4450 6300 1850 4450 8938 1547 7391
2000-01 6326 1866 4460 6326 1866 4460 3297 1143 21542001-02 6326 1866 4460 6326 1866 4460 1143 11432002-03 7300 2830 4470 7300 2830 4470 4595 2300 2295
2003-042004-052005-062006-07
Amount Recovered
64AGRICULTURETable 37:- Taccavi Loans Allocated, Disbursed and Recovered, The Punjab
( Thousand Rupees )
YearAmount Allocated Amount Disbursed
(Funds were not allocated by the Finance Department for the purpose.)
Source:- Board of Revenue, Punjab, Lahore
Crop
*
1
2
3
4
5
6
8
9
10
11
12
Source:-
Wheat
Fodder
6433
1998
39.6
12.3
184Jowar
Cotton
1728
911
712
Rice
Gram
* Includes Islamabad but excludes Orchards. Bureau of Statistics, Punjab, Lahore.
Potato
Others
120
818
Bajra
Rape and Mustard
367
136
97.4
15.1
10.6
0.8
Sugarcane
2463
Cropped Area
The Punjab
Table 38:- Cropped Area by Crop, The Punjab: 2006-07
15870
( Thousand Hectares )
% of Total
1.1
0.7
5.0
5.6
4.4
2.2

CROPPED AREA BY CROP
THE PUNJAB: 2006-07
TOTAL CROPPED AREA : 16257 ( ‘ 000’ HECTARES )
65
FODDER1998
(12.3% )
OTHERS2012
(12.4% )
WHEAT6433
( 39.6% )
COTTON2463
( 15.1% )
RICE1728
( 10.6% )
GRAM911
( 5.6% )
SUGARCANE712
( 4.4% )

25436 15689916 681
1118 7721370 777
828 356726 483984 683534 345
842 6721083 931
544 370
837 5411085 290
422 326433 329
1316 2721579 444
360 182642 485479 334933 602611 433
537 501436 422580 400531 426779 656
1238 235455 240461 270595 106
850 541
557 785318 432256 339
201 28
66
KhushabMianwali
RawalpindiAttockChakwal
LodhranPakpattan
(Islamabad)Source:- Bureau of Statistics, Punjab, Lahore.
Jhelum
Sargodha
Bhakkar
LahoreKasur
OkaraSheikhupura
SahiwalVehari
Nankana
Multan
GujranwalaGujratHafizabad
NarowalSialkot
Mandi Baha-ud-Din
MuzaffargarhRajanpur
FaisalabadJhangT.T. Singh
Bahawalpur BahawalnagarRahim Yar Khan
D.G. Khan Layyah
District
The Punjab
AGRICULTURE
Table 39:- Number of Mauzas and Cropped Area by District, The Punjab: 2006-07
Number of Mauzas Cropped Area (`000' Hectares)

Total Canals Wells Tube-wells
Canal-wells
Canal Tubewells Others
1997-98 15419 2303 13116 3854 111 2501 122 6463 65
1998-99 15314 2246 13068 3681 108 2509 90 6630 50
1999-00 15528 2157 13371 3741 115 2627 89 6739 60
2000-01 15572 2006 13566 3620 99 2749 93 6968 37
2001-02 15618 2012 13606 3518 107 2802 155 6983 41
2002-03 15475 2019 13456 3514 122 2720 166 6894 40
2003-04 15914 2079 13835 3515 127 2814 148 7181 50
2004-05 16162 2136 14026 3447 156 2779 184 7373 87
2005-06 16151 2094 14057 3462 152 2784 198 7419 42
2006-07 16261 2198 14063 3400 140 2846 213 7423 41
67AGRICULTURE
Table 40:- Area Sown, Irrigated and Un-Irrigated by Mode of Irrigation The Punjab
* Excluding Area Under Orchards. Source:- Bureau of Statistics, Punjab, Lahore
(Thousand Hectares)
Year Total Area Sown *
Un-Irrigated
Irrigated

Total Canals Wells Tube- wells
Canal- Wells
Canal Tube wells
Others
The Punjab 15828 2197 13631 3387 135 2806 177 7086 40
Bahawalpur 681 4 677 233 9 87 4 344 -Bahawalnagar 772 17 755 495 3 52 4 201 -Rahim Yar Khan 777 5 772 391 3 30 6 342 -
D.G. Khan 356 35 321 107 4 76 4 125 5Layyah 483 96 387 39 4 119 3 222 -Muzaffargarh 683 23 660 85 3 114 11 446 1Rajanpur 345 23 322 52 2 103 1 162 2
Faisalabad 672 - 672 475 1 31 3 161 1Jhang 931 65 866 84 13 261 21 485 2T.T. Singh 370 - 370 236 - 29 - 105 -
Gujranwala 541 4 537 127 5 319 7 79 -Gujrat 290 142 148 29 4 91 2 22 -Hafizabad 326 1 325 7 - 95 8 215 -Mandi Baha-ud-Din 329 6 323 11 6 46 18 241 1Narowal 272 95 177 5 1 156 1 14 -Sialkot 444 25 419 5 4 391 3 16 -
Lahore 182 3 179 59 1 52 12 55 -Kasur 485 3 482 190 4 91 18 179 -Nankana 335 - 335 6 5 15 6 302 1Okara 602 1 601 79 2 36 5 478 1
Multan 500 15 485 7 - 56 4 408 10Khanewal 568 4 564 35 5 35 10 477 2Lodhran 421 - 421 37 4 34 3 343 -Pakpattan 401 - 401 2 1 36 2 359 1Sahiwal 427 - 427 48 4 13 3 358 1Vehari 655 - 655 12 2 44 8 589 -
Rawalpindi 236 223 13 2 7 1 1 - 2Attock 241 212 29 2 17 6 1 - 3Chakwal 271 258 13 3 5 3 1 - 1Jhelum 105 77 28 1 2 25 - - -
Sargodha 541 1 540 202 2 47 3 286 -Bhakkar 785 417 368 130 4 173 1 59 1Khushab 431 306 125 87 5 26 1 4 2Mianwali 343 109 234 104 3 113 2 9 3
Islamabad 27 27 0 - - - - - -0
Source:- Bureau of Statistics, Punjab, Lahore " Zaid Rabi " Crop
( Thousand Hectares )
Total Area Sown
Un-Irri-gated
Note:- Excludes 514 thousand hectares under orchards & 17 thousand hectares under Tobacco, sown under
68
District
Irrigated
AGRICULTURE Table 41 :- Area Sown, Irrigatied and Un- Irrigated by Mode of Irrigation and District
The Punjab: 2006-07
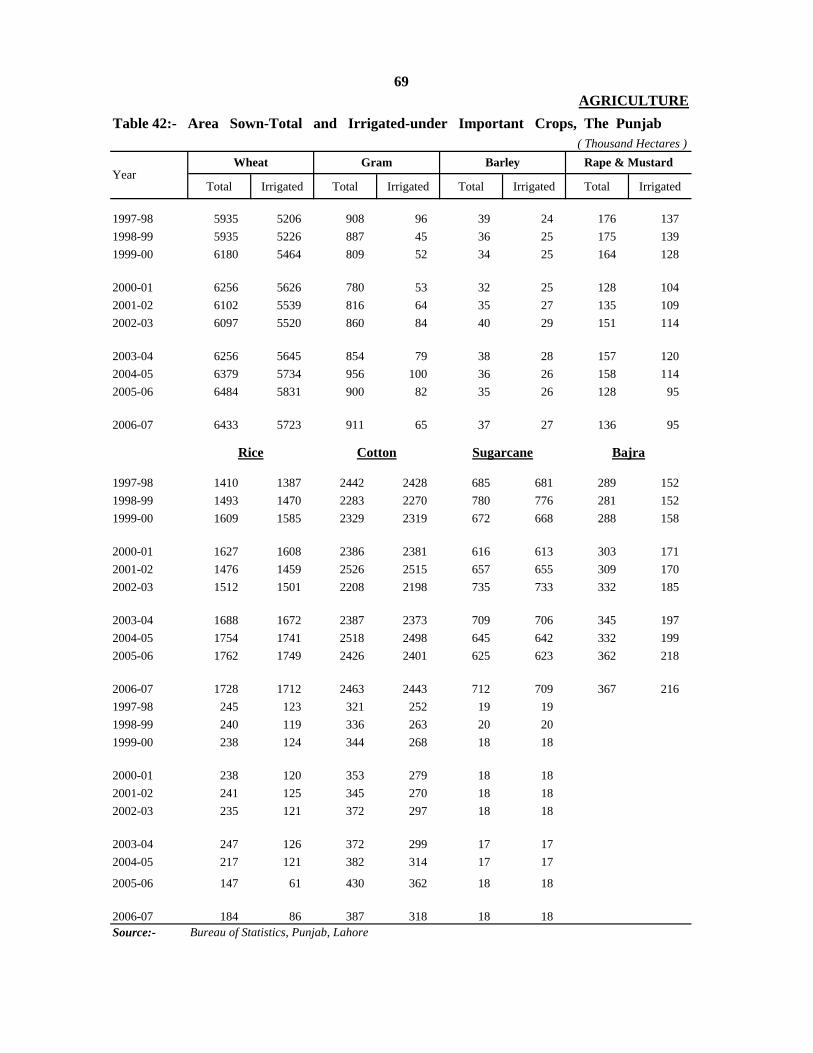
Total Irrigated Total Irrigated Total Irrigated Total Irrigated
1997-98 5935 5206 908 96 39 24 176 1371998-99 5935 5226 887 45 36 25 175 1391999-00 6180 5464 809 52 34 25 164 128
2000-01 6256 5626 780 53 32 25 128 1042001-02 6102 5539 816 64 35 27 135 1092002-03 6097 5520 860 84 40 29 151 114
2003-04 6256 5645 854 79 38 28 157 1202004-05 6379 5734 956 100 36 26 158 1142005-06 6484 5831 900 82 35 26 128 95
2006-07 6433 5723 911 65 37 27 136 95
1997-98 1410 1387 2442 2428 685 681 289 1521998-99 1493 1470 2283 2270 780 776 281 1521999-00 1609 1585 2329 2319 672 668 288 158
2000-01 1627 1608 2386 2381 616 613 303 1712001-02 1476 1459 2526 2515 657 655 309 1702002-03 1512 1501 2208 2198 735 733 332 185
2003-04 1688 1672 2387 2373 709 706 345 1972004-05 1754 1741 2518 2498 645 642 332 1992005-06 1762 1749 2426 2401 625 623 362 218
2006-07 1728 1712 2463 2443 712 709 367 2161997-98 245 123 321 252 19 191998-99 240 119 336 263 20 201999-00 238 124 344 268 18 18
2000-01 238 120 353 279 18 182001-02 241 125 345 270 18 182002-03 235 121 372 297 18 18
2003-04 247 126 372 299 17 172004-05 217 121 382 314 17 17
2005-06 147 61 430 362 18 18
2006-07 184 86 387 318 18 18Source:- Bureau of Statistics, Punjab, Lahore
Rice Cotton Sugarcane Bajra
69AGRICULTURE
Table 42:- Area Sown-Total and Irrigated-under Important Crops, The Punjab ( Thousand Hectares )
YearWheat Gram Barley Rape & Mustard

Crop/YearTotal Area Sown
Un-Irrigated
Area
Total Irrigated
AreaCanals Wells Tube-
wellsCanal-Wells
Canal Tube-wells
Others
1 2=3+4 3 4=5+6 to 10 5 6 7 8 9 10
WHEAT
1997-98 5935 729 5206 1372 44 1154 49 2562 25
1998-99 5935 709 5226 1336 55 1147 41 2623 24
1999-00 6180 716 5464 1379 58 1261 38 2704 24
2000-01 6256 630 5626 1364 44 1336 48 2816 18
2001-02 6102 563 5539 1300 37 1326 49 2809 18
2002-03 6097 577 5520 1333 48 1261 58 2800 20
2003-04 6256 611 5645 1345 56 1325 57 2844 18
2004-05 6379 645 5734 1322 66 1317 66 2942 21
2005-06 6484 653 5831 1341 60 1361 82 2967 20
2006-07 6433 710 5723 1318 59 1350 79 2895 22
RICE
1997-98 1410 23 1387 261 11 431 24 659 1
1998-99 1493 23 1470 254 9 437 14 752 4
1999-00 1609 24 1585 266 8 475 16 817 3
2000-01 1627 19 1608 253 8 478 15 852 2
2001-02 1476 17 1459 215 13 442 34 753 2
2002-03 1512 11 1501 218 15 441 28 798 1
2003-04 1688 16 1672 230 16 483 28 914 1
2004-05 1754 13 1741 233 23 485 38 960 2
2005-06 1762 13 1749 235 19 481 43 967 4
2006-07 1728 16 1712 218 17 484 51 941 1
70AGRICULTURE
Table 43:- Area Sown under Major Crops by Mode of Irrigation, The Punjab( Thousand Hectares )

Crop/YearTotal Area Sown
Un-Irrigated
Area
Total Irrigated
AreaCanals Wells Tube-
wellsCanal-Wells
Canal Tube-wells
Others
1 2=3+4 3 4=5+6 to 10 5 6 7 8 9 10
SUGARCANE
1997-98 685 4 681 293 3 96 4 284 1
1998-99 780 4 776 321 2 112 3 337 1
1999-00 672 4 668 278 3 87 3 296 1
2000-01 616 3 613 244 3 82 2 281 1
2001-02 657 2 655 238 4 94 8 310 1
2002-03 735 2 733 257 3 109 7 356 1
2003-04 709 3 706 244 4 98 6 353 1
2004-05 645 3 642 223 5 85 11 317 1
2005-06 625 2 623 219 6 77 6 314 1
2006-07 712 3 709 234 5 99 10 360 1
COTTON
1997-98 2442 14 2428 749 13 220 19 1421 6
1998-99 2283 13 2270 680 8 212 10 1354 6
1999-00 2329 10 2319 717 9 210 14 1365 4
2000-01 2386 5 2381 694 12 231 7 1434 3
2001-02 2526 11 2515 694 15 272 26 1503 5
2002-03 2208 10 2198 614 12 246 38 1283 5
2003-04 2387 14 2373 647 9 257 22 1432 6
2004-05 2518 20 2498 674 14 274 28 1503 5
2005-06 2426 25 2401 681 17 235 22 1440 6
2006-07 2463 20 2443 652 15 255 21 1496 4
Source:- Bureau of Statistics, Punjab, Lahore.
71
Table 43:-Area Sown under Major Crops by Mode of Irrigation, The Punjab – Concld .(Thousand Hectares)
AGRICULTURE
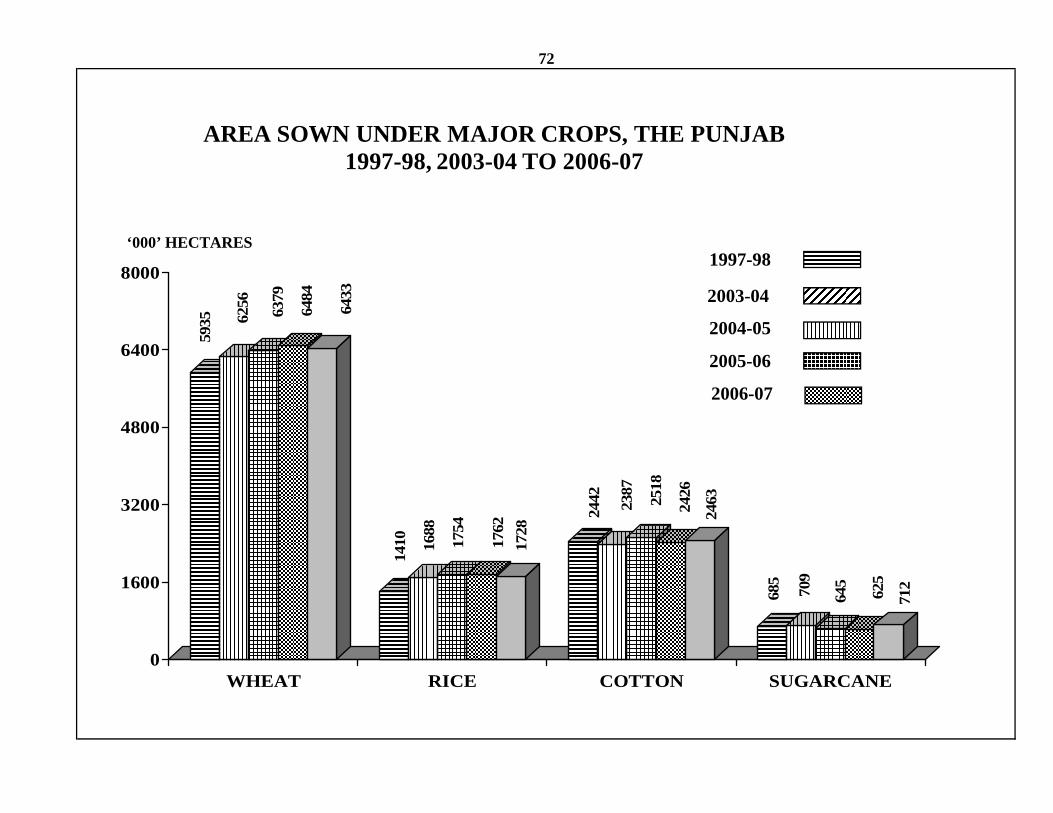
72
AREA SOWN UNDER MAJOR CROPS, THE PUNJAB1997-98, 2003-04 TO 2006-07
‘000’ HECTARES1997-98
2003-04
2004-05
2005-06
2006-07
5935 62
56 6379
6484
6433
1410 16
88
1754
1762
1728
2442 2387
2518
2426
2463
685
709
645
625
712
0
1600
3200
4800
6400
8000
WHEAT RICE COTTON SUGARCANE
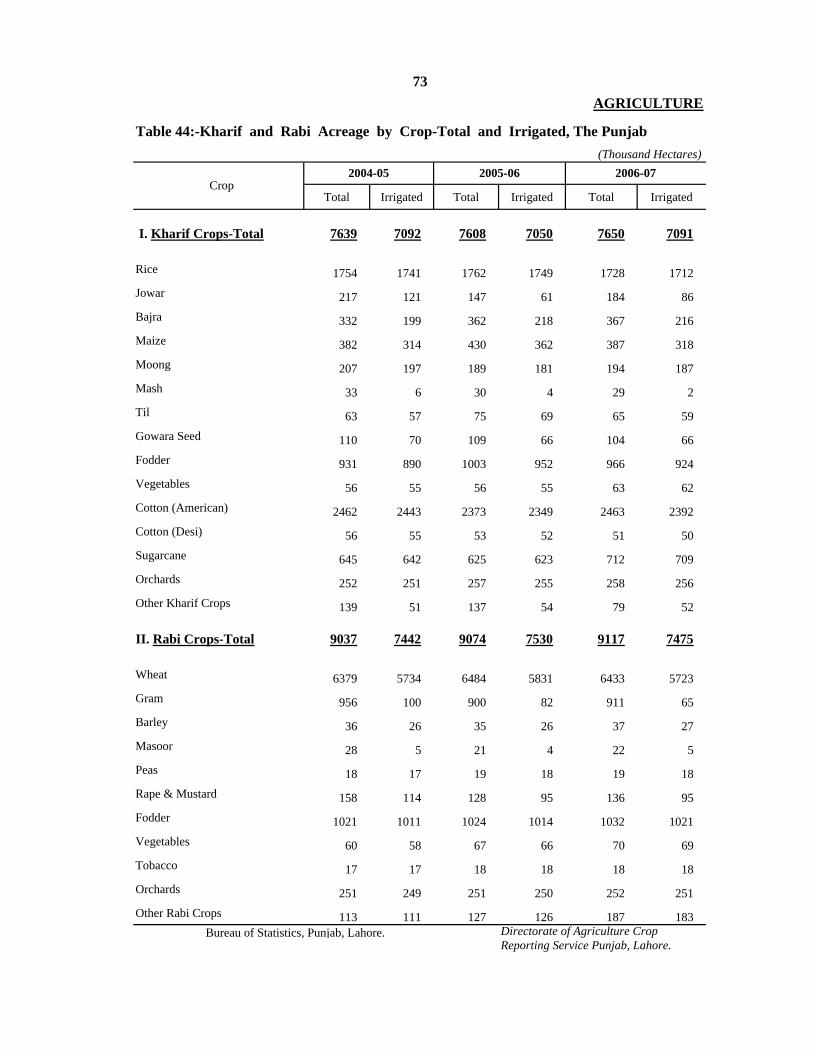
Total Irrigated Total Irrigated Total Irrigated
I. Kharif Crops-Total 7639 7092 7608 7050 7650 7091
Rice 1754 1741 1762 1749 1728 1712Jowar 217 121 147 61 184 86Bajra 332 199 362 218 367 216Maize 382 314 430 362 387 318Moong 207 197 189 181 194 187Mash 33 6 30 4 29 2Til 63 57 75 69 65 59Gowara Seed 110 70 109 66 104 66Fodder 931 890 1003 952 966 924Vegetables 56 55 56 55 63 62Cotton (American) 2462 2443 2373 2349 2463 2392Cotton (Desi) 56 55 53 52 51 50Sugarcane 645 642 625 623 712 709Orchards 252 251 257 255 258 256Other Kharif Crops 139 51 137 54 79 52
II. Rabi Crops-Total 9037 7442 9074 7530 9117 7475
Wheat 6379 5734 6484 5831 6433 5723Gram 956 100 900 82 911 65Barley 36 26 35 26 37 27Masoor 28 5 21 4 22 5Peas 18 17 19 18 19 18Rape & Mustard 158 114 128 95 136 95Fodder 1021 1011 1024 1014 1032 1021Vegetables 60 58 67 66 70 69Tobacco 17 17 18 18 18 18Orchards 251 249 251 250 252 251Other Rabi Crops 113 111 127 126 187 183
Reporting Service Punjab, Lahore.
2004-05 2005-06 2006-07
Bureau of Statistics, Punjab, Lahore. Directorate of Agriculture Crop
Crop
73AGRICULTURE
Table 44:-Kharif and Rabi Acreage by Crop-Total and Irrigated, The Punjab(Thousand Hectares)

Rice (Cleaned)
Total Irrigated Total Irrigated Total Irrigated Total
1997-98 13807 12590 646 104 42 30 19481998-99 13212 12165 578 48 37 30 21761999-00 16480 15535 466 50 40 32 2481
2000-01 15419 15082 335 35 33 28 25772001-02 14594 14191 304 41 34 29 22662002-03 15355 14599 612 67 38 31 2580
2003-04 15639 14833 524 56 36 29 28712004-05 17375 16259 761 82 35 27 29802005-06 16776 15893 383 59 32 26 3180
2006-07 17853 16607 728 56 35 27 3076
Cotton (Lint) (`000'Bales)
1997-98 32111 32017 176 144 139 107 68171998-99 33383 33266 171 143 136 106 66281999-00 27081 27002 177 146 144 112 8804
2000-01 26740 26689 128 110 156 121 85402001-02 31803 31749 131 113 158 119 80462002-03 33169 33117 146 120 181 133 7664
2003-04 34023 33969 151 127 195 148 77022004-05 33048 33031 143 110 187 148 111492005-06 28969 28969 109 88 205 161 10268
2006-07 37542 37542 120 94 217 164 103501997-98 137 83 694 632 24 241998-99 135 81 828 760 25 251999-00 140 86 817 745 24 24
2000-01 144 86 749 677 22 222001-02 143 88 742 669 23 232002-03 133 84 883 808 22 22
2003-04 144 90 1020 953 21 212004-05 124 87 1935 1873 21 21
2005-06 76 43 2319 2256 22 22
2006-07 101 62 2162 2093 22 22
Rape & Mustard Bajra
YearWheat Gram Barley
74
* Includes Kharif and Spring crops.Source:- Directorate of Agriculture Crop Reporting Service, Punjab, Lahore.
AGRICULTURE
Table 45:- Production of Important Crops,Total & Irrigated, The Punjab( Thousand Tonnes )
Sugarcane

75
PRODUCTION OF MAJOR CROPS, THE PUNJAB1997-98, 2003-04 TO 2006-07
‘000’ TONNES
1997-98 2003-04 2004-05 2005-06 2006-07
11 3402
3
048
9
3754
2
000 TONNES
321 3
330
2896
9
28000
35000
1380
7
1563
9
1737
5
1677
6
1785
3
49 8 0
21000
948
2871
2980
3180
3076
6817 7664
1114
1026
8
1035
0
7000
14000
19 2 2 3 3
0
WHEAT RICE (CLEANED) COTTON ‘000’BALES SUGARCANE

Rice (Cleaned)
Total Irrigated Total Irrigated Total Irrigated Total
1997-98 2327 2420 711 1080 1045 1210 13821998-99 2226 2330 651 1050 1008 1140 14581999-00 2667 2840 575 940 1106 1230 1541
2000-01 2465 2680 429 650 1025 1110 15842001-02 2392 2560 373 640 957 1050 15352002-03 2518 2640 711 790 962 990 1706
2003-04 2500 2630 613 720 952 1030 17012004-05 2724 2840 795 820 981 1050 16992005-06 2725 2730 425 720 920 1000 1804
2006-07 2775 2902 800 864 935 1022 1779
Cotton (Lint)
1997-98 46.9 47.0 996 1040 481 700 4941998-99 42.8 42.9 977 1020 485 700 4941999-00 40.3 40.4 1073 1130 497 710 643
2000-01 43.4 43.5 990 1050 513 710 6092001-02 48.4 48.5 967 1040 511 710 5422002-03 45.1 45.2 969 1050 544 720 590
2003-04 48.0 48.1 962 1050 565 750 5492004-05 51.3 51.3 900 970 563 740 7532005-06 46.3 46.3 851 922 567 740 720
2006-07 52.8 52.8 886 989 591 761 7141997-98 558 670 1799 2140 1257 12501998-99 561 680 2001 2260 1255 12601999-00 589 700 1986 2220 1306 1310
2000-01 604 710 1883 2100 1243 12402001-02 592 700 1890 2110 1240 12402002-03 563 690 2105 2540 1211 1210
2003-04 584 710 2385 2910 1236 12402004-05 573 720 4073 4610 1241 12402005-06 517 710 4289 4760 1220 1220
2006-07 549 721 4390 4939 1225 1225
Gram Barley
76AGRICULTURETable 46:- Per Hectare Yield of Important Crops, Total and Irrigated , The Punjab
( Kgs. )
Source: Directorate of Agriculture, Crop Reporting Service, Punjab, Lahore.
Sugarcane (Tonnes) Rape & Mustard Bajra
YearWheat

77PER HECTARE YIELD OF MAJOR CROPS, THE PUNJAB
2327 25
00 2724
2725
2775
1382
1701
1699 18
0417
79
494
549
753
720
714
0
700
1400
2100
2800
46.9
48.0 51
.0
46.3
52.8
0
13
26
39
52
2003-04 2004-05 2005-06 2006-071997-98
(Kgs.) (Tonnes)
0 2724
2725
2775
.0 2.8
2327 25
0 0 2
1 9 04 79
2800
46.9
48.0 51
46.3
5 2
52
1382
1701
1699 18 17
1400
210039
494
549
753
720
714
700
140026
4
0
700
0
13
WHEAT RICE (Cleaned ) COTTON (Lint) SUGARCANE
0 0

Total Irrigated Total Irrigated Total Irrigated
I. 51 26 40 33 134 123
Rice3 3 2 2 8 8
Cotton20 20 24 22 103 101
Jowar2 - 1 - 1 -
Bajra2 - 1 - 2 1
Maize2 - 1 1 1 1
Sugarcane- - 1 1 - -
Other Kharif Crops22 3 10 7 19 12
II. 91 45 391 8 18 11
Wheat71 42 40 5 14 10
Gram14 1 348 2 2 -
Barley1 - 1 - - -
Rape & Mustard3 1 1 - - -
Other Rabi Crops2 1 1 - 2 1
78AGRICULTURE
Table 47 :- Kharif and Rabi Acreage Failed by Crop-Total and Irrigated, The Punjab(Thousand Hectares)
Source:- Bureau of Statistics, Punjab, Lahore.
Kharif Crops-Total
Rabi Crops-Total
Crop2004-05 2005-06 2006-07

Area Production Area Production Area Production
1997-98 5935 13807 5739 13535 196 272
1998-99 5935 13212 5747 12991 188 221
1999-00 6180 16480 6048 16342 132 138
2000-01 6256 15419 6116 15327 140 92
2001-02 6102 14594 5993 14502 109 92
2002-03 6097 15355 6023 15270 74 85
2003-04 6256 15639 6208 15583 48 56
2004-05 6379 17375 6345 17326 34 49
2005-06 6484 16776 6445 16729 39 47
2006-07 6433 17853 6388 17808 45 45
Area Production Area Production Area Production Area Production
1997-98 1410 1948 1055 1343 221 397 134 208
1998-99 1493 2176 1162 1584 237 422 94 170
1999-00 724 2481 362 1764 266 535 96 182
2000-01 1627 2577 1114 1601 313 592 200 384
2001-02 1476 2266 1294 1914 148 285 34 67
2002-03 1512 2580 1317 2176 146 290 49 114
2004-05 1754 2980 1466 2348 108 236 180 396
2005-06 1762 3180 1535 2642 132 315 95 223
2006-07 1728 3076 1474 2494 139 334 115 248
( Area in '000' Hectares & Production in '000' Tonnes )
HYV
Total Basmati Irri-Pak Others
Others
HYV=High Yield Varieties
79
Source:- Directorate of Agriculture, Crop Reporting Service, Punjab, Lahore.
I WHEAT
AGRICULTURETable 48 :- Area and Production of Wheat and Rice by Variety, The Punjab
II RICE*
* Production pertains to cleaned Rice.
Year
Year
Total

Table 49 :- Area Sown-Total and Irrigated-Under Wheat by District, The Punjab
Total Irrigated Total Irrigated Total Irrigated
The Punjab 6379 5734 6342 5831 6433 5723
Bahawalpur 272 268 290 289 279 277Bahawalnagar 296 294 323 318 308 301Rahim Yar Khan 313 311 307 303 304 302
D. G. Khan 160 154 161 155 157 144Layyah 180 178 181 179 188 184Muzaffargarh 296 288 305 297 311 296Rajanpur 144 139 134 131 141 137
Faisalabad 277 277 274 274 263 263Jhang 379 378 386 385 376 376T. T. Singh 155 155 159 159 158 158
Gujranwala 226 225 227 226 222 220Gujrat 139 70 141 74 144 72Hafizabad 134 134 139 139 140 140Mandi Baha-ud-Din 122 119 123 120 125 121Narowal 137 94 138 97 138 88Sialkot 195 185 193 181 200 191
Lahore 55 53 56 54 58 57Kasur 174 174 179 175 169 168Nankana 142 138 138Okara 220 220 219 219 216 216Sheikhupura 308 307 177 177 170 170Multan 195 189 203 196 192 185Khanewal 219 218 218 217 224 221Lodhran 176 176 178 178 169 169Pakpattan 154 154 151 151 148 148Sahiwal 156 156 153 153 153 153Vehari 251 251 253 253 247 247
Rawalpindi 117 4 113 5 115 5Attock 147 14 150 15 158 15Chakwal 130 8 129 4 136 7Jhelum 49 15 53 14 52 15
Sargodha 208 208 209 209 207 206Bhakkar 145 138 156 152 155 146Khushab 87 68 85 63 86 60Mianwali 149 112 165 127 173 127
(Islamabad) 14 - 14 - 13 -
80
Source :- Directorate of Agriculture, Crop Reporting Service, Punjab, Lahore.
AGRICULTURE
( Thousand Hectares )2004-05 2005-06
District2006-07
(Included in Sheikhupura District) 142

2002-03 2003-04 2004-05 2005-06 2006-07
The Punjab 1512 1688 1754 1762 1728
Bahawalpur 5 6 4 5 4Bahawalnagar 41 54 58 60 63Rahim Yar Khan 13 13 13 13 13
D. G. Khan 27 28 30 30 26Layyah 1 1 2 2 2Muzaffargarh 20 20 17 18 18Rajanpur 5 8 6 6 5
Faisalabad 22 25 28 27 26Jhang 79 98 108 108 103T. T. Singh 22 27 29 29 29
Gujranwala 231 238 244 248 246Gujrat 34 38 42 43 42Hafizabad 113 114 83 84 120Mandi Baha-ud-Din 73 80 119 122 75Narowal 74 85 80 80 81Sialkot 151 170 178 176 177
Lahore 34 38 38 37 37Kasur 51 62 68 63 64Nankana 100 97Okara 104 126 132 128 127Sheikhupura 247 259 274 178 176
Multan 8 11 10 11 11Khanewal 18 21 21 22 21Lodhran 2 2 1 1 1Pakpattan 46 58 57 59 57Sahiwal 23 28 29 29 27Vehari 18 23 22 22 20
Rawalpindi - - - - -Attock - - - - -Chakwal - - - - -Jhelum 1 1 2 1 1
Sargodha 32 37 40 41 40Bhakkar - - (a) (a) (a)Khushab 16 15 17 17 17Mianwali 1 2 2 2 2
( Included in Sheikhupura District )
81
Table 50 :- Area * Sown Under Rice by District, The Punjab
District
* Un-Irrigated area sown under Rice in the Province is insignificant. (a) = Less than 500
AGRICULTURE
( Thousand Hectares )
Source :- Directorate of Agriculture, Crop Reporting Service, Punjab, Lahore.

2002-03 2003-04 2004-05 2005-06 2006-07
The Punjab 2208 2387 2517 2426 2463
Bahawalpur 268 279 282 287 283Bahawalnagar 178 199 212 220 218Rahim Yar Khan 307 309 308 304 299
D. G. Khan 93 100 110 111 106Layyah 29 37 43 33 37Muzaffargarh 189 206 212 206 204Rajanpur 148 168 163 134 147
Faisalabad 32 36 50 40 40Jhang 45 49 66 52 52T. T. Singh 37 39 58 43 43
Gujranwala - - - - -Gujrat - - - - -Hafizabad - - - - -Mandi Baha-ud-Din 2 2 2 2 2Narowal - - - - -Sialkot - - - - -
Lahore - - - - -Kasur 8 9 12 11 11Nankana - - (a) (a) (a)Okara 9 8 12 9 15Sheikhupura (a) (a) (a) (a) -
Multan 167 189 194 193 190Khanewal 176 192 195 197 200Lodhran 192 204 207 209 210Pakpattan 30 34 45 31 47Sahiwal 77 84 91 83 86Vehari 208 231 240 243 251
Rawalpindi - - - - -Attock - - - - -Chakwal - - (a) (a) (a)Jhelum (a) (a) (a) (a) (a)
Sargodha 7 7 8 8 9Bhakkar 3 2 3 3 5Khushab (a) (a) (a) (a) (a)Mianwali 3 3 4 7 8a) Less than 500.Source :- Directorate of Agriculture, Crop Reporting Service, Punjab, Lahore.
( Thousand Hectares )
District
* Un-Irrigated area sown under Cotton in the Province is insignificant.
AGRICULTURE
Table 51 :- Area* Sown Under Cotton by District, The Punjab
82

2002-03 2003-04 2004-05 2005-06 2006-07
The Punjab 735 709 645 625 712
Bahawalpur 9 10 9 8 10Bahawalnagar 27 25 21 18 21Rahim Yar Khan 43 49 54 56 71
D. G. Khan 3 3 3 2 2Layyah 16 15 13 12 13Muzaffargarh 25 28 29 29 32Rajanpur 5 8 7 6 7
Faisalabad 117 116 106 108 115Jhang 92 91 81 83 100T. T. Singh 46 44 36 36 39
Gujranwala 3 3 2 2 2Gujrat 4 4 3 2 4Hafizabad 8 7 6 6 6Mandi Bhah-ud-Din 34 33 32 32 33Narowal 5 4 3 3 2Sialkot 2 2 2 2 2
Lahore 1 1 1 1 1Kasur 63 53 47 45 50Nankana 18 20Okara 32 27 23 20 23Sheikhupura 23 22 21 3 3
Multan 3 3 3 2 3Khanewal 10 10 9 9 11Lodhran 1 1 1 1 2Pakpattan 14 12 9 7 9Sahiwal 14 14 12 11 11Vehari 19 19 17 14 20
Rawalpindi - - - - -Attock 0.2 0.2 0.2 0.2 0.2Chakwal - - - - -Jhelum 0.2 0.2 0.2 0.2 0.2
Sargodha 81 75 69 65 70Bhakkar 22 17 14 12 15Khushab 9 9 9 9 10Mianwali 4 4 3 3 5
Source :- Directorate of Agriculture, Crop Reporting Service, Punjab, Lahore.* Un-Irrigated area sown under Sugarcane in the Province is insignificant.
( Thousand Hectares )
( Included in Sheikhupura District )
District
83AGRICULTURE
Table 52 :- Area* Sown Under Sugarcane by District, The Punjab

Total Irrigated Total Irrigated Total Irrigated
The Punjab 17375 16259 16778 15895 17853 16607
Bahawalpur 738 730 749 748 813 808Bahawalnagar 803 798 760 756 931 918Rahim Yar Khan 860 856 822 817 915 913
D.G. Khan 401 388 420 413 423 395Layyah 510 506 481 479 500 493Muzaffargarh 774 759 770 759 844 816Rajanpur 379 369 332 329 405 396
Faisalabad 902 902 794 794 817 817Jhang 1088 1087 1107 1105 1163 1161T.T.Singh 463 464 461 461 464 464
Gujranwala 712 709 678 676 667 664Gujrat 276 158 271 175 285 162Hafizabad 373 373 387 387 392 392Mandi Baha-ud-Din 327 323 344 340 327 322Narowal 340 248 308 250 318 203Sialkot 505 481 530 512 508 497
Lahore 161 156 152 150 153 152Kasur 510 510 505 500 511 509Nankana 414 414 411 411Okara 748 748 701 701 758 758Sheikhupura 893 892 515 514 452 451
Multan 535 521 517 509 547 531Khanewal 676 675 619 618 706 699Lodhran 459 459 448 448 501 501Pakpattan 514 513 485 485 501 501Sahiwal 457 457 420 420 468 468Vehari 708 708 673 673 726 725
Rawalpindi 225 13 195 13 230 14Attock 275 37 250 39 321 47Chakwal 211 21 134 11 218 17Jhelum 100 46 89 40 109 43
Sargodha 569 569 529 529 546 545Bhakkar 356 349 379 375 367 359Khushab 171 150 180 157 170 140Mianwali 331 284 339 297 360 314
Islamabad 25 - 20 1 26 1
(Included in SKP. District)
AGRICULTURETable 53:-Wheat Production-Total and Irrigated-by District, The Punjab
( Thousand Tonnes )
84
District2004-05 2005-06 2006-07
Source: - Directorate of Agriculture, Crop Reporting Service, Punjab, Lahore.

2002-03 2003-04 2004-05 2005-06 2006-07
The Punjab 2580 2871 2980 3180 3076
Bahawalpur 7 8 6 7 7Bahawalnagar 65 86 92 105 119Rahim Yar Khan 19 18 20 20 23
D.G. Khan 53 66 62 68 54Layyah 1 2 2 3 4Muzaffargarh 32 33 28 36 34Rajanpur 7 12 11 12 8
Faisalabad 33 33 38 41 37Jhang 118 151 176 178 171T.T. Singh 43 39 46 50 46
Gujranwala 436 452 465 490 445Gujrat 53 61 64 72 71Hafizabad 203 196 217 227 204Mandi Baha-ud-Din 133 143 143 150 136Narowal 95 131 111 122 125Sialkot 241 303 294 299 322
Lahore 59 60 62 59 59Kasur 86 104 117 134 124Nankana 172 164Okara 198 218 245 270 280Sheikhupura 417 429 455 308 284
Multan 12 15 15 17 16Khanewal 28 33 35 36 33Lodhran 2 2 2 2 2Pakpattan 96 116 98 121 121Sahiwal 35 45 41 47 52Vehari 32 37 38 35 35
Rawalpindi - - - - -Attock - - - - -Chakwal - - - - -Jhelum 2 2 3 2 1
Sargodha 44 47 63 64 63Bhakkar - - 1 1 1Khushab 28 27 27 29 31Mianwali 2 2 3 3 4
( Included in Sheikhupura District )
District
Source:- Directorate of Agriculture, Crop Reporting Service, Punjab, Lahore.
( Thousand Tonnes )
* Un-Irrigated production of Rice in the Province is insignificant.
AGRICULTURE
Table 54:- Rice (Cleaned) Production* by District, The Punjab
85

2002-03 2003-04 2004-05 2005-06 2006-07
The Punjab 7664 7702 11149 10268 10350
Bahawalpur 968 995 1365 1160 1348Bahawalnagar 545 629 968 869 969Rahim Yar Khan 1076 820 1613 1374 1347
D.G. Khan 411 376 528 515 519Layyah 63 75 130 102 113Muzaffargarh 599 626 868 846 712Rajanpur 651 675 829 646 740
Faisalabad 67 73 137 121 115Jhang 113 103 168 127 150T.T. Singh 95 91 160 125 132
Gujranwala - - - - -Gujrat - - - - -Hafizabad - - - - -Mandi Baha-ud-Din 2 3 3 3 3Narowal - - - - -Sialkot - - - - -
Lahore - - - - -Kasur 9 13 20 20 21Nankana - - - (a) 1Okara 18 15 26 20 41Sheikhupura (a) (a) (a) - -
Multan 600 623 859 889 830Khanewal 627 662 900 931 866Lodhran 799 831 1078 1079 975Pakpattan 59 63 120 99 182Sahiwal 174 167 241 241 260Vehari 768 843 1107 1065 970
Rawalpindi - - - - -Attock - - - - -Chakwal - - (a) (a) (a)Jhelum (a) (a) (a) (a) (a)
Sargodha 7 7 12 12 15Bhakkar 6 5 6 8 14Khushab (a) (a) (a) (a) (a)Mianwali 7 7 11 16 27* Un-Irrigated production of Cotton in the Province is insignificant. a) Less than 500.
Table 55:- Cotton Production* by District, The Punjab( Thousand Bales )
AGRICULTURE86
District
Source :- Directorate of Agriculture, Crop Reporting Service, Punjab, Lahore.

2002-03 2003-04 2004-05 2005-06 2006-07
The Punjab 33169 34023 33048 28969 37542
Bahawalpur 501 628 465 411 529Bahawalnagar 1155 1159 931 705 1067Rahim Yar Khan 2620 3161 3401 3108 4605
D.G. Khan 142 144 150 130 134Layyah 674 716 753 411 618Muzaffargarh 1394 1464 1330 1312 1740Rajanpur 258 440 421 319 406
Faisalabad 5412 5752 6024 5452 6404Jhang 4281 4281 4006 3837 5096T.T. Singh 2147 2193 1984 1980 2182
Gujranwala 98 107 80 70 74Gujrat 135 138 151 101 155Hafizabad 326 322 282 286 281Mandi Baha-ud-Din 1453 1417 1436 1326 1637Narowal 132 121 90 82 76Sialkot 70 73 74 74 70
Lahore 39 28 38 39 33Kasur 2696 2347 2230 2065 2543Nankana 667 850Okara 1528 1333 1150 946 1089Sheikhupura 909 926 875 87 126
Multan 186 181 101 88 124Khanewal 491 491 540 404 580Lodhran 52 54 59 56 85Pakpattan 589 564 434 343 517Sahiwal 475 605 491 438 458Vehari 1106 1168 1055 666 1189
Rawalpindi - - - - -Attock 8 8 8 8 8Chakwal - - - - -Jhelum 9 9 9 8 8
Sargodha 3045 3020 3351 2598 3524Bhakkar 819 719 667 533 625Khushab 296 291 306 294 496Mianwali 123 163 156 125 213
Table 56- Sugarcane Production* by District, The Punjab( Thousand Tonnes )
87
Source :- Directorate of Agriculture, Crop Reporting Service, Punjab, Lahore.
AGRICULTURE
District
* Un-Irrigated production of Sugarcane in the Province is insignificant.
( Included in Sheikhupura District )

Cotton Seed Rape & Mustard Seasamum Groundnut Linseed
1997-98 2348 177 90 91 3
1998-99 2283 175 66 79 2
1999-00 2329 165 68 76 2
2000-01 2386 129 98 66 2
2001-02 2526 135 132 86 2
2002-03 2208 151 84 74 2
2003-04 2387 157 54 90 2
2004-05 2518 158 63 95 1
2005-06 2426 128 75 82 1
2006-07 2463 136 65 83 1
1997-98 2319 176 40 84 2
1998-99 2255 171 30 74 2
1999-00 2995 177 34 72 2
2000-01 2905 128 50 67 2
2001-02 2737 131 68 80 1
2002-03 2607 146 17 71 1
2003-04 2620 151 22 94 1
2004-05 3793 143 28 58 1
2005-06 3493 109 32 50 1
2006-07 3521 120 27 58 1
AGRICULTURE
Source :- Directorate of Agriculture, Crop Reporting Service, Punjab, Lahore.
Table 57:- Area and Production of Various Oil Seeds, The Punjab
Year
I. Area (‘000’ Hectares)
II. Production (‘000’Tonnes)
88

2002-03 2003-04 2004-05 2005-06 2006-07
Total 1375 1274 1719 1736 1809
Apple 4 4 4 4 4
Appricot 1 1 1 1 (a)
Banana 17 14 14 13 12
Dates 85 57 58 58 59
Guava 285 273 280 263 265
Mango 540 543 1006 1049 1121
Musk Melon /Water Melon 188 169 163 163 164
Pear 2 2 1 (a) (a)
Peach 2 2 1 1 1
Phalsa 6 6 6 6 6
Pomegranate 24 23 23 23 23
Others 221 180 162 155 154
(Others as Percent Of Total) 16.1 14.1 9.4 18.1 8.5
Total 15445 14729 20563 21153 20856
Apple 36 36 36 36 36
Appricot 3 3 2 2 2
Banana 117 102 99 92 80
Dates 621 417 427 426 432
Guava 2463 2415 2498 2317 2338
Mango 6842 7078 13119 13918 13566
Musk Melon / Water Melon 4042 3595 3402 3415 3463
Pear 15 12 4 3 2
Peach 11 9 5 5 4
Phalsa 26 26 27 28 28
Pomegranate 168 166 167 167 165
Others 1101 870 777 744 740
(Others as Percent of Total) 7.1 5.9 3.8 3.5 3.5
89
F r u i t
AGRICULTURE
Table 58:- Area and Production of Kharif Fruit, The Punjab
I- Area (‘00’ Hectares)
II- Production (‘00’ Tonnes)

2002-03 2003-04 2004-05 2005-06 2006-07
Total 2028 1972 2053 2132 2144
Citrus 1708 1666 1739 1821 1833
Banana 6 5 5 5 5
Ber 13 14 14 14 14
Guava 225 226 234 231 231
Loquat 7 7 7 7 8
Mulberry 4 4 4 4 3
Others 65 50 50 50 50
(Others as Percent of Total) 3.2 2.5 2.4 2.3 2.3
Total 18746 19546 21406 26488 16590
Citrus 16236 16918 18722 23851 14007
Banana 30 28 25 22 23
Ber 95 101 101 105 104
Guava 1908 2126 2190 2144 2116
Loquat 42 43 45 46 47
Mulberry 19 19 17 15 15
Others 416 311 306 305 278
(Others as Percent of Total) 2.2 1.6 1.4 1.2 1.7
90
II - Production (‘00’ Tonnes)
F r u i t
I - Area (‘00’ Hectares)
Table 59 :- Area and Production of Rabi Fruit, The Punjab
AGRICULTURE
Source :- Directorate of Agriculture, Crop Reporting Service, Punjab, Lahore.
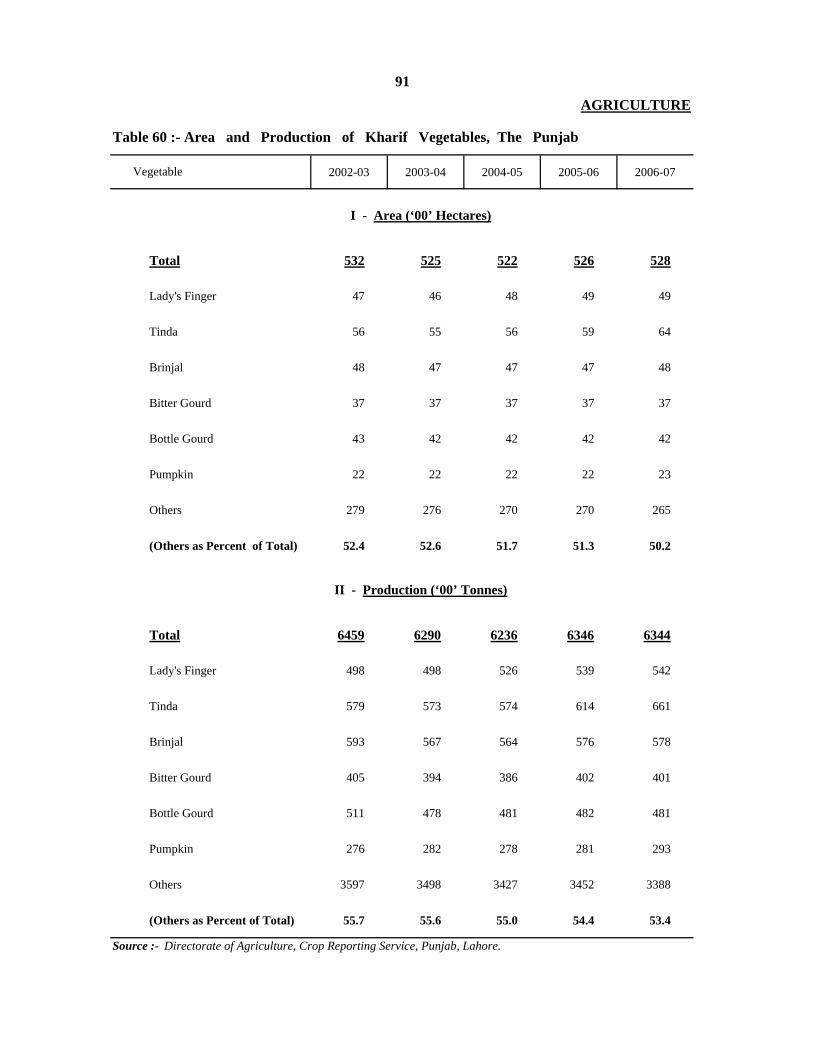
2002-03 2003-04 2004-05 2005-06 2006-07
Total 532 525 522 526 528
Lady's Finger 47 46 48 49 49
Tinda 56 55 56 59 64
Brinjal 48 47 47 47 48
Bitter Gourd 37 37 37 37 37
Bottle Gourd 43 42 42 42 42
Pumpkin 22 22 22 22 23
Others 279 276 270 270 265
(Others as Percent of Total) 52.4 52.6 51.7 51.3 50.2
Total 6459 6290 6236 6346 6344
Lady's Finger 498 498 526 539 542
Tinda 579 573 574 614 661
Brinjal 593 567 564 576 578
Bitter Gourd 405 394 386 402 401
Bottle Gourd 511 478 481 482 481
Pumpkin 276 282 278 281 293
Others 3597 3498 3427 3452 3388
(Others as Percent of Total) 55.7 55.6 55.0 54.4 53.4
II - Production (‘00’ Tonnes)
Source :- Directorate of Agriculture, Crop Reporting Service, Punjab, Lahore.
AGRICULTURE
Table 60 :- Area and Production of Kharif Vegetables, The Punjab
Vegetable
I - Area (‘00’ Hectares)
91
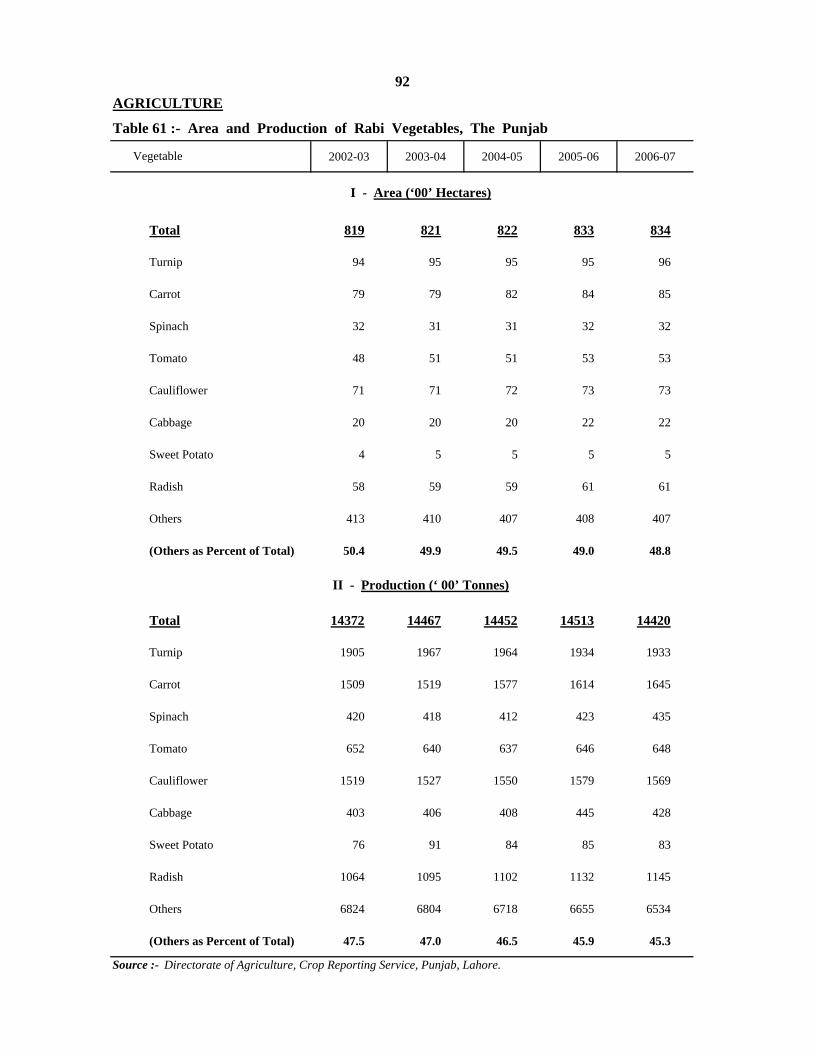
2002-03 2003-04 2004-05 2005-06 2006-07
Total 819 821 822 833 834
Turnip 94 95 95 95 96
Carrot 79 79 82 84 85
Spinach 32 31 31 32 32
Tomato 48 51 51 53 53
Cauliflower 71 71 72 73 73
Cabbage 20 20 20 22 22
Sweet Potato 4 5 5 5 5
Radish 58 59 59 61 61
Others 413 410 407 408 407
(Others as Percent of Total) 50.4 49.9 49.5 49.0 48.8
Total 14372 14467 14452 14513 14420
Turnip 1905 1967 1964 1934 1933
Carrot 1509 1519 1577 1614 1645
Spinach 420 418 412 423 435
Tomato 652 640 637 646 648
Cauliflower 1519 1527 1550 1579 1569
Cabbage 403 406 408 445 428
Sweet Potato 76 91 84 85 83
Radish 1064 1095 1102 1132 1145
Others 6824 6804 6718 6655 6534
(Others as Percent of Total) 47.5 47.0 46.5 45.9 45.3
92
Source :- Directorate of Agriculture, Crop Reporting Service, Punjab, Lahore.
Vegetable
I - Area (‘00’ Hectares)
II - Production (‘ 00’ Tonnes)
AGRICULTURE
Table 61 :- Area and Production of Rabi Vegetables, The Punjab

Area Production Area Production
1997-98 889 12239 210 2257
1998-99 935 16040 222 2308
1999-00 937 16480 225 2476
2000-01 871 14797 231 2513
2001-02 917 15488 239 2250
2002-03 1022 17619 265 2633
2003-04 971 17753 270 2512
2004-05 988 18498 277 2645
2005-06 1045 13896 326 3065
2006-07 1207 24075 356 3157
Pakistan Punjab % Share of Punjab Pakistan Punjab % Share of
Punjab
Total 13687 8278 60.5 13550 8161 60.2
(0-90 cms) 54 38 70.4 154 110 71.4
(90-150 cms) 400 149 37.3 1016 365 35.9
(150-300 cms) 5134 1187 23.1 5142 1375 26.7
(450-600 cms) 2485 1991 80.1 2057 1692 82.3
( > 600 cms) 5614 4913 87.5 5181 4619 89.2
( Thousand Hectares )
* Includes Kharif and Rabi Crops.Source :- Directorate of Agriculture, Crop Reporting Service, Punjab, Lahore.
Year
Table 63 :- Water Table Depths, Pakistan and The Punjab
Onion
93AGRICULTURE
Table 62 :- Area and Production of Potato and Onion, The Punjab
Potato *
(Area in 00 Hectares & Production in 00 Tonnes)
Source :- Chief Engineer, SCARPS Monitoring Organization `WAPDA,, Lahore.
Water Table Depths
AREA OCCUPIED
Jun-06 Jun-07

Pakistan Punjab % Share of Punjab Pakistan Punjab % Share of
Punjab
1 Wheat 8447.9 6484.0 76.8 8578.2 6432.8 75.0
2 Gram 1028.9 900.0 87.5 1052.3 910.7 86.5
3 Barley 89.9 35.0 38.9 94.0 37.0 39.4
4 Rape Seed & Mustard 227.3 128.0 56.3 255.9 135.0 52.8
5 Cotton 3103 2426.0 78.2 3074.8 2462.9 80.1
6 Rice (Total) 2621.4 1762 67.2 2581.2 1728.4 67.0
i) Rice (Basmati) 1658.5 1535.0 92.6 1589.2 1474.3 92.8
ii) Rice (Medium & Coarse) 962.9 227.0 23.6 992.0 254.1 25.6
7 Sugarcane 907.3 625.0 68.9 1028.8 711.8 69.2
8 Maize (Kharif & Spring) 1042 541.0 51.9 1016.9 429.5 42.2
9 Jowar 254.4 147.0 57.8 291.6 184.1 63.1
10 Bajra 440.7 362.0 82.1 504.1 366.7 72.7
1 Wheat 21276.8 16776.0 78.8 23294.7 17853.0 76.6
2 Gram 479.5 382.5 79.8 837.8 728.0 86.9
3 Barley 87.5 32.0 36.6 92.7 34.6 37.3
4 Rape Seed & Mustard 180.8 108.6 60.1 255.9 120.2 47.0
5 Cotton (‘000’ Bales) 13018.9 10268.0 78.9 12856.2 10350.0 80.5
6 Rice (Total) 5547.2 3180 57.3 5438.4 3075.5 56.6
i) Rice (Basmati) 2920.4 2642.0 90.5 2735.7 2493.6 91.2
ii) Rice (Medium & Coarse) 2626.8 538.0 20.5 2702.7 581.9 21.5
7 Sugarcane 44665.5 28968.6 64.9 54741.6 37540.0 68.6
8 Maize (Kharif & Spring) 3109.6 2319.4 74.6 3088.4 2161.0 70.0
9 Jowar 152.6 76.0 49.8 179.5 101.0 56.3
10 Bajra 220.8 205.0 92.8 238.0 216.8 91.1
94AGRICULTURE
I. Area (Thousand Hectares)
II. Production (Thousand Tonnes)
Table 64:- Area and Production of Important Crops Pakistan and The Punjab
Source :- Ministry of Food and Agriculture, (MINFAL) Govt. of Pakistan Islamabad
Crop2005-06 2006-07

95
PRODUCTION OF MAJOR CROPS PAKISTAN & PUNJAB 2006 07PRODUCTION OF MAJOR CROPS, PAKISTAN & PUNJAB:2006-07
(Thousand Tonnes) 5474252000
PAKISTAN
PUNJAB
3754039000
2329526000
17853
1285610350
54383076
13000
WHEATCOTTON
‘ 000’ BALES SUGARCANERICE
( Cleaned)
3076
0
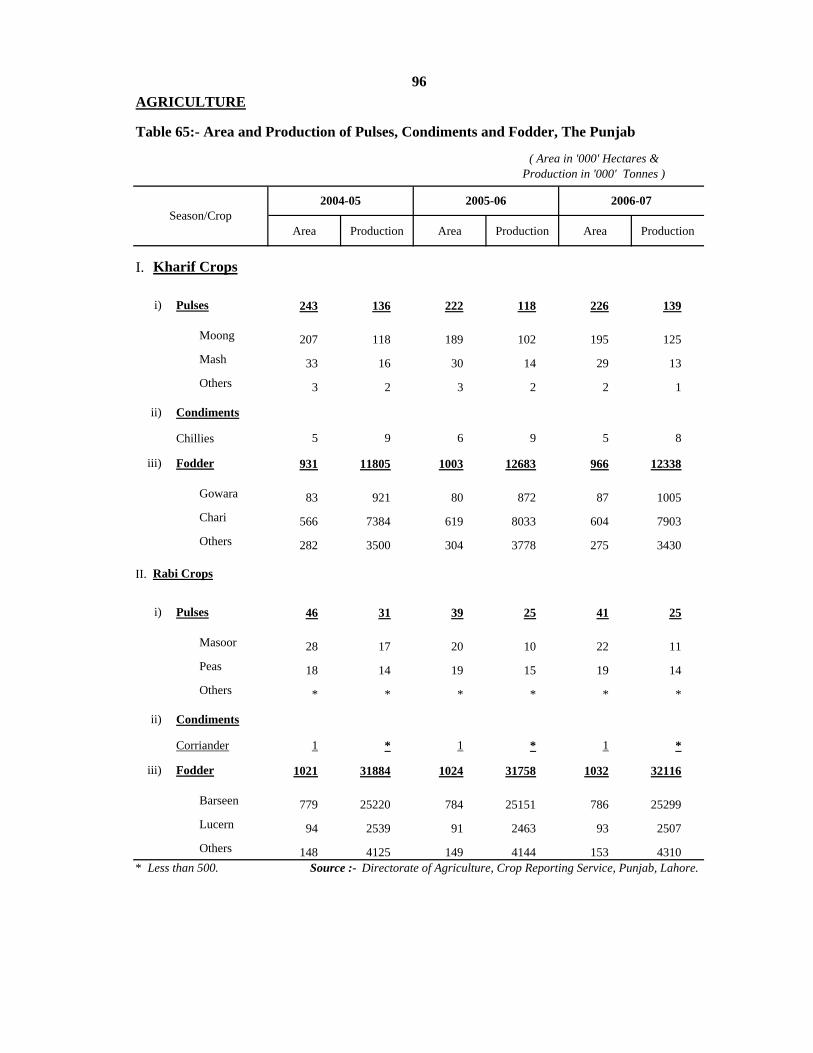
Area Production Area Production Area Production
I.
243 136 222 118 226 139
Moong 207 118 189 102 195 125Mash 33 16 30 14 29 13Others 3 2 3 2 2 1
5 9 6 9 5 8
931 11805 1003 12683 966 12338
Gowara 83 921 80 872 87 1005Chari 566 7384 619 8033 604 7903Others 282 3500 304 3778 275 3430
II.
46 31 39 25 41 25
Masoor 28 17 20 10 22 11Peas 18 14 19 15 19 14Others * * * * * *
1 * 1 * 1 *
1021 31884 1024 31758 1032 32116
Barseen 779 25220 784 25151 786 25299Lucern 94 2539 91 2463 93 2507Others 148 4125 149 4144 153 4310
* Less than 500. Source :- Directorate of Agriculture, Crop Reporting Service, Punjab, Lahore.
Season/Crop
Kharif Crops
Fodder
Pulses
Condiments
Chillies
Fodder
Rabi Crops
96
Pulses
Condiments
Corriander
AGRICULTURE
Table 65:- Area and Production of Pulses, Condiments and Fodder, The Punjab
2004-05 2005-06 2006-07
( Area in '000' Hectares & Production in '000' Tonnes )
ii)
iii)
i)
ii)
iii)
i)

2002-03 2003-04 2004-05 2005-06 2006-07
1 Major CropsRice 1512 1688 1754 1762 1728Wheat 6097 6256 6379 6484 6433Barley 40 38 36 35 37Jowar 235 247 217 147 184Bajra 333 345 332 362 367Maize 420 428 475 541 492Gram 860 854 956 900 911Sugarcane 735 709 645 625 712Rapeseed and Mustard 151 157 158 128 136Sesamum 84 54 63 75 65Tobacco 18 17 17 18 18Cotton 2208 2387 2518 2426 2463
2 Minor Crops
Mash 50.8 44 33.22 30.39 29.10Masoor 34.2 35 28 20.71 22.48Mung 237.3 231 206 189.3 194.6Matter 21.7 19.08 17.09 19.3 19.5Others (Moth, Arher, etc.) 3.3 3.87 3.4 3.4 2.74
Onion 26.4 27 27.07 32.6 35.6Chillies 7.3 6.4 5.22 5.76 5.02Garlic 2.7 2.71 2.7 2.78 2.86Turmeric 3.7 3.59 3.5 3.28 3.36Corriander 0.6 1.03 0.64 0.54 0.56Ginger - - - - -Cumin Seed - - - - -Fennu Greek - - - - -Others - - - - -Groundnut 74.3 89.7 94.7 81.8 83.2Soyabean - - - - -Sunflower 37.3 84.1 57 75.1 90.5Safflower - - - - -Canola - 5.95 5.09 2.4 2.83Linseed (Alsi) 1.7 1.61 1.41 1.4 1.3Castor Seed - 0.17 0.09 0.05 0.05Fodder 2037.2 1965.9 1952 2027.1 1998.1Sunhemp 2.4 2.31 1.67 1.88 1.15Jute - - - - -Guarseed 101.4 126.83 110.23 109.11 104.2Sugarbeet - - - - -Others - - - - -
Crops
AGRICULTURE97
Table 66:- Area of Major and Minor Crops, The Punjab ( ‘000’ Hectares)
Source:- Ministry of Food, Agriculture & Livestock Govt. of Pakistan, Islamabad.

2002-03 2003-04 2004-05 2005-06 2006-07
1 Major Crops
Rice 2579.7 2871.45 2980.3 3180 3075.50Wheat 15355 15639 17375 16776 17853.00Barley 38.4 35.8 35.2 32 34.60Jowar 132.5 144.3 124.1 76 101.00Bajra 180.9 194.8 186.8 205 216.80Maize 882.9 1019.8 1934.6 2319.4 2161.00Gram 611.5 524 760.6 382.5 728.30Sugarcane 33168.6 34023 33048 28968.6 37542.00Rapeseed and Mustard 146.1 151.3 142.5 108.6 120.20Sesamum 17.4 22.1 28.3 31.6 26.86Tobacco 21.9 21.1 20.6 21.6 21.61Cotton (‘000’ bales) 7664 7702 11149 10268 10350.00
2 Minor Crops
Mash 25.8 21.3 15.53 13.62 13.16Masoor 21.6 22 17.22 10.1 11.00Mung 125.7 126.8 118.3 101.8 124.54Matter 17.4 15.5 13.9 14.7 14.40Others (Moth, Arher, etc.) 2 2.3 2.2 1.9 1.24
Onion 263.2 251.2 264.54 306.45 315.69Chillies 12 10.8 8.6 9.34 7.99Garlic 22.4 22.9 22.68 22.93 24.10Turmeric 35.3 34.8 34.5 31.78 32.55Corriander 0.4 0.59 0.4 0.35 0.34Ginger - - - - -Cumin Seed - - - - -Fennu Greek - - - - -Others 5.1 0.6 0.6 - -
Groundnut 71.1 94.3 58.5 49.9 57.60Soyabean - - - - -Sunflower 54.89 122.5 86.36 122.84 156.26Safflower - - - - -Canola 5.15 6.26 5.34 2.27 2.86Linseed Alsi 1.34 1.24 1.11 1.08 1.02Castor Seed 0.16 0.23 0.11 0.08 0.06Fodder 45048.5 44025.8 43441.98 44440.9 44454.40Sunhemp 1.65 1.6 1.09 1.24 0.98Jute - - - - -Guarseed 87.8 103.7 91.5 81.69 81.30Sugarbeet - - - - -Others 1.6 - 7.9 - -
Source:- Ministry of Food, Agriculture & Livestock, Government of Pakistan, Islamabad.
98AGRICULTURETable 67:- Output of Major and Minor Crops, The Punjab
(Thousand Tonnes)Crops

2003 2004 2005 2006 2007
522891 611905 705867 784375 893428
1 214 162 147 139 136
2 522677 611743 705720 784236 893292
522890 611905 705867 784375 893428
I. 500897 562215 538772 644228 779767
1 41246 47532 53870 76317 81277
2 - 13827 11795 12036 12383
3 459116 500312 472514 555312 685469
4 535 544 593 563 638
II. 20989 48550 165843 138529 111921
1 2351 2799 2961 2865 3012
2 18559 45672 162803 135585 108830
379 79 79 79 79
III.1004 1140 1252 1618 1740
1 672 773 876 1240 1321
2 316 350 358 361 400
3 12 13 14 13 15
4 4 4 4 4 4
a)b)
Sterling Securities
Govt. of India Securities
Rupee (Coins)
Approved Foreign Exchange
India Notes (a)
Internal Bills of Exchange and Other Commercial Papers
Rupee ( Coins )
WITH RESERVE BANK OF INDIA PENDING TRANSFER TO PAKISTAN (b)
Gold
99
DOMESTIC ASSETS – TOTAL
Notes in Circulation
ASSETS
GOLD AND FOREIGN ASSETS
Gold
Govt. of Pakistan Securities
BANKING
Table 68 :- Liabilities and Assets of the State Bank of Pakistan
Representing assets receivable from Reserve Bank of India.Unpaid balance of assets receivable from the Reserve Bank of India Under Partition Agreement.
Source State Bank of Pakistan, Karachi.
Issue Department ( As on 30th June )( Million Rupees)
A - Advances
Notes in Banking Department
TOTAL LIABILITIES/ASSETS LIABILITIES
SDRs held with IMF

2003 2004 2005 2006 2007
I.589873 569643 698650 904489 1038911
i) 100 100 100 100 100
ii) 16714 16715 26714 26714 67139
iii) 496350 466656 562771 618069 713584
a) Central 36842 2682 64073 90872 92584
b) Provincial 32836 34207 45632 66645 62566
c) Banks 140990 156204 196302 207574 305169
d) Others 285682 273563 256764 252978 253265
iv) 1526 1526 1526 1526 1526
v) 672 494 1100 473 572
vi) 38883 45206 51647 74407 79441
vii) 35628 38946 54792 183200 176549
II. 589873 569642 688651 904489 1038911
i) 214 161 146 139 136
ii) 37 37 37 37 37
iii) - - 9116 - -
iv) 104385 132021 152217 124970 213091
v) 14092 - 1775 1089 419
vi) - 5533 10814 16404 10820
vii)130548 161888 181987 193579 253419
viii) 27386 21245 15254 14216 14074
ix) 134113 124564 199273 408378 373067
x) 179098 124193 118032 145677 173848
100
TOTAL LIABILITIES/ASSETS LIABILITIES
Capital Paid up
Various Funds
Deposits
BANKING
Table 69 :- Liabilities and Assets of the State Bank of Pakistan Banking Department ( As on 30th June )
(Million Rupees)
Item
Govt. Treasury Bills
Balance held outside Pakistan
Rights (SDR)
Bills Payable
Revaluation Account
Other Liabilities
Loans & Advances to NBFIS
Investments
Other Assets
Source :- State Bank of Pakistan, Karachi.
ASSETS
SDR held with IMF
Govt. Debtor Balances
Loans & Advances to Scheduled Banks
Notes & Coins
Bills Purchased & Discounted

2003 2004 2005 2006 2007
I. 2078706 2486556 2965623 3406904 4065155
II. 494578 578116 665911 740390 840181
1 527558 617508 712480 788968 898388
2 2565 2960 3107 139 136
3 30415 36432 43462 48439 58071
III. 1584128 1908440 2299712 2666514 3224974
1 608170 791413 954880 1095260 14555092 846321 969217 1161202 1370822 15566013
3499 2116 3335 4931 55524
126138 145694 180295 195501 207312
TotalSpecial
Drawing Rights
71283 115
117679 36
102495 24
169752 281
328599 510
619841 14092
694828 13827
680715 13570
768192 13124
934007 12802
28067
( As on 30th June )
838607
2002
Gold
1998
2000
2001
1999
28292
Residents Foreign Currency Account Deposits
Source :- State Bank of Pakistan, Karachi.
Table 71 :- Gold and Foreign Exchange Reserves and Special Drawing Rights, Pakistan
(Million Rupees)
Year Foreign Exchange
101
Scheduled Bank’s Demand Deposits
Scheduled Bank’s Time Deposits
BANKING
Table 70:-Components of Monetary Assets,Pakistan (As on 30th June)(Million Rupees)
Monetary Assets
Type of Assets
77557
2007 82598
677511
Currency in Circulation ( 1-2-3 )
Currency Issued
Held by State Bank of Pakistan
Other Deposits with State Bank of Pakistan
In Tills of Scheduled Banks
Deposits - Total
31508
36199
40020
41918
Source :- State Bank of Pakistan, Karachi.Note: Most of data of this table has been revised by the source agency.
2006
2003
2004
2005
48305
54746
42876
89576
70963
133272
288069
563831
632696
612399

2003 2004 2005 2006 2007
969873 1242384 1694153 2071193 2376182
Less Than Rs. 1,000 2 5 2 2 7
Rs. 1,000 to Rs. 5,000 68 100 213 171 177
Rs. 5,000 to Rs. 10,000 175 335 416 614 594
Rs. 10,000 to Rs. 25,000 4428 11275 11667 12586 14224
Rs. 25,000 to Rs. 50,000 28608 43233 44948 46696 47069
Rs. 50,000 to Rs. 100,000 55050 52632 86151 102930 103988
Rs. 100,000 to Rs. 200,000 26943 32565 61776 76891 112363
Rs. 200,000 to Rs. 500,000 51734 67213 107676 128351 152052
Rs. 500,000 and over 802865 1035026 1381304 1702952 1945708
1681528 2002308 2428293 2817351 3372552
Less Than Rs. 1,000 509 1624 1504 1200 1253
Rs. 1,000 to Rs. 5,000 7785 7628 6152 6064 8168
Rs. 5,000 to Rs. 10,000 33413 27888 19439 16751 15208
Rs. 10,000 to Rs. 25,000 180111 138480 110724 100290 80318
Rs. 25,000 to Rs. 50,000 188716 178734 183681 188715 158853
Rs. 50,000 to Rs. 100,000 156834 225993 294560 316793 277460
Rs. 100,000 to Rs. 200,000 157436 202824 301929 313729 338824
Rs. 200,000 to Rs. 500,000 208765 210582 268390 290828 331423
Rs. 500,000 and over 747959 1008555 1241914 1582981 2161045
B - Deposits
Total
Size of Account
Source:- State Bank of Pakistan, Karachi
Total
(Million Rupees)
A - Advances
102BANKINGTable 68 :- Liabilities and Assets of the State Bank of Pakistan
by Size of Account (As on 30th June)

Item Unit 2002-03 2003-04 2004-05 2005-06 2006-07
Post Offices Number 7307 7156 7347 7304 7300
Letter Boxes Thousand 13 16 14 13 13
Mail Lines* Thousand Kilometres 102 36 37 60 98
Un-Registered Articles Million 324 385 166 171 223
Registered Letters Million 12 14 13 14 15
Registered Parcels Thousand 460 528 448 711 150
Insured Letters
Number Thousand 32 40 57 14 7
Value Million Rs. 58 157 151 N.A. N.A.
Insured Parcels
Number Thousand 13 12 27 9 3
Value Million Rs. 209 632 366 37 N.A.
V.P.Letters
Number Thousand 475 466 419 367 588
Value Thousand Rs. 132 167 154 N.A. N.A.
Money Orders Issued
Number Thousand 2342 2410 4818 3781 4482
Value Million Rs. 6111 6255 6402 10954 10845
Money Orders Paid
Number Thousand 2720 3085 6190 5239 5836
Value Million Rs. 9095 9984 9197 29218 17819
103
* Excluding Air distance. Source :- Pakistan Postal Services Corporation, Lahore.
COMMUNICATIONS
Table 73 :- Postal Service Operations, The Punjab
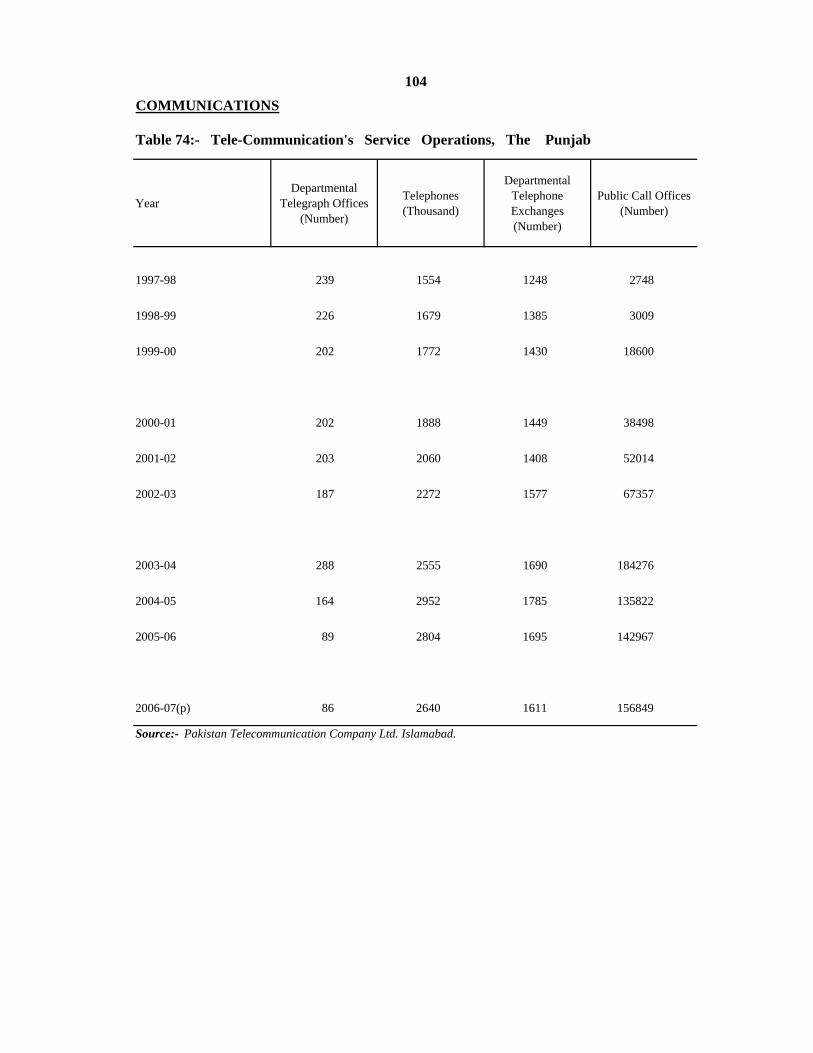
YearDepartmental
Telegraph Offices (Number)
Telephones (Thousand)
Departmental Telephone Exchanges (Number)
Public Call Offices (Number)
1997-98 239 1554 1248 2748
1998-99 226 1679 1385 3009
1999-00 202 1772 1430 18600
2000-01 202 1888 1449 38498
2001-02 203 2060 1408 52014
2002-03 187 2272 1577 67357
2003-04 288 2555 1690 184276
2004-05 164 2952 1785 135822
2005-06 89 2804 1695 142967
2006-07(p) 86 2640 1611 156849
COMMUNICATIONS
Table 74:- Tele-Communication's Service Operations, The Punjab
Source:- Pakistan Telecommunication Company Ltd. Islamabad.
104
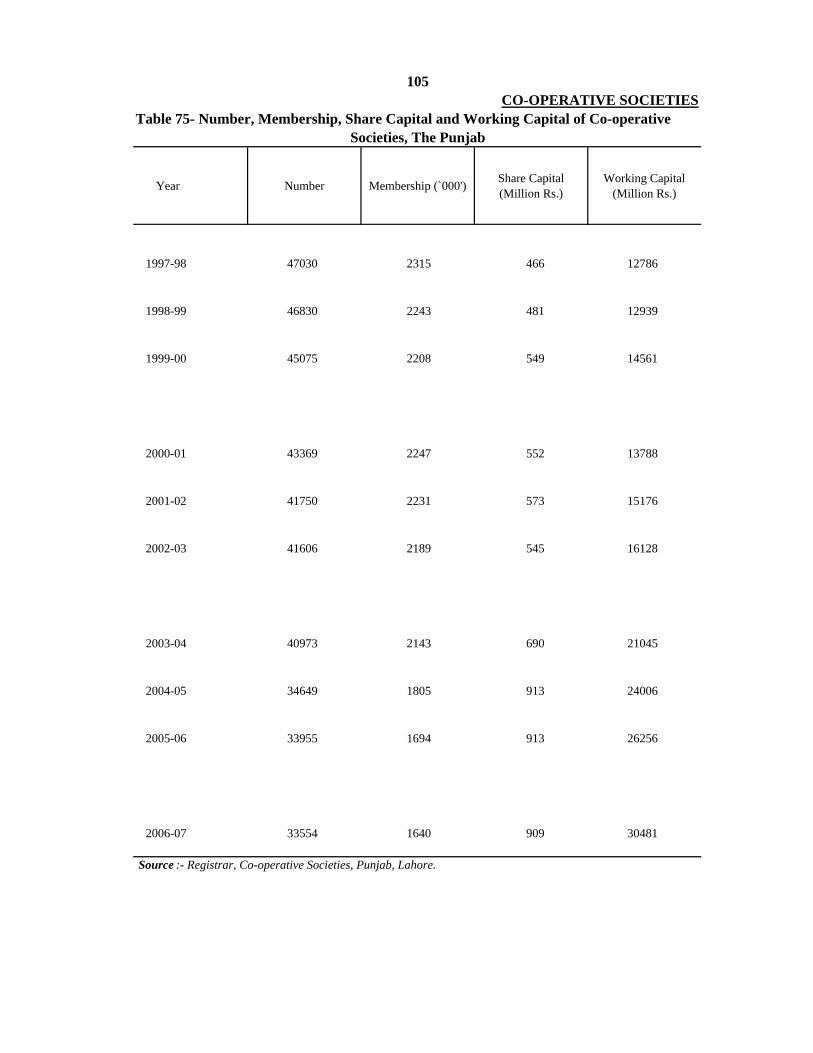
Year Number Membership (`000') Share Capital (Million Rs.)
Working Capital (Million Rs.)
1997-98 47030 2315 466 12786
1998-99 46830 2243 481 12939
1999-00 45075 2208 549 14561
2000-01 43369 2247 552 13788
2001-02 41750 2231 573 15176
2002-03 41606 2189 545 16128
2003-04 40973 2143 690 21045
2004-05 34649 1805 913 24006
2005-06 33955 1694 913 26256
2006-07 33554 1640 909 30481
105
Source :- Registrar, Co-operative Societies, Punjab, Lahore.
CO-OPERATIVE SOCIETIESTable 75- Number, Membership, Share Capital and Working Capital of Co-operative
Societies, The Punjab

106
NUMBER MEMBERSHIP SHARE AND WORKINGNUMBER, MEMBERSHIP, SHARE AND WORKING CAPITAL OF CO-OPERATIVE SOCIETIES THE PUNJAB : 1997-98, 2004-05 TO 2006-07
1997-98 2004-05 2005-06 2006-07
2315
2500
4750 913
913 909
980 56
3048
1
30000
1805
1694
16402000
2500
35 34 3440
700
840
980
2400
6
2625
20000
25000
30000
1000
1500
20
30
466
420
560
1278
6
10000
15000
20000
50010140
280
0
5000
10000
WORKING CAPITAL MILLION Rs.NUMBER ‘000’ MEMBERSHIP ‘000’ SHARE CAPITAL
MILLION Rs.
00 00

District Number Membership (Thousand)
Share Capital (Million Rs.)
Working Capital (Million Rs.)
The Punjab 33554 1640 908 30481
Bahawalpur 1357 43 12 481Bahawalnagar 1303 46 7 223Rahim Yar Khan 1086 40 15 343
D.G.Khan 884 19 10 80Layyah 758 30 4 87Muzaffargarh 811 27 4 137Rajanpur 332 16 2 31
Faisalabad 2499 170 24 1083Jhang 1340 48 21 92Toba Tek Singh 1122 49 8 200
Gujranwala 974 53 18 5029Gujrat 614 33 2 42Hafizabad 658 27 3 100Mandi Baha-ud-Din 586 18 3 76Narowal 477 22 3 49Sialkot 889 48 16 90
Lahore 2160 272 644 19118Kasur 1058 44 7 137Nankana 1044 37 7 281Okara 1362 41 11 394Sheikhupura 989 40 8 289
Multan 1706 54 10 457Khanewal 1377 41 9 313Lodhran 1176 31 3 169Pakpattan 535 25 2 94Sahiwal 1030 52 4 156Vehari 1304 38 6 236
Rawalpindi 795 87 24 241Attock 304 11 3 32Chakwal 437 15 2 63Jhelum 179 8 2 15
Sargodha 1038 78 6 194Bhakhar 535 37 3 52Khushab 274 14 2 48Mianwali 561 26 3 49
Source :- Registrar, Co-operative Societies, Punjab Lahore.
Note:- Includes the Societies which are under the control of Lady Assistant Registrars and Industrial Assistant Registrars, Bahawalpur, Faisalabad, Lahore and Rawalpindi.
107CO-OPERATIVE SOCIETIES
Table 76:- Number, Membership, Share Capital and working Capital of Co-operativeSocieties by District, The Punjab: 2006-07

Credit Others Credit Others
Number 33554 1 193 27615 2242 404 3099
Membership (000) 1640 39 56 1060 86 45 354
Share Capital 909 430 26 124 22 11 296
Reserve Fund 802 364 17 328 14 2 77
Other Fund 1967 1451 28 9 7 1 471
Deposits 9560 1674 41 81 100 24 7640
Loans 17243 12333 23 4331 142 6 408
Working Capital 32481 18252 135 4873 285 44 8892
Profit & Loss 7 0 4 6 1 1 -5
Cost of Management 695 426 4 0 3 0 262
Individuals 10658 3029 5 7282 297 29 16
Societies 9029 7953 18 32 120 5 901
Individuals 6633 1601 5 4693 283 27 24
Societies 8524 7803 17 30 117 6 551
Individuals 62.23 52.86 100.00 84.45 95.29 93.10 150.00
Societies 94.41 98.11 34.44 93.75 97.50 12.00 61.15
Source :- Registrar, Co-operative Societies, Punjab Lahore.
PERCENTAGE OF RECOVERY OF LOANS
RECEIPT FROM LOANS PAID
LOANS ADVANCED
108CO-OPERATIVE SOCIETIES
Table77:- Working of Co-operative Societies, The Punjab: 2006-07(Amount in Million Rupees)
Agricultural Co-operative Societies
Non-Agricultural Co-operative Societies
Item TotalProvincial
Co-operative Bank
Central Non-Credit Societies
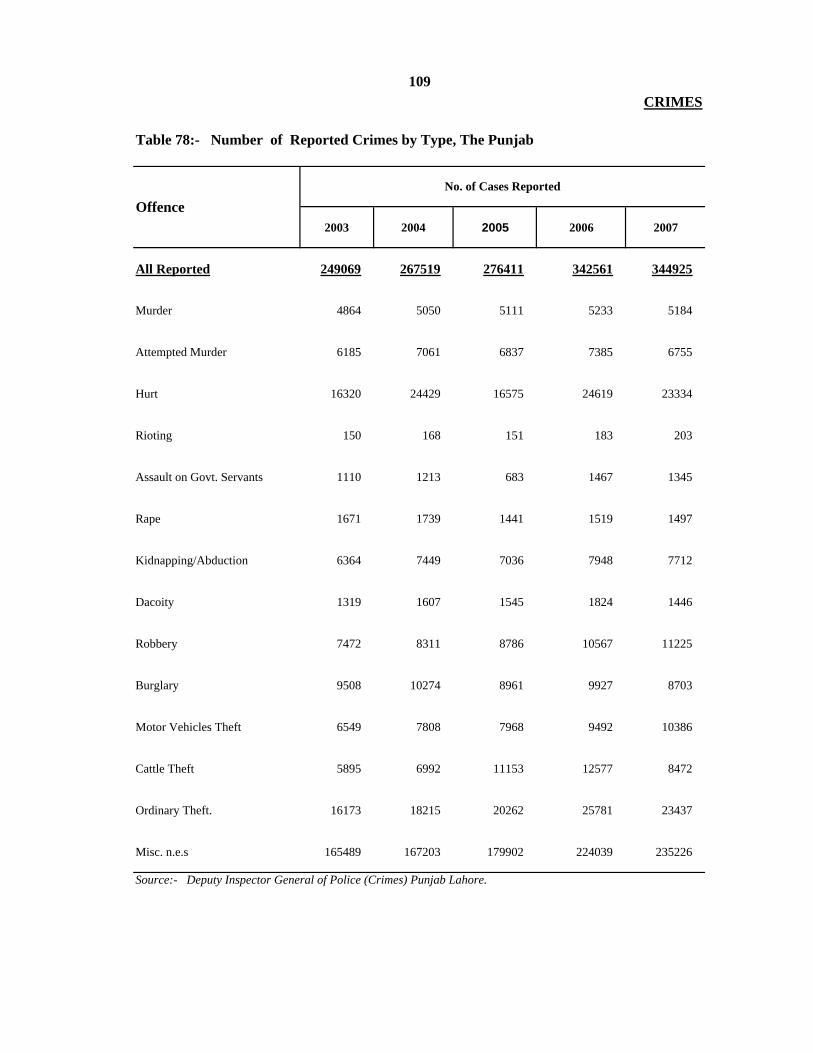
2003 2004 2005 2006 2007
All Reported 249069 267519 276411 342561 344925
Murder 4864 5050 5111 5233 5184
Attempted Murder 6185 7061 6837 7385 6755
Hurt 16320 24429 16575 24619 23334
Rioting 150 168 151 183 203
Assault on Govt. Servants 1110 1213 683 1467 1345
Rape 1671 1739 1441 1519 1497
Kidnapping/Abduction 6364 7449 7036 7948 7712
Dacoity 1319 1607 1545 1824 1446
Robbery 7472 8311 8786 10567 11225
Burglary 9508 10274 8961 9927 8703
Motor Vehicles Theft 6549 7808 7968 9492 10386
Cattle Theft 5895 6992 11153 12577 8472
Ordinary Theft. 16173 18215 20262 25781 23437
Misc. n.e.s 165489 167203 179902 224039 235226
109
Source:- Deputy Inspector General of Police (Crimes) Punjab Lahore.
OffenceNo. of Cases Reported
CRIMES
Table 78:- Number of Reported Crimes by Type, The Punjab

Sl. No. District All
Reported Murder Attempted Murder Hurt Rioting
Assault on Govt. Servants
Rape
1 The Punjab 344925 5184 6755 23334 203 1345 1497
2 Bahawalpur 12020 91 182 747 9 35 1163 Bahawalnagar 7906 128 203 736 13 22 964 R.Y.Khan 10564 110 166 747 17 24 94
5 D.G.Khan 5639 66 112 441 3 13 336 Layyah 2717 27 26 241 0 14 247 Muzaffargarh 7883 117 135 845 1 15 688 Rajanpur 3320 93 79 295 0 25 20
9 Faisalabad 26389 495 487 2114 0 116 11610 Jhang 10933 211 204 1134 0 17 6511 T.T.Singh 5746 102 114 419 0 25 43
12 Gujranwala 16504 332 409 1145 0 188 6113 Gujrat 9156 216 366 452 83 25 1714 Hafizabad 4237 85 73 405 0 44 3715 Mandi Bahaud-Din 5576 96 104 447 0 32 2816 Narowal 3405 60 76 373 0 1 1317 Sialkot 12297 204 339 830 0 73 28
18 Lahore 70805 576 937 1232 0 103 4819 Kasur 10673 195 266 1008 0 10 5420 Nankana 7704 120 111 583 0 25 4121 Okara 11707 167 217 852 0 14 7422 Sheikhupura 9982 281 249 674 0 38 37
23 Multan 10834 130 146 771 0 62 5924 Khanewal 7006 100 148 799 0 30 3325 Lodhran 4891 58 65 317 1 31 2526 Pakpattan 5293 91 85 424 0 17 3627 Sahiwal 7258 137 132 686 0 17 4628 Vehari 9341 97 89 864 0 48 56
29 Rawalpindi 14862 240 391 950 58 83 2330 Attock 3568 88 91 263 3 23 331 Chakwal 2833 52 83 284 0 11 1132 Jhelum 3135 45 67 275 1 30 9
33 Sargodha 10224 193 307 1073 14 63 5134 Bhakkar 3580 39 69 168 0 31 1635 Khushab 2731 60 56 333 0 14 636 Mianwali 4206 82 171 407 0 26 10
110CRIMES
Table 79:- Number of Reported Crimes

Kidnapping/ Abduction Dacoity Robbery Burglary
Motor Vehicles
Theft
Cattle Theft
Ordinary Thefts Misc. Sl.
No.
7712 1446 11225 8703 10386 8472 23437 235226 1
460 12 168 532 260 529 1132 7747 2208 40 203 269 54 388 821 4725 3278 18 172 332 277 590 1085 6654 4
102 8 78 185 121 211 504 3762 580 12 44 97 39 63 327 1723 6
146 22 82 297 83 386 803 4883 790 16 20 144 26 217 346 1949 8
538 161 796 560 721 959 2226 17100 9310 44 203 300 56 511 817 7061 10111 31 135 136 64 130 505 3931 11
345 109 963 376 511 168 1091 10806 12213 19 302 144 245 113 431 6530 13123 21 96 85 25 221 304 2718 14179 16 113 122 44 210 381 3804 15
77 11 91 37 7 48 166 2445 16210 66 738 182 354 156 564 8553 17
1237 148 3748 1266 4391 171 3020 53928 18209 65 217 170 46 215 825 7393 19176 34 233 94 36 177 460 5614 20384 85 263 311 94 473 997 7776 21321 129 274 217 154 120 770 6718 22
326 79 494 572 740 191 938 6326 23196 35 163 188 87 244 575 4408 24137 18 98 119 52 149 361 3460 25
94 33 41 112 39 163 368 3790 26189 37 211 204 99 390 601 4509 27202 24 139 227 107 607 644 6237 28
247 48 402 506 1332 49 667 9866 2928 13 30 66 31 17 78 2834 3064 3 34 98 20 18 66 2089 3161 9 59 88 31 30 95 2335 32
163 64 490 352 189 416 641 6208 33101 4 40 112 28 62 465 2445 34
47 7 26 111 8 41 171 1851 3560 5 59 92 15 39 192 3048 36
Source:- Deputy Inspector General of Police (Crimes) Punjab Lahore.
CRIMES
The Punjab:2007
111

EXPLANATORY NOTESON
112
R d t
ONEDUCATION SECTION
This section contains annual data relating to Number, Enrolment and Teaching Staff of Educational Institutions, Participation Rates, Population Level of educational attainment and literacy ratio.
The name of the Educational Institutions and respondents are as under:-
Categor of Instit tions Respondents
I.
a) Mosque
b) Primary
c) Middle
Schools
The Data Processing cell of the defunctEducational Management Information System(EMIS) used to consolidate data with the help of35 district EMIS cells in the Punjab pertaining to
i iddl d i h S h l
Category of Institutions
d) High
II.a) Intermediateb) Degree Principals of the Colleges/Higher Secondary
Mosque, Primary, Middle and High Schools.Now the Project Monitoring Information Unit(PMIU) has taken over this responsibility.
Colleges
b) Degreec) Higher Secondary Schools (XI & XII
Classes) Schools
III. a) General
b) Engineering
Universities
Principals of the Colleges/Higher Secondary
) g g
c) Agriculture
d) Arid Agriculture
e) Health Sciences
f) Veterinary Sciences
g) Education
Registrars of the respective Universities
h) Technology
IV.a) Elementary Teacher's Training Colleges Principals of the Colleges/Institutes
b) Colleges of Education -do-
c) College of Education for Sciences -do-
Teacher's Training Institutes
c) College of Education for Sciences -do-
d) Physical Education Colleges -do-e) Vocational Teacher's Training Institute for
Women -do-
f) Technical Teacher's Training College -do-
g) Institute of Education & Research Director of the Institute

113
V.a) Institute of Public Health Principal of the College
b) Dentistry College -do-
c) Medical Colleges -do-
d) Medical Institutes Directors of the Institutes
e) Post Graduate Institute Dean of the Institute
Colleges for Medical Sciences
e) Post Graduate Institute Dean of the Institute
f) Homoeo Pathic Medical Colleges Principal of the College
g) Tibbia Colleges -do-
VI.
a) Commercial Training Institutes TEVTA
Commercial Institutes
b) Commerce Colleges Principals of the Colleges
VII. TEVTA
VIII.
a) Textile College Principal of the College
Engineering Institutions
Vocational Institutes
a) Textile College Principal of the Collegeb) Colleges of Technology/Polytechnic
Institutes TEVTA
IX.
a) Home Economics College Principal of the College
b) National College of Arts -do-
Other Institutions
c) Law Colleges Principals of the Colleges
d) Institute of Computer Sciences Principal of the College
1. Mosque/Primary School is an Institution comprising First to five Grades (I-V) of Educational System
Definitions of the various types of Institutions are given below:-
2.
3.4.
System.Middle School is an Institution comprising First to Eight Grades (I-VIII) of Educational System.High School is an Institution comprising First to Ten Grades (I-X) of Educational System.Higher Secondary School is an Institution comprising first to Twelve Grades (I-XII) ofEducational System. However some of the Schools run by PAF also offer 3rd and 4th yearclasses.
5.
6. Degree College is an Institution comprising Four/Six Grades (XI to XVI) of Educational System.
Intermediate College is an Institution comprising of Two Grades (XI & XII) of Educational System.

Total Boys Girls Total Boys Girls Total Boys Girls
1997-98 11889 11730 159 433 427 6 14307 14106 201
1998-99 11945 11739 206 438 424 14 12606 12205 401
1999-00 8229 8205 24 374 373 1 9085 9064 21
2000-01 8082 7985 97 348 344 4 8852 8733 119
2001-02 7863 7779 84 338 286 52 15452 15233 219
2002-03 7742 7658 84 342 290 52 16518 16293 225
2003-04 7400 7400 318 314 4 11996 11852 144
2004-05 7474 7361 113 372 303 69 11728 11594 134
2005-06 7289 7191 98 380 374 6 12060 11934 126
2006-07 5754 5681 73 343 339 4 10116 10031 85
1997-98 45220 22096 23124 3784 2207 1577 146257 77598 68659
1998-99 44884 21589 23295 4218 2430 1788 140782 75250 65532
1999-00 44175 21291 22884 4184 2494 1690 138169 74967 63202
2000-01 44068 21357 22711 4174 2419 1755 133183 71111 62072
2001-02 44172 21240 22932 4152 2363 1789 129051 67255 61796
2002-03 44253 21280 22973 4208 2394 1814 138084 71959 66125
2003-04 44185 21454 22731 4291 2413 1878 129618 69420 60198
2004-05 44176 21461 22715 4875 2670 2205 131975 70703 61272
2005-06 44313 21512 22801 5121 2763 2358 133476 71374 62102
2006-07 44687 21877 22810 5244 2844 2400 134993 72363 62630
Mosque Schools
Teaching Staff in Schools for (Number)Category/
Year
Primary Schools
Number of Schools for Enrolment (‘000') in Schools for
114EDUCATION
Table 80 :- Government Mosque, Primary, Middle and High Schools for Boys & Girls, Their Enrolment and Teaching Staff, The Punjab

Total Boys Girls Total Boys Girls Total Boys Girls
Middle Schools
1997-98 5496 2282 3214 1268 602 666 61028 27180 33848
1998-99 6018 2461 3557 1498 696 802 64767 28953 35814
1999-00 5974 2451 3523 1452 724 728 64608 29245 35363
2000-01 6227 2558 3669 1518 703 815 63277 28838 34439
2001-02 6579 2675 3904 1664 794 870 69335 29171 40164
2002-03 6875 2797 4078 1686 804 882 74186 31210 42976
2003-04 6801 2753 4048 1682 783 899 62616 28419 34197
2004-05 7196 2965 4231 1936 904 1032 65690 29882 35808
2005-06 7371 3020 4351 2170 1005 1165 67155 30589 36566
2006-07 7400 3048 4352 2230 1010 1220 68168 30972 37196
High Schools
1997-98 4451 2955 1496 2561 1605 956 95271 63040 32231
1998-99 4469 2947 1522 2622 1633 989 93950 61976 31974
1999-00 4425 2921 1504 2783 1744 1039 100472 66073 34399
2000-01 4430 2928 1502 2530 1573 957 96086 63024 33062
2001-02 4354 2884 1470 2515 1531 984 88355 57373 30982
2002-03 4464 2959 1505 2549 1551 998 94537 61388 33149
2003-04 4466 2924 1542 2667 1641 1026 83749 54029 29720
2004-05 4482 2929 1553 2789 1694 1095 83103 53520 29583
2005-06 4498 2938 1560 3000 1821 1179 83472 53717 29755
2006-07 4541 2932 1609 3063 1842 1221 84449 54078 30371
ii) For 2004-05 onwards, Project Monitoring Information Unit (PMIU) LahoreSource:- i) Upto 2003-04:- Educational Management Information System (EMIS) Punjab, Lahore.
Number of Schools for Enrolment ('000') in Schools for
EDUCATION
Category/ Year
115
Their Enrolment and Teaching Staff The Punjab-Concld .
Teaching Staff in Schools for (Number)
Table 80:- Government Mosque, Primary, Middle and High Schools for Boys & Girls,

116
NUMBER, ENROLMENT AND TEACHING STAFF OF SCHOOLS,THE PUNJAB : 2002-03 TO 2006-07
PRIMARYMOSQUE MIDDLE HIGH
‘ 000’ No. Lac No. ‘ 000’ No.
10880 120 360
63 6363 62 87
89
108302
297288 2976387
107296
60 90
120
270
360
40 60 180
20 30 90
0
-03
-04
-05
-06
-07
0
-03
-04
-05
-06
-07 0
-03
-04
-05
-06
-07
NUMBER ENROLMENT TEACHING STAFF
2002
-
2003
-
2004
-
2005
-
2006
-
2002
-
2003
-
2004
-
2005
-
2006
-
2002
2003
2004
2005
2006

Total Boys Girls Total Boys Girls
679165 284394 394771 754295 333183 421112
i) 457601 207842 249759 489735 219719 270016
a) Pre-Medical 58510 24404 34106 64377 24573 39804
b) Pre-Engineering 54355 43023 11332 61581 49439 12142
c) Computer Science 43026 23051 19975 48961 25173 23788
d) Humanities 274120 96389 177731 279593 94936 184657e) Commerce, Home
Economics/Others 27590 20975 6615 35223 25598 9625
ii) 202633 70479 132154 243999 106641 137358
a) B.Sc. 39469 19496 19973 35616 16308 19308
b) B.A. 144924 37813 107111 185574 74023 111551
c) Bc.S. 3513 1444 2069 4826 1872 2954
d) B.Com. 14727 11726 3001 17983 14438 3545
iii) 18931 6073 12858 20561 6823 13738
a) M.Sc. 5811 2302 3509 6855 3001 3854
b) M.A. 13120 3771 9349 13706 3822 9884
Total
10756
12023
11289
10945
11446
12182
14673
17150
13361
20561
393
536
1304
1563
760
699
800
789
4123
2005-06
2006-07 14875
13440
8461
2004-05 2910
23259158
11393 740
3596
2540
2064
7528063
8622
2130
1157
1348
16961999-00
1997-98 9206
98861998-99
9057
EDUCATION
Table 81 :- Enrolment in Arts & Science Intermediate, Degree Colleges and Higher Secondary Schools by Study Group and Sex The Punjab
( No.of Students )
Bahawalpur UniversityPunjab University Multan University
Total
Table 82:- Post -Graduate Enrolment in Affiliated Colleges, The Punjab( No.of Students)
Source:- Bureau of Statistics, Punjab, Lahore
Intermediate Classes
Post Graduate Classes
Degree Classes
117
Source :- Bureau of Statistics, Punjab, Lahore
Year
2000-01
2001-02
2002-03
2003-04
Study Group2005-06 2006-07

Total Boys Girls Total Boys Girls Total Boys Girls
1997-98 403 213 190 400 201 199 14926 8881 60451998-99 442 235 207 400 191 209 15369 8985 63841999-00 496 267 229 410 189 221 15876 9343 6533
2000-01 510 269 241 437 205 232 15817 9260 65572001-02 514 267 247 462 219 243 15168 8726 64422002-03 531 271 260 492 234 258 16248 9258 6990
2003-04 299 299 548 258 290 17371 9693 76782004-05 618 332 286 600 274 326 18421 10081 83402005-06 672 339 333 619 273 346 19131 10677 8454
2006-07 694 354 340 651 285 366 20049 11332 8717
1997-98 125 72 53 28 14 14 1807 1148 6591998-99 136 85 51 26 14 12 1961 1339 6221999-00 151 97 54 28 16 12 2134 1511 623
2000-01 149 90 59 29 16 13 2253 1573 6802001-02 149 89 60 31 18 13 2140 1497 6432002-03 156 92 64 32 19 13 2482 1740 742
2003-04 181 104 77 34 20 14 2934 1909 10252004-05 202 110 92 38 20 18 3207 1961 12462005-06 203 113 90 40 22 18 3419 2181 1238
2006-07 204 114 90 44 24 20 3591 2213 1378
1997-98 278 141 137 372 187 185 13119 7733 53861998-99 306 150 156 374 177 197 13408 7646 57621999-00 345 170 175 382 173 209 13742 7832 5910
2000-01 361 179 182 408 188 220 13564 7687 58772001-02 365 178 187 431 201 230 13028 7229 57992002-03 375 179 196 460 216 244 13766 7518 6248
2003-04 404 195 209 514 238 276 14437 7784 66532004-05 455 222 233 562 255 307 15214 8120 70942005-06 469 226 243 579 251 328 15712 8496 7216
2006-07 490 240 250 607 261 346 16458 9119 7339
Teaching Staff, The Punjab
Inter & Degree Colleges
118EDUCATIONTable 83:-Number of Arts & Science Colleges for Boys & Girls, Their Enrolment and
Source:- Bureau of Statistics, Punjab, Lahore
Inter Colleges
Degree Colleges
YearNumber Enrolment (‘000`) Teaching Staff

119
NUMBER, ENROLMENT AND TEACHING STAFF OF COLLEGESA 2002 03 O 2006 0THE PUNJAB : 2002-03 TO 2006-07
INTER COLLEGES HIGHER SECONDARY SCHOOLS DEGREE COLLEGES
NUMBER ‘ 000’ No. ‘ 00 ’ No.
11441162
1217
6771200 840 275
918
1012
677
599
658204
250
219237
241715
1000
600
720
840
220
275
538
600
800
480
600
165
400240
360
55
110
0
200
03 04 05 06 07
0
120
03 04 05 06 070
55
03 04 05 06 07
NUMBER ENROLMENT TEACHING STAFF
2002
-
2003
-
2004
-
2005
-
2006
-
2002
- 0
2003
-0
2004
-0
2005
-0
2006
-0
2002
-0
2003
-0
2004
-0
2005
-0
2006
-0

Total Boys Girls Total Boys Girls Total Boys Girls Total Boys Girls
1997-98 325 206 119 234 115 119 34 17 17 3621 2576 10451998-99 352 197 155 246 130 116 33 14 19 3742 2335 14071999-00 375 211 164 264 131 133 34 15 19 4051 2504 1547
2000-01 378 210 168 245 121 124 37 17 20 4505 2880 16252001-02 380 212 168 259 130 129 40 20 20 4279 2702 15772002-03 387 217 262 126 136 46 23 23 4222 2660 1562
2003-04 237 237 295 147 148 51 26 25 4630 2875 17552004-05 487 262 225 322 154 168 58 28 30 5277 3034 22432005-06 491 262 229 393 187 206 60 29 31 4959 2901 2058
2006-07 523 273 250 420 196 224 68 32 36 4863 2827 2036
Total Male Female Total Male Female
34 5170 3090 2080 246 105 141
12 590 434 156 133 110 23
3 233 165 68 28 8 202 143 114 29 11 4 7
2 236 166 70 31 9 22
112 9434 6363 3071 279 122 157
1 122 26 96 18 2 16
1 75 13 62 12 1 11
1 - - - 8 8 -Source:- Special Education Department, 31-Sher Shah Block, New Garden Town, Lahore
Teachers Training College for the Teachers of Blind
Teaching StaffNumber
Enrolment
Teaching Staff
170
In-service Teacher’s Training College for the Teachers of Disabled
Source:- i ) Bureau of Statistics, Punjab, Lahore (Except for Enrolment of I-X Classes.) ii) For Enrolment of I-X Classes:- i) Upto 2003-04 EMIS, Punjab Lahore.
ii) From 2004-05 onwards PMIU, Lahore
Degree College for Special Education
Special Education Centres (cater 4 disabilities)
Teachers Training College for the Teachers Hearing Impaired
120EDUCATION
Table 84:-Number of Higher Secondary Schools for Boys & Girls, Their Enrolment and Teaching Staff, The Punjab
Table 85:-Number Enrolment and Teaching Staff in the Special Education InstitutionsThe Punjab : As on 31st December, 2007
Schools for Visually Impaired
Schools for Mentally RetardedSchools for Physically Disabled
YearNumber
Enrolment (‘000`)
I-X Classes XI-XII Classes
Type of Institution
Schools for Hearing Impaired

Total Boys Girls Total Boys Girls Total Boys Girls
1997-98 3 3 - 14240 8024 6216 760 621 1391998-99 4 3 1 13500 7125 6375 684 540 1441999-00 4 3 1 16733 9046 7687 895 652 243
2000-01 4 3 1 18783 9750 9033 843 565 2782001-02 4 3 1 19618 10427 9191 870 607 2632002-03 8 6 2 30524 17563 12961 1753 1045 708
2003-04 8 6 39622 19774 19848 1720 1102 6182004-05 6 6 43397 22658 20739 2379 1535 8442005-06 8 6 2 49585 24143 25442 2679 1713 966
2006-07 8 6 2 61683 31002 30681 3565 2294 1271
1997-98 2 2 - 6555 6205 350 337 334 31998-99 2 2 - 6512 6141 371 308 304 41999-00 2 2 - 6975 6330 645 312 307 5
2000-01 2 2 - 8353 7697 656 317 317 -2001-02 2 2 - 8684 7957 727 340 340 -2002-03 2 2 - 7359 6167 1192 324 324 -
2003-04 2 2 - 8517 7313 1204 359 359 -2004-05 2 2 - 8356 7074 1282 398 359 392005-06 2 2 - 9987 8409 1578 538 460 78
2006-07 2 2 - 9003 7611 1392 617 527 90
1997-98 1 1 - 5051 4341 710 485 460 251998-99 1 1 - 5477 4622 855 423 402 211999-00 1 1 - 5709 4751 958 431 410 21
2000-01 1 1 - 6059 5029 1030 409 389 202001-02 1 1 - 6463 5299 1164 409 389 202002-03 1 1 - 6045 4646 1399 388 354 34
2003-04 1 1 - 6504 5010 1494 408 371 372004-05 1 1 - 6674 5143 1531 424 388 362005-06 1 1 - 5341 3593 1748 399 365 34
2006-07 1 1 - 8076 5986 2090 562 490 72
YearNumber
121EDUCATION
Table 86:- Number, Enrolment and Teaching Staff of Universities by Sex, The Punjab
Enrolment Teaching Staff
Engineering Universities
General Universities
Agricultural Universities
2
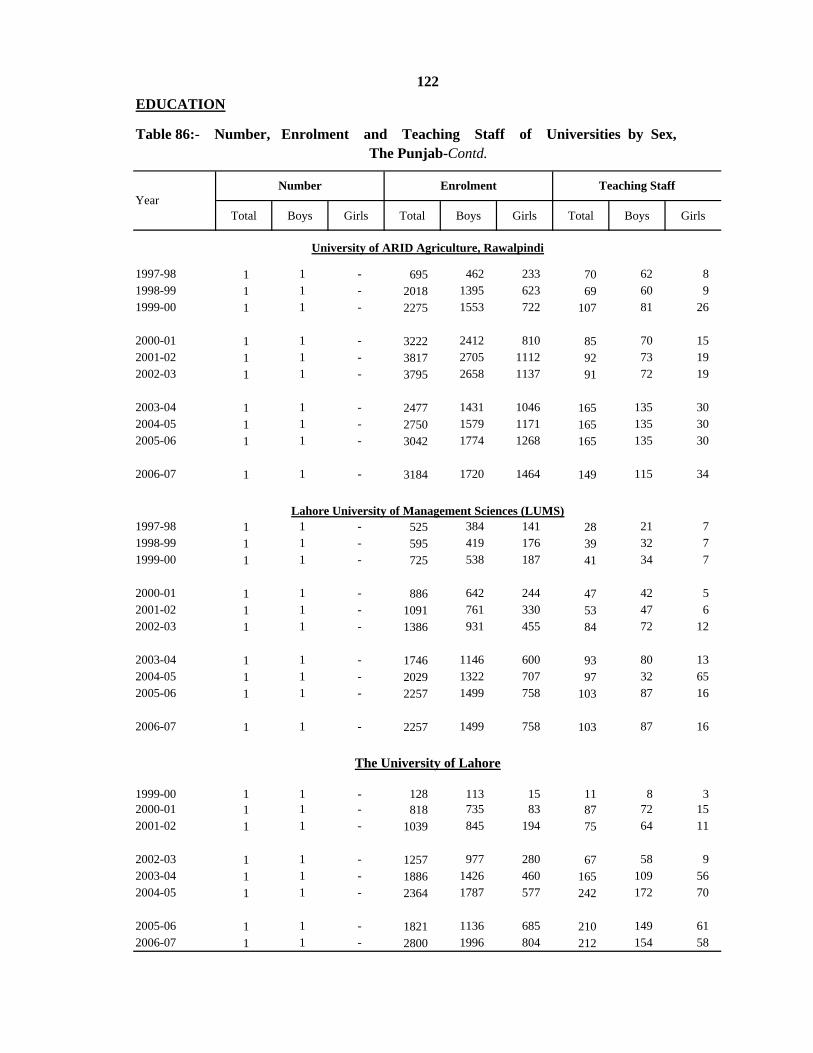
Total Boys Girls Total Boys Girls Total Boys Girls
1997-98 1 1 - 695 462 233 70 62 81998-99 1 1 - 2018 1395 623 69 60 91999-00 1 1 - 2275 1553 722 107 81 26
2000-01 1 1 - 3222 2412 810 85 70 152001-02 1 1 - 3817 2705 1112 92 73 192002-03 1 1 - 3795 2658 1137 91 72 19
2003-04 1 1 - 2477 1431 1046 165 135 302004-05 1 1 - 2750 1579 1171 165 135 302005-06 1 1 - 3042 1774 1268 165 135 30
2006-07 1 1 - 3184 1720 1464 149 115 34
1997-98 1 1 - 525 384 141 28 21 71998-99 1 1 - 595 419 176 39 32 71999-00 1 1 - 725 538 187 41 34 7
2000-01 1 1 - 886 642 244 47 42 52001-02 1 1 - 1091 761 330 53 47 62002-03 1 1 - 1386 931 455 84 72 12
2003-04 1 1 - 1746 1146 600 93 80 132004-05 1 1 - 2029 1322 707 97 32 652005-06 1 1 - 2257 1499 758 103 87 16
2006-07 1 1 - 2257 1499 758 103 87 16
1999-00 1 1 - 128 113 15 11 8 32000-01 1 1 - 818 735 83 87 72 152001-02 1 1 - 1039 845 194 75 64 11
2002-03 1 1 - 1257 977 280 67 58 92003-04 1 1 - 1886 1426 460 165 109 562004-05 1 1 - 2364 1787 577 242 172 70
2005-06 1 1 - 1821 1136 685 210 149 612006-07 1 1 - 2800 1996 804 212 154 58
The University of Lahore
Lahore University of Management Sciences (LUMS)
122EDUCATION
Table 86:- Number, Enrolment and Teaching Staff of Universities by Sex,
YearNumber Enrolment Teaching Staff
The Punjab-Contd.
University of ARID Agriculture, Rawalpindi

Year
2002-03 1 1 - 6846 3386 3460 856 639 2172003-04 1 1 - 6753 3426 3327 848 645 2032004-05 1 1 - 7031 3458 3573 894 686 208
2005-06 1 1 - 8082 3898 4184 1188 825 3632006-07 1 1 - 8557 3949 4608 1334 953 381
2002-03 1 1 - 586 544 42 53 50 32003-04 1 1 - 659 602 57 71 64 72004-05 1 1 - 690 616 74 87 74 13
2005-06 1 1 - 766 687 79 121 102 192006-07 1 1 - 1610 1516 94 160 132 28
2002-03 1 1 - 207 62 145 12 4 82003-04 1 1 - 325 90 235 26 12 142004-05 1 1 - 13106 3006 10100 220 180 40
2005-06 1 1 - 13373 2826 10547 220 180 402006-07 1 1 - 13373 2826 10547 220 180 40
2002-03 1 1 - 1820 1488 332 61 56 52003-04 1 1 - 2010 1670 340 70 61 92004-05 1 1 - 2500 2100 400 90 70 20
2005-06 1 1 - 2858 2245 613 171 146 252006-07 1 1 - 3386 2661 725 208 174 34
2002-03 1 1 - 206 147 59 48 28 202003-04 1 1 - 336 242 94 50 30 202004-05 1 1 - 747 490 257 47 32 15
2005-06 1 1 - 439 277 162 33 27 62006-07 1 1 - 620 391 229 55 47 8
2003-04 1 1 - 2478 2001 477 295 277 182004-05 1 1 - 2093 1712 381 74 64 102005-06 1 1 - 2075 1754 321 142 128 14
2006-07 1 1 - 2012 1591 421 102 90 12
123
University of Veterinary Sciences
University of Health Sciences
University of Education
University of Central Punjab
Gujranwala Institute of Future Technology (GIFT) University
University of Management & Technology Lahore
Teaching Staff
EDUCATION
Table 86:-Number, Enrolment and Teaching Staff of Universities by Sex, The Punjab - Contd.
EnrolmentNumber

Total Boys Girls Total Boys Girls Total Boys Girls
2003-04 1 1 - 2054 1458 596 73 64 92004-05 1 1 - 1424 795 629 115 93 222005-06 1 1 - 1527 884 643 59 51 8
2006-07 1 1 - 458 290 168 45 42 3
2003-04 1 1 - 304 288 16 65 61 42004-05 1 1 - 283 270 13 54 50 42005-06 1 1 - 335 312 23 54 52 2
2006-07 1 1 - 383 370 13 46 43 3
2003-04 1 1 - 368 299 69 60 49 112004-05 1 1 - 400 300 100 75 55 202005-06 1 1 - 191 152 39 42 39 3
2006-07 1 1 - 162 113 49 46 40 6
2004-05 1 1 - 127 109 18 14 13 12005-06 1 1 - 1144 986 158 70 60 102006-07 1 1 - 2058 1619 439 122 93 29
2004-05 1 1 - 675 626 49 39 32 72005-06 1 1 - 696 641 55 49 43 62006-07 1 1 - 716 652 64 42 38 4
2004-05 1 1 - 527 286 241 74 56 182005-06 1 1 - 938 656 282 142 87 552006-07 1 1 - 1189 761 428 231 127 104
2004-05 1 1 - 543 461 82 41 34 72005-06 1 1 - 452 390 62 37 30 72006-07 1 1 - 318 272 46 42 35 7
124EDUCATION
Table 86:-Number, Enrolment and Teaching Staff of Universities by Sex,
The Punjab - Concld.
Source:- Bureau of Statistics, Punjab, Lahore.
National Textile University, Faisalabad
University of South Asia, Lahore
The Minhaj University, Model Town, Lahore
Preston University, Faisalabad Campus
Foundation University, Rawalpindi
University Law Collage, Multan
The University of Faisalabad
YearNumber Enrolment Teaching Staff

Total Boys Girls Total Boys Girls Total Boys Girls
1997-98 19 15 4 13430 11979 1451 1104 1015 891998-99 19 15 4 13374 11915 1459 1098 1009 891999-00 19 15 4 13760 12681 1079 1140 1086 54
2000-01 20 16 4 13399 12158 1241 1139 1055 842001-02 20 16 4 11878 10847 1031 786 694 922002-03 20 16 4 12142 11057 1085 776 692 84
2003-04 23 19 4 15483 13826 1657 985 879 1062004-05 23 19 4 17711 16054 1657 1072 966 1062005-06 22 17 5 23391 21028 2363 1024 900 124
2006-07 23 18 5 27771 25459 2312 1076 954 122
1997-98 102 90 12 14437 13647 790 1169 1103 661998-99 102 90 12 13554 12910 644 1169 1103 661999-00 102 90 12 15018 14354 664 1178 1120 58
2000-01 102 90 12 15414 14721 693 1195 1127 682001-02 102 90 12 16429 15856 573 998 933 652002-03 102 90 12 17841 17156 685 985 925 60
2003-04 114 102 12 17473 16825 648 1342 1264 782004-05 114 102 12 31630 30433 1197 1551 1465 862005-06 115 103 12 38352 37155 1197 1549 1463 86
2006-07 117 106 11 44867 43210 1657 1522 1447 75
1997-98 111 13 98 8388 3400 4988 1073 390 6831998-99 113 13 100 7877 2822 5055 1408 723 6851999-00 100 (a) 100 4384 - 4384 688 - 688
2000-01 100 (a) 100 4394 - 4394 658 - 6582001-02 100 (a) 100 4536 - 4536 536 - 5362002-03 100 (a) 100 4721 - 4721 530 - 530
2003-04 111 (a) 111 5067 - 5067 557 - 5572004-05 111 (a) 111 7416 - 7416 620 - 6202005-06 113 (a) 113 13758 - 13758 671 - 671
2006-07 113 - 113 11802 - 11802 655 - 655
125
Vocational Institutes
Enrolment Teaching StaffYear
Number
EDUCATION
a) Renamed as Training Institutes/Apprenticeship Training Centres.
Table 87:- Number, Enrolment and Teaching Staff of Technical Institutes by SexThe Punjab
Colleges of Technology/Polytechnic Institutes
Commercial Training Institutes
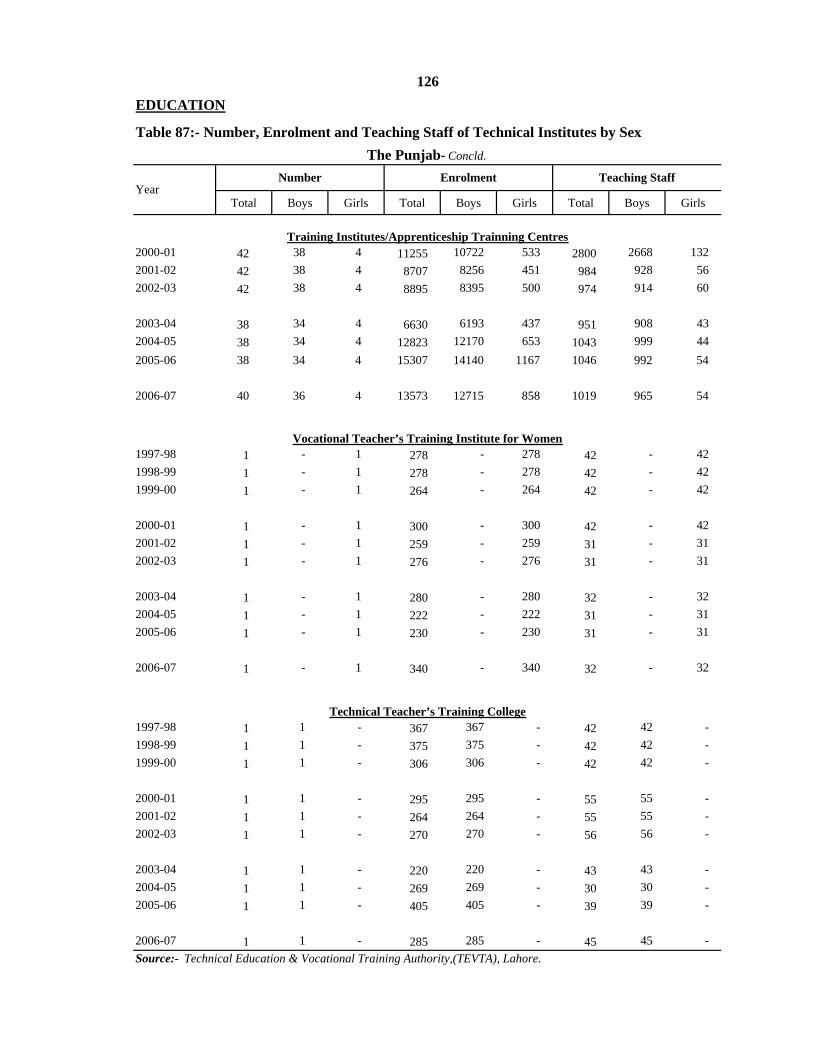
Total Boys Girls Total Boys Girls Total Boys Girls
2000-01 42 38 4 11255 10722 533 2800 2668 1322001-02 42 38 4 8707 8256 451 984 928 562002-03 42 38 4 8895 8395 500 974 914 60
2003-04 38 34 4 6630 6193 437 951 908 432004-05 38 34 4 12823 12170 653 1043 999 442005-06 38 34 4 15307 14140 1167 1046 992 54
2006-07 40 36 4 13573 12715 858 1019 965 54
1997-98 1 - 1 278 - 278 42 - 421998-99 1 - 1 278 - 278 42 - 421999-00 1 - 1 264 - 264 42 - 42
2000-01 1 - 1 300 - 300 42 - 422001-02 1 - 1 259 - 259 31 - 312002-03 1 - 1 276 - 276 31 - 31
2003-04 1 - 1 280 - 280 32 - 322004-05 1 - 1 222 - 222 31 - 312005-06 1 - 1 230 - 230 31 - 31
2006-07 1 - 1 340 - 340 32 - 32
1997-98 1 1 - 367 367 - 42 42 -1998-99 1 1 - 375 375 - 42 42 -1999-00 1 1 - 306 306 - 42 42 -
2000-01 1 1 - 295 295 - 55 55 -2001-02 1 1 - 264 264 - 55 55 -2002-03 1 1 - 270 270 - 56 56 -
2003-04 1 1 - 220 220 - 43 43 -2004-05 1 1 - 269 269 - 30 30 -2005-06 1 1 - 405 405 - 39 39 -
2006-07 1 1 - 285 285 - 45 45 -
Vocational Teacher’s Training Institute for Women
Technical Teacher’s Training College
Source:- Technical Education & Vocational Training Authority,(TEVTA), Lahore.
YearNumber Enrolment Teaching Staff
EDUCATION
Table 87:- Number, Enrolment and Teaching Staff of Technical Institutes by SexThe Punjab- Concld.
126
Training Institutes/Apprenticeship Trainning Centres

Total Male Female Total Male Female Total Male Female
1997-98 1 1 - 37 29 8 42 24 181998-99 1 1 - 139 130 9 40 22 181999-00 1 1 - 62 49 13 41 24 17
2000-01 1 1 - 137 130 7 38 17 212001-02 1 1 - 132 126 6 39 21 182002-03 1 1 - 130 121 9 39 19 20
2003-04 1 1 - 106 98 8 43 20 232004-05 1 1 - 121 112 9 46 24 222005-06 1 1 - 132 119 13 41 21 20
2006-07 1 1 - 148 132 16 48 22 26
1997-98 1 1 - 637 317 320 51 39 121998-99 1 1 - 532 222 310 52 37 151999-00 1 1 - 570 220 350 51 36 15
2000-01 1 1 - 506 194 312 49 35 142001-02 1 1 - 522 190 332 75 52 232002-03 1 1 - 647 266 381 53 36 17
2003-04 1 1 - 527 189 338 50 36 142004-05 2 2 - 575 217 358 18 14 42005-06 2 2 - 587 207 380 76 42 34
2006-07 2 2 - 643 236 407 40 31 9
1997-98 7 6 1 8754 3833 4921 1220 887 3331998-99 7 6 1 8795 4170 4625 1257 891 3661999-00 7 6 1 8613 3807 4806 1297 940 357
2000-01 7 6 1 8604 3671 4933 1197 837 3602001-02 8 7 1 9142 3877 5265 1152 791 3612002-03 9 8 1 9797 4107 5690 1307 893 414
2003-04 9 8 1 10116 4277 5839 1337 920 4172004-05 9 8 1 10137 4225 5912 1402 964 4382005-06 11 10 1 11434 4748 6686 1714 1122 592
2006-07 11 10 1 11235 4579 6656 1681 1083 598
YearNumber Enrolment Teaching Staff
EDUCATIONTable 88:- Number, Enrolment and Teaching Staff of Professional Colleges by Sex
The Punjab
Institute of Public Health
Dentistry Colleges (a)
Medical Colleges (b)
127

Total Male Female Total Male Female Total Male Female
1997-98 2 2 - 367 288 79 179 144 351998-99 2 2 - 295 237 58 190 145 451999-00 2 2 - 241 191 50 194 146 48
2000-01 2 2 - 248 178 70 178 141 372001-02 2 2 - 274 214 60 137 112 252002-03 2 2 - 290 220 70 154 116 38
2003-04 2 2 - 354 271 83 161 125 362004-05 2 2 - 372 288 84 136 115 212005-06 2 2 - 369 265 104 211 141 70
2006-07 2 2 - 405 272 133 178 133 45
1997-98 3 3 - 288 230 58 65 46 191998-99 3 3 - 280 223 57 66 46 201999-00 3 3 - 288 223 65 67 50 17
2000-01 3 3 - 287 219 68 66 50 162001-02 3 3 - 184 119 65 58 42 162002-03 3 3 - 343 268 75 64 46 18
2003-04 3 3 - 303 231 72 62 46 162004-05 3 3 - 319 243 76 64 49 152005-06 3 3 - 400 302 98 65 48 17
2006-07 3 3 - 410 350 60 54 39 15
1997-98 46 44 2 33254 31118 2136 976 930 461998-99 51 49 2 35926 33415 2511 1043 984 591999-00 53 52 1 33843 30706 3137 1070 991 79
2000-01 57 55 2 34745 31439 3306 1137 1044 932001-02 60 58 2 39431 35223 4208 1341 1174 1672002-03 63 61 2 40572 35338 5234 1595 1426 169
2003-04 70 68 2 42060 36310 5750 1670 1475 1952004-05 69 66 3 42154 36114 6040 1392 1234 1582005-06 75 72 3 53701 44546 9155 1893 1618 275
2006-07 86 82 4 56381 43731 12650 1906 1530 376
1997-98 62 60 2 20942 16603 4339 697 547 1501998-99 63 61 2 20063 15642 4421 714 546 1681999-00 65 63 2 18364 14099 4265 668 511 157
2000-01 77 75 2 18545 14185 4360 812 614 1982001-02 84 80 4 20950 15518 5432 883 640 2432002-03 88 84 4 20873 14722 6151 917 658 259
2003-04 89 85 4 19417 13912 5505 856 609 2472004-05 91 87 4 19961 14688 5273 931 656 2752005-06 97 93 4 19229 14057 5172 964 658 306
2006-07 97 93 4 19872 14478 5394 1025 662 363
YearNumber Enrolment Teaching Staff
The Punjab- Contd.Table 88:- Number, Enrolment and Teaching Staff of Professional Colleges by Sex
128
Post-Graduate Medical Institutes
Homeo-Pathic Medical Colleges
Commerce Colleges (c)
Medical Institutes
EDUCATION

Total Male Female Total Male Female Total Male Female
1997-98 21 21 - 5995 5774 221 253 239 141998-99 20 20 - 5830 5607 223 233 222 111999-00 18 18 - 5594 5407 187 228 220 8
2000-01 22 21 1 5960 5733 227 271 266 52001-02 22 21 1 5764 5486 278 280 272 82002-03 22 21 1 5708 5407 301 257 246 11
2003-04 23 22 1 5820 5450 370 280 263 172004-05 23 22 1 5317 4996 321 253 237 162005-06 23 22 1 5382 5006 376 276 259 17
2006-07 23 22 1 5248 4911 337 301 278 23
1997-98 8 5 3 3594 1400 2194 266 130 1361998-99 8 5 3 4006 1549 2457 313 159 1541999-00 8 5 3 3886 1365 2521 310 153 157
2000-01 8 5 3 3929 1326 2603 306 149 1572001-02 8 5 3 3700 1149 2551 289 136 1532002-03 8 5 3 3769 1109 2660 294 143 151
2003-04 8 5 3 4316 967 3349 303 145 1582004-05 8 5 3 5578 1746 3832 240 105 1352005-06 11 8 3 6306 2655 3651 340 201 139
2006-07 11 8 3 6017 2124 3893 256 102 154
1997-98 1 1 - 349 233 116 53 28 251998-99 1 1 - 337 202 135 53 26 271999-00 1 1 - 296 152 144 51 25 26
2000-01 1 1 - 380 156 224 45 23 222001-02 1 1 - 400 133 267 53 23 302002-03 1 1 - 455 138 317 46 26 20
2003-04 1 1 - 326 92 234 43 23 202004-05 1 1 - 354 96 258 35 19 162005-06 1 1 - 370 100 270 35 19 16
2006-07 1 1 - 714 205 509 20 12 8
1997-98 2 1 1 518 222 296 29 16 131998-99 2 1 1 514 214 300 29 17 121999-00 2 1 1 533 224 309 30 17 13
2000-01 2 1 1 492 177 315 32 21 112001-02 2 1 1 463 149 314 32 21 112002-03 2 1 1 324 110 214 32 21 11
2003-04 2 1 1 352 127 225 33 21 122004-05 2 1 1 324 122 202 34 21 132005-06 2 1 1 327 122 205 30 19 11
2006-07 2 1 1 342 112 230 31 19 12
Tibbia Colleges
Colleges of Education
Colleges of Education for Sciences
Physical Education Colleges
129EDUCATION
Table 88:- Number, Enrolment and Teaching Staff of Professional Colleges by SexThe Punjab- Contd.
YearNumber Enrolment Teaching Staff

Total Male Female Total Male Female Total Male Female
1997-98 1 - 1 1404 - 1404 87 - 871998-99 1 - 1 1431 - 1431 90 - 901999-00 1 - 1 1416 - 1416 89 - 89
2000-01 1 - 1 1413 - 1413 89 - 892001-02 1 - 1 1428 - 1428 91 - 912002-03 1 - 1 1369 - 1369 89 - 89
2003-04 1 - 1 1380 - 1380 88 - 882004-05 1 - 1 1452 - 1452 75 - 752005-06 1 - 1 1479 - 1479 93 - 93
2006-07 1 - 1 1525 - 1525 93 - 93
1997-98 24 24 - 10539 9477 1062 500 480 201998-99 25 25 - 10477 9231 1246 485 461 241999-00 29 29 - 11290 9860 1430 578 547 31
2000-01 29 29 - 13064 11608 1456 600 553 472001-02 32 32 - 12787 11314 1473 574 524 502002-03 34 34 - 13708 12208 1500 576 519 57
2003-04 36 36 - 14100 12460 1640 590 528 622004-05 36 36 - 16116 13521 2595 741 639 1022005-06 38 38 - 15920 13274 2646 702 598 104
2006-07 38 38 - 16581 14081 2500 756 619 137
1997-98 1 1 - 557 276 281 52 34 181998-99 1 1 - 576 286 290 57 46 111999-00 1 1 - 575 277 298 57 46 11
2000-01 1 1 - 590 289 301 57 47 102001-02 1 1 - 600 288 312 57 46 112002-03 1 1 - 825 390 435 57 44 13
2003-04 1 1 - 634 285 349 56 44 122004-05 1 1 - 680 300 380 56 44 122005-06 1 1 - 691 336 355 57 47 10
2006-07 1 1 - 674 326 348 57 41 16
Home Economics College
Law Colleges (d)
YearNumber Enrolment Teaching Staff
Table 88:- Number, Enrolment and Teaching Staff of Professional Colleges
by Sex, The Punjab- Contd.
130EDUCATION
National College of Arts

Total Male Female Total Male Female Total Male Female
1997-98 5 5 - 1339 1221 118 81 72 9
1998-99 8 8 - 2631 2299 332 159 142 17
1999-00 20 20 - 7508 6853 655 511 461 50
2000-01 28 28 - 9944 8894 1050 606 541 65
2001-02 35 34 1 9469 8295 1174 824 738 86
2002-03 37 36 1 11058 9836 1222 968 834 134
2003-04 47 46 1 11358 9973 1385 1070 925 145
2004-05 41 40 1 12130 10072 2058 1020 880 140
2005-06 50 49 1 17315 14554 2761 1040 844 196
2006-07 57 56 1 20230 16649 3581 1225 1005 220
1997-98 1 1 - 449 394 55 27 26 1
1998-99 1 1 - 391 351 40 25 25 -
1999-00 1 1 - 534 484 50 24 24 -
2000-01 1 1 - 431 395 36 29 27 2
2001-02 2 2 - 590 539 51 60 57 3
2002-03 2 2 - 652 594 58 61 58 3
2003-04 2 2 - 680 610 70 63 60 3
2004-05 2 2 - 675 626 49 39 32 7
2005-06 2 2 - 1022 907 115 56 45 11
2006-07 2 2 - 831 742 89 49 41 8
a)b)c)d)
Institutes of Computer Science
Textile Colleges
EDUCATIONTable 88:- Number, Enrolment and Teaching Staff of Professional Colleges
Source:- Bureau of Statistics, Punjab, Lahore.
by Sex, The Punjab- Concld.
Includes students of Dentistry at Nishtar Medical College, Multan and Lahore University.Excludes students of Dentistry at Nishtar Medical College, Multan and Lahore University.It includes private recognized Colleges.
YearNumber Enrolment Teaching Staff
It includes private Law Colleges.
131

Total Male Female Male Female Total Male Female
1997-98 34 25 9 9024 6642 2382 693 529 1641998-99 35 25 10 7105 4646 2459 618 469 1491999-00 35 25 10 6220 3484 2736 566 403 163
2000-01 35 25 10 2041 (a) 1614 427 627 458 1692001-02 35 25 10 1105 (a) 550 555 540 330 2102002-03 36 25 11 6528 2273 4255 558 414 144
2003-04 36 25 11 7466 1740 5726 600 360 2402004-05 36 25 11 10611 2665 7946 551 350 2012005-06 36 25 11 8860 2101 6759 551 370 181
2006-07 36 25 11 5420 1079 4341 483 290 193
1997-98 1 1 - 1501 832 669 52 38 14
1998-99 1 1 - 1592 863 729 47 35 12
1999-00 1 1 - 1283 658 625 44 32 12
2000-01 1 1 - 1519 714 805 40 31 9
2001-02 1 1 - 1421 535 886 46 31 15
2002-03 1 1 - 1421 535 886 46 31 15
2003-04 1 1 - 1707 734 973 52 36 16
2004-05 1 1 - 1579 454 1125 51 35 16
2005-06 1 1 - 1600 500 1100 81 53 28
2006-07 1 1 - 1244 360 884 65 44 21
132
EDUCATION
Table 89:- Number, Enrolment and Teaching Staff of Elementary Teacher’s TrainingColleges and Institute of Education and Research, The Punjab
Elementary Teacher’s Training Colleges
Institute of Education & Research (IER) University of the Punjab
a) Decrease is due to stopage of the admission in professional courses by the Government.Source:- Bureau of Statistics, Punjab, Lahore.
YearNumber Enrolment Teaching Staff
Total

District
THE PUNJAB 5754 342642 10116Bahawalpur 240 12171 340Bahawalnagar 207 11497 338R.Y.Khan 635 44293 1123
D. G. Khan 479 32438 1011Layyah 66 5259 141Muzaffargarh 340 29249 660Rajanpur 124 9258 228
Faisalabad 129 6508 195Jhang 313 14463 554T. T. Singh 88 4097 125
Gujranwala 72 4676 133Gujrat 171 7256 233Hafizabad 121 11074 296M. Baha-ud-din 87 4530 130Narowal 259 12569 414Sialkot 2 6932 326
Lahore 48 5241 148Kasur 92 4014 119Nankana 76 5187 180Okara 109 7847 201Sheikhupura 84 6621 198
Multan 219 11819 280Khanewal 212 12079 350Lodhran 83 4909 122Pakpattan 133 8450 201Sahiwal 78 3552 114Vehari 177 9251 289
Rawalpindi 100 3346 112Attock 34 1338 34Chakwal 52 1567 69Jhelum 100 3713 184
Sargodha 191 8332 307Bhakkar 305 15941 472Khushab 166 6325 247Mianwali 162 6840 242
by District, The Punjab: 2006-07Number Enrolment Teaching Staff
133
Source: PMIU, Lahore.
EDUCATIONTable 90:-Number of Govt.Mosque Schools, Their Enrolment and Teaching Staff

Total Boys Girls Total Boys Girls Total Boys Girls
THE PUNJAB 44687 21877 22810 5244521 2844362 2400159 134993 72363 62630
Bahawalpur 1695 923 772 167990 98323 69667 4636 2561 2075Bahawalnagar 1955 998 957 195594 113318 82276 5094 2696 2398R.Y.Khan 2468 1164 1304 277877 159023 118854 6073 3141 2932
D. G. Khan 1397 735 662 183359 98917 84442 4303 2378 1925Layyah 1219 693 526 123556 71137 52419 3148 1797 1351Muzaffargarh 1552 727 825 239326 134961 104365 4596 2520 2076Rajanpur 1010 561 449 120011 68592 51419 2912 1672 1240
Faisalabad 1891 1040 851 289379 168211 121168 7093 4257 2836Jhang 2543 1039 1504 239461 122766 116695 6693 3300 3393T. T. Singh 944 530 414 135351 80403 54948 3516 2091 1425
Gujranwala 1500 737 763 181680 94251 87429 4963 2732 2231Gujrat 1280 593 687 142886 67830 75056 4085 1956 2129Hafizabad 673 318 355 72659 39023 33636 1601 878 723M. Baha-ud-din 715 373 342 97830 54633 43197 2248 1261 987Narowal 1251 480 771 138984 62754 76230 4158 2028 2130Sialkot 2059 889 1170 197992 95832 102160 5805 2796 3009
Lahore 822 441 381 152226 87869 64357 3855 2174 1681Kasur 1291 685 606 176240 95702 80538 4123 2364 1759Nankana 997 583 414 101808 61557 40251 3001 1819 1182Okara 1202 602 600 166643 98889 67754 3760 2199 1561Sheikhupura 1067 597 470 119399 67825 51574 3194 1941 1253
Multan 1262 482 780 169538 79845 89693 4235 1958 2277Khanewal 1098 526 572 166113 92294 73819 3900 2170 1730Lodhran 668 267 401 94400 47500 46900 1967 972 995Pakpattan 702 382 320 104637 61938 42699 2043 1241 802Sahiwal 860 468 392 128351 71318 57033 2818 1612 1206Vehari 1132 591 541 165591 95505 70086 3662 2132 1530
Rawalpindi 1747 776 971 135854 62851 73003 5544 2568 2976Attock 963 462 501 95414 46039 49375 2897 1402 1495Chakwal 906 453 453 69264 33204 36060 2520 1228 1292Jhelum 773 359 414 69709 33057 36652 2300 1179 1121
Sargodha 1824 950 874 208249 113770 94479 5816 3090 2726Bhakkar 1114 476 638 123460 62216 61244 2781 1322 1459Khushab 831 482 349 81252 48339 32913 2388 1431 957Mianwali 1276 495 781 112438 54670 57768 3265 1497 1768
District
Number Enrolment Teaching Staff
Table 91:-Number of Govt. Primary Schools for Boys and Girls, Their Enrolment and Teaching Staff by District, The Punjab: 2006-07
EDUCATION134
Source: PMIU, Lahore.

Total Boys Girls Total Boys Girls Total Boys Girls
THE PUNJAB 7400 3048 4352 2230415 1010290 1220125 68168 30972 37196
Bahawalpur 225 88 137 54953 23910 31043 1960 889 1071Bahawalnagar 344 131 213 71631 32495 39136 2715 1116 1599R. Y. Khan 305 147 158 90624 49858 40766 2610 1371 1239
D. G. Khan 135 89 46 39556 26247 13309 1313 917 396Layyah 207 87 120 45358 24190 21168 1701 841 860Muzaffargarh 185 90 95 59423 33651 25772 1542 836 706Rajanpur 64 38 26 16893 12565 4328 579 370 209
Faisalabad 438 129 309 161479 53372 108107 4253 1450 2803Jhang 264 127 137 74057 39725 34332 2325 1183 1142T. T. Singh 288 89 199 84306 30438 53868 2583 911 1672
Gujranwala 273 115 158 98655 42314 56341 2982 1414 1568Gujrat 207 72 135 58027 19758 38269 1781 646 1135Hafizabad 84 23 61 22886 8291 14595 702 246 456M. Baha-ud-din 140 49 91 49350 17835 31515 1259 518 741Narowal 159 68 91 49100 23966 25134 1566 747 819Sialkot 258 85 173 77189 32232 44957 2482 1071 1411
Lahore 186 78 108 85523 34312 51211 2461 922 1539Kasur 239 103 136 89858 40696 49162 2328 1152 1176Nankana 157 65 92 44176 20928 23248 1542 710 832Okara 247 92 155 79381 33963 45418 2103 921 1182Sheikhupura 157 62 95 54394 21145 33249 1482 629 853
Multan 192 85 107 73985 33196 40789 2168 942 1226Khanewal 293 123 170 95223 47143 48080 2709 1323 1386Lodhran 138 59 79 38222 19237 18985 1081 506 575Pakpattan 126 54 72 41191 20870 20321 1016 534 482Sahiwal 268 94 174 84242 33968 50274 2389 926 1463Vehari 252 86 166 78342 32263 46079 2250 930 1320
Rawalpindi 287 135 152 61891 28903 32988 2655 1312 1343Attock 166 83 83 42115 21000 21115 1387 655 732Chakwal 215 88 127 50187 21038 29149 1869 809 1060Jhelum 135 62 73 37944 17682 20262 1221 624 597
Sargodha 340 115 225 99288 39219 60069 3277 1226 2051Bhakkar 144 76 68 41434 23975 17459 1250 702 548Khushab 118 65 53 30858 17667 13191 1107 654 453Mianwali 164 96 68 48674 32238 16436 1520 969 551
DistrictNumber Enrolment Teaching Staff
EDUCATIONTable 92:-Number of Govt. Middle Schools for Boys and Girls, their Enrolment and Teaching
Staff By District, The Punjab: 2006-07
Source: PMIU, Lahore.
135
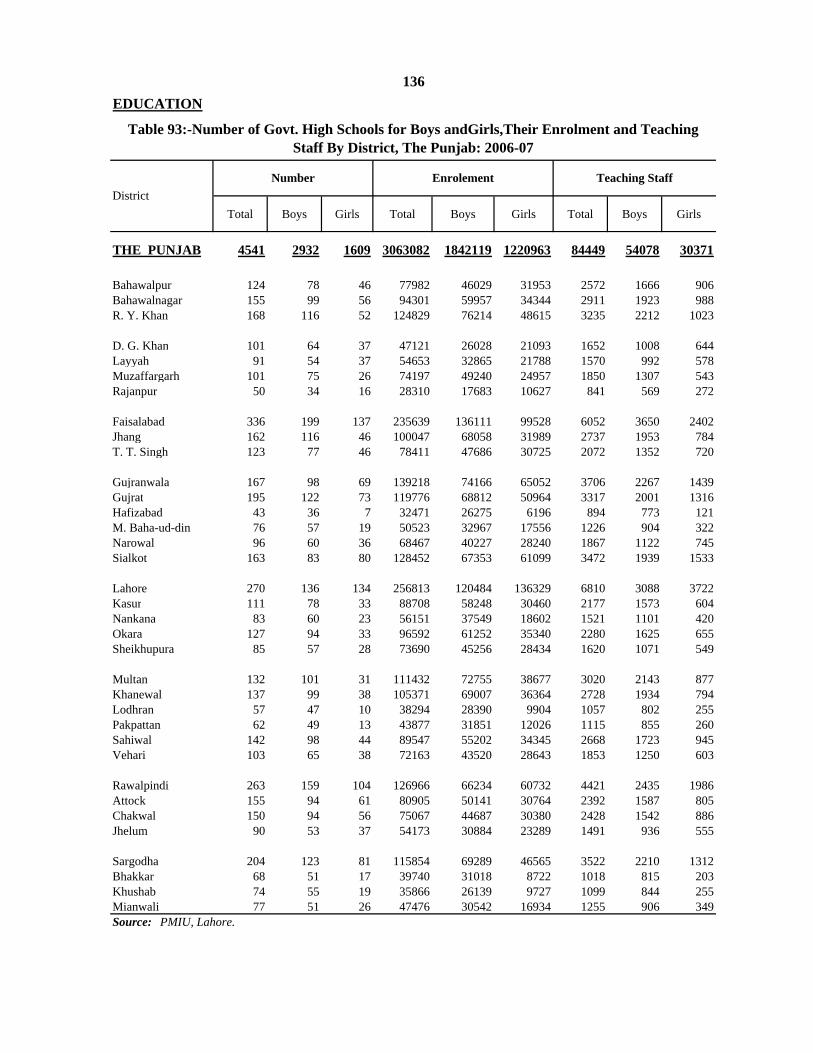
Total Boys Girls Total Boys Girls Total Boys Girls
THE PUNJAB 4541 2932 1609 3063082 1842119 1220963 84449 54078 30371
Bahawalpur 124 78 46 77982 46029 31953 2572 1666 906Bahawalnagar 155 99 56 94301 59957 34344 2911 1923 988R. Y. Khan 168 116 52 124829 76214 48615 3235 2212 1023
D. G. Khan 101 64 37 47121 26028 21093 1652 1008 644Layyah 91 54 37 54653 32865 21788 1570 992 578Muzaffargarh 101 75 26 74197 49240 24957 1850 1307 543Rajanpur 50 34 16 28310 17683 10627 841 569 272
Faisalabad 336 199 137 235639 136111 99528 6052 3650 2402Jhang 162 116 46 100047 68058 31989 2737 1953 784T. T. Singh 123 77 46 78411 47686 30725 2072 1352 720
Gujranwala 167 98 69 139218 74166 65052 3706 2267 1439Gujrat 195 122 73 119776 68812 50964 3317 2001 1316Hafizabad 43 36 7 32471 26275 6196 894 773 121M. Baha-ud-din 76 57 19 50523 32967 17556 1226 904 322Narowal 96 60 36 68467 40227 28240 1867 1122 745Sialkot 163 83 80 128452 67353 61099 3472 1939 1533
Lahore 270 136 134 256813 120484 136329 6810 3088 3722Kasur 111 78 33 88708 58248 30460 2177 1573 604Nankana 83 60 23 56151 37549 18602 1521 1101 420Okara 127 94 33 96592 61252 35340 2280 1625 655Sheikhupura 85 57 28 73690 45256 28434 1620 1071 549
Multan 132 101 31 111432 72755 38677 3020 2143 877Khanewal 137 99 38 105371 69007 36364 2728 1934 794Lodhran 57 47 10 38294 28390 9904 1057 802 255Pakpattan 62 49 13 43877 31851 12026 1115 855 260Sahiwal 142 98 44 89547 55202 34345 2668 1723 945Vehari 103 65 38 72163 43520 28643 1853 1250 603
Rawalpindi 263 159 104 126966 66234 60732 4421 2435 1986Attock 155 94 61 80905 50141 30764 2392 1587 805Chakwal 150 94 56 75067 44687 30380 2428 1542 886Jhelum 90 53 37 54173 30884 23289 1491 936 555
Sargodha 204 123 81 115854 69289 46565 3522 2210 1312Bhakkar 68 51 17 39740 31018 8722 1018 815 203Khushab 74 55 19 35866 26139 9727 1099 844 255Mianwali 77 51 26 47476 30542 16934 1255 906 349
DistrictNumber Enrolement Teaching Staff
EDUCATION
Table 93:-Number of Govt. High Schools for Boys andGirls,Their Enrolment and Teaching Staff By District, The Punjab: 2006-07
136
Source: PMIU, Lahore.

Baha-walpur
D.G. Khan
Faisal-abad
Gujran-wala Lahore Multan Rawal-
pindiSargo-
dha
Total 787290 53655 41968 98820 152982 183875 99485 99071 57434
Boys 447337 31690 27850 56480 76421 102562 60618 55193 36523
Girls 339953 21965 14118 42340 76561 81313 38867 43878 20911
Total 387802 28963 19672 54168 73724 90816 43940 48203 28316
Boys 196433 15652 12874 27554 32073 43923 24685 23080 16592
Girls 191369 13311 6798 26614 41651 46893 19255 25123 11724
Total 367630 30541 28450 43236 58143 82685 50488 45075 29012
Boys 255128 21476 21317 30660 39552 52844 36179 31456 21644
Girls 112502 9065 7133 12576 18591 29841 14309 13619 7368
Total 229443 20088 16453 30587 36000 53602 29019 25832 17862
Boys 145818 12978 11836 20224 22235 30554 19347 16247 12397
Girls 83625 7110 4617 10363 13765 23048 9672 9585 5465
Total 419660 23114 13518 55584 94839 101190 48997 53996 28422
Boys 192209 10214 6533 25820 36869 49718 24439 23737 14879
Girls 227451 12900 6985 29764 57970 51472 24558 30259 13543
Total 158359 8875 3219 23581 37724 37214 14921 22371 10454
Boys 50615 2674 1038 7330 9838 13369 5338 6833 4195
Girls 107744 6201 2181 16251 27886 23845 9583 15538 6259
Source:- Compiled by the Bureau of Statistics, Punjab, Lahore from the Gazette Notifications issued by the Concerned Boards of Intermediate and Secondary Education in the Punjab.
ALL GROUPS
Table 94:- Board-wise Number of Students Appeared and Passed by Study Group and Sex in Secondary School Certificate Examination
The Punjab: 2007 (Annual)
Name of the Board of Intermediate and Secondary Education The Punjab (Total)
Sex
SCIENCE GROUP
137
GENERAL GROUP
APPEARED
PASSED
PASSED
APPEARED
PASSED
APPEARED
EDUCATION

A+ A B C D E Others
The Punjab / All Types /Groups Total 387787 29320 54769 98782 132638 68174 4075 29
Boys 196482 14792 25774 45873 67582 39777 2668 16
Girls 191305 14528 28995 52909 65056 28397 1407 13
Science Group Total 230157 27808 43316 62371 68566 27219 860 17Boys 145535 14680 23921 38219 46771 21168 763 13
Girls 84622 13128 19395 24152 21795 6051 97 4
General Group Total 157630 11453 36411 64072 40955 3215 12Boys 50947 1853 7654 20811 18609 1905 3
Girls 106683 112 9600 28757 43261 22346 1310 9
Regular Students Total 285410 27253 48484 80201 94287 34462 722 1Boys 147185 13945 23725 39054 49722 20344 395 -
Girls 138225 13308 24759 41147 44565 14118 327 1
Science Group Total 199553 26163 40469 56333 57822 18608 158 0Boys 125466 13892 22506 34858 39640 14437 133 -
Girls 74087 12271 17963 21475 18182 4171 25 -
General Group Total 85857 1090 8015 23868 36465 15854 564 1Boys 21719 53 1219 4196 10082 5907 262 -
Girls 64138 1037 6796 19672 26383 9947 302 1
Private Students Total 102377 2067 6285 18581 38351 33712 3353 28Boys 49297 847 2049 6819 17860 19433 2273 16
Girls 53080 1220 4236 11762 20491 14279 1080 12
Science Group Total 30604 1645 2847 6038 10744 8611 702 17Boys 20069 788 1415 3361 7131 6731 630 13
Girls 10535 857 1432 2677 3613 1880 72 4
General Group Total 71773 422 3438 12543 27607 25101 2651 11Boys 29228 59 634 3458 10729 12702 1643 3
Girls 42545 363 2804 9085 16878 12399 1008 8
138
Source:- Compiled by the Bureau of Statistics, Punjab, Lahore from the Gazette Notifications issued by the Concerned Boards of Intermediate and Secondary Education in the Punjab.
EDUCATION
Table 95:- Number of Regular and Private Students Passed by Study Group, Sex & Grade in Eight Boards of Intermediate and Secondary Education, in Secondary
School Certificate Examination, The Punjab : 2007 (Annual)
The Punjab/All Types/Groups
No. Of Student by Sex
112
No. of Students Passed
Grades Acquired
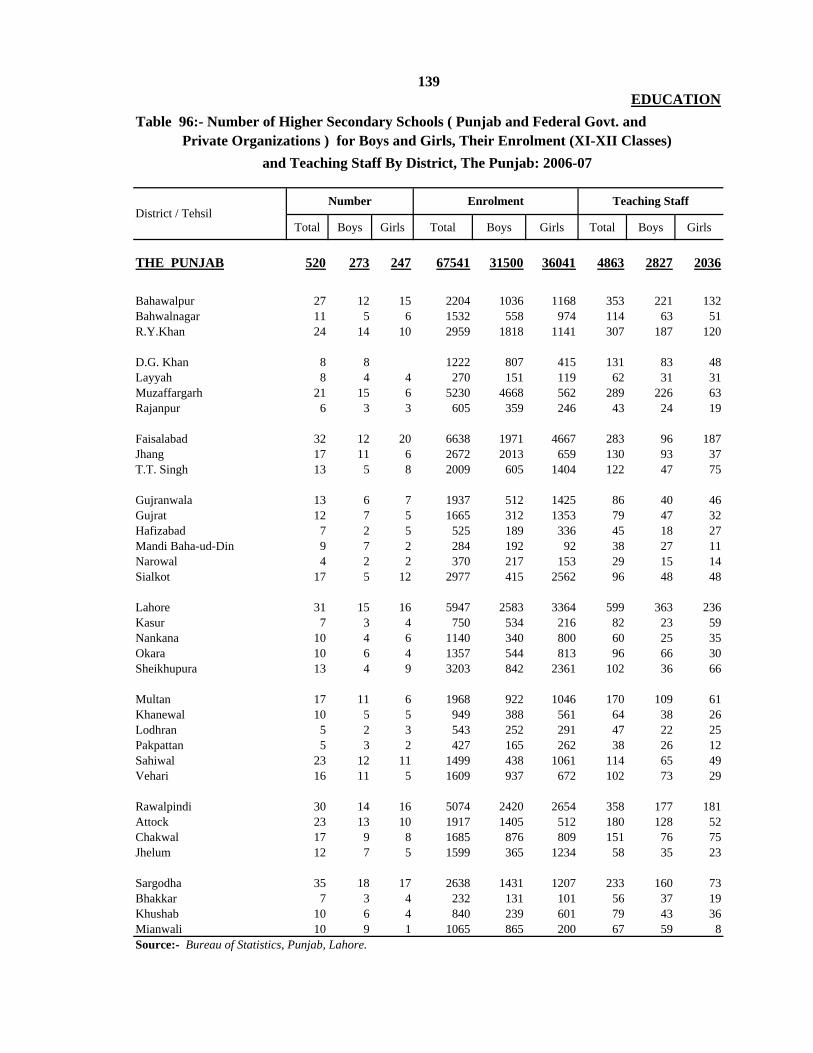
Total Boys Girls Total Boys Girls Total Boys Girls
THE PUNJAB 520 273 247 67541 31500 36041 4863 2827 2036
Bahawalpur 27 12 15 2204 1036 1168 353 221 132Bahwalnagar 11 5 6 1532 558 974 114 63 51R.Y.Khan 24 14 10 2959 1818 1141 307 187 120
D.G. Khan 8 8 1222 807 415 131 83 48Layyah 8 4 4 270 151 119 62 31 31Muzaffargarh 21 15 6 5230 4668 562 289 226 63Rajanpur 6 3 3 605 359 246 43 24 19
Faisalabad 32 12 20 6638 1971 4667 283 96 187Jhang 17 11 6 2672 2013 659 130 93 37T.T. Singh 13 5 8 2009 605 1404 122 47 75
Gujranwala 13 6 7 1937 512 1425 86 40 46Gujrat 12 7 5 1665 312 1353 79 47 32Hafizabad 7 2 5 525 189 336 45 18 27Mandi Baha-ud-Din 9 7 2 284 192 92 38 27 11Narowal 4 2 2 370 217 153 29 15 14Sialkot 17 5 12 2977 415 2562 96 48 48
Lahore 31 15 16 5947 2583 3364 599 363 236Kasur 7 3 4 750 534 216 82 23 59Nankana 10 4 6 1140 340 800 60 25 35Okara 10 6 4 1357 544 813 96 66 30Sheikhupura 13 4 9 3203 842 2361 102 36 66
Multan 17 11 6 1968 922 1046 170 109 61Khanewal 10 5 5 949 388 561 64 38 26Lodhran 5 2 3 543 252 291 47 22 25Pakpattan 5 3 2 427 165 262 38 26 12Sahiwal 23 12 11 1499 438 1061 114 65 49Vehari 16 11 5 1609 937 672 102 73 29
Rawalpindi 30 14 16 5074 2420 2654 358 177 181Attock 23 13 10 1917 1405 512 180 128 52Chakwal 17 9 8 1685 876 809 151 76 75Jhelum 12 7 5 1599 365 1234 58 35 23
Sargodha 35 18 17 2638 1431 1207 233 160 73Bhakkar 7 3 4 232 131 101 56 37 19Khushab 10 6 4 840 239 601 79 43 36Mianwali 10 9 1 1065 865 200 67 59 8Source:- Bureau of Statistics, Punjab, Lahore.
139
District / TehsilNumber Enrolment Teaching Staff
and Teaching Staff By District, The Punjab: 2006-07
EDUCATIONTable 96:- Number of Higher Secondary Schools ( Punjab and Federal Govt. and
Private Organizations ) for Boys and Girls, Their Enrolment (XI-XII Classes)
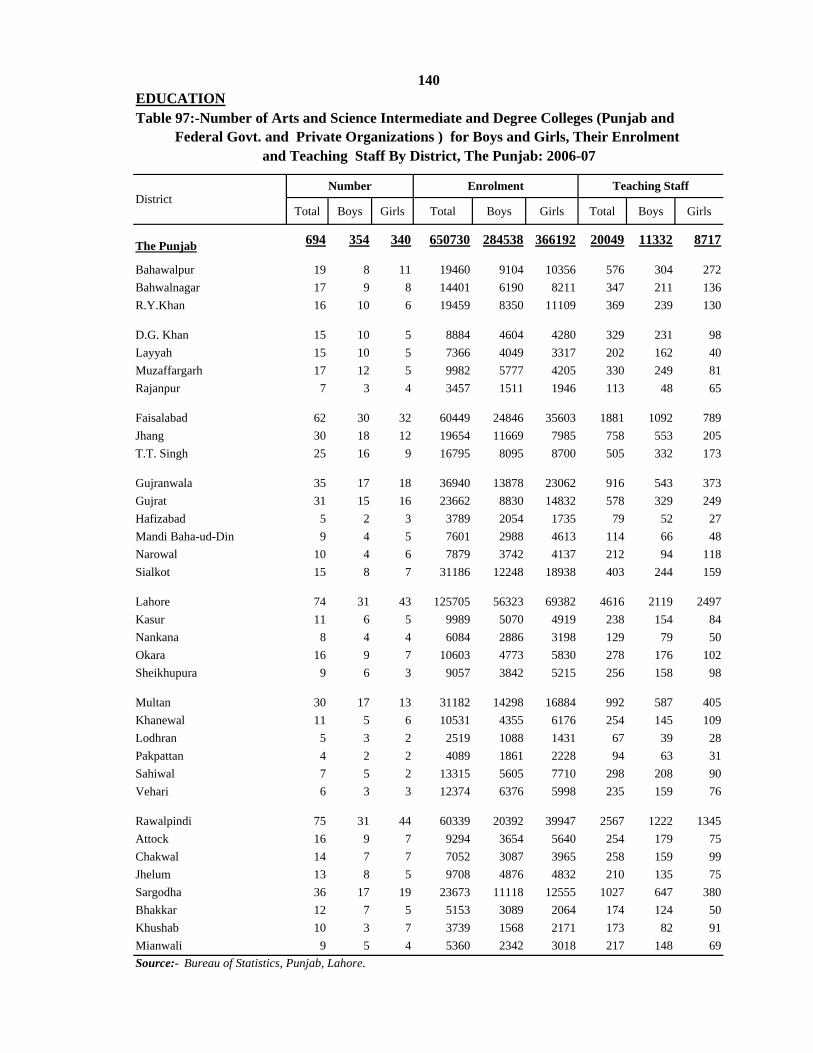
Total Boys Girls Total Boys Girls Total Boys Girls
The Punjab 694 354 340 650730 284538 366192 20049 11332 8717
Bahawalpur 19 8 11 19460 9104 10356 576 304 272Bahwalnagar 17 9 8 14401 6190 8211 347 211 136R.Y.Khan 16 10 6 19459 8350 11109 369 239 130
D.G. Khan 15 10 5 8884 4604 4280 329 231 98Layyah 15 10 5 7366 4049 3317 202 162 40Muzaffargarh 17 12 5 9982 5777 4205 330 249 81Rajanpur 7 3 4 3457 1511 1946 113 48 65
Faisalabad 62 30 32 60449 24846 35603 1881 1092 789Jhang 30 18 12 19654 11669 7985 758 553 205T.T. Singh 25 16 9 16795 8095 8700 505 332 173
Gujranwala 35 17 18 36940 13878 23062 916 543 373Gujrat 31 15 16 23662 8830 14832 578 329 249Hafizabad 5 2 3 3789 2054 1735 79 52 27Mandi Baha-ud-Din 9 4 5 7601 2988 4613 114 66 48Narowal 10 4 6 7879 3742 4137 212 94 118Sialkot 15 8 7 31186 12248 18938 403 244 159
Lahore 74 31 43 125705 56323 69382 4616 2119 2497Kasur 11 6 5 9989 5070 4919 238 154 84Nankana 8 4 4 6084 2886 3198 129 79 50Okara 16 9 7 10603 4773 5830 278 176 102Sheikhupura 9 6 3 9057 3842 5215 256 158 98
Multan 30 17 13 31182 14298 16884 992 587 405Khanewal 11 5 6 10531 4355 6176 254 145 109Lodhran 5 3 2 2519 1088 1431 67 39 28Pakpattan 4 2 2 4089 1861 2228 94 63 31Sahiwal 7 5 2 13315 5605 7710 298 208 90Vehari 6 3 3 12374 6376 5998 235 159 76
Rawalpindi 75 31 44 60339 20392 39947 2567 1222 1345Attock 16 9 7 9294 3654 5640 254 179 75Chakwal 14 7 7 7052 3087 3965 258 159 99Jhelum 13 8 5 9708 4876 4832 210 135 75Sargodha 36 17 19 23673 11118 12555 1027 647 380Bhakkar 12 7 5 5153 3089 2064 174 124 50Khushab 10 3 7 3739 1568 2171 173 82 91Mianwali 9 5 4 5360 2342 3018 217 148 69
District
EDUCATIONTable 97:-Number of Arts and Science Intermediate and Degree Colleges (Punjab and
Federal Govt. and Private Organizations ) for Boys and Girls, Their Enrolment and Teaching Staff By District, The Punjab: 2006-07
Number Enrolment Teaching Staff
Source:- Bureau of Statistics, Punjab, Lahore.
140

Total Boys Girls Total Boys Girls Total Boys Girls
THE PUNJAB 204 114 90 43753 23899 19854 3591 2213 1378
Bahawalpur 1 1 - 61 61 - 22 22 -Bahawalnagar 5 3 2 614 346 268 56 31 25R. Y. Khan 1 1 - 155 155 - 10 10 -
D.G. Khan 7 6 1 1218 1175 43 108 96 12Layyah 3 3 - 217 217 - 39 39 -Muzaffargarh 5 4 1 989 773 216 69 58 11Rajanpur 2 - 2 340 - 340 39 - 39
Faisalabad 22 9 13 3727 1111 2616 347 141 206Jhang 17 11 6 3645 2896 749 345 276 69T.T. Singh 11 9 2 1590 1226 364 154 120 34
Gujranwala 15 10 5 3945 3145 800 220 171 49Gujrat 8 5 3 1174 491 683 80 55 25Hafizabad 1 - 1 51 - 51 13 - 13M. Baha-ud-Din 5 2 3 1165 327 838 24 12 12Narowal - - - - - - - - -Sialkot 3 2 1 622 308 314 35 21 14
Lahore 15 5 10 4754 996 3758 276 85 191Kasur 1 1 - 241 241 - 16 16 -Nankana 3 2 1 932 849 83 45 31 14Okara 1 1 - 108 108 - 8 8 -Sheikhupura 4 2 2 741 448 293 59 31 28
Multan 6 3 3 1332 606 726 109 57 52Khanewal - - - - - - - - -Lodhran 1 1 - 262 262 - 8 8 -Pakpattan - - - - - - - - -Sahiwal - - - - - - - - -Vehari - - - - - - - - -
Rawalpindi 29 15 14 9730 4709 5021 1038 638 400Attock 6 3 3 1311 548 763 89 75 14Chakwal 6 3 3 492 218 274 70 38 32Jhelum 5 3 2 1452 1202 250 62 46 16
Sargodha 9 5 4 1206 724 482 114 77 37Bhakkar 5 3 2 539 381 158 50 29 21Khushab 4 - 4 469 - 469 57 - 57Mianwali 3 1 2 671 376 295 29 22 7
Number
141
Enrolment and Teaching Staff by District, The Punjab: 2006-07
District Enrolment Teaching Staff
EDUCATIONTable 98:-Number of Arts and Science Intermediate Colleges (Punjab and Federal
Govt. and Private Organizations ) for Boys and Girls, Their
Source:- Bureau of Statistics, Punjab, Lahore.

Total Boys Girls Total Boys Girls Total Boys Girls
THE PUNJAB 490 240 250 606977 260639 346338 16458 9119 7339
Bahawalpur 18 7 11 19399 9043 10356 554 282 272Bahawalnagar 12 6 6 13787 5844 7943 291 180 111R.Y. Khan 15 9 6 19304 8195 11109 359 229 130
D.G. Khan 8 4 4 7666 3429 4237 221 135 86Layyah 12 7 5 7149 3832 3317 163 123 40Muzaffargarh 12 8 4 8993 5004 3989 261 191 70Rajanpur 5 3 2 3117 1511 1606 74 48 26
Faisalabad 40 21 19 56722 23735 32987 1534 951 583Jhang 13 7 6 16009 8773 7236 413 277 136T.T. Singh 14 7 7 15205 6869 8336 351 212 139
Gujranwala 20 7 13 32995 10733 22262 696 372 324Gujrat 23 10 13 22488 8339 14149 498 274 224Hafizabad 4 2 2 3738 2054 1684 66 52 14M. Baha-ud-Din 4 2 2 6436 2661 3775 90 54 36Narowal 10 4 6 7879 3742 4137 212 94 118Sialkot 12 6 6 30564 11940 18624 368 223 145
Lahore 59 26 33 120951 55327 65624 4340 2034 2306Kasur 10 5 5 9748 4829 4919 222 138 84Nankana 5 2 3 5152 2037 3115 84 48 36Okara 15 8 7 10495 4665 5830 270 168 102Sheikhupura 5 4 1 8316 3394 4922 197 127 70
Multan 24 14 10 29850 13692 16158 883 530 353Khanewal 11 5 6 10531 4355 6176 254 145 109Lodhran 4 2 2 2257 826 1431 59 31 28Pakpattan 4 2 2 4089 1861 2228 94 63 31Sahiwal 7 5 2 13315 5605 7710 298 208 90Vehari 6 3 3 12374 6376 5998 235 159 76
Rawalpindi 46 16 30 50609 15683 34926 1529 584 945Attock 10 6 4 7983 3106 4877 165 104 61Chakwal 8 4 4 6560 2869 3691 188 121 67Jhelum 8 5 3 8256 3674 4582 148 89 59
Sargodha 27 12 15 22467 10394 12073 913 570 343Bhakkar 7 4 3 4614 2708 1906 124 95 29Khushab 6 3 3 3270 1568 1702 116 82 34Mianwali 6 4 2 4689 1966 2723 188 126 62
Table 99:- Number of Arts and Science Degree Colleges ( Punjab and Federal Govt.
142
Number Enrolment Teaching Staff
EDUCATION
District
Teaching Staff by District, The Punjab: 2006-07
Source:- Bureau of Statistics, Punjab, Lahore.
and Private Organizations ) for Boys and Girls, Their Enrolment and

Total Male Female Total Male Female Total Male Female
The Punjab 23 18 5 27771 25459 2312 1076 954 122Bahawalpur 3 2 1 2369 1977 392 110 96 14
D.G. Khan 2 2 - 2745 2745 - 85 85 -
Faisalabad 3 1 2 2894 2313 581 112 91 21
Gujranwala 4 4 - 5400 5400 - 173 173 -
Lahore 4 3 1 5522 4511 1011 262 190 72
Multan 4 3 1 5084 4756 328 213 198 15
Rawalpindi 2 2 - 1274 1274 - 55 55 -
Sargodha 1 1 - 2483 2483 - 66 66 -
The Punjab 117 106 11 44867 43210 1657 1522 1447 75Bahawalpur 15 14 1 5428 5355 73 217 213 4
D.G.Khan 13 11 2 5290 4897 393 163 151 12
Faisalabad 11 10 1 4209 4068 141 165 156 9
Gujranwala 19 16 3 7484 6942 542 204 180 24
Lahore 14 14 - 6267 6267 - 205 205 -
Multan 15 14 1 6547 6388 159 228 218 10
Rawalpindi 14 13 1 4153 4042 111 154 148 6
Sargodha 16 14 2 5489 5251 238 186 176 10
The Punjab 113 - 113 11802 - 11802 655 - 655Bahawalpur 12 - 12 1548 - 1548 79 - 79
D. G. Khan 11 - 11 1638 - 1638 74 - 74
Faisalabad 8 - 8 935 - 935 54 - 54
Gujranwala 16 - 16 921 - 921 75 - 75
Lahore 20 - 20 2133 - 2133 131 - 131
Multan 12 - 12 1571 - 1571 87 - 87
Rawalpindi 21 - 21 1989 - 1989 88 - 88
Sargodha 13 - 13 1067 - 1067 67 - 67
Teacher's Training Colleges by Sex and Area, The Punjab: 2006-07
I. Colleges of Technology / Polytechnic Institutes
II. Commercial Training Institutes
Type/AreaNumber Enrolment Teaching Staff
Table100:- Number, Enrolment and Teaching Staff of Technical Institutes/Elementary
143
III . Vocational Institutes
EDUCATION

Total Male Female Total Male Female Total Male Female
The Punjab 40 36 4 13573 12715 858 1019 965 54Bahawalpur 3 3 - 1105 1105 - 114 114 -
D. G. Khan 2 2 - 441 441 - 31 31 -
Faisalabad 3 3 - 557 557 - 59 59 -
Gujranwala 4 4 - 1500 1500 - 98 98 -
Lahore 10 8 2 3994 3668 326 349 316 33
Multan 8 7 1 2202 2054 148 230 219 11
Rawalpindi 6 5 1 2055 1671 384 38 28 10
Sargodha 4 4 - 1719 1719 - 100 100 -
The Punjab 36 25 11 5420 1079 4341 483 290 193Bahawalpur 5 4 1 894 319 575 69 67 2
D. G. Khan 4 3 1 466 157 309 70 53 17
Faisalabad 4 3 1 390 57 333 32 25 7
Gujranwala 6 5 1 1262 332 930 75 33 42
Lahore 4 2 2 423 43 380 62 29 33
Multan 5 3 2 939 65 874 77 32 45
Rawalpindi 4 2 2 411 7 404 48 11 37
Sargodha 4 3 1 635 99 536 50 40 10
144
Table 100:- Number, Enrolment and Teaching Staff of Technical Institutes/Elementary Teacher's Training Colleges by Sex and Area, The Punjab: 2006-07-Concld.
Type/Area
IV. Technical Training Institutes/Apprenticeship Training Centres
Number Enrolment Teaching Staff
V. Elementary Teacher’s Training Colleges
EDUCATION
Source:- i) Bureau of Statistics, Punjab, Lahore ii) TEVTA, Lahore.

Total Boys Girls
A.
1) Total Enrolment by Grade (I to V) inMosque ,Primary , Middle , High and HigherSecondary Schools.
I 1505 789 716
II 1324 722 602
III 1152 645 507
IV 1021 580 441
V 467 357
2) Estimated population Eligible for Primary Stage Education (5-9 Years) . 6875 6488
3) Percentage Enrolment of population Eligible at Primary Stage Education. #REF! 46.6 40.4
B.
1) Total Enrolment by Grades (VI-VIII) Middle,High and Higher Secondary Schools. 2098 1210 888
VI 813 470 343
VII 692 398 294
VIII 593 342 251
2) Estimated Population Eligible for Middle Stage Education (10-12 Years). 6799 3504 3295
3) Percentage Enrolment of Population Eligible at Middle Stage Education. 30.9 34.5 26.9
145
MIDDLE STAGE
PRIMARY STAGE
Grade And Sex at Primary, Middle, High, Higher Secondary And College Stage ( I-XIV Classes ) The Punjab:2006-07
PARTICULARS
5826
EDUCATION
Table 101:- Enrolment & Estimated Population Eligible at Various Stages of Education By
( Thousand )
3203 2623
824

Total Boys Girls
C.
1) Total Enrolment by Grades (IX- X) in High and Higher Secondary Schools 902 534 368
IX 530 319 211
X 372 215 157
2) Estimated Population Eligible for High StageEducation (13-14 Years) 4533 2336 2197
3) Percentage Enrolment of Population Eligibleat High Stage Education 19.9 22.9 16.8
D.
1) Enrolment in Grades (XI and XII) 490 223 267
2) Estimated Population Eligible for Intermediate Stage Education (15&16 Years) 4152 2111 2041
3) Percentage Enrolment of Population Eligible at Intermediate Stage Education 11.8 10.6 13.1
E.
1) Enrolment in Grades (XIII & XIV) 208 76 132
2) Estimated Population Eligible for Degree Stage Education (17 & 18 Years) 3950 2008 1942
3) Percentage Enrolment of Population Eligible at Degree Stage Education 5.3 3.8 6.8
146
PARTICULARS
EDUCATION
Table 102:- Enrolment & Estimated Population Eligible at Various Stages of Education By Grade And Sex at Primary, Middle, High, Higher Secondary And College Stage
( I-XIV Classes ) The Punjab:2006-07 - Concld.(Thousand)
HIGH STAGE
INTERMEDIATE STAGE
ii) For Inter and Degree Stage Bureau of Statistics, Punjab, Lahore.
DEGREE STAGE
Note:-Source:
Information supplied by EMIS pertains to Institutions run by Punjab Government only. i) For Primary, Middle and High Stage EMIS Punjab, Lahore
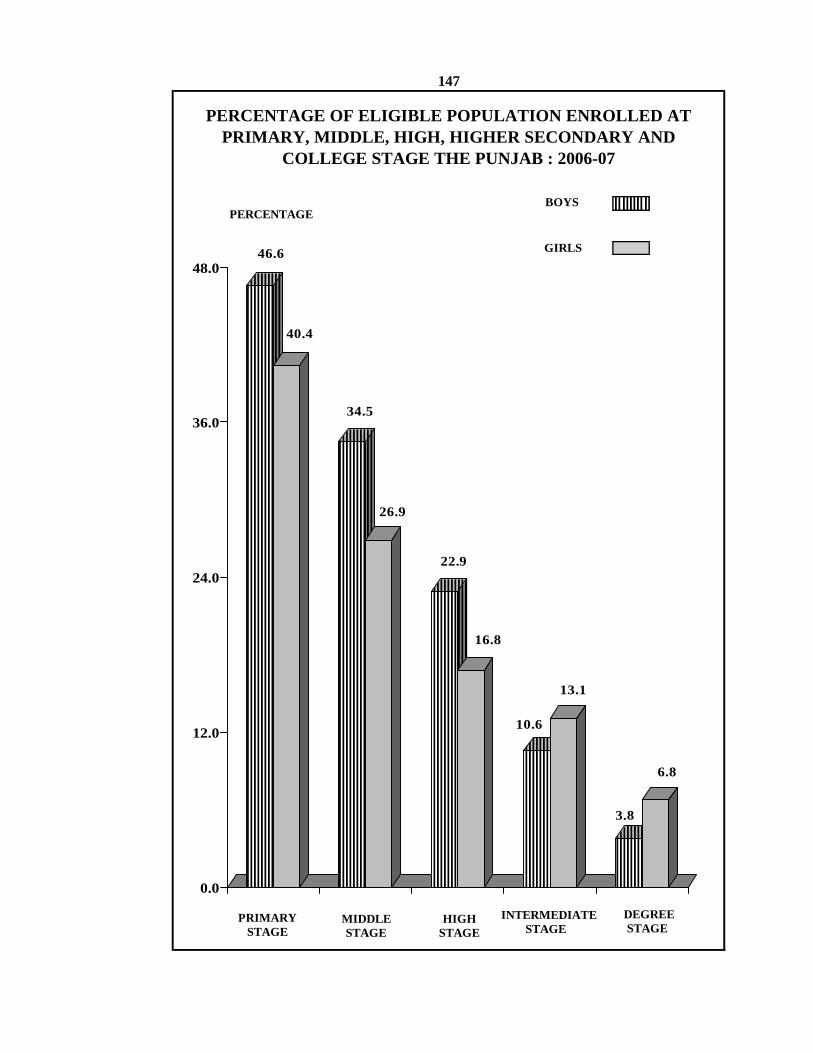
147
PERCENTAGE OF ELIGIBLE POPULATION ENROLLED AT PRIMARY, MIDDLE, HIGH, HIGHER SECONDARY AND
COLLEGE STAGE THE PUNJAB : 2006-07
PERCENTAGEBOYS
GIRLS
PRIMARY STAGE
MIDDLE STAGE
HIGH STAGE
INTERMEDIATE STAGE
DEGREE STAGE
46.6
40.4
34.5
26.9
22.9
16.8
10.6
13.1
3.8
6.8
0.0
12.0
24.0
36.0
48.0
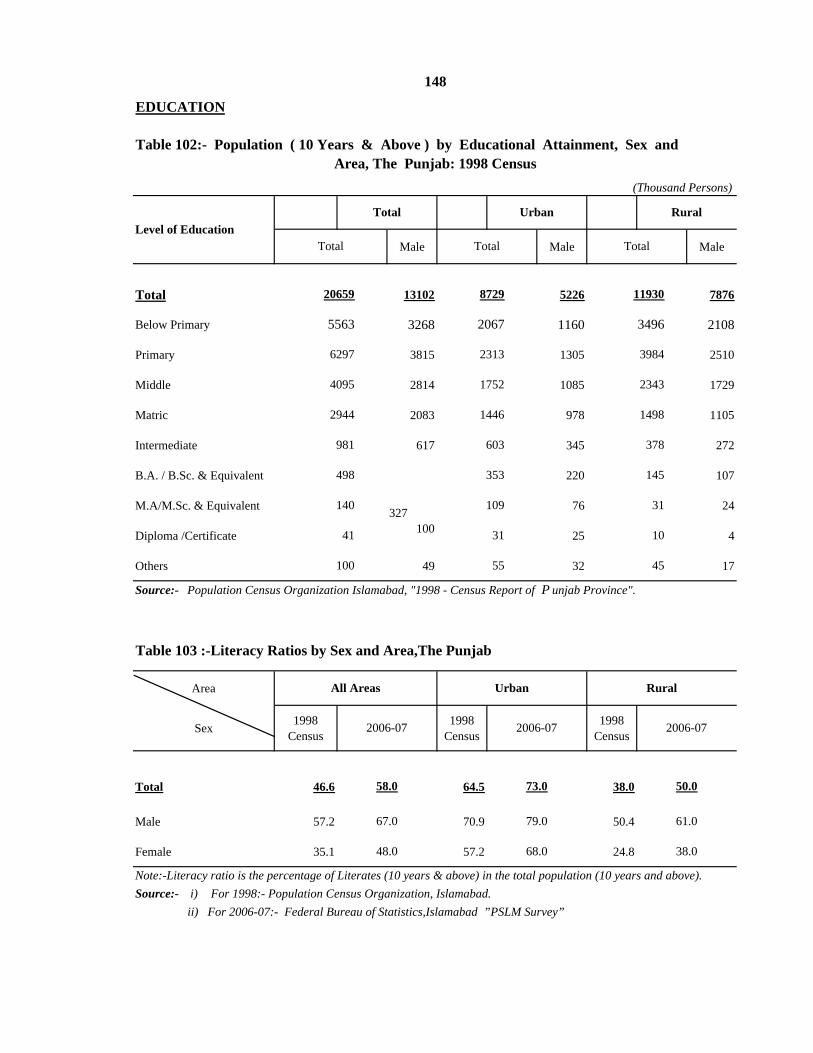
Male Male Male
Total 13102 5226 7876
Below Primary 3268 1160 2108
Primary 3815 1305 2510
Middle 2814 1085 1729
Matric 2083 978 1105
Intermediate 617 345 272
B.A. / B.Sc. & Equivalent 220 107
6297
4095
2944
981
Total
20659
5563
498
603
353
Total
8729
2067
2313
1752
1446
378
145
3496
3984
2343
1498
148
EDUCATION
Table 102:- Population ( 10 Years & Above ) by Educational Attainment, Sex and Area, The Punjab: 1998 Census
(Thousand Persons)
Total Urban RuralLevel of Education
Total
11930
M.A/M.Sc. & Equivalent 76 24
Diploma /Certificate 100 25 4
Others 49 32 17
Area
Sex 1998 Census
1998 Census
1998 Census
Total 46.6 64.5 38.0
Male 57.2 70.9 50.4
Female 35.1 57.2 24.8
2006-07
50.0
61.0
38.0
67.0
48.0
2006-07
73.0
79.0
68.0
41
100 55
31
2006-07
58.0
109140 327
45
31
10
ii) For 2006-07:- Federal Bureau of Statistics,Islamabad ”PSLM Survey”
Source:- Population Census Organization Islamabad, "1998 - Census Report of P unjab Province".
Note:-Literacy ratio is the percentage of Literates (10 years & above) in the total population (10 years and above).Source:- i) For 1998:- Population Census Organization, Islamabad.
Table 103 :-Literacy Ratios by Sex and Area,The Punjab
All Areas Urban Rural

149
LITERACY RATIOS OF POPULATION AGED 10 YEARS & ABOVE , BY SEX AND AREA, THE
PUNJAB : 1998 AND 2006-07
TOTAL
MALE
FEMALE
PERCENT
64.5
70.9
57.2
73.0
79.0
68.0
61.0
72
90
URBAN RURAL
38.0
50.4
24.8
50.0
38.0
0
18
36
54
1998 2006-07 1998 2006-07

1981 1998 Urban Rural Male Female
The Punjab 27.4 46.6 64.5 38.0 57.2 35.1
Bahawalpur 20.4 35.0 57.0 26.3 44.9 24.0Bahawalnagar 19.5 35.1 51.9 30.8 45.5 23.8R.Y.Khan 20.0 33.1 57.0 26.9 43.4 21.8
D.G.Khan 16.3 30.6 61.8 25.0 42.1 18.1Layyah 18.9 38.7 62.5 34.9 53.0 23.4Muzaffargarh 16.8 28.4 24.1 40.9 14.8Rajanpur 12.5 20.7 15.5 29.0 11.3
49.9Faisalabad 31.8 51.9 64.2 42.5 60.9 42.2Jhang 20.3 37.1 57.5 30.7 51.5 21.4T.T.Singh 30.3 50.5 63.2 47.5 61.3 39.1
Gujranwala 29.9 56.6 64.0 48.7 63.6 48.8Gujrat 31.3 62.2 72.8 57.9 73.0 51.6Hafizabad 30.3 50.5 63.2 47.5 61.3 39.1Mandi Baha-ud-Din 23.4 47.4 67.1 43.8 58.8 35.0Narowal 25.5 52.7 67.5 50.5 65.6 39.8Sialkot 30.8 58.9 72.3 53.8 65.9 51.5
Lahore 48.4 64.7 69.1 41.7 69.1 59.7Kasur 18.7 36.2 49.4 32.2 47.6 23.4NankanaOkara 24.8 37.8 58.7 31.3 49.3 25.0Sheikhupura 22.4 43.8 57.6 38.8 53.3 33.3
Multan 23.5 43.4 60.9 29.5 53.3 32.3Khanewal 25.6 39.9 60.8 35.4 53.6 25.1Lodhran 14.9 29.9 47.7 26.8 42.7 16.0Pakpattan 16.9 34.7 57.6 30.8 47.0 21.3Sahiwal 21.7 43.9 65.8 39.4 54.7 32.3Vehari 19.2 36.8 56.7 32.9 49.4 23.2
Rawalpindi 46.6 70.4 76.0 63.9 81.2 59.2Attock 21.1 49.3 69.4 43.7 66.9 32.0Chakwal 39.7 56.7 70.7 54.8 73.4 42.2Jhelum 38.9 68.9 77.2 58.6 777.0 50.5
Sargodha 24.9 46.3 64.2 39.1 59.2 32.7Bhakkar 17.7 34.2 55.1 30.1 49.7 17.6Khushab 21.4 40.5 51.6 36.7 59.8 21.8Mianwali 21.4 42.8 57.1 38.3 63.8 22.1
150
EDUCATION
Table 104:- Literacy Ratio by District, The Punjab(Percentage)
Source:- Population Census Organization, Islamabad
DistrictAll Areas/Both Sexes 1998 Census
( Included in Sheikhupura District )
55.5

Area 2002-03 2003-04 2004-05 2005-06 2006-07
The Punjab 571 597 621 669 731
Bahawalpur 30 38 42 46 50
D.G.Khan 54 86 119 118 132
Faisalabad 65 61 62 70 75
Gujranwala 74 96 93 115 130
Lahore 91 104 83 85 95
Multan 89 80 78 87 93
Rawalpindi 71 64 69 52 55
Sargodha 97 68 75 96 101
The Punjab 3997 4179 4968 6356 7310
Bahawalpur 210 266 336 437 500
D.G.Khan 378 602 952 1121 1320
Faisalabad 455 427 496 665 750
Gujranwala 518 672 744 1093 1300
Lahore 637 728 664 808 950
Multan 623 560 624 826 930
Rawalpindi 497 448 552 494 550
Sargodha 679 476 600 912 1010
151
Source:- Directorate General , Fisheries, Punjab, Lahore.
FISHERIES
Table 105:- Fish Production (Quantity and Value) by Area, The Punjab
I. Quantity ( ‘000’ Quintals )
II. Value (Million Rupees)
1 Procurement of Wheat by Food Department on Voluntary basis by District.
2 Procurement of Wheat by PASSCO on Voluntary basis.
3 Wheat Imports.
4 Releases of Wheat from Provincial Reserves.
5 Stocks of Wheat in Provincial Reserves.
6 Available Foodgrains Storage Capacity.
7 Sugar Production and Stocks.
152
These data are supplied by the District Offices of the Food Department on the basis of
records maintained by them. Wheat offered voluntarily by growers, zamindars, traders, agents
etc., is purchased at the procurement price fixed by the Government at the Procurement Centres
established by the Food Department and PASSCO for the purpose.
Releases of wheat from Government Reserves mainly relate to the wheat issued to Roller
Flour Mills for milling and sale to consumers through fair price shops at fixed prices. Wheat is
also released to Roller Flour Mills to supplement the supplies of wheat flour available in the open
market. These releases are issued as a measure to stabilize open market prices of wheat and wheat
atta.
Stocks of wheat on the Ist of every month indicate the size of buffer stocks maintained by
the Government as a level against rise in prices of wheat and wheat atta in the market.
The wheat procurement year runs from May to April following the harvesting of wheat of
previous Rabi Season and the Sugar production season runs from October to June.
EXPLANATORY NOTESON
FOODGRAINS STATISTICS SECTION
This section includes data on the following topics:-

2003-04 2004-05 2005-06 2006-07 2007-08
The Punjab 24091 24188 24380 25628 25688
Bahawalpur 1349 1268 1829 1503 1958Bahawalnagar 1336 2241 2155 1873 2174Rahim Yar Khan 1018 733 816 953 1366
D. G. Khan 559 390 772 716 762Layyah 595 833 970 918 944Muzaffargarh 1222 892 1384 1158 1115Rajanpur 516 860 1333 1111 1148
Faisalabad 715 530 533 846 947Jhang 699 2519 2722 2295 2249Toba Tek Singh 2368 771 713 618 744
Gujranwala 764 920 725 1167 607Gujrat 344 401 339 484 213HafizabadMandi Baha-ud-DinNarowalSialkot 541 1026 487 833 514
Lahore 178 38 22 118 50Kasur 302 155 69 317 206NankanaOkara 1458 1134 835 1201 854Sheikhupura 563 280 437 667 423
Multan 1379 881 1192 1159 1263Khanewal 1330 1270 1237 1372 1446Lodhran 820 632 664 638 881Pakpattan 951 847 474 510 576Sahiwal 1650 1978 1226 1193 1365Vehari 1348 1204 1085 1186 1267
Rawalpindi 5 10 15 18 6Attock 17 28 7 10 1Chakwal 1 5 3 10 5Jhelum 3 14 5 10 3
Sargodha 1090 914 1005 1257 843Bhakkar 600 937 1069 1037 1222KhushabMianwali 370 477 257 450 536
FOODGRAINS
Table 106 :- Procurement of Wheat by Food Department on Voluntary Basis by District, The Punjab
(Hundred Metric Tons)
153
( Included in Sheikhupura District )
( Included in Gujrat District ) ( Included in Sialkot District )
Source:- Food Directorate, Punjab, Lahore.
DistrictWheat Procurement Scheme Year
( Included in Gujranwala District )
( Included in Sargodha District )

Wheat Procurement Scheme Year
Food Department
1998-99 7928 25277
1999-00 10514 27862
2000-01 7114 63367
2001-02 15725 25145
2002-03 9761 28436
2003-04 7852 24091
2004-05 8233 24188
2005-06 9973 243802006-07 12424 25628
2007-08 12688 25688
Month 2003-04 2004-05 2005-06 2006-07 2007-08
June 828 1194 1190 1943 755
July 2574 2278 2310 3807 2587
August 2585 2490 2530 3929 2647
September 2574 2504 2603 3935 2641
October 2568 2490 2510 3925 2626
November 2515 2483 2489 3791 2342
December 2302 2134 2160 3481 1992
January 1960 1737 1780 2919 1755
February 1564 1322 1330 2263 1435
March 1101 826 820 1660 947
April 698 415 460 1026 517
April 274 138 132 305 189Source:- Food Directorate, Punjab, Lahore.
ii) For Food Department: Food Directorate, Punjab, Lahore.
Table 108:- Stock Position of Wheat in Government Reserves on the First of EveryMonth, The Punjab
(Thousand Metric Tons)
154
( Hundred Metric Tons )
Source:- i) For PASSCO: Pakistan Agricultural Storage & Services Corporation (PASSCO) Limited, Lahore.
FOODGRAINS
Table 107 - Total Procurement of Wheat by Pakistan Agricultural Storage AndServices Corporation (PASSCO) and Food Department, The Punjab
Total PASSCO
33205
38376
70481
34353
38052
38376
40870
38197
31943
32421

Quantity Percentage
1997-98 4099 1400 34.21998-99 2334 133 5.71999-00 1587 - -
2000-01 * - -2001-02 * - -2002-03 * - -
2003-04 * - -2004-05 1368 467 34.12005-06 * - -
2006-07 * - -
Year Production during the Season Sold in Open Market Balance with Sugar Mills
4293
1997-98 20659 14941 100111998-99 20334 20918 94271999-00 13156 22540 43
2000-01 14371 9794 46202001-02 21185 14312 114932002-03 22517 22058 11952
2003-04 24232 23351 128332004-05 21120 12990 209632005-06 16065 12132 24896
2006-07 22732 19959 27669
(Thousand Metric Tons)
Year PakistanReceipts of Imported Wheat in the Punjab
Closing balance with Sugar Mills during 1996-97
155
Source:- Food Directorate, Punjab, Lahore .
Table 109 : - Wheat Imports into Pakistan and Receipts of Imported Wheatin The Punjab
* No Wheat was imported because of self Sufficiency.Source:- Ministry of Food, Agriculture and Livestock (Planning Unit), Government of Pakistan, Islamabad.
Table 110 :- Sugar Production and Stocks, The Punjab(Hundred Metric Tons)
FOODGRAINS

District 2002-03 2003-04 2004-05 2005-06 2006-07
The Punjab 3242 2429 2728 3921 3537
Bahawalpur 146 77 98 216 160Bahawalnagar 114 17 35 293 94Rahim Yar Khan 170 72 105 145 118
D. G. Khan 58 21 26 83 40Layyah 23 14 18 127 40Muzaffargarh 115 41 54 168 60Rajanpur 48 7 13 139 27
Faisalabad 166 203 204 131 195Jhang 164 42 63 291 107Toba Tek Singh 69 65 49 106 59
Gujranwala 200 194 201 216 252Gujrat 52 82 95 66 116HafizabadMandi Baha-ud-DinNarowalSialkot 72 65 73 102 98
Lahore ( Proper ) 77 176 175 71 160Lahore ( Distt.. ) 78 118 129 25 129Kasur 48 28 30 39 39NankanaOkara 130 18 28 147 27Sheikhupura 139 107 161 118 231
Multan 210 86 130 155 133Khanewal 89 34 41 170 94
55 44 100 6711 13 63 22
Sahiwal 302 49 33 172 78Vehari 165 32 46 130 66
Rawalpindi 282 512 531 210 681Attock 62 99 134 47 187Chakwal 7 23 25 6 24Jhelum 40 61 56 29 77
Sargodha 117 85 76 175 104Bhakkar 36 15 14 125 27Khushab 16 - - - -Mianwali 47 20 28 56 25
156
( Included in Sheikhupura District )
( Included in Sialkot District )
FOODGRAINSTable 111 :- Off-take ( Releases ) of Wheat by District, The Punjab
( Thousand Metric Tons )
( Included in Gujranwala District )( Included in Gujrat District )
Source:- Food Directorate, Punjab, Lahore .
Lodhran (Included in Multan Distt)Pakpattan (Included in Sahiwal Distt)

Total House Type silos/Bins/Bini Shell
Open Bulk Heads
The Punjab 2189 1586 598 5
Bahawalpur 101 44 57 -Bahawalnagar 105 95 10 -Rahim Yar Khan 117 116 1 -
D.G.Khan 9 7 2Layyah 42 39 3 -Muzaffargarh 44 43 1 -Rajanpur 8 7 1 -
Faisalabad 182 130 52 -Jhang 133 85 48 -Toba Tek Singh 73 52 21 -
Gujranwala 88 82 6 -Gujrat 26 25 1 -HafizabadMandi Baha-ud- DinNarowalSialkot 33 32 1 -
Lahore 90 80 10 -Kasur 47 45 2 -NankanaOkara 98 92 6 -Sheikhupura 101 100 1 -
Multan 89 44 45 -Khanewal 128 48 80 -Lodhran 78 76 2 -Pakpattan 104 33 71 -Sahiwal 90 78 12 -Vehari 116 26 85 5
Rawalpindi 103 97 6 -Attock 16 15 1 -Chakwal 5 5 - -Jhelum 14 14 - -
Sargodha 93 32 61 -Bhakkar 25 22 3 -Khushab 17 13 4 -Mianwali 14 9 5 -
District
( Included in Gujrat District )( Included in Sialkot District )
( Included in Gujranwala District )
Source:- Food Directorate, Punjab,Lahore.
( Included in Sheikhuupura District )
157
The Punjab: As on 30th June, 2007(Thousand Metric Tons)
Table 112:- Foodgrains Storage Capacity (Functional) with Food Department by DistrictFOODGRAINS

158EXPLANATORY NOTES
ONFOREIGN TRADE SECTION
Foreign trade statistics refer to the movement of goods into and out of the customs area
of Pakistan and include imports, re-imports, exports and re-exports carried through sea, land and
air routes but exclude trade in-transit through Pakistan.
Import statistics represent arrival of goods of foreign origin from foreign countries into
Pakistan and are released by customs (either directly or indirectly after storage in bonded
warehouses) and intended for home consumption or for re-exportation. Goods salvaged from or
disposed off by ships in mid-stream are included in the imports from the country according to
the color of the ship. Diplomatic privileged imports and imports by parcel posts are also
included in imports. Exported goods subsequently imported from foreign countries without any
processing are treated as re-import which are tabulated and presented separately. However
imports into band not valued military goods, goods of no commercial value, gold and silver
Coins or bullion and currency notes, article of baggage and personnel effects of passenger and
trade in-transit through Pakistan are excluded from import statistics. Import are valued at cost,
insurance and freight (CIF).
Export statistics represent the movement of goods out of Pakistan of foreign countriesthrough lawful channels as emerge from customs documents. Re-export statistics representimported goods subsequently exported to foreign countries without further processing which aretabulated and presented separately. Supplies and bunker fuels to ships are included in exportsaccording to the color of the ships. Exports by parcel posts are also included however, notvalued military goods, relief goods/goods of no commercial values, sales from duty free shopsand trade with Isrel, gold and silver coins or bullion and currency notes. Non dutiable articles ofbaggage’s and personnel effects of passenger, Trade in-transit through Pakistan are not includedin exports. Trade data of Karachi Export Processing Zone (KEPZ) are being included inNational Trade Statistics from July, 2003.
Export are valued at free on board (FOB) upto June, 2002 commodities of export andimport were classified on the basis of Pakistan Standard Trade Classification (PSTC-R3). FromJuly, 2002 commodities of export and import are being classified according to Harmonizedcommodity Description and coding system (HS-02) for compilation and dissemination of data tonational and international users.

Group 2002-03 2003-04 2004-05 2005-06 2006-07
All Groups 162.29 153.72 160.20 185.35 179.41
Food and Live Animals 162.99 172.75 188.09 232.75 203.58
Beverages and Tobacco 108.89 263.08 272.03 254.45 268.03
Crude Materials Inedible Except Fuels 64.92 48.54 66.00 54.11 54.89
Mineral Fuels & Lubricants 151.47 196.70 337.58 510.30 561.39
Chemicals 309.53 361.71 617.98 600.15 739.33
Manufactured Goods 167.90 158.48 158.15 180.15 174.85
Machinery & Transport Equipment 385.78 511.88 415.45 550.93 610.49
Misc. Manufactured Articles 189.86 175.00 181.94 219.38 215.46
All Groups 198.08 200.19 252.72 244.59 252.67
Food and Live Animals 114.78 146.38 188.42 237.89 217.05
Beverages and Tobacco 108.95 123.68 145.19 240.06 556.63
Crude Materials Inedible Except Fuels 279.46 380.23 416.11 386.04 517.33
Mineral Fuels & Lubricants 180.59 182.72 178.77 181.10 200.40
Vegetable / Animal Oils & Fats 125.93 110.11 128.75 124.22 112.60
Chemicals 254.95 222.10 226.70 245.05 232.70
Manufactured Goods 174.60 132.55 175.19 208.02 179.82
Machinery & Transport Equipment 226.71 238.88 429.39 344.43 372.44
Misc. Manufactured Articles 156.83 168.92 193.44 248.82 246.29
159
Source:- Federal Bureau of Statistics, Karachi.
FOREIGN TRADE
Table 113:- Index Numbers of Quantum of Exports and Imports by GroupPakistan (Base: 1990-91 = 100)
IMPORTS
EXPORTS

Year Exports
1 2
1997-98 3731601998-99 3903421999-00 443678
2000-01 5390702001-02 5609472002-03 652294
2003-04 7090362004-05 8540882005-06 984841
2006-07 1029312
Consumer Goods
Capital Goods
1 2 3 4 5 6 7 8 9 10
1997-98 373160 47357 64683 261120 436338 77848 139618 195528 233441998-99 390342 45143 70288 274911 465964 73305 146450 220563 256461999-00 443678 53833 68208 321637 533792 75234 140045 287801 30712
2000-01 539070 67783 81288 389999 627000 89768 157091 345770 343712001-02 560947 60346 80438 420163 634630 72025 176702 346864 390392002-03 652294 71194 71323 509777 714372 72179 220942 380035 41216
2003-04 709036 70716 83361 554959 897825 82848 316082 441586 573092004-05 854088 92019 86483 675586 1223080 122607 441528 557226 1017192005-06 984841 112268 106029 766544 1711158 185698 631644 769336 124480
2006-07 1029312 115219 110454 803639 1851806 183387 669533 864594 134291
3295
43072943
(-) 84964(-) 70064
60777717
24025
160
819
342
1711158
1851806 232
614
(-) 59477
(-)165583
688745
1223079 4729
Year
634630714372
897825
9726
Table 115:- Exports and Imports by Economic Category, Pakistan
(-)367643(-)719214
(-)813000
3501
Source : - Federal Bureau of Statistics, Karachi
(Million Rupees)
Total (7 to 10)
Manu-factured Goods
Semi- Manu-
factured Goods
Primary Commo-
dities
E X P O R T S
Raw MaterialsTotal
(3 to 5)
(-) 60050
Source: - Federal Bureau of Statistics, Karachi.
(-) 72802(-) 87580940
681533792
627000
Re-Exports
Capital Goods
3
Imports
4
Re-Imports
5
I M P O R T S
465964
Consu-mer
Goods
3474
3711
FOREIGN TRADE
Table 114 :- Balance of Trade, Pakistan(Million Rupees)
436338
Balance of Trade
6=(2+3-4-5)
167
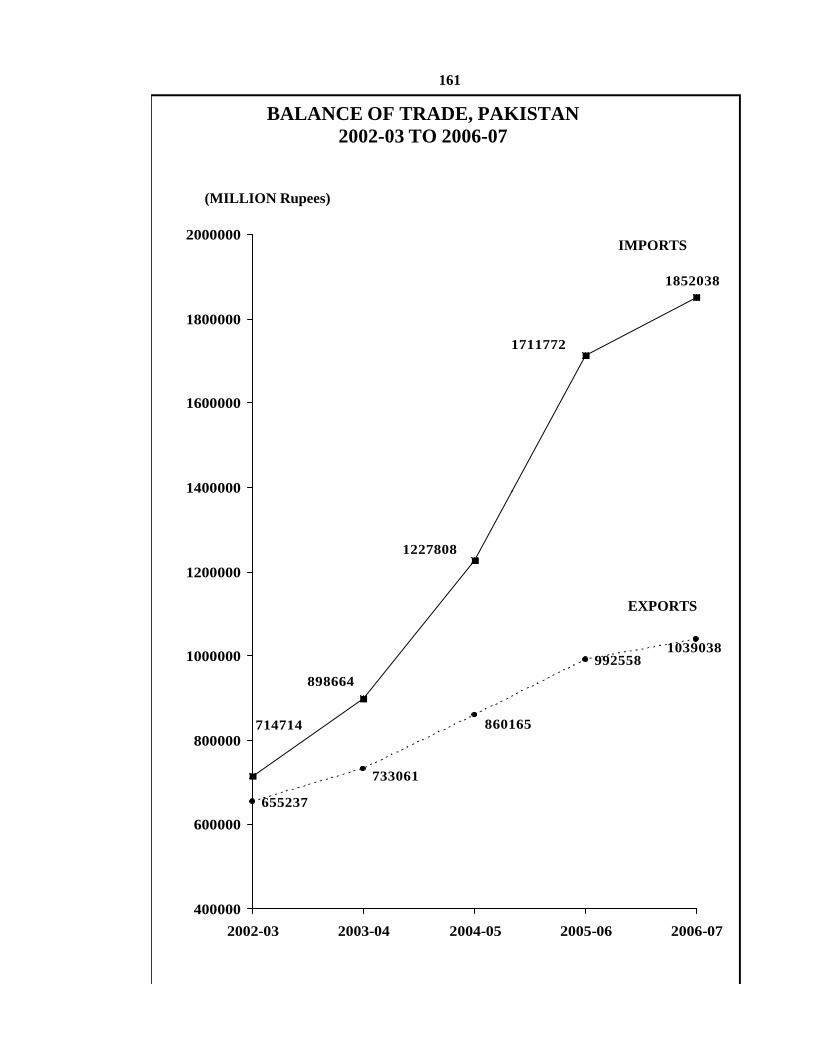
161
BALANCE OF TRADE, PAKISTAN2002-03 TO 2006-07
(MILLION Rupees)
IMPORTS
1852038
1711772
1400000
1600000
1800000
2000000
EXPORTS
655237
992558
1227808
898664
714714
1039038
860165
733061
400000
600000
800000
1000000
1200000
1400000
2002-03 2003-04 2004-05 2005-06 2006-07

Commodity Group 2002-03 2003-04 2004-05 2005-06 2006-07
Total Exports 652294 709036 854088 984841 1029312
Food and Live Animals 68638 68006 89857 113760 115759
Fish, fresh and simply preserved 6676 7620 6227 10264 9129
Fish in airtight containers n.e.s. 1191 1186 2032 1360 2290
Rice 32433 36535 55392 69325 68286
Fruit, Fresh and nuts excluding Oil nuts fresh or dried 4321 5220 4860 7242 6470
Spices 930 1100 852 1410 1415
Feeding stuff for animals 104 427 256 229 342
Others 22983 15918 20238 23930 27827
Beverages and Tobacco 627 1251 1432 1713 1421
Tobacco, manufactured 74 151 64 58 40
Others 553 1100 1368 1655 1381
Crude Material inedible except Fuel 11845 14124 20722 18249 20313
Oil seeds, oil nuts and oil kernals 472 805 1419 998 1422
Wool and other animal’s hair 133 122 130 202 296
Cotton 5044 5128 9295 7332 6558
Crude Vegetable material n.e.s. 2142 1814 2050 2139 2491
Others 4054 6255 7828 7578 9546
Mineral's Fuel Lubricants etc. 14547 17116 28477 49593 52095
Petroleum products etc 14311 16375 26604 48431 50600
Others 236 741 1873 1162 1495
Animal and Vegetable Oils and Fats 1450 3826 3502 6362 5374
Table 116:- Exports by Commodity Group, Pakistan
162FOREIGN TRADE
(Million Rupees)
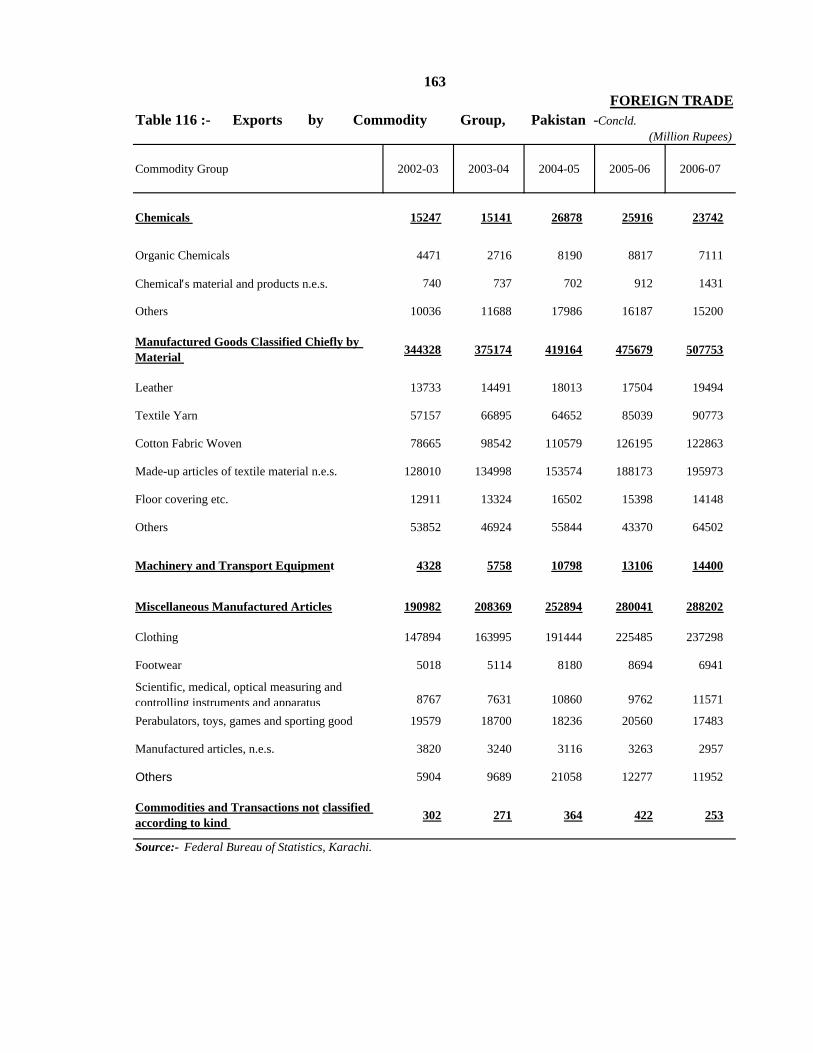
Commodity Group 2002-03 2003-04 2004-05 2005-06 2006-07
Chemicals 15247 15141 26878 25916 23742
Organic Chemicals 4471 2716 8190 8817 7111
Chemical′s material and products n.e.s. 740 737 702 912 1431
Others 10036 11688 17986 16187 15200
Manufactured Goods Classified Chiefly by Material 344328 375174 419164 475679 507753
Leather 13733 14491 18013 17504 19494
Textile Yarn 57157 66895 64652 85039 90773
Cotton Fabric Woven 78665 98542 110579 126195 122863
Made-up articles of textile material n.e.s. 128010 134998 153574 188173 195973
Floor covering etc. 12911 13324 16502 15398 14148
Others 53852 46924 55844 43370 64502
Machinery and Transport Equipment 4328 5758 10798 13106 14400
Miscellaneous Manufactured Articles 190982 208369 252894 280041 288202
Clothing 147894 163995 191444 225485 237298
Footwear 5018 5114 8180 8694 6941
Scientific, medical, optical measuring and controlling instruments and apparatus 8767 7631 10860 9762 11571
Perabulators, toys, games and sporting good 19579 18700 18236 20560 17483
Manufactured articles, n.e.s. 3820 3240 3116 3263 2957
Others 5904 9689 21058 12277 11952
Commodities and Transactions not classified according to kind 302 271 364 422 253
163FOREIGN TRADE
Table 116 :- Exports by Commodity Group, Pakistan -Concld.(Million Rupees)
Source:- Federal Bureau of Statistics, Karachi.

Commodity Group 2002-03 2003-04 2004-05 2005-06 2006-07
Total Imports 714372 897825 1223079 1711158 1851806
Food and Live Animals 29000 29486 64540 103890 82331
Milk and Cream 691 579 1142 2528 3609
Wheat including spelt meslin unmilled 1699 1355 5516 7944 2518
Fruit and nuts excluding oil nuts 2352 2012 3221 4992 5407
Tea and mate 10095 11078 13202 13346 12971
Spices 1341 2349 2807 3159 3275
Misc. edible products and preparation 1813 2008 2418 3244 4150
Others 11009 10105 36234 68677 50401
Beverages and Tobacco 368 420 367 769 1126
Crude Material inedible except Fuel 53964 79832 99090 113152 141344
Crude rubber including Synthetic 2869 3928 5104 6228 6958
Jute/Textile base fibre 1227 1779 2321 2539 2963
Synthetic and regenerated artificial fibres 5382 6110 8722 15612 14249
Iron and steel scrap 2795 5392 13182 21743 23163
Non-ferrus metal scrap 1779 1974 2375 2542 3535
Others 39912 60649 67386 64488 90476
Mineral Fuels, Lubricants etc. 184205 191640 255010 414114 469508
Crude Petroleum Mineral Oil 79930 101640 127465 227123 218279
Petroleum Products refined 98661 79556 109922 172544 226331
Others 5614 10444 17623 14447 24898
Animal /Vegetable Oils, Fats and Waxes 40655 45519 51010 50332 63857
Fixed Vegetable Oils 2820 2804 3341 1645 2704
Others Fixed vegetable oils 32843 36308 42338 43462 56389
Animal/vegetable oils, Fats and Waxes 2658 2779 2566 2693 2475
Others 2334 3628 2765 2532 2289
Chemicals 126404 161118 213949 250350 266954
Organic Chemicals 43719 56204 72685 65498 77953
Other Inorganic Chemicals 4582 8246 11914 16221 14936
Synthetic organic dyestuffs etc. 4839 4858 5690 7127 8066
164
(Million Rupees)
FOREIGN TRADETable 117 :- Imports by Commodity Group, Pakistan

Commodity Group 2002-03 2003-04 2004-05 2005-06 2006-07
Medicinal and Pharmaceutical Products 12964 15812 17343 20091 26038
Fertilizers manufactured 14068 16405 24794 40787 27109
Plastic material/artificial resin 24624 31635 47061 61062 69897
Chemical Material and Products n.e.s. 13305 17731 21771 24573 25320
Others 8303 10227 12691 14991 17635
Manufactured Goods by Material 71772 91509 134012 200619 206482
Rubber Manufactures n.e.s. 5946 6639 9994 12165 12570
Paper and Paper Board 7750 9507 11583 15377 18096
Textile Yarn and Fabrics etc. 12188 17342 18024 33759 35000
Ingots and other primary forms of iron & steel 9 280 7121 12593 2508
Iron and steel bars, rods etc. shapes/sections 865 1807 4091 7229 7943
Universal plates and sheets of Iron and Steel 15897 22018 34030 49273 45362
Tubes and pipes etc. of Iron and Steel 4256 3114 4273 8339 12556
Aluminium 3339 4727 6301 7326 11113
Finished structural parts and structure, n.e.s. 745 667 1615 3049 3121
Others 20777 25408 36980 51509 58213
Machinery and Transport Equipment 171904 243143 351574 498388 546735
Agricultural machinery and implements 2153 2169 4386 8465 10098
Textile and leather machinery 32897 36362 57956 51750 33438
Machinery and appliances (other than electrical) and machines parts n.e.s. 84206 102376 192110 274231 321933
Road motor vehicles 32377 59338 73745 108582 90489
Aircrafts/Associate equipment/parts n.e.s. 7607 28036 2236 24897 51243
Others 12664 14862 21141 30463 39534
Miscellaneous Manufactured Articles 21380 25666 31048 42258 58917
Medical instruments and appliances n.e.s. 2445 4474 5283 15416 20413
Articles of artificial plastic material n.e.s. 1551 1862 2133 3812 4022
Others 17384 19330 23632 23030 34482
Commodities and Transactions not classified according to kind 14720 29492 22479 37286 14552
Source:- Federal Bureau of Statistics, Karachi.
165FOREIGN TRADE
Table 117:- Imports by Commodity Group, Pakistan - Concld.(Million Rupees)
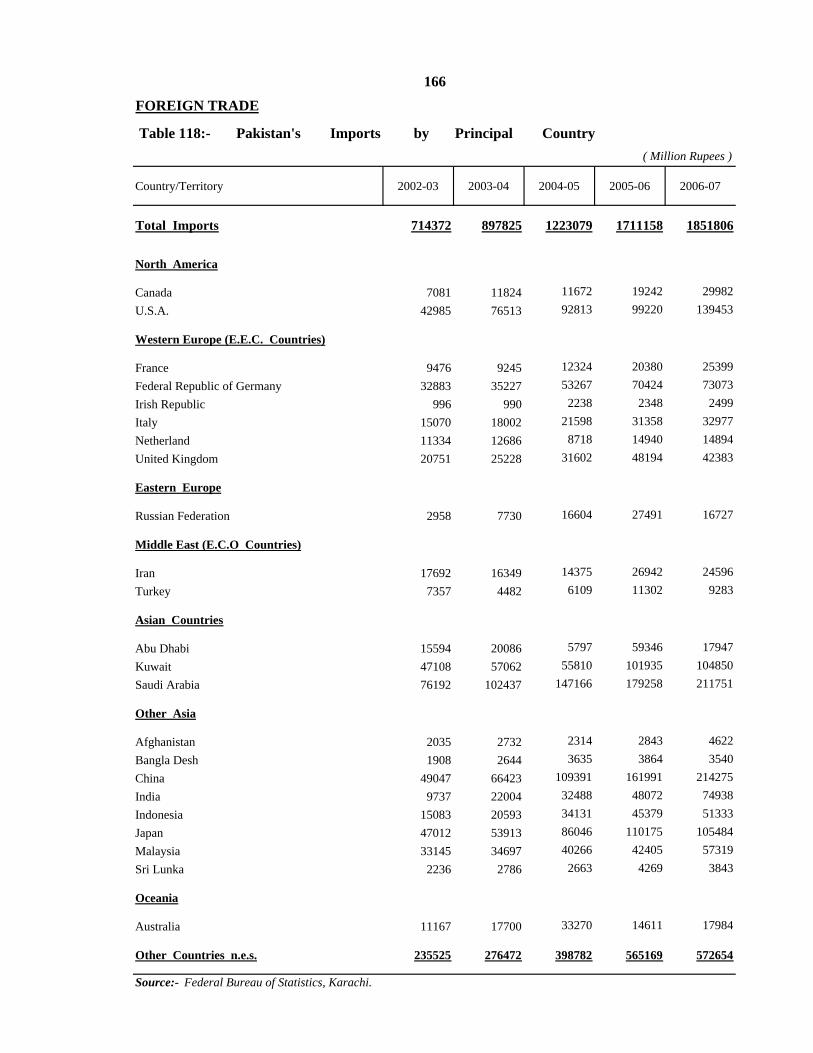
Country/Territory 2002-03 2003-04 2004-05 2005-06 2006-07
Total Imports 714372 897825 1223079 1711158 1851806
North America
Canada 7081 11824 11672 19242 29982U.S.A. 42985 76513 92813 99220 139453
Western Europe (E.E.C. Countries)
France 9476 9245 12324 20380 25399Federal Republic of Germany 32883 35227 53267 70424 73073Irish Republic 996 990 2238 2348 2499Italy 15070 18002 21598 31358 32977Netherland 11334 12686 8718 14940 14894United Kingdom 20751 25228 31602 48194 42383
Eastern Europe
Russian Federation 2958 7730 16604 27491 16727
Middle East (E.C.O Countries)
Iran 17692 16349 14375 26942 24596Turkey 7357 4482 6109 11302 9283
Asian Countries
Abu Dhabi 15594 20086 5797 59346 17947Kuwait 47108 57062 55810 101935 104850Saudi Arabia 76192 102437 147166 179258 211751
Other Asia
Afghanistan 2035 2732 2314 2843 4622Bangla Desh 1908 2644 3635 3864 3540China 49047 66423 109391 161991 214275India 9737 22004 32488 48072 74938Indonesia 15083 20593 34131 45379 51333Japan 47012 53913 86046 110175 105484Malaysia 33145 34697 40266 42405 57319Sri Lunka 2236 2786 2663 4269 3843
Oceania
Australia 11167 17700 33270 14611 17984
Other Countries n.e.s. 235525 276472 398782 565169 572654
166
FOREIGN TRADE
Table 118:- Pakistan's Imports by Principal Country ( Million Rupees )
Source:- Federal Bureau of Statistics, Karachi.

Country/Territory 2002-03 2003-04 2004-05 2005-06 2006-07
Total Exports 652294 709036 854088 984841 1029312
North America
Canada 12047 10460 11511 12510 12222U.S.A. 153061 169512 204426 250990 253584
Western Europe (E.E.C. Countries)
France 17028 19502 21809 20155 20988Federal Republic of Germany 33867 34927 40862 41142 42527Italy 19920 26147 34920 35045 38794Netherland 16768 19296 20477 23889 26799Spain 13366 17356 20232 24876 28231United Kingdom 46075 54174 52993 53530 57610
E.F.T.A. (Excl. U.K.)
Switzerland 1209 1806 1838 2189 1233
Eastern Europe
Russian Federation 600 1179 2607 3137 5060
Middle East (E.C.O. Countries)
Iran 3694 5324 8728 11258 10161
Asian Countries
Dubai 58748 51483 28111 54898 11167Iraq 918 162 736 1449 2932Kuwait 4133 4136 4717 4345 5116Saudi Arabia 27845 20071 20937 19710 17530Sultanate of Oman 2486 2878 2934 3342 3860
Other Asia
Afghanistan 18380 28393 44393 63671 45686Bangla Desh 6676 11226 12226 16075 15884China 14307 16588 21027 27773 34927Hong Kong 30216 33511 33121 40660 39645India 4122 5398 17126 17557 20805Indonesia 4305 2563 4188 3474 4418Japan 8312 7759 9758 7668 7524Singapur 5058 6738 3379 2276 4140Sri Lunka 4447 5633 9260 9531 12166
Other Countries n.e.s. 144706 152814 221772 233691 306303
Source:- Federal Bureau of Statistics, Karachi.
167FOREIGN TRADE
Table 119:- Pakistan's Exports by Principal Country(Million Rupees)

I.
i) RESERVED FORESTS
The forest area under the control of the ForestDepartment declared as Reserved Forest under the Forest Act,1927. The rights and privileges are normally limited andsettled.
ii) PROTECTED FORESTS
The forest area under the control of Forest Departmentwhich has been declared as Protected Forest under theProvision of Forest Act, 1927.
iii) UN-CLASSED FORESTS
The Government Forests which are neither ReservedForests nor Protected Forests.
iv) SECTION-38 AREA
Private land area handed over voluntarily by the ownersto the Forest Department for management under Section-38 ofForest Act, 1927.
168EXPLANATORY NOTES
ONFOREST STATISTICS SECTION
The data included in this Section cover the designated forest areas by legal status and the out-turn and value of timber & firewood produced from the same.
DESIGNATED FOREST AREAS
These include all the wooded and non-wooded areas and thebarren lands which are under the administrative control of the PunjabForest Department for the afforestation and management purposes. Itincludes all the coniferous forests, scrub forests, riverian forests,irrigated plantations, linear plantations and range lands.
The brief definitions of the categories of the Forest areas by legal status are:-

v) CHOS ACT AREA
Land taken up for soil and water conservation under theChos Act.
vi) RESUMED LANDS
Land taken over by Government under various Reformsor Martial Law Regulations.
vii) GUZARA FORESTS
The Forest area which are the joint property of thevillagers and are being managed presently by the ForestDepartment
II.
i ) CONIFEROUS FORESTS
Natural forests of cone bearing trees with usually needle like leavesmostly occuring in the hilly areas at elevation of 3500 feet above the sealevel.
ii) IRRIGATED PLANTATIONS
Man-made forests in the shape of blocks in the canalirrigated track.
iii) RIVERIAN FORESTS
Forests occuring in varied sized patches along the river banks.
iv) LINEAR PLANTATIONS
Rows of trees planted in the land strips, alongsidecanals, roads and railway lines.
v) RANGE LANDS
Naturally vegetated lands uncultivated due to adverseecological conditions useable for the production of forage foranimal consumption.
III.
169
Definitions of some Vegetational types of Forests are given below:-
PRODUCTION AND VALUE OF TIMBER & FIREWOOD
The information about the production and value of timber and firewood related to Forest Department managed forests only.
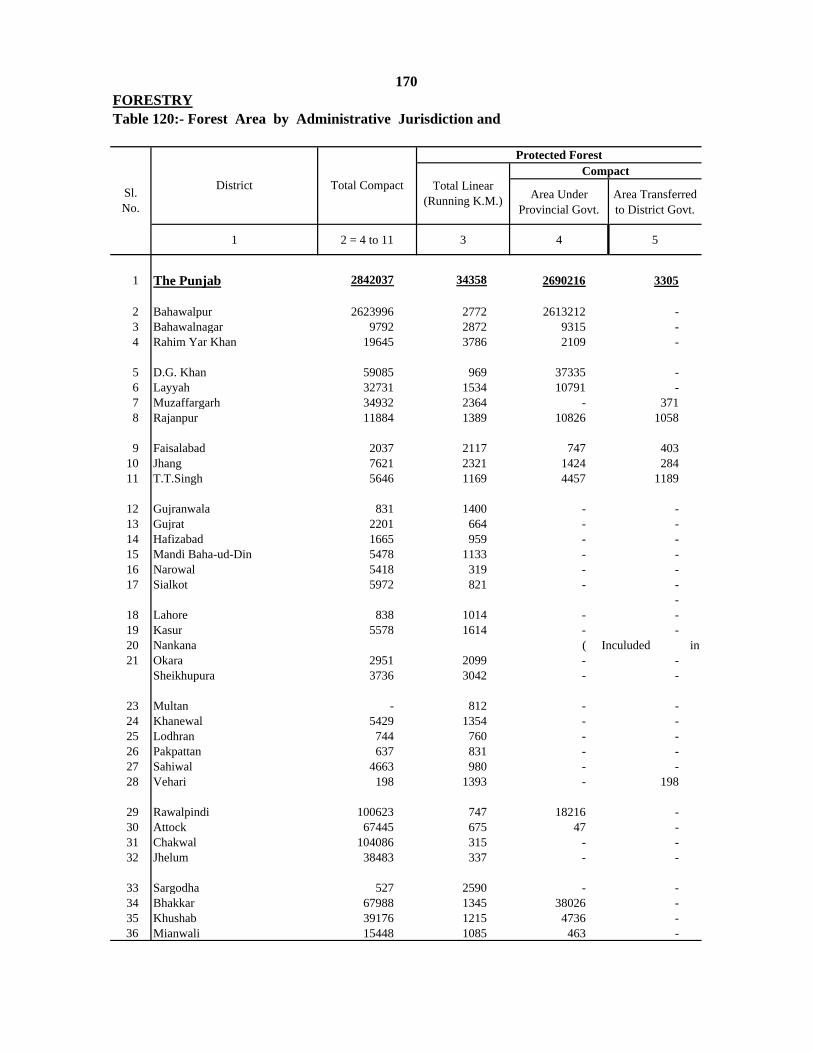
Area Under Provincial Govt.
Area Transferred to District Govt.
1 2 = 4 to 11 3 4 5
1 The Punjab 2842037 34358 2690216 3305
2 Bahawalpur 2623996 2772 2613212 -3 Bahawalnagar 9792 2872 9315 -4 Rahim Yar Khan 19645 3786 2109 -
5 D.G. Khan 59085 969 37335 -6 Layyah 32731 1534 10791 -7 Muzaffargarh 34932 2364 - 3718 Rajanpur 11884 1389 10826 1058
9 Faisalabad 2037 2117 747 40310 Jhang 7621 2321 1424 28411 T.T.Singh 5646 1169 4457 1189
12 Gujranwala 831 1400 - -13 Gujrat 2201 664 - -14 Hafizabad 1665 959 - -15 Mandi Baha-ud-Din 5478 1133 - -16 Narowal 5418 319 - -17 Sialkot 5972 821 - -
-18 Lahore 838 1014 - -19 Kasur 5578 1614 - -20 Nankana21 Okara 2951 2099 - -
Sheikhupura 3736 3042 - -
23 Multan - 812 - -24 Khanewal 5429 1354 - -25 Lodhran 744 760 - -26 Pakpattan 637 831 - -27 Sahiwal 4663 980 - -28 Vehari 198 1393 - 198
29 Rawalpindi 100623 747 18216 -30 Attock 67445 675 47 -31 Chakwal 104086 315 - -32 Jhelum 38483 337 - -
33 Sargodha 527 2590 - -34 Bhakkar 67988 1345 38026 -35 Khushab 39176 1215 4736 -36 Mianwali 15448 1085 463 -
170
Sl. No.
FORESTRYTable 120:- Forest Area by Administrative Jurisdiction and
District Total Compact
Protected ForestCompact
Total Linear (Running K.M.)
( Inculuded in

6 7 8 9 10 11 12
68880 3894 18353 14936 0 42453 3559 1
10247 537 - - - - - 2- 477 - - - - - 3
17536 - - - - - - 4
- - 1967 - - 19783 - 5- - - - - 21940 3105 6
17346 1747 15468 - - - 77 7- - - - - - - 8
- 157 - - - 730 - 95452 461 - - - - 21 10
- - - - - - 142 11
217 - - 614 - - - 121118 - - 1083 - - - 13
657 - - 1008 - - 214 145478 - - - - - - 15
- - - 5418 - - - 1685 - 187 5700 - - - 17
838 - - - - - - 185063 515 - - - - - 19
202928 - - 23 - - - 211915 - 731 1090 - - - 22
- - - - - - - 235154 275 - - - - - 24
744 - - - - - - 25- 637 - - - - - 26
4663 - - - - - - 27- - - - - - - 28
38171 - 3240 363 40633 - - 2965114 - - 2284 - - - 3085400 - 16461 2225 - - - 3129494 - 8068 921 - - - 32
- 527 - - - - 472 33- - 29962 - - - 2174 34
34416 - - 24 - - 1403 357102 - 2648 5235 - - 747 36
Sl. No.
171FORESTRY
Enactment, The Punjab: 2006-07 (Hectares)
Reserved Forests
Guzara Forests Area Under Provincial
Govt.
Area Transferred to District Govts.
Area Under Provincial Govt.
Area Transferred to District Govts.
Unclassed Forests
Section 38 Forests/
Resumed Lands
Chos Act/ Other Forests*
Sheikhupura District )
* Includes Civil Reserved Forests, Civil Un-classed Forests and Military Un-classed Forests Source:- Forestry, Wildlife, Fisheries and Tourism Department, Government of the Punjab, Lahore.

District 2002-03 2003-04 2004-05 2005-06 2006-07
The Punjab 3296 3296 3296 3296 3296
Bahawalpur 2624 2624 2624 2624 2624Bahawalnagar 10 10 10 10 10Rahim Yar Khan 19 19 19 19 19
D.G. Khan 58 58 58 58 58Layyah 14 14 14 14 14Muzaffargarh 35 35 35 35 35Rajanpur 35 35 35 35 35
Faisalabad 2 2 2 2 2Jhang 7 7 7 7 7T.T.Singh 6 6 6 6 6
Gujranwala 1 1 1 1 1Gujrat 2 2 2 2 2Hafizabad 2 2 2 2 2Mandi Baha-ud-Din 6 6 6 6 6Narowal 5 5 5 5 5Sialkot 6 6 6 6 6
Lahore 1 1 1 1 1Kasur 5 5 5 5 5NankanaOkara 3 3 3 3 3Sheikhupura 4 4 4 4 4
Multan - - - - -Khanewal 5 5 5 5 5Lodhran 1 1 1 1 1Pakpattan 1 1 1 1 1Sahiwal 5 5 5 5 5Vehari - - -
Rawalpindi 101 101 101 101 101Attock 67 67 67 67 67Chakwal 104 104 104 104 104Jhelum 39 39 39 39 39
Sargodha 1 1 1 1 1Bhakkar 70 70 70 70 70Khushab 41 41 41 41 41Mianwali 16 16 16 16 16Source :- Forestry, Wildlife, Fisheries and Tourism Department, Government of the Punjab, Lahore.
( Included in Sheikhupura District )
172FORESTRY Table 121 :- Area Under Forest (Compact) by Forest Circle, The Punjab
(Thousand Hectares)

Quantity (′000′ Cubic Metres) Value (′000′ Rs.) Quantity (′000'
Cubic Metres) Value (′000' Rs.)
1997-98 40 178790 101 36860
1998-99 34 210368 100 65000
1999-00 21 263353 54 17544
2000-01 43 239820 40 85300
2001-02 28 350000 48 17220
2002-03 135 713900 108 49725
2003-04 167 598288 31 18252
2004-05 54 193428 135 79380
2005-06 41 737008 59 34692
FORESTRY
Table 122:- Timber and Firewood Production (Quantity and Value), The Punjab
173
Source:- Forestry, Wildlife, Fisheries and Tourism Department, Government of the Punjab, Lahore.
Year
Timber Firewood
I)
1 Gas Consumption by Consumer Group
2 Installed Generating Capacity of Power Stations, National Grid, WAPDA
3 New Electricity Connections Given and Applications Pending with WAPDA byConsumer Group
4 Electricity Consumers and Units Sold by Categories, WAPDA System
5 Electricity Revenue Assessed by Type of Consumers, WAPDA
6 Generation of Energy in Pakistan and the Punjab under WAPDA System
7 Villages Settlements Electrified by Province.
II)
A - POWER STATIONS
1 Principal Hydel
The Power Stations utilising water heads available at the Dams come underPrincipal Hydel. The Prime movers of the generators are run by discharging waterthrough water turbines.
2 Small Hydel
The Power stations utilising water heads available from the small Dams acrosscanals come under small Hydel. The Prime movers of the generators are run bydischarging water through water turbines.
3 Thermal
Thermal stations are based on steam turbines utilising steam raised in boilersusing Sui Gas as a fuel in the boilers.
4 Gas
Unlike the conventional thermal stations, natural (Sui) Gas is burnt and isexpanded directly in the gas turbines which are prime movers for the generators.
Definitions of important terms used in this section are as under:-
174
This section includes data on the following topics:
EXPLANATORY NOTESON
FUEL AND POWER SECTION

5 Diesel
Conventional Diesel Engines using high speed diesel oil are used as primemovers for the generators.
B - TARIFF
1 Domestic
General Supply for the purpose of this Tariff, means a supply for lamps, fans and
other single phase appliances such as heaters, cookers, radiators, airconditioners,
refrigerators and domestic tubewells etc. The rated capacity of any motor used in such
appliances shall not, however, exceed 4 kilowatts.
2 Commercial
General supply for the purpose of this Tariff, means a supply for lamps, fans and
other single phase appliances such as heaters, cookers, radiators, airconditioners,
refrigerators and tubewells for non-agricultural purposes etc. The rated capacity of
any motor used in such appliances shall not, however, exceed 4 kilowatts.
3 Industrial
'Industrial Supply' for the purpose of this Tariff, means a supply for bonafide
industrial purposes in factories, and also for water pumps, and tubewells operating on
three phase 400 volts other than those meant for the irrigation and reclamation of
agricultural land, and includes a supply for lamps and fans required for the offices and
for the normal working of the industry upto but not exceeding a total of 5 per cent of
the total units consumed for motor power during a month.
4 Agricultural
Means a supply for Light Irrigation Pumps and/or Tubewells intended solely for
irrigation or reclamation of agricultural land or forests and includes supply for lighting
of the tubewells chamber which shall also be charged at the above rates.
5 Public Lighting
Means a supply given to a local body charged with Public Lighting for the
purpose of illuminating Public lamps within the area of its jurisdiction.
6 Traction
The electricity supplied to railways for running trains e.g. Lahore-Khanewal section.
175

7
i) Licensee (Licenced under Part II of the Electricity Act, 1910) for the Purpose of
further distribution and resale in his area of supply.
ii) A Non-Licensee (Permitted under Part II of the Electricity Act, 1980) to engage
in the business of supplying energy for the purpose of further distribution and resale inhis area of supply.
iii) Other Consumers e.g. Railways, M.E.S., P.A.F., Cantonment Boards and otherGovernment and Semi-Government and approved institutions having their owndistribution facilities for the purpose of further distribution within their respectivejurisdiction.
8
1 Domestic Consumers
Domestic consumers include residential colonies, mosques, churches, temples,
madrassas, other religious places and hostels attached thereto, Govt. and Semi-Govt.
offices, hospitals, Govt. Guest Houses, Armed Forces Messes/Langers, Universities,
Colleges, Schools, Orphanges and other charitable institutions.
2 Commercial Consumers
All establishments registered as commercial units with local authorities or
dealing in consumers items for direct commercial sale like cafes, bakeries, milk shops,
tea stalls canteens, barber shops, laundries, tandoors, places of entertainment like
cinemas, clubs and theatres, all private offices, clinics and maternity homes.
3 Industrial Consumers
All consumers engaged in the processing of industrial raw material into value-added finished products irrespective of the volume of gas consumed.
C - Gas
For the purpose of this Tariff, means a supply given in bulk at one point to:-
Tariff `H'
Bulk176
For one point supply to residential colonies attached to premises of industrial supply Consumers who have their own distribution facilities with their own colonies (A.C. supply).

No. of Fields Production No. of Fields Production
1997-98 72 20543 22 7931 38.6
1998-99 77 19986 22 7364 36.8
1999-00 77 20395 22 7660 37.6
2000-01 73 21084 24 7383 35.0
2001-02 82 23194 24 7847 33.8
2002-03 94 23458 24 8113 34.6
2003-04 95 22625 24 6700 29.6
2004-05 101 241198 24 8481 3.5
2005-06 108 23935 25 8416 35.2
2006-07 110 24615 21 7856 31.9
1997-98 48 699737 14 43971 6.3
1998-99 62 744970 15 52192 7.0
1999-00 54 818215 14 54465 6.7
2000-01 61 875433 18 65700 7.5
2001-02 65 923758 17 70227 7.6
2002-03 81 992655 15 47644 4.8
2003-04 89 1202752 15 47644 4.0
2004-05 94 1344953 16 63832 4.7
2005-06 95 1400032 17 66446 4.7
2006-07 102 1413578 14 68608 4.9
177
Source : Directorate General, Petroleum Concessions, Govt. of Pakistan, Islamabad.
% Share of Punjab in ProductionYear
FUEL AND POWER
Table 123:- Crude Oil and Gas Production in Pakistan and The Punjab
OIL (′000' Barrels)
GAS (Million Cubic Feet)
Pakistan Punjab

Year Total Household Commercial Industrial Others (a)
1997-98 633744 215345 39255 373967 5177
1998-99 657951 203390 37423 413201 3937
1999-00 803125 256467 43022 501600 2036
2000-01 810065 222559 34561 551230 1715
2001-02 844640 227132 38250 577857 1401
2002-03 896615 241393 39441 613697 2084
2003-04 1200148 246742 42539 908489 2378
2004-05 1427550 277593 48875 1098383 2699
2005-06 1506825 272147 52653 1179609 2416
2006-07 1505163 305514 56996 1141575 1078
Year Total (Km.) Mainline (Km.) Loopline (Km.)
1997-98 4920 3087 1833
1998-99 4542 2718 1824
1999-00 4539 2715 1824
2000-01 4521 2695 1826
2001-02 4711 2765 1946
2002-03 4867 2782 2085
2003-04 5211 2950 2261
2004-05 5103 2645 2458
2005-06 6195 3737 2458
2006-07 6624 3874 2750
1100
1100
1100
1100
1630
1300
1630
1650
1630
178
Source:- Sui Northern Gas Pipelines Limited , Lahore.
a) Includes Gas carried for other companies through Sui Northern System.Source:- Sui Northern Gas Pipelines Limited , Lahore.
Table 125:- Sui Northern Gas Transmission System, The Punjab
Table 124:- Gas Consumption by Consumer Group, The Punjab
FUEL AND POWER
(Thousand Decca Cubic Metres)
Transmission Capacity per Day (MMSCFD)
1030

179
GAS CONSUMPTION BY CONSUMER GROUP
INDUSTRIAL COMMERCIAL HOUSE HOLD OTHERS
MILLION DCM
142815051507
1500
1200
1200
634
900
600
300
01997-98 2003-04 2004-05 2005-06 2006-07

2002-03 2003-04 2004-05 2005-06 2006-07
14528 16063 16113 16103 16234A. 5010 6460 6463 6463 6444
i) 4902 6352 6355 6355 63551 Mangla 1000 1000 1000 1000 10002 Tarbela 3478 3478 3478 3478 34783 Warsak 240 240 243 243 2434 Chashma low head 184 184 184 184 1845 Ghazi Borotha - 1450 1450 1450 1450
ii) 108 108 108 108 891 Chichoki Mallian 13 13 13 13 222 Dargai 20 20 20 20 203 Kurram Garhi 4 4 4 4 -4 Malakand 20 20 20 20 145 Nandipur 14 14 14 14 136 Rasul 22 22 22 22 147 Renala 1 1 1 1 48 Chitral 1 1 1 1 19 Shadiwal 13 13 13 13 1
B. 4740 4825 4834 4834 4834i. 3119 3119 3119 3119 3119
1 Faisalabad 132 132 132 132 1322 Guddu 640 640 640 640 6403 Jamshoro 850 850 850 850 8504 Multan 130 130 130 130 1305 Muzaffargarh 1350 1350 1350 1350 13506 Pasni 17 17 17 17 17
ii. 150 150 150 150 150Lakhra 150 150 150 150 150
iii. 38 123 132 132 1321 Punjgoor 38 38 38 38 382 Quetta - 35 35 35 353 Shahdara - 50 59 59 59
iv. 1433 1433 1433 1433 14331 Faisalabad 244 244 244 244 2442 Guddu 1015 1015 1015 1015 10153 Kotri 174 174 174 174 174
C. 4453 4453 4491 4481 44811 KAPCO 1638 1638 1638 1638 16383 AES Lalpir 362 362 362 362 3624 AES Pak. Gen. 365 365 365 365 3655 KEL 131 131 131 131 1316 SEPCOL 117 117 117 117 1177 ROUSCH 412 412 450 450 4508 HABIBULLAH 140 140 140 140 1409 FOUJI KABIRWALA 157 157 157 157 157
10 SABA POWER 134 134 135 135 13511 JAPAN POWER 135 135 134 135 13512 UCH POWER 586 586 586 586 58613 ALTERN ENERGY 11 11 11 - -14 LIBERTY 235 235 235 235 23515 JAGRAN (HYDEL) 30 30 30 30 30
D. 325 325 325 325 325E. - - - - 150
Coal
FUEL AND POWERTable 126:- Installed Generating Capacity of Power Stations, National Grid, WAPDA
( Megawatts )
Steam
Small Hydel
WAPDA National Grid (A+B+C+D+E)
Type / Power Station
G. E. Energy Rental
180
Source :- General Manager Planning (Power), WAPDA, Lahore.
Hydel -Total (i+ii)Major Hydel
Thermal Total (i to iv)
Thermal (IPPS)
Chashma Nuclear (PAEC)
Combined Cycle/Gas Turbine
Gas Turbine

Pakistan Punjab N.W.F.P. Sindh Balochistan FATA
609 100 509 - - -
Up to 1997-98 65951 34903 10529 14124 3131 3264
1998-99 67183 35793 10672 14299 3140 3279
1999-00 68292 36620 10942 14302 3140 3288
2000-01 69887 37443 11373 14535 3246 3290
2001-02 71586 38181 11888 14862 3348 3307
2002-03 73832 39834 12022 15145 3514 3317
2003-04 81025 43900 13238 16377 4189 3321
2004-05 90489 48796 15396 17832 5105 3360
2005-06 103253 57280 16153 18600 7371 3524
2006-07 117499 67020 18162 20281 8187 3524
181
Source:- Chief Engineer (R.E), WAPDA, Lahore.
Table127:- Villages/Settlements Electrified by Province, Pakistan
FUEL AND POWER
(Progressive Nos.)
Pre- WAPDA
Post - WAPDA
Year

Year Total Household & Commercial Industrial Tubewells (a) Others
1997-98 2847 2804 30 13 -
1998-99 3860 3819 34 7 -
1999-00 5335 5274 40 21 -
2000-01 4312 4231 43 38 -
2001-02 3828 3759 49 18 2
2002-03 4556 4461 54 39 2
2003-04 6247 6128 53 64 2
2004-05 7085 6902 72 109 2
2005-06 8014 7747 92 173 2
2006-07 8736 8528 95 111 2
1997-98 1732 1711 15 6 -
1998-99 3146 3121 21 4 -
1999-00 1041 946 10 85 -
2000-01 628 606 10 12 -
2001-02 679 659 11 9 -
2002-03 952 900 9 43 -
2003-04 1213 1130 12 71 -
2004-05 1327 1176 19 132 -
2005-06 1751 1502 28 221 -
2006-07 1562 1334 26 201 1
a) Public and Private Source:- General Manager Operations WAPDA, Lahore.
(Hundred Numbers)
II. Applications Pending
I. New Connections Given
182
Table 128:- New Electricity Connections Given and Applications Pending with
FUEL AND POWER
WAPDA by Consumer Group, The Punjab
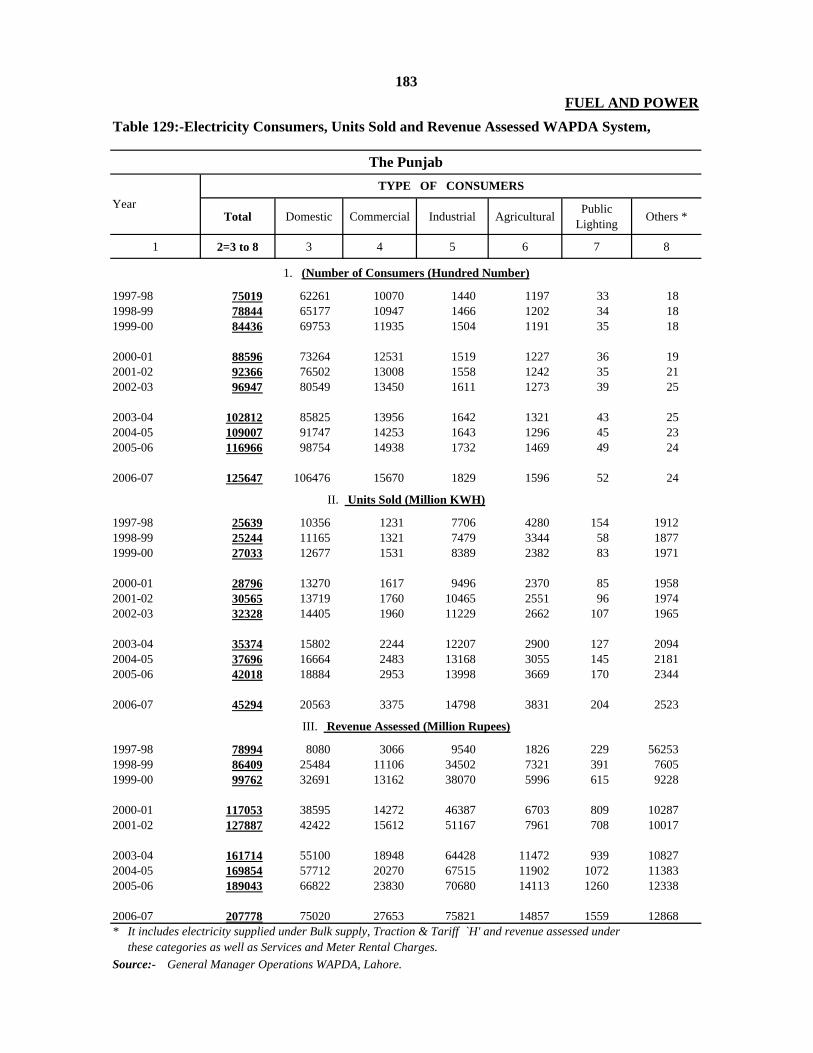
Total Domestic Commercial Industrial Agricultural Public Lighting Others *
1 2=3 to 8 3 4 5 6 7 8
1997-98 75019 62261 10070 1440 1197 33 181998-99 78844 65177 10947 1466 1202 34 181999-00 84436 69753 11935 1504 1191 35 18
2000-01 88596 73264 12531 1519 1227 36 192001-02 92366 76502 13008 1558 1242 35 212002-03 96947 80549 13450 1611 1273 39 25
2003-04 102812 85825 13956 1642 1321 43 252004-05 109007 91747 14253 1643 1296 45 232005-06 116966 98754 14938 1732 1469 49 24
2006-07 125647 106476 15670 1829 1596 52 24
1997-98 25639 10356 1231 7706 4280 154 19121998-99 25244 11165 1321 7479 3344 58 18771999-00 27033 12677 1531 8389 2382 83 1971
2000-01 28796 13270 1617 9496 2370 85 19582001-02 30565 13719 1760 10465 2551 96 19742002-03 32328 14405 1960 11229 2662 107 1965
2003-04 35374 15802 2244 12207 2900 127 20942004-05 37696 16664 2483 13168 3055 145 21812005-06 42018 18884 2953 13998 3669 170 2344
2006-07 45294 20563 3375 14798 3831 204 2523
1997-98 78994 8080 3066 9540 1826 229 562531998-99 86409 25484 11106 34502 7321 391 76051999-00 99762 32691 13162 38070 5996 615 9228
2000-01 117053 38595 14272 46387 6703 809 102872001-02 127887 42422 15612 51167 7961 708 10017
2003-04 161714 55100 18948 64428 11472 939 108272004-05 169854 57712 20270 67515 11902 1072 113832005-06 189043 66822 23830 70680 14113 1260 12338
2006-07 207778 75020 27653 75821 14857 1559 12868
Source:- General Manager Operations WAPDA, Lahore.
* It includes electricity supplied under Bulk supply, Traction & Tariff `H' and revenue assessed under
1. (Number of Consumers (Hundred Number)
II. Units Sold (Million KWH)
III. Revenue Assessed (Million Rupees)
FUEL AND POWER
these categories as well as Services and Meter Rental Charges.
Table 129:-Electricity Consumers, Units Sold and Revenue Assessed WAPDA System,
183
The Punjab
YearTYPE OF CONSUMERS

184
ELECTRICITY CONSUMPTION BY CONSUMERELECTRICITY CONSUMPTION BY CONSUMERGROUP THE PUNJAB : 1997-98 , 2003-04 TO 2006-07
DOMESTIC
COMMERCIAL
AGRICULTURALINDUSTRIAL
OTHERS
MILLION KWH 42018
37636
45294
42000
37636
35374
30000
36000
25639
24000
30000
12000
18000
0
6000
01997-98 2003-04 2004-05 2005-06 2006-07
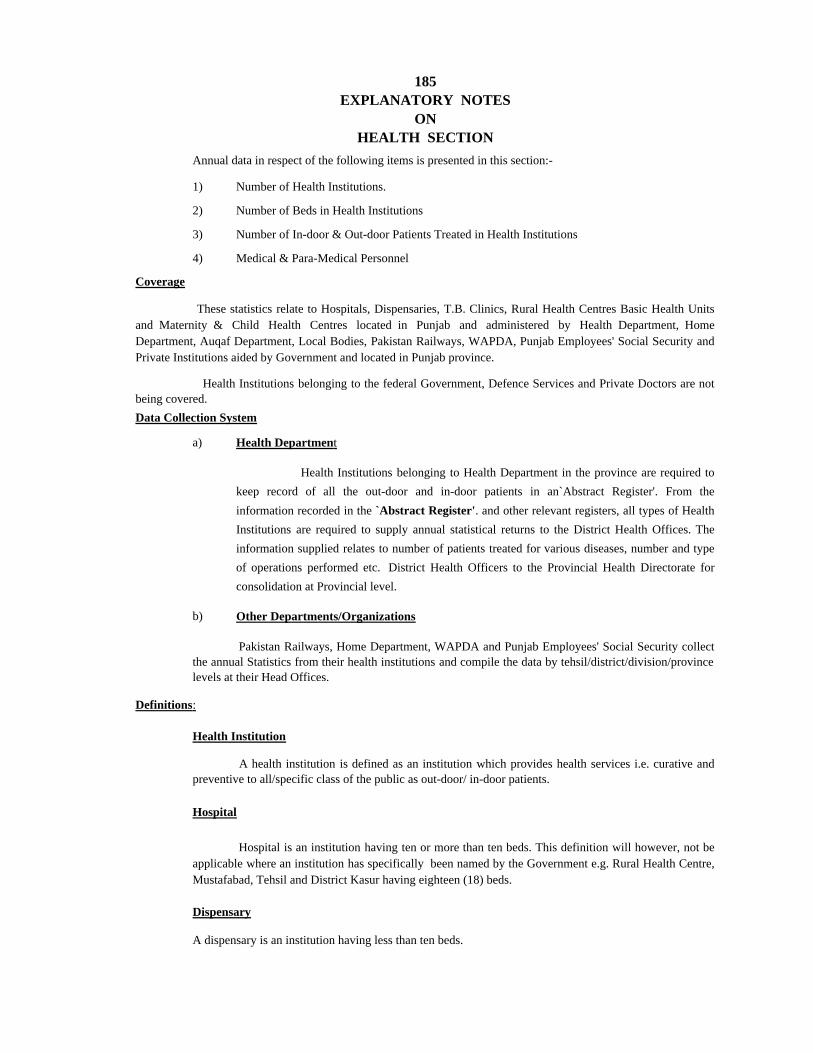
1) Number of Health Institutions.
2) Number of Beds in Health Institutions
3) Number of In-door & Out-door Patients Treated in Health Institutions
4) Medical & Para-Medical Personnel
a) Health Department
Health Institutions belonging to Health Department in the province are required tokeep record of all the out-door and in-door patients in an`Abstract Register'. From theinformation recorded in the `Abstract Register'. and other relevant registers, all types of HealthInstitutions are required to supply annual statistical returns to the District Health Offices. Theinformation supplied relates to number of patients treated for various diseases, number and typeof operations performed etc. District Health Officers to the Provincial Health Directorate forconsolidation at Provincial level.
b) Other Departments/Organizations
HEALTH SECTION
Pakistan Railways, Home Department, WAPDA and Punjab Employees' Social Security collectthe annual Statistics from their health institutions and compile the data by tehsil/district/division/provincelevels at their Head Offices.
Annual data in respect of the following items is presented in this section:-
Data Collection System
Coverage
These statistics relate to Hospitals, Dispensaries, T.B. Clinics, Rural Health Centres Basic Health Unitsand Maternity & Child Health Centres located in Punjab and administered by Health Department, HomeDepartment, Auqaf Department, Local Bodies, Pakistan Railways, WAPDA, Punjab Employees' Social Security andPrivate Institutions aided by Government and located in Punjab province.
Health Institutions belonging to the federal Government, Defence Services and Private Doctors are notbeing covered.
185
Hospital is an institution having ten or more than ten beds. This definition will however, not beapplicable where an institution has specifically been named by the Government e.g. Rural Health Centre,Mustafabad, Tehsil and District Kasur having eighteen (18) beds.
Dispensary
A dispensary is an institution having less than ten beds.
Definitions:
Health Institution
A health institution is defined as an institution which provides health services i.e. curative andpreventive to all/specific class of the public as out-door/ in-door patients.
Hospital
EXPLANATORY NOTESON

2003 2004 2005 2006 2007
i) Hospitals 298 306 308 308 325
ii) Dispensaries 1241 1227 1333 1333 1260
iii) Rural Health Centres 294 298 295 295 333
iv) T.B. Clinics 48 50 41 41 40
v) Basic Health Units 2427 2405 2456 2456 2529
vi) Sub-Health Centres 570 574 454 454 520
vii) M.C.H. Centres 475 492 513 513 347
i) Hospitals 33724 33334 34612 34612 36851
ii) Dispensaries 1605 1950 1973 1973 316
iii) Rural Health Centres 5764 5800 5900 5900 5866
iv) T.B. Clinics 36 36 72 72 294
v) Basic Health Units 4486 3944 4912 4912 4908
Source : -
6 Director General Medical Services, WAPDA.
1 Health Department, Government of the Punjab.
2 Home Department (I.G. Prisons), Government of the Punjab.
3 Auqaf Department, Government of the Punjab.
4 Punjab Employee's Social Security Institutions.
1. Number of Institutions
2. Number of Beds
186
5 Pakistan Railways.
Health Facility
HEALTH
Table 130:- Health Institutions and Their Bed Strength, The Punjab
(As on Ist January)
(Number)
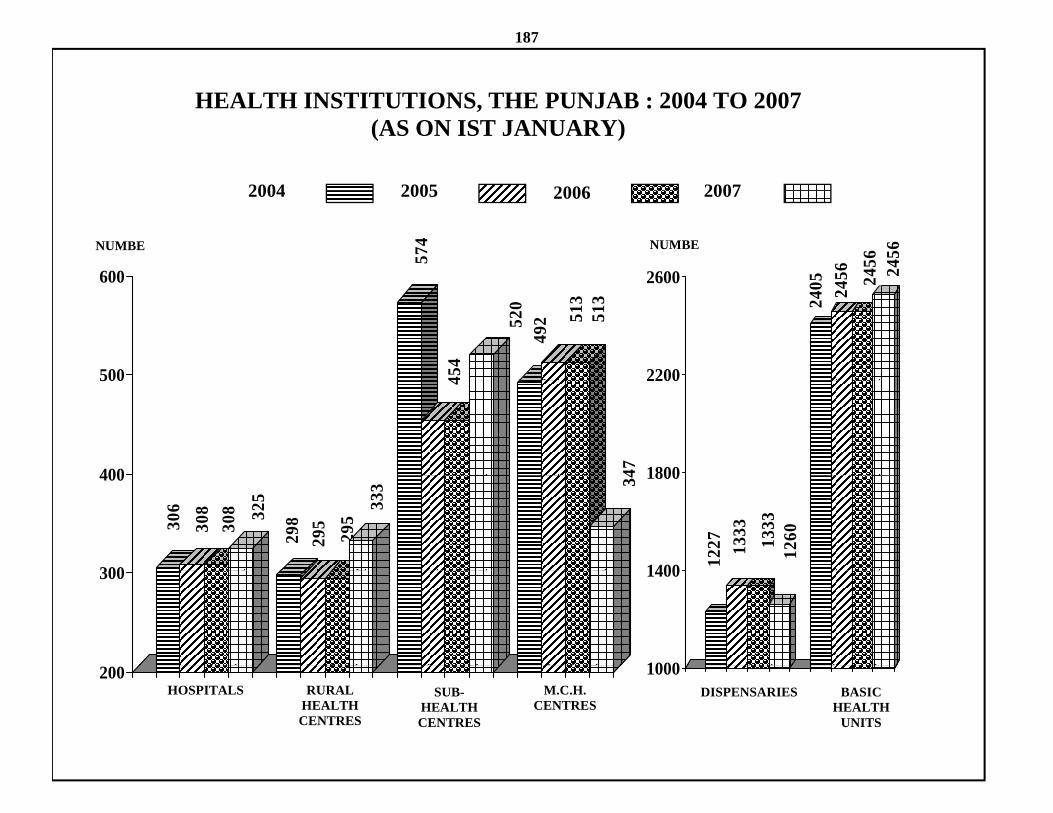
187
HEALTH INSTITUTIONS THE PUNJAB 2004 TO 2007HEALTH INSTITUTIONS, THE PUNJAB : 2004 TO 2007(AS ON IST JANUARY)
2004 2005 2006 2007
NUMBE NUMBE
2004 2005 2006 2007
574
600 05 456 24
5624
56
2600
454
454
520
492 51
351
3
500
240 242
22004 4
47400
500
1800
2200
306
308
308 32
5
298
295
295
333 34
300
400
1227 13
33 1333
1260
1400
1800
300
1000
1400
HOSPITALS RURAL HEALTH CENTRES
SUB-HEALTH CENTRES
M.C.H. CENTRES
DISPENSARIES BASIC HEALTH
UNITS
200 1000
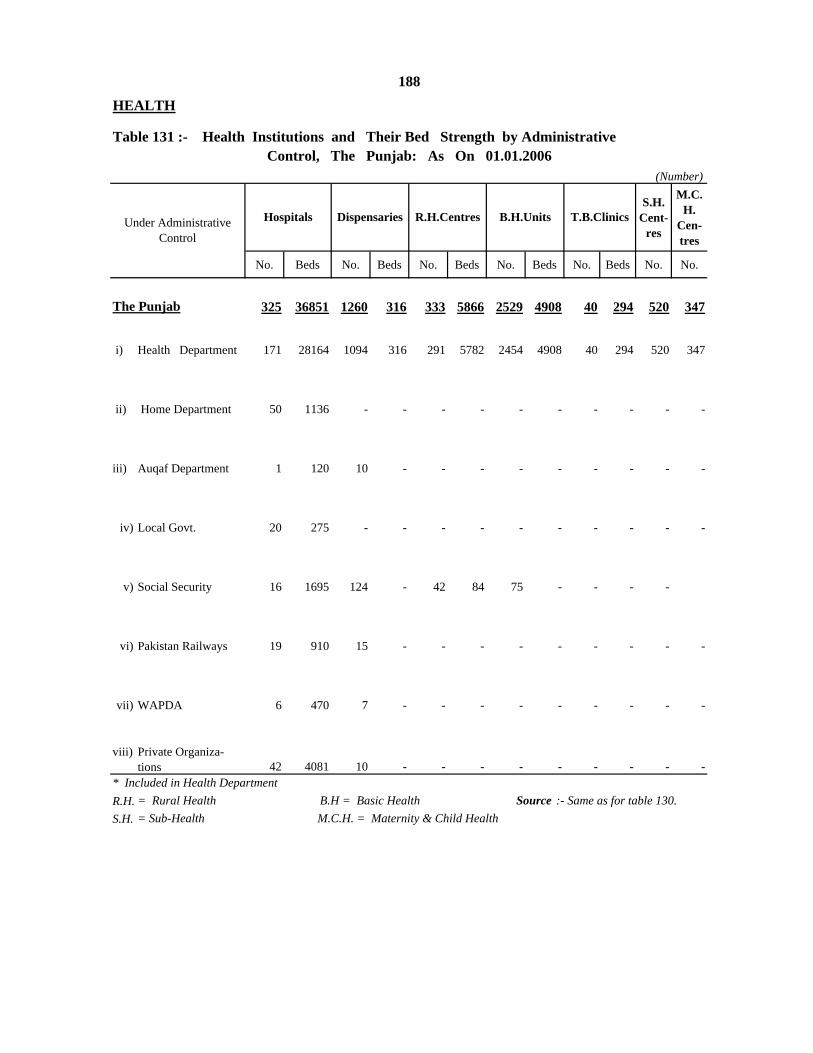
S.H. Cent-
res
M.C.H.
Cen-tres
No. Beds No. Beds No. Beds No. Beds No. Beds No. No.
325 36851 1260 316 333 5866 2529 4908 40 294 520 347
i) Health Department 171 28164 1094 316 291 5782 2454 4908 40 294 520 347
ii) Home Department 50 1136 - - - - - - - - - -
iii) Auqaf Department 1 120 10 - - - - - - - - -
iv) Local Govt. 20 275 - - - - - - - - - -
v) Social Security 16 1695 124 - 42 84 75 - - - -
vi) Pakistan Railways 19 910 15 - - - - - - - - -
vii) WAPDA 6 470 7 - - - - - - - - -
viii) Private Organiza- tions 42 4081 10 - - - - - - - - -
R.H.S.H.
= Rural Health B.H = Basic Health Source :- Same as for table 130.= Sub-Health M.C.H. = Maternity & Child Health
B.H.Units T.B.ClinicsUnder Administrative Control
Hospitals Dispensaries R.H.Centres
The Punjab
188
* Included in Health Department
HEALTH
Table 131 :- Health Institutions and Their Bed Strength by Administrative Control, The Punjab: As On 01.01.2006
(Number)

Total Male Total Male
1998 34190 24194 1489 1017 5910 4834 122 94
1999 35954 25112 1627 1090 6303 5156 132 102
2000 37607 25951 1732 1136 6692 5461 138 105
2001 39212 26704 1871 1193 7163 5811 150 115
2002 41193 27680 1999 1246 7594 6162 163 128
2003 43334 28723 2170 1320 8059 6526 171 134
2004 45487 29721 2450 1434 8518 6881 182 132
2005 48065 30694 2664 1511 9117 7334 192 138
2006 50302 31700 2888 1603 9594 7649 198 142
2007 52531 32666 3229 1714 10196 8069 213 153
Calendar Year
1998
1999
2000
2001
2002
2003
2004
2005
2006
2007
Source:- Pakistan Nursing Council (PNC), Islamabad.
Doctors(M.B.B.S) Denstists(BDS)
Source :- Pakistan Medical & Dental Council (PMDC), Islamabad .
Medical Dental
Table 133:- Number of Registered Nurses, LHVs, Midwives and Naib/Dais, The Punjab(Progressive Nos.)
Nurses LHVs Midwives Naib/Dais
189
Calendar Year
HEALTHTable 132 :- Number Of Registered Medical Personnel By Gender, The Punjab
(Progressive Nos.)
Specialists
Total Male Total Male
29575
31931
34467
24690
25883
27260
4908
5092
5354
5698
6298
6706
775040700
6784
6994
7345
35889
37574
39023
3993769
3279
3461
3628
2927
3066
3142
299
336
359
382
387
397
402
403
4055560
5173
5340

Doctors Dentists NursesPopulation
(Million Persons)
Hospitals/ Dispensaries
Beds in Hospitals/
DispensariesDoctors Dentists Nurses
1998 1744 33121 34190 1489 24690 75.091 23 441 455 20 329
1999 1746 33386 35954 1627 25883 76.893 23 434 468 21 337
2000 1740 33594 37607 1732 27260 78.738 22 427 477 22 346
2001 1750 33946 39212 1871 29575 80.156 22 424 489 23 369
2002 1751 35433 41193 1999 31931 81.598 22 440 511 24 391
2003 1539 35329 43334 2170 34467 83.067 19 425 522 26 415
2004 1533 35272 45487 2450 35889 84.563 18 417 538 29 424
2005 1641 36585 48065 2664 37574 84.562 19 425 559 31 437
2006 1641 36585 50302 2888 39023 87.548 19 420 575 33 446
2007 1585 37167 52531 3229 40700 89.036 18 417 590 36 457
190
Source:- Same as for tables 132& 133
Per Million Population
HEALTH
Table 134 :- Health Facilities Per Million Population, The Punjab
Calendar Year
No. of Hospitals/
Dispensaries
No. of Beds in
Hospitals/ Dispensaries
Progressive Number

S.H. Cen-tres
M.C.H. Cen-tres
No. Beds No. Beds No. Beds No. Beds No. Beds No. No.
The Punjab 325 36851 1260 316 333 5866 2529 4908 40 294 520 347
Bahawalpur Distt. 13 1845 64 4 11 202 77 142 3 0 0 10Ahmadpur East 1 90 18 - 3 60 24 46 - - - 2Bahawalpur 8 1586 5 - - - 4 4 2 - - 6Bahawalpur Sadar 1 9 15 - 4 62 12 24 - - - -Hasilpur 1 40 9 - 2 40 17 28 1 - - 2Khairpur Tamewali 1 60 2 - - - 5 10 - - - -Yazman 1 60 15 4 2 40 15 30 - - - -
Bahawalnagar Distt. 7 493 45 0 10 200 105 202 3 0 33 7Bahawalnagar 3 273 11 - 2 40 27 50 2 - 7 2Chishtian 1 60 7 - 3 60 24 46 - 9 1Fort Abbas 1 60 7 - 2 40 14 28 - 7 1Haroonabad 1 60 11 - 1 20 22 42 - 4 2Minchinabad 1 40 9 - 2 40 18 36 1 - 6 1
R.Y.Khan Distt. 11 1024 62 0 19 356 106 208 3 36 0 7Khanpur 4 140 14 - 4 68 22 44 1 - - 1Liaquatpur 1 60 14 - 5 88 29 56 - - - -R. Y. Khan 4 771 17 - 5 100 30 60 1 36 - 4Sadiqabad 2 53 17 - 5 100 25 48 1 - - 2
D.G.Khan Distt. 6 435 35 4 11 184 54 106 3 36 34 5D.G. Khan 5 355 26 2 8 124 35 68 2 36 23 4Taunsa 1 80 9 2 3 60 19 38 1 - 11 1
Layyah Distt. 4 455 13 0 3 60 42 84 0 0 15 2Chaubara 1 40 6 - - - 6 12 - - - 1Karor 1 40 3 - 1 20 17 34 - - 4 -Layyah 2 375 4 - 2 40 19 38 - - 11 1
Muzaffargarh Distt. 9 356 27 0 14 262 77 142 1 36 24 4Ali Pur 1 40 4 - 2 40 12 24 - - 24 1Jatoi - - 3 - 2 40 13 26 - - - -Kot Addu 4 92 6 - 4 80 21 38 - - - 1Muzaffargarh 4 224 14 - 6 102 31 54 1 36 - 2
Rajanpur Distt. 5 261 11 0 6 120 32 64 0 0 16 1Jampur 2 84 3 - 3 60 14 28 - - 11 -Rajanpur 2 137 4 - 2 40 12 24 - - 4 1Rojhan 1 40 4 - 1 20 6 12 - - 1 -
T.B. ClinicsDistrict/ Tehsil
Hospitals Dispensaries R.H. Centres B.H. Units
191HEALTH
Table 135:- Health Institutions By Tehsil, The Punjab: As on 01.01.2007( Number )

S.H. Cen-tres
M.C.H. Cen-tres
No. Beds No. Beds No. Beds No. Beds No. Beds No. No.
Sub-Total 88 7399 349 148 90 1566 751 1458 11 16 212 60Faisalabad Distt. 24 3283 124 0 17 232 170 336 2 0 34 6Chak Jhumra - - - - - - 1 - - - - -Faisalabad 20 3113 80 - 6 66 67 132 2 - 10 5Jaranwala 2 70 17 - 7 86 51 102 - - 12 -Sammundri 1 60 24 - 4 80 51 102 - - 12 1Tandlianwala 1 40 3 - - - - - - - - -
Jhang Distt. 11 597 49 6 16 302 101 188 2 0 45 8Ahmadpur Sial - - 4 2 2 40 9 18 - - 6 -Chiniot 2 188 13 2 5 100 36 72 1 - 14 2Jhang 8 341 24 2 8 142 42 72 1 - 22 4Shorkot 1 68 8 - 1 20 14 26 - - 3 2
T. T. Singh Distt. 4 400 25 0 7 122 69 132 1 0 20 3Gojra 1 150 6 - 1 20 25 48 - - 4 -Kamalia 1 100 10 - 2 40 17 32 - - 7 1T.T. Singh 2 150 9 - 4 62 27 52 1 - 9 2
Gujranwala Distt. 14 1174 46 84 14 208 93 176 1 0 35 9Gujranwala 11 1050 31 40 5 46 30 52 - - 7 8Kamoke 1 60 6 16 1 20 17 34 - - 5 -Noshera Virkan - - 4 8 1 20 23 44 - - 3 -Wazirabad 2 64 5 20 7 122 23 46 1 - 20 1
Gujrat Distt. 12 543 26 24 9 180 89 178 0 0 30 8Gujrat 9 478 16 14 4 80 46 92 - - 13 7Kharian 3 65 9 8 4 80 36 72 - - 16 1Sarai Alamgir - - 1 2 1 20 7 14 - - 1 -
Hafizabad Distt. 2 185 12 4 5 82 32 62 1 0 16 4Hafizabad 1 125 8 4 2 40 16 30 1 - 8 2Pindi Bhattian 1 60 4 - 3 42 16 32 - - 8 2
M. Baha-ud-Din Distt. 6 159 17 0 8 160 52 100 1 6 14 4Malakwal - - 4 - 2 40 16 32 - - 1 1Mandi Baha-ud-Din 5 119 6 - 3 60 20 38 1 6 6 2Phalia 1 40 7 - 3 60 16 30 - - 7 1
Narowal Distt. 2 80 15 20 7 140 57 112 1 0 2 4Narowal 1 40 5 12 4 80 27 52 - - 3Shakargarh 1 40 10 8 3 60 30 60 1 - 2 1
Sialkot Distt. 13 978 35 10 7 140 88 174 2 10 16 14Daska 2 239 6 5 2 40 18 36 1 5 5 2Pasrur 1 40 10 0 2 40 28 56 0 0 3 2Sambrial 1 20 6 5 1 20 15 28 0 0 5 2Sialkot 9 679 13 0 2 40 27 54 1 5 3 8
Table 135:- Health Institutions by Tehsil, The Punjab: As on 01.01.2007- Contd.
192
District/ TehsilHospitals Dispensaries R.H. Centres
( Number )
B.H. Units T.B. Clinics
HEALTH

S.H. Cen-tres
M.C.H. Cen-tres
No. Beds No. Beds No. Beds No. Beds No. Beds No. No.Sub-Total 109 17968 384 42 100 1758 766 1502 8 40 108 153Lahore Distt. 42 12509 114 0 12 132 38 74 2 - 11 67Lahore 42 12509 114 - 12 132 38 74 2 - 11 67
Kasur Distt. 6 337 27 0 16 248 83 162 1 0 0 8Chunian 1 40 5 - 3 60 21 40 - - - 2Kasur 4 237 13 - 8 124 39 76 - - - 5Pattoki 1 60 9 - 5 64 23 46 1 - - 1
Nankana 3 92 24 0 9 216 63 122 1 0 9 6Safdarabad - - 2 - 2 48 14 28 - - 2 -Shahkot 1 40 5 - 1 24 9 18 - - 2 -Sangla Hill 1 8 4 - 1 24 11 20 - - - 3Nankana 1 44 13 - 5 120 29 56 1 - 5 3
Okara Distt. 4 411 27 0 10 200 96 192 1 0 0 11Depalpur 2 100 10 - 5 100 49 98 - - - 5Okara 2 311 13 - 2 40 29 58 1 - - 5Renala Khurd - - 4 - 3 60 18 36 - - - 1
Sheikhupura Distt. 10 647 47 30 9 172 66 130 1 40 15 15Ferozewala - - 6 4 1 24 15 30 - - 5 2Muridke 1 68 16 8 2 26 18 34 - - 4 -Sharaqpur 1 18 2 2 1 24 5 10 - - - 2Sheikhupura 8 561 23 16 5 98 28 56 1 40 6 11
Multan Distt. 15 2266 48 0 10 146 78 148 0 0 14 24Jalalpur Pirwala 1 60 8 - - - 16 32 - - - 1Multan City 13 2146 34 - 8 106 48 90 - - 7 19Shujabad 1 60 6 - 2 40 14 26 - - 7 4
Khanewal Distt. 8 332 13 0 4 80 84 168 1 0 3 4Jahanian 1 40 1 - - - 11 22 - - - -Kabirwala 1 60 2 - 2 40 32 64 - - 2 1Khanewal 3 148 3 - 1 20 19 38 1 - - 2Mian Channu 3 84 7 - 1 20 22 44 - - 1 1
Lodhran Distt. 4 132 10 8 4 80 50 96 0 0 7 1Dunyapur 1 40 4 8 2 40 14 28 - - 7 -Karor Pacca 1 40 3 - - - 17 32 - - - 1Lodhran 2 52 3 - 2 40 19 36 - - - -
Pakpattan Distt. 5 145 14 0 4 80 53 106 1 0 8 2Arifwala 2 62 2 - 2 40 26 52 - - 2 1Pakpattan 3 83 12 - 2 40 27 54 1 - 6 1
Sahiwal Distt. 8 827 23 4 11 202 77 150 0 0 18 8Chichawatni 1 60 10 - 5 100 36 70 - - 10 3Sahiwal 7 767 13 4 6 102 41 80 - - 8 5
Vehari Distt. 4 270 37 0 11 202 78 154 0 0 23 7Burewala 1 60 9 - 3 42 25 50 - - 8 2Mailsi 1 60 13 - 2 40 29 58 - - 7 1Vehari 2 150 15 - 6 120 24 46 - - 8 4
District/ Tehsil Hospitals Dispensaries R.H. Centres
HEALTHTable 135:- Health Institutions by Tehsil, The Punjab: As on 01.01.2007-Contd.
( Number )
193
B.H. Units T.B. Clinics

S.H. Cen-tres
M.C.H. Cen-tres
No. Beds No. Beds No. Beds No. Beds No. Beds No. No.Sub-Total 73 6615 270 118 69 1158 519 1000 8 130 78 98Rawalpindi Distt. 17 3576 87 24 13 206 103 196 2 0 0 49Gujar Khan 1 60 7 4 3 60 30 56 - - - 7Kahuta 1 40 13 8 - - 11 22 - - - 8Kallar Syedan - - - - 1 20 8 16 - - - 5Kotli Sattian - - 9 - 2 40 8 16 - - - 4Murree 3 472 14 4 1 20 14 28 - - - 8Rawalpindi 11 2964 44 8 6 66 26 46 2 - - 10Taxila 1 40 - - - - 6 12 - - - 7
Attock Distt. 9 448 20 0 6 102 57 114 0 0 3 7Attock 3 198 3 - - - 8 16 - - 2Fateh Jang 1 40 5 - 1 20 11 22 - - 2 1Hassanabdal 1 30 2 - 1 2 6 12 - - - -Hazro 1 60 2 - 1 20 10 20 - - - -Jand 2 52 6 - 2 40 13 26 - - - 2Pindi Gheb 1 68 2 - 1 20 9 18 - - 1 2
Chakwal Distt. 5 229 11 0 9 170 72 132 - - 0 3Chakwal 3 129 5 - 5 90 28 56 - - - 3Choa Saidan Shah 1 50 3 - - - 15 18 - - - -Kalar Kahar - - 1 - 1 20 8 16 - - - -Talagang 1 50 2 - 3 60 21 42 - - - -
Jhelum Distt. 10 453 24 0 6 102 45 88 1 30 4 5Dina - - 1 - 1 20 10 20 - - - -Jhelum 7 367 10 - 2 22 10 20 1 30 2 3Pind Dadan Khan 2 46 7 - 2 40 13 24 - - 1 2Sohawa 1 40 6 - 1 20 12 24 - - 1 -
Sargodha Distt. 16 941 49 64 16 256 120 234 1 100 28 19Bhalwal 2 70 5 12 4 62 19 38 - - 1 1Sahiwal 1 40 6 12 2 22 11 22 - - 7 5Kot Momin - - 2 4 5 84 16 32 - - 6 1Sargodha 10 741 20 16 3 60 47 88 1 100 12 8Shahpur 2 50 11 16 1 20 12 24 - - 2 3Sillanwali 1 40 5 4 1 8 15 30 - - - 1
Bhakkar Distt. 3 231 39 30 5 82 40 80 1 0 13 2Bhakkar 1 151 17 8 2 22 14 28 1 - 3 1Darya Khan - - 6 10 2 40 8 16 - - 3Kalur Kot 1 40 9 4 1 20 10 20 - - 7 1Mankera 1 40 7 8 - - 8 16 - - - -
Khushab Distt. 8 393 34 0 5 60 41 76 1 0 9 7Khushab 6 305 19 - 5 60 31 58 1 9 7Nurpur 1 40 14 - - - 9 18 - - - -Qaidabad 1 48 1 - - - 1 - - - - -
Mianwali Distt. 5 344 6 0 9 180 41 80 2 0 21 6Isa Khel 2 84 - 3 60 10 20 1 - 6 3Mianwali 3 260 2 - 4 80 22 42 1 - 7 3Piplan - - 4 - 2 40 9 18 - - 8 -
District/ Tehsil Hospitals Dispensaries R.H. Centres B.H. Units T.B. Clinics
( Number )
HEALTHTable 135:- Health Institutions by Tehsil, The Punjab: As on 01.01.2007-Concld.
Source:- Same as for table 130.
194

No. Beds No. Beds No. Beds No. Beds
The Punjab 325 36851 263 32495 20 275 42 4081Bahawalpur 13 1845 12 1805 - - 1 40Bahawalnagar 7 493 6 479 - - 1 14R. Y. Khan 11 1024 10 1008 1 16 - -
D. G. Khan 6 435 6 435 - - - -Layyah 4 455 4 455 - - - -Muzaffargarh 9 356 6 324 3 32 - -Rajanpur 5 261 4 237 1 24 - -
Faisalabad 24 3283 14 2400 - - 10 883Jhang 11 597 7 412 2 5 2 180Toba Tek Singh 4 400 4 400 - - - -
Gujranwala 14 1174 8 767 - - 6 407Gujrat 12 543 9 471 1 12 2 60Hafizabad 2 185 2 185 - - - -M. Baha-ud-Din 6 159 5 149 - - 1 10Narowal 2 80 2 80 - - - -Sialkot 13 978 10 869 - - 3 109
Lahore 42 12509 38 10863 - - 4 1646Kasur 6 337 6 337 - - - -Nankana 3 92 2 84 1 8 -Okara 4 411 4 411 - - - -Sheikhupura 10 647 7 569 1 18 2 60
Multan 15 2266 13 2238 2 28 - -Khanewal 8 332 4 256 4 76 - -Lodhran 4 132 3 120 1 12 - -Pakpattan 5 145 3 111 2 34 - -Sahiwal 8 827 6 647 - - 2 180Vehari 4 270 4 270 - - - -
Rawalpindi 17 3576 15 3268 - - 2 308Attock 9 448 9 448 - - - -Chakwal 5 229 4 219 - - 1 10Jhelum 10 453 9 436 - - 1 17
Sargodha 16 941 12 799 1 10 3 132Bhakkar 3 231 3 231 - - - -Khushab 8 393 7 368 - - 1 25Mianwali 5 344 5 344 - - - -Source : - Same as for table 130.
195
District
HEALTH
Table 136:-Hospitals by Management Group and District, The Punjab As on 01-01-2006(Number)
TOTAL HOSPITALS GOVERNMENT LOCAL BODIES PRIVATE

Total In-door Out-door
1998 31983 19852 1303 18549 2463 9668
1999 36454 24491 1545 22946 2136 9827
2000 37843 26367 1627 24740 2395 9081
2001 37843 26367 1627 24740 2395 9081
2002 37890 26414 1674 24740 2395 9081
2003 37890 26414 1674 24740 2395 9081
2004 51496 39940 1999 37941 2475 9081
2005 60933 49377 2390 46987 2475 9081
2006 67027 54315 2629 51686 2723 9989
2007 79830 65360 2078 63282 3514 10956
a) =Note:-Source:- 1)
2)3)4)5)
Includes Patients treated in R.H.Cs, BHUs, Sub-Health Centres, T.B. Clinics and M.C.H. Centres.Excludes the patients treated in the health institutions run by Social Security.
H O S P I T A L SDispensaries Other Health
Centres (a)
WAPDA.
Health Department, Government of the Punjab.Home Department ( I. G. Prisons ), Government of the Punjab.Auqaf Department, Government of the Punjab.Pakistan Railways.
196
Total
HEALTH
(Thousand)
Table 137 : - Patients Treated by Various Health Institution, The Punjab
Calendar Year

District TOTAL GOVERNMENT LOCAL BODIES PRIVATE
The Punjab 65360 59293 1191 4876
Bahawalpur 2923 2908 - 15Bahawalnagar 1878 1873 - 5Rahim Yar Khan 2886 2856 30 -
D. G. Khan 916 916 - -Layyah 1067 1067 - -Muzaffargarh 1541 1395 146 -Rajanpur 679 617 62 -
Faisalabad 7330 5703 - 1627Jhang 2326 2272 49 5T. T. Singh 951 951 - -
Gujranwala 2329 2000 - 329Gujrat 2231 2026 80 125Hafizabad 889 889 - -Mandi Baha-ud-Din 1009 940 - 69Narowal 1011 1011 - -Sialkot 1877 1814 - 63
Lahore 6778 5678 - 1100Kasur 2068 2068 - -Nankana 716 679 37Okara 1294 1294 - -Sheikhupura 951 875 32 44
Multan 2224 2110 114 -Khanewal 1516 997 519 -Lodhran 1237 1206 31 -Pakpattan 890 842 48 -Sahiwal 2068 1753 - 315Vehari 742 742 - -
Rawalpindi 4271 3581 - 690Attock 1003 1003 - -Chakwal 1831 1613 - 218Jhelum 890 830 - 60
Sargodha 2451 2280 43 128Bhakkar 883 883 - -Khushab 728 645 - 83Mianwali 976 976 - -Source:- Same as for table 134.
197HEALTH
Table138:- Patients Treated in Hospitals by Management and District,
(Thousand Number)The Punjab As on 1.01.2007

In-door Out-door In-door Out-door In-door Out-door In-door Out-door
The Punjab 2078 63282 1689 57604 69 1122 320 4556
Bahawalpur 106 2817 104 2804 - - 2 13Bahawalnagar 35 1843 34 1839 - - 1 4Rahim Yar Khan 70 2816 64 2792 6 24 - -
D. G. Khan 35 881 35 881 - - - -Layyah 19 1048 19 1048 - - - -Muzaffargarh 32 1509 21 1374 11 135 - -Rajanpur 18 661 13 604 5 57 - -
Faisalabad 209 7121 120 5583 - - 89 1538Jhang 42 2284 37 2235 4 45 1 4T. T. Singh 35 916 35 916 - - - -
Gujranwala 127 2202 103 1897 - - 24 305Gujrat 85 2146 55 1971 12 68 18 107Hafizabad 14 875 14 875 - - - -Mandi Baha-ud-Din 13 996 10 930 - - 3 66Narowal 7 1004 7 1004 - - - -Sialkot 49 1828 46 1768 - - 3 60
Lahore 409 6369 334 5344 - - 75 1025Kasur 31 2037 31 2037 - - - -Nankana 10 706 8 671 2 35Okara 47 1247 47 1247 - - - -Sheikhupura 33 918 22 853 3 29 8 36
Multan 147 2077 132 1978 15 99 - -Khanewal 18 1498 13 984 5 514 - -Lodhran 7 1230 6 1200 1 30 - -Pakpattan 10 880 8 834 2 46 - -Sahiwal 48 2020 36 1717 - - 12 303Vehari 40 702 40 702 - - - -
Rawalpindi 175 4096 130 3451 - - 45 645Attock 28 975 28 975 - - - -Chakwal 35 1796 25 1588 - - 10 208Jhelum 25 865 21 809 - - 4 56
Sargodha 45 2406 22 2258 3 40 20 108Bhakkar 23 860 23 860 - - - -Khushab 13 715 8 637 - - 5 78Mianwali 38 938 38 938 - - - -Source :- Same as for table 134.
198
District
Table 139 :- Indoor/Outdoor Patients Treated in Hospitals by Management Group & DistrictThe Punjab As on 01.01.2007
(Thousand Number)PRIVATELOCAL BODIESGOVERNMENTTOTAL
HEALTH

Total Urban Rural Total Urban Rural
The Punjab 7538 1968 5570 10538 3200 7338 1.99
Bahawalpur 231 50 181 355 93 262 2.56Bahawalnagar 223 38 185 307 56 251 1.9Rahim Yar Khan 271 45 226 416 82 334 2.55
D.G. Khan 143 15 128 209 30 179 2.26Layyah 104 10 94 152 19 133 2.26Muzaffargarh 233 22 211 359 46 313 2.58Rajanpur 97 11 86 152 20 132 2.68
Faisalabad 547 160 387 751 315 436 1.88Jhang 344 85 259 434 95 339 1.38T.T. Singh 171 50 121 227 41 186 1.68
Gujranwala 306 114 192 449 226 223 2.28Gujrat 231 40 191 305 79 226 1.65Hafizabad 90 33 57 117 30 87 1.56Mandi Baha-ud-Din 139 24 115 173 25 148 1.3Narowal 140 27 113 170 21 149 1.15Sialkot 274 52 222 366 96 270 1.72
Lahore 537 448 89 881 731 150 2.95Kasur 255 53 202 338 75 263 1.67NankanaOkara 230 35 195 338 72 266 2.29Sheikhupura 336 56 280 456 113 343 1.79
Multan 337 86 251 433 176 257 1.49Khanewal 214 54 160 293 50 243 1.87Lodhran 75 19 56 161 22 139 4.6Pakpattan 141 21 120 199 26 173 2.05Sahiwal 227 35 192 267 42 225 0.96Vehari 217 28 189 301 46 255 1.94
Rawalpindi 353 160 193 521 270 251 2.32Attock 156 19 137 207 42 165 1.68Chakwal 120 17 103 187 21 166 2.64Jhelum 149 24 125 150 38 112 0.04
Sargodha 309 73 236 411 111 300 1.69Bhakkar 111 18 93 159 25 134 2.14Khushab 109 26 83 145 36 109 2.69Mianwali 118 20 98 149 30 119 1.38
Growth %1981 1998
( Included in Sheikhupura District )
199
Source:- Papulation Census Organisation, Govt. of Pakistan Islamabad.
HOUSINGTable:- 140 Number of Household Units by District The Punjab
1981 and 1998 Housing Censuses(Thousand Nos.)
District

1 2 3 4 5 6
Room Rooms Rooms Rooms Rooms Rooms or More
Total 19212 100.00 7321 5867 3070 1626 630 698 2.2 1 Person 555 2.89 400 94 34 15 5 7 1.5 2 Persons 1463 7.62 993 304 97 40 14 15 1.5 3 Persons 1535 7.99 895 393 147 59 21 20 1.7 4 Persons 1881 9.79 944 549 224 99 34 31 1.8 5 Persons 2212 11.51 956 701 317 141 52 45 2.0 6 Persons 2460 12.80 933 830 393 181 65 58 2.1 7 Persons 2169 11.29 727 766 377 178 63 58 2.2 8 Persons 1873 9.75 553 676 353 173 61 57 2.3 9 Persons 1483 7.72 384 535 300 155 56 53 2.410 Persons & More 3581 18.64 536 1019 828 585 259 354 3.0
Percent 100.00 - 38.11 30.54 15.98 8.46 3.28 3.63 -
Persons Per Housing Unit 6.8 - 5.3 6.9 7.9 8.9 9.6 11.4 -
Total 6032 100.00 1833 1911 1151 611 245 281 2.4 1 Person 185 3.07 119 37 15 7 3 4 1.6 2 Persons 358 5.94 197 93 38 17 6 7 1.8 3 Persons 434 7.19 202 128 60 25 9 10 1.9 4 Persons 576 9.55 226 181 93 44 16 16 2.1 5 Persons 724 12.00 243 236 134 63 25 23 2.3 6 Persons 824 13.66 250 279 159 77 30 29 2.3 7 Persons 685 11.36 190 239 138 67 25 26 2.4 8 Persons 585 9.70 147 210 123 60 22 23 2.4 9 Persons 456 7.56 102 164 100 51 19 20 2.510 Persons & More 1205 19.98 157 344 291 200 90 123 3.1
Percent 100.00 - 30.39 31.68 19.08 10.13 4.06 4.66 -
Persons Per Housing Unit 7 - 5.5 6.9 7.7 8.5 9.1 10.4 -
HOUSING
Table:- 141:- Housing Units by Number of Rooms & Household Size, Urban & Rural Areas Pakistan: 1998 Housing Census
(Thousand )
I-All Areas
Housing Unit
Total % With Total
Rooms Per
Housing Unit
Housing Units by Number of Rooms
Household Size
II-Urban Areas
200

1 2 3 4 5 6
Room Rooms Rooms Rooms Rooms Rooms or More
Total 13180 100.00 5488 3955 1914 1015 386 422 2.1
1 Person 370 2.81 281 57 18 8 3 3 1.4
2 Persons 1102 8.36 796 210 57 23 8 8 1.4
3 Persons 1101 8.35 693 266 87 34 11 10 1.6
4 Persons 1303 9.89 717 368 130 55 18 15 1.7
5 Persons 1488 11.29 713 465 183 78 27 22 1.9
6 Persons 1638 12.43 683 551 234 105 35 30 2.0
7 Persons 1485 11.27 538 527 238 112 38 32 2.1
8 Persons 1287 9.76 406 466 230 112 39 34 2.2
9 Persons 1027 7.79 282 371 200 104 37 33 2.4
10 Persons & More 2379 18.05 379 674 537 384 170 235 3.0
Percent 100.00 - 41.64 30.01 14.52 7.70 2.93 3.20 -
Persons Per Housing Unit 6.8 - 5.2 6.9 8 9.1 9.9 12.1 -
HOUSING
Table:- 141:- Housing Units by Number of Rooms & Household Size, Urban & Rural Areas Pakistan: 1998 Housing Census Concld.
(Thousand )
III-Rural Areas
Source:- Population Census Organization, Statistics Division Government of Pakistan, Islamabad
Household Size
Housing Unit Housing Units by Number of RoomsRooms
Per Housing
UnitTotal % With
Total
201

1 2 3 4 5 6
Room Rooms Rooms Rooms Rooms Rooms or More
Total 10538 100.0 3369 3534 1878 980 381 396 2.3 1 Person 262 2.5 167 58 21 9 3 4 1.6 2 Persons 626 5.9 360 170 57 23 8 8 1.7 3 Persons 775 7.4 388 234 91 37 13 12 1.8 4 Persons 1001 9.5 434 329 137 61 21 19 2.0 5 Persons 1242 11.8 464 429 198 89 33 29 2.1 6 Persons 1425 13.5 468 513 248 116 42 38 2.2 7 Persons 1292 12.3 373 480 243 116 42 38 2.3 8 Persons 1103 10.5 279 416 223 109 40 36 2.4 9 Persons 849 8.1 186 319 183 94 35 32 2.510 Persons & More 1963 18.6 250 586 477 326 144 180 3.0
Percent 100.00 - 31.97 33.54 17.82 9.30 3.62 3.76 -
Persons Per Housing Unit 6.9 - 5.4 6.8 7.7 8.6 9.2 10.4 -
Total 3200 100.0 890 1038 625 348 139 160 2.5 1 Person 82 2.6 50 18 7 4 1 2 1.7 2 Persons 163 5.1 81 47 19 9 3 4 1.9 3 Persons 213 6.7 92 67 30 14 5 5 2.0 4 Persons 293 9.2 108 97 48 23 8 9 2.2 5 Persons 385 12.0 122 129 71 35 14 14 2.3 6 Persons 458 14.3 131 158 89 45 17 18 2.4 7 Persons 394 12.3 102 138 81 41 16 16 2.4 8 Persons 331 10.3 78 117 71 37 14 14 2.5 9 Persons 253 7.9 52 90 56 31 12 12 2.610 Persons & More 628 19.6 74 177 153 109 49 66 3.1
Percent 100.00 - 27.81 32.44 19.53 10.88 4.34 5.00 -
Persons Per Housing Unit
7.1- 5.6 6.9 7.7 8.5 9 9.9 -
HOUSING
Table:- 142:- Housing Units by Number of Rooms & Household Size, Urban & Rural Areas The Punjab: 1998 Housing Census
(Thousand )
Household Size
Housing Unit Housing Units by Number of RoomsRooms
Per Housing
UnitTotal % With
Total
I-All Areas
II-Urban Areas
202

1 2 3 4 5 6
Room Rooms Rooms Rooms Rooms Rooms or More
Total 7338 100.0 2479 2494 1254 633 241 237 202.0
1 Person 179 2.4 117 39 14 5 2 2 1.6
2 Persons 462 6.3 278 123 38 14 5 4 1.6
3 Persons 562 7.7 296 168 61 23 8 6 1.7
4 Persons 707 9.6 325 232 90 38 12 10 1.9
5 Persons 857 11.7 342 300 127 54 19 15 2.0
6 Persons 968 13.2 337 355 160 71 25 20 2.1
7 Persons 898 12.2 271 342 162 75 26 22 2.2
8 Persons 770 10.5 202 296 152 72 26 22 2.3
9 Persons 596 8.1 134 229 127 63 23 20 2.5
10 Persons & More 1339 18.2 177 410 323 218 95 116 3.0
Percent 100.00 - 33.78 33.99 17.09 8.63 3.28 3.23 -
Persons Per Housing Unit 6.9 - 5.4 6.8 7.8 8.7 9.3 10.8 -
Rooms Per
Housing UnitTotal % With
Total
HOUSING
Table:- 142:- Housing Units by Number of Rooms & Household Size, Urban & Rural Areas The Punjab: 1998 Housing Census Concld.
III-Rural Areas
Source:- Population Census Organization, Statistics Division, Government of Pakistan, Islamabad
203
(Thousand )
Household Size
Housing Unit Housing Units by Number of Rooms

Housing Units
% With Total
Housing Units
% With Total
Housing Units
% With Total
Total 19212 100 6032 100 13180 100
Owned 15598 81.19 4157 68.92 11441 86.8
Rented 1659 8.64 1366 22.66 293 2.22
Rent Free 1955 10.18 509 6.43 1446 10.98
Total 10538 100 3200 100 7338 100
Owned 8742 82.97 2336 72.99 6406 87.32
Rented 749 7.11 605 18.9 144 1.96
Rent Free 1047 9.92 259 8.11 788 10.72
Total 15599 100 4157 100 11442 100
Under Construction 138 0.89 48 1.15 91 0.79
Less than Five Years 2839 18.2 614 14.77 2226 19.45
5-10 Years 3905 25.04 864 20.78 3041 26.58
10 Years and More 8715 55.87 2631 63.3 6084 53.18
Total 8743 100 2337 100 6406 100
Under Construction 63 0.73 24 1.01 40 0.62
Less than Five Years 1616 18.48 356 15.23 1260 19.67
5-10 Years 2373 27.15 491 21.02 1882 29.38
10 Years and More 4690 53.65 1466 62.74 3224 50.33
The Punjab
Source:- Population Census Organization, Statistics Division, Government of Pakistan, Islamabad
Total Urban Rural
Pakistan
Pakistan
The Punjab
204HOUSING
Table:- 143:- Housing Units by Tenure, Period of Construction, Urban & Rural Areas Pakistan & The Punjab: 1998 Housing Census
(Thousand)
A-By Tenure
Tenure
B-By Period of Construction

Housing Units
% With Total
Housing Units
% With Total
Housing Units
% With Total
Total 19212 100 6032 100 13180 100
I. Outer Walls
1. Baked Bricks/ 11231 58.46 5173 85.76 6058 45.96 Blocks/Stone
2. Unbaked Bricks/ 6625 34.48 734 12.16 5891 44.69 Earth Bound
3. Wood/Bamboo 1041 5.42 92 1.53 949 7.2
4. Others 315 1.64 33 0.54 282 2.14
II.Roofs
1. R.C.C./R.B.C. 4110 2.39 2735 4535 1375 10.43
2. Cement/Iron Sheets 2512 13.07 1188 19.69 1324 10.05
3. Wood Bamboo 11018 57.35 1823 30.23 9195 69.76
4. Others 1573 8.18 286 4.74 1287 9.76
Total 10538 100 3200 100 7338 100
I. Outer Walls
1. Baked Bricks/ 7160 67.95 2876 89.9 4284 58.37 Blocks/Stone
2. Unbaked Bricks/ 3207 30.43 293 9.14 2914 39.72 Earth Bound
3. Wood/Bamboo 76 0.72 15 0.46 61 0.83
4. Others 95 0.9 16 0.49 79 1.08
II.Roofs
1. R.C.C./R.B.C. 2308 21.9 1385 43.26 923 12.59
2. Cement/Iron Sheets 1183 11.23 396 12.37 787 10.72
3. Wood Bamboo 5933 56.31 1208 37.73 4725 64.41
4. Others 1113 10.56 212 6.64 901 12.28Source:- Population Census Organization, Statistics Division, Government of Pakistan, Islamabad
Tenure
Total Urban Rural
Pakistan
The Punjab
HOUSINGTable:- 144:- Housing Units by Tenure, Period of Construction, Urban & Rural Areas
Pakistan & The Punjab: 1998 Housing Census(Thousand)
205

Housing Units
% With Total
Housing Units
% With Total
Housing Units
% With Total
I. Source of Drinking Water 19212 100 6032 100 13180 100
Inside 14417 75.04 5395 89.44 9022 68.451. Pipe (Nul) 5394 28.08 3632 60.22 1762 13.37
2. Handpump 8084 42.07 1549 25.68 6535 49.58
3. Well 939 4.89 214 3.54 725 5.5
Outside 4795 24.96 637 10.56 4158 31.551. Pipe (Nul) 802 4.18 290 4.81 512 3.89
2. Handpump 972 5.06 79 1.31 893 6.78
3. Well 975 5.08 55 0.91 920 6.98
4. Pond 549 2.85 17 0.28 532 4.03
5. Others 1497 7.79 196 3.24 1301 9.87
II. Source of Lighting 19212 100 6032 100 13180 1001. Electricity 13536 70.46 5618 93.14 7918 60.07
2. Kerosene Oil 5353 27.87 336 5.58 5017 38.07
3. Others 323 1.68 78 1.28 245 1.86
III.Cooking Fuel Used 19212 100 6032 100 13180 1001. Wood 13224 68.83 1929 31.98 11295 85.69
2. Kerosene Oil 715 3.72 426 7.06 289 2.2
3. Gas 3880 20.19 3507 58.14 373 2.83
4. Others 1393 7.25 170 2.82 1223 9.28
HOUSING
Table:- 145:- Housing Units by Tenure, Period of Construction, Urban & Rural Areas Pakistan & The Punjab: 1998 Housing Census
(Thousand)
Tenure
Total Urban Rural
I-Pakistan
206

Housing Units
% With Total
Housing Units
% With Total
Housing Units
% With Total
I. Source of Drinking Water 10538 100 3200 100 7338 100
Inside 9134 86.68 3014 94.2 6120 83.41. Pipe (Nul) 2565 24.34 1754 54.8 811 11.05
2. Handpump 6358 60.35 1180 36.93 5178 70.56
3. Well 211 1.99 80 2.47 131 1.78
Outside 1404 13.32 186 5.8 1218 16.61. Pipe (Nul) 231 2.18 102 3.17 129 1.75
2. Handpump 558 5.3 39 1.22 519 7.08
3. Well 236 2.24 12 0.37 224 3.06
4. Pond 113 1.08 2 0.07 111 1.51
5. Others 266 2.52 31 0.96 235 3.2
II. Source of Lighting 10538 100 3200 100 7338 1001. Electricity 7638 72.49 2991 93.45 4647 63.34
2. Kerosene Oil 2803 26.61 180 5.64 2623 35.76
3. Others 97 0.91 29 0.91 68 0.91
III.Cooking Fuel Used 10538 100 3200 100 7338 1001. Wood 7196 68.3 1170 36.56 6026 82.15
2. Kerosene Oil 398 3.78 263 8.21 135 1.84
3. Gas 1860 17.67 1666 52.1 194 2.65
4. Others 1084 10.25 101 3.13 983 13.36
HOUSING
Table:- 145:- Housing Units by Tenure, Period of Construction, Urban & Rural Areas Pakistan & The Punjab: 1998 Housing Census
(Thousand)
II-Punjab
Source:- Population Census Organization, Statistics Division, Government of Pakistan, Islamabad.
Tenure
Total Urban Rural
207
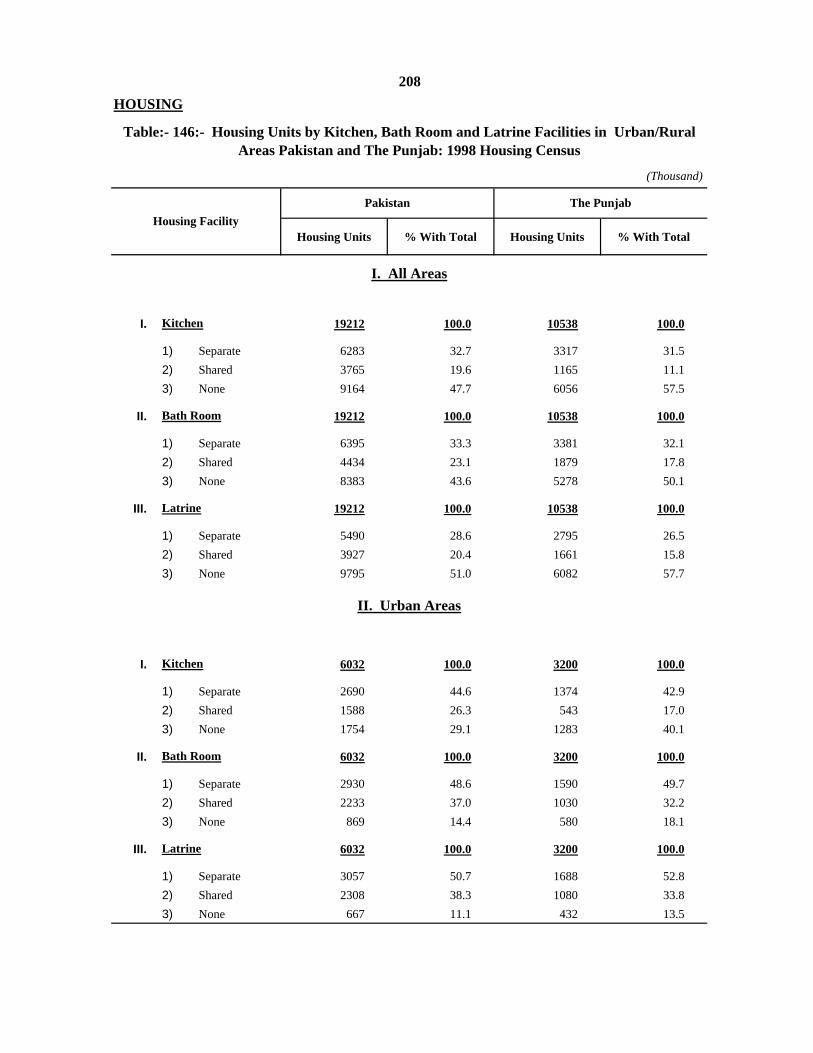
Housing Units % With Total Housing Units % With Total
I. 19212 100.0 10538 100.0
1) Separate 6283 32.7 3317 31.52) Shared 3765 19.6 1165 11.13) None 9164 47.7 6056 57.5
II. 19212 100.0 10538 100.0
1) Separate 6395 33.3 3381 32.12) Shared 4434 23.1 1879 17.83) None 8383 43.6 5278 50.1
III. 19212 100.0 10538 100.0
1) Separate 5490 28.6 2795 26.52) Shared 3927 20.4 1661 15.83) None 9795 51.0 6082 57.7
I. 6032 100.0 3200 100.0
1) Separate 2690 44.6 1374 42.92) Shared 1588 26.3 543 17.03) None 1754 29.1 1283 40.1
II. 6032 100.0 3200 100.0
1) Separate 2930 48.6 1590 49.72) Shared 2233 37.0 1030 32.23) None 869 14.4 580 18.1
III. 6032 100.0 3200 100.0
1) Separate 3057 50.7 1688 52.82) Shared 2308 38.3 1080 33.83) None 667 11.1 432 13.5
Pakistan The Punjab
Bath Room
Latrine
Kitchen
Bath Room
Latrine
II. Urban Areas
Table:- 146:- Housing Units by Kitchen, Bath Room and Latrine Facilities in Urban/Rural Areas Pakistan and The Punjab: 1998 Housing Census
(Thousand)
Kitchen
Housing Facility
I. All Areas
208HOUSING

Housing Units % With Total Housing Units % With Total
I. 13180 100.0 7338 100.0
1) Separate 3593 27.3 1942 26.5
2) Shared 2178 16.5 623 8.5
3) None 7409 56.2 4773 65.0
II. 13180 100.0 7338 100.0
1) Separate 3466 26.3 1791 24.4
2) Shared 2201 16.7 849 11.6
3) None 7513 57.0 4698 64.0
III. 13180 100.0 7338 100.0
1) Separate 2433 18.5 1106 15.1
2) Shared 1620 12.3 582 7.9
3) None 9127 69.2 5650 77.0
Source:- Population Census Organization, Statistics Division, Government of Pakistan, Islamabad .
Bath Room
Kitchen
Latrine
HOUSING
209
III. Rural Areas
Table:- 146:- Housing Units by Kitchen, Bath Room and Latrine Facilities in Urban/Rural Areas Pakistan and The Punjab: 1998 Housing Census
(Thousand)
Housing FacilityPakistan The Punjab

LABOUR FORCE & EMPLOYMENT210
Both S Male Female Both
S Male Female Both S Male Female
Activity
Table 147 :- Population (10 Years & Above) by Activity , Sex and AreaThe Punjab: 2005-06
(Thousand)
Total Urban Rural
Sexes Male Female Sexes Male Female Sexes Male Female
T o t a l 61869 31177 30692 20769 10665 10104 41100 20512 20588
Working 30281 22635 7646 8039 6832 1207 22242 15803 6439
Available /Looking for Work 1825 1296 529 789 578 211 1036 718 318
House-Keeping 16388 258 16130 5879 67 5812 10509 191 10318
Students 11499 6215 5284 4924 2484 2440 6575 3731 2844
Others 1876 773 1103 1138 704 434 738 69 669
Source :- Federal Bureau of Statistics, Statistics Division, Govt. of Pakistan Islamabad ( Labour Force Survey).
Table 148:- Population (10 Years & Above) Working and Looking for Work by Major Occupation Group and Area , The Punjab: 2005-06
(Thousand)
Total Urban RuralMajor Occupation Group
118
204181566
181
663
80391688
245
655
28457
3254
426
1318
227345
T o t a lLegislators, Senior Officials and Managers
Professionals
Technicians and Associate Professionals
Clerks 118
659
9693
2819
499
2330
227
706
Skilled Agricultural and Fishery workers
Craft and Related Traders workers
345
1365
10192
5149
Clerks
Service workers, shop and Market Sales Workers
Plant and Machine Operators and Assemblers 1052 621431Plant and Machine Operators and Assemblers
Elementory (unskilled) occupations
Source :- Federal Bureau of Statistics, Statistics Division, Govt. of Pakistan Islamabad ( Labour Force Survey).
1052
5356
621
4098
431
1258

1997-98 1999-00 2001-02 2003-04 2005-06
10 - 14 Years 21.1 21.1 19.0 19.2 20.5
15 - 19 Years 58.1 64.1 60.8 62.1 61.2
20 - 59 Years 94.9 94.7 94.4 94.2 95.1
60 Years & Above 66.5 63.1 60.1 62.7 62.2
1997-98 1999-00 2001-02 2003-04 2005-06
I. 28.97 29.38 29.61 30.41 32.22
i) Male 24.45 24.85 24.84 24.97 25.73
ii) Female 4.52 4.53 4.77 5.44 6.49
II. 26.70 27.65 27.16 28.07 30.22
i) Male 22.96 23.80 23.18 23.32 24.33
ii) Female 3.74 3.85 3.98 4.75 5.89
III. 2.27 1.73 2.45 2.33 2.00
i) Male 1.49 1.05 1.66 1.64 1.39
ii) Female 0.78 0.68 0.79 0.69 0.61
Table 149 :- Civilian Labour Force Participation Rates of Male Population, The Punjab
Table 150 :- Percentage Distribution of Civilian Labour Force by Sex , Pakistan
211
Source :- Federal Bureau of Statistics , Islamabad "Labour Force Surveys" of the respective year.
Age - Group
LABOUR FORCE & EMPLOYMENT
Source :- Federal Bureau of Statistics , Islamabad "Labour Force Surveys" of the respective year.
Sex Year
Total
Employed-Total
Un-Employed-Total

Total District Govts.
Provincial Govt. Total District
Govts.Provincial
Govt.
964338 639797 327162 1023984 661812 362172
i) BS-1-4 Total 244144 158066 86078 256667 169837 86830
1 207152 144379 62773 216212 151396 64816
2 12349 5310 7039 16228 8839 7389
3 11274 653 10621 9690 836 8854
4 13369 7724 5645 14537 8766 5771
BS-5-15 Total 568650 367398 201252 596783 367065 229718
5 169397 35566 133831 181636 34434 147202
6 21791 16962 4829 26461 21490 4971
7 176115 150005 26110 183182 154556 28626
8 4576 4238 338 4518 4172 346
9 123834 110237 13597 114626 100163 14463
10 4977 4651 326 4434 4115 319
11 19408 11421 7987 19917 11303 8614
12 7561 4249 3312 10802 7208 3594
13 763 178 585 617 233 384
14 36108 27021 9087 45242 25120 20122
15 4120 2870 1250 5348 4271 1077
iii) BS-16 42325 36885 8061 53197 40192 13005
iv) BS-17-22 Total 61103 31285 29818 62208 30222 31986
17 40398 22810 17588 42286 22628 19658
18 14359 5853 8506 13971 5237 8734
19 5261 2443 2818 4920 2217 2703
20 1031 178 853 978 140 838
21 47 1 46 38 0 38
22 7 0 7 15 0 15
v) Unclassified/Special Grade 48116 46163 1953 55129 54496 633
* The Information of District Government has not been compiled/supplied by source agency.Source
212
LABOUR FORCE & EMPLOYMENT
Table 151 :- Total Number of Sanctioned Posts by Basic Pay Scale in the Budget Estimates, The Punjab Government
ii)
Finance Department , Government of the Punjab , Lahore.
Basic Pay Scale or Equivalent
Grand Total (i to v)
2006-07 2007-08

2001 2004 2001 2004
6171 6521 578620 594909
206 237 11564 1240287 102 2845 3226
163 189 16045 18037
54 55 8741 87779 49 1774 3684
105 106 24058 2526829 27 1115 1065
819 763 80902 78794106 102 11582 10266
74 76 4867 4882
620 646 20474 21100257 262 14824 13807
8 14 2898 310212 12 2998 2998
9 9 153 153328 325 16573 15267
1399 1454 114984 118450256 289 56016 57915
38 43 3336 3850435 462 79236 82611
267 275 17811 19172119 122 6708 6756
47 68 1022 188346 54 1775 1935
139 138 6839 6809138 177 6069 6715
199 200 23843 2379744 53 5281 550514 40 5228 494833 34 7869 8187
71 71 7073 72627 15 2533 2692
18 28 9630 1050115 24 1954 3093
KhushabMianwali
Nankana ( Included in Sheikhupura District )
Bhakkar
PakpattanSahiwalVehari
RawalpindiAttockChakwalJhelum
Sargodha
HafizabadMandi Baha-ud-DinNarowalSialkot
LahoreKasur
Estimated Employment
LABOUR FORCE & EMPLOYMENT
BahawalnagarRahim Yar Khan
Gujrat
Sheikhupura
MultanKhanewalLodhran
213
The Punjab
Bahawalpur
Table 152:Number of Registered Factories and Their Employment Level by District,
No. of Factories
D. G. KhanLayyahMuzaffargarhRajanpur
Okara
The Punjab (As on 30th June)
District
• Massive increase in units of District Layyah and Chakwal are due to the new registration of Bricks
Source:- Bureau of Statistics, Punjab, Lahore. Klins Factories during 2002-03
FaisalabadJhangT. T. Singh
Gujranwala
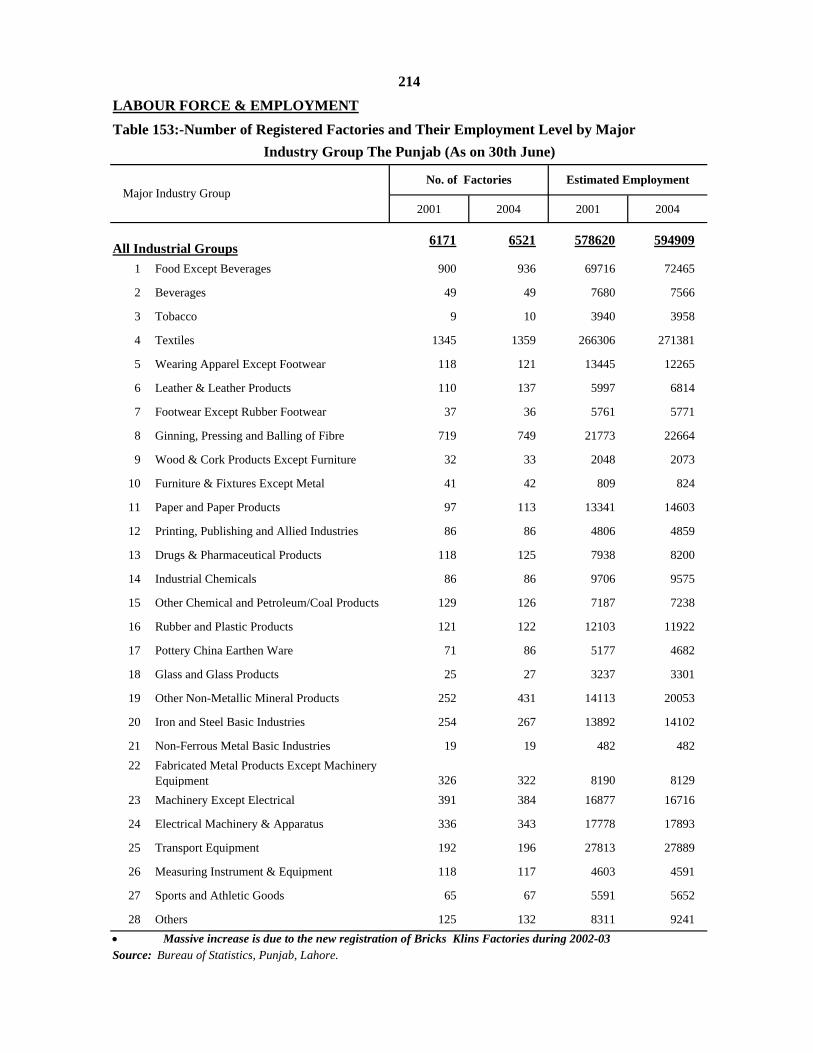
2001 2004 2001 2004
6171 6521 578620 594909
1 Food Except Beverages 900 936 69716 72465
2 Beverages 49 49 7680 7566
3 Tobacco 9 10 3940 3958
4 Textiles 1345 1359 266306 271381
5 Wearing Apparel Except Footwear 118 121 13445 12265
6 Leather & Leather Products 110 137 5997 6814
7 Footwear Except Rubber Footwear 37 36 5761 5771
8 Ginning, Pressing and Balling of Fibre 719 749 21773 22664
9 Wood & Cork Products Except Furniture 32 33 2048 2073
10 Furniture & Fixtures Except Metal 41 42 809 824
11 Paper and Paper Products 97 113 13341 14603
12 Printing, Publishing and Allied Industries 86 86 4806 4859
13 Drugs & Pharmaceutical Products 118 125 7938 8200
14 Industrial Chemicals 86 86 9706 9575
15 Other Chemical and Petroleum/Coal Products 129 126 7187 7238
16 Rubber and Plastic Products 121 122 12103 11922
17 Pottery China Earthen Ware 71 86 5177 4682
18 Glass and Glass Products 25 27 3237 3301
19 Other Non-Metallic Mineral Products 252 431 14113 20053
20 Iron and Steel Basic Industries 254 267 13892 14102
21 Non-Ferrous Metal Basic Industries 19 19 482 48222 Fabricated Metal Products Except Machinery
Equipment 326 322 8190 812923 Machinery Except Electrical 391 384 16877 16716
24 Electrical Machinery & Apparatus 336 343 17778 17893
25 Transport Equipment 192 196 27813 27889
26 Measuring Instrument & Equipment 118 117 4603 4591
27 Sports and Athletic Goods 65 67 5591 5652
28 Others 125 132 8311 9241
No. of Factories Estimated Employment
Source: Bureau of Statistics, Punjab, Lahore.
LABOUR FORCE & EMPLOYMENT
Major Industry Group
Table 153:-Number of Registered Factories and Their Employment Level by Major Industry Group The Punjab (As on 30th June)
All Industrial Groups
214
• Massive increase is due to the new registration of Bricks Klins Factories during 2002-03
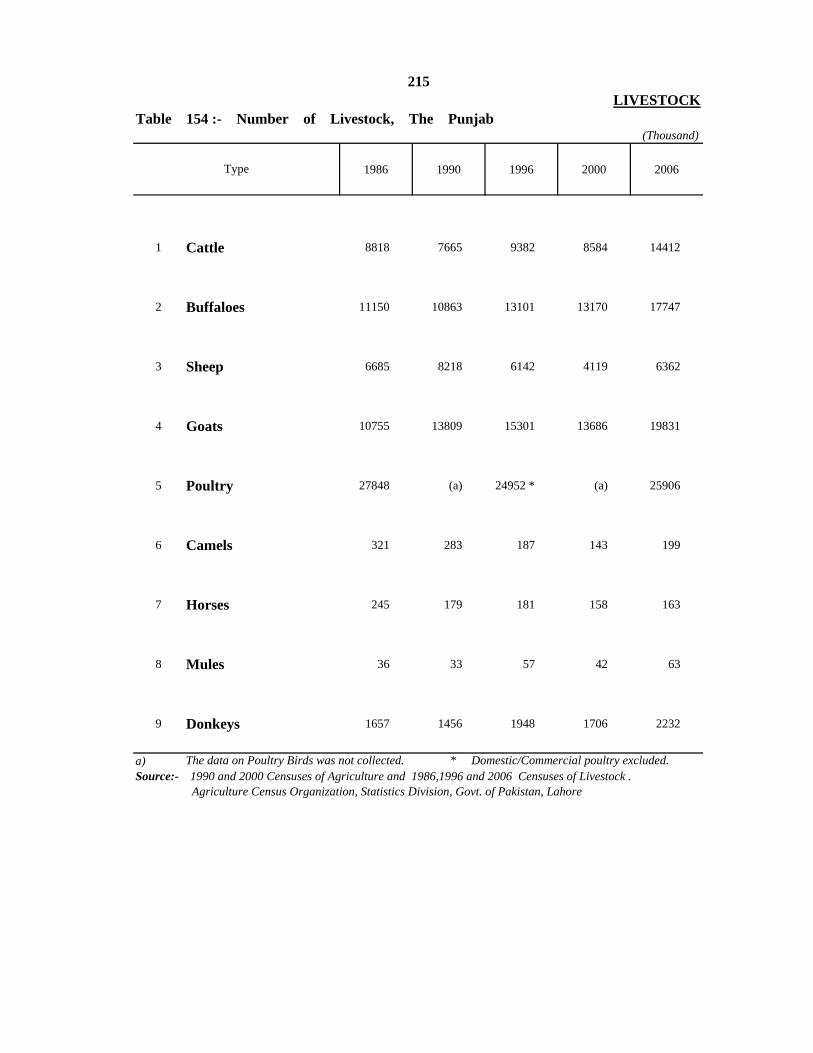
1986 1990 1996 2000 2006
1 Cattle 8818 7665 9382 8584 14412
2 Buffaloes 11150 10863 13101 13170 17747
3 Sheep 6685 8218 6142 4119 6362
4 Goats 10755 13809 15301 13686 19831
5 Poultry 27848 (a) 24952 * (a) 25906
6 Camels 321 283 187 143 199
7 Horses 245 179 181 158 163
8 Mules 36 33 57 42 63
9 Donkeys 1657 1456 1948 1706 2232
a)
Agriculture Census Organization, Statistics Division, Govt. of Pakistan, Lahore
215
The data on Poultry Birds was not collected. * Domestic/Commercial poultry excluded.
Type
LIVESTOCKTable 154 :- Number of Livestock, The Punjab
(Thousand)
Source:- 1990 and 2000 Censuses of Agriculture and 1986,1996 and 2006 Censuses of Livestock .

Cattle Buffaloes Cattle Buffaloes Cattle Buffaloes
The Punjab 9382 13101 8584 13170 14412 17747Bahawalpur 288 464 277 427 550 609Bahawalnagar 272 527 262 614 544 758Rahim Yar Khan 250 573 213 564 520 820(Cholistan Area) 407 13 197 18 567 10
D. G. Khan 320 167 280 152 645 220Layyah 267 205 327 213 582 301Muzaffargarh 600 392 584 414 1172 601Rajanpur 314 166 283 163 386 200(Tribal Area) 79 - 52 - - -
Faisalabad 332 941 299 854 461 1148Jhang 625 842 561 852 873 1175T. T. Singh 220 364 191 378 273 439
Gujranwala 163 509 140 645 225 628Gujrat 89 285 92 333 145 414Hafizabad 138 266 188 253 183 501Mandi Baha-ud-Din 155 400 124 390 226 568Narowal 125 236 136 251 156 311Sialkot 195 471 123 380 274 611
Lahore 77 264 81 327 135 403Kasur 191 536 170 569 390 1085Nankana 130 401Okara 214 628 204 665 329 880Sheikhupura 361 743 263 683 283 531
Multan 340 379 323 355 499 416Khanewal 280 486 285 475 424 566Lodhran 186 232 198 211 366 233Pakpattan 122 413 90 411 192 581Sahiwal 186 511 129 461 238 671Vehari 208 470 193 496 346 613
Rawalpindi 250 173 256 178 344 248Attock 313 121 334 117 386 121Chakwal 274 100 306 135 435 145Jhelum 183 153 131 120 167 146
Sargodha 425 575 421 601 575 688Bhakkar 365 195 318 166 538 261Khushab 217 118 207 123 345 168Mianwali 323 137 316 120 457 192(Islamabad) 28 46 30 56 51 84
216
2006
Table 155 :- Number of Cattle and Buffaloes by District, The Punjab(Thousand)
LIVESTOCK
1996 2000District
Source:- Census of Agriculture, 2000, 1996 and 2006 Census of Livestock
( Included in Sheikhupura District )

Sheep Goats Sheep Goats Sheep Goats
The Punjab 6142 15301 4119 13686 6362 19831
Bahawalpur 158 714 95 674 160 1045Bahawalnagar 179 735 185 740 196 957Rahim Yar Khan 111 999 76 971 137 1488(Cholistan Area) 651 275 191 360 356 257
D. G. Khan 696 897 402 641 1119 1531Layyah 315 347 275 373 505 571Muzaffargarh 337 700 312 685 346 1058Rajanpur 565 414 256 390 553 698
Faisalabad 80 851 66 731 55 905Jhang 417 780 284 654 385 1007T. T. Singh 63 537 57 435 47 504
Gujranwala 77 160 66 92 86 173Gujrat 8 145 9 121 36 208Hafizabad 46 128 24 86 23 108Mandi Baha-ud-Din 31 153 17 124 16 183Narowal 24 121 25 124 17 177Sialkot 42 137 28 99 87 161
Lahore 29 80 27 67 41 118Kasur 103 269 94 197 99 366Nankana 39 256Okara 135 349 77 272 91 356Sheikhupura 136 420 101 290 75 184
Multan 99 471 114 392 81 594Khanewal 165 617 147 607 156 712Lodhran 94 400 67 371 40 428Pakpattan 62 305 44 229 58 317Sahiwal 78 532 54 386 50 478Vehari 117 515 83 531 101 637
Rawalpindi 21 288 10 293 17 489Attock 160 371 156 415 181 629Chakwal 125 378 100 449 158 580Jhelum 46 249 42 174 59 303
Sargodha 143 633 101 473 134 588Bhakkar 402 438 284 440 460 656Khushab 180 394 92 351 167 529Mianwali 246 455 151 398 230 503(Islamabad) 1 44 7 51 1 77
2006
LIVESTOCKTable 156 :- Number of Sheep and Goats by District, The Punjab
(Thousand)1996
( Included in Sheikhupura District )
Source:- Census of Agriculture, 2000, 1996 and 2006 Census of Livestock.
District
217
2000

District Total Bullocks Cows Male Buffaloes
Female Buffaloes Camels Horses Asses Mules
The Punjab 1938384 351995 23755 8751 30895 66332 131215 1272398 53043
Bahawalpur 39361 7457 452 77 442 883 1682 27036 1332Bahawalnagar 92190 18841 4512 434 12150 1188 1811 52403 851Rahim Yar Khan 54906 4573 32 547 790 1718 3031 43215 1000(Cholistan Area) 5499 346 50 - - 2751 394 1940 18
D. G. Khan 70080 21552 1498 4 701 8024 4019 33358 924Layyah 53010 4527 46 185 - 7990 3232 36737 293Muzaffargarh 47627 19916 106 514 47 3192 2475 20286 1091Rajanpur 49507 6670 142 160 33 11637 4390 26145 330
Faisalabad 127876 40069 458 1640 1427 112 8599 71364 4207Jhang 179607 48130 552 33 495 3084 12755 113474 1084Toba Tek Singh 47262 17743 547 415 2317 28 1695 22787 1730
Gujranwala 56791 552 712 346 1839 - 6180 44169 2993Gujrat 50559 2933 258 2 200 217 5853 38534 2562Hafizabad 41247 2807 32 149 22 22 2635 33071 2509Mandi Baha-ud-Din 51303 5378 115 19 117 272 5362 36974 3066Narowal 46918 3852 594 778 926 167 2007 36578 2016Sialkot 44486 113 21 - - - 4871 37843 1638
Lahore 35181 160 1 460 406 - 6314 27066 774Kasur 54452 3733 20 176 226 - 4444 42173 3680Nankana 45092 5435 21 810 111 395 4655 31400 2265Okara 98515 20696 104 325 122 95 4251 70536 2386Sheikhupura 50518 1897 43 281 149 21 3887 40502 3738
Multan 18636 6190 252 199 195 1161 1524 8526 589Khanewal 33082 13876 - 112 135 171 2383 16115 290Lodharan 11869 4764 577 151 487 233 1169 4247 241Pakpattan 43525 10377 821 234 3878 87 1496 25536 1096Sahiwal 65747 16013 93 118 97 181 3455 44604 1186Vehari 46537 24314 1575 136 1266 87 1190 17398 571
Rawalpindi 29770 3506 3303 80 326 342 1648 19588 977Attock 38233 2521 2111 1 205 2366 2191 28277 561Chakwal 46197 1342 2804 24 325 1183 1860 37624 1035Jhelum 23623 1839 738 22 - 1252 1538 17597 637
Sargodha 112506 19546 980 179 1438 1216 9715 76564 2868Bhakkar 44808 1910 30 30 - 8462 2370 31769 237Khushab 45990 4791 75 86 - 3717 3705 31521 2095Mianwali 32510 3494 80 24 23 3988 1647 23092 162
(Islamabad) 3364 132 - - - 90 782 2349 11Source:- 2006 Census of Livestock, Agricultural Census Organization, Statistics Division, Government of Pakistan, Lahore.
218LIVESTOCKTable 157:- Number of Work Animals by Type and by District, The Punjab: 2006
(Number)

District Veterinary Hospitals Veterinary Dispensaries Veterinary Centres
The Punjab 537 1017 1931
Bahawalpur 16 57 77Bahawalnagar 21 28 90R.Y.Khan 26 38 95
D.G.Khan 11 47 61Layyah 9 14 35Muzaffargarh 16 91 12Rajanpur 9 11 27
Faisalabad 37 44 119Jhang 22 106 110T.T.Singh 20 17 68
Gujranwala 24 13 53Gujrat 17 41 32Hafizabad 9 11 30Mandi Baha-ud-Din 12 15 50Narowal 20 5 52Sialkot 23 6 80
Lahore 12 12 26Kasur 14 12 87Nankana 13 14 48Okara 15 22 53Sheikhupura 10 22 77
Multan 14 23 44Khanewal 10 15 57Lodhran 6 11 18Pakpattan 3 13 27Sahiwal 5 75 58Vehari 18 40 28
Rawalpindi 13 25 74Attock 13 32 53Chakwal 12 46 35Jhelum 10 11 35
Sargodha 32 28 90Bhakkar 10 47 41Khushab 16 20 40Mianwali 19 5 49
219LIVESTOCK
Table 158:- Number of Veterinary Hospitals, Dispensaries and Centres by DistrictThe Punjab: 2006-07
Source: - i) Directorate of Livestock and Dairy Development (Ext.) Punjab, Lahore. ii) Directorate of Livestock and Dairy Development, Barani Areas (PVTV), Rawalpindi.

Year Vaccinated Treated Castrated
1997-98 12757 7909 6621998-99 14196 8088 6681999-00 14278 8190 669
2000-01 13450 9545 6062001-02 18187 7978 6412002-03 29718 6400 524
2003-04 37688 9553 6262004-05 47373 10643 6502005-06 50144 16260 946
2006-07 52185 15717 889
Year Veterinary Hospitals Veterinary Dispensaries Veterinary Centres
1997-98 511 747 19941998-99 511 745 19961999-00 511 745 1996
2000-01 545 725 19642001-02 540 731 19912002-03 541 740 1892
2003-04 541 740 18922004-05 518 755 20242005-06 527 775 1998
2006-07 537 1017 1931
(Number)
Source: - i) Directorate of Livestock and Dairy Development (Ext.) Punjab, Lahore. ii) Directorate of Livestock and Dairy Development, Barani Areas (PVTI) Rawalpindi.
Source: - i) Directorate of Livestock and Dairy Development (Ext.) Punjab, Lahore. ii) Directorate of Livestock and Dairy Development, Barani Areas Rawalpindi.
Table 160:- Veterinary Hospitals, Dispensaries and Centers, The Punjab
Table 159:- Animals Vaccinated, Treated and Castrated, The Punjab(Thousand Number)
LIVESTOCK220

221
VETERINARY INSTITUTIONS THE PUNJAB1986 1990 1996 2000 2006
VETERINARY INSTITUTIONS, THE PUNJAB
NUMBERVETERINARYVETERINARY
CENTRES
2024 1998
1931
1892 1892
1800
2000
2200
1400
1600
1800
740740 755 775
1017
800
1000
1200
DISPENSARIES
541 537527518541
740
400
600
800
HOSPITALS0
200
2002-03 2003-04 2004-05 2005-06 2006-07

Year Total Cattle Buffaloes Sheep Goats Others
1997-98 73394 9034 8594 21374 34386 61998-99 82056 10207 8843 25267 37726 131999-00 87882 10391 10830 24911 41706 44
2000-01 99941 11592 12917 27651 47755 262001-02 118834 13884 13504 33139 58259 482002-03 175411 20499 20394 53669 80781 68
2003-04 176986 20521 20175 53850 82354 862004-05 126056 12702 14591 39021 59697 452005-06 82692 11928 10639 21944 38161 20
2006-07 87880 12250 14750 21850 38990 40
1997-98 55315 5879 5324 16181 27925 61998-99 57408 5723 5414 17699 28561 111999-00 63548 6336 6472 18469 32235 36
2000-01 74053 6877 7688 21165 38306 172001-02 76616 7778 8069 22582 38144 432002-03 126037 11843 12647 39396 62094 57
2003-04 129022 11907 12706 39991 64343 752004-05 97520 8290 9676 31550 47968 362005-06 57742 7979 6831 14663 28258 11
2006-07 62814 8321 9425 15405 29641 22
1997-98 18079 3155 3270 5193 6461 -1998-99 24648 4484 3429 7568 9165 21999-00 24334 4055 4358 6442 9471 8
2000-01 25888 4715 5229 6486 9449 92001-02 42218 6106 5435 10557 20115 52002-03 49374 8656 7747 14273 18687 11
2003-04 47964 8614 7469 13859 18011 112004-05 28536 4412 4915 7471 11729 92005-06 24950 3949 3808 7281 9903 9
2006-07 25066 3929 5325 6445 9349 18Source: - i) ii)
222LIVESTOCKTable 161:- Animals Slaughtered in Recognized and Un-Recognized Slaughter
Houses by Type, The Punjab(Hundred Number)
B - RECOGNIZED SLAUGHTER HOUSES
C - UN-RECOGNIZED SLAUGHTER HOUSES
Directorate of Livestock and Dairy Development (Ext.) Punjab, Lahore. Directorate of Livestock and Dairy Development, Barani Areas (PVTV), Rawalpindi.
A - BOTH RECOGNIZED & UN-RECOGNIZED SLAUGHTER HOUSES

District Total Cattle Buffaloes Sheep Goats Others
The Punjab 87880 12250 14750 21850 38990 40
Bahawalpur 962 133 220 109 500 -Bahawalnagar 2004 622 405 442 535 -Rahim Yar Khan 2507 381 402 354 1370 -
D.G. Khan 534 96 84 166 187 1Layyah 1450 255 255 337 595 8Muzaffargarh 5988 1234 1132 1647 1975 -Rajanpur 2686 374 471 805 1036 -
Faisalabad 15125 1363 2204 4597 6960 1Jhang 2106 304 477 489 835 1Toba Tek Singh 1050 99 234 113 604
Gujranwala 6488 975 1528 2074 1911 -Gujrat 3670 588 761 1235 1084 2Hafizabad 608 62 111 95 338 2Mandi Baha-ud-Din 2273 481 522 663 606 1Narowal 493 74 91 132 196 -Sialkot 1983 161 217 600 1005 -
Lahore 13805 922 746 3901 8235 1Kasur 490 92 88 172 138 -Nankana 510 68 199 68 173 2Okara 650 62 189 28 369 2Sheikhupura 3015 793 1012 566 644 -
Multan 2270 252 376 534 1108 -Khanewal 658 76 122 92 368 -Lodhran 370 45 93 61 171 -Pakpattan 564 76 182 122 184 -Sahiwal 750 73 177 128 372 -Vehari 874 179 203 269 223 -
Rawalpindi 4756 707 823 355 2866 5Attock 1312 106 74 38 1094 -Chakwal 1553 267 211 380 695 -Jhelum 1366 232 136 208 790 -
Sargodha 2894 532 582 735 1045 -Bhakkar 1046 271 232 181 362 -Khushab 716 188 132 115 267 14Mianwali 354 107 59 39 149 -Source: - i) ii)
Directorate of Livestock and Dairy Development (Ext.) Punjab, Lahore.Directorate of Livestock and Dairy Development, Barani Areas (PVTV), Rawalpindi.
223LIVESTOCK
Table 162:- Animals Slaughtered in Recognized and Un-recognized Slaughter Houses by Type and District, The Punjab: 2006-07
(Hundred Number)

Number
Capacity to rear birds per
Annum (Thousand)
Number
Capacity to rear birds per
Annum (Thousand)
Number
Capacity to rear birds per
Annum (Thousand)
The Punjab 18776 418660 3402 20570 412 5190
Bahawalpur 280 5355 30 155 - -Bahawalnagar 325 3115 11 25 - -R. Y. Khan 1021 20936 128 959 1 25
D. G. Khan 232 3234 139 279 - -Layyah 242 3746 20 79 - -Muzaffargarh 484 8916 30 90 - -Rajanpur 40 693 6 22 - -
Faisalabad 1556 37137 668 3596 46 454Jhang 125 3640 45 80 - -T. T. Singh 765 17869 507 3905 3 60
Gujranwala 1354 45583 150 1050 18 339Gujrat 172 6055 83 395 5 82Hafizabad 184 4774 21 44 - -Mandi Baha-ud-Din 81 1470 13 52 - -Narowal 825 9273 13 95 - -Sialkot 361 15824 79 862 9 140
Lahore 264 14297 52 305 5 128Kasur 991 33920 43 587 - -Nankana 386 9653 62 229 4 510Okara 207 4858 60 332 3 27Sheikhupura 460 13230 65 688 12 1000
Multan 690 21700 44 250 3 400Khanewal 674 14700 35 153 - -Lodhran 43 1141 32 246 - -Pakpattan 123 2331 201 1642 - -Sahiwal 452 12817 37 401 - -Vehari 422 10962 84 844 - -
Rawalpindi 1145 13650 124 320 145 593Attock 98 2534 12 40 - -Chakwal 2100 11991 315 1580 49 340Jhelum 371 6951 80 269 4 103
Sargodha 1137 36512 102 536 7 480Bhakkar 275 4165 - - - -Khushab 397 7308 23 210 7 104Mianwali 94 1460 48 130 1 5
(Islamabad) 400 6860 40 120 90 400
LIVESTOCKTable 163 :- Establishment of Private Poultry Farms by District, The Punjab: 2006-07
224
So urce:- Directorate, of Poultry Research Institute Punjab, Rawalpindi.
District
BROILER FARMS LAYER FARMS BREEDING FARMS

2004-05 2005-06 2006-07
1 26840 27222 28040
2i) Number 108 116 120
ii) Capacity to Produce Day-Old Chicks ('000' Nos.) 326290 350130 396310iii) Day-Old Chicks Produced ('000' Nos.) 293510 307680 323970
3i) Number 48 98 101
ii) Capacity to Produce Feed Per Annum ('000' M. Tons) 3575 7300 7520iii) Poultry Feed Produced ('000' M. Tons) 1702 1772 1894
4 16727 20247 22590i) Layer 2819 3347 3402
ii) Broiler 13380 16495 18776iii) Breeder 528 405 412
5i) Layer 18710 20500 20570
ii) Broiler 360130 337032 418660iii) Breeding Stock 4810 4020 5190
6i) Layer 14430 14990 15589
ii) Broiler 245850 258050 270950iii) Breeding Stock 3320 3340 4350
7 32500 33000 33500
8
I. Eggs (Million) 4760 4915 5171i) Farm 3463 3598 3741
ii) Desi 1297 1317 1430
II. Poultry Meat (Metric Tons) 303170 316559 331616i) Broiler 245850 258050 270950
ii) Culled Birds (Layer & Breeder) 17750 18330 19939iii) Desi 39570 40179 40727
9i) Eggs (Number) 55.02 55.74 57.61
ii) Poultry Meat (Kg.) 3.5 3.59 3.69
225
Particulars
LIVESTOCK
Table 164:- Poultry Production Status in Private Sector, The Punjab
Source:- Directorate of Poultry Research Institute Punjab, Rawalpindi.
Investment in Poultry Farming Sector (Million Rs.)
Hatcheries
Feed Mills
Poultry Farms (Number)
Capacity to Produce/Maintain Birds Per Annum (Thousand)
Birds Produced/Maintained ('000' Nos.)
Rural Poultry Population ('000' Nos.)
Poultry Products Produced
Per Capita Availability of Poultry Products

Sr. No. Particulars Unit 2002-03 2003-04 2004-05 2005-06 2006-07
1 Govt. Poultry Farms in Operation
(Number)10 10 10 10 10
2 Total Birds Maintained (Thousand Nos.) 706 740 681 891 797
3 Birds Sold For Breeding " 539 543 495 635 539
4 Birds Sold For Table " 42 55 61 106 75
5 Eggs Produced " 3158 3508 4537 2811 3628
6 Eggs Sold " 2230 2627 3644 1829 2686
7 Eggs Set in Incubators " 937 868 896 1022 934
8 Day - Old Chicks Produced "
555 508 503 650 592
9 Number of Birds in Lay Maintained Per Month "
19 21 26 17 21
10 Hatchability (Percent) 59.23 58.53 56.14 63.60 63.38
Source:- Directorate of Poultry Research Institute Punjab, Rawalpindi.
226LIVESTOCK
Table 165 :- Performance of Government Poultry Farms, The Punjab

i)
ii)
iii)
iv)
Annual Census of Manufacturing Industries (CMI).
Registered Factories and their Employment by District and Industry.
Statistical tables included in this section contain data on production and employment for
the years 1997-98 to 2006-07 and monthly data for 2006-07 as well in respect of 34 items
manufactured by 21 selected large scale industries in the Punjab. These industries accounted for
about 66.03% of "Total Value Added" in manufacturing sector in the Province during 1980-81.
227
MONTHLY SURVEY OF INDUSTRIAL PRODUCTION AND EMPLOYMENT
Industrial Credit.
EXPLANATORY NOTESON
MANUFACTURING INDUSTRIES SECTION
This Section includes statistics on the following topics:-
Monthly Survey of Industrial Production and Employment.
Employment during the year is monthly average.
This information has been collected through Bureau’s Monthly Survey of Industrial
Production and Employment which was started in October, 1971. Industry-wise proforma are
used for the purpose. Data from non-responding factories is collected by Bureau’s Officials
through personal visits. The results of the Survey for a month are generally finalized by the end
of the following month. Employment data for a factory is shown only once against the industry in
which it is classified on the basis of its major products even though it produces more than one
item.
Coverage and Steps for Improvement:- Coverage is complete in respect of Cotton Cloth (mill
sector), Woollen and Worsted Cloth, Jute Textile, Sugar, Cigarettes, Cement, Caustic Soda,
Sulphuric Acid, Fertilizers, Bicycles, Soft Drinks and Juices. To complete coverage in respect of
remaining Industrial Units attempts are being made to ensure response from outstanding
factories.
Efforts are also made to keep the list of factories up-to date in consultation with Central
Board of Revenue, PICIC, Zarai Traqiat-i Bank and Directorate of Labour Welfare, Punjab. More
over, scope of the Monthly Survey of Industrial Production and Employment is gradually being
extended to some more Industries.

a)
b)
c)
Federal Bureau of Statistics:-Planning of Census in collaboration with Provincial Bureaus of Statistics and Directorates of Industries.
Preparation of Questionnaire, Tabulation Plan and Editing Instructions in consultation with all concerned Federal Ministries, Provincial Departments and Autonomous and Private Organizations.
Preparation and Publication of CMI tables at national level.
228
CENSUS OF MANUFCTURING INDUSTRIES (CMI)
This section contains tables on Summary Statistics (Fixed Assets, Employment, Employment
Cost, Industrial Cost, Value of Production, Gross Value Added of registered factories reporing
annual Census of Manufacturing Industries for the years 1989-90 to 2000-01. The Census is
conducted under Industrial Statistics Act 1942, through a co-operative programme shared by
Federal Bureau of Statistics, Government of Pakistan, Directorate of Industries and Mineral
Development, Punjab and Bureau of Statistics, Punjab with following distribution of work:-
c)
a)
b)
c)
d)
a)
b)
c)
Preparation and Publication of CMI tables at national level.
Preliminary editing of CMI returns.
Bureau of Statistics, Punjab:-
Statistical examination of CMI returns.
Computer processing of CMI returns.
Directorate of Industries and Mineral Development, Punjab:-
Notification of the questionnaires.
Printing and Mailing out of Questionnaires
Collection of CMI returns.
Scope & Coverage:
All factories, carrying on manufacturing or repairing activities and registered or eligiblefor registration under Section 2 (J) or 5 (i) under the Factories Act 1934 (Amended in 1973), arecovered under the Census. It, however, excludes Defence and other Government establishmentsincluding Railway workshops which provide ancillary facilities and do not manufacture or repairanything for commercial purpose.
Preparation of CMI Tables for transmittal to FBS.

i)
ii)
iii)
REGISTERED FACTORIES:
An establishment is said to be registered under Section 2 (J) of Factories Act 1934,
(Amended in 1973) if ten or more workers are working on any day of the preceding
twelve months and in any part of which manufacturing process is being carried on with
or without the aid of power or is ordinarily so carried on, but does not include Mine
subject, which comes under the operation of Mines Act, 1923, whereas the
establishments having employment between 5-9 workers during the year are eligible
for registration under section 5 (i) of the Factories Act.
GROSS VALUE OF FIXED ASSETS:It includes the gross value of land, building, plant, machinery, transport and otherfixed assets i.e. equipment, furniture etc., as at the end of the year.
Definitions: Important terms used in the section are defined as under:-
EMPLOYMENT: It is the total average daily employment during the year computed from the monthly
229
iv)
v)
vi)
vii)
INDUSTRIAL COST:It includes cost of raw materials, fuel and electricity consumed and payments made toothers for repair, maintenance of building and machinery and processing ofestablishments materials.
GROSS VALUE OF INDUSTRIAL PRODUCTION:It includes value of products and by-products, sale-proceeds from industrial waste,
receipts for industrial work done and services rendered to others, sale of electricity and
value of ` net work in process'. The value of products and by-products includes
indirect taxes.
g y p y g y p yemployment data reported in CMI returns adjusted for contract labour.
EMPLOYMENT COST:It includes wages and salaries, cash and non-cash benefits and the amount paid tocontract labour.
GROSS VALUE ADDEDThis is worked out by subtracting industrial cost from the gross value of industrialproduction.

1
2
3
4
1
2
3
The reported data contained reporting errors and inconsistencies, which were corrected
on the basis of available supplementary information or/and past data.
Census results become available with a time-lag of 2-3 years due to the time taken forcollection, editing and tabulation processes.
Size and nature of non-response varies from year to year. Since non-response surveyscould not be conducted for all the years, the Census results were not adjusted for non-
230Limitations of CMI
The Bureau of Statistics has taken the following steps during recent years to improve the Census Results:-
List of registered factories is being kept up-todate.
Reported data is subjected to manual as well as computer statistical editing, beforefinal tabulation. Missing information estimated.
The cases, where reporting errors cannot be corrected without changing the reported
The mailing list used for the census may not be up-to date.
4 Efforts are being made to complete editing and tabulation as early as possible, afterreceipt of returns from Directorate of Industries and Mineral Development, Punjab.
REGISTERED FACTORIES AND THEIR EMPLOYMENT BY DISTRICT AND MAJOR INDUSTY GROUP
Tables on Distribution of registered factories employing persons less than hundred, and
hundred or more by district and major industry group as on 30th June 2001 and 2004 have also
been added to identify the areas of industrial concentration and the type of industrial activity.
These tables have been extracted from Bureau's Directories of Registered Factories in the Punjab
as on 30th June 2001 and 2004 (which contain information on names and addresses of registered
factories arranged alphabetically within industry along with their status of ownership and
legality, fixed assets & employment sizes and year of commencement of production).
, p g g g pinformation significantly, managements of the concerned units are asked to reconcilethe discrepancies observed in their data. Corrections are made in the light of theirreplies.

Vegetable Ghee
Cooking Oil* Total Production
Workers
1997-98 49 952800 353399 16126 4880 3077
1998-99 53 1010800 362168 20642 4669 2947
1999-00 54 1030800 324802 11557 4687 2911
2000-01 54 1024800 388274 20312 4561 2756
2001-02 55 1054800 388302 39306 4756 2871
2002-03 50 943800 357914 52394 4418 2698
2003-04 50 943800 385195 71327 4470 2692
2004-05 54 943800 468773 70618 4538 2706
2005-06 54 1011200 475707 75744 4592 2739
2006-07 54 1100100 492596 71696 4308 2551
2006-07
July 54 39206 5986 4288 2524August 54 39888 6457 4298 2542
September 54 41034 6427 4298 2531
October 54 42022 6454 4306 2528November 54 46027 5881 4301 2528
December 54 44515 6787 4306 2535
January 54 35067 5718 4306 2535
February 54 40874 5625 4310 2549
March 54 46032 6254 4440 2666
April 54 42559 4367 4434 2679
May 54 39041 6229 4431 2593
June 54 36330 5451 3976 2401Source: - Bureau of Statistics , Punjab, Lahore.
MANUFACTURING INDUSTRIES231
Table 166:- Performance Of Vegetable Ghee Industry, The Punjab
Annual Installed Capacity (M.Tons)
Year/MonthNo. of Units
Covered
Production (M.Tons) Employment (Nos.)

Total Production Workers
1997-98 40 183050 2067615 25026 16148
1998-99 40 182550 2032555 23712 15138
1999-00 40 182550 1317484 21479 13554
2000-01 40 182550 1609861 21767 13796
2001-02 40 183550 2152553 22182 14204
2002-03 40 183550 2339695 22108 14190
2003-04 38 183550 2633050 24002 15452
2004-05 39 188200 2204479 23718 15241
2005-06 41 216200 1616019 24565 15367
2006-07 41 216200 2163263 25230 16221
2006-07
July 41 - 20076 12127
August 41 - 20417 12291
September 41 - 20845 12514
October 41 - 21204 12344
November 41 64428 28181 17826
December 41 489343 32648 20680
January 41 459818 33324 21728
February 41 497549 33518 21309
March 41 527262 31833 20634
April 41 142863 27695 18666
May 41 - 16816 12368June 41 - 16204 12160
Employment (Nos.)
Source: - Bureau of Statistics , Punjab, Lahore.
232MANUFACTURING INDUSTRIES
Table 167:- Performance of Sugar Industry, The Punjab
Daily Crushing Capacity (M.Tons)
No. of Units CoveredYear/Month Production
(M. Tons)

Soft Drinks (Coca Cola, R.C.
Pepsi,7Up etc .)
Fruit Juices (Shezan , Benz
Tops etc .)Total Production
Workers
1997-98 34 40713 6061 3749 1483
1998-99 36 58060 5850 3715 1612
1999-00 39 58960 8372 4318 1873
2000-01 39 70045 11733 4736 2025
2001-02 39 71939 10896 4879 2078
2002-03 39 67115 10208 4827 2007
2003-04 39 75196 12823 4902 1933
2004-05 39 90899 12803 5075 2105
2005-06 39 128959 16190 5258 2173
2006-07 39 190736 15614 5518 2536
2006-07
July 39 12568 1666 5437 2486
August 39 14919 2074 5390 2457
September 39 15176 823 5397 2459
October 39 17495 1141 5388 2435
November 39 11348 1547 5391 2418
December 39 9192 1442 5363 2371
January 39 7925 496 5405 2391
February 39 11077 915 5655 2629
March 39 15532 672 5715 2649
April 39 22400 1690 5744 2671
May 39 24434 1671 5647 2736
June 39 28679 1471 5678 2731Source : - Bureau of Statistics, Punjab, Lahore .
Employment (Nos.)Production (`000'Crates of 24 Bottles/Packets)
Year /Month No. of Units Covered
233
MANUFACTURING INDUSTRIES
Table 168:- Performance of Beverages Industry, The Punjab

Total Production Workers
1997-98 3 21915 20955 2455 2168
1998-99 3 24035 22568 2359 2069
1999-00 3 24035 21321 2210 1957
2000-01 3 28000 26724 1845 1655
2001-02 3 28010 27459 1714 1541
2002-03 3 27006 24214 1684 1517
2003-04 3 28000 27309 1630 1470
2004-05 3 31156 29902 1555 1405
2005-06 3 34754 31773 1484 1344
2006-07 3 31098 29902 1398 1272
2006-07
July 3 2457 1415 1288
August 3 2259 1409 1282
September 3 2037 1410 1284
October 3 1955 1407 1280
November 3 2539 1402 1274
December 3 2258 1404 1276
January 3 2483 1397 1269
February 3 2445 1394 1266
March 3 2915 1390 1262
April 3 3062 1390 1262
May 3 3499 1363 1257
June 3 1942 1376 1255Source:- Bureau of Statistics, Punjab, Lahore.
MANUFACTURING INDUSTRIES
Table 169:- Performance of Cigarette Industry, The Punjab
Production (Million Nos.)
Annaul Installed Capacity (Million
Nos.)
No. of Units CoveredYear/Month
Employment (Nos.)
234

Total Spining WeavingSpindles
(`000' Nos.)
Rotors (Nos.)
Looms (Nos.)
Cotton Yarn (`000'
Kgs.)
Cotton Cloth (`000'
Metres)
TotalProduc-
tion Workers
1997-98 245 222 46 4840 38376 6168 559800 228629 1375 1204
1998-99 245 222 46 4897 34632 6654 554977 241349 1402 1231
1999-00 255 228 52 4902 40112 6892 630865 259430 1428 1260
2000-01 255 228 52 5014 36744 6470 649416 267720 1468 1294
2001-02 255 228 52 5123 48817 6400 704225 312086 1614 1425
2002-03 267 238 53 5518 45276 6777 740051 304867 1625 1437
2003-04 267 238 53 5504 38384 5823 737302 301397 1624 1433
2004-05 272 233 38 5786 42401 6537 783981 317586 1706 1509
2005-06 271 250 50 6083 51332 7327 823773 340015 1722 1504
2006-07 270 263 50 6578 50192 7033 935996 921403 1832 1581
2006-07
July 271 250 49 6445 44960 7257 77607 34989 181 1586
August 271 250 49 6508 44252 7005 77807 35000 1824 1579
September 289 259 49 6477 63580 7110 76902 33918 1825 1579
October 289 259 50 6566 42368 7136 77802 34120 1830 1582
November 289 259 50 6556 46800 7234 77875 34355 1832 1586
December 289 259 52 6626 38060 8376 78414 35674 1833 1581
January 289 259 52 6602 38676 7975 78810 35700 1844 1586
February 289 259 52 6567 40964 9571 78890 35814 1845 1584
March 289 259 52 6600 39964 7015 76575 35528 1827 1482
April 289 259 52 6594 39396 7232 77841 35812 1831 1577
May 289 259 52 6647 40244 7026 78971 35915 1837 1581
June 288 263 50 6578 50192 7033 78502 34578 1826 1826Source:- Bureau of Statistics, Punjab, Lahore.
Year/ Month
235
Table 170:- Performance of Cotton Textile Industry, The Punjab
No. of Units Covered Installed Capacity at the end of Year/Month Production Employment
(`00' Nos.)
MANUFACTURING INDUSTRIES

Sacking Hessain Twine Total Total Production Workers
1997-98 9 48557 6228 8889 63674 9637 8485
1998-99 9 42326 7412 7848 57586 10440 9307
1999-00 10 43495 7788 9976 61259 9607 8374
2000-01 10 45510 10640 10937 67087 9749 8520
2001-02 10 42174 9597 9250 61021 9240 8012
2002-03 10 59668 10363 13222 83253 9863 8415
2003-04 10 69949 15060 35231 120240 9912 8465
2004-05 10 61182 24137 23147 108466 9495 8035
2005-06 10 56095 32405 34738 123238 9590 8517
2006-07 10 75841 14813 31205 121859 10573 9552
2006-07
July 10 5328 1802 3567 10697 10585 9508
August 10 4811 1610 3392 9813 10344 9315
September 10 3143 1671 1820 6634 9644 8629
October 10 4244 1309 3267 8820 10022 8985
November 10 5258 1656 2809 9723 10344 9371
December 10 6035 1474 2521 10030 10577 9588
January 10 6472 900 1769 9141 10766 9762
February 10 7312 833 2054 10199 10968 9953
March 10 8941 840 2651 12432 10909 9886
April 10 5412 643 1722 7777 10764 9752
May 10 9112 635 2374 12121 10989 9935
June 10 6621 1445 3259 11325 10963 9940
236
Source: - Bureau of Statistics, Punjab, Lahore.
MANUFACTURING INDUSTRIES
Table 171:- Performance of Jute Textile Industry, The Punjab
Employment (Nos.)
Year/ Month No. of Units Covered
Production (M. Tons)
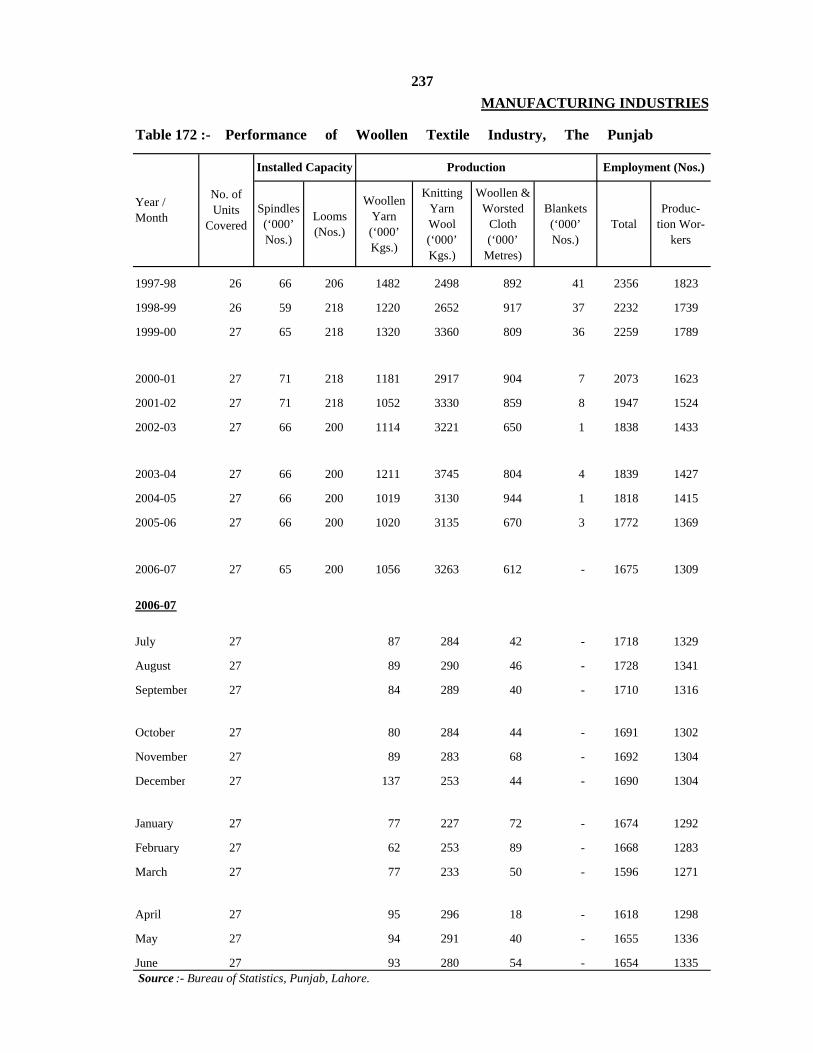
Spindles (‘000’ Nos.)
Looms (Nos.)
Woollen Yarn (‘000’ Kgs.)
Knitting Yarn Wool (‘000’ Kgs.)
Woollen & Worsted
Cloth (‘000’
Metres)
Blankets (‘000’ Nos.)
TotalProduc-
tion Wor-kers
1997-98 26 66 206 1482 2498 892 41 2356 1823
1998-99 26 59 218 1220 2652 917 37 2232 1739
1999-00 27 65 218 1320 3360 809 36 2259 1789
2000-01 27 71 218 1181 2917 904 7 2073 1623
2001-02 27 71 218 1052 3330 859 8 1947 1524
2002-03 27 66 200 1114 3221 650 1 1838 1433
2003-04 27 66 200 1211 3745 804 4 1839 1427
2004-05 27 66 200 1019 3130 944 1 1818 1415
2005-06 27 66 200 1020 3135 670 3 1772 1369
2006-07 27 65 200 1056 3263 612 - 1675 1309
2006-07
July 27 87 284 42 - 1718 1329
August 27 89 290 46 - 1728 1341
September 27 84 289 40 - 1710 1316
October 27 80 284 44 - 1691 1302
November 27 89 283 68 - 1692 1304
December 27 137 253 44 - 1690 1304
January 27 77 227 72 - 1674 1292
February 27 62 253 89 - 1668 1283
March 27 77 233 50 - 1596 1271
April 27 95 296 18 - 1618 1298
May 27 94 291 40 - 1655 1336
June 27 93 280 54 - 1654 1335 Source :- Bureau of Statistics, Punjab, Lahore.
237
Table 172 :- Performance of Woollen Textile Industry, The Punjab
Year / Month
No. of Units
Covered
Installed Capacity Production Employment (Nos.)
MANUFACTURING INDUSTRIES

Upper Leather (`000'Sq. Metres)
Sole Leather (`000' Kgs.)
Upper Leather (`000'Sq. Metres)
Sole Leather (`000'Kgs.) Total Production
Workers
1997-98 18 8536 3863 2960 110 1121 9031998-99 18 8536 3863 2318 108 1003 7811999-00 18 8536 3863 2119 124 945 713
2000-01 19 9736 3843 3208 128 1141 8672001-02 19 9736 3843 2685 118 1146 8682002-03 17 9025 3843 2716 119 1138 850
2003-04 17 9025 3843 6680 118 1231 8972004-05 17 9025 3843 4455 110 1251 9052005-06 17 9025 3843 4672 126 1249 897
2006-07 19 9142 3917 5078 126 1296 950
2006-07
July 17 395 10 1323 961August 17 350 11 1317 958September 17 349 12 1302 948
October 17 416 9 1312 956November 17 424 13 1313 959December 17 429 12 1317 964
January 17 325 9 1291 941February 17 364 13 1292 939March 17 505 11 1295 939
April 17 497 10 1289 935May 17 487 8 1306 948June 17 537 8 1306 946
Source:- Bureau of Statistics, Punjab, Lahore.
238
Year / Month
Annual Installed Capacity Production Employment (Nos.)
MANUFACTURING INDUSTRIES
Table 173:- Performance of Leather Tanning Industry, The Punjab
No. of Units
Covered

Total Production Workers
1997-98 13 26755 22820 7537 6442
1998-99 13 26555 22181 7511 6458
1999-00 13 26555 24116 7674 6609
2000-01 12 26411 24618 7474 6425
2001-02 12 26411 23324 7846 6784
2002-03 12 26411 22166 8386 7312
2003-04 13 26461 23585 8039 6938
2004-05 13 26461 21268 7882 6753
2005-06 15 26461 21521 8438 7123
2006-07 16 26411 24628 8948 7507
2006-07
July 16 1315 8832 7456
August 16 2422 8969 7574
September 16 2213 9091 7682
October 16 1871 9029 7601
November 16 1977 9103 7664
December 16 2090 9128 7590
January 16 1403 8839 7384
February 16 1988 8966 7515
March 16 2265 8800 7370
April 16 1989 8696 7244
May 16 2569 8877 7425
June 16 2526 9040 7596Source:- Bureau of Statistics, Punjab, Lahore.
239
Year / Month No. of Units Covered
Annual Installed Capacity
(`000' Pairs)
Production (`000' Pairs)
Table 174:- Performance of Footwear Industry, The Punjab
MANUFACTURING INDUSTRIES
Employment (Nos.)
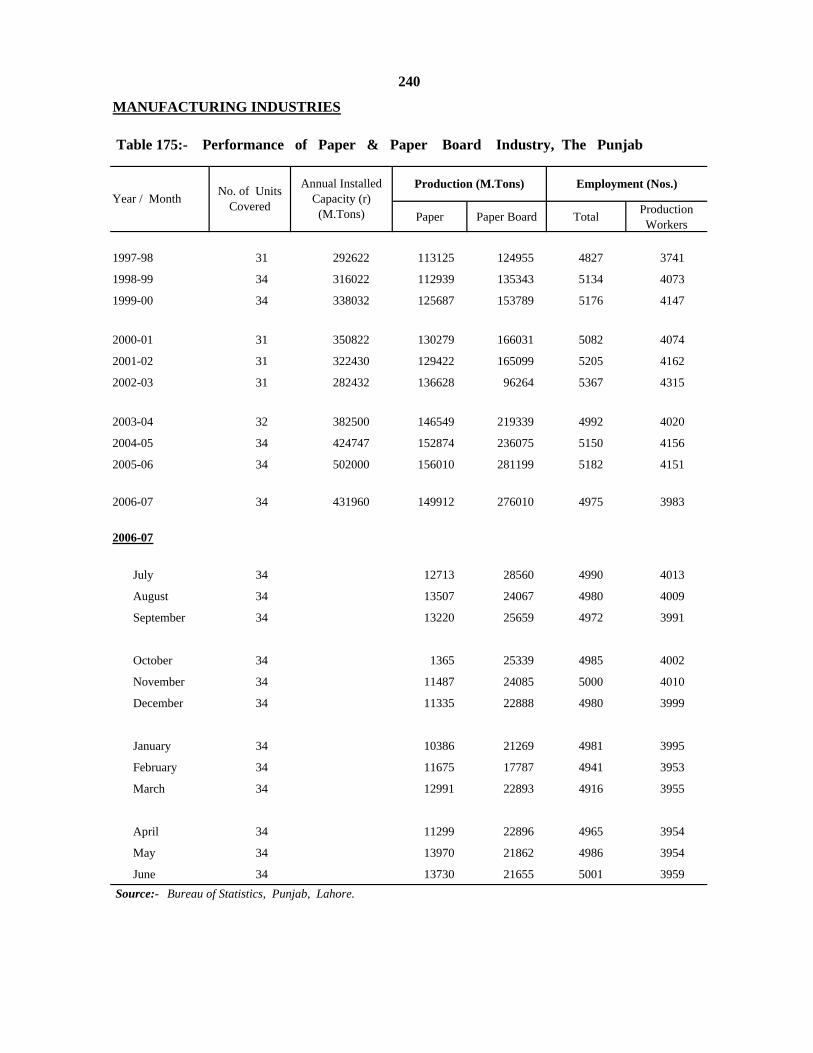
Paper Paper Board Total Production Workers
1997-98 31 292622 113125 124955 4827 3741
1998-99 34 316022 112939 135343 5134 4073
1999-00 34 338032 125687 153789 5176 4147
2000-01 31 350822 130279 166031 5082 4074
2001-02 31 322430 129422 165099 5205 4162
2002-03 31 282432 136628 96264 5367 4315
2003-04 32 382500 146549 219339 4992 4020
2004-05 34 424747 152874 236075 5150 4156
2005-06 34 502000 156010 281199 5182 4151
2006-07 34 431960 149912 276010 4975 3983
2006-07
July 34 12713 28560 4990 4013
August 34 13507 24067 4980 4009
September 34 13220 25659 4972 3991
October 34 1365 25339 4985 4002
November 34 11487 24085 5000 4010
December 34 11335 22888 4980 3999
January 34 10386 21269 4981 3995
February 34 11675 17787 4941 3953
March 34 12991 22893 4916 3955
April 34 11299 22896 4965 3954
May 34 13970 21862 4986 3954
June 34 13730 21655 5001 3959 Source:- Bureau of Statistics, Punjab, Lahore.
240
Production (M.Tons)Annual Installed Capacity (r)
(M.Tons)
No. of Units CoveredYear / Month
Employment (Nos.)
Table 175:- Performance of Paper & Paper Board Industry, The Punjab
MANUFACTURING INDUSTRIES

Sulphuric Acid
Annual Installed Capacity
( M. Tons)
Production ( M. Tons)
Production (M.Tons) Total Production
Workers
1997-98 7 120000 113312 6931 1103 817
1998-99 7 120000 117237 8145 1107 811
1999-00 7 150000 136677 38143 1119 807
2000-01 7 150000 139751 38281 1076 762
2001-02 7 150000 143913 42815 1086 766
2002-03 7 150000 157023 41907 1166 836
2003-04 7 150000 177417 39864 1266 914
2004-05 7 150000 196720 42481 1313 960
2005-06 7 220000 216147 43510 1320 934
2006-07 7 220000 240259 41196 1296 901
2006-07
July 7 16793 2739 1314 915
August 7 19570 2369 1286 899
September 7 19760 4055 1283 890
October 7 20002 4037 1290 893
November 7 17676 3418 1281 889
December 7 18864 3430 1299 898
January 7 19806 4664 1293 900
February 7 20105 27265 1296 903
March 7 23966 3394 1299 906
April 7 22836 3402 1289 900
May 7 20082 2733 1284 893
June 7 20799 4402 1333 981
241
Source :- Bureau of Statistics, Punjab, Lahore.
Employment (Nos.)
Table 176:- Performance of Chemical Industry, The Punjab
MANUFACTURING INDUSTRIES
Year / Month No. of Units Covered
Caustic Soda

Urea Amm. Sulphate
Super Phos-phate
Amm. Nitrate
Nitro Phos-phate
TotalProduc-
tion Workers
1997-98 6 3059 1975 1 - 316 293 4691 3143
1998-99 6 3059 1994 - - 339 285 4310 2930
1999-00 6 3059 2218 - 73 386 261 4712 3232
2000-01 6 3059 2223 - 78 374 284 4626 3146
2001-02 6 3059 2309 - 77 329 306 4587 3101
2002-03 6 3353 2638 - 75 335 305 4886 3325
2003-04 6 3797 3005 - 79 350 363 5089 3415
2004-05 6 3828 3083 - 76 330 339 5215 3582
2005-06 6 4043 3285 - 73 328 357 4887 3371
2006-07 6 3992 3268 - 67 331 326 4594 3221
2006-07
July 6 260 - 4 17 17 4695 3216
August 6 245 - 6 33 32 4683 3199
September 6 229 - 6 32 32 74603 3141
October 6 293 - 7 32 34 4548 3173
November 6 230 - 6 14 15 4596 3221
December 6 292 - 6 25 23 4602 3230
January 6 259 - 4 19 17 4608 3254
February 6 260 - 6 31 26 4619 3305
March 6 298 - 6 33 33 4541 3227
April 6 277 - 4 31 33 4572 3254
May 6 294 - 5 31 30 4554 3242
June 6 281 - 7 32 32 4515 3182
Source :- Bureau of Statistics, Punjab, Lahore.
242
Production (`000' M.Tons) Employment (Nos.)
MANUFACTURING INDUSTRIES
Table 177:- Performance of Fertilizers Industry, The Punjab
Year / MonthNo. of Units
Covered
Annual Installed Capacity
(`000' M.Tons)
a) Pak American Fertilizers Ltd. closed its Ammonium Sulphate Production Unit due to financial problems.

Total Production Workers
1997-98 10 5550 3360 3976 2351
1998-99 10 5495 4102 4000 2361
1999-00 10 6545 4299 3746 2218
2000-01 10 6545 4042 3814 2263
2001-02 10 6545 4074 3060 1680
2002-03 10 6545 4569 3104 1693
2003-04 10 6545 5221 3488 1967
2004-05 11 6745 6667 4475 2691
2005-06 11 7655 7542 4696 2714
2006-07 12 8862 8552 4950 2839
2006-07
July 12 698 4689 2664
August 12 664 4695 2664
September 12 604 4717 2670
October 12 665 4720 2684
November 12 665 4748 2667
December 12 716 5087 2435
January 12 791 5092 2952
February 12 646 5078 2438
March 12 770 5101 2454
April 12 846 5134 2443
May 12 842 5146 2470
June 12 920 5189 3029
Employment (Nos.)No. of Units
Covered
MANUFACTURING INDUSTRIES
Table 178:- Performance of Cement Industry, The Punjab
Year / MonthAnnual Installed Capacity (`000’
M. Tons)
Production (`000’
M.Tons)
243
Source:- Bureau of Statistics, Punjab, Lahore.

Total Production Workers
1997-98 33 283640 67701 1683 1316
1998-99 34 283640 90285 1698 1317
1999-00 34 283640 128626 1701 1306
2000-01 34 300000 118641 1650 1278
2001-02 34 300000 144800 1630 1274
2002-03 34 300000 194438 1617 1267
2003-04 34 500000 348896 1634 1290
2004-05 34 500000 369772 1475 1141
2005-06 34 500000 460257 1224 880
2006-07 34 550000 490894 1165 821
2006-07
July 34 38741 1224 880
August 34 37494 1224 880
September 34 39740 1224 880
October 34 41070 1224 880
November 34 43240 1224 880
December 34 42950 1124 880
January 34 43000 1124 880
February 34 44700 1124 880
March 34 43100 1124 880
April 34 38600 1124 880
May 34 39460 1124 880
June 34 38852 1113 880Source: - Bureau of Statistics, Punjab, Lahore.
Employment (Nos.)
MANUFACTURING INDUSTRIES
Table 179:- Performance of Re-Rolled Steel Industry, The Punjab
Year / Month No. of Units Covered
Annual Installed Capacity (`000’
M. Tons)
Production (`000’
M.Tons)
244
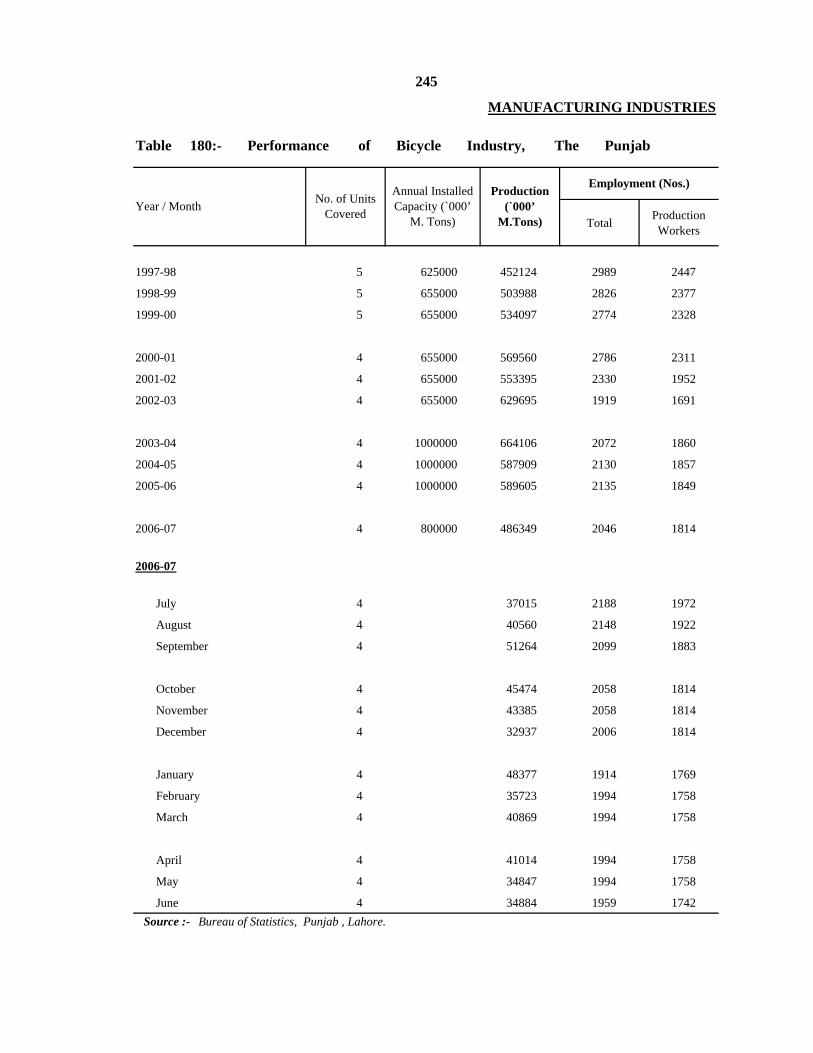
Total Production Workers
1997-98 5 625000 452124 2989 2447
1998-99 5 655000 503988 2826 2377
1999-00 5 655000 534097 2774 2328
2000-01 4 655000 569560 2786 2311
2001-02 4 655000 553395 2330 1952
2002-03 4 655000 629695 1919 1691
2003-04 4 1000000 664106 2072 1860
2004-05 4 1000000 587909 2130 1857
2005-06 4 1000000 589605 2135 1849
2006-07 4 800000 486349 2046 1814
2006-07
July 4 37015 2188 1972
August 4 40560 2148 1922
September 4 51264 2099 1883
October 4 45474 2058 1814
November 4 43385 2058 1814
December 4 32937 2006 1814
January 4 48377 1914 1769
February 4 35723 1994 1758
March 4 40869 1994 1758
April 4 41014 1994 1758
May 4 34847 1994 1758
June 4 34884 1959 1742 Source :- Bureau of Statistics, Punjab , Lahore.
MANUFACTURING INDUSTRIES
Employment (Nos.)
Year / Month No. of Units Covered
Annual Installed Capacity (`000’
M. Tons)
Production (`000’
M.Tons)
245
Table 180:- Performance of Bicycle Industry, The Punjab

Total Production Workers
1997-98 23 6856 173 67 48
1998-99 23 6856 153 62 47
1999-00 23 6856 196 76 60
2000-01 23 6800 200 70 52
2001-02 23 6800 128 65 49
2002-03 23 6800 2611 109 90
2003-04 23 6800 3972 167 142
2004-05 23 10000 5561 173 148
2005-06 23 15000 10937 199 165
2006-07 21 20000 14997 199 146
2006-07
July 21 1062 195 144
August 21 1072 192 141
September 21 1080 194 141
October 21 1203 195 144
November 21 1090 196 143
December 21 1056 196 143
January 21 1087 196 143
February 21 892 194 143
March 21 802 194 140
April 21 1732 211 155
May 21 1922 210 155
June 21 1999 209 155
Table 181:- Performance of Diesel Engine Industry, The Punjab
Employment (Nos.)
Year / Month No. of Units Covered
Annual Installed Capacity (`000’
M. Tons)
Production (`000’
M.Tons)
246
MANUFACTURING INDUSTRIES
Source:- Bureau of Statistics, Punjab, Lahore.

Total Production Workers
1997-98 39 638 519 1212 931
1998-99 50 1057 554 1267 964
1999-00 50 864 656 1340 1034
2000-01 40 1153 809 1419 1162
2001-02 40 1200 905 1479 1199
2002-03 40 1300 1214 1596 1326
2003-04 40 1500 1335 1804 1503
2004-05 40 1600 1373 1741 1425
2005-06 40 2000 1399 1823 1476
2006-07 41 2200 1469 1867 1483
2006-07
July 41 113 1829 1547
August 41 99 1778 1516
September 41 68 1819 1407
October 41 87 1818 1398
November 41 92 1818 1396
December 41 100 1847 1395
January 41 116 1915 1553
February 41 131 1931 1560
March 41 148 1915 1560
April 41 174 1911 1565
May 41 175 1900 1319
June 41 166 1922 1562Source:- Bureau of Statistics, Punjab, Lahore.
Annual Installed Capacity (`000’
M. Tons)
Production (`000’
M.Tons)
Employment (Nos.)
247
MANUFACTURING INDUSTRIES
Table 182:- Performance of Electric Fans Indutry, The Punjab
Year / Month No. of Units Covered

Total Production Workers
1997-98 21 75540 5083 101 88
1998-99 21 75540 3448 103 88
1999-00 21 75540 3437 94 79
2000-01 21 80500 4503 101 84
2001-02 21 80500 5454 118 101
2002-03 21 80500 6293 118 101
2003-04 21 90000 6877 118 103
2004-05 18 10000 8407 117 98
2005-06 18 120000 7893 126 99
2006-07 16 130000 7942 112 89
2006-07
July 16 727 113 90
August 16 689 113 90
September 16 742 112 89
October 16 631 111 85
November 16 626 111 88
December 16 671 111 88
January 16 524 111 88
February 16 638 111 88
March 16 665 111 88
April 16 617 111 88
May 16 703 115 92
June 16 709 115 92Source:- Bureau of Statistics, Punjab, Lahore.
Year / Month No. of Units Covered
Annual Installed Capacity (`000’
M. Tons)
Production (`000’
M.Tons)
Employment (Nos.)
248
MANUFACTURING INDUSTRIES
Table 183:- Performance of Electric Motors Industry, The Punjab

Total Production Workers
1997-98 8 2699 2017
1998-99 8 2668 2030
1999-00 8 2710 2079
2000-01 8 2752 2056
2001-02 5 2994 2322
2002-03 5 3239 2476
2003-04 5 4346 3611
2004-05 5 5405 4504
2005-06 5 6606 5525
2006-07 4 6605 5396
2006-07
July 4 7602 6427
August 4 7601 6427
September 4 6398 5175
October 4 6396 5175
November 4 6396 5175
December 4 6398 5175
January 4 6398 5175
February 4 6406 5182
March 4 6406 5182
April 4 6406 5182
May 4 6428 5182
June 4 6423 5199Note:-Annual installed capacity is not available.Source:- Bureau of Statistics, Punjab, Lahore.
7033
5297
4703
6509
9765
21099
20339
249
Year / Month No. of Units Covered
31694
23938
MANUFACTURING INDUSTRIES
Table 184:- Performance of Electric Transformers Industry, The Punjab
Production (`000’ M.Tons)
2949
Employment (Nos.)
2557
3265
3130
960
2414
2389
2325
3047
1947
3034
3046
3280

Total Production Workers
1997-98 4 986 604
1998-99 4 988 621
1999-00 4 969 620
2000-01 4 931 645
2001-02 4 928 633
2002-03 4 835 581
2003-04 4 802 558
2004-05 4 782 539
2005-06 4 784 534
2006-07 4 738 506
2006-07
July 4 744 514
August 4 744 512
September 4 740 512
October 4 746 519
November 4 746 519
December 4 744 516
January 4 738 511
February 4 741 511
March 4 741 511
April 4 737 483
May 4 738 483
June 4 738 481Note:-Annual installed capacity is not available. Source:- Bureau of Statistics, Punjab, Lahore.
Year / Month No. of Units Covered
Employment (Nos.)
Production (`000’ M.Tons)
31625
24651
27047
14142
26663
34504
35306
43539
48795
4887
4215
4045
4016
3106
4930
55249
5208
5053
250
MANUFACTURING INDUSTRIES
Table 185:- Performance of Tractor Industry, The Punjab
6413
4746
4559
4071
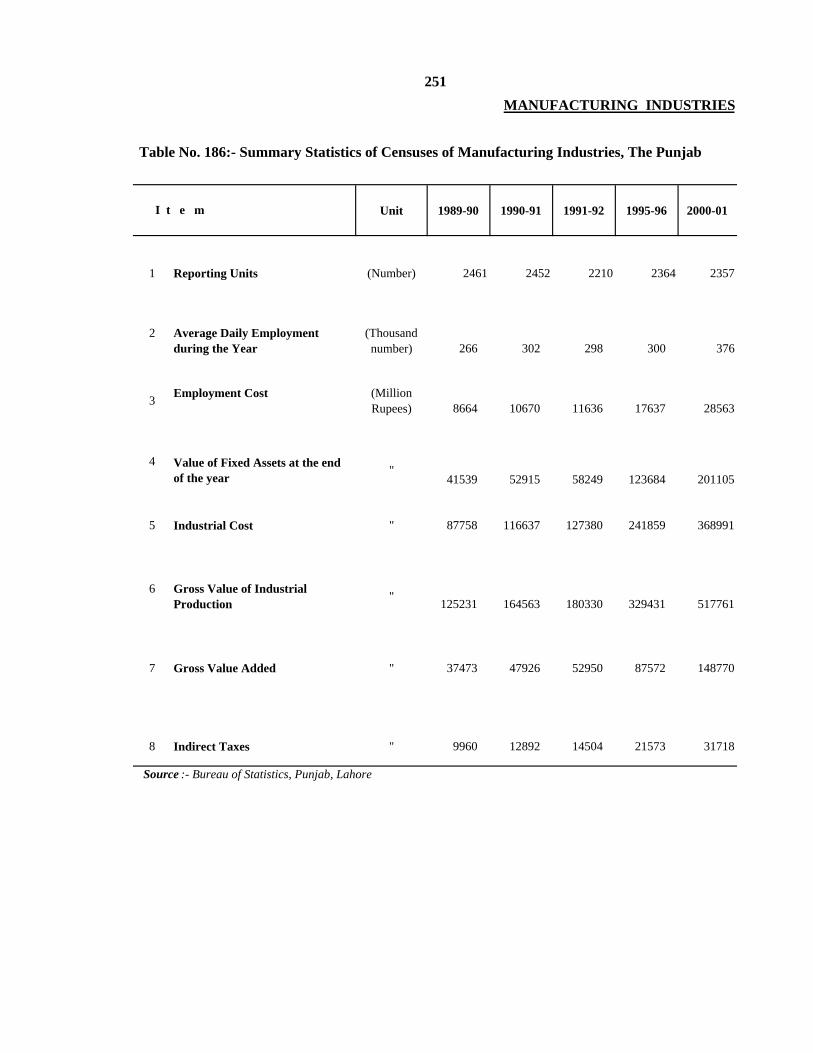
Unit 1989-90 1990-91 1991-92 1995-96 2000-01
1 Reporting Units (Number) 2461 2452 2210 2364 2357
2 Average Daily Employment during the Year
(Thousand number) 266 302 298 300 376
3 Employment Cost (Million Rupees) 8664 10670 11636 17637 28563
4 Value of Fixed Assets at the end of the year "
41539 52915 58249 123684 201105
5 Industrial Cost " 87758 116637 127380 241859 368991
6 Gross Value of Industrial Production " 125231 164563 180330 329431 517761
7 Gross Value Added " 37473 47926 52950 87572 148770
8 Indirect Taxes " 9960 12892 14504 21573 31718
I t e m
Source :- Bureau of Statistics, Punjab, Lahore
MANUFACTURING INDUSTRIES251
Table No. 186:- Summary Statistics of Censuses of Manufacturing Industries, The Punjab
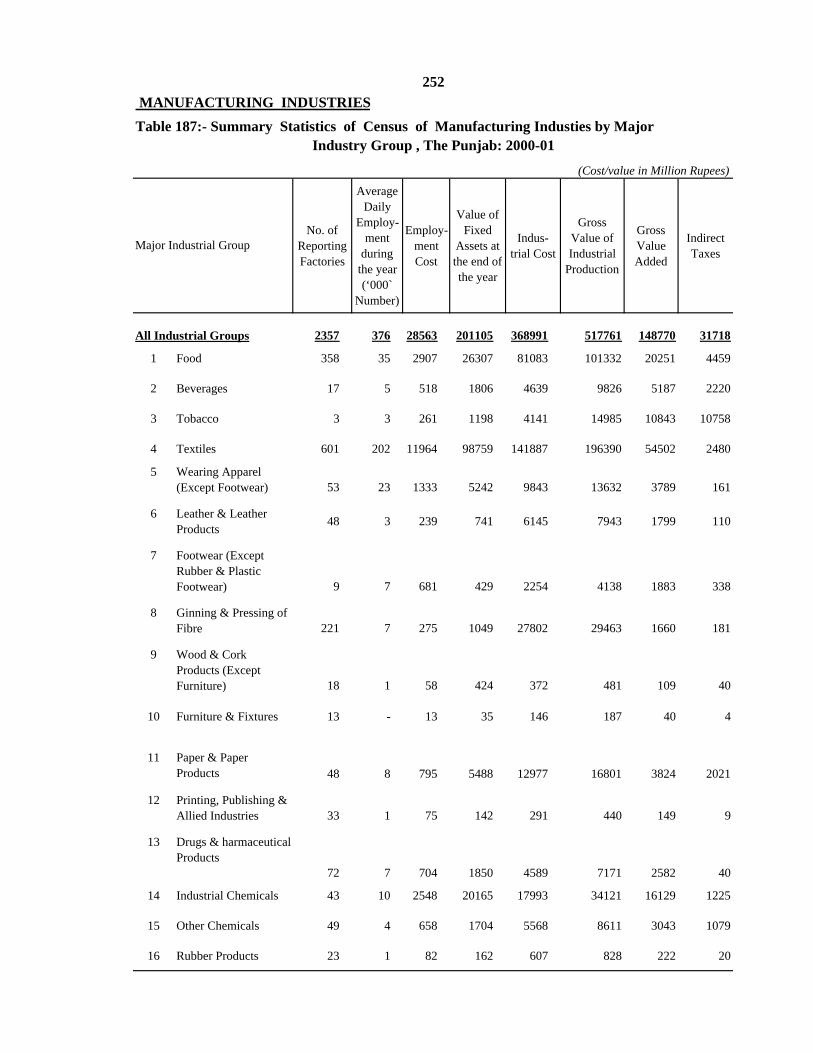
No. of Reporting Factories
Average Daily
Employ-ment
during the year (‘000`
Number)
Employ-ment Cost
Value of Fixed
Assets at the end of the year
Indus-trial Cost
Gross Value of Industrial
Production
Gross Value Added
Indirect Taxes
2357 376 28563 201105 368991 517761 148770 31718
1 Food 358 35 2907 26307 81083 101332 20251 4459
2 Beverages 17 5 518 1806 4639 9826 5187 2220
3 Tobacco 3 3 261 1198 4141 14985 10843 10758
4 Textiles 601 202 11964 98759 141887 196390 54502 2480
5 Wearing Apparel (Except Footwear) 53 23 1333 5242 9843 13632 3789 161
6 Leather & Leather Products 48 3 239 741 6145 7943 1799 110
7 Footwear (Except Rubber & Plastic Footwear) 9 7 681 429 2254 4138 1883 338
8 Ginning & Pressing of Fibre 221 7 275 1049 27802 29463 1660 181
9 Wood & Cork Products (Except Furniture) 18 1 58 424 372 481 109 40
10 Furniture & Fixtures 13 - 13 35 146 187 40 4
11 Paper & Paper Products 48 8 795 5488 12977 16801 3824 2021
12 Printing, Publishing & Allied Industries 33 1 75 142 291 440 149 9
13 Drugs & harmaceutical Products
72 7 704 1850 4589 7171 2582 40
14 Industrial Chemicals 43 10 2548 20165 17993 34121 16129 1225
15 Other Chemicals 49 4 658 1704 5568 8611 3043 1079
16 Rubber Products 23 1 82 162 607 828 222 20
252
Major Industrial Group
MANUFACTURING INDUSTRIESTable 187:- Summary Statistics of Census of Manufacturing Industies by Major
All Industrial Groups
Industry Group , The Punjab: 2000-01
(Cost/value in Million Rupees)

No. of Reporting Factories
Average Daily
Employ-ment
during the year (‘000`
Number)
Employ-ment Cost
Value of Fixed
Assets at the end of the year
Indus-trial Cost
Gross Value of Industrial
Production
Gross Value Added
Indirect taxes
17 Petroleum & Coal Products 3 - 13 18 415 449 35 17
18 Plastic Products N.E.C. 28 1 77 964 805 1165 360 106
19 Pottery, China & Earthenware 27 2 137 637 539 960 421 71
20 Glass & Glass Products 8 2 145 1234 942 1457 515 122
21 Other Non-Metallic Mineral Products 33 5 673 17703 6044 12725 6680 5594
22 Iron & Steel Basic Industries 103 4 269 1444 9484 10583 1099 174
23 Non-Ferrous Metal Basic Industries 10 - 11 32 129 168 39 22
24 Metal Products Except Machinery 127 6 999 1342 2880 5143 2264 185
25 Machinery (Except Electrical) 132 8 1049 3757 11171 14085 2914 122
26 Electrical Machinary, Apparatus Appliances and Supplies 102 10 682 4544 5583 9408 3825 931
27 Transport Equipment69 5 334 1519 4644 5754 1110 23
28 Scientific, Precision and Measuring Instruments & Equipment s 48 3 296 817 1860 2930 1069 51
29 Sports & Athletic Goods 38 11 600 1164 3288 5206 1918 228
30 Miscellaneous Industries 20 2 165 431 870 1380 510 33
253
Major Industrial Group
separately.Information for such industry group has, been included in Major Group of Misc.Industries.Source:- Bureau of Statistics, Punjab, Lahore.
MANUFACTURING INDUSTRIESTable 187:- Summary Statistics of Census of Manufacturing Industies by Major
Industry Group , The Punjab: 2000-01 - Concld.(Cost/value in Million Rupees)
Note:- Due to assurance of confidentiality provided to the respondents under the Industrial Statistics Act, information for industry group in which number of factories is less than three is not being shown

Major Industrial GroupNo. of
Reporting Factories
Average Daily
Employ-ment
during the year (‘000` Number)
Employ-ment Cost
Value of Fixed
Assets at the end of the year
Indus-trial Cost
Gross Value of Industrial
Production
Gross Value Added
Indirect taxes
The Punjab 2357 376 28563 201105 368991 517761 148770 31721
Bahawalpur 79 4 181 1786 11035 11971 936 122Bahawalnagar 19 2 54 299 2528 2899 371 80R. Y. Khan 40 5 1077 4019 13534 22195 8661 588
D. G. Khan 10 3 365 6664 6693 11045 4351 1724Layyah 4 1 51 124 606 803 197 69Muzaffargarh 15 11 717 5597 10913 14106 3193 593Rajanpur 4 - 3 16 493 510 17 2
Faisalabad 272 46 2949 19725 45732 60990 15258 1494Jhang 45 8 487 3780 8923 11346 2423 946T. T. Singh 27 3 155 1682 3399 4363 964 254
Gujranwala 289 12 676 3370 11367 14117 2750 360Gujrat 30 6 343 694 1925 3052 1128 8Hafizabad 6 3 270 2362 1947 2756 809 104Mandi Baha-ud-Din 3 1 66 1228 1003 1516 513 131Narowal 3 - 6 29 743 787 43 -Sialkot 125 23 1112 2330 8923 12637 3717 -391
Lahore 637 71 7171 23632 56608 81810 25202 3652Kasur 121 49 3002 29626 44017 64625 20608 1042NankanaOkara 22 2 157 2045 3148 4521 1373 384Sheikhupura 234 68 5501 51382 77180 102486 25306 3259
Multan 123 11 957 2897 15026 18817 3791 538Khanewal 38 4 198 2278 9332 10619 1288 256Lodhran 17 - 19 75 1382 1471 89 7Pakpattan 9 1 75 45 1223 1618 394 158Sahiwal 38 7 119 870 4012 8082 4069 3056Vehari 16 1 36 221 1844 2034 190 11
Rawalpindi 52 9 679 3507 6270 9452 3181 1141Attock 14 4 315 1021 2316 3505 1189 280Chakwal 6 4 206 2985 2355 3269 914 567Jhelum 20 4 635 3744 5342 14609 9267 8594
Sargodha 23 4 224 2154 2708 4277 1569 320Bhakkar 2 2 92 951 1109 1351 242 107Khushab 8 5 326 5319 2948 4131 1183 814Mianwali 6 2 339 14648 2407 5991 3584 1451
(Cost/Value in Million Rupees )
Source:- Bureau of Statistics, Punjab, Lahore.
( Included in Sheikhupura District )
254
MANUFACTURING INDUSTRIES
Table 188:- Summary Statistics of Census of Manufacturing Industries by District The Punjab : 2000-01

Total Less than 100 100 or More Total Less than 100 100 or more
The Punjab 6171 5266 905 6521 5593 928
Bahawalpur 206 193 13 237 224 13Bahawalnagar 87 83 4 102 98 4Rahim Yar Khan 163 148 15 189 173 16
D. G. Khan 54 41 13 55 42 13Layyah * 9 6 3 49 46 3Muzaffargarh 105 82 23 106 81 25Rajanpur 29 28 1 27 26 1
Faisalabad 819 713 106 763 659 104Jhang 106 88 18 102 88 14T. T. Singh 74 66 8 76 68 8
Gujranwala 620 596 24 646 622 24Gujrat 257 237 20 262 245 17Hafizabad 8 5 3 14 11 3Mandi Baha-ud-Din 12 8 4 12 8 4Narowal 9 9 0 9 9 -Sialkot 328 292 36 325 291 34
Lahore 1399 1229 170 1454 1279 175Kasur 256 135 121 289 165 124Nankana Okara 38 30 8 43 34 9Sheikhupura 435 279 156 462 295 167
Multan 267 236 31 275 241 34Khanewal 119 106 13 122 109 13Lodhran 47 47 - 68 67 1Pakpattan 46 45 1 54 53 1Sahiwal 139 129 10 138 128 10Vehari 138 128 10 177 167 10
Rawalpindi 199 166 33 200 167 33Attock 44 32 12 53 41 12Chakwal * 14 7 7 40 31 9Jhelum 33 19 14 34 19 15
Sargodha 71 61 10 71 60 11Bhakkar 7 5 2 15 13 2Khushab 18 7 11 28 16 12Mianwali 15 10 5 24 17 7
255MANUFACTURING INDUSTRIES
Table 189:- Number of Registered Factories by District, The Punjab
No. of Factories Employing Persons No. of Factories Employing Persons
· Increase in units of District Layyah and Chakwal is due to the new registration of Bricks Kilns Factories during 2002-03 Source:- Bureau of Statistics, Punjab, Lahore.
District
( Included in Sheikhupura District )
As on 30th June 2001 As on 30th June, 2004

Total Less than 100
100 or more Total Less than
100100 or more
All Industrial Groups 6171 5266 905 6521 5593 928
1 Food Except Beverages 900 791 109 936 826 1102 Beverages 49 28 21 49 29 203 Tobacco 9 2 7 10 3 74 Textiles 1345 932 413 1359 927 4325 Wearing Apparel Except Footwear 118 94 24 121 99 226 Leather & Leather Products 110 92 18 137 118 197 Footwear Except Rubber Footwear 37 30 7 36 29 78 Ginning Pressing & Balling of Fibre 719 704 15 749 734 15
9 Wood & Cork Products Except Furniture 32 26 6 33 27 610 Furniture & Fixtures Except Metal 41 41 - 42 42 -11 Paper & Paper Products 97 77 20 113 89 24
12 Printing, Publishing & Allied Industries 86 79 7 86 79 713 Drugs & Pharmaceutical Products 118 97 21 125 103 2214 Industrial Chemicals 86 71 15 86 72 1415 Other Chemical and Petroleum/Coal
Products 129 117 12 126 114 1216 Rubber & Plastic Products 121 110 11 122 112 1017 Pottery China/Earthenware 71 63 8 86 79 718 Glass & Glass Products 25 14 11 27 16 1119 Other Non-Metallic Mineral Products* 252 234 18 431 411 2020 Iron and Steel Basic Industries 254 245 9 267 258 921 Non-Ferrous Metal Basic Industries 19 18 1 19 18 122 Fabricated Metal Products Except
Machinery 326 315 11 322 311 1123 Machinery Except Electrical 391 369 22 384 362 2224 Electrical Machinery & Apparatus 336 302 34 343 309 3425 Transport Equipment 192 158 34 196 161 3526 Scientific Precision and Measuring
Instrument 118 105 13 117 104 1327 Sports and Athletic Goods 65 51 14 67 53 1428 Others 125 101 24 132 108 24
* Massive increase in units is due to the new registration of Bricks Kilns Factories during 2002-03 .Source :- Bureau of Statistics, Punjab, Lahore.
256
Major Industry Group
MANUFACTURING INDUSTRIES
Table 190:- Number of Registered Factories by Major Industry Group The PunjabNo. of Factories Employing
Persons As on 30th June, 2001No. of Factories Employing
Persons As on 30th June, 2004

Pakistan Punjab % Share of Punjab
Cotton Yarn (a) (Million Kgs.) 2241 936 41.8
Cotton Cloth* (b) (Million Sq.Metres) 1013 421 41.6
Vegetable Ghee (c) (`000’ Tonnes) 1174 564 48.0
Sugar (d) " 3526 2163 61.3
Fertilizers " 5936 3992 67.3
Cement " 22739 8882 39.1
Paper & Paper Board " 542 426 78.6
Soda Ash " 331 331 100.0
Caustic Soda " 242 240 99.2
Sulphuric Acid " 95 41 43.2
Cigarettes (Million Numbers) 65980 29902 45.3
Source:- For Pakistan:- Federal Bureau of Statistics, Statistics Division Govt. of Pakistan, Islamabad "Monthly
Table 191:- Production of Major Manufactured Items, Pakistan and The Punjab
d) Includes Sugar produced from Cane, Sugar Beet and Gur.
Statistical Bulletin October, 2007" With Provincial Bureaus as Primary Source. For Punjab:- i) Bureau of Statistics, Punjab, Lahore.
* Production of Cloth in the Punjab is in linear million metres.a) Excludes the production of man-made yarn/fibre.b) Excludes the production of man-made cloth/fabrics.c) Includes Cooking Oil Produced by Ghee Mills.
"Monthly Survey of Industrial Production and Employment" in the Punjab.
257
Item Unit
2006-07
MANUFACTURING INDUSTRIES

PRODUCTION OF MAJOR MANUFACTURED ITEMS PAKISTAN AND THE PUNJAB : 2006-07
258
‘000’ TonnesPAKISTAN PUNJAB
22412500
3000 22739
16000
20000
COTTON YARN
MILLION Kgs.
VEGETABLE GHEE‘000’
Tonnes
COTTON CLOTHMillion
Sq.Mtrs.
PAPER &PAPER BOARD
‘000’ Tonnes
CEMENT FERTILIZERS SUGAR
936 1013
421
1174
564 542426
0
500
1000
1500
2000
8882
59363992 3526
2163
0
4000
8000
12000
16000

2002-03 2003-04 2004-05 2005-06 2006-07
1085 939 762 2321 1391
1 Food, Beverage & Tabacco - - 25 64 56
2 Sugar 66 299 138 141 -
3 Cement - - - 56 358
259MANUFACTURING INDUSTRIES
Loans Disbursed-Total
( Million Rupees )
Industrial Group
Table 192:- Industry-wise Loans Disbursed by Pakistan Industrial Credit and Investment Corporation Limited in the Punjab
4 Textiles 705 496 423 1348 855
5 Other Textile - - 56 - -
6 Fuel and Energy - - - 20 -
7 Chemicals & Pharmaceutical 268 - 21 71 -
8 Transport Storage and Communication 6 4 - 23 -
9 Non-Industries Local Products - - - 126 -
10 Wood Products - - - 11 -
11 Miscellaneous/Others 40 140 99 461 122
Source: - Pakistan Industrial Credit and Investment Corporation Limited (PICIC) Karachi.

2001-02 2002-03 2003-04 2004-05 2005-06 2006-07
25.73 - - - - -
1 Food Industries 0.73 - - - - -
2 Manufacturing of Cotton Textile 25 - - - - -
3 Manufacturing of Other Textiles - - - - - -
4 Paper & Paper Products - - - - - -
5 Manufacturing of Rubber Products (Except Footwear) - - -
6 Manufacturing of Chemicals & Chemical Products.
- - -
7 Hotels and Motels - - - - - -
8 Cold Storage Including ICC Plants - - - - - -
9 Others - - - - - -Note:- IDBP is under process of restructuring/Privatization, therefore, fresh funding / lending are not
Source: - Industrial Development Bank of Pakistan, Karachi. extended since 2002-03
Bank of Pakistan in the PunjabTable 193:- Industry-wise Loans Disbursed by the Industrial Development
260
MANUFACTURING INDUSTRIES
Loans Disbursed-Total
Industrial Group
( Million Rupees )
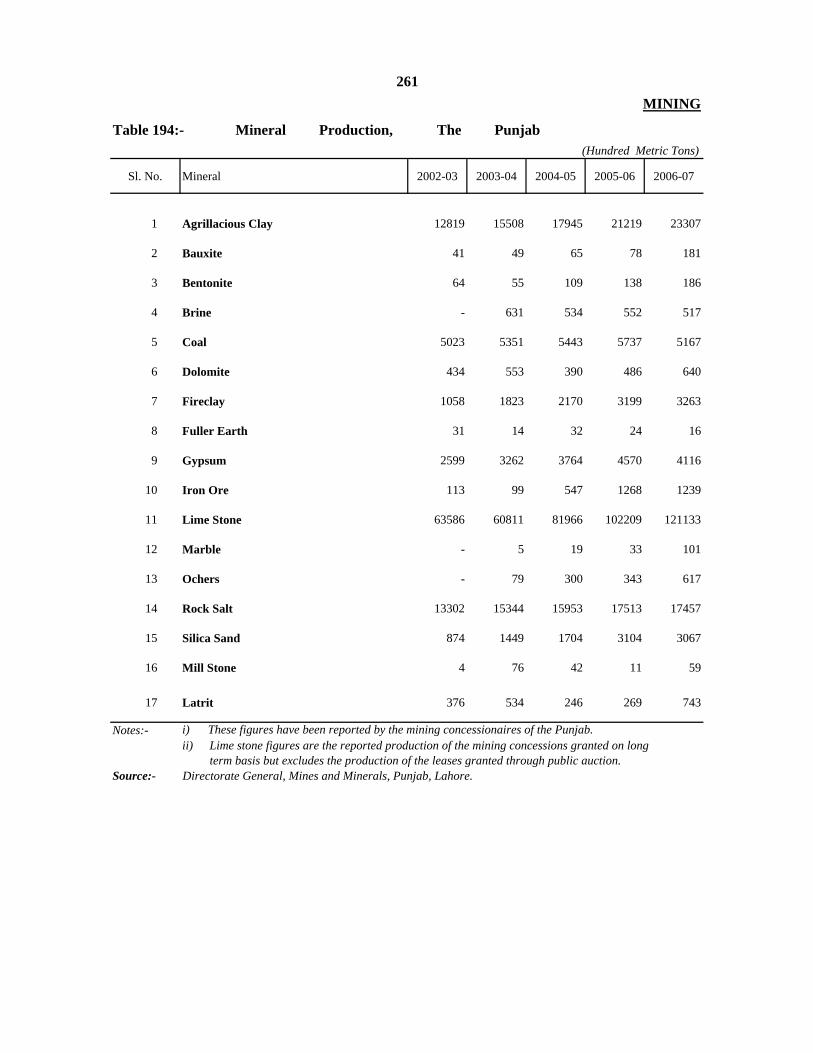
Sl. No. Mineral 2002-03 2003-04 2004-05 2005-06 2006-07
1 Agrillacious Clay 12819 15508 17945 21219 23307
2 Bauxite 41 49 65 78 181
3 Bentonite 64 55 109 138 186
4 Brine - 631 534 552 517
5 Coal 5023 5351 5443 5737 5167
6 Dolomite 434 553 390 486 640
7 Fireclay 1058 1823 2170 3199 3263
8 Fuller Earth 31 14 32 24 16
9 Gypsum 2599 3262 3764 4570 4116
10 Iron Ore 113 99 547 1268 1239
11 Lime Stone 63586 60811 81966 102209 121133
12 Marble - 5 19 33 101
13 Ochers - 79 300 343 617
14 Rock Salt 13302 15344 15953 17513 17457
15 Silica Sand 874 1449 1704 3104 3067
16 Mill Stone 4 76 42 11 59
17 Latrit 376 534 246 269 743
Notes:-
term basis but excludes the production of the leases granted through public auction.Source:- Directorate General, Mines and Minerals, Punjab, Lahore.
i) These figures have been reported by the mining concessionaires of the Punjab.ii) Lime stone figures are the reported production of the mining concessions granted on long
261MINING
Table 194:- Mineral Production, The Punjab(Hundred Metric Tons)

Sr. No Mineral Total Attock Chakwal Jhelum Rawal-pindi D.G. Khan Khushab Mianwali
1 Agrillacious Clay 23307 4546 4205 - - 6115 3486 4955
2 Bauxite 181 - - - - - 174 7
3 Bentonite 186 - 35 119 5 - 27 -
4 Brine 517 - - 517 - - - -
5 Coal 5167 - 2158 130 - - 1994 885
6 Dolomite 640 - 345 - - - 28 267
7 Fireclay 3263 287 6 10 - - 358 2602
8 Fuller Earth 16 - - - - 16 - -
9 Gypsum 4116 - 236 769 - 798 575 1738
10 Iron Ore 1239 - 17 - - 231 - 991
11 Lime Stone 121133 19870 26565 8 5928 29511 21012 18239
12 Marble 101 24 59 5 - - 12 1
13 Ochers 617 - 1 - - - 106 510
14 Rock Salt 17457 - 4918 4533 - - 7230 776
15 Sillica Sand 3067 10 2 1 - 710 241 2103
16 Mill Stone 59 - 59 - - - - -
17 Latrit 743 71 13 - - - 71 588
Source:- Directorate General, Mines and Minerals, Punjab, Lahore.
262MINING
Table 195:- Mineral Production by District, The Punjab: 2006-07(Hundred Metric Tons)

2005-06 2006-07(r) 2007-08(p) 2005-06 2006-07(r) 2007-08(p)
A. 1457222 1698000 2016950 1092098 1132041 1148871i) 464276 564184 696117 370005 400798 388904
ii) 168461 194636 221520 126457 124857 130967
iii) 766448 881657 1031851 561500 577378 599217
iv) 30492 35071 44340 16540 16606 18431
v) 27545 22452 23122 17596 12402 11352
B. 1923698 2196657 2635232 1256827 1357548 1420465i) 219682 251725 306696 128288 132254 138777
ii) 1370793 1566123 1892778 912953 987576 1040863a) Large-Scale 1003062 1148398 1404211 639585 694777 728401b) Small-Scale 245962 279928 331590 206656 223352 240126c) Slaughtering 121769 137797 156977 66712 69447 72336
iii) 179885 213655 277141 108195 127616 146962
iv) 153338 165154 158617 107391 110102 93863
3380920 3894657 4652182 2348925 2489589 2569336C. 3777607 4362737 5253917 2511551 2702861 2923452
i)908409 1029582 1174090 496073 528465 551809
ii) 1262001 1433337 1760491 838426 883487 939752iii) 364320 451573 582620 265056 304855 356811iv) 184812 206166 235838 135820 140587 145521v) 404628 475871 577554 295959 322981 358116
vi) 653437 766208 923324 480217 522486 571443
D. 7158527 8257394 9906099 4860476 5192450 5492788
E. 569077 617104 718667 395440 400977 413717
F. 104399 151283 146572 72545 98300 84377
G. 7623205 8723215 10478194 5183371 5495127 5822128
H. 149901 158481 233986 84343 82878 103961
I. 7308428 8415875 10140085 4944819 5275328 5596749
J. 7773106 8881696 10712180 5267714 5578005 5926089
K. 155.37 158.17 160.97 155.4 158.2 161.0
L. 47039 53208 62994 31826 33352 34769
M. 50030 56153 66548 33904 35266 36815
Commodity Producing Sector (A+B)
263
iii) GDP (FC) / GNP (FC) + Indirect Taxes - Subsidies = GDP (MP) / GNP (MP)
Population ( In Million )
Per Capita Income in Rupees (FC)
Per Capita Income in Rupees (MP)
Source :- Federal Bureau of Statistics, Govt of Pakistan, Islamabad. "Economic Survey of Pakistan 2007-08".
Indirect Taxes
Subsidies
Gross Domestic Product (MP)
Net Factor Income from Abroad
Gross National Product (FC)
Gross National Product (MP)
At Constant Factor Cost of 1999-00
( Million Rupees )
Ownership of DwellingsPublic Admn. and DefenceCommunity, S & P Services
Gross Domestic Product (FC)
Fishing
Forestry
Industrial SectorMining and Quarrying
NATIONAL ACCOUNTS
Major Crops
Minor Crops
Livestock
SectorAt Current Factor Cost
Manufacturing
Table 196 : - Gross National Product, Pakistan
Agriculture
Note :. i) F C = Factor Cost ii)M P = Market Prices
Construction
Electricity and Gas Distribution
Services SectorTransport, Storage and CommunicationWholesale and Retail TradeFinance and Insurance

2004-05 2005-06 (r) 2006-07(p) 2004-05 2005-06 (r) 2006-07(p)
A. 1253947 1317133 1537920 988666 1006585 1057192i) 468088 466023 546800 368638 354308 381250
ii) 145085 159349 180855 120620 121376 122734
iii) 602195 656539 771008 469463 505681 527646
iv) 15452 20214 22364 12540 15530 16241
v) 23127 15008 16893 17405 9690 9321
B. 1448728 1696761 1942200 1069840 1124633 1201766i) 175276 211748 246029 116733 121942 128220
ii) 964500 1186786 1382185 737064 816521 887295a) Large-Scale 661615 848730 994416 499064 558857 609888
b) Small-Scale 203089 220942 250023 178641 193502 209030
c) Slaughtering 99796 117114 137746 59359 64162 68377
iii) 145969 164702 197931 92755 97966 115385
iv) 162983 133525 116055 123288 88204 70866
C. 2932443 3556579 4123921 2164049 2378245 2567746i)
648440 801016 898963 376799 402036 421524ii) 1081833 1302059 1506133 847822 921849 988055
iii) 228262 329428 420001 179226 239671 283483
iv) 110595 125014 140255 80283 82751 85361v)
335696 394324 454492 263580 289795 309262vi) 527617 604738 704077 416339 442143 480061
D. 5635118 6570473 7603841 4222555 4509463 4826704
E. 134461 149901 160738 88750 84343 86110
F. 5769579 6720374 7764579 4311305 4593806 4912814
G. 152.53 155.37 158.17 152.53 155.37 158.17
H. 37826 43254 49090 28265 29567 31060
Services Sector
Fishing
Forestry
Transport, Storage and CommunicationWholesale and Retail Trade
Finance and Insurance
Ownership of Dwellings
264
Manufacturing
Construction
Electricity and Gas Distribution
Per Capita Income (In Rupees)
Source :- Federal Bureau of Statistics, Govt. of Pakistan, Islamabad "Monthly Statistical Bulleten, October, 2007".
Public Administration & DefenceCommunity, S & P Services
Net Domestic Product (FC)
Net Factor Income from Abroad
POPULATION (In million)
Net National Product (FC)
Industrial SectorMining and Quarrying
AgricultureMajor Crops
Minor Crops
Livestock
NATIONAL ACCOUNTS
Table 197 :- Net National Product, Pakistan
SectorAt Current Factor Cost At Constant Factor Cost of
1999-00
( Million Rupees )
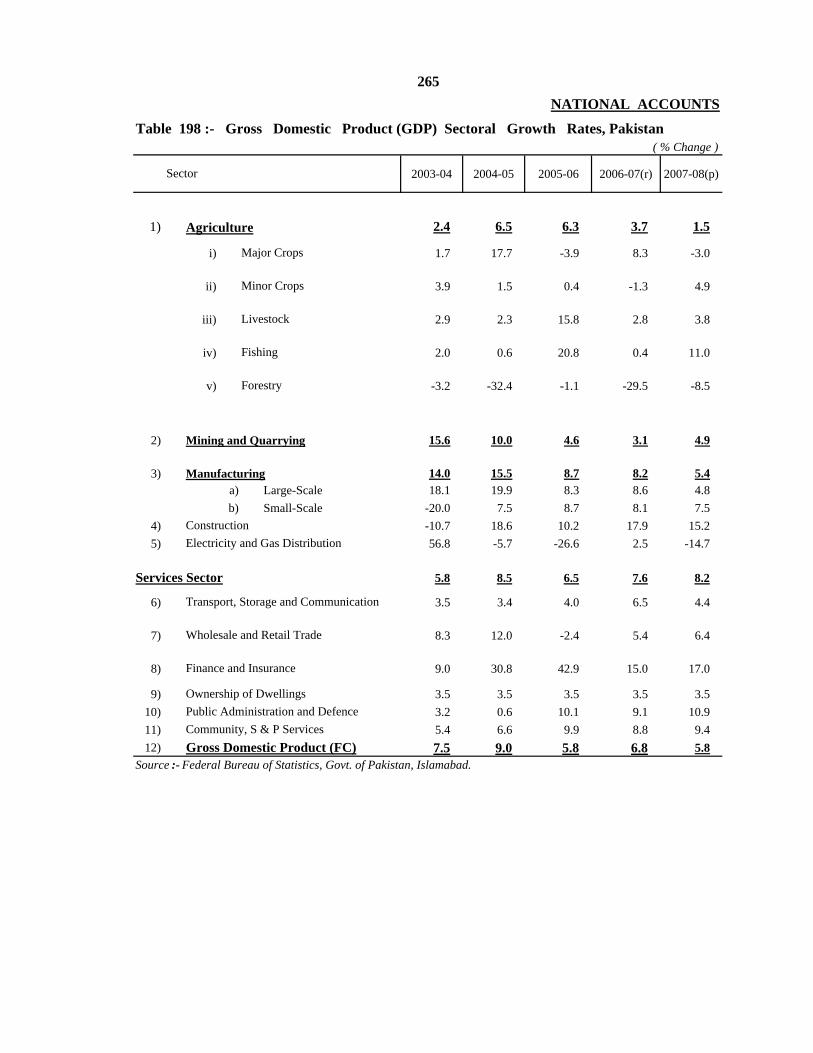
2003-04 2004-05 2005-06 2006-07(r) 2007-08(p)
1) 2.4 6.5 6.3 3.7 1.5
i) 1.7 17.7 -3.9 8.3 -3.0
ii) 3.9 1.5 0.4 -1.3 4.9
iii) 2.9 2.3 15.8 2.8 3.8
iv) 2.0 0.6 20.8 0.4 11.0
v) -3.2 -32.4 -1.1 -29.5 -8.5
2) 15.6 10.0 4.6 3.1 4.9
3) 14.0 15.5 8.7 8.2 5.4a) Large-Scale 18.1 19.9 8.3 8.6 4.8b) Small-Scale -20.0 7.5 8.7 8.1 7.5
4) -10.7 18.6 10.2 17.9 15.25) 56.8 -5.7 -26.6 2.5 -14.7
5.8 8.5 6.5 7.6 8.2
6) 3.5 3.4 4.0 6.5 4.4
7) 8.3 12.0 -2.4 5.4 6.4
8) 9.0 30.8 42.9 15.0 17.0
9) 3.5 3.5 3.5 3.5 3.510) 3.2 0.6 10.1 9.1 10.911) 5.4 6.6 9.9 8.8 9.412) 7.5 9.0 5.8 6.8 5.8
Livestock
Community, S & P Services
Finance and Insurance
Ownership of DwellingsPublic Administration and Defence
Mining and Quarrying
265
Source :- Federal Bureau of Statistics, Govt. of Pakistan, Islamabad.
Sector
( % Change )Table 198 :- Gross Domestic Product (GDP) Sectoral Growth Rates, Pakistan
NATIONAL ACCOUNTS
Gross Domestic Product (FC)
Construction
Agriculture
Manufacturing
Wholesale and Retail Trade
Electricity and Gas Distribution
Services Sector
Transport, Storage and Communication
Fishing
Forestry
Major Crops
Minor Crops

2002-03 2003-04 2004-05 2005-06 2006-07
1 24.0 22.9 22.4 22.5 21.8
i) Crops
a) Major crops 8.2 7.8 8.4 7.6 7.7
b) Minor crops 3.0 2.9 2.7 2.6 2.4
ii) Livestock 11.7 11.2 10.6 11.6 11.1
iii) Fishing 0.3 0.3 0.3 0.3 0.3
iv) Forestry 0.7 0.6 0.4 0.4 0.2
2 23.6 25.5 26.3 25.9 26.1
i) Mining & Quarrying 2.5 2.6 2.7 2.6 2.5
ii) Manufacturing 16.3 17.3 18.3 18.8 19.0a) Large-scale 10.6 11.7 12.9 13.2 13.4b) Small-scale 5.6 4.2 4.1 4.3 4.3c) Slaughtering - 1.4 1.3 1.4 1.3
iii) Construction 2.4 2.0 2.1 2.2 2.5
iv) Electricity & Gas Distt. 2.5 3.7 3.2 2.2 2.1
47.6 48.4 48.7 48.3 47.9
3 52.4 51.6 51.3 51.7 52.1i) Transport, Storage & Comm. 11.4 10.9 10.4 10.2 10.2ii) Wholesale & Retail Trade 18.0 18.2 18.7 17.2 17.0iii) Finance & Insurance 3.3 3.4 4.0 5.5 5.9iv) Ownership of Dewellings 3.1 3.0 2.9 2.8 2.7v) Public Admn. & Defence. 6.6 6.3 5.9 6.1 6.2
vi) Community, S & P Service 9.9 9.7 9.5 9.9 10.1
4 100.0 100.0 100.0 100.0 100.0
Industrial Sector
Commodity Producing Sector (1+2)
Source :- Federal Bureau of Statistics, Govt. of Pakistan, Islamabad.
266NATIONAL ACCOUNTS
(At Constant Factor Cost of 1999-00)
Services Sector
Gross Domestic Product (FC)
(In percent )
Table 199:-SECTORAL SHARES IN GROSS DOMESTIC PRODUCT, PAKISTAN
Agriculture Sector
Sector

Interval (Year)
Growth Rate (%)
1951 9th to 28th February 1951 28th February 1951 - -
1961 12th to 31st January 1961 31st January 1961 10 2.17
1972 16th to 30th September 1972 16th September 1972 11.62 3.41
1981 1st to 15th March 1981 1st March 1981 8.46 2.74
1998 2nd to 18th March 1998 2nd March 1998 17 2.64
Intercensal
Census Year Census DateEnumeration Period
A population census is defined in the UN documents as the total process of collecting,
compiling, evaluating, analysing and disseminating demographic, economic and social data
pertaining, to all persons in a country at a specific time. The last census conducted in British
rule was the one in 1941. Pakistan continued the British tradition of holding censuses, the first
census in Pakistan was conducted in 1951 and the last in 1998. So far five censuses have been
conducted in Pakistan according to the following schedule:
267EXPLANATORY NOTES
ON
POPULATION SECTION
POPULATION CENSUSES AND THEIR TIME SCHEDULE
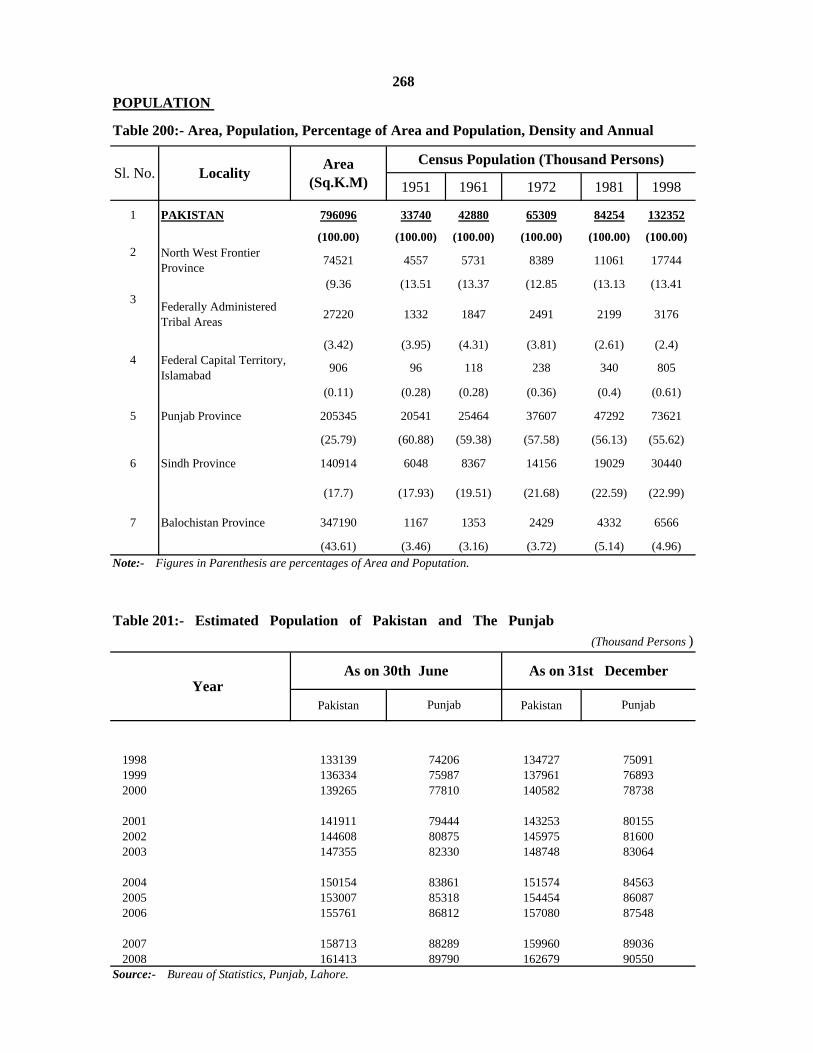
1951 1961 1972 1981 1998
1 PAKISTAN 796096 33740 42880 65309 84254 132352
(100.00) (100.00) (100.00) (100.00) (100.00) (100.00)2 North West Frontier
Province 74521 4557 5731 8389 11061 17744
(9.36 (13.51 (13.37 (12.85 (13.13 (13.413 Federally Administered
Tribal Areas 27220 1332 1847 2491 2199 3176
(3.42) (3.95) (4.31) (3.81) (2.61) (2.4)4 Federal Capital Territory,
Islamabad 906 96 118 238 340 805
(0.11) (0.28) (0.28) (0.36) (0.4) (0.61)
5 Punjab Province 205345 20541 25464 37607 47292 73621
(25.79) (60.88) (59.38) (57.58) (56.13) (55.62)
6 Sindh Province 140914 6048 8367 14156 19029 30440
(17.7) (17.93) (19.51) (21.68) (22.59) (22.99)
7 Balochistan Province 347190 1167 1353 2429 4332 6566
(43.61) (3.46) (3.16) (3.72) (5.14) (4.96)
Pakistan Pakistan
1998 133139 1347271999 136334 1379612000 139265 140582
2001 141911 1432532002 144608 1459752003 147355 148748
2004 150154 1515742005 153007 1544542006 155761 157080
2007 158713 1599602008 161413 162679
(Thousand Persons )Table 201:- Estimated Population of Pakistan and The Punjab
Source:- Bureau of Statistics, Punjab, Lahore.
YearAs on 30th June As on 31st December
Punjab Punjab
8087582330
742067598777810
Note:- Figures in Parenthesis are percentages of Area and Poputation.
8531886812
83861
750917689378738
80155
88289
268
Area (Sq.K.M)
Census Population (Thousand Persons)
POPULATION
Table 200:- Area, Population, Percentage of Area and Population, Density and Annual
Sl. No. Locality
8160079444
89790
83064
845638608787548
8903690550

1961 1972 1981 1998 1961/ 1951 1998/ 1981
54 82 106 166 2.45 2.69 1
77 113 148 238 2.2 2.82 2
68 92 81 117 3.2 2.19 3
130 263 375 889 2.08 5.19 4
124 183 230 358 2.17 2.64 5
59 100 135 216 3 2.8 6
4 7 12 19 1.49 2.48 7
Total Urban Rural Male Female Total Urban Rural Male Female
1998 74206 23211 50995 38397 35809 75091 23503 51588 38855 362361999 75987 23798 52189 39319 36668 76893 24096 52797 39787 371062000 77810 24398 53412 40262 37548 78738 24704 54034 40742 37996
2001 79444 24937 54507 41107 38337 80155 25173 54982 41476 386802002 80875 25410 55465 41847 39027 81598 25649 55949 42221 393372003 82330 25891 56439 42601 39729 83067 26135 56932 42982 40085
2004 83861 26381 57480 43367 40444 84563 26630 57933 43757 408062005 85318 26963 58355 44148 41172 86085 27223 58862 44544 415412006 86812 27470 59342 44952 41861 87548 27719 59829 45278 42270
2007 88289 27972 60317 45756 42533 89036 28228 60808 46048 429882008 89790 28467 61323 46534 43256 90550 28708 61842 46831 43719
(Thousand Persons )Table 202:- Estimated Population by Area and Sex, The Punjab
Source:- Bureau of Statistics, Punjab, Lahore.
269POPULATION
Growth Rate by Province, Pakistan: 1951,1961,1972, 1981 and 1998 Censuses
7.09
Year
2.74
3.56
4.34
Sl. No.Annual Growth Rate (Percentage)Density (Persons Per Sq. K.M.)
1981/ 19721972/ 1961
3.06
3.32
(-) 147
Source: i) For Area: Cartographic Office, Survey of Pakistan, Rawalpindi. ii) For Population: Population Census Organization, Govt.of Pakistan, Islamabad.
As on 30th June As on 31st December
3.41
4.63
3.67
3.33
6.22
2.61
5.16

270
POPULATION OF PAKISTAN BY PROVINCE1951, 1961, 1972, 1981 AND 1998 CENSUSES
.W.F.P. (+) F.A.T.A.
PUNJAB (+) ISLAMABAD
SINDH BALOCHISTA
1951
1961
1972
1981
1998
‘ 000 ’ PERSONS
5889 7578 10
880
1326
0 2092
0
2063
7 2558
237
845
4763
2
7442
6
6048 83
67 1415
619
029
3044
0
1167
1353 24
29
4332 6566
0
20000
40000
60000
80000
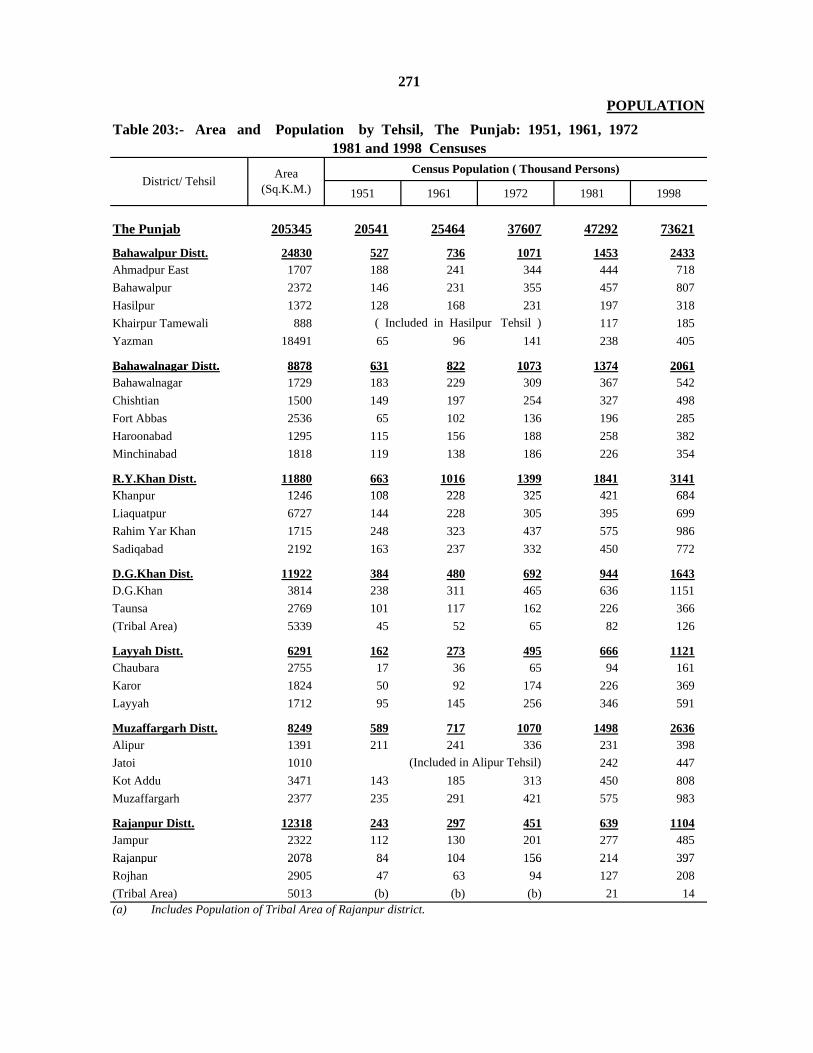
271POPULATION
1951 1961 1972 1981 1998
The Punjab 205345 20541 25464 37607 47292 73621
Table 203:- Area and Population by Tehsil, The Punjab: 1951, 1961, 1972 1981 and 1998 Censuses
District/ Tehsil Area (Sq.K.M.)
Census Population ( Thousand Persons)
Bahawalpur Distt. 24830 527 736 1071 1453 2433Ahmadpur East 1707 188 241 344 444 718Bahawalpur 2372 146 231 355 457 807Hasilpur 1372 128 168 231 197 318Khairpur Tamewali 888 117 185Yazman 18491 65 96 141 238 405
Bahawalnagar Distt. 8878 631 822 1073 1374 2061
( Included in Hasilpur Tehsil )
Bahawalnagar Distt. 8878 631 822 1073 1374 2061Bahawalnagar 1729 183 229 309 367 542Chishtian 1500 149 197 254 327 498Fort Abbas 2536 65 102 136 196 285Haroonabad 1295 115 156 188 258 382Minchinabad 1818 119 138 186 226 354
R.Y.Khan Distt. 11880 663 1016 1399 1841 3141Kh 1246 108 228 325 421 684Khanpur 1246 108 228 325 421 684Liaquatpur 6727 144 228 305 395 699Rahim Yar Khan 1715 248 323 437 575 986Sadiqabad 2192 163 237 332 450 772
D.G.Khan Dist. 11922 384 480 692 944 1643D.G.Khan 3814 238 311 465 636 1151Taunsa 2769 101 117 162 226 366(Tribal Area) 5339 45 52 65 82 126
Layyah Distt. 6291 162 273 495 666 1121Chaubara 2755 17 36 65 94 161Karor 1824 50 92 174 226 369Layyah 1712 95 145 256 346 591
Muzaffargarh Distt. 8249 589 717 1070 1498 2636Alipur 1391 211 241 336 231 398Jatoi 1010 242 447Kot Addu 3471 143 185 313 450 808Muzaffargarh 2377 235 291 421 575 983
Rajanpur Distt. 12318 243 297 451 639 1104Jampur 2322 112 130 201 277 485Rajanpur 2078 84 104 156 214 397
(Included in Alipur Tehsil)
Rajanpur 2078 84 104 156 214 397Rojhan 2905 47 63 94 127 208(Tribal Area) 5013 (b) (b) (b) 21 14(a) Includes Population of Tribal Area of Rajanpur district.

POPULATION272
Table 203: Area and Population by Tehsil The Punjab: 1951 1961 1972
1951 1961 1972 1981 1998
Sub-Total 35124 6708 7974 12107 14309 21317Faisalabad Distt. 5856 1549 1990 3164 3562 5430Chak Jhumra 654 202 254(Included in Faisalabad Sadar Tehsil)
1981 and 1998 Censuses-Contd.
District/ Tehsil Area (Sq.K.M.)
Census Population ( Thousand Persons)
Table 203:- Area and Population by Tehsil, The Punjab: 1951, 1961, 1972
Faisalabad City 168 1182 2140Faisalabad Sadar 1186 666 924Jaranwala 1811 438 483 738 748 1055Sammundri 753 409 484 721 378 516Tandlianwala 1284 386 541
Jhang Distt. 8809 876 1078 1562 1971 2834
Chiniot 2643 330 397 571 694 965
1023 1705}{702
(Included in Sammundri Tehsil )
Chiniot 2643 330 397 571 694 965
Jhang 4153 363 441 631 817 1199Shorkot 2013 183 240 360 460 670
Toba Tek Singh Distt. 3252 604 693 1078 1134 1622
Gojra 916 200 229 339 357 495Kamalia 1336 170 193 326 342 510Toba Tek Singh 1000 234 271 413 435 617g
Gujranwala Distt. 3622 795 1000 1615 2108 3401
Gujranwala 914 578 745 1245 1098 1927
Kamoke 834 273 406
Naushera Virkan 678 295 424
Wazirabad 1196 217 255 370 442 644
Gujrat Distt. 3192 743 835 1177 1408 2048
{(Included in Gujranwala Tehsil)}
Gujrat 1463 397 433 625 745 1093
Kharian 1154 346 402 552 543 780
Sarai Alamgir 575 120 175
Hafizabad Distt. 2367 252 292 444 568 833
Hafizabad 1189 252 292 444 332 485Pindi Bhattian 1178 236 348
(Included in Kharian Tehsil)
(Included in Hafizabad Tehsil)Mandi Baha-ud-Din Distt. 2673 415 491 722 846 1161
Malakwal 759 240 300Mandi Baha-ud-Din 759 325 461Phalia 1155 415 491 722 281 400
Narowal Distt. 2337 513 550 835 909 1265
Narowal 1065 252 266 386 443 627
( Included in Phalia Tehsil )
Shakargarh 1272 261 284 449 466 638
Sialkot Distt. 3016 961 1045 1510 1803 2723
Daska 1026 291 332 490 574 861Pasrur 978 252 257 374 426 612Sialkot 1012 418 456 646 803 1250b) Included in the Population of Tribal Area of D.G.Khan district.

POPULATIONTable 203:- Area and Population by Tehsil, The Punjab: 1951, 1961, 1972
273
1951 1961 1972 1981 1998
Sub-Total 37242 6741 8399 12276 16204 25825Lahore Distt. 1772 1135 1626 2588 3545 6319Lahore Cantt. 917 2032 3778Lahore City 855 1513 25412588}{1135 1626
District/ Tehsil Area (Sq.K.M.)
Census Population ( Thousand Persons)
Table 203: Area and Population by Tehsil, The Punjab: 1951, 1961, 1972 1981 and 1998 Censuses-Contd.
Lahore City 855 1513 2541Kasur Distt. 3995 761 854 1186 1528 2376Chunian 1212 391 419 599 389 585Kasur 1891 370 435 587 736 1157Pattoki 892 403 634
Nankana Distt. 2720 435 508 762 938 1273Safdar Abad 72 84 133 166 228Sangla Hill 54 62 99 124 170
}
N A
(Included in Chunian Tehsil)
{
Sangla Hill 54 62 99 124 170Shahkot 60 70 111 139 191Nankana 249 292 419 509 684Okara Distt. 4377 731 828 1124 1487 2232Depalpur 2502 307 332 500 669 1031Okara 1241 424 496 624 578 862Renala Khurd 634 (Included in 240 339Sheikhupura Distt. 3242 487 572 895 1172 2048Ferozewala 94 111 170 236 428
N.A.
Muridke 92 109 167 231 420Sharaqpur 33 39 60 83 151Sheikhupura 268 313 498 622 1049Multan Distt. 3720 725 984 1506 1970 3117Jalalpur Pir Wala 978 230 358Multan City 304 913 1501Multan Sadar 1632 555 831Shujabad 806 218 263 391 272 427
N.A.
507 721 1115
(Included in Shujabad Tehsil)
j
Khanewal Distt. 4349 636 774 1068 1370 2068Jahanian 549 164 250Kabirwala 1804 251 310 403 456 659Khanewal 784 179 219 321 353 543Mian Channu 1212 206 245 344 397 616
Lodhran Distt. 2778 289 365 559 740 1172Dunyapur 889 221 338K P 778 236 362
(Included in Lodhran Tehsil)
(Included in Khanewal Tehsil )
Karor Pacca 778 236 362Lodhran 1111 283 472
Pakpattan Distt. 2724 380 440 616 844 1287Arifwala 1241 406 604Pakpattan 1483 438 683
Sahiwal Distt. 3201 604 744 944 1281 1843Chichawatni 1591 262 321 412 553 785Sahiwal 1610 342 423 532 728 1058
289
380 440 616
365 559
Sahiwal 1610 342 423 532 728 1058
Vehari Distt. 4364 558 704 1028 1329 2090Burewala 1295 200 265 369 473 730Mailsi 1639 185 226 342 442 705Vehari 1430 173 213 317 414 655

POPULATION274
Table 203 :- Area and Population by Tehsil , The Punjab: 1951, 1961
1951 1961 1972 1981 1998
Sub-Total 48611 3893 4750 6973 8364 12340
Rawalpindi Distt. 5285 873 1086 1745 2121 3364j h
Area (Sq. K.M.)
Census Population ( Thousand Persons)
1972, 1981 and 1998 Censuses -Concld.
District/ Tehsil
Table 203 : Area and Population by Tehsil , The Punjab: 1951, 1961
Gujar Khan 1457 210 232 348 360 494Kahuta 1096 124 146 219 232 313Kotli Sattian 304 83 81Murree 434 99 117 186 157 177Rawalpindi 1682 440 591 992 1066 1928Taxila 312 223 371
Attock Distt. 6857 481 528 741 877 1275
(Included in Kahuta &Murree Tehsils)
(Included in Rawalpindi Tehsil )
Attock 1350 233 244 345 323 501Fateh Jang 1249 84 94 129 149 214Hassanabdal 350 93 136Jand 2043 65 75 105 165 228Pindi Gheb 1865 99 115 162 147 196
Chakwal Distt. 6524 460 508 700 776 1084Chakwal 3120 311 335 460 428 598
(Included in Attock Tehsil )
( l d d i Ch k l h il)Choa Saidan Shah 472 80 106Talagang 2932 149 173 240 268 380
Jhelum Distt. 3587 368 415 592 659 937Jhelum 1062 191 211 311 353 517Pind Dadan Khan 1267 102 124 168 188 264Sohawa 1258 75 80 113 118 156
Sargodha Distt. 5854 890 1104 1553 1912 2666
(Included in Chakwal Tehsil)
Sargodha Distt. 5854 890 1104 1553 1912 2666Bhalwal 2115 311 376 522 633 820Sahiwal 829 173 237Sargodha 1536 404 511 719 723 1081Shahpur 767 175 217 312 206 274Sillanwali 607 177 254
Bhakkar Distt. 8153 234 332 500 666 1051Bhakkar 2427 138 188 287 265 425
(Included in Shahpur Tehsil)
(Included in Sargodha Tehsil )
Bhakkar 2427 138 188 287 265 425Darya Khan 1719 147 233Kalur Kot 2239 65 96 138 147 223Mankera 1768 31 48 75 107 170
Khushab Distt. 6511 271 363 547 641 906Khushab 4011 215 295 448 516 731Nurpur 2500 56 68 99 125 175
Mi li Di tt 5840 316 414 595 712 1057
(Included in Bhakkar Tehsil)
Mianwali Distt. 5840 316 414 595 712 1057Isa Khel 1863 76 96 154 160 257Mianwali 2689 240 318 441 374 532Piplan 1288 178 268Source :- i) For Area:
ii) For Population: Population Census Organization, Statistics Division, Government of Pakistan, Islamabad..
(Included in Mianwali Tehsil)
Cartographic office, Survey of Pakistan, Rawalpindi.

2002 2003 2004 2005 2006 2007 2008
The Punjab 80875 82330 83861 85318 86812 88289 89790
Bahawalpur 2714 2771 2829 2888 2947 3005 3064Bahawalnagar 2246 2283 2320 2358 2395 2432 2470R.Y.Khan 3518 3594 3673 3752 3832 3910 3990
D.G.Khan 1848 1890 1932 1976 2019 2062 2106Layyah 1252 1278 1305 1333 1360 1387 1415Muzaffargarh 2972 3039 3109 3180 3251 3322 3393Rajanpur 1239 1267 1295 1324 1353 1381 1410
Faisalabad 5937 6038 6141 6245 6349 6451 6555Jhang 3061 3106 3151 3197 3243 3288 3333T.T.Singh 1749 1774 1800 1826 1852 1877 1902
Gujranwala 3763 3836 3910 3986 4061 4135 4210
275
Estimated As on 30 th June
POPULATIONTable 204 :- Estimated Population by District, The Punjab
(Thousand Persons)
District
Gujranwala 3763 3836 3910 3986 4061 4135 4210Gujrat 2217 2251 2285 2319 2353 2387 2421Hafizabad 903 917 931 946 960 974 988Mandi Baha-ud-Din 1241 1257 1273 1289 1305 1320 1336Narowal 1357 1375 1393 1412 1430 1448 1466Sialkot 2973 3023 3074 3125 3176 3226 3277
Lahore 7144 7313 7485 7661 7836 8010 8188Kasur 2609 2655 2703 2751 2799 2846 2894Nankana 1357 1374 1391 1408 1424 1441 1457Okara 2434 2474 2515 2556 2597 2637 2678Sheikhupura 2255 2296 2338 2381 2423 2465 2508
Multan 3434 3498 3563 3629 3694 3759 3825Khanewal 2257 2295 2333 2372 2410 2448 2486Lodhran 1292 1316 1340 1365 1390 1415 1439Pakpattan 1407 1431 1455 1480 1505 1529 1553Sahiwal 1990 2020 2049 2079 2109 2138 2167Vehari 2301 2343 2386 2430 2473 2516 2559
Rawalpindi 3710 3779 3850 3922 3994 4064 4137Attock 1380 1401 1473 1444 1465 1486 1508Chakwal 1164 1179 1195 1211 1227 1243 1259Jhelum 1010 1024 1038 1053 1068 1082 1097
Sargodha 2860 2898 2937 2976 3014 3052 3091Bhakkar 1158 1179 1201 1223 1245 1267 1289Khushab 974 988 1002 1016 1029 1043 1057
Mianwali 1149 1168 1186 1205 1224 1243 1262

2002 2003 2004 2005 2006 2007 2008
The Punjab 81600 83064 84563 86087 87548 89036 90550Bahawalpur 2743 2800 2859 2919 2976 3035 3094Bahawalnagar 2264 2301 2339 2377 2414 2451 2489R.Y.Khan 3556 3633 3712 3793 3871 3950 4031
D.G.Khan 1869 1911 1954 1998 2040 2084 2128Layyah 1265 1291 1319 1347 1373 1401 1429Muzaffargarh 3005 3074 3145 3217 3286 3357 3430Rajanpur 1253 1281 1309 1339 1367 1395 1425
Faisalabad 5987 6089 6193 6298 6400 6503 6607Jhang 3083 3128 3174 3221 3265 3310 3356T.T.Singh 1762 1787 1813 1839 1864 1890 1915
Gujranwala 3799 3873 3948 4024 4098 4172 4248Gujrat 2234 2268 2302 2337 2370 2404 2438
DistrictAs on 31 st December
Table 204 :- Estimated Population by District, The Punjab - Concld.(Thousand Persons)
276POPULATION
Gujrat 2234 2268 2302 2337 2370 2404 2438Hafizabad 910 924 939 953 967 981 995Mandi Baha-ud-Din 1249 1265 1281 1297 1313 1328 1344Narowal 1366 1384 1402 1421 1439 1457 1475Sialkot 2998 3048 3099 3151 3200 3251 3303
Lahore 7228 7398 7573 7751 7923 8099 8279Kasur 2632 2679 2727 2775 2822 2869 2918Nankana 1366 1382 1399 1416 1433 1449 1466Okara 2454 2494 2535 2577 2617 2657 2699Sheikhupura 2275 2317 2359 2403 2444 2487 2530
Multan 3466 3530 3596 3662 3727 3792 3858Khanewal 2276 2314 2352 2391 2429 2467 2506Lodhran 1304 1328 1353 1378 1402 1427 1452Pakpattan 1419 1443 1468 1493 1517 1541 1566Sahiwal 2005 2034 2064 2094 2123 2153 2182Vehari 2322 2364 2408 2452 2494 2538 2581
Rawalpindi 3744 3815 3886 3959 4029 4100 4173Attock 1391 1412 1433 1455 1476 1497 1518Chakwal 1171 1187 1203 1220 1236 1250 1267Jhelum 1017 1031 1046 1061 1075 1089 1104
Sargodha 2879 2917 2956 2996 3033 3072 3110Bhakkar 1169 1190 1212 1235 1256 1278 1300Khushab 981 995 1009 1023 1036 1050 1063Mianwali 1158 1177 1196 1215 1233 1252 1271S f S b h
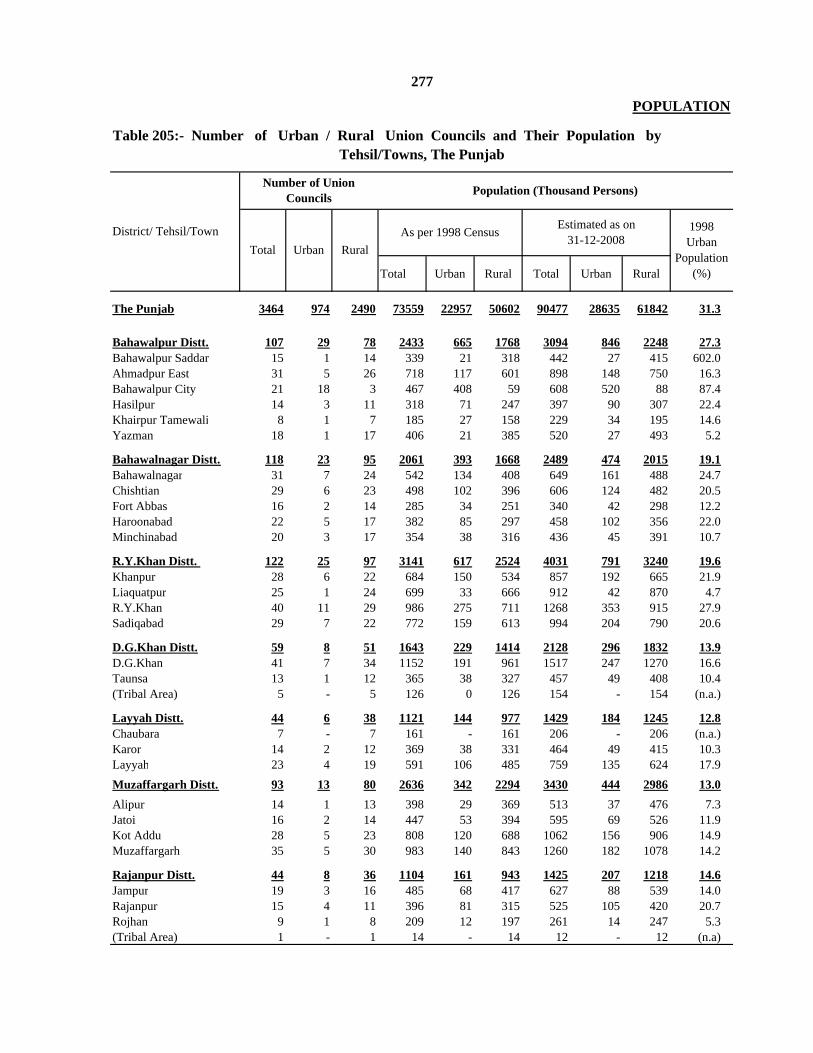
Total Urban Rural Total Urban Rural
The Punjab 3464 974 2490 73559 22957 50602 90477 28635 61842 31.3
Bahawalpur Distt. 107 29 78 2433 665 1768 3094 846 2248 27.3Bahawalpur Saddar 15 1 14 339 21 318 442 27 415 602.0Ahmadpur East 31 5 26 718 117 601 898 148 750 16.3Bahawalpur City 21 18 3 467 408 59 608 520 88 87.4Hasilpur 14 3 11 318 71 247 397 90 307 22.4Khairpur Tamewali 8 1 7 185 27 158 229 34 195 14.6Yazman 18 1 17 406 21 385 520 27 493 5.2
Bahawalnagar Distt. 118 23 95 2061 393 1668 2489 474 2015 19.1Bahawalnagar 31 7 24 542 134 408 649 161 488 24.7Chishtian 29 6 23 498 102 396 606 124 482 20.5Fort Abbas 16 2 14 285 34 251 340 42 298 12.2Haroonabad 22 5 17 382 85 297 458 102 356 22.0Minchinabad 20 3 17 354 38 316 436 45 391 10.7
R.Y.Khan Distt. 122 25 97 3141 617 2524 4031 791 3240 19.6Khanpur 28 6 22 684 150 534 857 192 665 21.9Liaquatpur 25 1 24 699 33 666 912 42 870 4.7R.Y.Khan 40 11 29 986 275 711 1268 353 915 27.9Sadiqabad 29 7 22 772 159 613 994 204 790 20.6
D.G.Khan Distt. 59 8 51 1643 229 1414 2128 296 1832 13.9D.G.Khan 41 7 34 1152 191 961 1517 247 1270 16.6Taunsa 13 1 12 365 38 327 457 49 408 10.4(Tribal Area) 5 - 5 126 0 126 154 - 154 (n.a.)
Layyah Distt. 44 6 38 1121 144 977 1429 184 1245 12.8Chaubara 7 - 7 161 - 161 206 - 206 (n.a.)Karor 14 2 12 369 38 331 464 49 415 10.3Layyah 23 4 19 591 106 485 759 135 624 17.9Muzaffargarh Distt. 93 13 80 2636 342 2294 3430 444 2986 13.0Alipur 14 1 13 398 29 369 513 37 476 7.3Jatoi 16 2 14 447 53 394 595 69 526 11.9Kot Addu 28 5 23 808 120 688 1062 156 906 14.9Muzaffargarh 35 5 30 983 140 843 1260 182 1078 14.2
Rajanpur Distt. 44 8 36 1104 161 943 1425 207 1218 14.6Jampur 19 3 16 485 68 417 627 88 539 14.0Rajanpur 15 4 11 396 81 315 525 105 420 20.7Rojhan 9 1 8 209 12 197 261 14 247 5.3(Tribal Area) 1 - 1 14 - 14 12 - 12 (n.a)
As per 1998 Census Estimated as on 31-12-2008
RuralUrban
1998 Urban
Population (%)
District/ Tehsil/Town
Population (Thousand Persons)Number of Union Councils
Total
277
Table 205:- Number of Urban / Rural Union Councils and Their Population by
POPULATION
Tehsil/Towns, The Punjab

Total Urban Rural Total Urban Rural
Sub-Total 985 321 664 18594 6134 12460 22378 7445 14933FaisalabadCity Distt. 289 123 166 5430 2319 3111 6607 2821 3786 42.7Iqbal Town 43 28 15 764 499 265 1012 611 401 65 3Jinnah Town 39 28 11 767 542 225 984 664 320 70.6
Lyallpur Town 38 21 17 758 427 331 925 498 427 56.3
Madina Town 41 31 10 774 563 211 1013 704 309 72.7Chak Jhumra Town 15 2 13 255 33 222 274 38 236 12.6Jaranwala Town 57 7 50 1055 137 918 1204 165 1039 13
SammundriTown 28 3 25 516 55 461 580 66 514 10.7Tandlianwala Town 28 3 25 541 63 478 615 75 540 11.6Jhang Distt. 128 29 99 2834 663 2171 3356 785 2571 23.4Ahmadpur Sial 13 2 11 296 46 250 353 55 298 15.5
Chiniot 44 12 32 965 259 706 1125 306 819 26.8
Jhang 55 14 41 1199 305 894 1432 361 1071 25.4Shorkot 16 1 15 374 53 321 446 63 383 14.2T.T.Singh Distt. 82 16 66 1622 306 1316 1915 361 1554 18.9Gojra 24 6 18 495 118 377 576 139 437 23.8Kamalia 26 7 19 510 128 382 613 151 462 25.1Toba Tek Singh 32 3 29 617 60 557 726 71 655 9.7Gujranwala City Distt. 188 92 96 3401 1721 1680 4248 2147 2101 50.5Aroop Town 26 17 9 469 297 172 615 400 215 63.3Khiali Shahpur Town 26 14 12 477 263 214 627 347 280 55.1Nandipur Town 23 15 8 403 266 137 530 344 186 65.8Qila Dedar Singh Town 28 23 5 486 403 83 581 477 104 82.9Kamoke Town 24 8 16 414 152 262 502 176 326 37.4
Naushera Virkan Town 25 2 23 415 34 381 496 43 453 8.2Wazirabad Town 36 13 23 644 213 431 775 238 537 33.1Cantonment - - - 93 93 - 122 122 - 100
Gujrat Distt. 117 30 87 2048 568 1480 2438 676 1762 27.7Gujrat 65 21 44 1093 363 730 1306 432 874 33.2Kharian 43 7 36 780 168 612 923 200 723 21.5Sarai Alamgir 9 2 7 175 37 138 209 44 165 21.1
Hafizabad Distt. 42 11 31 833 227 606 995 271 724 27.4Hafizabad 25 8 17 485 148 337 578 176 402 30.5Pindi Bhattian 17 3 14 348 79 269 417 95 322 23
M.B-Din Distt. 65 10 55 1161 176 985 1344 204 1140 15.2Malakwal 17 2 15 299 31 268 331 36 295 10.4Mandi Baha-ud-Din 27 6 21 462 113 349 542 131 411 24.5Phalia 21 2 19 400 32 368 471 37 434 8Narowal Distt. 74 10 64 1265 154 1111 1475 180 1295 12.2Narowal 39 7 32 627 103 524 737 121 616 16.4Shakargarh 35 3 32 638 51 587 738 59 679 8
Table 205:- Number of Urban / Rural Union Councils and Their Population by
Tehsil/Towns The Punjab -Contd
As per 1998 CensusDistrict/Tehsil/Town
POPULATION
Total Urban Rural
Number of Union Population (Thousand Persons)
Estimated as on 31-12-2008 1998 Urban
Propotion
278

Total Urban Rural Total Urban Rural
Sub-Total 1124 363 761 26396 10121 16275 32686 12799 19887Sialkot Distt. 124 32 92 2723 713 2010 3303 865 2438 26.2Daska 29 6 23 563 123 440 687 149 538 21.8Pasrur 28 4 24 612 78 534 725 94 631 12.7Sambrial 17 5 12 298 73 225 364 88 276 24.5Sialkot 50 17 33 1250 439 811 1527 534 993 35.1Lahore City Distt. 150 122 28 6319 5209 1110 8279 6825 1454 82.4Aziz Bhatti Town 11 7 4 414 264 150 540 344 196 63.8Data Ganj Buksh Town 18 18 - 712 712 - 928 928 - 100Gulberg Town 15 15 - 571 571 - 745 745 - 100Iqbal Town 15 6 9 567 218 349 740 283 457 38.4Nishtar Town 19 11 8 734 403 331 957 524 433 54.9Ravi Town 30 30 - 1163 1163 - 1617 1617 - 100Samanabad Town 19 19 - 722 722 - 942 942 - 100Shalimar Town 11 11 - 389 389 - 508 508 - 100Wagha Town 12 5 7 481 201 280 528 160 368 41.8Cantonment - - - 566 566 - 774 774 - 100Kasur Distt. 113 26 87 2376 542 1834 2918 666 2252 22.8Chunian 27 3 24 585 61 524 707 75 632 10.4Kasur 55 17 38 1157 366 791 1428 450 978 31.6Pattoki 31 6 25 634 115 519 783 141 642 18.1Nankana Distt. 68 11 57 1273 206 1067 1466 236 1230 14.6Safdar Abad 11 2 9 228 47 181 264 54 210 20.6Sangla Hill 10 3 7 170 51 119 196 58 138 29.4Shahkot 10 2 8 191 39 152 222 45 177 20.4Nankana 37 4 33 684 69 615 784 79 705 10.1Okara Distt. 114 26 88 2232 514 1718 2699 622 2077 23.0Depalpur 55 12 43 1030 210 820 1261 254 1007 20.4Okara 41 12 29 862 272 590 1038 329 709 31.6Renala Khurd 18 2 16 340 32 308 400 39 361 9.4Sheikhupura Distt. 101 34 67 2048 665 1383 2530 822 1708 32.4Ferozwala 21 6 15 428 119 309 538 147 391 27.8Muridke 21 8 13 420 143 277 529 177 352 34.0Sharaqpur 8 1 7 151 28 123 190 35 155 18.5Sheikhupura 51 19 32 1049 375 674 1273 463 810 35.7Multan Distt. 129 61 68 3055 1253 1802 3785 1530 2255 42.2Jalalpur Pirwala Town 15 2 13 358 32 326 435 33 402 8.9Bosan Town 24 14 10 571 285 286 654 303 351 49.8Shah Rukn-e-Alam 25 16 9 598 309 289 765 395 370 51.7Mumtazabad Town 24 15 9 560 297 263 717 383 334 53.0Sher Shah Town 24 12 12 541 273 268 693 352 341 50.0Shujabad Town 17 2 15 427 57 370 521 64 457 13.3Khanewal Distt. 100 17 83 2068 364 1704 2506 442 2064 17.5Jahanian 12 1 11 250 25 225 304 30 274 10.0Kabirwala 34 5 29 659 98 561 783 120 663 15.0Khanewal 28 7 21 543 152 391 662 184 478 28.0Mian Channu 26 4 22 616 89 527 757 108 649 14.4Lodhran Distt. 73 11 62 1172 170 1002 1452 211 1241 14.4Dunyapur 22 2 20 338 30 308 412 37 375 8.6Karor Pacca 23 5 18 362 75 287 441 93 348 20.7Lodhran 28 4 24 472 65 407 599 81 518 13.8Pakpattan Distt. 63 9 54 1287 183 1104 1566 223 1343 14.2Arifwala 30 4 26 603 74 529 725 90 635 12.3Pakpattan 33 5 28 684 109 575 841 133 708 15.9Sahiwal Distt. 89 14 75 1843 302 1541 2182 357 1825 16.4Chichawatni 37 3 34 785 73 712 924 86 838 9.3Sahiwal 52 11 41 1058 229 829 1258 271 987 21.6
Estimated as on 31-12-20081998 Urban
Propotion (%)
279 POPULATION
Table 205:- Number of Urban / Rural Union Councils and Their Population by Tehsil/Towns The Punjab -Contd
District/Tehsil/TownTotal Urban Rural
As per 1998 Census
Number of Union Councils
Population (Thousand Persons)

Total Urban Rural Total Urban Rural
Sub-Total 768 178 590 14430 4151 10279 17387 5149 12238Vehari Distt. 89 15 74 2090 335 1755 2581 414 2167 16.0Burewala 32 6 26 730 152 578 894 188 706 20.8Mailsi 31 5 26 705 89 616 876 110 766 12.6Vehari 26 4 22 655 94 561 811 116 695 14.4Rawalpindi City Distt. 175 56 119 3364 1788 1576 4173 2335 1838 53.2Gujar Khan Town 33 4 29 494 67 427 584 78 506 13.6Kahuta Town 14 2 12 154 19 135 181 22 159 12.3Kotli Sattian Town 10 - 10 82 - 82 88 - 88 -Murree Town 15 1 14 176 21 155 191 25 166 11.9Rawal Town 46 46 - 782 782 - 1055 1055 - 100.0Potohar Town 36 - 36 518 - 518 559 - 559 -Kallar Syedan Town 11 - 11 159 - 159 187 - 187 -Taxila Town 10 3 7 371 271 100 481 308 173 73.0Rawalpindi Cantt. - - - 628 628 - 847 847 - 100.0Attock Distt. 72 13 59 1275 271 1004 1518 322 1196 21.3Attock 11 3 8 262 118 144 321 141 180 45.0Fateh Jang 14 2 12 214 26 188 255 31 224 12.1Hassanabdal 8 2 6 136 38 98 162 45 117 27.9Hazro 14 3 11 239 42 197 293 50 243 17.6Jand 12 1 11 228 17 211 265 20 245 7.5Pindi Gheb 13 2 11 196 30 166 222 35 187 15.3Chakwal Distt. 68 8 60 1084 132 952 1267 154 1113 12.2Chakwal 30 5 25 490 80 410 573 94 479 13.4Choa Saidan Shah 7 1 6 106 14 92 120 16 104 13.2Kalar Kahar 8 - 8 108 - 108 126 - 126 -Talagang 23 2 21 380 38 342 448 44 404 10.0Jhelum Distt. 54 12 42 937 259 678 1104 306 798 27.6Dina 11 2 9 165 39 126 198 46 152 -Jhelum 17 6 11 352 161 191 420 190 230 38.7Pind Dadan Khan 16 3 13 264 47 217 308 55 253 17.8Sohawa 10 1 9 156 12 144 178 15 163 7.7Sargodha Distt. 161 40 121 2666 749 1917 3110 876 2234 28.1Bhalwal 31 8 23 476 122 354 536 142 394 20.4Kot Moman 22 3 19 344 45 299 386 52 334 -Sahiwal 14 3 11 236 50 186 273 59 214 21.2Sargodha 62 22 40 1081 458 623 1302 536 766 42.4Shahpur 16 3 13 274 51 223 313 60 253 18.6Sillanwali 16 1 15 255 23 232 300 27 273 9.0Bhakkar Distt. 42 9 33 1051 168 883 1300 209 1091 16.0Bhakkar 17 3 14 424 69 355 529 85 444 16.2Darya Khan 8 3 5 233 54 179 289 68 221 23.2Kalur Kot 10 2 8 224 36 188 271 44 227 16.1Mankera 7 1 6 170 9 161 211 12 199 5.3Khushab Distt. 51 13 38 906 229 677 1063 269 794 25.3Khushab 41 12 29 731 214 517 859 251 608 29.3Nurpur 10 1 9 175 15 160 204 18 186 8.6Mianwali Distt. 56 12 44 1057 220 837 1271 264 1007 20.8Isa Khel 14 3 11 257 44 213 321 53 268 17.1Mianwali 28 5 23 532 103 429 626 123 503 19.4Piplan 14 4 10 268 73 195 324 88 236 27.2
ii) For 1998 Census: Population Census Organization, Statistics Division, Govt. of Pakistan, Islamabad., iii) For Estimated Population : Bureau of Statistics, Punjab, Lahore.
280POPULATIONTable 205:- Number of Urban / Rural Union Councils and Their Population by
Tehsil/Towns, The Punjab - Concld.
Source :- i) For Union Councils: Assistant Directors Local Govt. and Rural Development (ADLGs) in Punjab .
District/ Tehsil/Town
Number of Union Population (Thousand Persons)
Total Urban RuralAs per 1998 Census Estimated as on
31-12-20081998 Urban
Population (%)
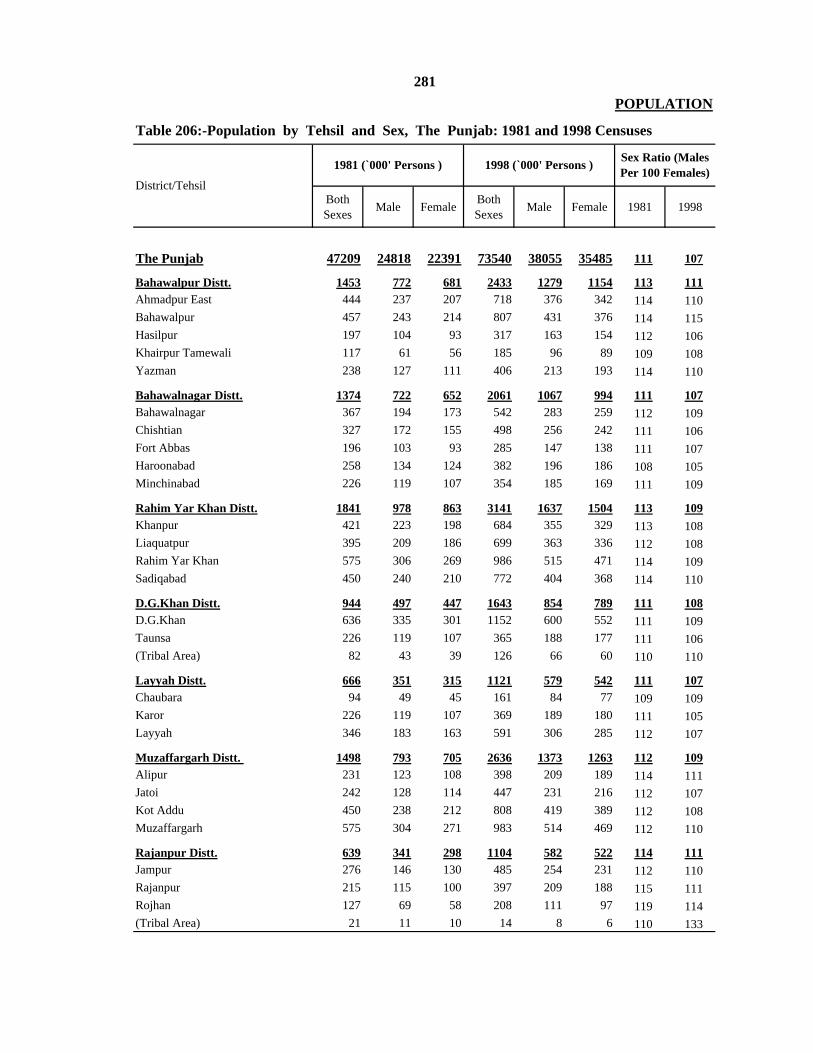
Both Sexes Male Female Both
Sexes Male Female 1981 1998
The Punjab 47209 24818 22391 73540 38055 35485 111 107
Bahawalpur Distt. 1453 772 681 2433 1279 1154 113 111Ahmadpur East 444 237 207 718 376 342 114 110Bahawalpur 457 243 214 807 431 376 114 115Hasilpur 197 104 93 317 163 154 112 106Khairpur Tamewali 117 61 56 185 96 89 109 108Yazman 238 127 111 406 213 193 114 110
Bahawalnagar Distt. 1374 722 652 2061 1067 994 111 107Bahawalnagar 367 194 173 542 283 259 112 109Chishtian 327 172 155 498 256 242 111 106Fort Abbas 196 103 93 285 147 138 111 107Haroonabad 258 134 124 382 196 186 108 105Minchinabad 226 119 107 354 185 169 111 109
Rahim Yar Khan Distt. 1841 978 863 3141 1637 1504 113 109Khanpur 421 223 198 684 355 329 113 108Liaquatpur 395 209 186 699 363 336 112 108Rahim Yar Khan 575 306 269 986 515 471 114 109Sadiqabad 450 240 210 772 404 368 114 110
D.G.Khan Distt. 944 497 447 1643 854 789 111 108D.G.Khan 636 335 301 1152 600 552 111 109Taunsa 226 119 107 365 188 177 111 106(Tribal Area) 82 43 39 126 66 60 110 110
Layyah Distt. 666 351 315 1121 579 542 111 107Chaubara 94 49 45 161 84 77 109 109Karor 226 119 107 369 189 180 111 105Layyah 346 183 163 591 306 285 112 107
Muzaffargarh Distt. 1498 793 705 2636 1373 1263 112 109Alipur 231 123 108 398 209 189 114 111Jatoi 242 128 114 447 231 216 112 107Kot Addu 450 238 212 808 419 389 112 108Muzaffargarh 575 304 271 983 514 469 112 110
Rajanpur Distt. 639 341 298 1104 582 522 114 111Jampur 276 146 130 485 254 231 112 110Rajanpur 215 115 100 397 209 188 115 111Rojhan 127 69 58 208 111 97 119 114(Tribal Area) 21 11 10 14 8 6 110 133
POPULATION
Table 206:-Population by Tehsil and Sex, The Punjab: 1981 and 1998 Censuses
1981 (`000' Persons ) 1998 (`000' Persons ) Sex Ratio (Males Per 100 Females)
District/Tehsil
281
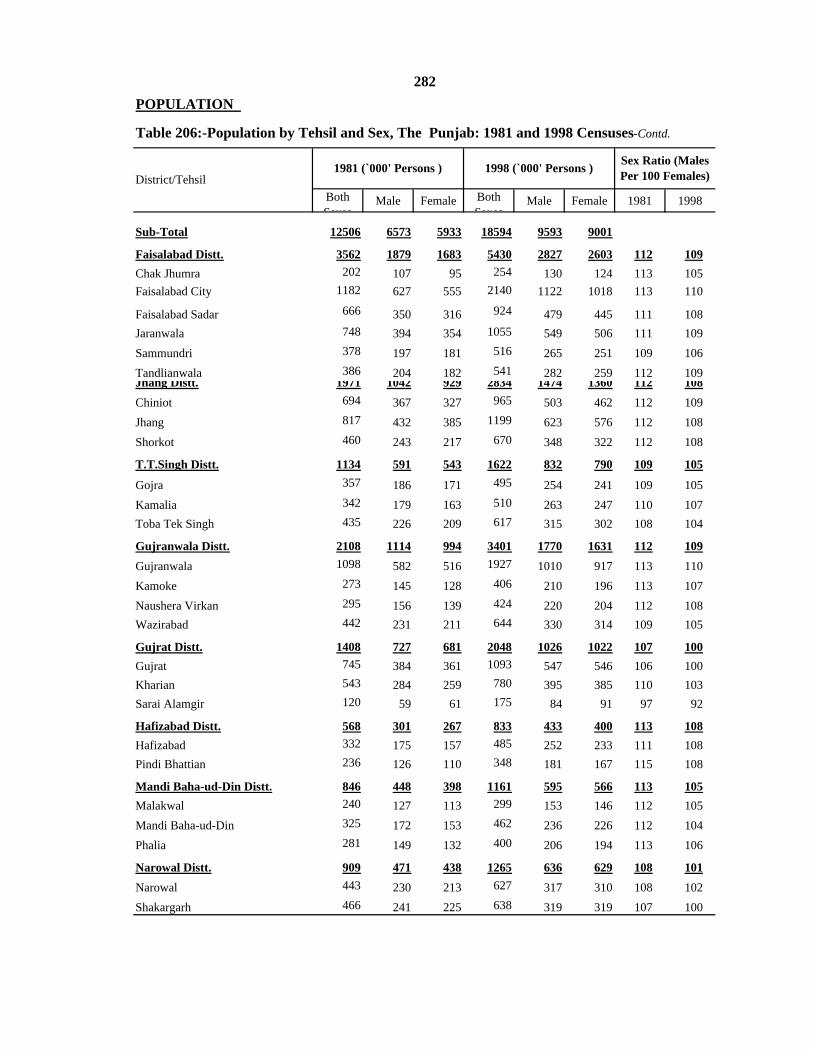
Both Sexes
Male Female Both Sexes
Male Female 1981 1998
Sub-Total 12506 6573 5933 18594 9593 9001
Faisalabad Distt. 3562 1879 1683 5430 2827 2603 112 109Chak Jhumra 202 107 95 254 130 124 113 105Faisalabad City 1182 627 555 2140 1122 1018 113 110
Faisalabad Sadar 666 350 316 924 479 445 111 108Jaranwala 748 394 354 1055 549 506 111 109Sammundri 378 197 181 516 265 251 109 106Tandlianwala 386 204 182 541 282 259 112 109Jhang Distt. 1971 1042 929 2834 1474 1360 112 108Chiniot 694 367 327 965 503 462 112 109Jhang 817 432 385 1199 623 576 112 108Shorkot 460 243 217 670 348 322 112 108
T.T.Singh Distt. 1134 591 543 1622 832 790 109 105
Gojra 357 186 171 495 254 241 109 105Kamalia 342 179 163 510 263 247 110 107Toba Tek Singh 435 226 209 617 315 302 108 104
Gujranwala Distt. 2108 1114 994 3401 1770 1631 112 109Gujranwala 1098 582 516 1927 1010 917 113 110Kamoke 273 145 128 406 210 196 113 107Naushera Virkan 295 156 139 424 220 204 112 108Wazirabad 442 231 211 644 330 314 109 105
Gujrat Distt. 1408 727 681 2048 1026 1022 107 100Gujrat 745 384 361 1093 547 546 106 100Kharian 543 284 259 780 395 385 110 103Sarai Alamgir 120 59 61 175 84 91 97 92
Hafizabad Distt. 568 301 267 833 433 400 113 108Hafizabad 332 175 157 485 252 233 111 108Pindi Bhattian 236 126 110 348 181 167 115 108
Mandi Baha-ud-Din Distt. 846 448 398 1161 595 566 113 105Malakwal 240 127 113 299 153 146 112 105Mandi Baha-ud-Din 325 172 153 462 236 226 112 104Phalia 281 149 132 400 206 194 113 106
Narowal Distt. 909 471 438 1265 636 629 108 101Narowal 443 230 213 627 317 310 108 102Shakargarh 466 241 225 638 319 319 107 100
POPULATION
Table 206:-Population by Tehsil and Sex, The Punjab: 1981 and 1998 Censuses-Contd.
District/Tehsil1981 (`000' Persons ) 1998 (`000' Persons ) Sex Ratio (Males
Per 100 Females)
282

Both Sexes
Male Female Both Sexes
Male Female 1981 1998
Sub-Total 16678 8826 7852 26458 13804 12654Sialkot Distt. 1803 942 861 2723 1396 1327 109 105Daska 574 299 275 861 440 421 109 105Pasrur 426 221 205 612 307 305 108 101Sialkot 803 422 381 1250 649 601 111 108Lahore Distt. 3545 1898 1647 6319 3329 2990 115 111Lahore Cantt. 2032 1088 944 3778 1995 1783 115 112Lahore City 1513 810 703 2541 1334 1207 115 111Kasur Distt. 1528 806 722 2376 1244 1132 112 110Chunian 389 204 185 585 305 280 110 109Kasur 736 389 347 1157 605 552 112 110Pattoki 403 213 190 634 334 300 112 111Okara Distt. 1487 785 702 2232 1167 1065 112 110Depalpur 669 353 316 1031 537 494 112 109Okara 578 306 272 862 456 406 113 112Renala Khurd 240 126 114 339 174 165 111 105Sheikhupura Distt. 2110 1117 993 3321 1729 1592 112 109Ferozwala 550 292 258 999 519 480 113 108Nankana Sahib 509 268 241 684 355 329 111 108Ahmed Abad 429 226 203 589 304 285 111 107Sheikhupura 622 331 291 1049 551 498 114 111Multan Distt. 1970 1048 922 3117 1636 1481 114 110Jalalpur Pir Wala 230 122 108 358 186 172 113 108Multan City 913 486 427 1501 797 704 114 113Multan Sadar 555 296 259 831 431 400 114 108Shujabad 272 144 128 427 222 205
112 108Khanewal Distt. 1370 720 650 2068 1072 996 111 108Jahania 164 86 78 250 129 121 110 107Kabirwala 456 240 216 659 343 316 111 109Khanewal 353 185 168 543 281 262 110 107Mian Channu 397 209 188 616 319 297 111 107Lodhran Distt. 740 391 349 1172 609 563 112 108Dunyapur 221 116 105 338 174 164 110 106Karor Pacca 236 125 111 362 189 173 113 109Lodhran 283 150 133 472 246 226 113 109Pakpattan Distt. 844 445 399 1287 669 618 112 108Arifwala 406 214 192 603 312 291 111 107Pakpattan 438 231 207 684 357 327 112 109Sahiwal Distt. 1281 674 607 1843 953 890 111 107Chichawatni 553 290 263 785 403 382 110 105Sahiwal 728 384 344 1058 550 508 112 108
POPULATION Table 206:-Population by Tehsil and Sex, The Punjab: 1981 and 1998 Censuses-Contd.
District/Tehsil1981 (`000' Persons ) 1998 (`000' Persons ) Sex Ratio (Males
P 100 F l )
283

Both Sexes
Male Female Both Sexes
Male Female 1981 1998
Sub-Total 9610 4965 4645 14349 7287 7062Vehari Distt. 1329 701 628 2090 1084 1006 112 108Burewala 473 249 224 730 378 352 111 107Mailsi 442 233 209 705 366 339 111 108Vehari 414 219 195 655 340 315 112 108Rawalpindi Distt. 2038 1056 982 3283 1684 1599 108 105Gujar Khan 360 174 186 494 236 258 94 91Kahuta 232 112 120 313 149 164 93 91Murree 157 82 75 177 91 86 109 106Rawalpindi 1066 569 497 1928 1014 914 114 111Taxila 223 119 104 371 194 177 114 110Attock Distt. 877 447 430 1275 636 639 104 100Attock 323 168 155 501 257 244 108 105Fateh Jang 149 76 73 214 107 107 104 100Hassanabdal 93 49 44 136 70 66 111 106Jand 165 80 85 228 108 120 94 90Pindi Gheb 147 74 73 196 94 102 101 92Chakwal Distt. 776 381 395 1084 518 566 96 92Chakwal 428 211 217 598 286 312 97 92Choa Saidan Shah 80 40 40 106 52 54 100 96Talagang 268 130 138 380 180 200 94 90Jhelum Distt. 659 333 326 937 468 469 102 100Jhelum 353 180 173 517 264 253 104 104Pind Dadan Khan 188 95 93 264 130 134 102 97Sohawa 118 58 60 156 74 82 97 90Sargodha Distt. 1912 1004 908 2666 1373 1293 111 106Bhalwal 633 330 303 820 422 398 109 106Sahiwal 173 92 81 236 119 117 114 102Sargodha 723 382 341 1081 561 520 112 108Shahpur 206 107 99 274 140 134 108 104Sillanwali 177 93 84 255 131 124 111 106Bhakkar Distt. 666 351 315 1051 543 508 111 107Bhakkar 265 139 126 425 219 206 110 106Darya Khan 147 78 69 233 121 112 113 108Kalur Kot 147 77 70 223 115 108 110 106Mankera 107 57 50 170 88 82 114 107Khushab Distt. 641 327 314 906 451 455 104 99Khushab 516 263 253 731 363 368 104 99Nurpur 125 64 61 175 88 87 105 101Mianwali Distt. 712 365 347 1057 530 527 105 101Isa Khel 160 80 80 257 126 131 100 96Mianwali 374 192 182 532 268 264 105 102Piplan 178 93 85 268 136 132 109 103
284
Source:- Population Census Organization, Statistics Division, Government of Pakistan, Islamabad.
POPULATION
Table 206- Population by Tehsil and Sex, The Punjab: 1981 and 1998 Censuses-Concld.
District/Tehsil1981 (‘000' Persons) 1998 (‘000' Persons) Sex Ratio (Males

Increase in 1998/1981
1981 1998 Percent 1981 1998
The Punjab 205350 47292 73621 55.67 230 359
Bahawalpur 24830 1453 2433 67.4 59 98Bahawalnagar 8878 1374 2061 50 155 232Rahim Yar Khan 11880 1841 3141 70.6 155 264
D. G. Khan 11922 944 1643 74 83 145Layyah 6291 666 1121 68.1 106 178Muzaffargarh 8249 1498 2636 76 182 320Rajanpur 12318 639 1104 72.8 52 90
Faisalabad 5856 3562 5430 52.4 608 927Jhang 8809 1971 2834 43.8 224 322Toba Tek Singh 3252 1134 1622 43.9 349 499
Gujranwala 3622 2108 3401 61.3 582 939Gujrat 3192 1408 2048 45.5 441 642Hafizabad 2367 568 833 46.7 240 352Mandi Baha-ud-Din 2673 846 1161 37.2 316 434Narowal 2337 909 1265 39.2 389 541Sialkot 3016 1803 2723 51 598 903
Lahore 1772 3545 6319 78.3 2001 3566Kasur 3995 1528 2376 55.5 382 595Nankana 2720 938 1273 35.7 345 468Okara 4377 1487 2232 50.1 340 510Sheikhupura 3247 1172 2048 71.8 361 632
Multan 3720 1970 3117Khanewal 4349 1370 2068 58.2 530 838Lodhran 2778 740 1172 50.9 315 476Pakpattan 2724 844 1287 - 266 422Sahiwal 3201 1281 1843 52.5 310 472Vehari 4364 1329 2090 43.9 400 576
57.3 305 479Rawalpindi 5285 2121 3364Attock 6857 877 1275 58.6 401 637Chakwal 6524 776 1084 46.9 128 186Jhelum 3587 659 937 39.7 119 166
42.2 184 261Sargodha 5854 1912 2666Bhakkar 8153 666 1051 39.4 327 455Khushab 6511 641 906 57.8 82 129
Mianwali 5840 712 1057 41.3 98 139
285POPULATION
Table 207:- Area, Population and Density by District, The Punjab: 1981 and 1998 Censuses
Source :- Population Census Organization, Statistics Division, Government of Pakistan, Islamabad.
Population (`000' Persons )
Density Person Per Sq. K. M. District Area (Square
Kilometres)

Total Never Married Married Widowed Divorced
1 Total 42317 13474 26138 2518 187
2 15 - 19 7585 6819 742 18 6
3 20 - 24 6553 3836 2668 30 19
4 25 - 29 5323 1518 3732 48 25
5 30 - 34 4651 563 3989 72 27
6 35 - 39 3580 217 3250 90 23
7 40 - 44 3266 133 2975 136 22
8 45 - 49 2627 79 2361 171 16
9 50 - 54 2457 77 2100 265 15
10 55 - 59 1707 47 1405 246 9
11 60 Years & Above 4568 185 2916 1442 25
POPULATION
Table 208:- Population by Age group (15 Years and Above) ,Marital Status and Sex
Both SexesAge-Group
yearsSr. No.
286

Sl. No.
Total Never Married Married Wido-
wed Divorced Total Never Married Married Wido-
wedDivo-rced
21892 8156 12838 840 58 20425 5318 13300 1678 129 1
3896 3723 164 8 1 3689 3096 578 10 5 2
3281 2440 824 13 4 3272 1396 1844 17 15 3
2704 1112 1563 22 7 2619 406 2169 26 18 4
2419 416 1964 30 9 2232 147 2025 42 18 5
1885 153 1692 33 7 1695 64 1558 57 16 6
1669 87 1533 42 7 1597 46 1442 94 15 7
1342 52 1234 51 5 1285 27 1127 120 11 8
1295 49 1162 79 5 1162 28 938 186 10 9
921 29 812 77 3 786 18 593 169 6 10
2480 95 1890 485 10 2088 90 1026 957 15 11
Source :- Population Census Organization, Statistics Division, Government of Pakistan, Islamabad.
POPULATION
The Punjab: 1998 Census
( Thousand Persons )
Male Female
287

Both Sexes Male Both Sexes Male Both Sexes Male
73621 38094 23019 12073 50602 26023
Less than
0 - 4 10481 5350 2941 1501 7540 3849
5 - 9 11226 5822 3214 1658 8012 4164
10 - 14 9597 5031 3075 1595 6522 3436
15 - 19 7585 3896 2577 1327 5007 2569
20 - 24 6553 3281 2210 1146 4343 2135
25 - 29 5323 2703 1788 951 3535 1752
30 - 34 4651 2419 1575 853 3076 1566
35 - 39 3579 1884 1250 678 2329 1206
40 - 44 3265 1669 1104 589 2162 1080
45 - 49 2627 1342 828 439 1799 903
50 - 54 2458 1293 748 399 1711 896
55 - 59 1706 921 505 277 1201 644
60 - 64 1608 861 448 241 1160 620
65 - 69 1002 547 277 153 725 394
70 - 74 906 500 229 128 676 372
75 Years & Above 1054 575 250 138 804 437
288
Source :- Population Census Organization, Statistics Division, Government of Pakistan, Islamabad.
POPULATION
Table 209 :- Population by Age-Group, The Punjab: 1998 Census( Thousand Persons )
Total Urban RuralAge-Group (Years)
Total - All Ages
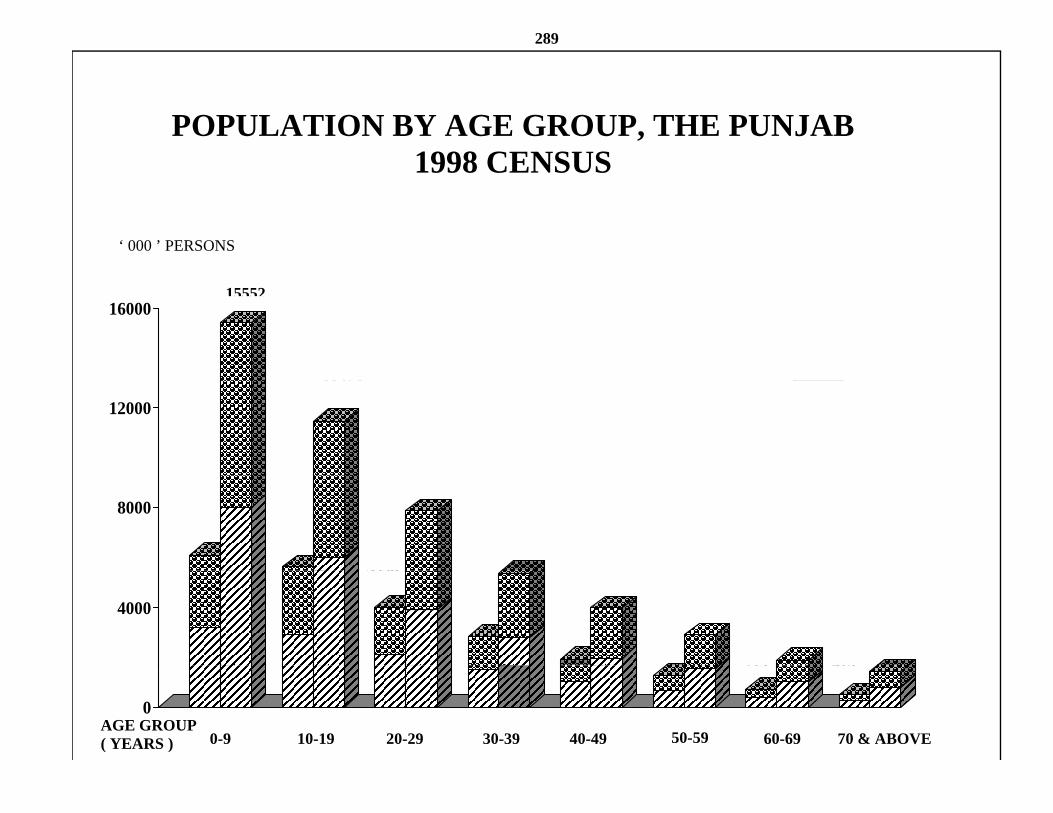
289
POPULATION BY AGE GROUP, THE PUNJAB1998 CENSUS
‘ 000 ’ PERSONS
URBAN
15552
11529
16000
RURAL
MALE
11529
12000
61555652
3998
7877
5405
8000
39982825
1932
3961
1252
2911
725
1885
479
14804000
0-9 10-19 20-29 30-39 40-49 50-59 60-69 70 & ABOVEAGE GROUP( YEARS )
725 479
0

Religion Total Urban Rural
Total 73621 23019 50602
Muslim 71575 22156 49419
Christian 1700 753 947
Ahmadi 181 85 96
Hindu 93 15 78
Scheduled Castes 24 3 21
Others 48 7 41
Nature of Disability Total Male Female
Disabled-Total 1827 1074 753
Blind 155 85 70
Deaf and Dumb 149 85 64
Crippled 381 236 145
Mentally Retarded 144 78 66
Insane 123 72 51
Having more than one disability 147 78 69
Other disability 728 440 288
290
Source :- Population Census Organization, Statistics Division, Government of Pakistan, Islamabad.
Source :- Population Census Organization, Statistics Division, Government of Pakistan, Islamabad.
Table 211 :- Disabled Population by Nature of Disability and SexThe Punjab: 1998 Census
( Thousand Persons )
POPULATION
Table 210 :- Population by Religion and Area, The Punjab: 1998 Census( Thousand Persons )

Annual Growth
Rate (%)
1981 1998 1998/ 1981
June 2007
December 2007
June 2008
December 2008
1 2952 5144 3.32 6295 6353 6407 6462
i) Lahore 2707 4578 3.14 5562 5613 5657 5703
ii) Lahore Cantt. 245 566 5.05 733 740 750 759
2 795 1410 3.43 1703 1718 1733 1747
i) Rawalpindi 457 782 3.21 936 943 950 958
ii) Rawalpindi Cantt. 338 628 3.71 767 775 783 789
3 732 1198 2.94 1454 1468 1481 1494
i) Multan 696 1078 2.61 1276 1286 1295 1305
ii) Multan Cantt. 36 120 7.34 178 182 186 189
4 659 1226 3.72 1482 1494 1513 1532
i) Gujranwala 601 1133 3.8 1373 1385 1397 1409
ii) Gujranwala Cantt. 58 93 2.82 109 109 116 123
5 302 421 1.97 493 497 501 506
i) Sialkot 258 358 1.95 419 422 426 430
ii) Sialkot Cantt. 44 63 2.13 74 75 75 76
6 291 459 2.72 564 570 575 579
i) Sargodha 232 371 2.8 459 464 468 472
ii) Sargodha Cantt. 59 88 2.38 105 106 107 107
7 180 408 4.93 505 510 514 518
i) Bahawalpur 152 356 5.13 444 448 452 456
ii) Bahawalpur Cantt. 28 52 3.71 61 62 62 62
City/Town (Including Respective Cantonment)
Lahore City
Multan City
Gujranwala City
Rawalpindi City
Census Population (Thousand Persons) ESTIMATED POPULATION
Sialkot City
Bahawalpur City
291
POPULATION
Table 212 :- Population of Major Cities / Towns The Punjab
(Thousand Persons)
Sargodha City

Annual Growth
Rate (%)
1981 1998 1998/1981 June 2007 December 2007 June 2008 December
2008
8 107 147 1.89 172 173 175 176
i) Jhelum 93 129 1.94 151 152 154 155
ii) Jhelum Cantt. 14 18 1.49 21 21 21 21
9 1104 2009 3.58 2410 2431 2450 2470
10 196 293 2.39 353 356 359 362
11 155 245 2.73 292 294 295 297
12 155 252 2.9 305 308 311 314
13 151 209 1.93 244 246 247 249
14 141 280 4.12 330 333 335 338
15 119 234 4.06 280 282 283 284
16 102 191 3.76 230 231 232 233
Sourc Population Census Organization, Statistics Division,Government of Pakistan, Islamabad.
Gujrat
Sahiwal
Sheikhupura
Rahim Yar Khan
D. G. Khan
POPULATION
Table 212 :- Population of Major Cities / Towns The Punjab
Jhelum City
Faisalabad
(Thousand Persons)
City/Town (Including Respective Cantonment)
Census Population (Thousand Persons) ESTIMATED POPULATION
Jhang
Kasur
292

30-06-08 31-12-08 30-06-08 31-12-08
Kh/pur Tamewali Tehsil
Ahamdpur East Tehsil Khairpur Tamewali 26854 33784 34076
Ahamdpur East-1 26496 33348 33652 Yazman Tehsil
Ahamdpur East-2 26186 32958 33258 Yazman-City 21028 26492 26760
Ahamdpur East-3 24994 31458 31744
Ahamdpur East-4 18739 23585 23800 Bahawalnagar Tehsil
Uch Sharif 20476 25771 26006 Faisal Colony 18884 22617 22783
Bahawalpur City Tehsil Amir Kot 18583 22256 22419
Bahawalpur -1 20299 25590 25865 Jinnah Colony 17425 20869 21022
Bahawalpur -2 19664 24790 25056 Nizam Pura 19700 23594 23767
Bahawalpur -3 20501 25845 26122 Khadim Abad 18012 21572 21730
Bahawalpur -4 18982 23930 24187 Muslim Colony 18709 22407 22571
Bahawalpur -5 18464 23277 23527 Donga Bonga 22472 26914 27111
Bahawalpur -6 23809 30015 30337 Chishtian Tehsil
Bahawalpur -7 19756 24900 25173 Chishtian-1 17547 21029 21197
Bahawalpur -8 19062 24031 24289 Chishtian-2 18387 22035 22211
Bahawalpur -9 17346 21867 22102 Chishtian-3 16141 19344 19498
Bahawalpur-10 23469 29586 29904 Chishtian-4 15970 19139 19292
Bahawalpur-11 18598 23416 23697 Chishtian-5 16432 19693 19850
Bahawalpur-12 17746 22372 22612 Chishtian-6 17810 21344 21514
Bahawalpur-13 18204 22949 23195 Fortabbas Tehsil
Bahawalpur-14 19130 24116 24375 Fortabbas-1 17964 21509 21662
Bahawalpur-15 18004 22697 22940 Fortabbas-2 (Phulra) 16673 19964 20105
Bahawalpur-16 19602 24711 24977 Haroonabad Tehsil
Bahawalpur-17 22326 28145 28442 Madina Colony 17561 21033 21188
Bahawalpur-18 21664 27311 27604 Muslim Colony 15138 12998 13094
Bahawalpur Cantt. 51769 65263 65963 Hashim Colony 15748 18862 19001
Bahawalpur Sadar Tehsil Baldia City 18717 22418 22583
Samma Satta 20841 26276 26561 Faqir Wali 21546 25806 25997
Hasilpur Tehsil Minchinabad Tehsil
Hasilpur Old-1 20586 25909 26143 Minchinabad-1 18102 21705 21889
Hasilpur Old-2 20043 25225 25454 Minchinabad-2 16837 8846 8921
Hasilpur Mandi 30666 38595 38944 Mandi Sadiq Gunj 20483 14614 14737
PopulationDistrict/Tehsil/Urban
Union Council
POPULATION293
Table 213:- Population of Urban Union Councils by Tehsil, The Punjab
1998 Census
Estimated as onDistrict/Tehsil/Urban Union Council
Population
Estimated as on1998 Census
BAHAWALPUR DISTRICT
BAHAWALNAGAR DISTRICT

30-06-08 31-12-08 30-06-08 31-12-08
D.G.Khan -4 27499 35263 35653
Sadiqabad Tehsil D.G.Khan -5 27176 34849 35241
Sadiqabad-1 20971 26644 26918 D.G.Khan -6 25999 33340 33714
Sadiqabad -2 22064 28033 28321 D.G.Khan -7 27107 34760 35151
Sadiqabad -3 24139 30669 30985 Taunsa TehsilSadiqabad -4 24140 30671 30986 Taunsa 38297 49004 49448
Sadiqabad -5 25621 32552 32887Sadiqabad -6 27456 34884 35243 Choubara Tehsil - - -
Ahmadpur Lamma 14728 18712 18905 Karor Tehsil
Rahim Yar Khan Tehsil Karor City 22595 28500 28767R.Y.Khan-1 27352 34751 35109 Fatehpur 15748 19864 20049R Y Khan -2 31089 39499 39906 Layyah TehsilR.Y.Khan -3 21751 27635 27920 Layyah-1 22647 28590 28881R.Y.Khan -4 25265 32100 32430 Layyah-2 22228 28061 28347R.Y.Khan -5 22407 28469 28762 Layyah-3 27444 34645 34998R.Y.Khan -6 23970 30455 30768 Chowk Azam 33541 42342 42774
R.Y.Khan -7 27597 35063 35424
R.Y.Khan -8 26163 33241 33583 Ali Pur TehsilR.Y.Khan -9 27943 35502 35868 Ali Pur City 28601 36804 37185
Trinda Swai Khan 20797 26423 26695 Jatoi TehsilKot Samaba 20332 25832 26098 Shah Sultan 33470 43756 44262Khanpur Tehsil Jatoi City 38986 50234 50821Khanpur-1 22252 28241 28501 Kot Addu TehsilKhanpur -2 23293 29562 29834 Kot Addu-1 28737 37008 37420
Khanpur -3 22937 29111 29379 Kot Addu-2 22302 28721 29041
Khanpur -4 25518 32386 32684 Kot Addu -3 29681 38224 38649
Khanpur -5 26382 33483 33791 Chowk Sarwar Shaheed 26355 33941 34318
Zahirpir 29557 37512 37858 Dera Din Panah 27029 34986 35362
Liaqatpur Tehsil Muzaffar Garh TehsilLiaqatpur 32858 41772 42226 Muzaffar Garh-1 38804 49924 50430
Muzaffar Garh-2 28661 36874 37248
D.G.Khan Tehsil Muzaffar Garh-3 28454 36608 36979
D.G.Khan-1 27388 35121 35515 Muzaffar Garh-4 27485 35361 35720
D.G.Khan -2 27764 35603 36003 Khan Garh City 16899 21742 21962D.G.Khan -3 27609 35404 35802
1998 Census
Estimated as on 1998 Census
Estimated as on
294
Table 213:- Population of Urban Union Councils by Tehsil, The Punjab-Contd .
District/Tehsil/Urban Union Council
Population PopulationDistrict/Tehsil/Urban Union
Council
POPULATION
LAYYAH DISTRICT
MUZAFFAR GARH DISTRICT
RAHIM YAR KHAN DISTRICT
D.G.KHAN DISTRICT

30-06-08 31-12-08 30-06-08 31-12-08
Iqbal Nagar 20786 25999 26263Jampur Tehsil Dawood Nagar 21122 26420 26687Jampur Sharqi 25699 32831 33174 Maryam Colony 16126 20171 20375Jampur Gharbi 26817 34260 34617 Shalimar Park 20460 25592 25851Dajal 24367 19415 19617 Abadi Wazir Khan 19611 24530 24778Rajanpur Tehsil D-Type Colony 18768 23475 23713Kot Mithan 26761 17461 17662 Sindhu Town 15648 19573 19771Rajanpur Sharqi 20879 26702 27010 Nisar Colony 17821 22291 22517Rajanpur Gharbi 22764 29113 29449 Samanabad (C) 17227 21548 21766Fazil Pur 24016 30714 31068 Nawaban Wala 18239 22814 23045Rojhan Tehsil Sheikhanwala 16623 20792 21003Rojhan 11130 14200 14329 Ucha Marabba 16321 20415 20621
Samanabad (A) 16879 21113 21326Chak Jhumra Town Aminabad No.2 23114 28911 29204Chak Jhumra-1 16411 19511 19572 Ayub Colony 18302 22892 23124Chak Jhumra-2 15700 18666 18724 Dijkot 23126 27909 28126Jaranwala Town Jinnah TownKhurrianwala-1 15722 18815 18914 Ejaz Town 21692 26336 26603Khurrianwala-2 14290 17101 17191 Nazim Abad 21192 25729 25990Jaranwala-1 21966 26287 26426 Khalid Abad 18375 22309 22535Jaranwala-2 22125 26477 26617 Partab Nagar 17673 21457 21674Jaranwala-3 19184 22957 23079 Kausar Abad 16970 20603 20812Jaranwala-4 20658 24721 24852 Liaqat Abad 15054 18277 18462Jaranwala-5 23052 27586 27732 Gulistan Colony 16243 19721 19921Iqbal Town Shadab Colony 16847 20454 20661Fatehabad (West) 17355 21708 20785 Saif Abad 16365 19869 20070Batala Colony 16640 20814 19929 Gul Rahim Town 19473 23642 23882Muhammad Abad 15531 19425 18600 Sher Singh Wala 15905 19310 19506Abadi Feroz Shah 17641 22066 21128 Raza Abad 21885 26571 26840Basti Allah Hoo 17492 21879 20950 Marzi Pura 25357 30786 31098People Colony No.2 22765 28475 27265 Qadir Abad 21617 26245 26511People Colony No.2-C 18681 23366 22374 G. Muhammad Abad-D 22836 27725 28006Sarfraz Colony 15080 18862 18061 G.Muhammad Abad-S 21451 26044 26308Allama Iqbal Colony (E) 21063 26346 25226 G.Muhammad Abad-Ext. 18433 22380 22606Allama Iqbal Colony (W) 18488 23125 22142 G.Muhammad Abad-B 15615 18958 19150Zulifqar Colony 20091 25130 24062 G.Muhammad Abad-A 19186 23294 23530Yasin Abad 21538 26940 25795 Choor Majra 15809 19194 19388
Raza Abad-1 18170 22060 22284
295
District/Tehsil/Urban Union Council
POPULATIONTable 213:- Population of Urban Union Councils by Tehsil, The Punjab-Contd.
Population
1998 Census
Estimated as on 1998 Census
Estimated as on
RAJANPUR DISTRICT
District/Tehsil/Urban Union Council
Population
FAISALABAD CITY DISTRICT

30-06-08 31-12-08 30-06-08 31-12-08
Raza Abad-2 15422 21588 21762 Faisal Garden 20651 25554 25813279-Khurd 21944 26073 26282 Malikpur 19908 24634 24884Gulshan Colony 18172 21591 21764 Amin Town 19217 23779 24020Afghan Abad 22665 26929 27145 Ashraf Pura 19110 23647 23887Muhammad pura 22396 26610 26823 Manzoor Park 20582 25468 25727Gulberg 22713 26986 27203 Gulistan Colony 20593 25482 25740Jinnah Colony 22220 26400 26612 Islamia Park 16683 20644 20853Lyallpur Town Tariqabad 22371 27682 27963Clock Tower 19188 24341 24588 Nagehban Pura 20033 24789 25040Model Town 17512 22215 22440 Sharifpura 19659 24326 24573Agri. University 16000 20297 20502 Mansoor Abad 15896 19670 19869Kanak Basti 17948 22768 22999 Farooq Abad 16608 20551 20759Sidhupura 17070 21654 21874 Abdullah Pur 14536 17987 18169Rashidabad 19328 24518 24767 Madina Town 19776 26505 26774Akbarabad 19141 24281 24527 Himat Pura 21420 28005 28225Bawa Chak 20494 25998 26261 Madina Town-(Z) 19941 24675 24925Ghkhoowal 17799 22579 22808 Madina Town-(X) 21701 26853 27125Muslim Town 16784 21291 21507 Khalsa College 16832 20828 21039Noor Pur 23527 29845 30148 People Colony No.1 18685 23121 23355Mattoopura 19402 24612 24862 Kahkashan Colony 18494 28960 29254Taj Colony 18619 23619 23858 Khan Model Colony 18403 22772 23003Islam Nagar 21820 27680 27960 People Colony B-D 16141 19973 20176New Civil Line 18728 23757 23998 Fateh Abad (East) 16317 20191 20396Mai-De-Jhugi (East) 18455 23411 23648 Railway Colony 16485 20399 20606Mai-De-Jhugi (West) 18711 23736 23976 Elahi Abad 18438 22815 23047Factory Area 18821 23875 24117 Sahianwala-225 16126 19955 20157SirSyed Town (Blk A& B) 16861 21389 21606 Sammundri TownSirSyed Town (Blk C,D & E) 16111 20438 20645 Sammundri-1 20064 23968 24080Madina Town Sammundri-2 17373 20753 20851Johar Colony 19066 23593 23832 Sammundri-3 17471 20870 20968Jamilabad 18978 23484 23722 Tandlianwala TownCrescent Sugar Mills 17412 21546 21764 Tandlianwala-1 17825 13310 13379Shamasabad 17859 22099 22323 Tandlianwala-2 16759 12514 12579
Mamunkanjan 27846 20793 20900
Population
1998 Census
Estimated as on 1998 Census
Estimated as on
POPULATION
Table 213:- Population of Urban Union Councils by Tehsil, The Punjab-Contd.
296
District/Tehsil/Urban Union Council
District/Tehsil/Urban Union Council
Population
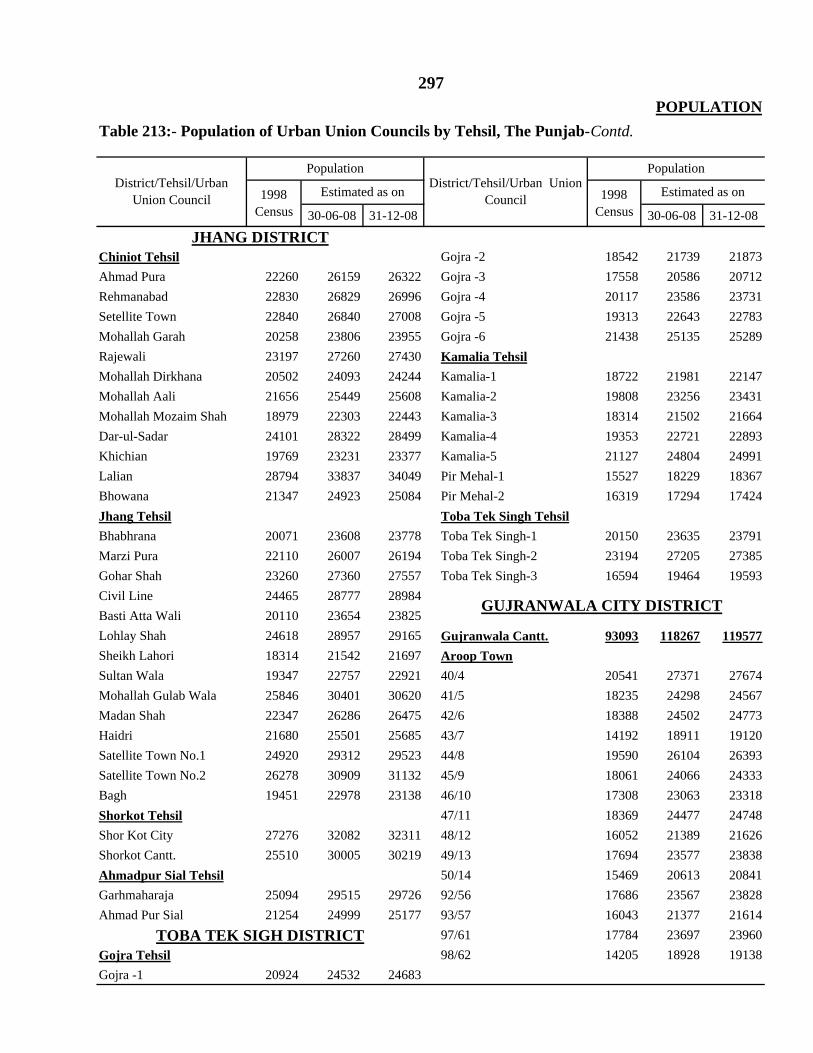
30-06-08 31-12-08 30-06-08 31-12-08
Chiniot Tehsil Gojra -2 18542 21739 21873Ahmad Pura 22260 26159 26322 Gojra -3 17558 20586 20712Rehmanabad 22830 26829 26996 Gojra -4 20117 23586 23731Setellite Town 22840 26840 27008 Gojra -5 19313 22643 22783Mohallah Garah 20258 23806 23955 Gojra -6 21438 25135 25289Rajewali 23197 27260 27430 Kamalia TehsilMohallah Dirkhana 20502 24093 24244 Kamalia-1 18722 21981 22147Mohallah Aali 21656 25449 25608 Kamalia-2 19808 23256 23431Mohallah Mozaim Shah 18979 22303 22443 Kamalia-3 18314 21502 21664Dar-ul-Sadar 24101 28322 28499 Kamalia-4 19353 22721 22893Khichian 19769 23231 23377 Kamalia-5 21127 24804 24991Lalian 28794 33837 34049 Pir Mehal-1 15527 18229 18367Bhowana 21347 24923 25084 Pir Mehal-2 16319 17294 17424Jhang Tehsil Toba Tek Singh TehsilBhabhrana 20071 23608 23778 Toba Tek Singh-1 20150 23635 23791Marzi Pura 22110 26007 26194 Toba Tek Singh-2 23194 27205 27385Gohar Shah 23260 27360 27557 Toba Tek Singh-3 16594 19464 19593Civil Line 24465 28777 28984Basti Atta Wali 20110 23654 23825Lohlay Shah 24618 28957 29165 Gujranwala Cantt. 93093 118267 119577Sheikh Lahori 18314 21542 21697 Aroop TownSultan Wala 19347 22757 22921 40/4 20541 27371 27674Mohallah Gulab Wala 25846 30401 30620 41/5 18235 24298 24567Madan Shah 22347 26286 26475 42/6 18388 24502 24773Haidri 21680 25501 25685 43/7 14192 18911 19120Satellite Town No.1 24920 29312 29523 44/8 19590 26104 26393Satellite Town No.2 26278 30909 31132 45/9 18061 24066 24333Bagh 19451 22978 23138 46/10 17308 23063 23318Shorkot Tehsil 47/11 18369 24477 24748Shor Kot City 27276 32082 32311 48/12 16052 21389 21626Shorkot Cantt. 25510 30005 30219 49/13 17694 23577 23838Ahmadpur Sial Tehsil 50/14 15469 20613 20841Garhmaharaja 25094 29515 29726 92/56 17686 23567 23828Ahmad Pur Sial 21254 24999 25177 93/57 16043 21377 21614
97/61 17784 23697 23960Gojra Tehsil 98/62 14205 18928 19138Gojra -1 20924 24532 24683
POPULATIONTable 213:- Population of Urban Union Councils by Tehsil, The Punjab-Contd.
District/Tehsil/Urban Union Council
Population Population
1998 Census
Estimated as on 1998 Census
Estimated as onDistrict/Tehsil/Urban Union
Council
JHANG DISTRICT
TOBA TEK SIGH DISTRICT
297
GUJRANWALA CITY DISTRICT

30-06-08 31-12-08 30-06-08 31-12-08
99/63 17806 23727 23989 Kamoke-3 19661 22630 22808100/64 19250 25651 25935 Kamoke-4 19001 21871 22042Khiali Shah Pur Town Kamoke-5 14302 16462 1659164/28 20020 26954 27253 Kamoke-6 19449 22386 2256265/29 20124 27094 27394 Kamoke-7 19709 22685 2286466/30 16795 22612 22863 Kamoke-8 19189 22087 2226067/31 17979 24207 24474 NowsheraVirkan Town68/32 18540 24962 25238 Nowshera Virkan-1 16453 18869 1896169/33 16689 22470 22718 Nowshera Virkan-2 17487 20043 2013570/34 18205 24511 24782 Qila Dedar Singh Town71/35 16303 21950 22193 Qila Dedar Singh-1 20533 24156 2433072/36 17669 23789 24052 Qila Dedar Singh-2 20871 24553 2473073/37 19838 26709 27005 Ladhewala Warriach-1 16562 19484 1962474/38 17522 23591 23852 Ladhewala Warriach-2 17366 20430 2057783/47 17123 23054 23309 39/3 16739 19692 1983484/48 16981 22863 23116 75/39 17347 20408 20555Eminabad 19136 25764 26049 76/40 14249 16763 16884Nandi Pur Town 77/41 16730 19682 1982337/1 18770 24950 25226 78/42 15931 18742 188738/2 18995 25249 25528 79/43 19899 23410 2357851/15 16472 21895 22138 80/44 10073 11850 11193652/16 16259 21612 21851 81/45 19381 22800 2296553/17 16432 21842 22084 82/46 17860 21011 2116254/18 16421 21827 22069 85/49 14729 17328 1745255/19 17484 23240 23498 86/50 17951 21118 2127056/20 19400 25787 26073 87/51 19388 22809 2297357/21 18589 24709 24983 88/52 18189 21398 2155258/22 16217 21556 21795 89/53 17419 20492 2064059/23 19964 26537 26831 90/54 20623 24262 2443660/24 15478 20574 20802 91/55 19048 22409 2257061/25 17052 22666 22917 94/58 16574 19498 1963962/26 17515 23282 23539 95/59 18144 21345 2149963/27 19652 26122 26411 96/60 17242 20284 20430Kamoke Town Wazirabad TownKamoke-1 19817 22810 22989 Wazirabad-1 17934 19914 20064Kamoke-2 21160 24356 24547 Wazirabad-2 18282 20301 20453
298
Estimated as onDistrict/Tehsil/Urban Union Council
POPULATION
Table 213:- Population of Urban Union Councils by Tehsil, The Punjab-Contd.
District/Tehsil/Urban Union Council
Population Population
1998 Census
Estimated as on 1998 Census

30-06-08 31-12-08 30-06-08 31-12-08
Wazirabad-3 19572 21733 21896 Sarai Alamgir TehsilWazirabad-4 15554 17272 17401 Sarai Alamgir-1 17271 20420 20567Wazirabad-5 18855 20937 21094 Sarai Alamgir-2 19895 23522 23692Ghakkar-1 15696 17429 17560Ghakkar-2 15673 17404 17534 Hafizabad TehsilGhakkar-3 14880 16523 16647 Hafizabad-1 24121 30057 30199Alipur Chattha-1 19458 21607 21769 Hafizabad-2 20239 24005 24176Alipur Chattha-2 20089 22307 22475 Hafizabad-3 19992 23712 23881Rasool Nagar 12373 13739 13842 Hafizabad-4 17402 23367 23533Sodhra 13948 15488 15604 Hafizabad-5 20271 21316 21468Dhaunkal 20033 23427 23578 Hafizabad-6 20959 24859 25036
Hafizabad-7 17904 21235 21387Kalike 14027 16637 16756
Gujrat Tehsil Pindi Bhattian TehsilGujrat -1 16345 19326 19466 Pindi Bhattian 29917 35491 35751Gujrat -2 15602 18447 18582 Sukheke 28245 33507 33753Gujrat -3 13536 16005 16121 Jalalpur Bhattian 21248 25206 25391Gujrat -4 16603 19631 19774Gujrat -5 18559 21944 22103 M. B.Din TehsilGujrat -6 16392 19381 19522 M.B.Din-1 19726 22725 22874Gujrat -7 15272 18057 18188 M.B.Din-2 22035 25385 25552Gujrat -8 20876 24683 24863 M.B.Din-3 20880 24055 24212Gujrat -9 21228 25099 25282 M.B.Din-4 15872 18285 18405Gujrat-10 15814 18698 18834 M.B.Din-5 20983 24173 24332Gujrat-11 15421 18233 18366 Mangat 14006 16135 16241Gujrat-12 18304 21642 21800 Malikwal TehsilGujrat-13 17258 20405 20554 Malikwal-1 15234 17508 17580Gujrat-14 15618 18466 18601 Malikwal-2 16024 18416 18492Gujrat-15 14764 17693 17822 Phalia TehsilJalal Pur Jattan-1 18024 21311 21466 Phalia 21678 24975 25140Jalal Pur Jattan-2 17814 21063 21216 Qadirabad 21282 24716 24867Jalal Pur Jattan-3 17674 20897 21049Jalal Pur Jattan-4 15883 18780 18916 Narowal TehsilKunjah 24338 28776 28986 Narowal-1 14333 16618 16727Shadiwal 17678 20902 21054 Narowal-2 15268 17702 17818Kharian Tehsil Narowal-3 12859 14909 15007Lalamusa-1 14941 17659 17780 Narowal-4 15279 16918 17030Lalamusa-2 10618 17736 17858 Zaffarwal 19824 22984 23136Lalamusa-3 15196 17960 18084 Baddomalhi 15785 18302 18422Lalamusa-4 14853 17555 17676 Q.Sobha Singh (Ahmadabad) 10978 12728 12812Dinga-1 14942 17663 17787 Shakargarh TehsilDinga-2 19238 22742 22902 Shakargarh-1 16756 19416 19532Kharian City 23713 28032 28229 Shakargarh-2 17951 20801 20925Kharian Cantt. 49914 59004 59463 Shakargarh-3 16040 18586 18697
299
Estimated as onDistrict/Tehsil/Urban Union Council
POPULATIONTable 213:- Population of Urban Union Councils by Tehsil, The Punjab-Contd.
District/Tehsil/Urban Union Council
Population Population
1998 Census
Estimated as on 1998 Census
HAFIZABAD DISTRICT
MANDI BAHA-UD-DIN DISTRICT
GUJRAT DISTRICT
NAROWAL DISTRICT
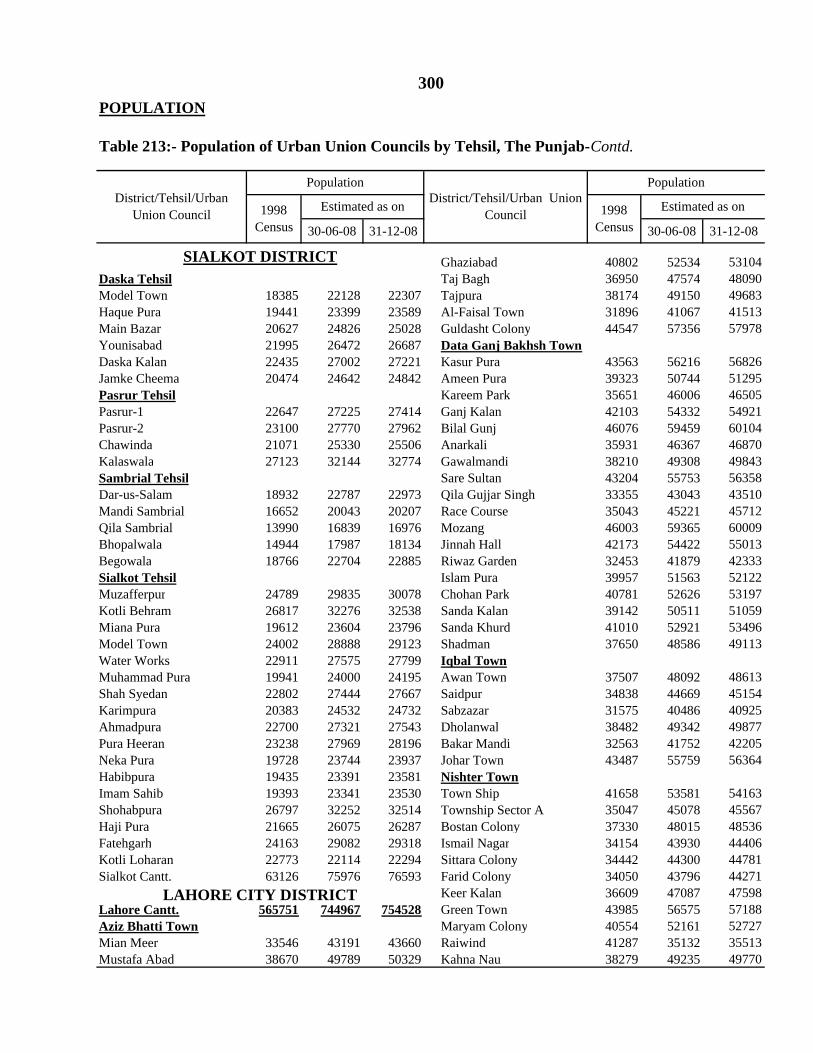
30-06-08 31-12-08 30-06-08 31-12-08
Ghaziabad 40802 52534 53104Daska Tehsil Taj Bagh 36950 47574 48090Model Town 18385 22128 22307 Tajpura 38174 49150 49683Haque Pura 19441 23399 23589 Al-Faisal Town 31896 41067 41513Main Bazar 20627 24826 25028 Guldasht Colony 44547 57356 57978Younisabad 21995 26472 26687 Data Ganj Bakhsh TownDaska Kalan 22435 27002 27221 Kasur Pura 43563 56216 56826Jamke Cheema 20474 24642 24842 Ameen Pura 39323 50744 51295Pasrur Tehsil Kareem Park 35651 46006 46505Pasrur-1 22647 27225 27414 Ganj Kalan 42103 54332 54921Pasrur-2 23100 27770 27962 Bilal Gunj 46076 59459 60104Chawinda 21071 25330 25506 Anarkali 35931 46367 46870Kalaswala 27123 32144 32774 Gawalmandi 38210 49308 49843Sambrial Tehsil Sare Sultan 43204 55753 56358Dar-us-Salam 18932 22787 22973 Qila Gujjar Singh 33355 43043 43510Mandi Sambrial 16652 20043 20207 Race Course 35043 45221 45712Qila Sambrial 13990 16839 16976 Mozang 46003 59365 60009Bhopalwala 14944 17987 18134 Jinnah Hall 42173 54422 55013Begowala 18766 22704 22885 Riwaz Garden 32453 41879 42333Sialkot Tehsil Islam Pura 39957 51563 52122Muzafferpur 24789 29835 30078 Chohan Park 40781 52626 53197Kotli Behram 26817 32276 32538 Sanda Kalan 39142 50511 51059Miana Pura 19612 23604 23796 Sanda Khurd 41010 52921 53496Model Town 24002 28888 29123 Shadman 37650 48586 49113Water Works 22911 27575 27799 Iqbal TownMuhammad Pura 19941 24000 24195 Awan Town 37507 48092 48613Shah Syedan 22802 27444 27667 Saidpur 34838 44669 45154Karimpura 20383 24532 24732 Sabzazar 31575 40486 40925Ahmadpura 22700 27321 27543 Dholanwal 38482 49342 49877Pura Heeran 23238 27969 28196 Bakar Mandi 32563 41752 42205Neka Pura 19728 23744 23937 Johar Town 43487 55759 56364Habibpura 19435 23391 23581 Nishter TownImam Sahib 19393 23341 23530 Town Ship 41658 53581 54163Shohabpura 26797 32252 32514 Township Sector A 35047 45078 45567Haji Pura 21665 26075 26287 Bostan Colony 37330 48015 48536Fatehgarh 24163 29082 29318 Ismail Nagar 34154 43930 44406Kotli Loharan 22773 22114 22294 Sittara Colony 34442 44300 44781Sialkot Cantt. 63126 75976 76593 Farid Colony 34050 43796 44271
Keer Kalan 36609 47087 47598Lahore Cantt. 565751 744967 754528 Green Town 43985 56575 57188Aziz Bhatti Town Maryam Colony 40554 52161 52727Mian Meer 33546 43191 43660 Raiwind 41287 35132 35513Mustafa Abad 38670 49789 50329 Kahna Nau 38279 49235 49770
300
Estimated as onDistrict/Tehsil/Urban Union Council
POPULATION
Table 213:- Population of Urban Union Councils by Tehsil, The Punjab-Contd.
District/Tehsil/Urban Union Council
Population Population
LAHORE CITY DISTRICT
1998 Census
Estimated as on 1998 Census
SIALKOT DISTRICT

30-06-08 31-12-08 30-06-08 31-12-08
Ravi Town Waga TownKot Begum 40169 51836 52399 Muslim Abad 41370 53087 53663Kot Mohibbu 39531 51013 51566 Sultan Mehmood 34300 44015 44492Aziz Colony 41382 53402 53981 Shadipura 39567 50773 51324Fisal Park 44034 56824 57440 Salamat Pura 43269 55524 56126Qaiser Town 38852 50137 50681 Darogha Wala 42124 54054 54641Dhair 35087 45278 45769 Gulberg TownShahdara 35516 45832 46329 Railway Colony 38311 49438 49975Jia Musa 41628 53719 54302 Daras Barey Mian 42105 54334 54924Qila Lachhman Singh 32291 41670 42122 Bibi Pak Daman 40683 52499 53069Fruit Mandi 36101 46587 47092 Garrhi Shahu 33112 42729 43193Siddique Pura 33059 42661 43124 Al-Hamra 36078 46557 47062Bangali Bagh 41758 53887 54471 Zaman Park 40078 51719 52280Siddiqia Colony 46689 60250 60904 Gulberg 42540 54896 55491Bhamman 35267 45510 46004 Makkah Colony 38783 50048 50591Bhaghat Pura 31564 40732 41174 Naseer Abad 36994 47739 48257Gujjar Pura 37880 48882 49413 Garden Town 40672 52485 53055Rehmatpura 38711 49955 50497 Model Town 33385 43082 43549Begum Pura 38020 49063 49595 Faisal Town 32789 42313 42772Chah Miran 45783 59081 59722 Liaqatabad 41172 53130 53707Bilal Park 40144 51804 52366 Kot Lakhpat 34067 43962 44439Makhanpura 41393 53416 53995 Pindi Rajputan 40127 51782 52344Kot Khawaja Saeed 38731 49981 50523 Samanabad TownShad Bagh 38666 49897 50438 Abu Bakar Siddique Coly. 35695 46063 46563Wassanpura 33528 43266 43736 Sham Nagar 41880 54044 54631Faiz Bagh 39093 50448 50995 Gulgasht Colony 34114 44023 44500Farooq Ganj 36982 47724 48241 Gulshan-e-Ravi 36602 47233 47746Aandroon Dehli Gate 38534 49726 50266 Babu Sabu 33069 42674 43137Rang Mahal 40923 52809 53382 Rizwan Park 38539 49733 50272Androon Bhatti Gate 42853 55300 55900 Sodiwal 31822 41065 41510Androon Texali Gate 38424 49584 50122 Bahawalpur House 30368 39188 39614Shalimar Town Ichhra 34205 44140 44619Crown Park 31422 40549 40988 New Samanabad 34896 45032 45520Madhu Lal Hussain 31987 41278 41725 Shah Kamal 40549 52327 52894Muhammad Colony 36968 47705 48223 Pakki Thatti 41926 54104 54691Baghbanpura 37041 47800 48318 Kashmir Block 45199 58327 58960Harbanspura 38475 49650 50189 Nawan Kot 46229 59656 60304Rashidpura 41948 54132 54719 Samanabad 36068 46544 47049Fateh Garh 31922 41194 41641 Rehman Pura 39366 50800 51351Nabipura 40454 52204 52770 Gulshan-e-Iqbal 43617 56286 56896Angori Bagh 33416 43122 43589 Sikandar Block 43083 55597 56200Mujahidabad 32395 41804 42258 Muslim Town 34742 44833 45319Mughalpura 33134 42758 43222
Estimated as onDistrict/Tehsil/Urban Union
Council 1998 Census
District/Tehsil/Urban Union Council
Population Population
1998 Census
Estimated as on
POPULATION301
Table 213:- Population of Urban Union Councils by Tehsil, The Punjab-Contd.
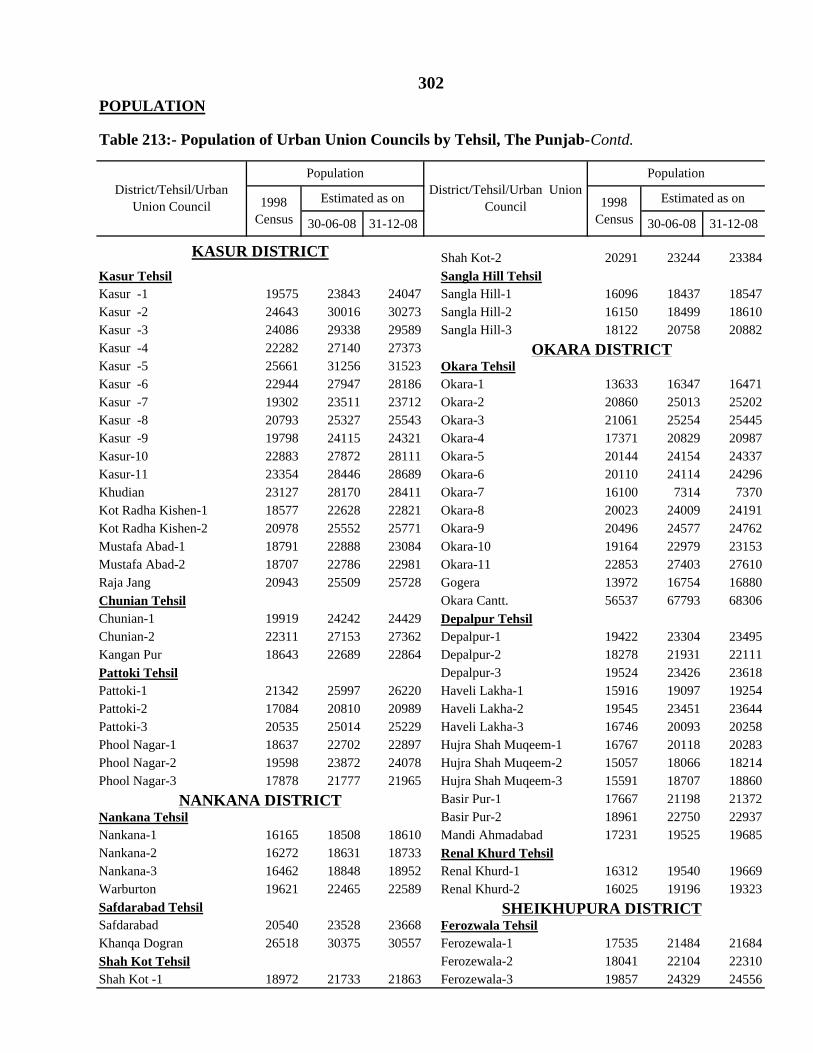
30-06-08 31-12-08 30-06-08 31-12-08
Shah Kot-2 20291 23244 23384Kasur Tehsil Sangla Hill TehsilKasur -1 19575 23843 24047 Sangla Hill-1 16096 18437 18547Kasur -2 24643 30016 30273 Sangla Hill-2 16150 18499 18610Kasur -3 24086 29338 29589 Sangla Hill-3 18122 20758 20882Kasur -4 22282 27140 27373Kasur -5 25661 31256 31523 Okara TehsilKasur -6 22944 27947 28186 Okara-1 13633 16347 16471Kasur -7 19302 23511 23712 Okara-2 20860 25013 25202Kasur -8 20793 25327 25543 Okara-3 21061 25254 25445Kasur -9 19798 24115 24321 Okara-4 17371 20829 20987Kasur-10 22883 27872 28111 Okara-5 20144 24154 24337Kasur-11 23354 28446 28689 Okara-6 20110 24114 24296Khudian 23127 28170 28411 Okara-7 16100 7314 7370Kot Radha Kishen-1 18577 22628 22821 Okara-8 20023 24009 24191Kot Radha Kishen-2 20978 25552 25771 Okara-9 20496 24577 24762Mustafa Abad-1 18791 22888 23084 Okara-10 19164 22979 23153Mustafa Abad-2 18707 22786 22981 Okara-11 22853 27403 27610Raja Jang 20943 25509 25728 Gogera 13972 16754 16880Chunian Tehsil Okara Cantt. 56537 67793 68306Chunian-1 19919 24242 24429 Depalpur TehsilChunian-2 22311 27153 27362 Depalpur-1 19422 23304 23495Kangan Pur 18643 22689 22864 Depalpur-2 18278 21931 22111Pattoki Tehsil Depalpur-3 19524 23426 23618Pattoki-1 21342 25997 26220 Haveli Lakha-1 15916 19097 19254Pattoki-2 17084 20810 20989 Haveli Lakha-2 19545 23451 23644Pattoki-3 20535 25014 25229 Haveli Lakha-3 16746 20093 20258Phool Nagar-1 18637 22702 22897 Hujra Shah Muqeem-1 16767 20118 20283Phool Nagar-2 19598 23872 24078 Hujra Shah Muqeem-2 15057 18066 18214Phool Nagar-3 17878 21777 21965 Hujra Shah Muqeem-3 15591 18707 18860
Basir Pur-1 17667 21198 21372Nankana Tehsil Basir Pur-2 18961 22750 22937Nankana-1 16165 18508 18610 Mandi Ahmadabad 17231 19525 19685Nankana-2 16272 18631 18733 Renal Khurd TehsilNankana-3 16462 18848 18952 Renal Khurd-1 16312 19540 19669Warburton 19621 22465 22589 Renal Khurd-2 16025 19196 19323Safdarabad TehsilSafdarabad 20540 23528 23668 Ferozwala TehsilKhanqa Dogran 26518 30375 30557 Ferozewala-1 17535 21484 21684Shah Kot Tehsil Ferozewala-2 18041 22104 22310Shah Kot -1 18972 21733 21863 Ferozewala-3 19857 24329 24556
POPULATION
Table 213:- Population of Urban Union Councils by Tehsil, The Punjab-Contd.
District/Tehsil/Urban Union Council
Population
1998 Census
Estimated as on 1998 Census
District/Tehsil/Urban Union Council
Population
302
Estimated as on
OKARA DISTRICT
SHEIKHUPURA DISTRICT
NANKANA DISTRICT
KASUR DISTRICT

30-06-08 31-12-08 30-06-08 31-12-08
Kot Abdul Malik-1 22448 27504 27760 Durana Langana 20497 29975 32975Kot Abdul Malik-2 18518 22688 22900 Jahangir Abad 24097 35246 38769Kot Abdul Malik-3 22559 27640 27897 Qadirpur Rawan 17520 20037 20217Muridke Tehsil Cantt. Area U.C.-A 20000 22873 23078Narang-1 16551 20278 20468 Cantt. Area U.C.-B 20000 22873 23078Narang-2 14794 18126 18295 Cantt. Area U.C.-C 20000 22873 23078Muridke-1 21113 25868 26109 Jalalpur Pirwala TownMuridke-2 19005 23285 23502 Jalalpur Pirwala-1 14316 14567 14682Muridke-3 17697 21683 21885 Jalalpur Pirwala-2 17903 18217 18361Muridke-4 19182 23502 23721 Mumtazabad TownMuridke-5 17478 21414 21614 Saleem Colony 26233 26518 26756Muridke-6 17476 21412 21611 Iqbal Nagar 24188 24451 24670Sharaqpur Tehsil Niaz Abad 24367 24631 24853Sharaqpur 28186 34536 34859 Mumtazabad 29665 29987 30257Sheikhupura Tehsil Panjand Colony 25866 26147 26382Sheikhupura -1 23357 28577 28802 Qasab Pura 20511 20734 20920Sheikhupura -2 21947 26852 27064 Gulshan-5-Faiz 28337 28645 28902Sheikhupura -3 20719 25349 25549 Gulzaib Colony 26194 26478 26716Sheikhupura -4 20594 25196 25395 Shah Risal 28004 28308 28562Sheikhupura -5 19324 23642 23829 New Nizamabad 25886 25864 26096Sheikhupura -6 19713 24118 24309 Abbas pur 20473 22892 23098Sheikhupura -7 21778 26645 26855 Mohalla Kamangran 24578 24845 25068Sheikhupura -8 17078 20894 21059 Mohallah Shah Gardez 26089 26372 26609Sheikhupura -9 17216 21063 21230 Mohallah Hakeeman Wala 21593 21827 22024Sheikhupura-10 17628 21567 21738 Dera Budhu Malik 21338 21570 21764Sheikhupura-11 20364 24915 25111 Shah Rukn-e-Alam Sheikhupura-12 22492 27518 27736 Nazimabad 22710 22947 23154Sheikhupura-13 21979 26891 27103 Abid Colony 19629 19531 19707Sheikhupura-14 16074 19666 19821 Shamas Abad 20367 25969 26203Farooqabad-1 21074 25783 25987 WAPDA Colony 23234 23477 23688Farooqabad-2 18336 22434 22611 Akhtarabad 22056 20265 20448Farooqabad-3 19605 23986 24176 Hasan Abad 23528 23774 23988Mananwala 25564 31277 31524 Peoples Colony 20800 23506 23717Jandiala Sher Khan 22339 12632 12732 Shah Rukh-e-Alam Colony 24042 24293 24512
Ghouspura 21474 21698 21893Writers Colony 28737 29037 29298
Multan Cantt.(a) 61529 71619 72243 Sharifpura 26514 26791 27032Bosan Town Manzoor Abad 27903 28194 28448Bagh Dewan 23100 33786 37162 Jamalpura 21858 22086 22285Gulgasht Colony 28966 42365 46598 Khawaja Farid Colony 26062 26334 26571Officers Colony 23744 34729 38107 Bhani 19801 20008 20188Mehrban Colony 24758 36210 39827 Piran Ghaib 36068 36445 36772Sadiq Colony 20873 30529 33580 Sher Shah TownTibba Masood pur 23112 30426 33804 Per Colony 16483 21010 21199Alamdi Sura 26287 38449 42292 Ashraf Colony 25090 25343 25571Taraf Mubarak Doem 28776 42088 46294 Timber Market 23751 23991 24206Neel Kot 24198 35393 39599
303POPULATION
Table 213:- Population of Urban Union Councils by Tehsil, The Punjab-Contd.
District/Tehsil/Urban Union Council
Population Population1998
CensusEstimated as on 1998
CensusEstimated as on
Govt. of Pakistan Notification No.21/2/Budget/83/1331/D-6(A-vi)/2004 dated 3-8-2004.a) Excludes the population of Area Surrendered / Encluded under Contomment Board Multan by Ministry of Defence,
District/Tehsil/Urban Union Council
MULTAN DISTRICT

30-06-08 31-12-08 30-06-08 31-12-08
Latifabad 19698 19897 20076 Lodhran TehsilGlass Factory 23982 24224 24442 Railway Station 16015 19692 19884Gulnar Colony 24718 24967 25192 Muncipality 16015 19692 19884Abbas Colony 23404 21620 21814 Gulab Pura 16755 20602 20802Khangah Inayat Shah 24897 25148 25374 Gangay Wala 16716 20554 20754Hasan Parwana 22701 22930 23136Gul Din colony 17874 18054 18217 Arifwala TehsilMohallah Qadeer Abad 17830 18010 18172 Arif wala-1 20188 24360 24543Shadman Colony 23091 23324 23534 Arif wala-2 16987 20498 20651Shujaabad Town Arif wala-3 17449 21055 21213Shujaabad-1 28314 31318 31570 Arif wala-4 19550 23590 23767Shujaabad-2 29095 32182 32441 Pakpattan Tehsil
Pakpattan-1 24995 30189 30444Khanewal Tehsil Pakpattan-2 24678 29806 30058Khanewal-1 20564 24727 24928 Pakpattan-3 18362 22177 22365Khanewal-2 24103 28982 29218 Pakpattan-4 20309 24529 24736Khanewal-3 24792 29811 30054 Pakpattan-5 20689 24988 25199Khanewal-4 21662 26047 26259Khanewal-5 23645 28432 28663 Chichawatni TehsilKhanewal-6 19220 23111 23299 Chichawatni-1 25055 29453 29647Makhdoom Pur Pohran 17613 21179 21351 Chichawatni-2 24469 28764 28953Kabirwala Tehsil Chichawatni-3 23197 27269 27448Kabirwala-1 27090 32536 32762 Sahiwal TehsilKabirwala-2 20365 24459 24629 Sahiwal -1 18129 18257 18001Abdul Hakim-1 18656 22406 22562 Sahiwal -2 29133 29340 28928Abdul Hakim-2 19434 23341 23503 Sahiwal -3 25966 26150 25783Sarai Sidhu 13267 15934 16045 Sahiwal -4 18650 18782 18518Mian Channu Tehsil Sahiwal -5 19896 20037 19756Mian Channu-1 18177 21861 22043 Sahiwal -6 26105 26290 25921Mian Channu-2 22228 26733 26956 Sahiwal -7 21226 21377 21077Mian Channu-3 24454 29410 29656 Sahiwal -8 31208 31429 30988Tulamba 24120 29008 29251 Sahiwal -9 27345 27538 27152Jahanian Tehsil Sahiwal-10 27888 28085 27692Jahanian 24871 29901 30140 Kamir Sharif 24100 24270 23930
Dunyapur Tehsil Burewala TehsilHousing Scheme 13990 17173 17311 Yaqoobabad 29751 29751 29995Eid Gah Wali 15523 19055 19208 Gulshan –e-Rehman 25188 25188 25395Kehror Pacca Tehsil Housing Scheme 32869 32869 33139Dhanote 16100 19764 19924 Main City 31234 32134 32398Bakshi Wala 15798 19394 19551 BTM 33514 33514 33790Patwann Wala 13774 16909 17046 Satelite Town 32689 32689 32958Zafar Abad 15528 19062 19217 Mailsi TehsilDiyanat Pura 13874 19032 17170 Mailsi West 34372 34372 34677
Estimated as onDistrict/Tehsil/Urban Union Council
Population
Table 213:- Population of Urban Union Councils by Tehsil, The Punjab-Contd.
District/Tehsil/Urban Union Council
POPULATION304
PAKPATTAN DISTRICT
SAHIWAL DISTRICT
VEHARI DISTRICT
Population
1998 Census
Estimated as on 1998 Census
KHANEWAL DISTRICT
LODHRAN DISTRICT
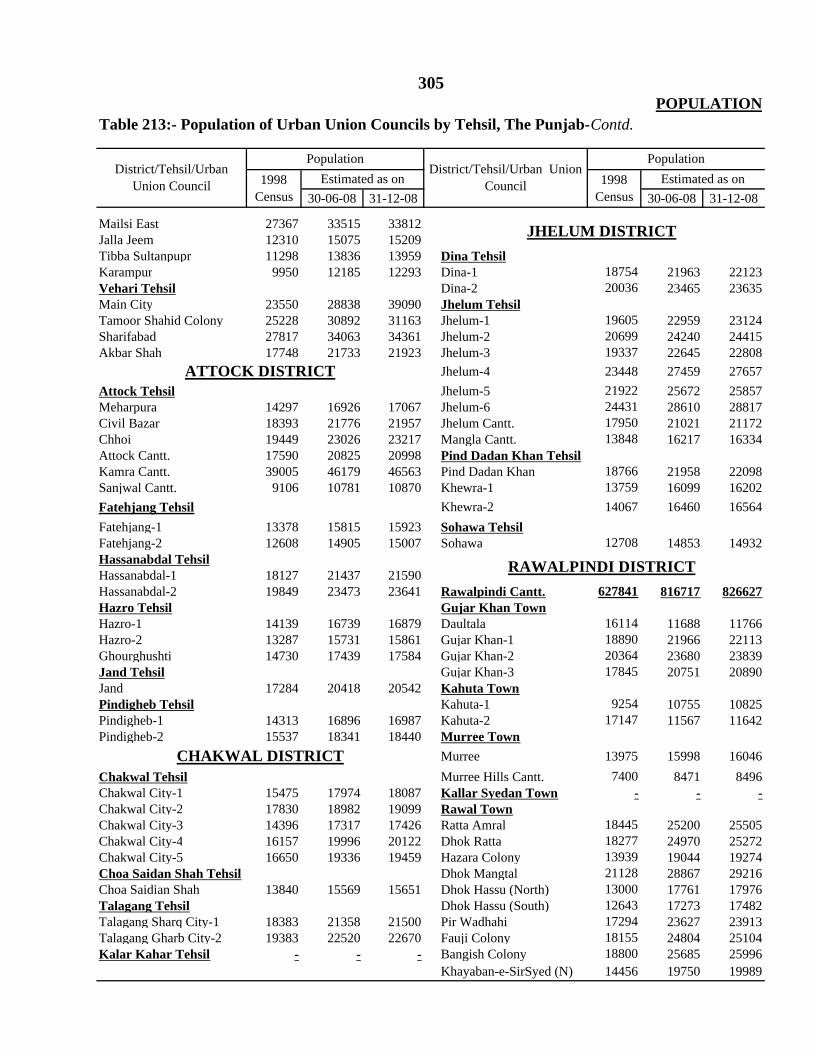
30-06-08 31-12-08 30-06-08 31-12-08
Mailsi East 27367 33515 33812Jalla Jeem 12310 15075 15209Tibba Sultanpupr 11298 13836 13959 Dina TehsilKarampur 9950 12185 12293 Dina-1 18754 21963 22123Vehari Tehsil Dina-2 20036 23465 23635Main City 23550 28838 39090 Jhelum TehsilTamoor Shahid Colony 25228 30892 31163 Jhelum-1 19605 22959 23124Sharifabad 27817 34063 34361 Jhelum-2 20699 24240 24415Akbar Shah 17748 21733 21923 Jhelum-3 19337 22645 22808
Jhelum-4 23448 27459 27657Attock Tehsil Jhelum-5 21922 25672 25857Meharpura 14297 16926 17067 Jhelum-6 24431 28610 28817Civil Bazar 18393 21776 21957 Jhelum Cantt. 17950 21021 21172Chhoi 19449 23026 23217 Mangla Cantt. 13848 16217 16334Attock Cantt. 17590 20825 20998 Pind Dadan Khan TehsilKamra Cantt. 39005 46179 46563 Pind Dadan Khan 18766 21958 22098Sanjwal Cantt. 9106 10781 10870 Khewra-1 13759 16099 16202Fatehjang Tehsil Khewra-2 14067 16460 16564Fatehjang-1 13378 15815 15923 Sohawa TehsilFatehjang-2 12608 14905 15007 Sohawa 12708 14853 14932Hassanabdal TehsilHassanabdal-1 18127 21437 21590Hassanabdal-2 19849 23473 23641 Rawalpindi Cantt. 627841 816717 826627Hazro Tehsil Gujar Khan TownHazro-1 14139 16739 16879 Daultala 16114 11688 11766Hazro-2 13287 15731 15861 Gujar Khan-1 18890 21966 22113Ghourghushti 14730 17439 17584 Gujar Khan-2 20364 23680 23839Jand Tehsil Gujar Khan-3 17845 20751 20890Jand 17284 20418 20542 Kahuta TownPindigheb Tehsil Kahuta-1 9254 10755 10825Pindigheb-1 14313 16896 16987 Kahuta-2 17147 11567 11642Pindigheb-2 15537 18341 18440 Murree Town
Murree 13975 15998 16046Chakwal Tehsil Murree Hills Cantt. 7400 8471 8496Chakwal City-1 15475 17974 18087 Kallar Syedan Town - - -Chakwal City-2 17830 18982 19099 Rawal TownChakwal City-3 14396 17317 17426 Ratta Amral 18445 25200 25505Chakwal City-4 16157 19996 20122 Dhok Ratta 18277 24970 25272Chakwal City-5 16650 19336 19459 Hazara Colony 13939 19044 19274Choa Saidan Shah Tehsil Dhok Mangtal 21128 28867 29216Choa Saidian Shah 13840 15569 15651 Dhok Hassu (North) 13000 17761 17976Talagang Tehsil Dhok Hassu (South) 12643 17273 17482Talagang Sharq City-1 18383 21358 21500 Pir Wadhahi 17294 23627 23913Talagang Gharb City-2 19383 22520 22670 Fauji Colony 18155 24804 25104Kalar Kahar Tehsil - - - Bangish Colony 18800 25685 25996
Khayaban-e-SirSyed (N) 14456 19750 19989
305
District/Tehsil/Urban Union Council 1998
CensusEstimated as on
POPULATIONTable 213:- Population of Urban Union Councils by Tehsil, The Punjab-Contd.
District/Tehsil/Urban Union Council
Population Population1998
CensusEstimated as on
JHELUM DISTRICT
RAWALPINDI DISTRICT
ATTOCK DISTRICT
CHAKWAL DISTRICT

30-06-08 31-12-08 30-06-08 31-12-08
Khayaban-e-SirSyed (S) 15962 21807 22071Dhok Najjo 17814 24338 24632New Katarian 16929 23129 23408Satellite Town (Blk-F) 15677 21418 21677 Bhalwal TehsilSaidpur Scheme 16635 22727 23002 Miani 13008 15059 15131Mohallah Eidgah 14557 19888 20129 Bhera-1 17695 20485 20583Dhok Babu Irfan 19261 26315 26633 Bhera-2 13923 16118 16195Pindora 18482 25250 25556 Bhalwal-1 16251 18813 18903Satellite Town 18242 24922 25224 Bhalwal-2 16771 19415 19508Asghar Mall Scheme 19681 26888 27214 Bhalwal-3 14906 17256 17339Dhok Kala Khan 16530 22583 22857 Bhalwal-4 13595 15739 15814Qayyum Abad 16318 22294 22564 Phularwan 16114 18655 18744Dhok Kashmirian 17193 23489 23774 Kot Momen TehsilDohok Ali Akbar 16398 22403 22674 Kot Momen-1 17561 20329 20425Sadiq Abad 16931 23131 23411 Kot Momen-2 16671 19299 19390Afandi Colony 14964 20444 20691 Lalliani 10334 11963 12019Muslim Town (East) 14597 19943 20184 Sahiwal TehsilMuslim Town (West) 17993 24582 24880 Sahiwal-1 15412 17862 17966Khuram Colony 17185 23478 23762 Sahiwal-2 16607 19247 19360Chah Sultan 19320 26395 26715 Farooqa 18478 21415 21541Dhok Hukam Dad 19615 26798 27123 Sargodha TehsilAmar Pura 18285 24981 25283 Sargodha -1 13494 15665 15783Kartar Pura 15961 21806 22070 Sargodha -2 18681 21687 21851Banni 16152 22067 22334 Sargodha -3 16574 19241 19386Mohallah Imam Bara 16988 23209 23490 Sargodha -4 16792 19494 19641Mohanpura 17579 24017 24307 Sargodha -5 15770 18307 18446Dhoke Dalal 15383 21016 21271 Sargodha -6 16968 19698 19847Ganjmandi 16119 22022 22288 Sargodha -7 14585 16932 17060Waris Khan 14184 19378 19613 Sargodha -8 15397 17874 18009Purana Qilla 14440 19798 19967 Sargodha -9 13528 15704 15823Shah Chan Chiragh 13835 18901 19130 Sargodha-10 16267 18884 19027Millat Colony 17437 23823 24111 Sargodha-11 14954 17360 17491Dhok Khabba 17917 24478 24775 Sargodha-12 17425 20228 20381Dhok Farman Ali 20836 28466 28811 Sargodha-13 19153 22234 22403Chamanzar Colony 21137 28878 29227 Sargodha-14 18283 21224 21385City 19252 25039 25333 Sargodha-15 20098 23331 23508Pothohar Town - - - Sargodha-16 19730 22904 23078Kotli Sattian Town - - - Sargodha-17 16532 19192 19337Taxila Town Sargodha-18 18439 21406 21567Sarai Kala 18800 22009 22239 Sargodha-19 18724 21736 21901Gheela Khurd 15100 17678 17863 Sargodha-20 16188 18792 18935Mohra Shah 15004 17565 17749 Sargodha-21 16480 19131 19276Wah Cantt. 198891 232841 235278 Sargodha-22 16764 19461 19608Taxila Cantt. 22978 26900 27182 Sargodha Cantt. 87614 101710 102479
306POPULATION
Table 213:- Population of Urban Union Councils by Tehsil, The Punjab-Contd.
District/Tehsil/Urban Union Council Estimated as on 1998
CensusEstimated as on
District/Tehsil/Urban Union Council1998
Census
Population Population
SARGODHA DISTRICT
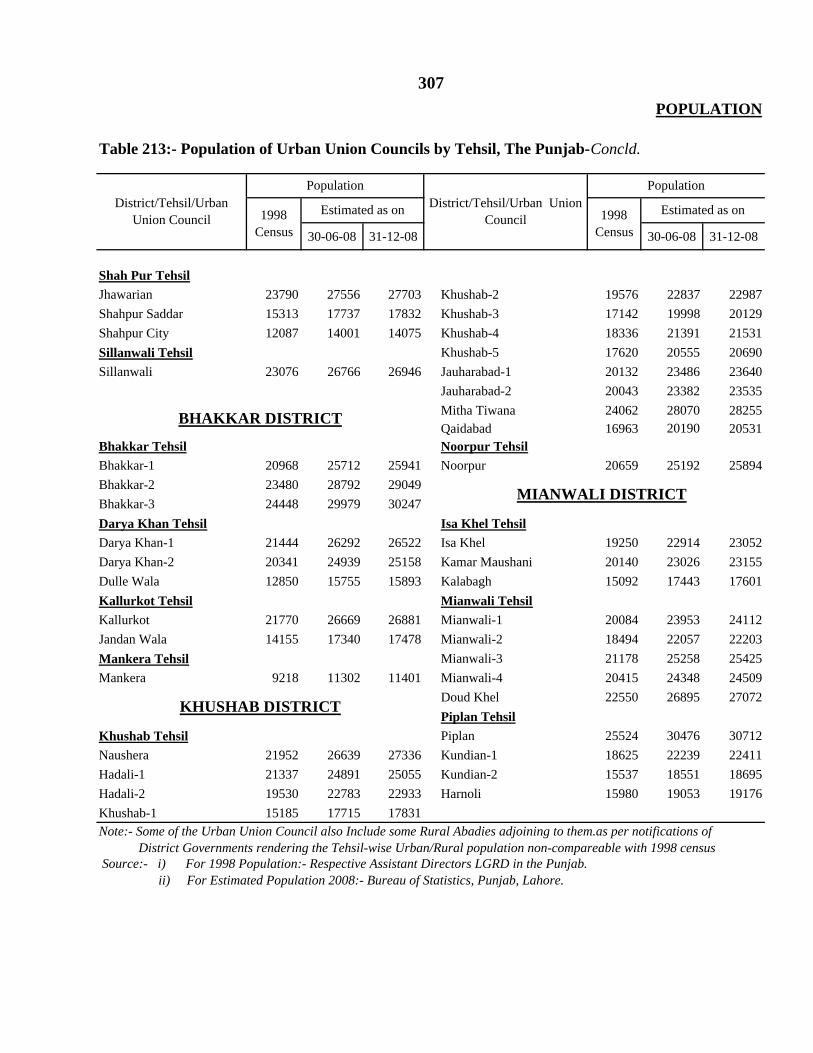
30-06-08 31-12-08 30-06-08 31-12-08
Shah Pur TehsilJhawarian 23790 27556 27703 Khushab-2 19576 22837 22987Shahpur Saddar 15313 17737 17832 Khushab-3 17142 19998 20129Shahpur City 12087 14001 14075 Khushab-4 18336 21391 21531Sillanwali Tehsil Khushab-5 17620 20555 20690Sillanwali 23076 26766 26946 Jauharabad-1 20132 23486 23640
Jauharabad-2 20043 23382 23535Mitha Tiwana 24062 28070 28255Qaidabad 16963 20190 20531
Bhakkar Tehsil Noorpur TehsilBhakkar-1 20968 25712 25941 Noorpur 20659 25192 25894Bhakkar-2 23480 28792 29049Bhakkar-3 24448 29979 30247Darya Khan Tehsil Isa Khel TehsilDarya Khan-1 21444 26292 26522 Isa Khel 19250 22914 23052Darya Khan-2 20341 24939 25158 Kamar Maushani 20140 23026 23155Dulle Wala 12850 15755 15893 Kalabagh 15092 17443 17601Kallurkot Tehsil Mianwali TehsilKallurkot 21770 26669 26881 Mianwali-1 20084 23953 24112Jandan Wala 14155 17340 17478 Mianwali-2 18494 22057 22203Mankera Tehsil Mianwali-3 21178 25258 25425Mankera 9218 11302 11401 Mianwali-4 20415 24348 24509
Doud Khel 22550 26895 27072Piplan Tehsil
Khushab Tehsil Piplan 25524 30476 30712Naushera 21952 26639 27336 Kundian-1 18625 22239 22411Hadali-1 21337 24891 25055 Kundian-2 15537 18551 18695Hadali-2 19530 22783 22933 Harnoli 15980 19053 19176Khushab-1 15185 17715 17831
District Governments rendering the Tehsil-wise Urban/Rural population non-compareable with 1998 census
ii) For Estimated Population 2008:- Bureau of Statistics, Punjab, Lahore. Source:- i) For 1998 Population:- Respective Assistant Directors LGRD in the Punjab.
307POPULATION
1998 Census
Estimated as onDistrict/Tehsil/Urban Union Council
Note:- Some of the Urban Union Council also Include some Rural Abadies adjoining to them.as per notifications of
KHUSHAB DISTRICT
MIANWALI DISTRICT
Table 213:- Population of Urban Union Councils by Tehsil, The Punjab-Concld.
District/Tehsil/Urban Union Council
Population Population
1998 Census
Estimated as on
BHAKKAR DISTRICT

30-06-08 31-12-08 30-06-08 31-12-08
Ahmadpur East Tehsil Chak No.37/BC 26085 33709 34074Mehrab Wala 18582 22897 23105 Sanjar 23779 30729 31062Tibbi Izzat 22319 27582 27833 Chak No.12/BC 22019 28455 28763Khuda Bakhsh Maher 20450 25272 25502 Chak No.24/BC 22642 29260 29577Sukhail 24915 30790 31070 Jalalbad 18695 24159 24421Kotla Mousa Khan 23944 29590 29859 Khanqah Sharif 22898 29590 29911Mud Pir Wah 22022 27215 27462 Mari Sheikh Shijra 20099 25973 26255Kulab 25258 31214 31498 Jamrani Kohna 25517 32975 33332Bukhtiari 26455 32693 32991 Miani 25976 33568 33932Chenab Rasool Pur 25064 30974 31256 Jamal Channar 25754 33281 33642Uch Bukhari 19791 24458 24680 Wahi Hussain 20257 26178 26461Nonari 24547 30335 30611 Goth Mehrab 19105 24689 24956Uch Gillani 23447 28976 29239 Jindu Mission 21910 28314 28620Khurampur 25190 31300 31413 Hasilpur TehsilKhairpur Daha 20769 25666 25900 Hazrat Rangeela Shah 22490 27716 27967Mubarikpur 29032 35878 36204 Jamalpur 22970 28300 28564Mandhal 26734 33038 33338 Shahpur 22441 27656 27906Bhawalpur Ghalwan 19397 23971 24189 Qaimpur 23792 29321 29586Hethaji 25752 31824 32114 Pallah 23230 28628 28887Janoowala 16827 20795 20984 Chak No.58/Fateh 18455 22744 22949Chanigoth 20827 25738 25972 Chak No.79/Fateh 21452 26437 26676Rajor Hoo 19801 24470 24693 Chak No.89/Fateh 22717 27996 28249Kot Khalifa 20945 25881 26119 Chak No. 188/Murad 23553 29026 29289Mahand 22136 27356 27605 Chak No.192/Murad 18717 23066 23275Banwala 22611 27943 28197 Chak No.163/Murad 26401 32536 32831Dhoor Kot 24264 29985 30258 Khairpur Tamewali Ali Kharik 23544 29096 29360 Guddan 20831 25433 25653Bahawalpur City Tehsil Israni 24488 29898 30157Jhangiwali 19532 28819 29129 Behli 20020 24443 24654Raman 19332 28524 28830 Kotla Qaim Khan 22811 27850 28092Khanuwali 20042 29572 29889 Syed Imam Shah 25558 31204 31474
Inayiti 18372 22431 22625Jhandani 25980 31720 31994
Chan No.4/B.C 23702 30629 30961
308
POPULATION
Table 214:- Population of Rural Union Councils by Tehsil, The Punjab
District/Tehsil/Rural Union Council
Population Population
1998 Census
Estimated as on 1998 Census
Estimated as onDistrict/Tehsil/Rural Union Council
BAHAWALPUR DISTRICT
Bahawalpur Sadar Tehsil

30-06-08 31-12-08 30-06-08 31-12-08
Yazman Tehsil Kishan Garh 19682 23355 23526Chak No.1/DNB 19529 24776 25026 Sawai Wala 16770 19899 20045Chak No.17/DNB 21485 27258 27533 Korian Wali 14935 17722 17852Chak No.36/DNB 19327 24520 24768 Chishtian TehsilChak No.22/DNB 27004 34260 34606 Chak No.201/M 17824 21541 21713Chak No.47/DNB 27272 34600 34949 Chak No.177/M 20242 24463 24659Chak No.98/DNB 20806 26396 26663 Chak No.169/M 14979 18103 18247Chak No.44/DB 25150 31908 32230 Chak No.173/M 18079 21849 22024Chak No.57/DB 26849 34063 34407 Chak No.128/M 18264 22073 22249Chak No.67/DB 22882 29030 29323 Chak No.98/F 18102 21877 22052Chak No.68/DB 22918 29076 29369 Chak No.95/F 18285 22098 22275Chak No.88/DB 15672 19883 20084 Chak No.52/F 20062 24246 24439Chak No.106/DB 23746 30126 30430 Chak No.48/F 15407 18620 18769Chak No.117/DB 26537 33667 34007 Chak No.42/F 18501 22359 22538Chananpir 20076 25470 25727 Chak No.118/M 16339 19747 19904Derawer 19466 24696 24946 Chak No.28/G 17830 21548 21720Merana 18758 23798 24038 Chak No.35/F 14504 17529 17669Chak No.75/DB 23094 29299 29595 Chak No.7/G 18228 22029 22205
Mari Shouqe Shah 17665 21349 21519Fatani 16248 19637 19793
Bahawalnagar Tehsil Moharan Sharif 16557 20010 20170Kalia Shah 17263 20484 20635 Mehta Jhedu 17456 21096 21265Qasim Ka 16963 20128 20276 Shaher Fareed 17221 20812 20979Sanetteka 13498 16017 16134 Purani Chishtian 13627 16469 16600Takhat Mohal Hittar 19763 23451 23623 Chak No.7/FW 14733 17806 17948Noor Sar 20452 24268 24446 Shali Ghurbi 18163 21951 22126Pir Skandar 17734 21043 21198 Dullah Bhedera. 17667 21351 21522Musa Bhotta 19446 23075 23244 Fortabbas TehsilRojhan Wali 18102 21480 21637 Chak No.327/HR 21235 25040 25218Toba Quallandar Shah 18736 22232 22395 Chak No.319/HR 16625 19604 19743Rabnawaz Pura 17232 20448 20598 Chak No.311/HR 17521 20661 20807Muhammad Pur 14376 17059 17184 Chak No.304/HR 17421 20543 20688Islam Pura 14856 17628 17757 Chak No.281/HR 18412 21711 21865Malik Pura 21319 25297 25483 Chak No.264/HR 15274 18011 18139Mohar Wali 17919 21263 21419 Chak No.260/HR 16848 19867 20008Nathay Wala 17600 20884 21037 Chak No.209/9R 21300 25117 25295Jand Wala 19306 22909 23077 Chak No.199/8R 18197 21458 21610Khetranwala 15712 18644 18781 Chak No.167/7R 19655 23177 23341Bara Sajwar Khan 17768 21084 21238 Chak No.185/7R 21411 25248 25427Khattan 13781 16353 16473 Chak No.176/7R 17113 20180 20323Donga Akkuka 10310 12234 12324 Chak No.226/9R 15033 17727 17852Sunda 14245 16903 17027 Chak No.289/HR 14914 17587 17711
Population Population
1998 Census
District/Tehsil/Rural Union Council
POPULATION
Table 214:- Population of Rural Union Councils by Tehsil, The Punjab-Contd.
309
District/Tehsil/Rural Union Council
BAHAWALNAGAR DISTRICT
Estimated as on 1998 Census
Estimated as on

30-06-08 31-12-08 30-06-08 31-12-08
Haroonabad TehsilChak No.58/4R 20646 24538 24719 Chachran Sharif 26331 32499 32798Chak No.129/6R 19600 23295 23467 Mueenabad 25247 31161 31448Chak No.432/6R 16969 20168 20317 Qadir Pur 29715 36675 37013Chak No.132/6R 20293 24118 24296 Jajja Abbasian 26608 32841 33143Chak No.42/3R 19300 22938 23108 Chandia 29872 36869 37208Chak No.30/3R 19328 22971 23141 Jhoran 27981 34535 34853Chak No.142/6R 14269 16959 17084 Nawan Kot 26906 33208 33514Chak No.164/7R 21149 25136 25321 Azim Shah 22867 28223 28483Chak No.152/2L 16028 19049 19190 Jetha Bhutta 27871 34400 34716Chak No.82/5R 14721 17496 17625 Neel Garh 23793 29366 29637Chak No.94/6R 14386 17098 17224 MasiAllah Bachaya 24850 30671 30953Chak No.101/6R 15344 18236 18371 Mud Bhoora 23198 28632 28895Chak No.86/5R 16128 19168 19310 Sehja 21041 25970 26209Chak No.23/3R 15718 18681 18819 Bagho Bahar 24735 30529 30810Chak No.15/1R 15881 18875 19014 Chak No.45/P 16332 20158 20343Chak No.105/6R 15190 18053 18187 Latki 23307 28766 29031Chak No.109/6R 18107 21520 21679 Islam Garh 4556 5623 5675Minchinabad Tehsil Liaqatpur TehsilHasil Saru 17690 21647 21830 Muhammad Dahar 29734 38420 38839Mut Wala 15059 18428 18584 Tranda Gurgoi 31359 40520 40961Qaimpur 15950 19518 19683 Chak No.46/Abbasia 23535 30410 30741Giria Abad 18988 23235 23432 Chak No.10/Abbasia 25498 32947 33305Ahmad Pur 17219 21071 21249 Chak No.42/Abbasia 27823 35951 36342Hassan wala 17604 21542 21724 Chak No.68/Abbasia 23859 30829 31165Pir Ghar 20292 24831 25042 Jhok Ghulab Shah 24334 31443 31785Rohana 13856 16955 17099 Gul Muhammad Langah 25320 32717 33073Shahbaz pur (Moti pur) 17279 21144 21323 Trinda Muhammad 29124 37632 38042Khola Mirzeka 18815 23024 23219 Deshti 27065 34972 35352Bunga Akbar (Mari Niha) 18952 23191 23388 Aminabad 27677 35762 36152Fidai Shah 18231 22309 22498 Janpur 30396 39276 39703Said Ali 18122 22176 22364 Ghooka 26685 34481 34856Muhammadpur Sansaran 17209 21058 21237 Hayat Lar 24337 31447 31789Kabootri 15635 19132 19294 Allahabad 26460 34190 34562Laleka 19357 23687 23888 Khan Bela 25781 33313 33675Munian wala 18581 22737 22930 Nulla Musani 16454 21261 21492
Chanjni 24168 31228 31568Pacca Laran 28526 36859 37261
Khan Pur Tehsil Shedani Sharif 27320 35301 35685Dinpur Sharif 22317 27545 27798 Zafar Abad 22838 29510 29831Chari Ikhtiar Khan 25523 31502 31791 Dufli Kabir Khan 26912 34774 35152Ghena Lar atJangi 25538 31520 31810 Ahmad Ali Lar 24355 31470 31812Kotla Pathan 23360 28832 29097 Chak No.178/7-R 28809 37225 37630Ghazi Pur 25246 31160 31446 Other Rural 37758 48788 49319
RAHIM YAR KHAN DISTRICT
Table 214:- Population of Rural Union Councils by Tehsil, The Punjab-Contd.
District/Tehsil/Rural Union Council
PopulationDistrict/Tehsil/Rural
Union Council
Population
1998 Census
Estimated as on 1998 Census
Estimated as on
310POPULATION
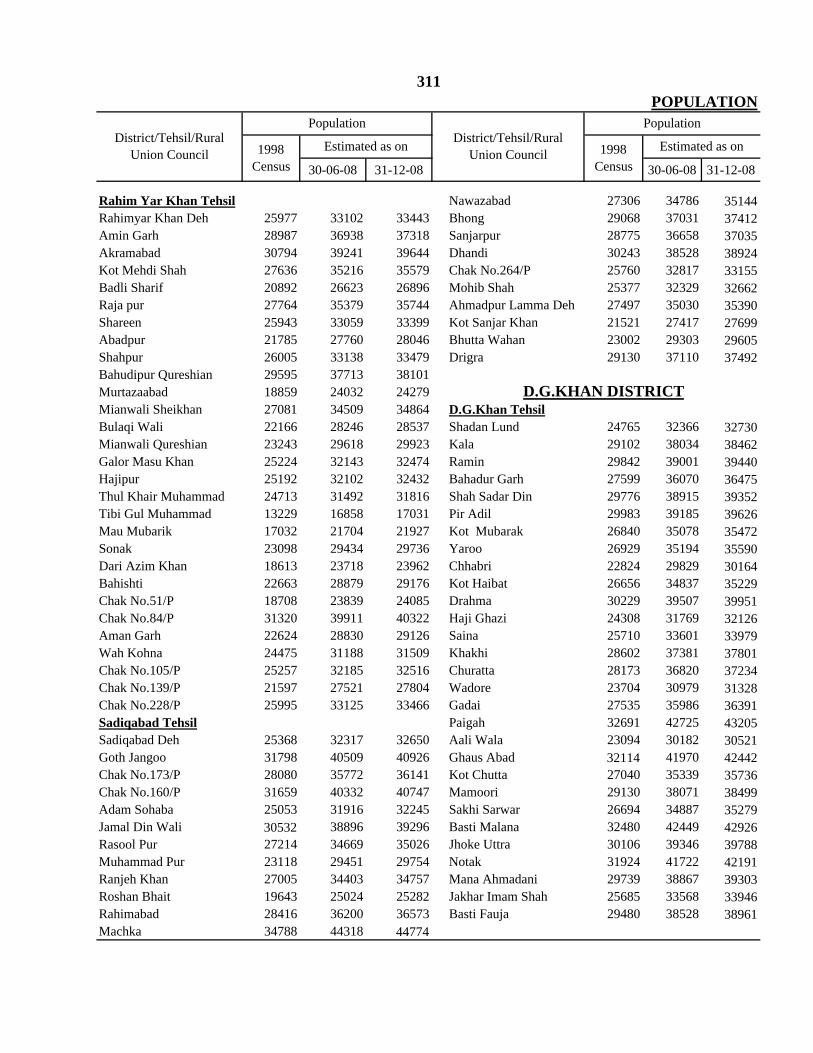
30-06-08 31-12-08 30-06-08 31-12-08
Rahim Yar Khan Tehsil Nawazabad 27306 34786 35144Rahimyar Khan Deh 25977 33102 33443 Bhong 29068 37031 37412Amin Garh 28987 36938 37318 Sanjarpur 28775 36658 37035Akramabad 30794 39241 39644 Dhandi 30243 38528 38924Kot Mehdi Shah 27636 35216 35579 Chak No.264/P 25760 32817 33155Badli Sharif 20892 26623 26896 Mohib Shah 25377 32329 32662Raja pur 27764 35379 35744 Ahmadpur Lamma Deh 27497 35030 35390Shareen 25943 33059 33399 Kot Sanjar Khan 21521 27417 27699Abadpur 21785 27760 28046 Bhutta Wahan 23002 29303 29605Shahpur 26005 33138 33479 Drigra 29130 37110 37492Bahudipur Qureshian 29595 37713 38101Murtazaabad 18859 24032 24279Mianwali Sheikhan 27081 34509 34864 D.G.Khan TehsilBulaqi Wali 22166 28246 28537 Shadan Lund 24765 32366 32730Mianwali Qureshian 23243 29618 29923 Kala 29102 38034 38462Galor Masu Khan 25224 32143 32474 Ramin 29842 39001 39440Hajipur 25192 32102 32432 Bahadur Garh 27599 36070 36475Thul Khair Muhammad 24713 31492 31816 Shah Sadar Din 29776 38915 39352Tibi Gul Muhammad 13229 16858 17031 Pir Adil 29983 39185 39626Mau Mubarik 17032 21704 21927 Kot Mubarak 26840 35078 35472Sonak 23098 29434 29736 Yaroo 26929 35194 35590Dari Azim Khan 18613 23718 23962 Chhabri 22824 29829 30164Bahishti 22663 28879 29176 Kot Haibat 26656 34837 35229Chak No.51/P 18708 23839 24085 Drahma 30229 39507 39951Chak No.84/P 31320 39911 40322 Haji Ghazi 24308 31769 32126Aman Garh 22624 28830 29126 Saina 25710 33601 33979Wah Kohna 24475 31188 31509 Khakhi 28602 37381 37801Chak No.105/P 25257 32185 32516 Churatta 28173 36820 37234Chak No.139/P 21597 27521 27804 Wadore 23704 30979 31328Chak No.228/P 25995 33125 33466 Gadai 27535 35986 36391Sadiqabad Tehsil Paigah 32691 42725 43205Sadiqabad Deh 25368 32317 32650 Aali Wala 23094 30182 30521Goth Jangoo 31798 40509 40926 Ghaus Abad 32114 41970 42442Chak No.173/P 28080 35772 36141 Kot Chutta 27040 35339 35736Chak No.160/P 31659 40332 40747 Mamoori 29130 38071 38499Adam Sohaba 25053 31916 32245 Sakhi Sarwar 26694 34887 35279Jamal Din Wali 30532 38896 39296 Basti Malana 32480 42449 42926Rasool Pur 27214 34669 35026 Jhoke Uttra 30106 39346 39788Muhammad Pur 23118 29451 29754 Notak 31924 41722 42191Ranjeh Khan 27005 34403 34757 Mana Ahmadani 29739 38867 39303Roshan Bhait 19643 25024 25282 Jakhar Imam Shah 25685 33568 33946Rahimabad 28416 36200 36573 Basti Fauja 29480 38528 38961Machka 34788 44318 44774
311
Population Population
1998 Census
Estimated as on 1998 Census
Estimated as onDistrict/Tehsil/Rural Union Council
District/Tehsil/Rural Union Council
D.G.KHAN DISTRICT
POPULATION

30-06-08 31-12-08 30-06-08 31-12-08
Mutafariq Chahan 29812 38962 39400 Fateh Pur (Deh) 31365 39020 39385Choti Zerine 30072 39302 39744 Noshera Thal Kalan 29328 36486 36827Nawan 27253 35618 36018 Layyah TehsilDchoti Bala 32386 42326 42802 Lohanch Nasheb 23180 29502 29802Darkhast Jamal Khan 28417 37139 37556 Kotla Haji Shah 28320 36043 36411Taunsa Tehsil Layyah Thal Jandi 26541 33779 34123Lakhani 26233 32374 32668 Mandi Town 28301 36019 36386Vehoa 27502 33940 34248 Tail Indus 26851 34174 34522Jaluwali 25839 31888 32177 Basti Shadu Khan 28530 36311 36681Fateh Khan 29346 36216 36544 Chowk Azam 28442 36199 36567Tibbi Aisrani 25245 31155 31437 Layyah Thal Kalan 24336 30973 31288Morejhangi 28349 34986 35303 Mirhan 29983 38160 38549Nari Shumali 27557 34008 34316 Chak No.172/TDA 25995 33084 33421Kot Qaisrani 25599 31592 31878 Pahar Pur 24772 31528 31849Mangrotha 28178 34775 35090 Bait Swasava Shumali 22399 28508 28798Sokar 28915 35684 36008 Kot Sultan 25365 32282 32611Makwal Kalan 29145 28383 36294 Bakhri Ahmad Khan 21298 27106 27383Hero Sharqi 25479 31444 31729 Chak No.164-A/TDA 21319 27133 27410Tribal Area Ladhana 26727 34016 34363Tuman Leghari 26145 31624 31878 Jaman Shah 23590 30023 30329Barthi 28842 34886 35166 Sarishta Thal 24052 30611 30923Faziz Katchh 20358 24624 24822 Jakhar 25181 32048 32375Mubaraki 23466 28383 28611Tuman Qaisarani 27387 33126 33392
Ali Pur TehsilMud wala 25334 32286 32620
Choubara Tehsil Yakey Wali 26035 33180 33523Aulakh Thal Kalan 22399 28372 28657 Ghalwan 25662 32704 33042Jamal Chappri 23276 29483 29779 Bait Mulan Wali 31095 39628 40038Nawan Kot 26274 33280 33614 Baz wala 24170 30803 31121Khairay wala 20947 26533 26799 Seet Pur 33031 42096 42531Choubara 20845 26404 26669 Sultan Pur 28636 36495 36872Sher Garh 23322 29541 29838 Langer Wah 26940 34333 34688Rafique Abad 23947 30333 30637 Khan Garh Dooma 29227 37248 37633Karor Tehshil Murad Pur Janubi 25051 31926 32256Shah Pur 28549 35517 35849 Khan Pur Dadaat 26495 33766 34115Sahu Wala 26054 32413 32716 Fateh Pur Janubi 33127 42218 42654Baseera 21854 27188 27442 Ali Wali 26185 33371 33716Garay Wala 25183 31329 31622 Jotoi TehsilKaror Thal Jandi 27967 34793 35118 Binda Ishaaq 30968 40859 41336Wara Sehran 28497 35452 35784 Damar Wala 24015 31685 32055Samtia 30626 38101 38457 Bair Band 28907 38140 38585Tibbi 23156 28808 29077 Jhalaren 23982 31642 32011Chak No.98/ML 27828 34620 34943 Shahbaz Pur 28670 37827 38268Shaukat Abad 30149 37507 37858 Sabay Wala 23242 30665 31023
312POPULATION
Table 214:- Population of Rural Union Councils by Tehsil, The Punjab-Contd.
District/Tehsil/Rural Union Council
Population Population
1998 Census
Estimated as on 1998 Census
Estimated as onDistrict/Tehsil/Rural Union Council
LAYYAH DISTRICT
MUZAFFAR GARH DISTRICT

30-06-08 31-12-08 30-06-08 31-12-08
Jughi Wala 24058 31742 32112 Ghazanffar Garh 33047 41872 42297Ram Pur 27765 36633 37060 Brahim Wala 26348 33384 33723Jatoi Shumali 32090 42339 42833 Manka Bhutta 30244 38321 38709Vains 24769 32680 33061 Rohillanwali 24258 30736 31048Kotla Gamoon 24401 32194 32570 Ganga 23504 29781 30083Beelay Wala 32165 42438 42933 Aluday Wali 23800 30156 30461Bit Meer Hazaar 26569 35055 35464 Marrah Sharqi 28238 35779 36142Bakaini 22489 29672 30018 Utra Sandila 24561 31120 31435Kot Addu Tehsil Manik Pur 25016 31696 32018Pattan Kot Addu 28450 37006 37418 Dareen 29248 37059 37434Bait Qaim Wala 23772 30921 31265 Usman Koria 27740 35148 35504Hanjrani 28847 37523 37940 Basti Kharak 31086 39387 39787Ehsanpur 26017 33842 34218 Shah Jamal 28693 36355 36724Mir Pur Bhaga 30633 39846 40289 Ahmad Mohana 28167 35689 36051Chak No.632/TDA 26507 34479 34862 Sharif Chajra 25406 32191 32517Pattal Munda 22705 29533 29862 Nohan Wali 26701 33831 34174Chak No.547/TDA 31090 40440 40890 Kram Dad Qureshi 29467 37336 37715Chak No.565/TDA 28239 36732 37140 Wan Pitafi 27548 34905 35258Shadi Khan Munda 27940 36343 36747 Basira 29957 37957 38342Patti Ghulam Ali 31013 40340 40789 Gul Wala 27259 34538 34889Wandhar 33409 43457 43940Kashif Abad 26788 34844 35232Mehmood Kot 26672 34694 35079 Jampur TehsilBudh 30523 39703 40144 Kot Tahir 27948 35763 36136Ghazi Ghatt 29630 38541 38970 Basti Rindan 29375 37589 37981Gujrat 26252 34147 34527 Totra Wala 26762 34245 34603Allurid 28282 36788 37197 Kotla Dewan 25981 33246 33593Thatta Gurmani 29816 38783 39215 Kotla Mughlan 32774 41938 42376Shakh Ummar 26796 34855 35243 Muhammad Pur 28715 36744 37128Dogrta Kalsra 31154 40523 40974 Bokhara 24910 31875 32208Mahha 30039 39073 39508 Noorpur Munju Wala 21222 27156 27440Snawan 27084 35229 35621 Hajipur 24043 30766 31087Muzaffar Garh Tehsil Wah Leashari 23604 30204 30519Chak Frazi 24711 31310 31627 Harrand 24634 31522 31851Rang Pur 28461 36061 36427 Tibbi Lundan 22619 28944 29246Murad Abad 30613 38788 39181 Tul Shumali 21145 27058 27340Khan Pur Shumali 30997 39275 39673 Noshahera 23403 29947 30260Lutkaran 24485 31024 31338 Burey Wala 26808 34304 34662Taliri 29556 37449 37828 Allahabad 24225 30999 31322Jaggat Pur 32972 41777 42201 Rajanpur TehsilThatta Qureshi 28935 36662 37034 Bakhsh Sherqi 27816 36715 37138Garay Wain 30625 38803 39197 Sikhani Wala 24818 32758 33136Umar Pur Janobi 30920 39177 39574 Shahan Wala 26128 34487 34885
313
District/Tehsil/Rural Union CouncilEstimated as on 1998
CensusEstimated as on
RAJANPUR DISTRICT
POPULATION
Table 214:- Population of Rural Union Councils by Tehsil, The Punjab-Contd.
District/Tehsil/Rural Union Council
Population Population
1998 Census

30-06-08 31-12-08 30-06-08 31-12-08
Shikar Pur 20913 27604 27922 Chak No.61/RB 20978 23622 23747Noor Pur 29170 38502 38946 Chak No.91/RB 18441 20766 20875Wang 24233 31986 32354 Chak No.97/RB 20766 23384 23507Murghai 22577 29800 30143 Chak No.97/GB 14771 16633 16721Kotla Naseer 26471 34940 35342 Chak No.101/GB 18204 20499 20607Fateh Pur 22933 30270 30619 Chak No.63/GB 19650 22127 22244Jahanpur 30022 39627 40084 Chak No.106/GB 21060 23715 23840Kotla Easan 22628 29867 30212 Chak No.205/RB 21816 24566 24696Rakh Fazil Pur 23824 31446 31808 Chak No.229/RB 18261 20563 20672Rojhan Tehsil Chak No.112/GB 22995 25894 26031Subzani 20803 25745 25979 Chak No.73/GB 17939 20200 20307Umer Kot 25690 31793 32082 Chak No.67/GB 19845 22347 22465Miran Pur 22240 27523 27774 Chak No.122/GB 15345 17279 17371Kacha Mian Wali 25628 31716 20901 Chak No.58/GB 16622 18717 18816Rojhan Sharqi 23847 29512 29781 Chak No.235/GB 17458 19659 19763Soan Maini 32593 40335 40703 Chak No.657/GB 20721 23333 23456Shah Wali 29895 36997 37333 Chak No.591/GB 17131 19291 19392Tribal Area 14051 11738 11640 Chak No.562/GB 16984 19125 19226
Chak No.566/GB 15619 17588 17681Chak No.569/GB 14089 15865 15949
Chak Jhumra Town Chak No.644/GB 15352 17287 17379Chak No.19/JB 15959 16954 17006 Chak No.647/GB 17578 19794 19898Chak No.44/JB 17641 18740 18799 Chak No.631/GB 22097 24883 25014Chak No.136/RB 20201 21460 21527 Chak No.648/GB 15778 17767 17861Chak No.127/RB 20269 21532 21599 Chak No239/GB 22808 25683 25819Chak No.139/RB 15176 16122 16172 Chak No.147/GB 18923 21308 21421Chak No.146/RB 14484 15387 15434 Chak No.240/GB 16035 18056 18152Chak No.155/RB 14812 15735 15784 Chak No.353/GB 17821 20067 20174Chak No.156/RB 13924 14792 14838 Chak No.378/GB 17856 20107 20213Chak No.106/RB 22482 23883 23957 Chak No.383/GB 19581 22049 22166Chak No.20/JB 16875 17927 17982 Chak No.363/GB 15473 17424 17516Chak No.159/RB 16343 17362 17415 Chak No.273/GB 20207 22754 22875Chak No.186/RB 14753 15672 15721 Chak No.282/GB 17420 19616 19720Chak No.189/RB 18776 19946 20008 Chak No.22/GB 18991 21385 21498Jaranwala Town Chak No.55/GB 21295 23979 24106Chak No.54/RB 16732 18841 18941 Chak No.115/GB 16720 18828 18927Chak No.58/RB 14547 16381 16467 Chak No.32/GB 20578 23172 23295Chak No.151/RB 15993 18009 18104 Chak No.39/GB 20773 23392 23515Chak No.76/RB 22143 24934 25066 Chak No.37/GB 23186 26109 26247Chak No.200/RB 16622 18717 18816 Chak No.283/GB 16007 18025 18120Chak No.106/RB 17599 19818 19922 Chak No.364/GB 19538 22001 22117Chak No.103/RB 15531 17489 17581 Chak No.434/GB 15143 17052 17142Chak No.68/RB 20679 23286 23409
Table 214:- Population of Rural Union Councils by Tehsil, The Punjab-Contd.
District/Tehsil/Rural Union Council
Population Population
1998 Census
Estimated as on 1998 Census
Estimated as onDistrict/Tehsil/Rural Union Council
POPULATION314
FAISALABAD CITY DISTRICT

30-06-08 31-12-08 30-06-08 31-12-08
Jinnah Town Waseeran 82/GB 20325 29452 29750Baoo Wala.219/RB 15658 22030 22254 Khanooana 239/RB 21386 30989 31303Chak No.220/RB 25404 35743 36105 Phatak Wali 209/RB 20436 29613 29913Pensra 275/JB 20235 28470 28759 Nathri 215/RB 26325 38146 38533Jappal 73/JB 21246 29893 30196 Malkhanwala 226/RB 18201 26374 26641Thiriwala 74/JB 20890 29392 29690 Iqbal TownSadhar 67/JB 18502 26032 26296 Chak No.222/RB 17394 24679 24929Dhandra 66/JB 23424 32957 33291 Farala 258/RB 21892 31061 31376Chohla 61/JB 21719 30558 30868 Pathanwala 268/RB 20099 28517 28806Leelan 64/JB 16053 22586 22815 Naggan 260/RB 24073 34155 34501Gardna 38/JB 20871 29365 29663 Gokhoowal 275/RB 16168 22939 23172Mazara 41/JB 18049 25394 25652 Majiwal 270/RB 16825 23872 24114Lyallpur Town Sharshmir 84/JB 15614 22153 22378Samana 119/JB 17311 22041 22265 Badala 256/RB 20462 29032 29326Pathanwala 34/JB 16866 21475 21692 Jahangir 257/RB 14369 20387 20594Chak No.30/JB 18923 2494 24338 Jahangir Kalan 248/RB 15869 22515 22743Shahbaz Pur 29/JB 16550 21072 21286 Miani 247/RB 15127 21462 21680Khud Pur 27/JB 14676 18686 18876 Rasal-e-Wala 231/RB 18342 26024 26288Nathoo Chak 29/JB 21759 27705 27986 Abbas Pur 245/RB 15838 22471 22699Mullan Pur 9/JB 20400 25974 26238 Mullan Pur 78/RB 16237 23037 23271Kurri Bla 100/JB 15699 19989 20191 Pansera 82/JB 14256 20227 20432Kamalpur 6/JB 20783 26462 26730 Sammundri TownRamdewali 2/JB 23512 29937 30240 Chak No.198/GB 19654 21823 21925Thatiala 53/JB 22733 28945 29238 Chak No.193/GB 18061 20054 20148Dholanwal 113/JB 20885 26592 26861 Chak No.201/GB 22434 24910 25027Dial Garh 115/JB 15680 19965 20167 Chak No.205/GB 14070 15623 15696Karari 195/RB 21722 27658 27938 Chak No.214/GB 15838 17586 17668Dhonala 117/JB 18891 24053 24297 Chak No.203/GB 15796 17539 17622Munia Wala 197/RB 24818 31600 31920 Chak No.484/GB 16900 18765 18853Chak No.198/RB 16730 21302 21517 Chak No.479/GB 21424 23788 23900Madina Town Chak No.475/GB 16291 18089 18174Chak No.204/RB 20368 29514 29813 Chak No.226/GB 19882 22076 22180Chak No.202/RB 23524 34087 34433 Chak No.225/GB 19130 21241 21341Garala .91/GB 19856 28772 29064 Chak No.47/GB 16926 18794 18882Dalowal .248/RB 16702 24202 24447 Chak No.228/GB 20167 22393 22498Dasuha 249/RB 20976 30395 30703
315
District/Tehsil/Rural Union Council
POPULATIONTable 214:- Population of Rural Union Councils by Tehsil, The Punjab-Contd.
District/Tehsil/Rural Union Council
Population Population
1998 Census
Estimated as on 1998 Census
Estimated as on
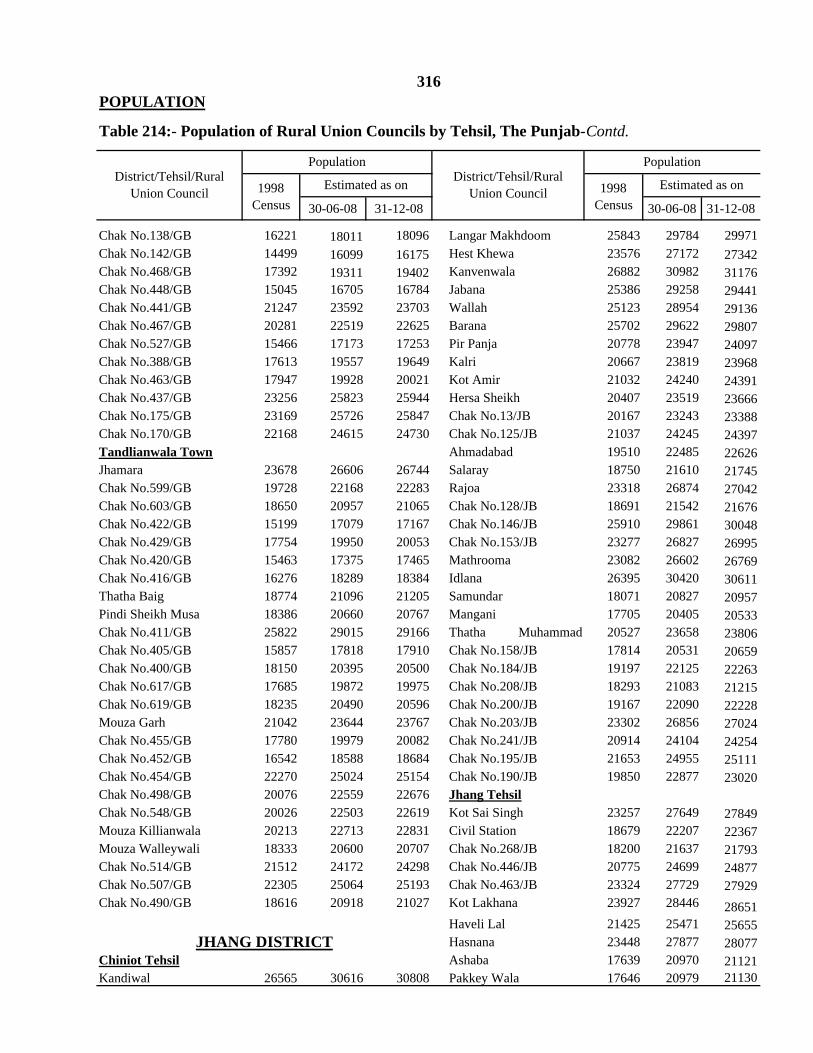
30-06-08 31-12-08 30-06-08 31-12-08
Chak No.138/GB 16221 18011 18096 Langar Makhdoom 25843 29784 29971Chak No.142/GB 14499 16099 16175 Hest Khewa 23576 27172 27342Chak No.468/GB 17392 19311 19402 Kanvenwala 26882 30982 31176Chak No.448/GB 15045 16705 16784 Jabana 25386 29258 29441Chak No.441/GB 21247 23592 23703 Wallah 25123 28954 29136Chak No.467/GB 20281 22519 22625 Barana 25702 29622 29807Chak No.527/GB 15466 17173 17253 Pir Panja 20778 23947 24097Chak No.388/GB 17613 19557 19649 Kalri 20667 23819 23968Chak No.463/GB 17947 19928 20021 Kot Amir 21032 24240 24391Chak No.437/GB 23256 25823 25944 Hersa Sheikh 20407 23519 23666Chak No.175/GB 23169 25726 25847 Chak No.13/JB 20167 23243 23388Chak No.170/GB 22168 24615 24730 Chak No.125/JB 21037 24245 24397Tandlianwala Town Ahmadabad 19510 22485 22626Jhamara 23678 26606 26744 Salaray 18750 21610 21745Chak No.599/GB 19728 22168 22283 Rajoa 23318 26874 27042Chak No.603/GB 18650 20957 21065 Chak No.128/JB 18691 21542 21676Chak No.422/GB 15199 17079 17167 Chak No.146/JB 25910 29861 30048Chak No.429/GB 17754 19950 20053 Chak No.153/JB 23277 26827 26995Chak No.420/GB 15463 17375 17465 Mathrooma 23082 26602 26769Chak No.416/GB 16276 18289 18384 Idlana 26395 30420 30611Thatha Baig 18774 21096 21205 Samundar 18071 20827 20957Pindi Sheikh Musa 18386 20660 20767 Mangani 17705 20405 20533Chak No.411/GB 25822 29015 29166 Thatha Muhammad 20527 23658 23806Chak No.405/GB 15857 17818 17910 Chak No.158/JB 17814 20531 20659Chak No.400/GB 18150 20395 20500 Chak No.184/JB 19197 22125 22263Chak No.617/GB 17685 19872 19975 Chak No.208/JB 18293 21083 21215Chak No.619/GB 18235 20490 20596 Chak No.200/JB 19167 22090 22228Mouza Garh 21042 23644 23767 Chak No.203/JB 23302 26856 27024Chak No.455/GB 17780 19979 20082 Chak No.241/JB 20914 24104 24254Chak No.452/GB 16542 18588 18684 Chak No.195/JB 21653 24955 25111Chak No.454/GB 22270 25024 25154 Chak No.190/JB 19850 22877 23020Chak No.498/GB 20076 22559 22676 Jhang TehsilChak No.548/GB 20026 22503 22619 Kot Sai Singh 23257 27649 27849Mouza Killianwala 20213 22713 22831 Civil Station 18679 22207 22367Mouza Walleywali 18333 20600 20707 Chak No.268/JB 18200 21637 21793Chak No.514/GB 21512 24172 24298 Chak No.446/JB 20775 24699 24877Chak No.507/GB 22305 25064 25193 Chak No.463/JB 23324 27729 27929Chak No.490/GB 18616 20918 21027 Kot Lakhana 23927 28446 28651
Haveli Lal 21425 25471 25655Hasnana 23448 27877 28077
Chiniot Tehsil Ashaba 17639 20970 21121Kandiwal 26565 30616 30808 Pakkey Wala 17646 20979 21130
316
District/Tehsil/Rural Union Council
POPULATION
Table 214:- Population of Rural Union Councils by Tehsil, The Punjab-Contd.
District/Tehsil/Rural Union Council
Population Population
1998 Census
Estimated as on 1998 Census
Estimated as on
JHANG DISTRICT

30-06-08 31-12-08 30-06-08 31-12-08
Sultan Pur 21741 25847 26033 Kakki Nau 24535 29058 29266Mukhiana 23123 27490 27688 Dab Kalan 20264 24000 24172Sheikh Ghuhar 23125 27493 27690 Binda Surbana 23391 27704 27902Satiana 20525 24401 24577 Ahmad Pur Sial TehsilChak No.159/JB 25030 29757 29972 Samandoana 21942 25991 26177Sultan Pakhra 19769 23503 23672 Bangla Yasmeen 23158 27431 27627Chak No.250/JB 24251 28831 29039 Pir Abdul Rehman 22322 26441 26630Mochiwala 20678 24583 24760 Ranjeet Kot 21146 25048 25227Chak No.220/JB 23303 27704 27904 Hazart Sultan Bahu 25106 29739 29951Malhoana 23896 28409 28614 Jaivain 21168 25074 25253Athara Hazari 22996 27339 27536 Gadra 21514 25484 25666Rashid Pur 18590 22101 22260 Hasu Bulail 24357 28851 29058Kot Murad 25625 30465 30684 Kot Bahadar Shah 18568 21994 22151Rodu Sultan 22143 26325 26515 Kot Mapal 26122 30942 31163Uch Gul Imam 20754 24674 24851 Sharif Abad 24714 292741 29484Wasu Astana 24716 29384 29596Dosa 24537 29171 29381Kot Shakir 23751 28237 28440 Gojra TehsilMari Shah Sakhird 23721 28201 28404 Chak No.334/JB 16774 19311 19429Chak Rasul Pur 20955 24913 25092 Chak No.278/JB 19306 22225 22362Pabbar Wala 21591 25669 25854 Chak No. 93/JB 22849 26304 26466Pir Kot Sidhana 19752 23482 23652 Chak No.367/JB 24147 27798 27970Haveli Sheikh Raju 21407 25450 25633 Chak No. 154/JB 21870 25177 25332Hassan Khan 20165 23973 24146 Chak No.178/JB 20024 23052 23194Shah Jewna 20495 24360 24541 Chak No.161/JB 20942 24109 24257Ratta Matta 18582 22091 22251 Chak No.158/JB 23839 27444 27613Kari Wala 17591 20913 21064 Chak No.301/JB 20973 24144 24293Mohar Wali 23256 27648 27847 Chak No.316/JB 21744 25032 25186Chatta 21218 25225 25407 Chak No.438/JB 21568 24829 24982Nadha Ghar 19320 22969 23134 Chak No.431/JB 19700 22679 22819Dhori Wala 21423 25469 25652 Chak No.423/JB 24262 27931 28103Shor Kot Tehsil Chak No.354/JB 23056 26542 26706Havali Bahadar Shah 20917 24773 24951 Chak No.349/JB 20317 23389 23533Qaim Bharwana 19389 22964 23128 Chak No.345/JB 16631 19146 19264Chyianwala 21701 25702 25886 Chak No.338JB 20194 23248 23391Allah Yar Juta 21960 26009 26195 Chak No.281/JB 19008 21882 22017Shah Sadiq Nehang 25078 29702 29914 Kamalia TehsilChak No.485/JB 24732 29292 29501 Muhammad Shah 23714 28499 28714Chak No.493/JB 21012 24886 25064 Chak No.712/GB 21599 25957 26153Chak No.497/JB 18333 21713 21868 Plot No.57/4 16001 19229 19375Chak No. 17/Ghogh 20270 24007 24179 Chak No.739/JB 23144 27814 28024Badh Rajbana 20068 23768 23938 Chak No.715/GB 22632 27198 27404Kotla Zarif Khan 19316 22877 23041 Bairoon Kamalia 22566 27119 27324Bhangoo 20038 23732 23902 Chak No.661/GB 18894 22706 22878
317
Population
1998 Census
Estimated as on 1998 Census
Estimated as onDistrict/Tehsil/Rural Union Council
POPULATION
Table 214:- Population of Rural Union Councils by Tehsil, The Punjab-Contd.
District/Tehsil/Rural Union Council
Population
TOBA TEK SINGH DISTRICT

30-06-08 31-12-08 30-06-08 31-12-08
Chak No.718/GB 20781 24974 25162Kot Pathana 20218 24297 24481Chak No.760/GB 18645 22407 22576 Aroop TownChak No.681/GB 19695 23669 23847 Talwandi Rahwali 19478 24159 24427Chak No.670/GB 20435 24558 24743 Talwandi Khajoorwali 19679 24409 24679Plot - C 17261 20744 20900 Jalal 17028 21121 21354Chak No.674/GB 17449 20970 21128 Aroop 20233 25096 25374Chak No.759/GB 21416 25737 25931 Lohianwala 19156 23760 24023Shah Pur 19788 23781 23960 Mandiala Warraich 19480 24162 24429Mouza Jusa 17967 21592 21755 Buttranwali 18341 22749 23001Nawab Bhutti 20832 25035 25224 Wanianwala 18217 22595 22845Chak No.694/GB 17255 20736 20893 Gondlanwala 20131 24969 25246Toba Tek Singh Tehsil Kamoke TownChak No.338/JB 19932 23287 23441 Dhensar Pain 17286 21372 21540Chak No.375/JB 16836 19670 19800 Kali Suba 16844 20826 20989Chak No.323/JB 19566 22860 23011 Sohawa 16129 19942 20098Chak No.328/JB 16041 18741 18865 Wahndoo 18433 22790 22969Chak No.290/JB 23565 27532 277714 Chak Ramdass 17818 22030 22203Chak No.391/JB 22713 26537 26712 Mandiala Tega 17588 21746 21916Chak No.296/JB 23603 27576 27759 Gunnaur 17811 22021 22194Chak No.284/JB 16923 19772 19902 Kotali Nawab 17421 21539 21708Chak No.393/JB 17132 20016 20148 Macherala 17060 21093 21258Chak No.151/JB 20632 24050 24264 Nagal Doona Singh 16250 20091 20249Chak No.361/JB 15284 17857 17975 Ghanian 15649 19348 19500Chak No.251/JB 18961 22153 22299 Sodhoke 14765 18255 18399Chak No.183/JB 19869 23214 23367 Mari Thakran 13558 16763 16895Chak No.189/JB 19377 22639 22788 Ghoman 14698 18172 18315Chak No.184/JB 22948 26811 26988 Maju Chak 14669 18137 18279Chak No.262/JB 19864 23208 23361 Akbar Ghanoke 15456 19110 19260Chak No.269/JB 20793 24293 24454 Khiali Shah Pur TownRajana 18351 21440 21582 Kohlowala 19291 23927 24192Chak No.284/JB 16236 18969 19094 Muraliwala 19068 23651 23913Chak No.517/JB 19053 22260 22407 Audo Rai 18441 22873 23126Chak No.295/JB 21159 24721 24884 Khaili Shah Pur 15221 18879 19088Chak No.350/JB 23522 27482 27663 Sainsra Goraya 14881 18458 18662Chak No.342/JB 17320 20236 20369 Botala Sherm Singh 17236 21379 21615Chak No.333/JB 20355 23782 23939 Attawa 10843 13449 13598Chak No.330/JB 17064 19937 20068 Nandpur 19744 24489 24760Chak No.327/JB 18502 21617 21759 Dhillanwali 19524 24216 24485Chak No.314/JB 15864 18535 18657 Dhariwal 13620 16893 17080Chak No.316/JB 19353 22611 22760 Kot Shera 17710 21966 22210Chak No.301/JB 16279 19019 19145 Qila Mian Singh 20080 24906 25182
Estimated as on1998 Census
District/Tehsil/Rural Union Council
Population Population
Estimated as on 1998 Census
District/Tehsil/Rural Union Council
Table 214:- Population of Rural Union Councils by Tehsil, The Punjab-Contd.
GUJRANWALA CITY DISTRICT
POPULATION318
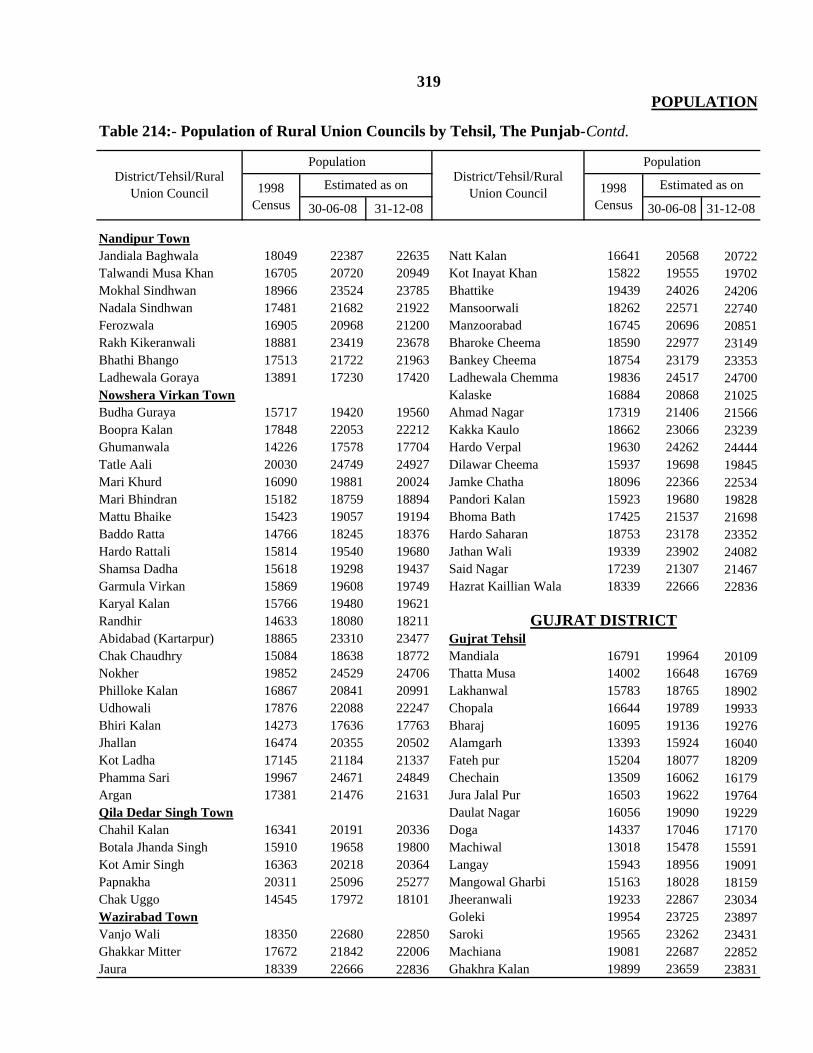
30-06-08 31-12-08 30-06-08 31-12-08
Nandipur TownJandiala Baghwala 18049 22387 22635 Natt Kalan 16641 20568 20722Talwandi Musa Khan 16705 20720 20949 Kot Inayat Khan 15822 19555 19702Mokhal Sindhwan 18966 23524 23785 Bhattike 19439 24026 24206Nadala Sindhwan 17481 21682 21922 Mansoorwali 18262 22571 22740Ferozwala 16905 20968 21200 Manzoorabad 16745 20696 20851Rakh Kikeranwali 18881 23419 23678 Bharoke Cheema 18590 22977 23149Bhathi Bhango 17513 21722 21963 Bankey Cheema 18754 23179 23353Ladhewala Goraya 13891 17230 17420 Ladhewala Chemma 19836 24517 24700Nowshera Virkan Town Kalaske 16884 20868 21025Budha Guraya 15717 19420 19560 Ahmad Nagar 17319 21406 21566Boopra Kalan 17848 22053 22212 Kakka Kaulo 18662 23066 23239Ghumanwala 14226 17578 17704 Hardo Verpal 19630 24262 24444Tatle Aali 20030 24749 24927 Dilawar Cheema 15937 19698 19845Mari Khurd 16090 19881 20024 Jamke Chatha 18096 22366 22534Mari Bhindran 15182 18759 18894 Pandori Kalan 15923 19680 19828Mattu Bhaike 15423 19057 19194 Bhoma Bath 17425 21537 21698Baddo Ratta 14766 18245 18376 Hardo Saharan 18753 23178 23352Hardo Rattali 15814 19540 19680 Jathan Wali 19339 23902 24082Shamsa Dadha 15618 19298 19437 Said Nagar 17239 21307 21467Garmula Virkan 15869 19608 19749 Hazrat Kaillian Wala 18339 22666 22836Karyal Kalan 15766 19480 19621Randhir 14633 18080 18211Abidabad (Kartarpur) 18865 23310 23477 Gujrat TehsilChak Chaudhry 15084 18638 18772 Mandiala 16791 19964 20109Nokher 19852 24529 24706 Thatta Musa 14002 16648 16769Philloke Kalan 16867 20841 20991 Lakhanwal 15783 18765 18902Udhowali 17876 22088 22247 Chopala 16644 19789 19933Bhiri Kalan 14273 17636 17763 Bharaj 16095 19136 19276Jhallan 16474 20355 20502 Alamgarh 13393 15924 16040Kot Ladha 17145 21184 21337 Fateh pur 15204 18077 18209Phamma Sari 19967 24671 24849 Chechain 13509 16062 16179Argan 17381 21476 21631 Jura Jalal Pur 16503 19622 19764Qila Dedar Singh Town Daulat Nagar 16056 19090 19229Chahil Kalan 16341 20191 20336 Doga 14337 17046 17170Botala Jhanda Singh 15910 19658 19800 Machiwal 13018 15478 15591Kot Amir Singh 16363 20218 20364 Langay 15943 18956 19091Papnakha 20311 25096 25277 Mangowal Gharbi 15163 18028 18159Chak Uggo 14545 17972 18101 Jheeranwali 19233 22867 23034Wazirabad Town Goleki 19954 23725 23897Vanjo Wali 18350 22680 22850 Saroki 19565 23262 23431Ghakkar Mitter 17672 21842 22006 Machiana 19081 22687 22852Jaura 18339 22666 22836 Ghakhra Kalan 19899 23659 23831
Estimated as on
POPULATION
Table 214:- Population of Rural Union Councils by Tehsil, The Punjab-Contd.
District/Tehsil/Rural Union Council
Population Population
1998 Census
1998 Census
319
GUJRAT DISTRICT
District/Tehsil/Rural Union CouncilEstimated as on

30-06-08 31-12-08 30-06-08 31-12-08
Nagrianwala 17037 20256 20404 Chakori Sher Gazi 18254 21420 21568Moin-ud-Din Pur 15493 18421 18555 Khawas Pur 14676 17222 17340Chak Manju 21734 25841 26029 Chak Miana 19531 22919 23076Akhlas Garh 17239 20497 20646 Fateh Bhand 15099 17718 17840Madina 14874 17685 17813 Kolian Shah Hussain 14799 17366 17485Sabowal 14453 17184 17309 Seeker Wali 14051 16488 16602Hariya wala 23717 28199 28404 Warrichian Wala 13954 16374 16487Kathala 21598 25679 25866 Ammra Kalan 15413 22780 22937Chak Sada 18479 21971 22131 Chak Jani 17319 20323 20463Deona 18621 22140 22301 Chakori Bhelowal 14646 17186 17305Adowal 15851 18846 18983 Bagrian Wala 13862 16266 16378Surkh Pur 16354 19443 19585 Kotla Arab Ali Khan 20404 23943 24108Bareela 16796 19970 20115 Aach 18678 21918 22068Tanda 17100 20331 20479 Chiryawala 20205 23710 23873Marri khokharan 14080 16741 16862 Bhaddar 19852 23295 23456Bhagowal 22388 26619 26812 Langrial 23344 15659 15766Chak Kamala 14670 17442 17569 Sabour 20631 24210 24376Karianwala 14546 17295 17421 Dilawar Pur 15313 17969 18093Haji wala 12638 15008 15118 Sarai Alamgir TehsilBaroo 14258 16952 17076 Mandi Bhalwal 18960 22465 22628Hazara Mughlan 13283 15793 15908 Thill Bakohal 18574 22008 22167Ajnala 15121 17978 18109 Baysa 20353 24116 24290Jalal Pur Sobtian 17043 20264 20411 Bhag Nagar 17164 20337 20484Santal 13440 15980 16096 Karyala 19153 22694 22858Pero Shah 14306 22489 22653 Simbil 21936 25991 26179Kharian Tehsil Khohar 20486 24273 24449Bhagwal 16990 19937 20074Sehna 16713 19612 19747Guliyana 17319 20323 20463 Hafizabad TehsilMalka 16168 18972 19103 Karyala 21266 25160 25340Thuta Rai Bahadur 14940 17531 17652 Chak Kharal 18214 22995 23159Dhoria 20450 23997 24162 Sagar Kalan 21015 24863 25041Banmali 15707 18431 18558 Chak Chatha 19904 23549 23717Noona Wali 14886 17468 17588 Winni 18747 22180 22338Mirza Tahir 15734 18463 18590 Kassoke 19155 22662 22824Murala 18573 21795 21944 Nonuana 19456 23019 23183Punjan Kassana 15031 17638 17759 Solangi Awan 21051 24906 25083Bahar Wal 15266 17940 18037 Qila Ram Kour 21248 22510 22671Jaura 14826 17398 17517 Vonike Tarar 20542 24303 24477Karnana 14678 17224 17342 Ramke Chatha 22323 26411 26599Haji Muhammad 14713 17265 17384 Dhiranke Lalke 19550 23130 23295Kotla Qasim Khan 14934 17524 17645 Kolo Tarar 18590 21994 22151Thekrian 15527 18220 18346 Kot Ishaq 17775 21030 21180Ganja 15025 17631 17752
320
District/Tehsil/Rural Union Council
POPULATION
Table 214:- Population of Rural Union Councils by Tehsil, The Punjab-Contd.
District/Tehsil/Rural Union Council
Population Population
1998 Census
Estimated as on 1998 Census
Estimated as on
HAFIZABAD DISTRICT

30-06-08 31-12-08 30-06-08 31-12-08
Kot Said Muhammad 17323 20495 20641 Chak Raib 14881 16330 16397Shah Jamal 16734 19798 19939 Wara Alam Shah 15133 16606 16675Nahrianwala 18384 21750 21906 Gohr 21216 23281 23377Pindi Bhattian Tehsil Gojra 21734 23850 23948Chak Bhatti 18168 21620 21779 Rukkan 16909 18555 18632Basulpur Tarar 17435 20748 20900 Dafar 16574 18187 18263Madhora Kalan 21516 25604 25792 Pind Macco 15491 16999 17069Sadhoke 20388 24262 24440 Bosal 18080 19840 19922Matteke 16805 19998 20145 Barmusa 14442 15848 15913Kot Sarwar 17670 21028 21182 Waryait 15818 17358 17430Nouthien 21576 25676 25864 Miana Gondal 17872 19612 19693Bhobra 23917 28462 28670 Garh Qaim 15404 16940 16973Kot Nakka 17189 20455 20605 Pindi Rawan 14870 16318 16385Mustafa Abad 20461 24349 24528 Phalia TehsilBadar Ali 18265 21736 21895 Dhaul 19401 22709 22859Behlolpur 18878 22465 22630 Raiakey 21260 24885 25050Thatha Khairu Mutmal 18109 21550 21708 Helan 19747 23114 23267Khuram Chorera 18006 21427 21585 Dharekan Kalan 17958 21020 21159
Ghanian 15118 17696 17813Duggal 2115 23545 23701
M.B.Din Tehsil Pahrianwali 20643 24163 24323Ahla 16619 19487 19615 Narang 18738 21933 22078Mong 18553 21755 21898 Hasalanwala 22042 25800 25971Rasul 17630 20673 20809 Chak Jano Kalan 18657 21838 21983Chelianwala 16968 19897 20027 Jokalian 15916 18630 18753Mojianwala 17638 20682 20818 Pindi Kalu 17870 20917 21055Khoke Kasib 14653 17182 17295 Saida 14571 17056 17168Mirala 16634 19505 19633 Bhekho 15994 18721 18845Chak Basawa 16962 19890 20020 Bhoa Hassan 19031 22276 22423Wasu 19481 22843 22993 Dhunni Kalan 2118 24793 24957Shaheedanwali 17505 20526 20661 Bherowal 17919 20974 21113Pindi Bahauddin 21036 24667 24829 Kot Hast Khan 21719 25422 25590Sahana 14116 16552 16661 Berka Bala 19056 22305 22453Chimmon 14398 16883 16994Sohawa Bolani 12671 14585 14956Sohawa Dillowana 12672 14859 14957 Narowal TehsilKadhar 15287 17926 18043 Rasinwal 13121 15340 15440Mianwal 15185 17806 17923 Pajowali 13224 15460 15562Nain 17401 20404 20538 Behnian 13473 15751 15855Kuthiala Sheikhan 21601 25329 25496 Bathanwala 17419 20364 20498Chakn No.40 14918 17493 17608 Giddian 14254 16664 16774Bhikhi 16115 18896 19020 Dhrag Miana 16336 19098 19224Malikwal Tehsil Holowal 18138 21205 21344Haria 16544 18155 18229 Talwandi Bhindran 16903 19761 19891Badshahpur 15316 16807 16876
District/Tehsil/Rural Union Council
321POPULATION
Table 214:- Population of Rural Union Councils by Tehsil, The Punjab-Contd.
District/Tehsil/Rural Union Council
Population
1998 Census
Estimated as on 1998 Census
Estimated as on
Population
MANDI BAHA-UD-DIN DISTRICT
NAROWAL DISTRICT

30-06-08 31-12-08 30-06-08 31-12-08
Niddokay 17177 20081 20213 Lasser Kalan 18225 20961 21086Kot Lakha Singh 15147 17708 17825 Darman 20123 23144 23282Manak 13289 15536 15638 Rambri 16664 19166 19280Khan Khassa 16353 19118 19244 Dara Pur 15855 18235 18344Dongian 15427 18035 18154 Dudhoo Chak 19518 22448 22582Faleez Pur 14214 16617 16727 Ghona 19571 22509 22644Lala 19864 23223 23375 Mallaha 18613 21407 21535Feroze Pur 15671 18321 18441 Kanjroor 15931 18323 18432Uncha Kalan 15591 18227 18347 Goralla 17573 20211 20332Jandiala 15829 18505 18627 Langah 16966 19513 19630Mararya 19492 22788 22938 Kalah 16816 19341 19456Chak Dudho 21318 21566 21708 Bua 18607 21400 21528Dhamthal 18183 21257 21397 Maingari 18992 21843 21974Langerkay 18526 21658 21801Mehlowala 18953 22158 22303Sankhatra 19596 22909 23060 Daska TehsilNonar 17027 19906 20037 Gojra 13576 15030 15152Bubak Marali 14129 16518 16627 Kandan Sian 21894 24239 24436Sadowala Uncha 17170 20073 20205 Mitranwali 18149 20093 20256Bola Bajwa 14678 17160 17273 Goindke 19929 22063 22243Maddo Kahlwan 17501 20460 20595 Raja Ghuman 21365 23653 23845Chanderkay Rajpootan 14706 17193 17306 Galotian Khurd 21265 23543 23734Jassar 17011 19887 20018 Galotian Kalan 21701 24025 24220Chandowal 14600 19655 19784 Adamke Cheema 22675 25104 25307Shakargarh Tehsil Akbar 18322 20284 20449Wali Pur Bura 15179 17458 17562 Salhoke 20302 22476 22659Bara Manga 17643 20292 20413 Bharthanwala 19207 21264 21437Kot Naina 20336 23389 23529 Satrach 21816 24153 24349Phagwari Muslimana 17017 19572 19689 Bhagatpur 20259 22429 22611Bheri Khurd 16791 19312 19427 Siranwali 22323 24714 24915Ikhlas Pur 20908 24047 24191 Wadhala Sandhwan 23778 26325 26538Masroor 20671 23774 23916 Budha Goraya 24733 27382 27604Norangabad 16420 18885 18998 Alomahar 19923 22057 22236Sukho Chak 18081 20795 20920 Ghuinke 24116 26699 26916Chak Amru 17969 22737 22873 Sehjokala 20889 23126 23314Baran 18894 21731 21860 Peero Chak 22284 24671 24871Chatrana 19378 22287 22420 Bogray 20301 22475 22658Phalwari 20217 23252 23391 Malo Mahay 18509 20491 20658Gumtala 15688 18043 18151 Kanwan Litt. 24441 27059 27278Raiba Kalan 20715 23825 23967 Pasrur TehsilTola 19496 22423 22557 Bajra Garhi 24715 28997 29195Sarjal 19589 22530 22665 Mehrajke 20745 24337 24506Nagwal 15995 18396 18506 Pindi Bhago 19897 23342 23504Dinga Narain Pur 20809 23933 24076
Estimated as onDistrict/Tehsil/Rural Union Council
Population Population
1998 Census
Estimated as on 1998 Census
District/Tehsil/Rural Union Council
POPULATION
Table 214:- Population of Rural Union Councils by Tehsil, The Punjab-Contd.
322
SIALKOT DISTRICT

30-06-08 31-12-08 30-06-08 31-12-08
Chobarah 18869 22136 22290 Kharoata Syedan 25273 30698 30947Charwah 18079 21209 21356 Sheehni 24406 29645 29885Prail 18337 21512 21661 Chapprar 23222 28206 28435Kingra 24898 29209 29411 Plaural Kalan 22400 27208 27429Dhullam Kahlwan 19072 22374 22529 Kammanwakla 24506 29766 30008Chahoor 21092 24744 24915 Bharath 25906 31467 31722Gadgore 21214 24887 25060 Dallowali 24851 30185 30430Khananwali 23876 28010 28204 Rasoolpur 23278 28274 28504Jassoran 23407 27460 27650 Langeriali 17244 20945 21115Badiana 20939 24565 24565 Syedanwali 21471 26080 26291Kapoorpur 21734 25497 25497 Bhagowal 19398 23562 23753Ballagan 19885 23328 23328 Talwara Mughalan 18558 22541 22724Malipur 19819 23251 23251 Pindi Araiyan 18065 21943 22121Adamke Nagra 24193 28382 28382 Doburji Araiyan 20938 25432 25639Ban Bajwa 21570 25305 25305 Paragpur 24860 30196 30441Mussapur 20639 24213 24213 Gurhi 22144 26897 2715Talwandi Inayat Khan 21576 25312 25312 Hundal 22947 27872 28099Pejoke 22888 26851 26851 Charind 25901 31460 31716Saukinwind 23745 27856 27856 Miani 23532 28583 28815Qila Kalarwala 26355 30918 30918 Adalatgarh 23575 28635 28868Takhatpur 20386 23916 23916 Moman Kalan 17599 21376 21550Sambrial Tehsil Uggoki 27204 33043 33311Kullowal 22292 27077 27298 Jaurian Kalan 26117 31723 31980Roras 20263 24613 24814 Bhagwal Awan 24371 29602 29842Sahowala 15431 18743 18897 Moonger 23206 28187 28416Jethike 19993 24285 24483 Ballanwala 25176 30580 30828Habibpur 17940 21791 21969 Gohadhpur 29126 35378 35665Randheer 19699 23928 24123 Baunkan 25009 30377 30624Kopra 21869 26563 26780Malkhanwala 18894 22950 23137Ballagan 18951 23019 23207 Aziz Bhatti TownVerowala 14203 17252 17393 Bhangali 41507 53777 54361Baddoke 12222 14846 14967 Kamahan 38287 49605 50144Kharolian 12428 15096 15219 Hair 35491 45983 46482Sialkot Tehsil Dhaloke 34547 44760 45245Phuklian 21887 26585 26801 Iqbal TownKachhiman 21381 25970 26181 Hanjarwal 44336 57443 58066Gondal 25358 30801 31051 Niaz Beg 44448 57588 58212Head Marala 23413 28438 28669 Shahpur 36097 46768 47275Pindin Khokharan 20513 24916 25118 Ali Raza Abad 38190 49480 50017
District/Tehsil/Rural Union Council
Population
* There is no Rural Union Council in Ravi Town, Shalimar Town, Data Ganj Baksh Town, Sammanabad
PopulationDistrict/Tehsil/Rural
Union Council
323
Estimated as on
POPULATION
Table 214:- Population of Rural Union Councils by Tehsil, The Punjab-Contd.
1998 Census
Estimated as on 1998 Census
Town and Gulberg Town as these Towns Comprise of Urban areas only.
LAHORE DISTRICT

30-06-08 31-12-08 30-06-08 31-12-08
Chung 34917 45239 45730 Olakh Hithar 19512 23918 24122Maraka 36543 47346 47859 Rajowal Nau 19967 24476 24685Shamke Bhattian 33042 42810 43274 Kilara 25833 31666 31937Sultanke 36399 47159 47671 Rao Khan Wala 21770 26686 26914Manga 44593 57776 58402 Daftuh 20268 24845 25057Nishter Town Matta 20645 25307 25523Attari Saroba 39859 51642 52202 Baroon Raja Jang 18181 22286 22477Dullo Khurd Kalan 39828 51602 52162 Ibrahimabad 17889 21928 22116Chandrai 41513 53785 54369 Chathian Wala 18911 23181 23379Haloke 41302 53512 54092 Sarilali Kalan 16708 20481 20656Gajju Matta 35906 46520 47025 Zafarke 21261 26062 26285Kahna Kohna 6268 8121 8209 Nathoki 20389 24993 25207Jia Bagga 37671 48807 49337 Bhamba Kalan 19725 24179 24386Paji 34915 45237 45727 Babilana Otar 24761 30352 30612Pandoki 39401 51049 51603 Handal 18652 22864 23059Wagha Town Cheena Arla 17044 20893 21071Lakhodher 39853 51634 52194 Olakh Otar 19400 23781 23984Bhaseen 37259 48273 48797 Chak.55 23734 29093 29342Dograi Kalan 42880 55556 56159 Mudke Dhariwal 21993 26959 27190Manawan 41895 54280 54869 Chunian TehsilMinhala 38884 50379 50925 Kangan Pur (R) 17883 21415 21580Barki 39328 50954 51507 Mokal 20247 24245 24432Hadiara 40525 52505 53075 Kotha 17375 20806 20967
Jajjal 23140 27722 27935Kull 24113 28875 29097
Kasur Tehsil Mulapur 21539 25793 25991Oraka 23952 29360 29611 Talwandi 20694 24781 24972Qadi Wind 23327 28594 28839 Ellah Abad 30197 36160 36439Maan 23244 28492 28736 Jamsher Kalan 22890 27410 27622Bahadar Pura 23432 28723 28969 Lundey 24851 29759 29988Sheikh Umad Kohna 18462 22631 22824 Dhuttay 21140 25315 25510Fateh Pur 18520 22702 22896 Gehlan Hathar 20680 24764 24955Hardo Sohari 22936 28115 28355 Bhagiwal 21943 26276 26479Kotli Rai Abubakar 19460 23854 24058 Jand Wala 17909 21446 21611Rhieela Hithar 17012 20853 21032 Jamsher Khurd 22057 26413 26616Sehjra 20178 24734 24946 Sadda 22131 26501 26706Bhedian Kalan 19663 24103 24309 Deo Sial 21736 26028 26229Bazid Pur 19126 23445 23645 Jagowala 25417 30436 30671Hussain Khan Wala 17079 20935 21114 Chak No.13 22188 26570 26775Gohar 22563 27658 27894 Kot Sandaras 21379 25601 25798Khudian Beroon 25631 31418 31687 Wan Khara 26226 31405 31647Khai Hithar 23303 28565 28809 Chak No.18 19644 23523 23705Usman Wala 17115 20980 21159 Mundayki 18984 22733 22908Pial Kalan 25330 31050 31315 Maujoki 19321 23137 23315Dholan Hithar 23652 28993 29241
KASUR DISTRICT
324POPULATION
Table 214:- Population of Rural Union Councils by Tehsil, The Punjab-Contd.
District/Tehsil/Rural Union Council
Population Population
1998 Census
Estimated as on 1998 Census
Estimated as onDistrict/Tehsil/Rural Union Council

30-06-08 31-12-08 30-06-08 31-12-08
Pattoki Tehsil Chak No.49/RB 17223 19878 19998Wan Radh Ram 22413 27479 27715 Chak No.25/RB 18371 21203 21331Chak No. 7 Kothi Wala 23894 29295 29547 Sangla Hill TehsilChak No.23 Bhopewal 16509 20240 20415 Chak No.292/RB 14860 17137 17239Chak No.27 Dholan 17056 20911 21091 Chak No.43/RB 16519 19050 19164Hanjray Kalan 21063 25824 26046 Chak No.28/RB 19248 22197 22329Chak No.39 18690 22914 23111 Marh Balochan 13133 15145 15235Chak No.35 19965 24478 24688 Chak No.113/RB 16492 19019 19132Sheikhum 21143 25922 26145 Chak No.119/RB 21444 24730 24877Chak No.45 23593 28926 29174 Chak No.122/RB 17578 20271 20392Halla 20040 24570 24781 Nankana TehsilAlpa Kalan 16770 20560 20737 Chak No.12/GB 17653 20110 20221Sarai Noshera 20846 25558 25778 Chak No.13/GB 19033 21682 21802Kot Sardar Kahan Singh 25710 31521 31792 Chak No.5/GB 21985 25045 25183Behr Wal Kalan 26166 32080 32356 Chak No.4/GB 19454 22162 22284Jamber Khurd 22961 28151 28393 Machrala 23318 26564 26710Ghumankey 21312 26129 26354 Chak No.575/GB 20285 23108 23236Phullalani 17386 21316 21499 Miran pur 17187 19579 19687Khomekey More 20062 24596 24808 Shireen Jhangar 21291 24254 24388Lambey Jagheer 17770 21786 21974 Kot Hussain 17424 19849 19959Chak No.6 Dina Nath 25134 30815 31080 Nabipur Piran 17201 19595 19703Nathey Kalsey 20456 25080 25295 Fatta Thatta 17728 20195 20307Baghiana Kalan 21704 26610 26838 Joge Kot Nau Bahar 23622 26910 27058Kanween 17492 21446 21630 Rehan Wala 18946 21583 21702Bhoe Asal 17241 21138 21320 Jawaharpur 17665 20124 20235
Ganishpur 23165 26389 26535Mangtan Wala 18858 21483 21601
Safdarabad Tehsil Jalal Nau 18437 21003 21119Salar Bhattian 16678 19226 19340 More Khunda 19319 22008 22129Bhalike 20429 23549 23690 Natha 19092 21749 21869Chak No.170 22918 26419 26576 Kot Namdar 16251 18513 18615Chak No.15 21491 24774 24921 Barkhudar 21468 24456 24591Chak No.4/RB 19050 21960 22091 Buchike 15998 18225 18325Chhena 16794 19359 19475 Lurka 16795 19133 19238Chak No.12/RB 20598 23744 23886 Haft Madar 19222 21897 22018Chak No.78/RB 16593 19128 19242 Kot Benidas 18199 20732 20846Chak-282/RB 26113 30102 30281 Chindpur 16483 18777 18881Shah Kot Tehsil Bara Ghar 19394 22093 22215Chak No.83/RB 21201 24470 24617 Machora 17045 19417 19524Chak No.168/RB 18636 21509 21638 Chak Haidarabad 16396 18678 18781Chak No.176/RB 19723 22764 22901 Malka Haji Mouj 17802 20280 20392Chak No.180/RB 19747 22791 22928 Syed wala 16325 18597 18700Chak No.184/RB 17984 20757 20881 Shah Blawal 16273 18538 18640Chak No.82/RB 19105 22050 22183 Meharpur 16129 18374 18475
325
District/Tehsil/Rural Union Council
Population Population
1998 Census
Estimated as on 1998 Census
Estimated as onDistrict/Tehsil/Rural Union Council
NANKANA DISTRICT
POPULATION
Table 214:- Population of Rural Union Councils by Tehsil, The Punjab-Contd.

30-06-08 31-12-08 30-06-08 31-12-08
Kani Pur 18987 23099 23289Okara Tehsil Mancharian 17442 21220 21394Akbar 20176 24073 24255 Mahant Darshan 21483 26136 26350Fatehpur 15277 18228 18366 Mehar Shah Khaga 16155 19654 19815Sheikhu Sharif 22861 27277 27483 I/SP Wasawewala 22457 27321 27545Chak No.18/GD 14215 16961 17089 Faridpur Sohag 19188 23344 23536Chak No.34/GD 18371 21920 22085 Maroof 20118 24475 24676Burj Jeway Khan 15968 19053 19197 Mohib Ali Utar 19767 24048 24246Chak No.48/3R 15430 18411 18550 Nama Jineka 18149 22080 22261Chak No.45/GD 19789 23612 23790 Jaith Pur 16039 19513 19673Chak No.40/3R 20871 24903 25091 Sher Garh 18107 22029 22210Chak No.4/41 20059 23934 24115 Rehmat Wala 17024 20711 20881Chak No.36-A/4L 21553 25716 25911 Phullan Toli 20914 25444 25653Chak No.40-A/4L 21951 26191 26389 Bhone Manzebta 20186 2458 24760Chak No.27/4L 23834 28438 28653 Rajowal 20637 25107 25313Chak No.44/21 19508 23276 23452 Klair Kalan 19891 24199 24398Chak No.32/2L 20325 24251 24435 Muhammad Nagar 21067 25630 25840Chak No.53/2L 22172 26455 26655 Bhela Ghulab Singh 19623 23873 24069Chak No.52/2L 17809 21249 21410 Rohila Tajeyka 16756 20385 20552Chak No.32/2R 21629 25807 26002 Nahal Mahar 20064 24410 24610Bibi Pur 19874 23713 23892 Rukan Pura 18269 22226 22408Jaboka 19932 23782 23962 Guddar 17189 20912 21084Chak No.24/GD 21782 25990 26186 Shah Yakka 20080 24429 24630Tariqabad 23118 27584 27792 Bhoman Shah 20706 25191 25397Jandraka 19331 23065 23240 Bonga Saleh 16196 19704 19866Kohla 15165 18094 18231 Dhulliana 19861 24163 24361Chak No.12/GD 14655 17486 17618 Behlor Pur 17532 21329 21504Lashari 20728 24732 24919 Bariet (Chak Bawa) 17896 21772 21951Chak No.15/1R 15109 18028 18164 Mustafaabad 18770 22835 23023Satghara 23973 28604 28820 Amli Moti 20276 24668 24870Chak No.42/3R 17908 21367 21529 Jhujh Kalan 15566 18937 19093Depalpur Tehsil Renala Khurd TehsilBhuta Mohabbat 19728 24001 24198 Mopalkey 17183 20012 20143Qila Tara Singh 20996 25544 25753 Bazeeda 19200 22361 22508Sobha Ram 21961 26718 26937 Chak No.4/GD 18117 21100 21238Qila Javand Singh 16811 20452 20620 Kaman 22300 25971 26142Shah Nawaz Khan Wala 19008 23125 23315 Chak No.7/1R 20857 24291 24450Pandat Manphool Pur 18241 22192 22374 Chak No.5/RA 18942 22061 22206Qadir Abad 19105 23243 23434 Chak No.23/2L 18113 21095 21234Awan Kalan 15759 19172 19330 Chak No.11/1L 15911 18531 18652Mazhar Abad 17381 21146 21319 Chak No.13/1L 16996 19794 19924Ratta Khanna 21098 25668 25878 Chak No.18/1L 20974 24427 24588Pipli Pahar 21960 26716 26936 Chak No.6/1L 18311 21326 21466Chipli Pur 21688 26385 26602 Chak No.33/1AL 19015 22146 22291
Estimated as on
Table 214:- Population of Rural Union Councils by Tehsil, The Punjab-Contd.
326POPULATION
Population Population
1998 Census
Estimated as on 1998 Census
District/Tehsil/Rural Union Council
District/Tehsil/Rural Union Council
OKARA DISTRICT

30-06-08 31-12-08 30-06-08 31-12-08
Chak No.22/1AL 17021 19823 19954 Sheikhupura TehsilChak No.4/1AL 18855 21959 22104 Mallian Kalan 17727 21163 21330Akhtarabad 23453 27314 27494 Kot Ranjeet 22009 26274 26482Chak No.14/1AL 22207 25863 26033 Chechoki Mallian 17084 20395 20556
Muraday Kalan 23958 28601 28827Baharianwala 20620 24616 24811
Ferozwala Tehsil Bahuman 22589 26967 27180Luban wala 23653 29612 29889 Jewanpura 19613 23414 23599Chak No.44 17152 21473 21674 Khudlathi 16920 20199 20359Bharth 20478 25637 25877 Rakh Hern Minare 23470 28019 28240Bhianwala Kalan 17334 21701 21904 Mirza Virkan 21785 26007 26212Shekhan 20203 25293 25529 Madar 16350 19519 14456Wandala Dial Shah-I 22206 27801 28060 Kaloke 18862 22518 22695Wandala Dial Shah-II 22989 28781 29050 Ghazi Minara 24125 28801 29028Dacca 25936 32471 32773 Ghang 20653 24656 24850Faizpur Khurd 24145 30228 30510 Khariawala 20622 24619 24813Momanpur 17264 21614 21815 Bhakhi 24315 29027 29256Mandhiali 17942 22463 22672 Tibbi Hamboo 18913 22578 22757Kot Pindi Dass 19860 24864 25096 Butter 21445 25601 25803Qila Sattar Shah 14698 18401 18573 Nokhar 17131 20451 20612Khanpur 19062 23865 24087 Esherke 22705 27105 27319Burj Attari 26221 32827 33134 Jhabran 20118 24017 24207Murridke Tehsil Kakar Gill 21267 25389 25589Nangal Bhucher 21418 26900 27151 Ajnanwala 21445 25601 25803Methtasuja 24280 30494 30779 Gujian Nau 23546 28109 28331Ladheke 18404 23114 23330 Kot Sendha 25015 29863 30099Kirtee 22640 28435 28700 Farooqabad Village 22522 26887 27099Ratta Gujjaran 16573 20815 21009 Jatri Kohna 19640 23446 23631Kala Khatai 18335 23028 23243 Lagar 16945 20229 20389Aahian 18703 23490 23709 Ferozwatwan-I 16919 20198 20357Lanbray 19302 24242 24468 Ferozwatwan-II 16126 19251 19403Dharor Muslim 13754 17274 17435 Mananwala Kirpal Singh 23976 28623 28849Nangal Gahdan 29583 37155 37501 Mananwala Johad Singh 23468 28016 28237Nangal Kaswala 22719 28534 28800Khuthial a Virkan 23765 29848 30126Noon 27765 34871 35197 Bosan TownSharaqpur Tehsil Binda Sandila 23576 26652 26892Sehjewal 16248 20337 20528 Buch Khusro Abad 21825 24673 24895Mandian wala 16000 20027 20214 Saleh Mehay 20432 23098 23306Dhamke 17285 21635 21838 Punj Koha 20967 23703 23916Marh Bhagwan 22135 27716 27965 Lutaf Abad 24415 27601 27849Qurashian wala 17972 22495 22706 Bosan 26669 30149 30420Kot Mehmood 16491 20641 20835 Allam pur 21583 24399 24619Feizpur Kalan 16430 20565 20758
327
Estimated as on
POPULATION
Table 214:- Population of Rural Union Councils by Tehsil, The Punjab-Contd.
District/Tehsil/Rural Union Council 1998
CensusEstimated as on 1998
Census
District/Tehsil/Rural Union Council
Population Population
SHEIKHUPURA DISTRICT
MULTAN CITY DISTRICT

30-06-08 31-12-08 30-06-08 31-12-08
Abbas pur 20473 23144 23353 Ayyazabad Maral 20402 25710 25941Matti Tal 27706 31321 31603 Khokhar 28377 35760 36082Jalapur Pirwala Town Hamidpur Kanora 23056 29100 29362Darbarpur 25955 31753 32004 Sher Shah 27916 35179 35495Khan Bela 19548 23914 24103 Shujaabad TownBait Kaitch 25337 30997 31242 Ponta 18922 23175 23362Inayatpur 21109 25824 26028 Chak R.S 27692 33916 34189Ghazipur 26868 32870 33129 Sikandar abad 22789 27911 28136Alipur Sadaat 23741 29044 29274 Shahpur Ubha 30269 37073 37371Jahanpur 26904 32914 33174 Gajju Hatta 21587 26439 26652Mianpur Belay wala 28479 34840 35116 Basti Mithu 24652 30193 30436Karam Ali Wala 22644 27702 27921 Raja Ram 26037 31889 32146Lal Wah 25992 31798 32049 Kotli Nijabat 19989 24482 24679Nou Raja Bhutta 27689 33874 34142 Rasoolpur 23320 28562 28792Kotla Chakar 29467 36049 36334 Matotli 22990 28157 28384Bahadar pur 21888 26777 26989 Thath Ghalwan 27804 34053 34328Mumtazabad Town Punjani 20103 24622 24820Jhok Lashkar Pur 22585 28798 28755 Jalalpur Khakhi 24074 29485 29723Bootay Wala 22585 28498 28755 Gardazpur 27915 34189 34465Makhdoom Rashid 11412 14400 14529 Mahra 26207 32098 32356Khanpur Maral 22503 28395 2865018-MR 19994 25229 25456Chah 5-Faiz 21594 27248 27493 Khanewal TehsilQadirpur Lar 18071 22802 23008 Chak No.4/AH 17890 18669 18821Basti Malook 23983 30262 30535 Chak No.12/AH 25941 27070 27291Rana Wahin 20952 26438 26676 Khanewal Kohana 20299 21182 21355
Chak No.7/9AR 25208 26305 26519Bangle Wala 23216 29274 29537 Chak No.14/8-R 23306 24320 24518Loothar 21809 27500 27747 Chak No.4/8-AR 19559 20410 20577Tatepur 24772 31236 31517 Chak No.19/9-R 17968 18750 18903Dumra 25125 31681 31966 Chak No.36/10-R 19086 19917 20079Kotla Muharran 24829 31308 31590 Chak No.30/10-R 27007 28182 28412Multani Wala 19390 24450 24670 Chak No.80/10-R 22657 23643 23836Budhala Sanat 20015 25238 25465 Chak No.76/10-R 24371 25432 25639Kothay Wala 22792 28740 28998 Chak No.70/10-R 16760 17489 17632Gharyala 27837 35101 35417 Chak No.88/10-R 25209 26306 26520Sher Shah Town Chak No.43/10-R 24702 25777 25987Rangeelpur 17507 17684 17843 Chak No.58/10-R 17790 18564 18715Kayanpur 23052 23285 23494 Chak No.92/10-R 21828 22778 22964Muzzafarabad 19036 19228 19401 Chak No.171/10-R 23841 24879 25081Bakhar Arbi 19479 19676 19852 Bherowal 17581 18346 18496Billi Wala 19493 24565 24785 Chak No.78/15-L 21243 22168 22348Kabirpur 24592 30990 31269 Chak No.74/15-L 20380 21267 21440Lar 23264 29317 29580 Chak No.72-73/15-L 22787 23779 23972Qasba Maral 22001 27725 27974
328
Shah Rukn-e-Alam Town
District/Tehsil/Rural Union Council
Population Population
1998 Census
Estimated as on 1998 Census
Estimated as onDistrict/Tehsil/Rural Union Council
POPULATION
Table 214:- Population of Rural Union Councils by Tehsil, The Punjab-Contd.
KHANEWAL DISTRICT

30-06-08 31-12-08 30-06-08 31-12-08
Jahanian Tehsil Mian Channu TehsilThatha Sadiq Abad 20619 24894 25093 Chak No.44/15-L 23395 28530 28768Chak No.127/10-R 21621 26104 26313 Chak No.129/15-L 19638 23948 24148Chak No.136/10-R 22200 26803 27017 Chak No.131/15-L 23129 28205 28441Chak No.139/10-R 18179 21948 22124 Chak No.134/16-L 19195 23408 23603Chak No.140/10-R 22733 27447 27666 Chak No.137/16-L 20796 25360 25572Mian Pur 17099 20644 20810 Chak No.126/15-L 18596 22677 22867Rahim Shah 22819 27550 27771 Chak No.123/15-L 20346 24811 25018Chak No.55/10-R 19783 23885 24076 Chak No.115/15-L 25844 31516 31779Chak No.106/10-R 20260 24461 24656 Chak No.93/15-L 23058 28119 28353Chak No.149/10-R 18537 22381 22560 Chak No.57/15-L 17511 21354 21532Chak No.157/10-R 20853 25177 25378 Chak No.92/15-L 26229 31986 32253Kabirwala Tehsil Chak No.100/15-L 27858 33972 34256Mongan Wala 17350 20371 20513 Chak No.61-A/15-L 19606 23909 24109Ibrahimpur 16117 18924 19055 Chak No.84/15-L 21243 25905 26121Man Kot 17312 20327 20468 Chak No.123/7-ER 19172 23380 23575Salary Wahin Nau 17622 20691 20835 Rotla 17439 21266 21444Mumdal 18176 21341 21490 Jarahi 21267 25935 26151Chak Haider Abad 20291 23825 23990 Chak No.14/8-AR 17708 21594 21775Nirhal 19374 22748 22906 Chak No.7/8-AR 18587 22666 22856Chak Naurang Shah 17240 20242 20383 Choghatta Panjoana 20801 25366 25578Mari Sahu 17578 20639 20783 Noori Sohag 19813 24161 24363Hashmat Miral 17261 20267 20408 Ghous Pur 17816 21726 21907Sardar Pur 20376 23924 24091Kund Sargana 18545 21775 21926Baqir Pur 20821 24447 24617 Lodhran TehsilJasoo Kanwain 18551 21782 21933 Raja Pur 15454 19112 19298Okan Wala 18913 22207 22361 Kmalpur Jatial 17444 22000 22215Moola pur 23494 27585 27777 Danwan 16139 20355 20553Mahani Shah 21925 25743 25922 Havely Naseer Khan 17288 21804 22016Sham Kot 22291 26173 26355 Dera Jand 16872 21279 21486Kot Bahadar 18182 21348 21497 Adam Wahin 20644 26036 26290Jodh Pur 17796 20895 21040 Lodhran (partly) 15541 19600 19791Nabi Pur 19718 23120 23313 Chanb Kulyar 19305 24348 24585Bagar Sargana 17855 20964 21110 Durnwala 16931 21353 21561Daduana 16791 19715 19852 Bhultaji 14820 18691 18873Qatalpur 21363 25083 25258 Khan Waha Ghullan 18119 22852 23074Hussain Abad-I 20878 24514 24684 Qureshi Wala 12847 22509 22728Umeed Garh 26864 31542 31762 Saad ullah pur 16413 20700 20902Haveli Koranga 18462 21677 21828 Wahi Imam Bakhsh 14819 18690 18872Kot Islam 18062 21207 21355 Gogran 19098 23973 24206Dharkhana 21592 25352 25529 Koundi 14624 18444 18623
329
Table 214:- Population of Rural Union Councils by Tehsil, The Punjab-Contd.
District/Tehsil/Rural Union Council
POPULATION
1998 Census
Estimated as onDistrict/Tehsil/Rural Union Council
LODHRAN DISTRICT
Population Population
1998 Census
Estimated as on

30-06-08 31-12-08 30-06-08 31-12-08
Sumra 15434 19465 19655 Chak No.231/WB 10908 17638 17780Salsadar 19423 24559 24799 Ladha Bohar 16166 19506 19663Wahi Salamat Rai 20639 26030 26283 Chak No.237/WB 16029 19340 19496Chak No.49/M 18029 22738 22960 Chak No.11/M 13281 16025 16154Chak Hirtta 16326 20590 20791 Dunyapur (partly) 1903 2296 2315Sagwan 13461 16977 17142 Chak No.35/M 17587 21220 21391Rawani 12583 15870 16024 Sirajwala 17656 21304 21475Lahori 12964 16350 16509Kehror Pacca TehsilAlipur Kanju 16520 19913 20074 Arif wala TehsilGahi Mammer 17373 20941 21110 Chak No.59/EB 16329 19456 19602Burhan Pur 14724 17748 17891 Chak No.151/EB 18737 22325 22492Chowki Masti Khan 17230 20768 20937 Chak No.34/EB 19447 23171 23345Ameer Pur Saddat 17312 20867 21036 Chak No.50/SP 22662 27001 27204Noor Shah Gilani 12908 15559 15685 Chak Shafi 22635 26969 27172Rappar 12501 15068 15190 Chak Jewan Shah 22119 26354 26552Jamrani Wah 17427 21006 21176 Chak No.13/FB 16530 19695 19843Bahwal Grah 19593 23617 23808 Chak No.75/EB 20834 24823 25010Shah Pur Phull 12630 15224 15347 Chak No.69/EB 19324 23024 23197Naseer ud Din Wahin 20263 24424 24622 Qaboola 21234 25300 25490Tibbi Wadan 18928 22815 23000 Pir Saddar Din 16328 19450 19601Fareed abad 18895 22775 22960 Noora Rath 20310 24199 24381Dakhna Gharoo 15075 18171 18318 Machi Singh 24961 29741 29964Massa Kotha 12159 14656 14775 Chak No.18/KB 22525 26838 27040Nau Qabil Waha 14732 17757 17901 Jamun Bodla 23366 27840 28049Rana Wahin 14260 17188 17328 Arazi Dilawar 18987 22623 22793Chelay Wahin 13928 16788 16924 Chak Mehdi Khan 21012 25036 25223Dunya Pur Tehsil Chak No.163/EB 22088 26318 26515Jallah Arain 19419 23431 23619 Chak No.147/EB 20387 24291 24473Makhdoom Ali 14242 17184 17322 Chak No.351/EB 19400 23115 23288Chak No.386/WB 17854 21542 21716 Chak No.86/EB 18791 22389 22557Chak No.384/WB 15345 18515 18664 Chak No.66/EB 17557 20919 21076Chak No.353/WB 20303 28117 28343 Chak No.48/EB 20548 24483 24666Chak No.360/WB 13761 16604 16737 Chak No.83/EB 16193 19294 19439Chak No.357/WB 16430 19462 19619 Chak No.109/EB 21995 26207 26403Chak No.355/WB 14796 17845 17989 Chak No.137/EB 24623 29338 29558Qutab Pur 15441 18631 18781 Pakpattan TehsilChak No.342/WB 18642 22457 22638 Hillah Wattoan 24088 29430 29679Sultan Ayub Qattal 14826 17889 18033 Tiwana Kalan 19336 23624 23824Maqbool Wah 14521 15786 15913 Bonga Hayat 18755 22914 23108Jhandir Wah 13083 17521 17662 Chak Bedi 23751 29018 29263
330
Estimated as on
Table 214:- Population of Rural Union Councils by Tehsil, The Punjab-Contd.
District/Tehsil/Rural Union Council
Population Population
1998 Census
Estimated as on
POPULATION
1998 Census
District/Tehsil/Rural Union Council
PAKPATTAN DISTRICT

30-06-08 31-12-08 30-06-08 31-12-08
Chak No.26/SP 19326 23612 23811 Chak No.164-A/9-L 17699 20667 20804Chak Noor M.uhammad 18138 22160 22348 Chak No.18/11-L 20715 24189 24319Chak No.17/SP 24159 29517 29766 Chak No.30/11-L 15949 18624 18747Chak No.15/SP 17581 21480 21661 Chak No.169/9-L 24073 28111 28296Kumhariwala 18579 22699 22891 Chak No.168/9-L 17800 20785 20922Mousewal 16454 20103 20273 Chak No.57/12-L 21251 24815 24979Boyle Gang 21068 25740 25958 Chak No.62/12-L 22826 26654 26830Pir Ghani 19925 24344 24549 Chak No.118/12-L 23397 27321 27501Jagga Baloch 20633 25209 25422 Chak No.101/12-L 24236 28301 28487Behram Pur 21376 26117 26337 Chak No.6/14-L 19823 23148 23300Feroz Pur Chistian 18490 22591 22781 Chak No.4/14-L 20518 23959 24117Kalyana 20394 24917 25127 Chak No.7/14-L 16378 19125 19251Hotta 22719 27757 27992 Chak No.39/14-L 26514 30961 31165Chak No.15/KB 18008 22002 22188 Chak No.116/7-CR 19133 22342 22489Pacca Sidhar 21435 26189 26410 Chak No.69/12-L 25231 29463 29657Dhawana 20188 24665 24874 Chak No.82/12 21505 25112 25277Chak No.37/SP 20892 25525 25741 Chak No.90/12-L 21143 24689 24852Chak No.30/SP 19686 24052 24255 Chak No.96/12-L 20967 24484 24645Maka Hans 22740 27783 28018 Chak No.28/14-L 22979 26833 27010Dhapai 21197 25898 26117 Chak No.20/14-L 21976 25662 25831Chak Sandhay Khan 24489 29920 30173 Sahiwal TehsilChak No.93/D 23566 28790 29036 Chak No.78/5R 25243 29858 30070Chak No.85/D 19551 23887 24089 Chak No.85/6R 25663 30355 30570Chak No.96/D 18027 22025 22211 Chak No.86/6R 15216 17998 18125
Chak No.87/6R 15672 18537 18669Chak No.89/6R 22886 26361 26547
Chichawtni Tehsil Chak No.92/6R 23757 28100 28299Murad Ke Kathia 19228 22453 22601 Chak No.99/6R 19109 22603 22763Chak No.36/12-L 25381 29638 29833 Muhammad Pur 21620 25100 25277Chak No.110/7-R 17062 19924 20055 Chak No.88/9-L 20070 23742 23910Chak No.112/7-R 21049 24579 24741 Chak No.91/9-L 20546 24302 24475Chak No.8/11-L 22313 26055 26227 Chak No.93/9-L 15759 18589 18721Chak No.6/11-l 19566 22848 22998 Chak No.133/9-L 24855 29399 29607Chak No.10/11-L 18987 22171 22318 Chak No.138/9-L 17680 20912 21061Chak No.23/11-L 18358 21437 21578 Chak No.58/GD 16946 20044 20186Chak No.109/12-L 24565 28685 28874 Aurangabad 23172 27290 27484Chak No.110/12-L 19234 22460 22608 Chak No.50/GD 17117 20246 20390Chak No.45/12-L 23638 27603 27784 Chak No.48/GD 18434 21804 21959Chak No.50/12-L 15290 17854 17972 Chak No.69/4-R 23016 27224 27417Chak No.180/9-L 25209 29437 29631 Noor Shah 23150 27382 27576Chak No.162/9-L 18643 21170 21913
331
Estimated as on
POPULATION
Table 214:- Population of Rural Union Councils by Tehsil, The Punjab-Contd.
District/Tehsil/Rural Union Council
Population Population
1998 Census
District/Tehsil/Rural Union Council
SAHIWAL DISTRICT
1998 Census
Estimated as on

30-06-08 31-12-08 30-06-08 31-12-08
Karyal 16005 18931 19065 Chak No.483/ EB 24622 29813 30058Chak No.65/5-L 19400 22947 23109 Gaggoo 21609 26165 26380Chak No.67/5-L 16388 19384 19521 Chak No.225/ EB 23899 28938 29176Chak No.58/5-L 26880 31794 32020 Chak No.223/ EB 27143 32866 33136Chak No.56/5-L 17877 21145 21295 Chak No.173/ EB 21775 26366 26583Chak No.73/5-L 26706 31589 31812 Sheikh Fazal 26214 3171 32002Chak No.80/5-L 17499 20698 20845 Chak No.403/ EB 19677 23826 24022Chak No.62/4-R 19725 23213 23377 Chak No.124/ EB 24007 29069 29308Chak No.61/4-R 15661 18524 18655 Chak No.425/ EB 19370 23454 23647Chak No.77/5-R 17065 20185 20328 Chak No.199/EB 20142 24389 24589Chak No.129/9-L 19928 23571 23738 Chak No.257/EB 20925 25337 25545Chak No.114/9-L 18582 21979 22135 Mailsi TehsilChak No.119/9-L 17124 20257 20401 Ali Wah 23521 29001 29259Chak No.141/9-L 22596 26727 26916 Shah Sattar 20653 25465 25691Chak No.142/9-L 16307 19288 19425 Alam Pur 23141 28533 28786Chak No.153/9-L 18505 21891 22046 Fadda 28213 34787 35095Chak No.112/9-L 24262 28698 28901 Borana 20167 24866 25086Chak No.185/9-L 21663 25624 25805 Karampur (partly) 6214 7662 7730Mir Dad Maufi 19994 23649 23817 Muhammad Shah 20491 25265 25489Harappa 23940 28317 28517 Warisi Wahin 20298 25028 25249Chak No.1/14-L 22171 26224 26410 Fateh Pur 24269 29924 30189Dadra 19672 25568 25749 Jalla Jeem (partly) 3038 3746 3779
Kikri Khurd 21755 26824 27062Bland Pur 26442 32603 32892
Burewala Tehsil Jahan Pur 20156 24852 25073Chak No.435/ EB 21043 25480 25689 Sargana 23221 28632 28885Chak No.499/ EB 22006 26646 26865 Sandhal 20050 24722 24941Chak No.148/ EB 19521 23637 23831 Lali Pur 19494 24036 24249Chak No.521/ EB 19724 23883 24079 151/WB 21466 26468 26702Chak No.457/ EB 20108 24348 24548 Graha More 24174 29807 30071Chak No.327/ EB 20450 24762 24965 Mitru 20905 25776 26004Chak No.267/ EB 20966 25387 25595 Zaheer Abad 22420 27644 27889Chak No.287/ EB 22179 26855 27076 86/WB 19873 24503 24721Sahuka 25687 31103 31359 Shitab Garh 26095 32175 32460Dewan Sahib 21781 26373 26590 Lal Sagu 24337 30008 30274Chak No.305/ EB 20344 24633 24836 Kharala 22931 28274 28525Chak No.291/ EB 23094 27963 28193 T.S.Pur 23140 28532 28785Mouza Jamlera 19018 23028 23217 335/WB 27046 33348 33643Chak No.495/ EB 29122 35262 35552 Seharan 20602 25402 25627Suldera 24060 29133 29372
332
Estimated as onDistrict/Tehsil/Rural Union Council
POPULATION
Table 214:- Population of Rural Union Councils by Tehsil, The Punjab-Contd.
District/Tehsil/Rural Union Council
Population Population
1998 Census
Estimated as on 1998 Census
VEHARI DISTRICT
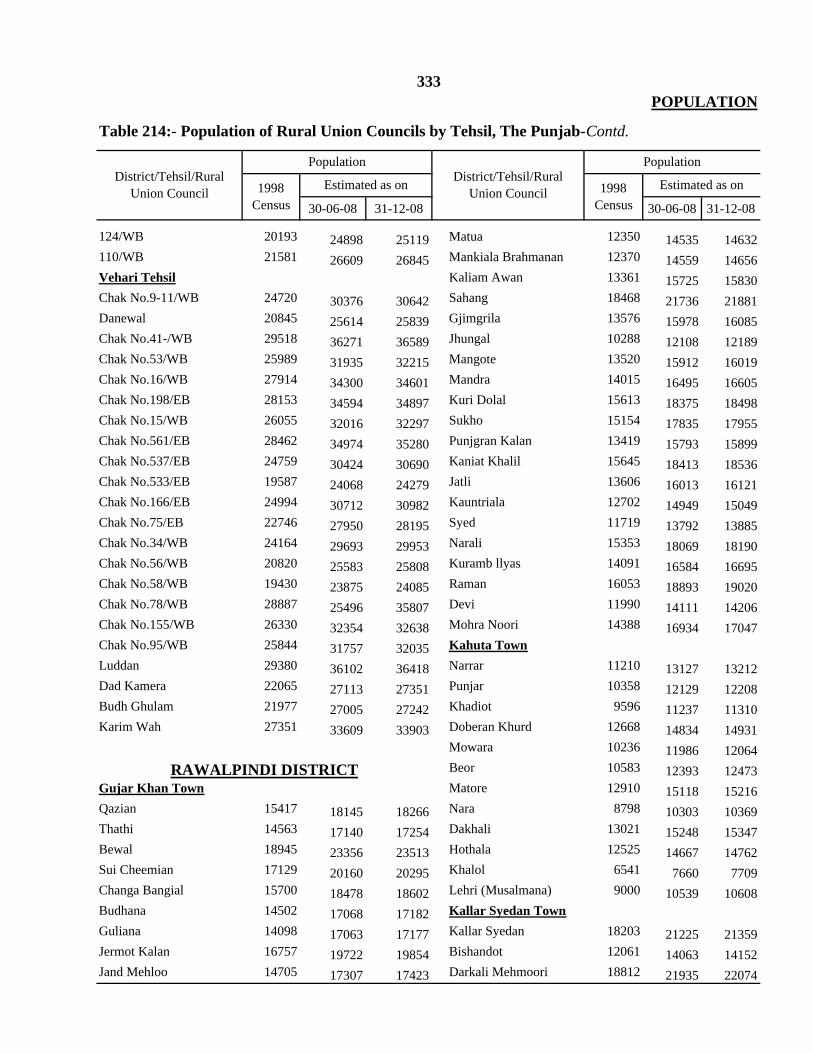
30-06-08 31-12-08 30-06-08 31-12-08
124/WB 20193 24898 25119 Matua 12350 14535 14632110/WB 21581 26609 26845 Mankiala Brahmanan 12370 14559 14656Vehari Tehsil Kaliam Awan 13361 15725 15830Chak No.9-11/WB 24720 30376 30642 Sahang 18468 21736 21881Danewal 20845 25614 25839 Gjimgrila 13576 15978 16085Chak No.41-/WB 29518 36271 36589 Jhungal 10288 12108 12189Chak No.53/WB 25989 31935 32215 Mangote 13520 15912 16019Chak No.16/WB 27914 34300 34601 Mandra 14015 16495 16605Chak No.198/EB 28153 34594 34897 Kuri Dolal 15613 18375 18498Chak No.15/WB 26055 32016 32297 Sukho 15154 17835 17955Chak No.561/EB 28462 34974 35280 Punjgran Kalan 13419 15793 15899Chak No.537/EB 24759 30424 30690 Kaniat Khalil 15645 18413 18536Chak No.533/EB 19587 24068 24279 Jatli 13606 16013 16121Chak No.166/EB 24994 30712 30982 Kauntriala 12702 14949 15049Chak No.75/EB 22746 27950 28195 Syed 11719 13792 13885Chak No.34/WB 24164 29693 29953 Narali 15353 18069 18190Chak No.56/WB 20820 25583 25808 Kuramb llyas 14091 16584 16695Chak No.58/WB 19430 23875 24085 Raman 16053 18893 19020Chak No.78/WB 28887 25496 35807 Devi 11990 14111 14206Chak No.155/WB 26330 32354 32638 Mohra Noori 14388 16934 17047Chak No.95/WB 25844 31757 32035 Kahuta TownLuddan 29380 36102 36418 Narrar 11210 13127 13212Dad Kamera 22065 27113 27351 Punjar 10358 12129 12208Budh Ghulam 21977 27005 27242 Khadiot 9596 11237 11310Karim Wah 27351 33609 33903 Doberan Khurd 12668 14834 14931
Mowara 10236 11986 12064Beor 10583 12393 12473
Gujar Khan Town Matore 12910 15118 15216Qazian 15417 18145 18266 Nara 8798 10303 10369Thathi 14563 17140 17254 Dakhali 13021 15248 15347Bewal 18945 23356 23513 Hothala 12525 14667 14762Sui Cheemian 17129 20160 20295 Khalol 6541 7660 7709Changa Bangial 15700 18478 18602 Lehri (Musalmana) 9000 10539 10608Budhana 14502 17068 17182 Kallar Syedan TownGuliana 14098 17063 17177 Kallar Syedan 18203 21225 21359Jermot Kalan 16757 19722 19854 Bishandot 12061 14063 14152Jand Mehloo 14705 17307 17423 Darkali Mehmoori 18812 21935 22074
333
District/Tehsil/Rural Union Council
POPULATION
Table 214:- Population of Rural Union Councils by Tehsil, The Punjab-Contd.
District/Tehsil/Rural Union Council
Population Population
1998 Census
Estimated as on 1998 Census
Estimated as on
RAWALPINDI DISTRICT

30-06-08 31-12-08 30-06-08 31-12-08
Samote 12083 14089 14178 Dhok Munshi Khan 15346 16527 16576Manianda 13555 15805 15905 RahmatAabad 16649 17930 17983Sakot 17906 20878 21011 Kotha Kalan 21357 2300 23068Kanoha 15306 17847 17960 Morgah 16143 17385 17436Choa Khalsa 14581 17001 17109 Adiala 19681 21195 21258Nala Musalmanan 9147 10665 10733 Dhamian Syedan 12399 13353 13392Guff 16815 19606 19731 Dhmaial 19597 21105 21167Ghazan abad 10884 12691 12771 Lakhan 12199 13138 13176Kotli Sattian Town Chak Jalal Din 17783 19151 19208Karore 7876 8482 8507 Garja 9327 10045 10074Dheer Kot Satian 7111 7658 7681 Bijnial 12740 13720 13761Wahgal at Dhanda 10078 10853 10885 Ranial 11571 12461 12498Malot Sattian 6462 6959 6980 Chahan 11595 12487 12524Santh Saroola 8988 9679 9708 Sihal 11494 12378 12415Kotli Sattian 7219 7774 7797 Kolian Hameed 12933 13928 13969Darnoian 8078 8699 8725 Chakri 13412 14444 14487Bhattian 9156 9860 9890 Parial 12483 13443 13483Lehtrar Bala 9754 10504 10535 Raika Mira 13229 14247 14289Ariari 6801 7324 7346 Chakbeli Khan 17779 19147 19203Murree Town Gagan 12992 13992 14033Dewal 11052 11799 11834 Chauntra 14342 15445 15491Phagwari 13060 13943 13984 Banda 15482 16673 16722Potha Sharif 10190 10879 10911 Tarahia 10232 11019 11052Gehl 9488 10129 10159 Bassali 14715 15847 15894Rewat 9172 9792 9821 Takhat Pari 12577 13545 13585Schrbagla 10869 11604 11638 Baggar Sheikhan 14735 15869 15916Darua Gali 11414 12185 12222 Lodhra 11494 12378 12415Ghora Gali 14410 15384 15429 Sagri Kalan 15958 17186 17237Numbal 11547 12327 12364 Mughal 12366 13317 13357Mussiari 9945 10617 10649 Jhatta Hatial 10513 11322 11355Angoori 11414 12185 12222 Kalial 5119 5513 5529Tret 14184 15143 15187 Taxila TownCharhan 11792 12589 12626 Thatha Khalil 15983 25333 25598Ban 6514 6954 6975 Jalala 12951 20527 20742Potohar Town Khurram Paracha 8488 13453 13594Shakrial (Shumali) 19451 20947 21009 Usman Khattar 13859 21966 22196Shakrial (janubi) 14884 16029 16076 Ghari Sikandar 16626 2632 26628Khanna Dak 21768 23443 23512 Lab Thathoo 16161 25615 25883Gnagal 14965 16116 16164 Wah (Rural) 16299 25834 26104Chaklala 18534 19960 20019
334
Estimated as onEstimated as on 1998 Census
District/Tehsil/Rural Union Council
POPULATION
Table 214:- Population of Rural Union Councils by Tehsil, The Punjab-Contd.
District/Tehsil/Rural Union Council
Population Population
1998 Census
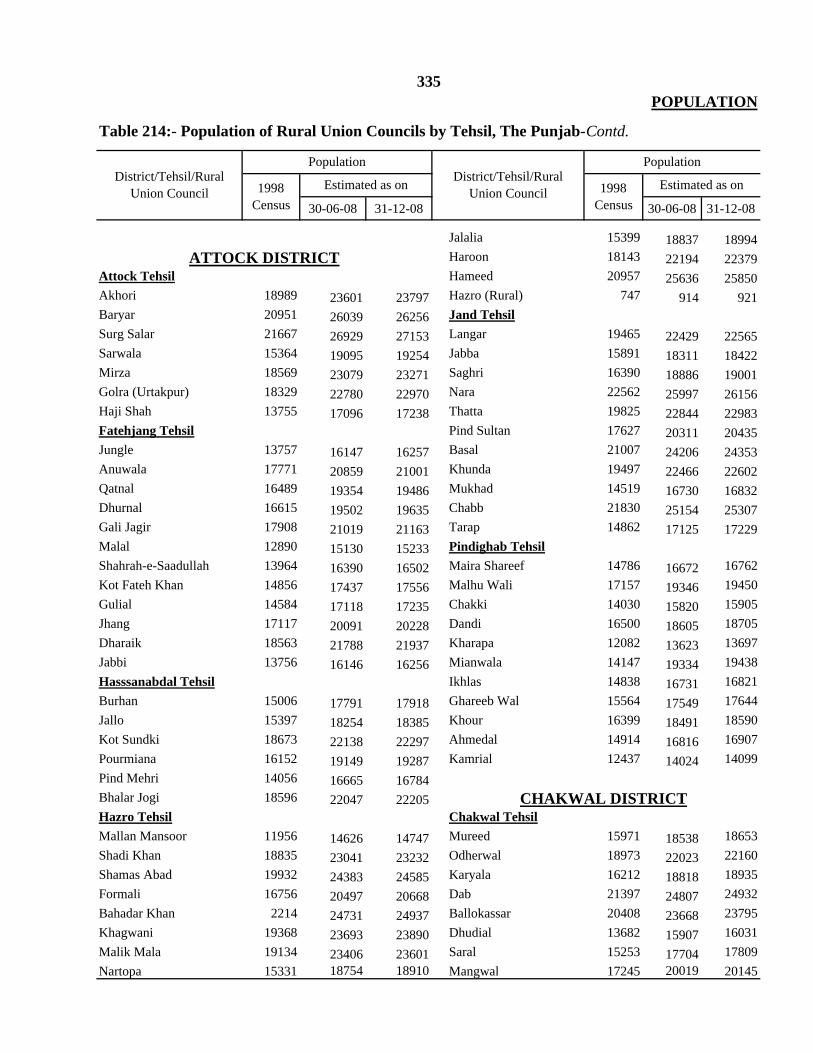
30-06-08 31-12-08 30-06-08 31-12-08
Jalalia 15399 18837 18994Haroon 18143 22194 22379
Attock Tehsil Hameed 20957 25636 25850Akhori 18989 23601 23797 Hazro (Rural) 747 914 921Baryar 20951 26039 26256 Jand TehsilSurg Salar 21667 26929 27153 Langar 19465 22429 22565Sarwala 15364 19095 19254 Jabba 15891 18311 18422Mirza 18569 23079 23271 Saghri 16390 18886 19001Golra (Urtakpur) 18329 22780 22970 Nara 22562 25997 26156Haji Shah 13755 17096 17238 Thatta 19825 22844 22983Fatehjang Tehsil Pind Sultan 17627 20311 20435Jungle 13757 16147 16257 Basal 21007 24206 24353Anuwala 17771 20859 21001 Khunda 19497 22466 22602Qatnal 16489 19354 19486 Mukhad 14519 16730 16832Dhurnal 16615 19502 19635 Chabb 21830 25154 25307Gali Jagir 17908 21019 21163 Tarap 14862 17125 17229Malal 12890 15130 15233 Pindighab TehsilShahrah-e-Saadullah 13964 16390 16502 Maira Shareef 14786 16672 16762Kot Fateh Khan 14856 17437 17556 Malhu Wali 17157 19346 19450Gulial 14584 17118 17235 Chakki 14030 15820 15905Jhang 17117 20091 20228 Dandi 16500 18605 18705Dharaik 18563 21788 21937 Kharapa 12082 13623 13697Jabbi 13756 16146 16256 Mianwala 14147 19334 19438Hasssanabdal Tehsil Ikhlas 14838 16731 16821Burhan 15006 17791 17918 Ghareeb Wal 15564 17549 17644Jallo 15397 18254 18385 Khour 16399 18491 18590Kot Sundki 18673 22138 22297 Ahmedal 14914 16816 16907Pourmiana 16152 19149 19287 Kamrial 12437 14024 14099Pind Mehri 14056 16665 16784Bhalar Jogi 18596 22047 22205Hazro Tehsil Chakwal TehsilMallan Mansoor 11956 14626 14747 Mureed 15971 18538 18653Shadi Khan 18835 23041 23232 Odherwal 18973 22023 22160Shamas Abad 19932 24383 24585 Karyala 16212 18818 18935Formali 16756 20497 20668 Dab 21397 24807 24932Bahadar Khan 2214 24731 24937 Ballokassar 20408 23668 23795Khagwani 19368 23693 23890 Dhudial 13682 15907 16031Malik Mala 19134 23406 23601 Saral 15253 17704 17809Nartopa 15331 18754 18910 Mangwal 17245 20019 20145
335
Estimated as onDistrict/Tehsil/Rural Union Council 1998
Census1998
CensusEstimated as on
Population
POPULATION
Table 214:- Population of Rural Union Councils by Tehsil, The Punjab-Contd.
District/Tehsil/Rural Union Council
Population
ATTOCK DISTRICT
CHAKWAL DISTRICT

30-06-08 31-12-08 30-06-08 31-12-08
Chak Umra 17288 20056 20180 Lawa 22480 26326 26501Padshahan 15760 19294 19408 Dhaular 15475 18122 18243Chak Malook 19888 23164 23387 Jhatla 13350 15634 15738Bheen 10050 11665 11790 Bhilomar 15439 18080 18200Balkassar 19866 23135 23362 Bidher 19051 22310 22459Warwal 14097 16362 16466 Kot Qazi 14540 17028 17141Dullah 14859 17254 17364 Pichnand 14598 17095 17209Begal 15149 17585 17690 Dhurnal 16498 19320 19449Kot Chaudhrian 15429 17910 18022 Kot Gulla 13866 16031 16137Karsal 11991 13919 14006Khairpur 14276 16571 16674Jand 16413 16516 16619 Dina TehsilMulhal Mughlan 19390 19493 19596 Janjil 10599 12632 12724Jandkhan Zada 11366 11469 11572 Badlot 13573 16177 16294Dhumman 9842 9945 10048 Gharhmahal 12492 14888 14996Khotian 18755 28906 29009 Khokha 13799 16446 16566Choa Ganj Ali Shah 12225 12328 12431 Sohan 16149 19247 19387Jaswal 14186 14289 14392 Madu Kalas 15488 18459 18593Kalar Kahar Tehsil Ladhar 16125 19218 19358Kallar-Kahar 14005 14108 14211 Mughalabad 12748 15193 15304Bhoun 18070 18173 18276 Dhanyala 15426 18385 18519Bharpur 13410 13513 13616 Jhelum TehsilMunara 12869 12972 13075 Nara 12907 15457 15569Noorpur 14434 14537 14640 Nakka Kurd 16879 20214 20360Buchal Kallan 18907 19010 19113 Darapur 12831 15366 15477Miani 15856 15959 16062 Chotala 16687 19984 20128Choa Saiden Shah Sanghoi 20678 24764 24942Choa Saiden Shah (Rural) 421 476 478 Kotla Faqir 20291 2430 24475Dandoot 16025 18101 18197 Monan 21840 26155 26344Dalwal 15981 18051 18147 Chak Jamal 17171 20564 20712Dulmial 17040 19247 19349 Kala Gujran 12933 15488 15600Lahr Sultan Pur 19202 21689 21804 Chak Khasa 20446 24486 24662Basharat 14283 16133 16219 Bokan 17850 21377 21531Ara 8886 10037 10090 Pind Dadan Khan Talagang Tehsil Kandwal 15163 17604 17716Tehi 13899 16277 16385 Lilla 19512 22653 22797Jasial 12061 14124 14218 Ahmadabad 14552 16894 17002Kot Sarang 16873 19760 19891 Toba 14308 16611 16717Naka Kahoot 19162 22440 22589 Golepur 17763 20622 20754Jabbi Shah Dilawar 16057 18804 18929 Gujjar 14984 17292 17402Multan Khurd 14932 17487 17603 Sauwal 14919 17321 17431Budial 16244 19023 19149 Haranpur 15003 17418 17529Saghar 16317 19109 19236 Dharyala Jalip 16822 19530 19654Pira Fatehial 22303 26119 26292 Daulatpur 15141 17578 17690Tamman 14596 17093 17207 Chak Shadi 19189 22278 22420Leti 13644 15978 16084 Pindi Saidpur 18848 21882 22021Thoha Mehram Khan 21447 251116 25283
336
1998 Census
Estimated as on 1998 Census
Estimated as onDistrict/Tehsil/Rural Union Council
POPULATION
Table 214:- Population of Rural Union Councils by Tehsil, The Punjab-Contd.
District/Tehsil/Rural Union Council
Population Population
JHELUM DISTRICT

30-06-08 31-12-08 30-06-08 31-12-08
Jala Pur Sharif 19824 23015 23162 Chak No.15/SB 12653 14012 14079Khewra (R) 1085 1260 1268 Kot Momen TehsilSohawa Tehsil Mauzzamabad 15106 16820 16900Sohawa (R) 6543 7389 7428 Lalliani 15912 17717 17801Pind Matay Khan 17395 19644 19748 Mateela 14898 16588 16667Phulray Syedan 16923 19111 19212 Chak No.11/SB 16239 18082 18167Pail Bannay Khan 14471 16341 16427 Kot Raja 15707 17489 17572Lehri 12951 14626 14703 Hujjan 15041 16748 16827Domeli 17926 20244 20351 Chak No.19/SB 16365 18222 18308Jajial 12713 14357 14433 Bucha Kallan 16728 18626 18714Adrana 15034 16978 17068 Mela 16098 17925 18009Nagial 15319 17300 17391 Bhabra 16690 18584 18672Kohali 14418 16282 16368 Takhat Hazara 17366 19336 19428
Ghullapur 14739 16411 16489Midh Ranjha 16239 18082 18167
Bhalwal Tehsil Kot Miana 14937 16632 16710Midh Paragna Miani 16694 18487 18576 Gurna 16805 18712 18800Chak Saida 15165 16794 16874 Doda 15496 17254 17336Kalyanpura 14991 16601 16681 Naseerpur Kalan 13359 14875 14945Kot Ahmed Khan 14339 15879 15955 Garhi Kala 13143 14634 14703Hazoorpur 13991 15494 15568 Jam Muhammad wala 18461 20556 20653Fateh Garh 13526 14979 15051 Sahiwal TehsilKhan Muhammadwala 19944 22086 22192 Vijh 13050 14957 15045Alipur Syedian 15607 17283 17366 Kudlathi Ara 17198 19712 19828Dhal 15323 16969 17050 Lakhiwal 18475 21175 21300Chak Ramdas 16053 17777 17862 Radhan 16083 18434 18542Chawa 17850 19767 19862 Dera Jara 17021 19509 19624Rattokala 14651 16225 16302 Azmatwala 18203 20864 20986Thatti Noor 15516 17183 17265 Sial Sharif 18027 20662 20783Chak No.10/ML 14807 16398 16476 Sajoka 20357 23333 23470Purana Bhalwal 14514 16073 16150 Jahanian Shah 19072 21860 21988Chak No.18/NB 13753 15230 15303 Majoka 13893 15924 16017Chak No.10/NB 19835 21966 22071 Thathi Jalal at 14347 16444 16541Chaba Purana 13474 14921 14993 Sargodha TehsilChak No.8/NB 13933 15430 15503 Jaura Sakasar 16998 20743 20900Dhori 14056 15566 15640 Chak No.19/NB 12320 15035 15148Salam 14281 15815 15891 Ajnala 11847 14457 14567Deowal 18773 20790 20889 Mitha Lak 14554 17761 17895
337POPULATION
District/Tehsil/Rural Union Council
Table 214:- Population of Rural Union Councils by Tehsil, The Punjab-Contd.
District/Tehsil/Rural Union Council
Population Population
1998 Census
Estimated as on 1998 Census
Estimated as on
SARGODHA DISTRICT

30-06-08 31-12-08 30-06-08 31-12-08
Chak No.88/SB 15962 19479 19627 Bakhar Bar 19559 22069 22187Chokera 16221 19795 19945 Aqil Shah 20018 22587 22707Chak No.50/NB 15664 19116 19260 Kandan 19310 21788 21904Chak No.40/NB 14848 18120 18257 Mangowal 15990 18042 18138Chak No.36/NB 13156 16055 16176 Jahanabad 14827 16730 16819Mari 20200 24651 24838 Sabowal 15070 17004 17095Ludewala 13106 15994 16115 Jalalpur Jadeed 16521 18641 18741Chak No.58/NB 15498 18913 19056 Gondal 16729 18876 18977Dherema 18943 23117 23292 Sillanwali TehsilChak No.67/ANB 16058 19596 19745 Shah Nikdar 13813 16208 16316Kalowal 14142 17258 17389 Chak No.163/NB 13889 16297 16406Haiderabad Town 13814 16858 16985 Chak No.135/SB 15951 18716 18842Chak No.71/NB 12761 15573 15691 Chak No.126/SB 19769 23196 23352Remount Depot 16149 19707 19856 Chak No.48/SB 16225 19038 19166Chak No.92/NB 16574 20226 20379 Chak No.49/SB 15168 17797 17917Chak No.90/NB 20811 25397 25589 Chak No.138/SB 14477 16987 17101Chak No.104/NB 17323 21140 21300 Chak No.111/NB 13687 16060 16168Chak No.97/NB 19841 24213 24396 Shaheenabad 19840 23279 23436Chak No.109/SB 13736 16763 16890 Chak No.131/SB 16240 19055 19183Chak No.104/SB 17104 20873 21030 Chak No.129/NB 16416 19262 19391Chak No.113/SB 18989 23173 23348 Chak No.147-48/NB 13879 16285 16394Chak No.46/SB 18512 22591 22762 Chak No.137-38/NB 13534 15880 15987Chak No.45/SB 18281 22309 22478 Chak No.152/NB 13922 16335 16445Chak No.52/SB 14069 17169 17299 Chak No.118/NB 14395 16890 17004Chak No.40/SB 12990 15852 15972Chak No.34/SB 13710 16731 16858Chak No.100/SB 17267 21072 21231 Bhakkar TehsilChak No.36/SB 16011 19539 19687 Godola 22035 27228 27471Chak No.33/SB 14762 18015 18151 Daggar Aulakh 23703 29289 29551Luqman 17302 21114 21274 Katchi Shahani 22752 28114 28365Chak No.23/ASB 15672 19125 19270 Daggar Rehtas 24182 29881 30148Laluwali 14475 17665 17798 Yousaf Shah 22356 27625 27871Chak No.74/SB 12447 15190 15305 Sial 25724 31787 32070Chak No.70/SB 13383 16332 16455 Mullanwali 28369 35055 35368Chak No.84/SB 13752 16782 16909 Pir Ashab 25324 31292 31572Chak No.96/SB 13767 16801 16928 Dhandla 26983 33342 33640Shah Pur Tehsil Karari Kot 29458 36401 36726Ghangwal 13452 15178 15259 Behal 23582 29140 29400Khawajabad 12896 14551 14629 Notak 26766 33074 33369Kalra 16717 18862 18963 Chak No.61/ML 25985 32109 32396Kot Bhai Khan 14912 16826 16915 Khansar 24208 29913 30180Kot Pehlwan 15556 17552 17646 Other Rural 4165 5147 5193
Estimated as on
338
Estimated as on 1998 Census
District/Tehsil/Rural Union Council1998
Census
BHAKKAR DISTRICT
POPULATION
Table 214:- Population of Rural Union Councils by Tehsil, The Punjab-Contd.
District/Tehsil/Rural Union Council
Population Population

30-06-08 31-12-08 30-06-08 31-12-08
Darya Khan TehsilKohawar Kalan 31610 38869 39210 Chak No.59/MB 14962 17476 17590Daggar Qureshian 31593 38848 39189 Sandral 14672 17137 17249Baranga 28954 35603 35915 Chak No. 50/MB 20492 23935 24092Dullewala (R) 25447 31290 31565 Hassanpur Tiwana 19368 22622 22770Panggrain 29401 36152 36470 Girote 21626 25259 25425Angra Daggar 31771 39065 39408 Roda 21582 25208 25373Kallur Kot Tehsil Bajar 20465 23903 24060Kanjan 21361 25655 25858 Botala 17826 20821 20957Maibel 21450 25762 25966 Jabbi 18322 21400 21541Malana Daggar 20263 24336 24529 Warcha 16784 19604 19732Heitu 21014 25238 25438 Goliwali 21091 24634 24796Ghulaman 31993 38424 38728 Bandial 19855 23191 23343Fazil 21571 25907 26112 Utra Janubi 26875 31390 31596Jandanwala (R) 7603 9131 9204 Gunjial Janubi 21733 25384 25551Chak No.63/DB 21443 25753 25957 Okhali Mohla 15482 18083 18202Jandanwala (R) 21053 25285 25485 Chak 14/MB 16303 19042 19167Mankera Tehsil Noorpur TehsilChak No.67/Ml 22784 28008 28254 Adhi Kot 20744 24100 24253Litten 21687 26660 26893 Rangpur 20471 23783 23934Patti Bilanda 23292 28633 28884 Rahdari 16477 19143 19265Mankera (R) 13215 16245 16388 Jharkil 15824 18384 18501Gohar wala 21930 26958 27195 Khatwan 14947 17365 17476Mahni 27022 33218 33509 Khai Khurd 15978 18563 18681Haiderabad 30734 37781 38112 Jaura Kalan 15157 17609 17721
Jamali 15458 17959 18076Pelovance 18968 22037 22177
Khushab TehsilUchali 14105 16475 16583Kufri 14154 16532 16640 Isa Khel TehsilAnga 14523 16963 17074 Khaglan wala 20276 20379 20482Khoora 15404 17992 18110 Kallur 19451 19554 19657Khabeki 15189 17741 17857 Sultan Khel 20363 20466 20569Padhrar 18787 21943 22087 Traq 18467 22063 26359Daiwal 15506 18111 18230 Kammar Mushani Pacca 16088 19221 22964Katha Saghral 15507 18112 18231 Vanjari 16221 19379 23152Tilokar 15018 17541 17656 Tani Khel 19991 23884 28535Nari 14683 17150 17262 Chapri 20677 24703 29513Nali Shumali 15379 17963 18081 Kot Chandna 15120 18064 21581Waheer 14661 17124 17236 Tola Bangi Khel 16365 19551 23358Kund 15005 17526 17641 Tabi Sar 18996 22695 27114
1998 Census
Estimated as on
KHUSHAB DISTRICT
MIANWALI DISTRICT
339POPULATION
Table 214:- Population of Rural Union Councils by Tehsil, The Punjab-Contd.
District/Tehsil/Rural Union Council
PopulationDistrict/Tehsil/Rural
Union Council
Population
1998 Census
Estimated as on

30-06-08 31-12-08 30-06-08 31-12-08
Mianwali TehsilWatta Khel 18891 18994 19097 Chhidru 17128 17231 17334Yaru Khel 15927 16030 16133 Abba Khel 16682 16785 16888Shahbaz Khel 16230 16333 16436 Gulmiri 19723 19826 19929Rokhri 15788 15891 15994 Mazaffar Pur at Miras 18070 18173 18276Qureshian 17425 17528 17631 Muzaffar pur Janubi 21671 21774 21877Mochh 19575 19678 19781 Wan Bhachran 27066 27169 27272Dher Umid Ali Shah 16621 16724 16827 Shadia 19329 19432 19533Doud Khel at Pakki Shah 23633 23736 28839 Piplan TehsilMari 15458 15561 15664 Gujrat 15790 15893 15996Chakrala 12316 12419 12522 Doaba 21325 21428 21531Thamewali 16964 17067 17170 Alluwali 21446 21549 21652Ban Hafiz Jee 16738 16841 16944 Khola 22016 22119 22222Namal 17772 17875 17978 Vichvin Bala 16144 16247 16350Watta Khel 17505 17608 17711 Chak No.7/ML 17535 17638 17741Swans 21202 21305 21408 Dabba Baluchan 16158 16261 16364Musakhel 27721 27824 27927 Tibba Mehrban Shah 21000 21103 21206
Source:- i) For1998 Census: Respective Assistant Directors LGRD in the Punjab. ii) For Estimated Population 2008:- Bureau of Statistics, Punjab, Lahore
Table 214:- Population of Rural Union Councils by Tehsil, The Punjab-Concld.
District/Tehsil/Rural Union Council
PopulationDistrict/Tehsil/Rural
Union Council
Population
1998 Census
Estimated as on 1998 Census
Estimated as on
340POPULATION
1. Average Retail Prices of nine essential commodities.
2. Index Numbers of Wholesale Prices.
3. Inflation Rates.
4. Combined Consumer Price Index Numbers.
5. Spot Bullion Quotations.
6. Weekly Exchange Rates of U.S. Dollar.
7.Monthly Average Wholesale Prices of Wheat, Rice (Basmati), Kappas(American) and Gram (Whole).
341
Wholesale Price Index Numbers are designed to measure the directional
movement of Prices in the Primary and Wholesale Markets. Prices used are generally
those which conform to the Primary sellers, realizations at ex-factory or at an organized
wholesale level.
The Wholesale Price Index Numbers (WPI) were originally computed in
1960-61 as the price base which was subsequently switched by the Federal Bureau of
Statistics over to 1959-60 base. Later on, new series with base 1969-70 , 1975-76,
1980-81 and 1990-91 with enlarged coverage were computed. Now the base year has
been shifted to 2000-01.
RETAIL PRICESBureau of Statistics, Punjab collects retail Prices of 60 selected
commodities at eight Major Cities (Ex-Divisional Headquarters) of the Province.The prices are daily collected by the staff posted at these Major cities andtransmitted to the Headquarter’s office at Lahore. Daily Price situation report issubmitted to the Concerned Officers of the Province. This section includes yearlydata on average Retail Prices of nine essential commodities i.e. Wheat Atta,Gram Dal, Sugar White, Vegetable Ghee, Mutton, Beef, Kerosene Oil, Potatoand Onion for the years 1997-98 to 2006-07 and monthly data for theyears 2006-07 (July - June) and 2007-08 (July - April).
WHOLESALE PRICE INDEX (WPI)
EXPLANATORY NOTESON
PRICES SECTION
This section includes data on the following topics:-
342
RATE OF INFLATION
Rate of inflation can be measured through CPI, WPI or implicit deflator ofGDP, but the common practice to measure inflation is through CPI as given in thisbulletin.
CONSUMER PRICE INDEX (CPI)
Consumer Price Index Numbers are prepared in order to measure thepercentage change in the cost of purchasing a constant basket of goods and services of aparticular population during a given period of time.
Series of Consumer Price Index Numbers having 202 items with price base
1969-70 and weight base 1972 was started in 1973. Another series of CPI with price
base 1975-76 and weight base 1978 covering 357 items was started. Later on, two other
series with 1980-81 as base year covering 466 Consumer items and 1990-91 as base
year Covering 367 Consumer items were taken up.
With the changes in consumer preferences a new series of CPI with 2000-01 as base year covering 374 consumer items encompassing almost the entire range offamily’s basket of goods and services. The expenditure weight for the series wasderived on the basis of Family Expenditure Survey conducted for the period 2000-01.The survey covered Industrial,Commercial and Government employees with incomegroups upto Rs.3000/-, Rs.3001/- to 5000/-, Rs. 5001/- to Rs.12000/-, and above Rs.12000/-. The series have ten major expenditure groups viz. (i) Food & Beverages,(ii) Apparel, Textile and Footwear, (iii) House Rent, (iv) Fuel & Lighting, (v)Household Furniture & Equipment etc, (vi) Transport & Communication, (vii)Recreation, & Entertainment, (viii) Education, (ix) Cleaning Laundry & Personalappearance (x) Medicares.

Year / Month
Wheat Atta
(20Kg. Thaila)
Gram Dal
(Kg.)
Sugar White (Kg.)
Vegetable Ghee
(Loose Kg.)
Mutton (Kg.)
Beef (Kg.)
Kerosene Oil (Litre)
Potato (Kg.)
Onion (Kg.)
1997-98 160.00 19.73 19.63 45.91 98.30 50.77 11.45 9.17 10.131998-99 142.32 21.38 18.94 53.36 99.42 51.44 11.50 8.27 15.181999-00 157.58 24.26 20.89 47.97 101.74 51.89 12.60 9.22 6.90
2000-01 181.44 28.83 27.09 43.59 103.46 52.08 16.50 10.07 10.392001-02 176.45 33.80 22.68 48.92 104.93 52.38 17.89 12.03 9.642002-03 189.29 29.65 20.85 55.68 122.02 59.92 21.83 10.65 9.36
2003-04 209.33 23.23 19.25 60.57 157.94 72.42 23.56 9.64 11.162004-05 238.90 27.26 23.27 59.75 179.12 89.00 28.33 16.56 14.072005-06 254-84 29.71 33.86 59.91 205.91 104.99 35.53 20.92 12.85
2006-07 258.50 41.28 34.17 71.80 231.23 122.00 39.00 18.05 20.86
2006-07
July 248.43 37.11 39.50 60.62 231.25 121.56 38.75 22.00 11.86August 256.20 40.99 38.91 63.50 231.25 121.56 38.75 23.96 14.28September 257.13 42.61 38.09 65.13 231.25 121.56 38.75 24.80 15.43
October 257.13 42.72 35.25 65.13 231.25 121.56 38.75 26.63 23.43November 257.13 45.25 34.81 66.50 231.25 121.56 38.75 29.48 34.76December 257.13 45.19 32.85 68.00 231.25 121.56 38.81 18.35 36.42
January 257.13 45.06 32.24 72.30 231.25 121.56 39.06 12.67 27.79February 258.51 45.06 32.50 72.70 231.25 121.56 39.06 10.81 27.58March 259.38 40.56 32.47 73.65 230.64 121.56 39.06 10.81 21.04
April 264.48 36.88 32.16 79.56 231.01 1252.41 39.22 10.81 12.92May 265.19 36.94 31.25 84.23 231.56 123.75 39.50 10.81 12.99June 264.19 36.94 29.89 90.27 231.56 123.75 39.50 15.44 11.80
2007-08July 278.38 37.63 29.38 90.43 232.16 123.75 39.52 18.79 14.93August 281.14 38.52 30.35 91.06 234.13 123.77 39.56 18.56 16.43September 295.77 38.48 30.53 91.06 233.13 124.16 39.56 21.67 24.57
October 297.50 38.63 30.56 91.06 233.13 125.31 39.56 22.14 23.15November 301.40 38.63 30.56 97.01 233.13 125.31 39.56 21.35 22.87December 302.60 38.53 30.41 101.16 232.98 125.12 39.54 17.39 21.38
January 314.62 39.03 28.57 109.39 233.88 127.33 39.56 11.69 16.76February 298.70 39.13 27.00 117.00 234.06 127.81 43.82 10.94 13.56March 296.30 39.13 26.99 132.17 234.06 127.80 48.28 10.94 13.46
April 334.42 40.31 26.58 125.00 234.83 127.81 49.00 10.94 11.04Source:- Bureau of Statistics, Punjab, Lahore.
Table 215:- Average Retail Prices of Nine Essential Commodities, The Punjab( Rupees )
343PRICES

Effective Date of Prices
01-01-2003 32.50 21.14 20.7016-01-2003 32.64 21.72 20.6201-02-2003 32.96 21.72 21.3201-03-2003 35.74 25.05 23.6116-03-2003 37.11 25.93 24.6201-04-2003 33.27 24.53 21.0616-04-2003 30.58 21.28 19.0201-05-2003 30.13 20.23 19.2516-05-2003 28.88 19.91 18.5301-06-2003 30.12 19.91 18.7916-06-2003 30.83 20.02 18.83
01-07-2003 31.19 - 18.7616-07-2003 31.52 19.92 18.8701-08-2003 31.52 20.04 19.5416-08-2003 31.61 20.55 20.1501-09-2003 31.80 21.32 20.7116-09-2003 31.33 21.74 20.0701-10-2003 30.73 21.00 19.5216-10-2003 32.03 21.09 20.5401-11-2003 32.59 21.98 21.4116-11-2003 32.90 22.21 21.4701-12-2003 33.58 22.90 22.1616-12-2003 33.67 22.78 22.38
06-01-2004 35.48 23.85 23.2201-02-2004 35.33 23.85 23.5516-02-2004 34.47 23.77 22.1801-03-2004 34.80 23.77 22.4115-03-2004 34.75 23.77 21.9801-04-2004 34.57 23.44 21.9816-04-2005 35.57 24.02 23.0001-05-2004 36.92 24.37 24.0016-12-2004 39.50 25.96 25.50
01-01-2005 40.39 26.21 26.0402-02-2005 42.39 27.16 27.0401-03-2005 43.96 28.21 27.9816-03-2005 45.53 29.06 27.9830-06-2005 48.94 31.74 29.5301-09-2005 52.61 34.59 31.0001-10-2005 56.29 37.18 32.87
01-05-2006 57.70 38.73 35.2316-01-2007 53.70 37.70 35.2301-03-2008 58.70 42.70 38.3717-03-2008 62.81 44.13 41.1318-04-2008 65.81 47.13 41.1301-05-2008 68.81 50.12 41.13Source:- Hydrocarban Development Institute of Pakistan, Islamabad
Motor Gassoline HSD Kerosene Oil
PRICESTable 216:- Ex-Depot Sale Prices of P.O.L. Items, Pakistan
(Rupees per Litre)
344

Year/Month GeneralFood
Beverages & Tobacco
Apparel, Textile & Footwear
House Rent Fuel & Lighting
Household Furniture & Equipment
Transport & Commu-nication
Recreation Entertainment & Education
Education
Cleaning Laundry & Personal
Appearance
Medicine / Medicare
1997-98 203.96 213.02 187.81 195.29 210.59 191.79 181.59 186.84 - 201.81 212.781998-99 215.66 225.58 200.35 208.31 214.16 198.83 195.64 195.55 - 213.66 216.191999-00 223.39 230.61 211.28 217.12 226.95 204.52 212.40 204.59 - 225.10 218.83
2001-02 103.45 102.39 103.25 102.80 109.07 103.53 106.73 107.07 105.00 102.40 102.382002-03 106.25 105.40 106.78 103.54 117.81 106.90 111.60 107.21 109.92 107.37 105.592003-04 111.63 111.74 109.69 108.20 121.30 110.68 115.43 106.08 114.19 111.29 106.89
2004-05 121.98 125.67 112.98 120.42 125.77 117.34 125.11 105.93 117.55 115.90 107.942005-06 131.64 134.39 117.58 132.36 137.09 123.41 145.90 105.65 125.03 119.49 110.662006-07 142.21 148.29 123.70 141.21 149.43 131.61 148.96 105.75 134.07 124.54 120.94
2006-07
July 137.91 142.51 120.16 137.36 147.39 128.11 150.87 105.80 129.69 122.52 113.37August 139.63 145.70 120.44 138.12 148.50 128.50 151.08 105.82 130.14 122.84 117.75September 140.07 145.90 120.55 138.90 148.74 129.41 151.38 105.84 131.84 122.72 120.17
October 140.57 146.56 121.02 139.53 148.12 129.86 151.44 105.86 133.20 122.56 120.58November 141.59 148.69 121.32 140.14 147.26 130.59 151.60 105.87 133.47 123.54 120.26December 142.26 149.59 121.99 140.67 148.21 131.00 151.72 105.85 133.53 124.29 120.92
January 141.01 146.27 122.46 141.24 149.05 132.31 148.63 105.79 133.70 124.75 121.54February 142.47 148.35 125.09 142.10 151.13 132.79 148.74 105.56 134.97 125.19 121.72March 147.17 149.67 127.10 142.89 151.34 133.62 145.45 105.52 135.15 125.66 123.39
April 143.62 150.10 127.72 143.50 151.33 134.12 145.52 105.50 136.46 126.23 123.39May 144.94 152.77 127.95 144.28 151.05 134.33 145.53 105.81 136.62 126.79 124.00June 145.23 152.31 128.61 145.82 151.06 134.76 145.60 105.85 137.11 127.42 124.18
345
Source:- Federal Bureau of Statistics, Statistics Division, Government of Pakistan, Karachi.
PRICESTable 217 :-Combined Consumer Price Index Numbers by Commodity Group, Pakistan
(Base:1990-91=100)
(Base:2000-01=100)

346PRICES
Year/Month General Food Raw Materials
Fuel, Lighting & Lubricants
Manufac-tures
Building Materials
Table 218- Index Numbers of Wholesale Prices by Commodity Group, Pakistan
(Base: 1990-91 =100)1997-98 213.08 220.78 232.78 228.65 189.17 181.93
1998-99 226.60 235.68 256.10 248.88 195.02 183.78
1999-00 230.62 236.99 229.25 272.98 203.92 179.23
Base: 2000-01 = 100
2001-02 102.08 102.05 100.95 103.08 101.91 101.81
2002-03 107.77 105.62 115.51 115.95 103.67 102.90
2003-04 116.30 112.99 135.12 119.23 111.83 126.46
2004-05 124.14 125.03 110.44 138.01 113.05 143.79
Base: 2000 01 100
2004 05 124.14 125.03 110.44 138.01 113.05 143.79
2005-06 136.68 133.78 121.93 174.57 116.35 144.18
2006-07 146.17 145.68 138.85 184.13 119.92 151.82
2005-06
July 143.22 139.60 132.20 185.41 119.64 148.50July 143.22 139.60 132.20 185.41 119.64 148.50
August 144.32 142.43 132.15 185.82 119.81 147.99
September 144.97 143.16 136.50 185.54 119.90 147.04
October 144.26 143.41 128.25 185.88 119.03 147.19
November 145.54 145.02 135.10 186.12 118.76 148.78
December 146.08 145.31 140.15 186.09 118.76 149.28
January 144.33 144.40 141.75 177.90 118.96 149.91
February 145.07 145.76 142.40 176.60 119.05 157.13
March 146.55 146.79 142.96 180.09 120.49 156.57
April 148 25 147 77 144 83 184 93 121 14 157 01April 148.25 147.77 144.83 184.93 121.14 157.01
May 149.87 150.86 145.86 185.87 121.39 155.74
June 151.52 153.17 144.05 189.25 122.06 156.68
Source:- Federal Bureau of Statistics, Statistics Division, Government of Pakistan, Karachi.

347
INDEX NUMBERS OF WHOLESALE PRICES BY COMMODITY
2003-04 2004-05 2005-06 2006-07
INDEX
116 12
413
7 146
113 12
5 134 14
6
135
110
122 139
119
138
175 184
112
113 11
6 120
126
144
144 15
2
130
150
170
190
GENERAL FOOD RAW MATERIALS
FUELLIGHTING & LUBRICANTS
MANUF-ACTURES
BUILDINGMATERIALS
1 1-10
10
30
50
70
90
110

Year Consumer Price Index Inflation Rate (Based on CPI)
1996-97 189.18 11.80
1997-98 203.96 7.81
1998-99 215.66 5.74
1999-00 223.39 3.58
2001-02 103.54 3.54
2002-03 106.75 3.10
2003-04 111.63 4.57
2004-05 121.98 9.27
2005-06131.64 7.92
2006-07142.21 8.03
348
Source:- Federal Bureau of Statistics, Statistics Division, Government of Pakistan, Karachi.
PRICES
Table 219:- Inflation Rate in Pakistan
(CPI at 1990-91 Base)
( CPI at 2000-01 Base )

349
INFLATION RATE IN PAKISTANINFLATION RATE IN PAKISTAN2002-03 TO 2006-07
INDEX CONSUMER PRICE INDEX( At 2000-01 Base)160
142.21
121.98
131.64
120
140
106.75111.63
100
120
60
80
40
INFLATION RATE
3.108.037.929.27
4.57
0
20
2002-03 2003-04 2004-05 2005-06 2006-07
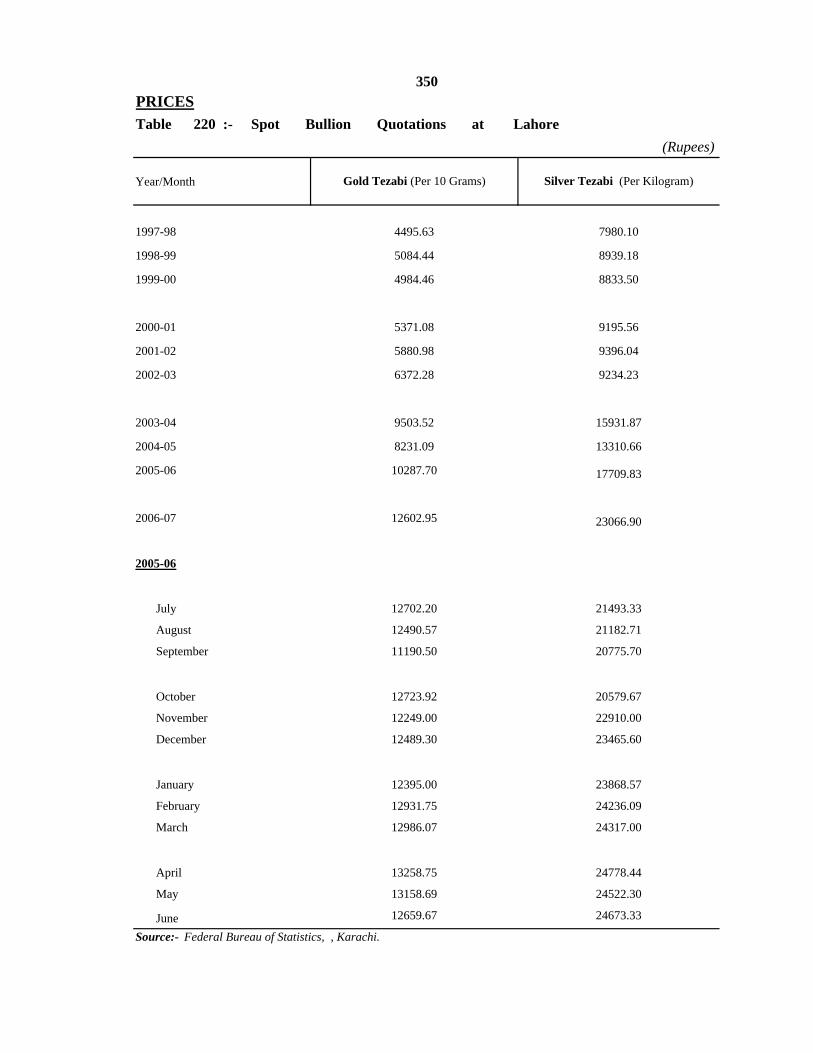
Year/Month
1997-98
1998-99
1999-00
2000-01
2001-02
2002-03
2003-04
2004-05
2005-06
2006-07
2005-06
July
August
September
October
November
December
January
February
March
April
May
June
8833.50
Silver Tezabi (Per Kilogram)
7980.10
8939.18
15931.87
13310.66
17709.83
23066.90
24778.44
24522.30
24673.33
Source:- Federal Bureau of Statistics, , Karachi.
9195.56
9396.04
21493.33
21182.71
9234.23
23868.57
24236.09
24317.00
20579.67
22910.00
23465.60
20775.70
Gold Tezabi (Per 10 Grams)
4495.63
5084.44
4984.46
5371.08
5880.98
6372.28
12602.95
9503.52
10287.70
8231.09
12249.00
12489.30
12702.20
12490.57
11190.50
350PRICESTable 220 :- Spot Bullion Quotations at Lahore
(Rupees)
12723.92
13258.75
13158.69
12659.67
12395.00
12931.75
12986.07

Buying (Exports) Selling (Imports)
2007January 6th 61.05 60.85
13th 61.05 60.85
20th 60.95 60.75
27th 60.85 60.65
February 3rd 60.88 60.6810th 60.90 60.70
17th 60.95 60.75
24th 60.77 60.57
March 3rd 60.84 60.6410th 60.84 60.64
17th 60.82 60.62
24th 60.80 60.60
April 1st (Sunday) 60.80 60.60
7th 60.86 60.66
14th 60.95 60.75
21st 60.80 60.60
28th 60.80 60.60
May 5th 60.72 60.52
12th 60.68 60.48
19th 60.78 60.58
26th 60.86 60.66
June 2nd 60.83 60.63
12th (Wednesday) 60.84 60.64
16th 60.72 60.52
23th 60.78 60.58
30th 60.65 60.45
351PRICES
Table 221:- Weekly Exchange Rates of U.S. Dollar.
Year/Month Date (Saturday)Exchange Rates (Rs. Per U.S. $)

Buying (Exports) Selling (Imports)
2007
July 7th 60.50 60.30
14th 60.45 60.25
21st 60.50 60.30
28th 60.50 60.30
August 4th 60.52 60.32
11th 60.55 60.35
18th 60.59 60.39
25th 60.90 60.70
September 1st 60.70 60.50
8th 60.70 60.50
15th 60.73 60.53
22nd 60.70 60.50
29th 60.70 60.50
October 6th 60.82 60.62
13th 60.75 60.55
20th 60.73 60.53
27th 60.75 60.55
November 3rd 60.82 60.62
10th 60.98 60.78
17th 61.25 61.05
24th 61.10 60.90
December 1st 61.23 61.03
8th 61.32 61.12
15th 61.35 61.15
22nd 61.30 61.10
29th 61.40 61.20
Source: Daily Newspaper " Dawn" Karachi .
Exchange Rates (Rs. Per U.S. $)Date (Saturday)
352
Year/Month
PRICES
Table 221:- Weekly Exchange Rates of U.S. Dollar-Concld .

Month Lahore Faisalabad Sargodha Multan Gujranwala
July 1097 1062 1043 1046 1048
August 1122 1127 1097 1092 1080
September 1122 1122 1105 1092 1087
October 1125 1122 1112 1092 1082
November 1128 1116 1121 1122 1097
December - 1133 1131 1139 1113
January 1155 1138 1166 1151 1135
February 1172 1138 1174 1156 1168
March 1187 1190 1169 1156 1175
April 1135 1141 1029 1111 1125
May 1120 1071 1083 1056 1095
June 1155 1090 1119 1122 1133
Month Lahore Faisalabad Sargodha Multan Gujranwala
July 2920 2808 2662 2955 2912
August 3050 2809 2690 2900 2825
September 3050 2910 2815 2870 2920
October 3200 2920 2888 3010 2967
November 3067 3000 2692 3017 3006
December 3108 3075 2656 3113 3183
January 3100 3177 2646 3096 3280
February 3658 3385 3188 3706 3417
March 3900 3833 3385 3450 3700
April 3763 3865 3396 3458 3762
May 4133 4138 3719 4200 3992
June 4383 4485 4427 4446 4275 Source :- Directorate of Agriculture (Economics and Marketing), Punjab, Lahore .
353
PRICESTable 222:- Monthly Wholesale Prices of Wheat, The Punjab: 2006-07
( Rs. Per 100 Kgs. )
Source :- Directorate of Agriculture (Economics and Marketing), Punjab, Lahore .
Table 223:-Monthly Average Wholesale Prices of Rice (Basmati) The Punjab:2006-07( Rs. Per 100 Kgs. )

Cotton Season/Month Khanewal Multan R.Y.Khan Bahawalpur Vehari
2005-06
September 2468 2475 2434 2412 2381
October 2732 2670 2652 2565 2690
November 2771 2729 2730 2717 2732
December 2679 2727 2737 2745 2713
January 2829 2771 2789 2745 2753
2006-07
September 3623 3574 3412 3521 3495
October 3810 3621 3654 3714 3772
November 3850 3700 3710 3865 3812
December 3785 3674 3700 3800 3715
January 3704 3559 3478 3684 3595
Month Lahore Faisalabad Sargodha Multan Gujranwala
July 3145 3072 2909 2985 3175
August 3375 3340 3155 3237 3362
September 3497 3320 3325 3310 3480
October 3685 3640 3650 3707 3842
November 3842 3515 3344 3506 3873
December 3650 3548 3354 3424 3573
January 4058 3817 3456 3992 3993
February 3700 3351 3155 3383 3650
March 3000 2828 2551 2833 3104
April 2763 2439 2284 2442 2831
May 2683 2379 2379 2633 2769
June 2717 2519 2510 2617 2823
PRICES
Source :- Directorate of Agriculture (Economics and Marketing), Punjab, Lahore .
Table 224:-Monthly Average Wholesale Prices of American Kappas, The Punjab( Rs. Per 100 Kgs. )
Source :- Directorate of Agriculture (Economics and Marketing), Punjab, Lahore .
Table 225:- Monthly Average Wholesale Prices of Gram (Whole), The Punjab: 2006-07
354
( Rs. Per 100 Kgs. )

385 Supper
2001-02 300 385 460 205 780 42
2002-03 300 385 460 205 800 42
2003-04 350 400* 485* 215* 850 42
2004-05 400 415* 510* 230* 925 42
2005-06 415 460* 560* 300* 1025 45
2006-07 425 - - 360* 1025 60
2007-08 625 60
Year
2002-03
2003-04
2004-05
2005-06
2006-07Source:- Director of Agriculture (Economics and Marketing )Punjab,Lahore
Year
1-6-2004
1-6-2005
1-4-2006
31-12-2006
31-12-2007*
113
134
Pakistan
4500
Punjab
2496
Total
149
(Number)
397 194 203
78212
Urban
105
Market Committees
Not announced by the Government.
Source:- Utility Store Corporation of Pakistan (Pvt.) Ltd. Islamabad. * Urban./Rural Break up not Available
133
134
134
183
184
184 155
200
Year Cotton
152
Sugarcane
Paddy
BasmatiIrri-6
(Number)
Vegetable Markets
Wheat
Table 228:-Utility Stores in Urban and Rural Areas, The Punjab
155
155
Source:- Directorate of Agriculture,Crop Reporting Service, Punjab, Lahore.
Table 227:- Number of Market Committees, Grain and Vegetable Markets, The Punjab
Grain Markets
*Intervention Prices Announced by the Government.
135 158
166
Rural
44
53
355PRICES
Table 226:-Procurement/Support Prices of Agricultural Commodities, The Punjab(Rs. Per 40 Kg)
134 184

2007-08
Budget Esti-mates
Revised Esti- mates
Budget Esti-mates
385092 382697 471258
274088 276252 356172
A. 186707 191264 233076
B. 72678 66640 97161
I 30342 31456 37315
i) Direct Taxes (On Income and Wealth) 10628 11113 13117
ii) Indirect Taxes (On Commodities and Transactions) 16697 17425 20757
iii) Others 3017 2918 3441
II 42336 35184 59846
i) Income from Property & Enterprise 16937 4762 29017
ii) Receipts from Civil Administration 3883 4099 4276
iii) Misc. Receipts 21516 26323 26553
C. 14703 18348 25935
D. 111004 106445 115086
i) 102127 97569 107143
ii) 8877 8876 7943
SourcFinance Department, Government of the Punjab, Lahore.
Tax Revenue (i to iii)
Non Tax Revenue ( i to iii )
2006-07
Total Provincial Consolidated Fund (A+D)
General Revenue Receipts (A to C)
Federal Transfers
Total Provincial Revenue (I+II)
Development Capital Receipts
Table 229:- Revenue and Capital Receipts (Summary) The Punjab Government
356
PUBLIC FINANCE
General Capital Receipts
Grnats
Total Capital Receipts (i+ii)
Item
( Million Rupees )

2007-08Budget Esti-
matesRevised Esti-
matesBudget Esti-
matesA. 233280 269898 315371B. 191378 201081 243487
1 123178 123827 1497652 24996 32305 347143 15514 17706 231834 26 31 275 5769 817 24846 5887 8099 71957 504 1044 6508 14102 15841 237469 1402 1411 1723
C. 41902 68817 718841 Agriculture 1186 1073 25392 Forestry 284 274 4043 Preservation of Wildlife & Control 63 103 794 Fisheries 35 36 745 Livestocks & Production 706 820 10146 Industries 31 - -7 Irrigation 63 69 4748 Low Cost Housing - 29 -9 Water Supply 5200 5175 6500
10 Environment Protection Planning 173 64 110011 Service & General Administration 45 4 1012 Board of Revenue 2 14 -13 Finance Department 1 - 114 Human Resource Management 4 - 815 Transport 28 323 -16 Religious Affairs/Auqaf 20 20 1517 Home Department - 9 2918 Police (AJP) 50 - 1019 Education (School/Special) 8850 1268 955620 Higher Education 463 2975 750221 Information Technology 292 293 44022 Health Services 2491 1754 378223 Social Welfare Measures 128 67 14024 Labour Affairs 36 17 7325 Planning & Development 1227 2249 447126 Regional Planning 2200 2101 232627 Rural Works Programme (LG&CD) 1795 11636 692328 Population Welfare Measures 1709 1702 189129 Tourism 24 643 2030 Information & Culture 114 705 24331 Food Department 77 232 12832 Roads - 118 74633 Commerce & Investment 378 52 54034 District Government 9580 24084 1095635 TMAs 2420 3682 304336 TEVTA 218 342 60437 Tamer-e-Punjab 1855 - -38 Punjab Small Industry Corporation 74 210 40039 Mines & Minerals 80 73 12840 Physical Housing & Planning (Urban Dev.) - 6540 267041 Others - 61 3045
Item2006-07
Expenditure met from Revenue Total (B to C)Total Current Revenue Expenditure (1 to 9)
357PUBLIC FINANCE
Table 230:- Revenue Expenditure (Summary) by Important Heads, The Punjab Govt.(Million Rupees)
Housing and Community AmenitiesHealthRecreational Culture and ReligionEducation Affairs and Services
General Public ServicePublic Order and Safety AffairsEconomic AffairsEnvironment Protection
Social ProtectionDevelopment Revenue Expenditure – Total (1 to 41)
Source:- Finance Department, Govt. of the Punjab, Lahore.

2006-07
Budget Estimates
Budget Estimates
Budget Estimates
I. 86797 88281 92544
1 Debt Servicing 12017 6966 12658
2 Loans and Advances 13106 1000 13146
3 Loans from Commercial Banks 24824 32732 29600
4 State Trading 34837 39289 37126
5 Transfers - Inter Governmental 2000 8283 -
6 Medical Stores 13 11 14
II. 75222 68296 94949
1 Roads and Bridges 37143 34510 53696
2 Govt. Buildings 13915 18033 15018
3 Low Cost Housing (Town Development) 400 157 600
4 Agricultural Improvement & Research 831 177 682
5 Irrigation Works 8587 10635 10672
6 Loans to Autonomous Bodies 14346 4784 14281
7 Development 41902 68817 71885
PUBLIC FINANCE
Table 231:- Total Capital Disbursements of The Punjab Government
358
Development Capital Expenditure - Total (1 to 7)
Source:- Finance Department, Govt. of the Punjab, Lahore.
(Million Rupees)
Item
Current Capital Expenditure – Total (1 to 6)
2005-06

Total (a) Provincial Contribution
Federal Assistance (Cash/Cash
Development Loans)
Foreign Assistance (Loans and
Grants)
1998-99 (B.E) 17000 15370 1811 7494 6065
1999-00 " 15100 13100 708 5827 6565
2000-01 " 13000 12660 2151 6189 4320
2001-02 " 20130 19500 8932 4000 6568
2002-03 " 21593 20750 12979 341 7430
2003-04 " 31357 30500 22200 - 8300
2004-05 " 44456 43440 34700 - 8740
2005-06 " 55535 53000 43127 - 9873
2006-07 " 117125 100000 91169 - 8831
2007-08 " 166834 150000 71010 - 7899
359
PUBLIC FINANCE
Table 232:- Annual Development Programmes and Sources of their Financing The Punjab ( Million Rupees )
Source :- Finance Department, Government of the Punjab, Lahore. " White Paper on Budget -Various Issues”. Punjab Governments cash balance.a) The gap between the resource availability and the size of the programme was met by utilization of the
YearAnnual
Development Programme
F i n a n c i n g

Sector Allocation 2006-07
Allocation 2007-08
%Increase Over 2006-07
100000 150000 50.0
A 28165 44377 57.6
1 12480 21480 72.1
i School Education 8305 8488 2.2
ii Higher Education 2900 9936 242.6
iii Special Education 600 954 59.0
iv Literacy 275 1200 336.4
v Sports 400 902 125.5
2 4300 6500 51.2
3 5200 6500 25.0
4 330 616 86.7
5 2200 2326 5.7
6 3655 6955 90.3
i LG&CD 1800 2100 16.7
ii Tameer-e-Punjab Programme 1855 1855 -
iii Local Development Programme 0 2000 -
iv Community Uplift Programme 0 1000 -
B 26893 32354 20.3
7 14000 14300 2.1
8 8500 11000 29.4
9 700 800 14.3
10 2500 2450 -2.0
11 1193 3804 218.9
C 3375 7053 109.0
12 1100 2800 154.5
13 575 690 20.0
i Forestry 200 220 10.0
ii Wildlife 310 350 12.9
iii Fisheries 65 120 84.6
14 50 120 140.0
15 600 1200 100.0
16 180 400 122.2
17 750 1638 118.4
18 120 205 70.8
Public Buildings (Offices)
PUBLIC FINANCE360
Mines & Minerals
Food
Livestock
Industries
TEVTA
Regional Planning
Urban Development
Agriculture
Forestry, Wildlife & Fisheries
Local Government & Community Dev.
Roads
Irrigation
Public Buildings (Housing)
Infrastructure Development
Production Sectors
Table:233 Sector-wise Annual Development Programme, The Punjab.
Sr. No.
Grade Total
Education
Social Sectors
(Million Rs.)
Health
Water Supply & Sanitation
Social Protection

Sector Allocation 2006-07
Allocation 2007-08
%Increase Over 2006-07
D 2350 4181 77.9
19 800 1250 56.3
20 500 900 80.0
21 60 95 58.3
22 - 50 -
23 900 1804 100.4
24 90 82 -8.9
E 4217 5035 19.4
25 550 1150 109.1
26 210 450 114.3
27 50 82 64.0
28 600 400 -33.3
29 2807 2953 5.2
65000 93000 43.1
F 35000 57000 62.9
i District/TMA Development Programme 12000 14000 16.7
ii Development of Katchi abadis 0 3000 -
iii Special Infrastructure 23000 40000 73.9
Planning & Development
361PUBLIC FINANCE
Transport
Emergency Service
Tourism
Environment
Total Special Programme
Total Core Promme
Others
Information, Culture & Youth Affairs
Auqaf, Religious & Minority Affairs
Access to Justice Programme
Information Technology
Commerce & Investment
Labour & Human Resource Development
Table:233 Sector-wise Annual Development Programme, The Punjab Concld
Sr. No.
(Million Rs.)
Services Sectors
Source :- Finance Department, Government of the Punjab, Lahore. " White Paper on Budget”.

National Highways
Provincial Roads
Ex-District Council Roads
Farm to Market Roads
Sugar Cess
Roads
1997-98 39957 1610 13687 0 21407 2556 334 363
1998-99 40955 1610 13808 0 22214 2674 334 315
1999-00 42307 1610 13966 0 23234 2848 334 315
2000-01 43998 1610 14067 0 24785 2887 334 315
2001-02 44827 1610 14567 0 25134 2864 334 318
2002-03 60431 1610 14630 10333 30160 3046 334 318
2003-04 65459 1610 14630 12921 32469 3117 387 325
2004-05 69799 1610 14630 13521 36138 3188 387 325
2005-06 71010 1610 14630 14132 36620 3306 387 325
2006-07 71010 1610 14630 14132 36620 3306 387 325
Low Type
Roads
6. Other Track Way
High Type
Note: i) High Type Roads include:-
Source:- Planning & Design Directorate, Punjab Highway Department, Lahore.
1. Granular 2. Stablized 3. Natural Surface
4. Brick Paved5. Banked Earth
1. Black Top 2. Concrete 3. Macadam
362
*Includes 334 Kilometers Lahore–Islamabad Motoway and 53 Kilometers Pindi Bhattian–Faisalabad Motorway.ii) Low Type Roads include:-
ROADS AND ROAD ACCIDENTS
Table 234 :- Road Length by Type Under National Highway Authority and Highway Department, The Punjab
(Kilometres)
Total Road* Length
Year Motor-Way

363
ROAD LENGTH UNDER NATIONAL HIGHWAY AUTHORITY AND HIGHWAY DEPARTMENT
THE PUNJAB: 2001-02 TO 2006-07
44827
60431
65459
6979971010 71010
50000
60000
70000
80000
* Includes 334 Kilometres Lahore – Islamabad Motorway, and 53 Kilometers Pindi Phattian – Faisalabad Motorway.
44827
0
10000
20000
30000
40000
2001-02 2002-03 2003-04 2004-05 2005-06 2006-07

District Total National Highways Motorway Provincial
Roads
Farm to Market Roads
Sugar Cess Roads
Ex-Distt. Council
Road
The Punjab 70528.00 1610.39 387.00 14473.12 36619.97 3305.79 14131.73
North Zone 26125.29 528.96 258.00 6125.62 14390.38 881.09 3941.24Gujranwala 2262.24 69.52 45.50 422.58 1454.28 16.66 253.7Gujrat 1513.36 61.82 0.00 393.31 938.36 26.82 93.05Hafizabad 1113.51 0.00 0.00 152.96 818.82 11.14 130.59M. B. Din 1216.90 0.00 0.00 299.75 663.21 250.10 3.84Narowal 1027.61 0.00 0.00 152.46 782.15 - 93.00Sialkot 1702.65 0.00 0.00 465.86 1019.53 30.54 186.72
Lahore 1210.98 48.43 0.00 358.91 331.21 - 472.43Kasur 1677.28 53.13 0.00 403.41 1013.10 207.64 -Nankana 1289.84 - - 322.44 443.18 138.64 385.58Okara 2437.69 46.01 0.00 337.20 1753.90 184.46 116.12Sheikhupura 1249.35 31.80 67.50 391.73 478.21 15.09 265.02
Rawalpinid 3620.63 97.38 38.00 1284.42 1570.17 - 630.66Attock 1981.35 68.54 8.00 470.76 823.94 - 610.11Chakwal 2552.66 0.00 79.00 473.20 1411.85 - 588.61Jhelum 1269.24 52.33 20.00 196.63 888.47 - 111.81
South Zone 44344.71 1081.43 71.00 8347.50 22229.59 2424.70 10190.49Sargodha 2889.19 0.00 71.00 856.71 1063.59 280.09 617.81Bhakkar 1878.91 0.00 0.00 462.54 1092.51 95.78 228.06Khushab 1659.44 0.00 0.00 569.03 844.14 82.04 164.23Mianwali 1651.50 0.00 0.00 385.00 707.60 - 558.9
Bahawalpur 2630.81 95.83 - 757.41 1195.17 89.97 492.43Bahawalnagar 2508.46 - - 417.52 1751.03 112.51 227.40R.Y. Khan 3121.35 146.83 - 530.91 1536.84 354.77 552.00
D.G.Khan 1670.00 314.94 - 204.70 972.26 - 178.10Layyah 1341.85 - - 288.32 959.40 28.63 65.50Muzaffargarh 2713.42 42.03 - 502.17 1289.02 60.20 720.00Rajanpur 1322.86 177.05 - 147.39 990.66 7.76 -
Faisalabad 3637.42 - - 632.36 1075.36 534.75 1394.95Jhang 4096.47 - - 666.25 921.42 304.91 2203.89T.T.Singh 1854.74 - - 324.35 873.46 208.50 448.43
Multan 1918.13 139.53 - 257.45 829.65 - 691.50Khanewal 2173.68 76.67 - 312.89 1379.56 41.44 363.12Lodhran 1436.46 - - 186.77 935.60 - 314.09Pakpattan 1639.80 - - 263.39 1053.04 105.11 218.26Sahiwal 1773.67 88.55 - 182.05 1198.55 91.03 213.49Vehari 2526.56 - - 400.29 1560.73 27.21 538.33(Islamabad) 5.00 (-) 5.00 (-) (-) (-) (-)
Pindi Bhattian/ Faisalabad 53.00 (-) 53.00 (-) (-) (-) (-)
364
Source:- Planning & Design Directorate, Punjab Highway Department, Lahore.* District–wise break up’ not available.
ROADS AND ROAD ACCIDENTSTable 235 :- Metalled Roads Length (Actual) by Type and District, under
The Punjab, As on 30th June, 2007(Kilometres)
National Highway Authority and Highway Department
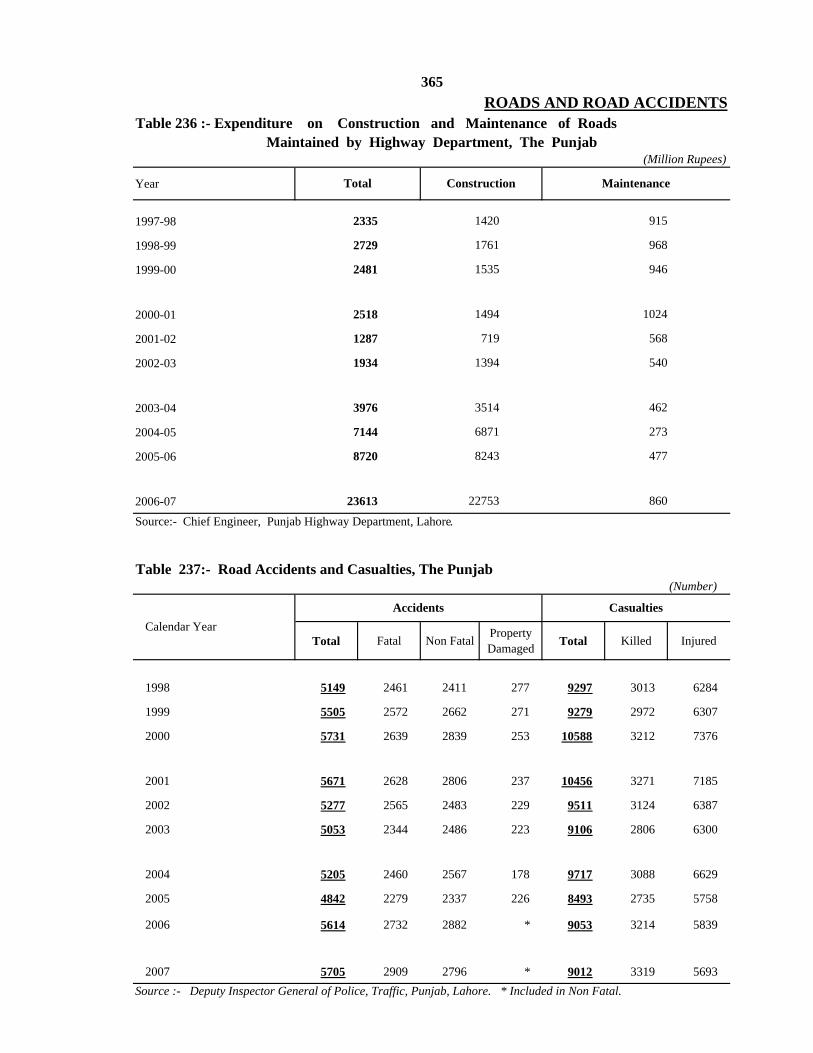
Year
1997-98
1998-99
1999-00
2000-01
2001-02
2002-03
2003-04
2004-05
2005-06
2006-07
Total Fatal Non Fatal Property Damaged Total Killed Injured
1998 5149 2461 2411 277 9297 3013 6284
1999 5505 2572 2662 271 9279 2972 6307
2000 5731 2639 2839 253 10588 3212 7376
2001 5671 2628 2806 237 10456 3271 7185
2002 5277 2565 2483 229 9511 3124 6387
2003 5053 2344 2486 223 9106 2806 6300
2004 5205 2460 2567 178 9717 3088 6629
2005 4842 2279 2337 226 8493 2735 5758
2006 5614 2732 2882 * 9053 3214 5839
2007 5705 2909 2796 * 9012 3319 5693
365ROADS AND ROAD ACCIDENTS
Table 236 :- Expenditure on Construction and Maintenance of Roads Maintained by Highway Department, The Punjab
(Million Rupees)
Table 237:- Road Accidents and Casualties, The Punjab(Number)
Calendar Year
2518
1287
1934
3976
7144
8720
MaintenanceConstructionTotal
Source:- Chief Engineer, Punjab Highway Department, Lahore.
2335
2729
2481
273
1420
1761
1535
1494
Source :- Deputy Inspector General of Police, Traffic, Punjab, Lahore. * Included in Non Fatal.
Accidents Casualties
23613
719
1394
3514
6871
8243 477
86022753
915
968
946
1024
568
540
462

Total Fatal Non-Fatal Total Killed Injured
The Punjab 5705 2909 2796 9012 3319 5693
Bahawalpur 206 52 154 293 52 241Bahawalnagar 193 54 139 274 59 215Rahim Yar Khan 266 78 188 318 81 237
D. G. Khan 123 57 66 180 66 114Layyah 92 41 51 128 41 87Muzaffargarh 169 73 96 259 86 173Rajanpur 142 65 77 252 79 173
Faisalabad 277 221 56 382 244 138Jhang 110 78 32 247 107 140Toba Tek Singh 82 50 32 149 57 92
Gujranwala 206 130 76 402 150 252Gujrat 162 98 64 163 98 65Hafizabad 65 42 23 89 42 47Mandi Baha-ud-Din 48 26 22 68 30 38Narowal 55 32 23 95 36 59Sialkot 253 113 140 291 122 169
Lahore 726 410 316 953 434 519Kasur 156 105 51 240 114 126Nanakan 142 49 93 113 56 57Okara 135 91 44 188 94 94Sheikhupura 227 127 100 411 150 261
Multan 135 68 67 229 83 146Khanewal 104 61 43 240 72 168Lodhran 68 31 37 157 38 119Pakpattan 84 51 33 174 62 112Sahiwal 106 70 36 230 93 137Vehari 112 60 52 207 67 140
Rawalpindi 399 165 234 630 192 438Attock 128 69 59 259 95 164Chakwal 136 53 83 271 83 188Jhelum 114 54 60 211 64 147
Sargodha 237 130 107 396 141 255Bhakkar 120 44 76 237 62 175Khushab 70 33 37 167 35 132Mianwali 57 28 29 109 34 75
366ROADS AND ROAD ACCIDENTS
District
Source:- Deputy Inspector-General of Police, Traffic, Punjab, Lahore.
Table 238:- Road Accidents and Casualties by District, The Punjab As on 31st December, 2007
(Number)
Accidents Casualties

Unit 2002-03 2003-04 2004-05 2005-06 2006-07
I. Locomotives-Total (Number) 577 592 557 544 544
Steam " 14 14 14 13 12
Diesel " 536 551 520 510 513
Electric " 27 27 23 21 19
II. Freight
Wagons (Thousand) 24 22 22 20 20
Capacity (In terms of 4 Wheels) (Thousand M.Tons) 501 488 488 546 606
Tonne-Kilometres (Million) 4820 4796 5013 4971 5454
Average Turn Round Time (B.G.) (a) (Days Per Wagon) 20.3 20.4 20.9 20.4 22.4
III. Passengers
Passengers Carried (Million) 72.4 75.7 78.1 81.4 83.9
Passenger Carriages (Number) 1553 1579 1604 1663 1670
Passenger-Kilometres (Million) 22306 23045 24237 25621 26446
Railway Stations (Number)633 625 626 626 545
367
d): It stands for "Average Time taken by a Wagon " from the time it is loaded upto the time it is again made available for loading.Source :- Statistical Branch, Pakistan Railways, Lahore .
Item
TRANSPORT
Table 239:- Pakistan Railways, Locomotives, Freight and Passengers

Number of Passengers
Carried by Rail (Million)
Passenger Kilometres (Million)
Average No. of Kilometres Travelled by a
Passenger
Metric Tons Carried by Rail
(Million)
Metric Tons Kilometres (Million)
1997-98 65 18774 289.4 6 4447
1998-99 65 18980 292.1 5 3970
1999-00 68 18495 274.0 5 3753
2000-01 69 19589 284.5 6 4519
2001-02 69 20782 301.18 6 4572
2002-03 72 22306 309.8 6 4820
2003-04 75 23045 304.4 6 4796
2004-05 78 24238 310.0 6 5013
2005-06 81 25621 314.0 6 4971
2006-07 84 26446 315.2 6 5454
First Class
Sleeper Sitter Lower Sleeper
1997-98 64870 72 291 1453 628 32607 29819
1998-99 64928 72 251 1415 610 31812 30768
1999-00 67508 89 240 1481 625 34832 30241
2000-01 68858 99 163 1510 683 34030 32373
2001-02 69003 99 145 1444 585 31844 34886
2002-03 72402 95 139 1908 403 32632 37225
2003-04 75700 91 138 1867 417 34307 38880
2004-05 78179 94 142 1928 431 35430 40154
2005-06 81425 74 312 2384 197 32981 45477
2006-07 83895 88 287 2662 176 30600 50082
368
Table 241 :- Rail Passengers by Class
A.C. Class
Source:- Statistical Branch, Pakistan Railways, Lahore.
TRANSPORT
Table 240 :- Pakistan Railways, Passengers and Freight Traffic
(Thousand)
Economy Class
Second ClassTotalYear
Passenger Traffic Freight Traffic
Year
Source :- Statistical Branch, Pakistan Railways, Lahore .
Average Kilometres Travelled by a M.Ton
744.1
759.2
730.6
771
824.7
849.0
782.6
779.8
781.2
782.1

2002-03 2003-04 2004-05 2005-06 2006-07
6180 6140 6410 6026 6480
19 25 20 27 24
62 51 53 9 8
535 609 265 224 281
150 362 293 234 170
a) Coal, Coke & Patent Fuel for Railways (Including H.S.D. and Furnace Oil) 283 253 225 222 288
b) Railway Materials and Stores 789 1067 866 1158 1241
55 64 52 59 49
- - - 2 18
3 - - - -
63 23 37 56 70
6 8 1 2 -
- - - 7 4
5 1 6 1 2
1 4 - 1 -
- - 2 - 2
1 40 85 70 157
119 201 90 118 28
Malasses
369TRANSPORT
Table 242:- Commodities Carried by Type by Pakistan Railways( Thousand Metric Tons )
Gypsum
Fruits & Vegetable fresh
Jute Manufectured
Iron and Steel-Divn. `A' includes Angles, Axes, Sheets, Girders etc.
Livestock
Machinery, other than Electrical
Firewood
Grass, Dry
Oils-Divn. `D' includes Vacuum refined edible oils
Oil Seeds
Coal & Coke for the Public
Departmental Commodities
Commodity
Ballast and Stone
Cement
Chemical Manures ( Fertilizers)
Total

2002-03 2003-04 2004-05 2005-06 2006-07
2 4 20 5 1
59 41 63 49 23
a) Division `B' includes Diesel Oil 527 733 372 247 159
b) Division `C' includes Furnace Oil 1319 378 1032 733 1212
- - - 1 -
119 132 113 95 97
2 72 19 111 47
3 2 - 2-
1 1 2 1-
325 - 378 84 8
- - 560 663 722
1732 2069 1856 1845 1869
370
Timber
Sugarcane
Commodity
TRANSPORT
Source:- Statistical Branch, Pakistan Railway, Lahore.
Sugar
Salt
Petroleum and other hydrocarbon oils non-dangerous i.e. having a flashing point at or above 760 Fahr. - Division `A' includes Kerosene Oil, etc.
Miscellaneous
Wheat
Petroleum and other hydrocarbon Oils non-dangerous, i.e., having a flashing point at or above 760 Fahr.
Paddy and Rice
Container Traffic
Other Grains & Pulses
Table 242:- Commodities Carried by Type by Pakistan Railways-Concld. ( Thousand Metric Tons )

Year All Motor Vehicles
Motor Cars,
Jeeps and Station Wagons
Motor Cycles and Scooters
Trucks Delivery Vans Buses Taxis
Auto Rick-shaws
Tractors Other Vehicles
1998 1274902 332262 700865 25532 48494 26429 7508 176871999 1396507 714949 352758 24686 43030 20646 7671 194582000 1581200 877914 423146 25762 29090 28849 7407 24429
2001 2686435 526070 1519003 32567 46692 48928 16125 439472002 2857631 544337 1631840 32670 47232 49606 16193 531392003 3031723 570678 1741839 33114 51053 51415 16212 61266
2004 3322974 618934 1938489 33905 54827 54116 16374 77970 524500 38592005 3844526 696820 2313450 34730 64217 57241 17801 101025 555157 40852006 4318826 793789 2669497 37064 74987 62984 16534 107531 552061 4379
2007 4998026 925507 3169095 40512 84771 67949 17677 115250 572519 4746
213309116125
506146482614453103
164603
(Number)
371TRANSPORT
Table 243:- Motor Vehicles `on Road' by Type, The Punjab (As on 30th June)
Motor Vehicles Registered
Source: Additional Director General Excise & Taxation Punjab Lahore
Division/ District Total
Motor Cars,
Jeeps and Station Wagons
Motor Cycles and Scooters
Trucks Delivery Vans Buses Taxis
Auto Rick-shaws
Tractors Other Vehicles
The Punjab 4998026 925507 3169095 40512 84771 67949 17677 115250 572519 4746
Bahawalpur 128450 12747 91555 350 409 1324 401 1961 19626 77Bahawalnagar 47736 2191 24688 78 290 169 - 563 19645 112R.Y.Khan 200615 9896 156186 374 2259 1057 9 37 30795 2
D.G.Khan 159799 4278 97616 210 49 162 44 122 57185 133Layyah 23936 567 17688 30 246 39 - 21 5228 117Muzaffargarh 41472 3083 23602 424 288 253 5 - 13796 21Rajanpur 15006 522 12906 19 68 24 10 - 1447 10
Faisalabad 408921 64599 292825 4077 5073 5349 - 11834 25155 9Jhang 59346 2660 34615 365 431 1079 - 1729 18251 216T.T.Singh 52646 1535 40783 79 101 71 - 213 9829 35
As on 30th June, 2007(Number)
Source:- Additional Director General, Excise & Taxation, Punjab, Lahore.
Table 244:- Motor Vehicles `Registered' by Type and District The Punjab
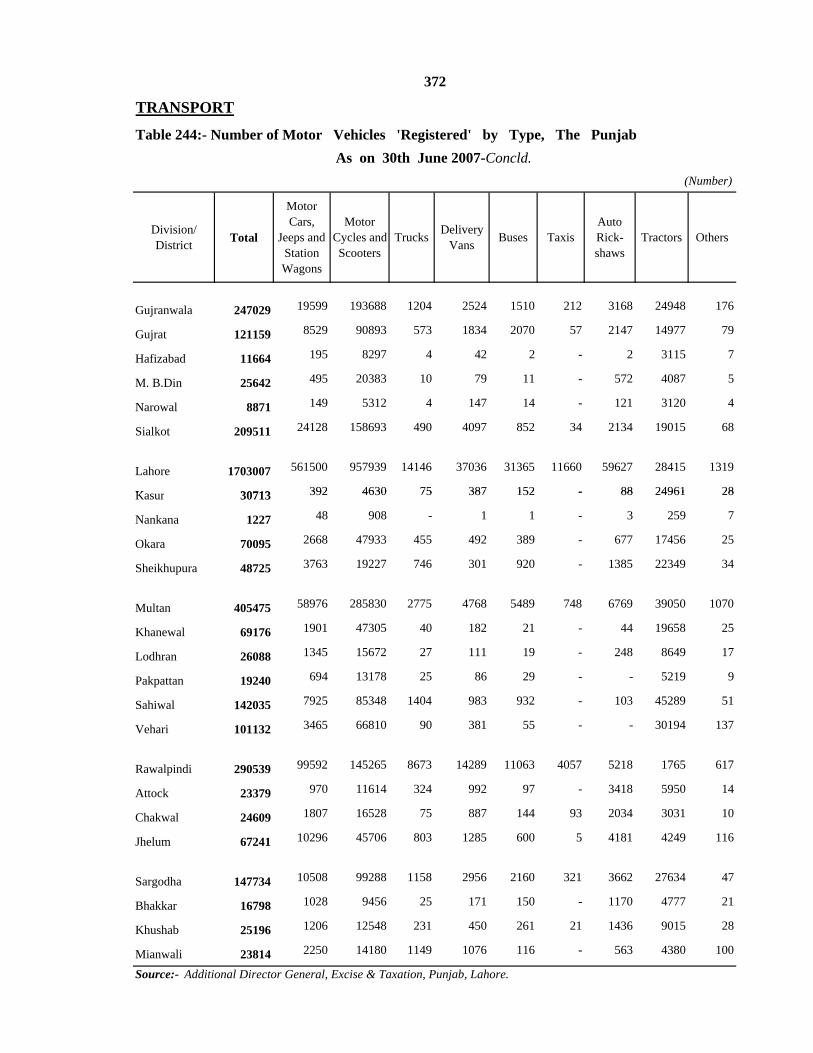
Division/ District Total
Motor Cars,
Jeeps and Station Wagons
Motor Cycles and Scooters
Trucks Delivery Vans Buses Taxis
Auto Rick-shaws
Tractors Others
Gujranwala 247029 19599 193688 1204 2524 1510 212 3168 24948 176
Gujrat 121159 8529 90893 573 1834 2070 57 2147 14977 79
Hafizabad 11664 195 8297 4 42 2 - 2 3115 7
M. B.Din 25642 495 20383 10 79 11 - 572 4087 5
Narowal 8871 149 5312 4 147 14 - 121 3120 4
Sialkot 209511 24128 158693 490 4097 852 34 2134 19015 68
Lahore 1703007 561500 957939 14146 37036 31365 11660 59627 28415 1319
K 30713 392 4630 75 387 152 - 88 24961 28
372
TRANSPORT
Table 244:- Number of Motor Vehicles 'Registered' by Type, The PunjabAs on 30th June 2007-Concld.
(Number)
Kasur 30713 392 4630 75 387 152 - 88 24961 28
Nankana 1227 48 908 - 1 1 - 3 259 7
Okara 70095 2668 47933 455 492 389 - 677 17456 25
Sheikhupura 48725 3763 19227 746 301 920 - 1385 22349 34
Multan 405475 58976 285830 2775 4768 5489 748 6769 39050 1070
Khanewal 69176 1901 47305 40 182 21 - 44 19658 25
Lodhran 26088 1345 15672 27 111 19 - 248 8649 17
Pakpattan 19240 694 13178 25 86 29 - - 5219 9
Sahiwal 142035 7925 85348 1404 983 932 - 103 45289 51
Vehari 101132 3465 66810 90 381 55 - - 30194 137
Rawalpindi 290539 99592 145265 8673 14289 11063 4057 5218 1765 617
Attock 23379 970 11614 324 992 97 - 3418 5950 14
Chakwal 24609 1807 16528 75 887 144 93 2034 3031 10
Jhelum 67241 10296 45706 803 1285 600 5 4181 4249 116
Sargodha 147734 10508 99288 1158 2956 2160 321 3662 27634 47
Bhakkar 16798 1028 9456 25 171 150 - 1170 4777 21
Khushab 25196 1206 12548 231 450 261 21 1436 9015 28
Mianwali 23814 2250 14180 1149 1076 116 - 563 4380 100
Source:- Additional Director General, Excise & Taxation, Punjab, Lahore.
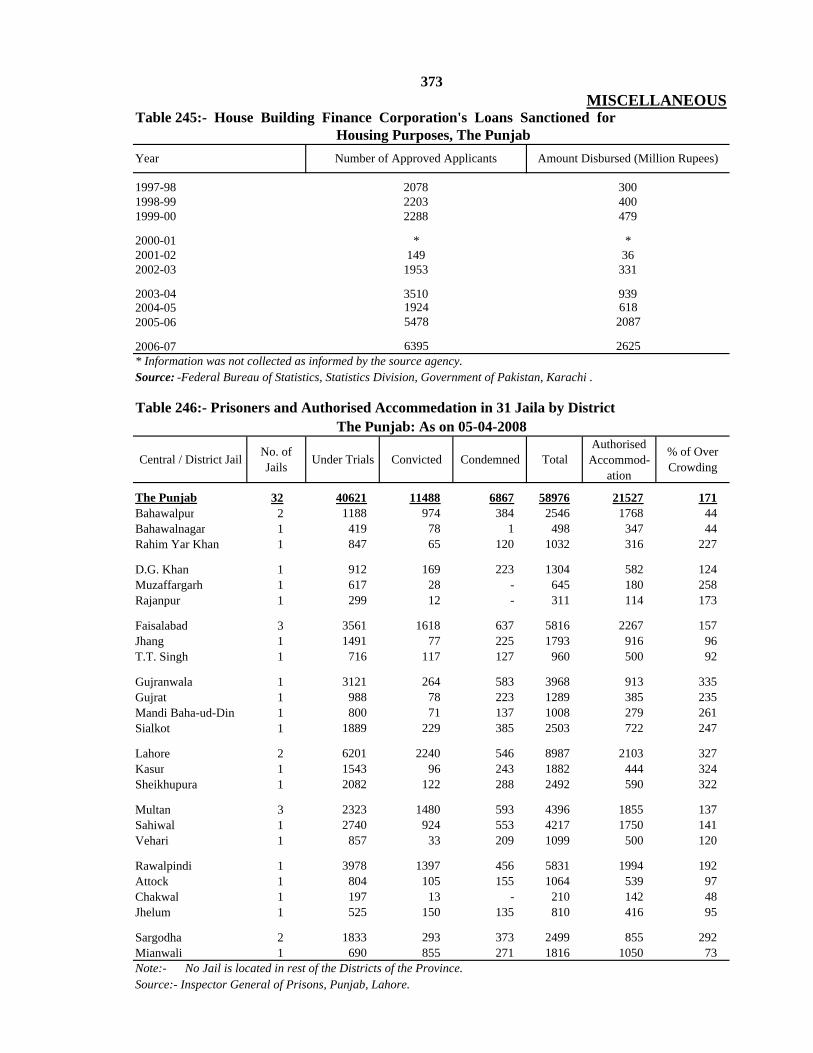
1997-981998-991999-00
2000-012001-022002-03
2003-042004-052005-06
2006-07
Central / District Jail No. of Jails Under Trials Convicted Condemned Total
Authorised Accommod-
ation
% of Over Crowding
The Punjab 32 40621 11488 6867 58976 21527 171Bahawalpur 2 1188 974 384 2546 1768 44Bahawalnagar 1 419 78 1 498 347 44Rahim Yar Khan 1 847 65 120 1032 316 227
D.G. Khan 1 912 169 223 1304 582 124Muzaffargarh 1 617 28 - 645 180 258Rajanpur 1 299 12 - 311 114 173
Faisalabad 3 3561 1618 637 5816 2267 157Jhang 1 1491 77 225 1793 916 96T.T. Singh 1 716 117 127 960 500 92
Gujranwala 1 3121 264 583 3968 913 335Gujrat 1 988 78 223 1289 385 235Mandi Baha-ud-Din 1 800 71 137 1008 279 261Sialkot 1 1889 229 385 2503 722 247
Lahore 2 6201 2240 546 8987 2103 327Kasur 1 1543 96 243 1882 444 324Sheikhupura 1 2082 122 288 2492 590 322
Multan 3 2323 1480 593 4396 1855 137Sahiwal 1 2740 924 553 4217 1750 141Vehari 1 857 33 209 1099 500 120
Rawalpindi 1 3978 1397 456 5831 1994 192Attock 1 804 105 155 1064 539 97Chakwal 1 197 13 - 210 142 48Jhelum 1 525 150 135 810 416 95
Sargodha 2 1833 293 373 2499 855 292Mianwali 1 690 855 271 1816 1050 73
The Punjab: As on 05-04-2008
6185478 20871924
2625
Table 246:- Prisoners and Authorised Accommedation in 31 Jaila by District
Source: -Federal Bureau of Statistics, Statistics Division, Government of Pakistan, Karachi .* Information was not collected as informed by the source agency.
Source:- Inspector General of Prisons, Punjab, Lahore.
6395
3004004792288
*
Note:- No Jail is located in rest of the Districts of the Province.
1491953
20782203
331
9393510
*36
Year
373
Number of Approved Applicants Amount Disbursed (Million Rupees)
MISCELLANEOUSTable 245:- House Building Finance Corporation's Loans Sanctioned for
Housing Purposes, The Punjab

Year Daily Bi-Weekly & Weekly Fortnightly Monthly Quarterly and
Others
1998 4155 348 1117 283 2148 259
1999 546 (a) 64 155 42 253 32
2000 117 14 33 12 49 9
2001 63 12 17 7 23 4
2002 63 12 17 7 23 4
2003 136 23 32 17 52 12
2004 136 23 32 17 52 12
2005 364 77 100 18 146 23
2006 316 85 74 19 109 29
2007 513 110 131 29 207 36
Year Urdu English Punjabi Others
1998 4155 3752 330 55 18
1999 546 (a) 500 39 5 2
2000 117 111 6 - -
2001 63 54 9 - -
2002 63 54 9 - -
2003 136 116 20 - -
2004 136 116 20 - -
2005 364 293 64 6 1
2006 316 268 40 5 3
2007 513 368 134 7 4
Source:-
374
B - By Language
a) Drastic decline is due to restrictions imposed on the grant of declaration.
MISCELLANEOUS
Directorate General, Public Relations, Punjab, Lahore.* (Upto 3-3-04)
The Punjab ( As on 1st January )Table 247:- Newspapers and Periodicals by Frequency and Language
A - By Frequency
Total
Total

District Total Number of Local Zakat Committees
The Punjab 25267Bahawalpur 811Bahawalnagar 1076R. Y. Khan 830
D. G. Khan 364Layyah 687Muzaffargar 519Rajanpur 263
Faisalabad 1388Jhang 1178T. T. Singh 605
Gujranwala 1314Gujrat 1122Hafizabad 607Mandi Baha-ud-din 430Narowal 588Sialkot 851
Lahore 1282Kasur 961Okara 978Sheikhupura 686Nankana 591
Multan 558Khanewal 532Lodhran 387Pakpattan 572Sahiwal 585Vehari 758
Rawalpindi 1166Attock 434Chakwal 388Jhelum 592
Sargodha 1068Bhakkar 392Khushab 417Mianwali 287
ZAKAT
Table 248:- Number Of Local Zakat Committees By District, The Punjab: 2006-07
Source:- Zakat and Usher Department Govt. of the Punjab, Lahore
375
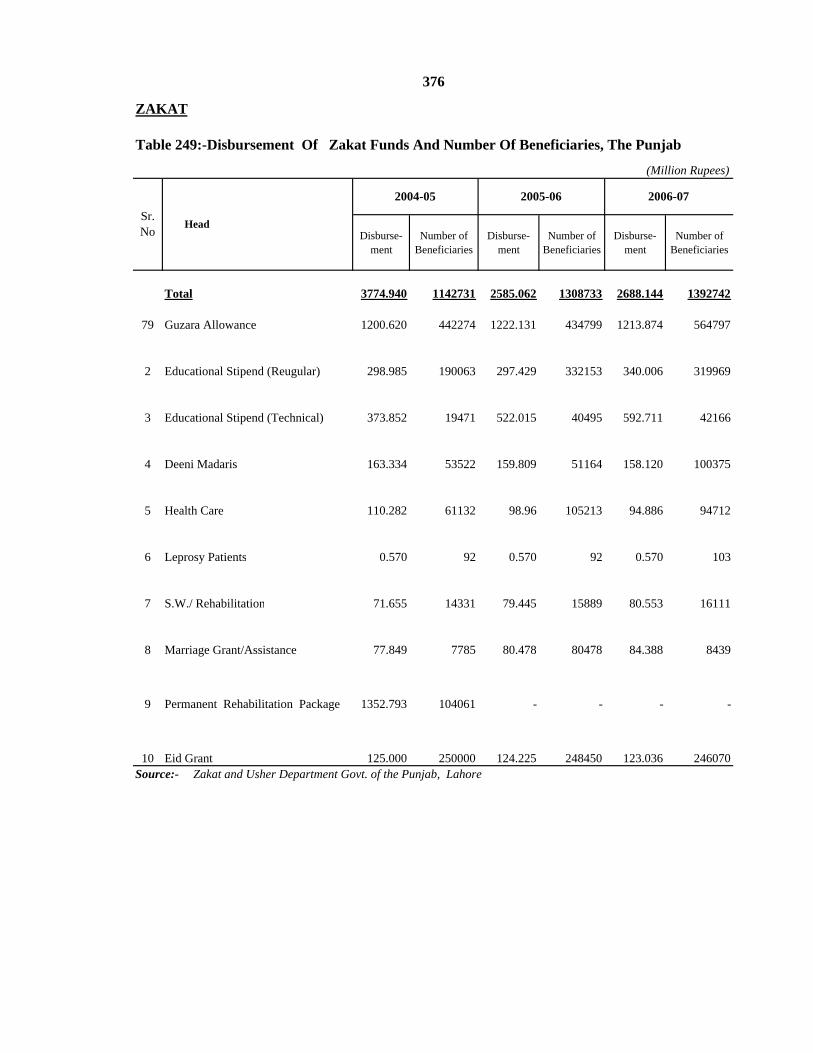
Disburse-ment
Number of Beneficiaries
Disburse-ment
Number of Beneficiaries
Disburse-ment
Number of Beneficiaries
Total 3774.940 1142731 2585.062 1308733 2688.144 1392742
79 Guzara Allowance 1200.620 442274 1222.131 434799 1213.874 564797
2 Educational Stipend (Reugular) 298.985 190063 297.429 332153 340.006 319969
3 Educational Stipend (Technical) 373.852 19471 522.015 40495 592.711 42166
4 Deeni Madaris 163.334 53522 159.809 51164 158.120 100375
5 Health Care 110.282 61132 98.96 105213 94.886 94712
6 Leprosy Patients 0.570 92 0.570 92 0.570 103
7 S.W./ Rehabilitation 71.655 14331 79.445 15889 80.553 16111
8 Marriage Grant/Assistance 77.849 7785 80.478 80478 84.388 8439
9 Permanent Rehabilitation Package 1352.793 104061 - - - -
10 Eid Grant 125.000 250000 124.225 248450 123.036 246070Source:- Zakat and Usher Department Govt. of the Punjab, Lahore
2004-05 2005-06 2006-07
376
ZAKAT
Table 249:-Disbursement Of Zakat Funds And Number Of Beneficiaries, The Punjab
(Million Rupees)
Sr. No Head

TELEPHONE NUMBER
DIRECTOR GENERAL 9212577
Mr. Shamim Rafique 9212578
P.A. to DIRECTOR GENERAL Fax No. 9212579
Mr. Abdul Rehman 9212577
DIRECTOR 9212590
DEPUTY DIRECTORS
1 Mr. Sajid Rasul 92125902 Mr. Mahmood Akhtar 92125833 Mr. Zaffar Ali 72241264 Mr. Mushtaq Ahmad 92125845 Mr. Farasat ullah 72241246 Mr. Abdul Rehman 7224125
SENIOR SYSTEMS ANALYST
Mr. Muhammad Mumtaz Ahmad 9212588
ASSISTANT DIRECTORS
1 Mr. Basharat Ahmad 92125912 Mr. Zafar Iqbal Malik 7362421
STATISTICAL OFFICERS
1 Mr. Pervaiz Iqbal Sheikh 9212589
2 Mr. Muhammad Usman 9212580
377
NAME ADDRESS OF OFFICER
LIST OF TELEPHONESOF
BUREAU OF STATISTICS2-BEGUM ROAD, LAHORE

TELEPHONE NUMBER
1 Mr. Muhammad Saleem 041-9210210Assistant Director,430-G Gulistan Colony No.1 Raja Road, Faisalabad.
2 Mr. Waris Ali 0621-9250193Statistical Officer,Tosha Khana,Bahawalpur.
3 Mr. Muhammad Shabbir 061-9200930 Statistical Officer,Near Circuit House,Multan.
4 Mr. Abdul Razzaq 0641-9260356Statistical Officer,14-B Khyaban-e-Sarwar,H. No.35, Block-Z, Street-H, Model TownDera Ghazi Khan.
5 Mr. Shamas-ul-Huda 051-9278199Assistant Director342/A-1,Lane No.4,Peshawar Road,Rawalpindi.
6 Mr. Allah Ditta 048-9230208Assistant Director,H. No.742, St. No.11Farooq Colony,Sargodha.
7 Mr. Muhammad Younas Awan 055-9200419Statistical OfficerSecond Floor Azam Plaza,Near Passport Office, Bokhari Road,Gujranwala.
378
ADDRESSES / TELEPHONE NUMBERS
(FIELD OFFICES)
NAME ADDRESS OF OFFICER
OFBUREAU OF STATISTICS
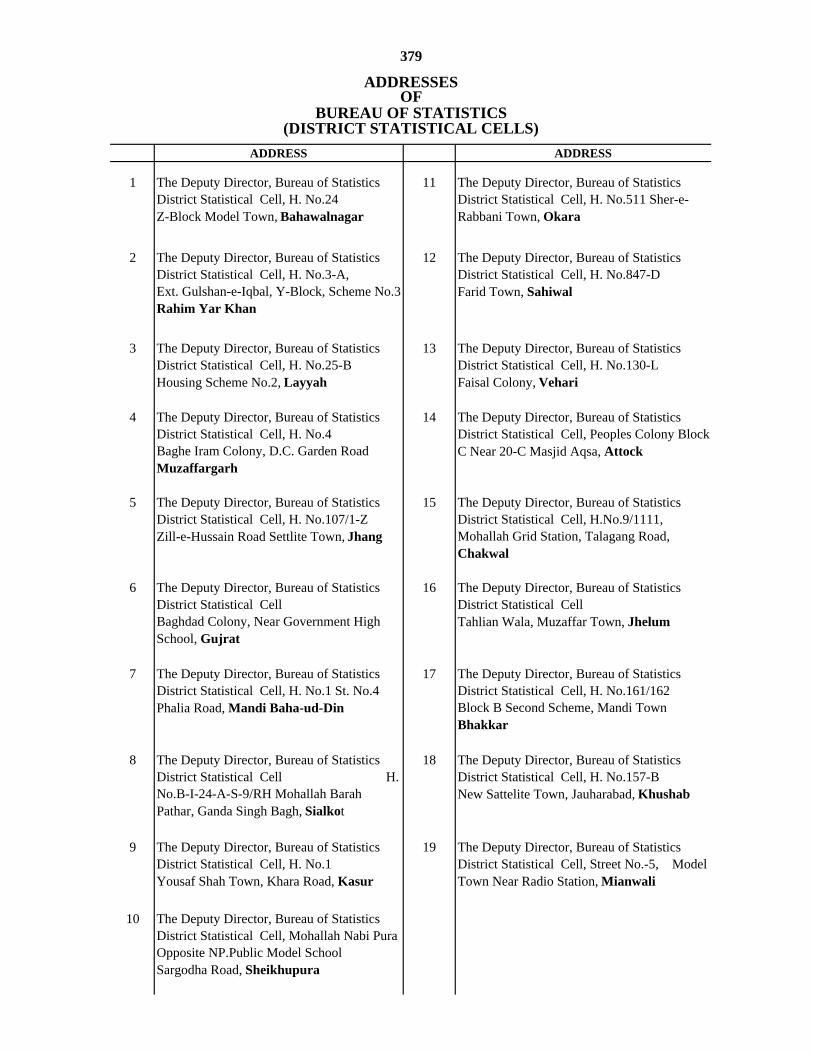
ADDRESS ADDRESS
1 The Deputy Director, Bureau of Statistics District Statistical Cell, H. No.24 Z-Block Model Town, Bahawalnagar
11 The Deputy Director, Bureau of Statistics District Statistical Cell, H. No.511 Sher-e-Rabbani Town, Okara
2 The Deputy Director, Bureau of Statistics District Statistical Cell, H. No.3-A, Ext. Gulshan-e-Iqbal, Y-Block, Scheme No.3 Rahim Yar Khan
12 The Deputy Director, Bureau of Statistics District Statistical Cell, H. No.847-D Farid Town, Sahiwal
3 The Deputy Director, Bureau of Statistics District Statistical Cell, H. No.25-B Housing Scheme No.2, Layyah
13 The Deputy Director, Bureau of Statistics District Statistical Cell, H. No.130-L Faisal Colony, Vehari
4 The Deputy Director, Bureau of Statistics District Statistical Cell, H. No.4 Baghe Iram Colony, D.C. Garden Road Muzaffargarh
14 The Deputy Director, Bureau of Statistics District Statistical Cell, Peoples Colony Block C Near 20-C Masjid Aqsa, Attock
5 The Deputy Director, Bureau of Statistics District Statistical Cell, H. No.107/1-Z Zill-e-Hussain Road Settlite Town, Jhang
15 The Deputy Director, Bureau of Statistics District Statistical Cell, H.No.9/1111, Mohallah Grid Station, Talagang Road, Chakwal
6 The Deputy Director, Bureau of Statistics District Statistical Cell Baghdad Colony, Near Government High School, Gujrat
16 The Deputy Director, Bureau of Statistics District Statistical Cell Tahlian Wala, Muzaffar Town, Jhelum
7 The Deputy Director, Bureau of Statistics District Statistical Cell, H. No.1 St. No.4 Phalia Road, Mandi Baha-ud-Din
17 The Deputy Director, Bureau of Statistics District Statistical Cell, H. No.161/162 Block B Second Scheme, Mandi Town Bhakkar
8 The Deputy Director, Bureau of Statistics District Statistical Cell H. No.B-I-24-A-S-9/RH Mohallah Barah Pathar, Ganda Singh Bagh, Sialkot
18 The Deputy Director, Bureau of Statistics District Statistical Cell, H. No.157-B New Sattelite Town, Jauharabad, Khushab
9 The Deputy Director, Bureau of Statistics District Statistical Cell, H. No.1 Yousaf Shah Town, Khara Road, Kasur
19
10 The Deputy Director, Bureau of Statistics District Statistical Cell, Mohallah Nabi Pura Opposite NP.Public Model School Sargodha Road, Sheikhupura
(DISTRICT STATISTICAL CELLS)
The Deputy Director, Bureau of Statistics District Statistical Cell, Street No.-5, Model Town Near Radio Station, Mianwali
379
ADDRESSESOF
BUREAU OF STATISTICS