pump controller - iowa state universityseniord.ece.iastate.edu/projects/archive/may0612... · web...
TRANSCRIPT
Pump ControllerDesign Report
Team NumberMay06-12
ClientViking Pump
AdvisorsNicola Elia
Team MembersDan Paulsen - Team Leader
John Taylor - Communications CoordinatorDwayne Stammer
Francois MunyakaziClifford Pinsent Jr.
Report Disclaimer NoticeDISCLAIMER: This document was developed as part of the requirements of an electrical and computer engineering course at Iowa State University, Ames, Iowa. This document does not constitute a professional engineering. Although the information is intended design or to be accurate, the associated students, faculty and Iowa State University make no claims, promises, or guarantees about the accuracy, completeness, quality or adequacy of the information. The user of this document shall ensure that any such use does not violate any laws with regard to professional licensing and certification requirements. This use includes any work resulting from this student-prepared document that is required to be under the responsible charge of a licensed engineer. This document is copyrighted by the students who produced this document and the associated faculty advisors. No part may be reproduced without the written permission of the senior design course coordinator.
Date Submitted12/14/2005
ii

Table of ContentsList of Figures....................................................................................................................iiList of Tables.....................................................................................................................iiiList of Definitions..............................................................................................................ivIntroduction........................................................................................................................1
Executive Summary.......................................................................................................1Executive Summary.......................................................................................................1Acknowledgement..........................................................................................................2Acknowledgement..........................................................................................................2Problem Statement........................................................................................................2Problem Statement........................................................................................................2Operating Environment................................................................................................3Operating Environment................................................................................................3Intended Users...............................................................................................................3Intended Users...............................................................................................................3Intended Uses.................................................................................................................3Assumptions...................................................................................................................4Limitations......................................................................................................................4Expected End Product and Other Deliverables..........................................................5
Approach and Design Considerations.............................................................................6Design Objectives...........................................................................................................6Functional Requirements..............................................................................................6Design Constraints.........................................................................................................7Technical approach Considerations.............................................................................8Testing Requirements Considerations.........................................................................9Detailed Design.............................................................................................................10Pre Existing Modules...................................................................................................11Software Design...........................................................................................................12Hardware design..........................................................................................................17
Estimated Resources and Schedules..............................................................................21Schedule............................................................................................................................25Closure Material..............................................................................................................26
Client Information.......................................................................................................26Faculty Advisor Information......................................................................................26Student Team Information.........................................................................................26Closing Summary.........................................................................................................27References.....................................................................................................................28Closing Summary.........................................................................................................28
i

List of FiguresFigure 1 – Whole Project Schematic..............................................10Figure 2 – Software Design Overview............................................12Figure 3 – Data Hub to/from Pump Interface...............................13Figure 4 – Data Hub to/from PC Communication Interface.......14Figure 5 – PC Communication to/from PC Interface...................14Figure 6 – Data Hub to/from Touch Screen GUI Interface........15Figure 7 – Data Hub to/from Control Algorithm Interface........16Figure 8 – Data Hub to/from Pulse Counter Interface................17Figure 9 – Implemented Hardware Schematic.............................19Figure 10 – Current to voltage conversion...................................19Figure 11 – Voltage to current conversion...................................20Figure 12 – Original Gantt Chart...................................................25Figure 13 – Revised Gantt Chart....................................................25Figure 14 – Deliverable Schedule...................................................25
ii

List of TablesTable 1 – Required Parts List..........................................................18Table 2 – Expected Personal Effort Requirements......................21Table 3 – Revised Personal Effort Requirements.........................22Table 4 – Original Other Required Resource Requirements.....22Table 5 – Revised Other Required Resource Requirements......22Table 6 – Original Expected Financial Requirements.................23Table 7 – Revised Expected Financial Requirements..................24
iii

List of Definitions
Flow meter: An instrument used to measure pressure, flow rate, and discharge rate of a liquid, vapor, or gas flowing in a pipe.
GUI: An abbreviation for graphical user interface.
I/O: An abbreviation for input/output.
Positive-displacement pump: A pump in which a measured quantity of liquid is entrapped in a space, its pressure rose, and then is delivered; for example, a reciprocating piston-cylinder or rotary-vane, gear, or lock mechanism.
Pressure transmitter: A device used by the pump to measure the inlet and outlet pressures.
RPM: an abbreviation for revolutions per minute. It is a measure of speed for spinning objects.
RTD: Resistance temperature detector; a metallic probe that measures temperature based upon its coefficient of resistivity.
Set point: the speed that a pump has to rotate in order to achieve a given flow or output pressure.
Specific gravity: the specific gravity of a substance is a comparison of its density to that of water.
Variable speed pump: A pump which allows the output velocity to be varied continuously.
Visco-elasticity: Property of a material which is viscous but which also exhibits certain elastic properties such as the ability to store energy of deformation, and in which the application of a stress gives rise to a strain that approaches its equilibrium value slowly.
Viscous: Having a relatively high resistance to flow
iv

Introduction
This document is intended to become define the basis design for senior design group May06-12. The group’s current problem, design, and development process will be defined in this document. Also this document will include the expected cost and schedule of the project.
Executive Summary
The goal of this project is to implement a control algorithm which will control the flow rate of a highly viscous material to within 0.25% of the desired flow rate. The algorithm will do so without measuring the actual flow rate by mechanical measurements. Also, a prototype controller will be constructed to control a pumping system using the control algorithm previously mentioned. Finally, a model of the pumping system will be created and delivered to the client.
A major goal of the project is to make the user interface efficient and friendly. The user interface will support security of the pump control from unqualified individual trying change the pump’s settings using the user interface. The ability to change such settings will require access to a key or password which will allow these changes. Moreover, the user interface will display the current configuration of the device, and the current status of the device. This will be done via a touch screen and onscreen keypad for easy entry of data and a user friendly understanding of the pump settings and configuration.
The flow manager will support all currently supported features as well as have support for add on features at a later time. A short list of new features such as remote configuration and control via a new pc based application which will communicate with the flow manager using a common 9-pin communications port. From this new application qualified users will be able to configure the flow manager, create and store profiles with will hold saved setting for a particular application.
Future features for the flow manager may include logging of the flow manager’s status history for viewing by the qualified personal.
1

The group will use unit testing to test for each part of the project before it is combined with the rest to ensure bug free software and circuitry.
Final testing of the product will ensure bug free software and hardware for the product before delivery to the client in May, 2006.
2

Acknowledgement
Viking Pump will provide a pumping test bed along with a set of flow equations on which to base the control algorithm. They have also granted permission to use their patented algorithm. Viking Pump will also provide a DC drive to supply power to a pump, and a box which to hold the flow manager components.
Problem Statement
One of Viking Pumps flagship products has been their flow manager which has led the market for pump controllers for many years. However the product was designed and built over twenty years ago and its design is behind the curve of modern technology and user ability. The flow manager is difficult to use and lacks the user friendliness that is common on today’s modern consumer environment. It has also become apparent to Viking that the parts which were used to implement the older pump control are no longer available. The client wants to implement the functionality of the original flow manager to a new and modern interface with the ability to expand functionality of the flow manager in the future. The old flow manager supports the regulation of volume of highly viscous fluids without using a mechanical means of measuring the flow. The control instead draws inputs from the liquid pressure on both sides of the pump along with the temperature of the liquid. Using these inputs along with the known parameters of the liquid a algorithm, which is supplied by Viking Pump, is used to calculate the how fast the pump must run to obtain the specified volume. The current flow manager setup can maintain a flow within .25% of a specified set point. The current flow manager also supports other functionality including batch flow (Pumping a specified amount of volume) and the ability to adjust the flow in real-time to a voltage input with would specify the volume needed. The current flow manager also supports a PC connection via a common nine pin communication port. This port is used to read and write values to the flow manager that can not be changed using the current user interface.
The proposed solution to this problem is to exchange the current flow manager display with a new touch-screen display which will be code named flow manager2 (FM2)
3

during development. The flow manager2 will support more methods of user input than the button press and eight segment display that the flow manager currently has. The flow manager2 will include analog-to-digital (A/D) capability to read the inputs from the pump setup. Fflow manager2 will also have a digital-to-analog (D/A) capability to write outputs to the pump setup. These inputs and output will be unchanged from the current flow manager setup to make the new controller totally interchangeable with the all old setups. The FM2 will also support the communication port interface with will allow different types of user security and also different types of users to change the variables of the flow manager2. This will make the new PC interface more advanced than the old interface. The FM2 will support a profile saving system with will allow the user to select different setups without having the reprogram the FM2 for different types of liquid. Future abilities for the FM2 may include logging of the setup and the variables within the FM2 for viewing by users.
Operating Environment
The expected operating conditions for a final product will be in a factory, 40 – 120 degrees Fahrenheit. It will have to be durable enough to sustain normal factory conditions for the duration of its life. The controller will be stationary once installed and not subject to moving hazards. Also, since it will be designed to be used in a factory, it will not be subject to the changing weather conditions, except that of temperature.
Intended Users
The intended users for this product are people working in a factory environment. These users need to be able very accurately control the flow of a highly viscous fluid flowing through the pump with the FM2 is controlling. The intended user of the FM2 has a good working knowledge of the pump and the fluid which to be pumped. It is expected that the users will be able to read the operating manual for the FM2 and provide the necessary inputs to properly manage the system. A person with the proper training and technical knowledge of the variable speed pump and the sensors used will be required to properly install and setup the FM2.
4

Intended Uses
The intended use for the FM2 is to control the volume displaced by a positive displacement pump that is pumping a highly viscous fluid by varying the speed (RPM) of the pump. This will provide a constant output from the pump which is being controlled. It is expected that the pump will be used in a controlled environment where it may be exposed to extended periods of operation. The end product is not intended to be used on any type of pump that is not supported.
5

Assumptions
In order to complete the project some assumptions concerning the design and materials available have been made. These assumptions are:
· Viking Pump will provide the information and support necessary to model the pump system and will provide a suitable pumping test bed.
· The controller will receive measurements of inlet and outlet pressures, fluid temperature, and pump speed which are correct and in real time.
· The controller will be configured by a user with knowledge of the parameters of the fluid being pumped.
· The flow being controlled will not be a turbulent flow.
· Viking Pump will provide funding for all necessary hardware which will be returned to Viking Pump at the end of the project.
· The min/max pumping rates and min/max pressure values will not be a constant value, but, however, will be dependent on the application.
· The device setup will have an abundant 120 volt power supply from which to use to power the FM2 itself and the pump it controls.
Limitations
There are some limitations to the design that must be met and cannot be changed. They are requirements put in place by the client, Viking Pump, and are as follows.
· The FM2 must be able to operate in a real time environment which will provide the best quality control of the flow through the pump.
· The algorithm implementation must be portable.· The controller solution must be economical.
6

· The controller must be able to control instantaneously the actual flow within 0.25% of a specified point chosen by the user.
7

Expected End Product and Other DeliverablesA prototype FM2 for the pump system will be delivered to the client, Viking Pump. The FM2 will successfully control a variable-speed positive-displacement pump and provide accurate flow of highly viscous fluids. The FM2 will take use no more room than the current flow manager and will interface with the pump which it controls in exactly the same fashion as the current flow manager. The fully function FM2 will support a user interface using a new touch-screen which is built into the FM2 itself or using a new PC interface which can control the FM2 remotely using a standard nine-pin communication port. The prototype FM2 will be accompanied by the source code of the software, documentation of the design, project plan, and test results explaining both the design and use of the FM2.
8

Approach and Design Considerations
This section of the document will explain the approach used in the design of this FM2 and the considerations taken when developing a design for the FM2. This section of the design document will also explain the detailed design which came from this approach and considerations.
Design Objectives
The following is a list of objectives which the played a roll in the design of the FM2. These objectives were used to help improve the design of the FM2 and a design with meets there objectives will be picked as the primary design of the FM2.
· Future functionality - The design must incorporate the ability for the FM2 to expand in the future to such functionality as logging of the FM2’s status to a file to be read by the user for troubleshooting or reporting purposes.
· Simple design - The design must be intuitive to the project goals. This will require the design properly match and be configured to the project rather than a design which is geared for another purpose.
· Operating environment conditions - The design must take into account that the device is to be used in a factor setting where electromagnetic fields may be large and disrupt discrete voltage inputs and outputs.
· Interchangeable with previous setup - The design must use the existing inputs and outputs to control the current pump setup. A foreign setup will not be interchangeable with the current flow manager setups which Viking Pump already has in place and supports.
· Same size, similar weight - The design of the FM2 must fit in the box supplied by the client. A design which is larger will not meet the requirement of being interchangeable with the current system.
Functional Requirements
9

The following requirements where placed on the project by the client Viking Pump:
· Accurate flow control – The end-product shall be able to control the flow of a given fluid under user-defined conditions of the application such as viscosity of the liquid or flow rate. Users shall be able to configure the system to maintain a set pressure or flow rate by varying pump speed.
· Fast-processing – The end-product should be capable of processing information quickly enough to make the necessary changes in real time.
· Able to interface with the required sensors – The controller needs to be able to receive and interpret inputs from the provided sensors (inlet and outlet pressure, temperature of fluid, and pump speed) and provide the necessary outputs to control the system and inform the users of the current state.
· Store and interpret provided inputs – The prototype needs to be able to take user inputs such as the amount of liquid that should be pumped, the flow rate, and information about the viscosity of the liquid along with any other required information.
· Provide a friendly user interface – The controller must provide an easy to use interface for configuration and status monitoring. The user should be able to easily set the pump’s operation data, such as fluid viscosity, as well as set the desired flow rate. The flow rate and other data should be readily accessible to the user.
· Portable algorithm – The algorithm designed should be portable so it can easily be transferred to new hardware.
Design Constraints
This section of the document states what constraints will play a large roll in the design of the FM2. A design which overcomes all of the following constraints will greatly increase the success of the project:
10
Cost:While the group has not yet received any specific cost requirements from Viking Pump, the group has determined that it should be beneficial for the client to produce a product that meets all operational requirements at a minimum cost. The cost should be low enough to allow production of the FM2 unit economical. This may require a more cost effective implementation of the user interface.
Size:While the prototype of the design may be greatly different than the final product, the design should be created in a way that enables it to be scaled down. The final product should be small and portable.
11

Power Consumption:The device should use as little power as possible, but the group expects the device will have access to an abundant power supply. This is due to the expected use of the device in a factory-like setting, indicating that it will not be required to operate from a battery supply.
Weight:The group has not been given any specific weight requirements, but one will realize that lighter devices tend to reduce cost when implementing and installing the device in a factory setting. For this reason, the final product should be as light weight as the operational requirements allow. Due to the developmental nature of this project, the prototype created may not reflect the final product in weight specifications.
Performance:The control unit must work in a factory setting with constantly changing input. As such, it must be able to complete all calculations in a real-time environment. The completion of all tasks in this speedy matter is crucial to the operation of the device. Incorrect calculations resulting from failure to complete this task could result in problems with overall factory operation.
Technical Approach ConsiderationsThe considerations that follow pertain to the methods by which the team plans to develop its project. The project will be developed using a build and unit test behavior. This behavior will ensure that the unit parts of the project work correctly, filtering out any bugs, before the parts are put together during integration. It is believed that this behavior will cause integration to be easier because the group will not be debugging the project as a whole. Once all the parts of the project have been acquired or written and unit tested, integration of the project will start. Once the group has
12

completed troubleshooting the integration, formal testing of the project will begin. This strategy will make the project run more smoothly and increase the chance of success within the given schedule and budget.
13

Testing Approach Considerations
Testing is expected to occur in three phases. The first two, testing of the code and testing of the circuitry, can be conducted in parallel by the group. The final testing, testing of the prototype as a whole, must be completed after all other testing which will also be done by the group. Each series of tests will require writing simulation code or building simulation circuitry with will test each boundary condition of the function and circuit. Unit testing of the code will be informal confidence testing done by the author of the function in question. The group will then expect the primary test phase to focus on the integration of the project’s pieces which will be done by the group once the integration is finished. Final testing of the project will need to be done onsite under normal operations conditions, likely to be done by Viking Pump.
Project Continuation
The team believes that the project as currently stated will result in a working prototype for the client that will meet all expectations of the client. Therefore, the team suggests the project be continued as planned because the team has a good understanding of what is required of the project.
14

Detailed Design
The FM2 will be broken down in to two main parts with will be developed in parallel by the team. These two parts are the software architecture and the hardware architecture.
The figure below shows an abstract overview of the project design. The boxes in orange are the responsibility of the hardware design team, while the blue boxes are the responsibility of the software design team. Those boxes left uncolored are preexisting modules to be incorporated in the overall design. The “flow manager” box is the responsibility of both teams, as it involves integrating the software with the hardware.
Figure 1 – Whole Project Schematic
15

Pre Existing Modules
The uncolored boxes in the above figure are preexisting hardware modules used for testing FM2 in a simulation of a real-world environment. A list of these modules, specifications, and purpose follows.
- Allen Bradley 90V Direct Current Drive, Model #1362-NOF
This DC drive is uses an inputted current from the circuit block and outputs a variable frequency AC signal used to control the speed of the motor. A more detailed description of its functionality follows in the hardware design subsection.
- Allen-Bradley .25 HP Direct Current Motor, Model #PN-111169
The DC motor is used to directly control the speed of the pump. The speed of the motor is measured using a pulse sending unit, and the speed of this motor is what directly creates the desired flow.
- Kondu 6-24 VDC Pulse Sending Unit, Model #DRK 56C
The pulse sending unit outputs a square wave to the flow manager through the circuit block. The frequency of this square wave is directly proportional to the RPM of the DC motor.
-Viking Positive Displacement Gear-in-Gear PumpThe pump is used to positively displace viscous fluids. For simulation and testing purposes, the pump displaces #10 lube oil in a closed-loop circuit.
- Wika 0-500 p.s.i Pressure Transmitter, Model # 8341197
Two pressure transmitters are used to measure both inlet pressure and outlet pressure. The pressure transmitter outputs a current directly proportional to the gauge pressure of the inlet or outlet line.
- Minco Temperature SensorThe temperature sensor sends a current signal to the circuit block which is directly proportional to the temperature.
16

17

Software Design
Figure 2 – Software Design OverviewThe software system implements a modular design, with each piece connecting to all other pieces through the central data hub. This design will make future modifications to the system easier to perform, as each module is able to function indepen-dently of the implementation of other modules. As such, ex-panding the current software design would involve modifica-tions to the data hub and the creation of an additional module, with no need to alter any of the other existing modules. This de-sign will also facilitate testing of the system as a whole. Each module can be tested independently, enabling the team to more quickly determine the location of problems and more easily fix them once they are found. The system design is easy to under-stand, as the modularization divides a complex problem into smaller pieces that can be looked at one by one.
18

Data Hub
Figure 3 – Data Hub to/from Pump Interface
The data hub module is the center piece of our software design. It will store all of the software's data in a central location and al-low data access from all other modules. Whenever a module re-quires a piece of data, it accesses it through a data hub func-tion. For example, for the control algorithm to request current pump speed, it must call the function getFloat(RPM_ACTUAL), where RMP_ACTUAL is a predefined index in an array of floats that will be decoded by the getFloat function to determine which value to access. The getFloat function will then return the requested value to the control algorithm. Values are up-dated in the same way using the set functions. The data hub de-termines, upon data access, if the data needs to come from an outside source or an internal source. For example, if the data requested were the current temperature of the fluid, the data hub would detect that temperature values come from the out-side world and would update its temperature value using the A/D converter built into the QVGA board. After the temperature value is updated in the data hub, and then the data hub will re-turn the new temperature value to the calling function. Output values, such as desired pump speed, are also updated in this way.
19

PC Communication
Figure 4 – Data Hub to/from PC Communication Interface
Figure 5 – PC Communication to/from PC Inter-face
20

The PC communication module is responsible for handling all communication between the flow manager and a PC. A PC can be connected to the flow manager to control the flow manager in much the same way as the touch screen GUI, providing a more user-friendly interface into the system. The PC communi-cation module acts as a direct connection from the flow man-ager to the PC. The PC user must first login to the system, which is handled by the PC communication module. Once this is completed, the user will have access to the flow manager based on the privileges associated with his login account. For exam-ple, in normal access mode, the user will be able to make stan-dard changes, such as switching between automatic and manual control. All communication between the PC and the PC commu-nication module will be facilitated using a string-passing proto-col, with PC communication acting as a slave to the PC. PC communication waits for a string to be sent from the PC; when a string is received it processes the communication and performs the necessary actions, and then sends a response string back to the PC. The response string can be data requested by the PC or simply a "completed" string when no other data needs to be sent. This module will run as its own thread so that it may be completely independent of all other modules.
Touch Screen GUI
Figure 6 – Data Hub to/from Touch Screen GUI Interface
21

The touch screen GUI module will provide a user-friendly inter-face into the operation of the flow manager. This operation is similar in concept to the PC communication module, but the lay-out of the GUI will be different so as to make more efficient use of the smaller screen. The module will run as its own thread, constantly displaying the most current runtime data as well as the current control settings. It will reside in the normal access mode, which does not require logging in, as the first level of se-curity for the system is a lock on the front of the flow manager enclosure. To switch to an access mode with more privileges, a username and password is required. For example, only the flow manager administrator or a Viking Pump representative will have the ability to change the slip coefficient used by the control algorithm. The touch screen GUI is capable of handling all user interaction so that the flow manager can function by itself with no need for an accompanying PC.
Control Algorithm
Figure 7 – Data Hub to/from Control Algorithm Interface
The control algorithm module will run as its own thread. It will consist of while loop that continuously checks the operational status and then adjusts pump speed as necessary. First the con-trol algorithm retrieves all necessary data from the Data Hub. This includes the inlet pressure, outlet pressure, current pump
22

speed, fluid temperature, and slip coefficient of the pump, as well as information regarding the viscosity of the fluid being pumped. Using this data, the control algorithm then determines the current flow through the system. When in automatic control mode, the control algorithm then determines how much the pump's speed must be increased or decreased to achieve the de-sired flow, and calls the data hub functions necessary to update the desired pump speed accordingly. When in manual control mode, the FM2 makes the flow calculations, but does not act to change the desired pump speed settings. The control algorithm will use the following equations:
Theoretical Flow = RPM * DisplacementSlippage = SlipCoeff * (PressureOut – PressureIn) / Viscosity *
DisplacementActual Flow = Theoretical Flow – Slippage
23

Pulse Counter
Figure 8 – Data Hub to/from Pulse Counter Inter-face
The pulse counter module is responsible for converting pulses from the pump into a number representing the pump’s speed and acceleration. Each time a pulse is received, it activates an interrupt, whose interrupt service routine simply adds one to a pulse counter through the data hub. The pulse counter runs as its own thread. It has a continuous loop that sleeps for a know duration of time. Each time it awakes, it takes the number of pulses divided by the sleep duration and multiplies that result by a constant to determine the average pump speed since the last time the loop has run. It takes this speed, subtracts the pre-vious pump speed, and divides by sleep duration to determine the pump’s average acceleration since the last sleep. These two results are then sent to the data hub to be used by all other modules. Finally, the pulse counter calls the necessary data hub functions to reset the pulse counter then goes back to sleep to wait for another round.
Hardware design
24

The list below includes all hardware used in implementing and designing FM2. Any reference to any hardware parts in the detailed description below can be referenced to this list.
25
Table 1 – Required Parts ListCOMPONENTS SPECIFICATIONS Estimated
Cost/per PartAllen-Bradley DC-Driver
AC Volts 115 MaxAmps 15DC Volts 90 Max Amps12HZ 50/60 VDC
Donated by Client
Nemic-Lamda power supply
115V AC 50/60 HZ to 16 VDC 4A
Donated by Client
Allen-Bradley Relay 50/60 Hz 110- 330 V Donated by Client
Philips Low power op-amps
LM324N3V~32V ( or ±1.5 ~16V)Large DC VoltageGain:100dB
$1.49
Phoenix Contacts 16 pins Donated by Client
Push button: stop 300 VAC max720 VA Break 110 300V800 MR-B6 Series A
Donated by Client
Push button: start 300 VAC max720 VA Break 110 300V800 MR-A2 Series A
Donated by Client
Serial port Nine pins males D-Sub Connector-Solder
$0.20
Fuse holder: Radio shack
1 inch by ¼ inch $1.00
Wire Black (hot) :14 gaugeRed ( push button) : 14 gaugeWhite( neutral): 14 gaugeGreen( ground): 14 gauge
$5.00
Fast- Acting Fuses Radio shack
250 V 5A 1 ¼ * ¼”
$0.40
Resistors 220 ,33,1000 Ohm ½ watt
$0.20
26

5% toleranceGeneric three pins power connector
Male 15A 250V 50/60 HZ
Donated by Client
Total Cost: $8.29
The figure below shows a detailed diagram of how each piece of hardware interacts with the others. It does not include any details on the preexisting hardware, as this was detailed above, nor does it include any detailed specifications on the touch screen, other than its functionality, as this was a previously purchased piece of hardware.
27

Figure 9 – Implemented Hardware Schematic
The power supply accepts AC voltage from the wall, and converts it to 16V DC. This voltage powers both the touch screen and the op-amp on the circuit block.
Using the voltage supplied by the power supply, the circuit block accepts as inputs pressure in, pressure out and temperature, all as currents, then converts these signals to voltages, which are accepted and interpreted by the touch screen. The circuit block also accepts from the touch screen a voltage used to control the speed of the pump and converts it to a current which is sent to the DC drive.
28

Figure 10 – Current to voltage conversionThe current to voltage circuit in the figure above is used to convert incoming current signals from pressure in, pressure out and temperature measurements on the pump to corresponding voltages used by the touch screen. Incoming currents range from 0 to 20 mA, and voltage is read across the 250 Ohm resistor in the 0 to 5 V range. The 1k Ohm resistor is used to ensure no large current can enter the touch screen device. There will be six of these circuits, one each for pressure in, pressure out, and temperature, as well as three additional circuits to allow for future expansion of other signals.
Figure 11 – Voltage to current conversion
The voltage to current circuit is used to convert an input voltage into a corresponding output current used to control the speed of the motor. The 0 to 5 V signal is input to the positive op-amp terminal, which forces the same voltage at the negative terminal. This voltage across the 250 Ohm creates the output current in the 0 to 20 mA range which is then supplied to the DC drive. There will be two of these circuits, one to control the speed of the motor and one to allow for future expandability.
The touch screen inputs the voltages from the circuit block for its reading of the pressure input, pressure output, and fluid
29

temperature. The touch screen additionally inputs a pulse voltage which is used to calculate the speed of the motor driving the pump. Powered by the AC voltage from the wall, the push buttons are used to control a relay; when the on button is pressed, the connection in the relay is made, and this in turn supplies voltage to the DC drive. This connection is maintained until the off button is pressed, at which point the connection in the relay is broken, and no voltage is supplied to the DC Drive.
Once the connection in the relay has been made, the DC drive will power on and accept current from the circuit block, then output a corresponding variable frequency AC voltage which is used to control the speed of the pump motor.
The touch screen and the circuit block will be housed inside of a Faraday cage to protect them from electromagnetic interference, and this cage, along with all of the of the other hardware in the figures above will be mounted inside of a component case supplied by the client. All connections to and from other hardware modules shall be made through the Phoenix Contact 16-pin connector.
Resources and Schedules
The team estimates that each member needs to commit an estimated amount of hours to certain tasks to finish the project on time. The initial breakdown of these hours is in the table below divided by team member and task number. The table also shows the total hours dedicated to the project as a whole by team member as the total hours put forth by each task by the team.
Table 2 – Expected Personal Effort RequirementsMember Task
1Task 2
Task 3
Task 4
Task 5
Task 6
Member Total Hours
Dan Paulsen
12 15 80 50 15 20 192
Dwayne Stammer
15 14 70 65 20 15 199
Francois 13 17 56 60 15 17 178
30

ManyakaziJohn Taylor
14 12 58 80 25 20 209
Cliff Pinsent
10 0 10 0 10 0 30
Team Total
64 58 274 255 85 72 808
After getting started on the project it became clear that certain tasks where going to take longer than previously expected by the team as a whole. It also became clear as each team member found his role in the project that some team members would be committing more hours to some task and fewer hours on others. These estimated revised personal effort hours are displayed in the table below. The table is also divided by team member and task as well as shows that the total hours for each team member on the project and total hours on each task. The total number of hours which the team is projected to take has increased by 157 hours due to new project information and viewing the hours already used on the project.
31
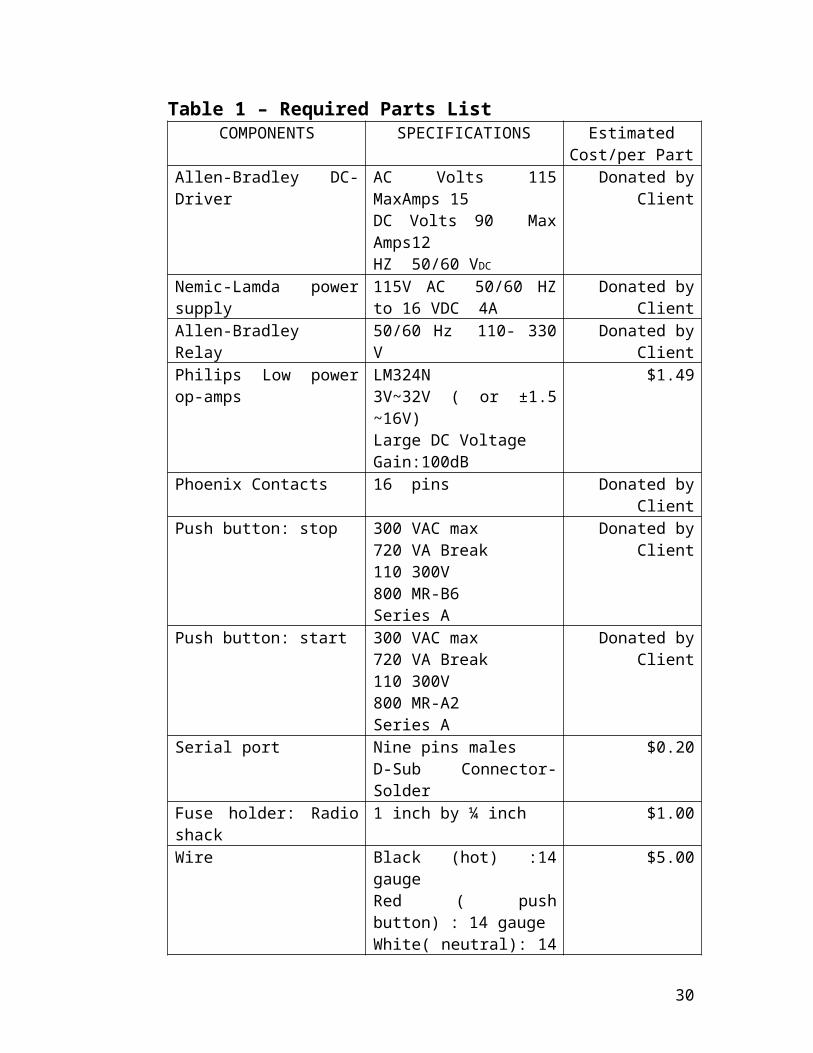
Table 3 – Revised Personal Effort RequirementsMember Task
1Task 2
Task 3
Task 4
Task 5
Task 6
Member Total Hours
Dan Paulsen
30 15 70 50 20 40 225
Dwayne Stammer
25 20 120 65 20 20 270
Francois Manyakazi
20 20 50 60 15 35 200
John Taylor
20 25 60 80 15 35 235
Cliff Pinsent
5 0 20 0 10 0 35
`Team Total
100 80 320 255 80 130 965
The following list of hardware the group predicts will be needed to build a working demo unit for delivery. This list included all implementation parts needed, all documentation printing cost, and all development tools or parts required for development.
Table 4 – Original Other Required Resource Requirements
Item Team Hours
Other Hours Cost
Printing of project docs.
20 0 $20.00
Misc. electrical components
5 0 $30.00
Totals 25 0 $50.00
As the project got underway it became apparent to the team that other tools and parts would be needed to complete the project. These included a larger list to electrical parts that would be needed to complete the project on time. Also added to the list was a computer cable required to hook the development computer to the destination hardware device.
Table 5 – Revised Other Required Resource Requirements
Item Team Other Hours Cost
32

HoursPrinting of project doc.
20 0 $20.00
Misc. electrical components
5 0 $40.00
Computer cables 1 0 $10.00Heavy duty electrical parts
2 0 Donated by Client
Revised Totals 28 0 $70.00
The following table shows the expected total finical requirements for the project. Shown in the table is the complete budget of the previous team to work on the project and any expected cost that this team anticipates during development. Added to this subtotal is the expected labor cost for this team. The original expect total cost of this project is $17.268.00.
Table 6 – Original Expected Financial RequirementsExpected Cost Item Cost Without
LaborCost With Labor
Previous School Sessions
$ 8,270.00
$ 8,270.00
Project Poster $ 60.00
$ 60.00
Misc. Parts/Wire $ 50.00
$ 50.00
Subtotal $
8,380.00 $
8,380.00 Labor at $11.00 Hours
Expected
Dan Paulsen 192 $ 2,112.00
Dwayne Stammer 199 $ 2,189.00
Francois Munyakazi
178 $ 1,958.00
John Taylor 209 $ 2,299.00
Cliff Pinsent 30 $ 330.00
Total Hours 808 Total Labor Cost $
33

8,888.00 Total Project Cost $
8,380.00 $
17,268.00
After getting started on the development of the project it became clear that the team was going to need more parts for the project to work as expected. These additional parts include heavy duty switches and fuses for the pump to run, these parts were donated by the client. The revised expected cost of the project as a whole has risen to $19,005.00 because of required parts, but mainly by additional labor need to finish the project on time.
34

Table 7 – Revised Expected Financial RequirementsExpected Cost Item Cost Without Labor Cost With LaborPrevious School Ses-sions $ 8,270.00 $ 8,270.00 Project Poster $ 60.00 $ 60.00 Misc. Parts/Wire $ 50.00 $ 50.00 Computer Cables $ 10.00 $ 10.00 Heavy duty electrical parts Donated by client
Subtotal $ 8,390.00 $ 8,390.00 Labor at $11.00 Hours Expected Dan Paulsen 225 $ 2,475.00 Dwayne Stammer 270 $ 2,970.00 Francois Munyakazi 200 $ 2,200.00 John Taylor 235 $ 2,585.00 Cliff Pinsent 35 $ 385.00 Total Hours 965 Total Labor Cost $ 10,615.00 Total Project Cost $ 8,390.00 $ 19,005.00
35

Schedule
The group initially identified many tasks with a schedule that is needed to complete the project on time. This initial estimate is outlined in the gantt chart below. After starting the project it became clear that some task where going to take longer than anticipated in the original gantt chart. The revised version of the gantt chart is shows below. Following the revised gantt chart is a schedule of deliverable documents and dates which will keep the project on schedule.
Figure 12 – Original Gantt Chart
Figure 13 – Revised Gantt Chart
The deliverable schedule has not changed from the original schedule; therefore no revised schedule is necessary.Figure 14 – Deliverable Schedule
36

Closure Material
Client Information
Viking Pump, IncBill Allen406 State Street, PO Box 8Cedar Falls, IA 50013-0008Phone: 319-266-1741 ext 8208
Faculty Advisor Information
Nicola Elia3131 CooverAmes, IA 50011-3060Email: [email protected]: 515-394-3579Fax: 515-294-8432
Student Team Information
Dwayne Stammer Dan Paulsen4335 Frederiksen Ct. 218 South Walnut #5Ames, IA 50010 Ames, IA 50010Phone: 515-572-7820 Phone: 319-558-9887Email: [email protected] Email: [email protected]
John Taylor Francois Munyakazi1313 Frederiksen Ct. 143 University Village Apt. BAmes, IA 50010 Ames, IA 50010Phone: 563-607-0661 Phone: 515-572-4704Email: [email protected] Email: [email protected]
Clifford Pinsent Jr.119 Stanton Ave Apt. 722Ames, IA 50014Phone: 515-451-0360Email: [email protected]
37

Closing Summary
Viking Pump needs a well-designed flow control manager to be used with already existing pumps. The previous version of this product was a very large success for the company, however, they have not sold any of the older versions for many years because of a number of factors including obsolete parts, and the lack of user friendliness of the device even thought it is still the best device on the market.
The project goal is to recreate the device with a new look and user friendly feel with updated hardware and software. The approach used to do this will include milestones which will mark a major accomplishment for the team as it overcomes the learning curve of the project. Each milestone will build on the previous one to ensure that the project works as expected. Meetings with the client will be scheduled during this time to ensure that the product being produced is in parallel with the client’s wishes.
The final product will be delivered to Viking pump consist of a control unit case, accompanying hardware, code to implement the control unit, and a touch screen to handle user interaction. The delivered device will be ready for real world testing by Viking whom may choose to pursue a sellable model afterward so that Viking Pump will continue to lead the world in the market of pump mangers with the production of the FM2.
38

References
Viking Flow Manager User’s Manual, Viking Pump, Inc ©1997406 State St. P.O. Box 8 Cedar Falls, IA 50613-0008
A C Programmer’s Guide to the QVGA Controller, © Oct. 2002 Mosaic Industries
Bulletin 1362 Single Phase DC Package Drive Instruction Manual, Alan-Bradley
39