pump-and-treat remediation of chlorinated solvent contamination at a controlled field-experiment...
TRANSCRIPT

Pump-and-Treat Remediationof Chlorinated SolventContamination at a ControlledField-Experiment SiteM I C H A E L O . R I V E T T , * , †
S T E V E N W . C H A P M A N , ‡
R I C H E L L E M . A L L E N - K I N G , §
S T A N L E Y F E E N S T R A , | A N DJ O H N A . C H E R R Y ‡
School of Geography, Earth & Environmental Sciences,University of Birmingham, Birmingham, B15 2TT, U.K.,Department of Earth Sciences, University of Waterloo,Waterloo, Ontario, N2L 3G1, Canada, Department of Geology,876 Natural Sciences Complex, University at Buffalo,Buffalo, New York, 14260, and Applied GroundwaterResearch Ltd., 5285 Drenkelly Court, Mississauga, Ontario,L5M 2H7, Canada
Pump-and-treat (P&T) remediation and associatedconcentration tailing are investigated at the field scale ina mildly heterogeneous sandy aquifer through theextraction of dissolved chlorinated solvent plumes thathad developed over 475 d from a multicomponent densenonaqueous-phase liquid (DNAPL) source intentionallyemplaced in the aquifer at the Borden (ON) research site.Extraction was accomplished via a source-containmentwell located 25 m from the source and two furtherdowngradient plume-centerline wells to remove theadvancing high-concentration dissolved plumes. The 550days of detailed P&T field data demonstrated the following:remediation, albeit slowly, of the leading 25-60 m plumesection to around typical drinking water standardconcentrations; concentration tailing (reduction) over 4orders of magnitude in the plume; a steady-state concentration“plateau” in the source-containment well capturing thesteadily dissolving DNAPL source; influences of extractionrate changes (concentration rebounds); and, lengthytailing from inter-well stagnation-zone areas. Much of thecontaminant behavior during the P&T appeared to be“ideal” in the sense that with appropriate specification ofthe source term and pumping regime, it was reasonablypredicted by 3-dimensional numerical model (Hydro-GeoSphere) simulations that assumed ideal (macrodispersion,linear sorption, etc.) transport. Supporting lab studiesconfirmed nonideal sorption was, however, important atthe point sample scale with enhanced PCE (tetrachloroethene)sorption to low- and high-permeability strata and moderatenonlinear and competitive sorption influences. Althoughthere was limited evidence of nonideal tailing contributionsto the field data (underprediction of some tailing curvegradients), such contributions to P&T tailing were not easilydiscerned and appeared to play a relatively minor rolewithin the mildly heterogeneous aquifer studied.
IntroductionPump-and-treat (P&T) remediation was adopted at 75% ofSuperfund sites during 1982-1992 (1). Toward the end ofthat period, however, it became apparent that completeaquifer restoration by P&T to low µg/L drinking waterstandards was generally not feasible, particularly at sitescontaminated by dense nonaqueous-phase liquid (DNAPL)sources (1-3). Significant attention has been paid to thechallenges of source zone remediation ever since (4, 5);nevertheless, P&T remains prominent, either to hydraulicallycontain sources, remove dissolved plumes, or as a componentof accelerated source removal technologies. Adoption ofso-called “smart P&T” practices where greater considerationis given to contaminant removal or control, thorough siteinvestigation, optimized dynamic management of the wellfield, and setting of realistic cleanup goals (6, 7) is vital, asis underpinning research on processes that cause exponen-tially declining concentrations (tailing), quasi-stabilizationof concentrations (plateau), or even concentration increases(rebound) (2). Understanding such processes is key toreducing remediation costs and effective P&T optimization(8-12).
Although P&T data from contaminated field sites fromthe past two decades are demonstrative of tailing andsupportive of the general consensus that P&T alone fails toachieve permanent aquifer restoration due to the presenceof DNAPL (13), such data are frequently too ambiguous todraw specific process-related conclusions on concentrationtailing (14). Supporting lab and modeling studies indicateslow NAPL dissolution, diffusion from less permeable strata,or slow desorption from aquifer solids are key processes thatcause tailing (15-21). Detailed field research studies relevantto P&T have focused upon reverse diffusion from contami-nated aquitards (22-25) and the elution of small sub-portionsof plumes (26-28). Detailed P&T field research studies at thewhole source-plume scale (29) are surprisingly rare.
This field research study evaluates processes limitingconcentration reduction during P&T remediation of dissolvedchlorinated solvent plumes originating from a multicom-ponent DNAPL source zone. The source had been purposelyinstalled and 3-dimensional plume development was moni-tored as part of a controlled field experiment (30). The well-known contaminant source conditions enabled the followingresearch goals: (i) to evaluate the feasibility (or efficacy) ofP&T to remediate high-concentration, dissolved plumes ina mildly heterogeneous aquifer through collection andanalysis of a high-resolution 3-dimensional P&T field dataset;(ii) to evaluate the ability of a model based on “ideal” transportassumptions (i.e., macrodispersion, linear and local equi-librium sorption) to reasonably capture field-scale P&Tbehavior for these conditions; and, (iii) to use the model toexplore the combined effects of known source and opera-tional activities on concentration tailing.
Exponential concentration tailing trends are the expectedbehavior for any plume flushing operation, even under idealtransport assumptions; e.g., a trailing plume edge is subjectto dispersion. Nonideal processes, however, may causechanges in the exponential slope over time and exacerbatetailing. Such processes include nonequilibrium, nonlinear,and competitive sorption; physical heterogeneity that resultsin greater dispersion than that observed for a nonreactivetracer; or, slow diffusive contaminant release from low-permeability strata. These may lead to long remediationtimescales even when DNAPL sources have been removedor effectively isolated (25). Although nonideal processes
* Corresponding author fax: + 44 (0)121 414 4942; e-mail:[email protected].
† University of Birmingham.‡ University of Waterloo.§ University at Buffalo.| Applied Groundwater Research Ltd.
Environ. Sci. Technol. 2006, 40, 6770-6781
6770 9 ENVIRONMENTAL SCIENCE & TECHNOLOGY / VOL. 40, NO. 21, 2006 10.1021/es0602748 CCC: $33.50 2006 American Chemical SocietyPublished on Web 09/22/2006

inevitably occur in all aquifer settings, their influence onP&T in mildly heterogeneous aquifers may not be thatsignificant, or even easily discernible among other contrib-uting factors or uncertainty in those factors at the plumescale. Such issues are examined using ideal transport modelsimulations of the detailed field dataset and supporting labwork that quantifies some of the nonideal sorption processesrelevant to multi-solute plumes spanning wide concentrationranges.
Materials and MethodsSite Description. The P&T study was undertaken at theBorden “emplaced-source” site (ES site), a field-research“sub-site” among others located at the Borden research site,Canadian Forces Base Borden, ON (30, 31). The layout of theES site is shown in Figure 1 with plates in the SupportingInformation (SI) Figure 1. The ES site had hosted the ESnatural gradient tracer test, a controlled field experiment tostudy chlorinated solvent dissolution and transport processesin a natural aquifer setting (30-35). The aquifer comprisesglaciolacustrine fine-medium sands with mean propertiesdetermined at the ES site of hydraulic conductivity (K)6.34 × 10⁻³ cm/s, porosity 33%, bulk density 1.75 g/mL, andfraction organic carbon (foc) 0.021%. Based on the averagehydraulic gradient of 0.51%, the calculated natural ground-water velocity was 8.5 cm/d (30). The water table was 2-3 mbelow ground and the lower 2 m of the aquifer contained aninorganic solute-rich leachate plume derived from an up-gradient landfill. The ES tracer test and P&T study wereconducted in the 6-m-thick, previously clean groundwaterzone overlying the landfill plume, and thus in an environmentwhere the DNAPL and downgradient plume was not incontact with an underlying aquitard.
Sand beds at Borden are typically cm to tens of cm thickwith mm-scale variability visible (36). The mild to modest
degree of geological heterogeneity in the area where the P&Tstudy was undertaken is shown by four K profiles (Figure 2)and a 16-core transect (SI Figure 2). The ln K variance andK range determined from a 794-sample (5-cm vertical interval)set of permeameter measurements obtained from that tran-sect were 0.49 and 1.62 × 10⁻⁵ to 3.12 × 10⁻² cm/s, respec-tively. Low and high K samples were usually present at∼95-96 m elevations (Figure 2a-c) although some profilesdemonstrated remarkable uniformity throughout (Figure 2d,SI Figure 2).
The DNAPL source was purposely installed to allow fieldstudy of plumes generated from a known source zone (30,31). A 0.75 m3 rectangular block-shaped source was emplaced1 m below the water table at 95.1-96.1 m site elevation viaa controlled dewatered excavation and subsequent back-filling. The source, mixed at the surface and then depositedinto a temporary source form in the dewatered aquifer,contained Borden sand mixed with residual DNAPL com-prising a multicomponent mixture of TCM (trichloromethane,a.k.a. chloroform), TCE (trichloroethene), and PCE (tetra-chloroethene). Gypsum powder was incorporated to providea conservative sulfate tracer. Initial source (core) massestimates were as follows: TCM 1.45 ( 0.33 kg; TCE 8.93 (1.42 kg; and PCE 12.60 ( 1.61 kg. DNAPL pore saturationwas 5.0 ( 0.7% with initial mole fractions as follows: TCM0.078 ( 0.011; TCE 0.434 ( 0.012; and PCE 0.488 ( 0.020.Based on these data, literature solubility values (37), and aRaoult’s law analogue, initial effective solubilities were TCM680 mg/L, TCE 610 mg/L, and PCE 120 mg/L (31).
Site monitoring methods, plume development, and sourcedissolution have been previously described (30-32). Thenatural gradient test lasted 454 d with dissolved plumescontinuously generated from the DNAPL source and moni-tored via 173 Teflon multilevel samplers (2300 samplingpoints) (Figure 1). By 418 d, just 15% of the solvent DNAPLhad dissolved into the aquifer (31). TCM, the most mobileplume, was 60 m long, 7 m wide, and 3 m vertical thicknesswith peak concentrations >100 mg/L and plume fringeconcentrations detected to <0.005 mg/L. Horizontal andvertical transverse plume spreading was limited with highconcentration gradients observed (30, 32). Abiotic degrada-tion was not expected and biodegradation was not evident(dechlorination products absent, persistent aerobic condi-tions, and lack of carbon source (30)).
Primary plume transport controls were hence dispersionand sorption that controlled the relative migration of plumes.Retardation factor (Ri) estimates from 3-D transient numericalmodel fits (moments analysis was not applicable) to longi-tudinal profiles at various times were as follows: RTCM ∼1.0(also shown to be conservative relative to the sulfate plume),RTCE ∼1.1-1.2, and RPCE ∼1.4-1.8 (32). These model fitsassumed uniform dispersion with time and linear equilibriumsorption and hence provided a fundamental “baseline” fit tothe data. These values were comparable to empiricalestimates of RTCM ) 1.06, RTCE ) 1.10, and RPCE ) 1.29 basedon Koc (organic-carbon partition coefficient) data (53, 94,and 265 mL/g for TCM, TCE, and PCE, respectively (38)) andmean aquifer property values provided earlier.
Pump-and-Treat Design. Source dissolution data andmodeling indicated that the source zone under naturalgradient conditions may persist for ∼25 years (31, 33). Therole of the P&T was hence to (i) remove the leading plumefront from the aquifer portion 25-60 m downgradient of thesource, the “25-60 m zone”; and, (ii) attain source zonecontrol, i.e., capture of contaminants continuing to dissolvefrom the DNAPL. This was achieved via three extraction wells,PW2, PW3, and PW4, located in the 25-60 m zone approx-imately along the plume centreline, with PW2 serving as thesource-control well (Figure 1; SI Figure 1). The plume center-line approach was selected as a basic, typical, P&T scheme.
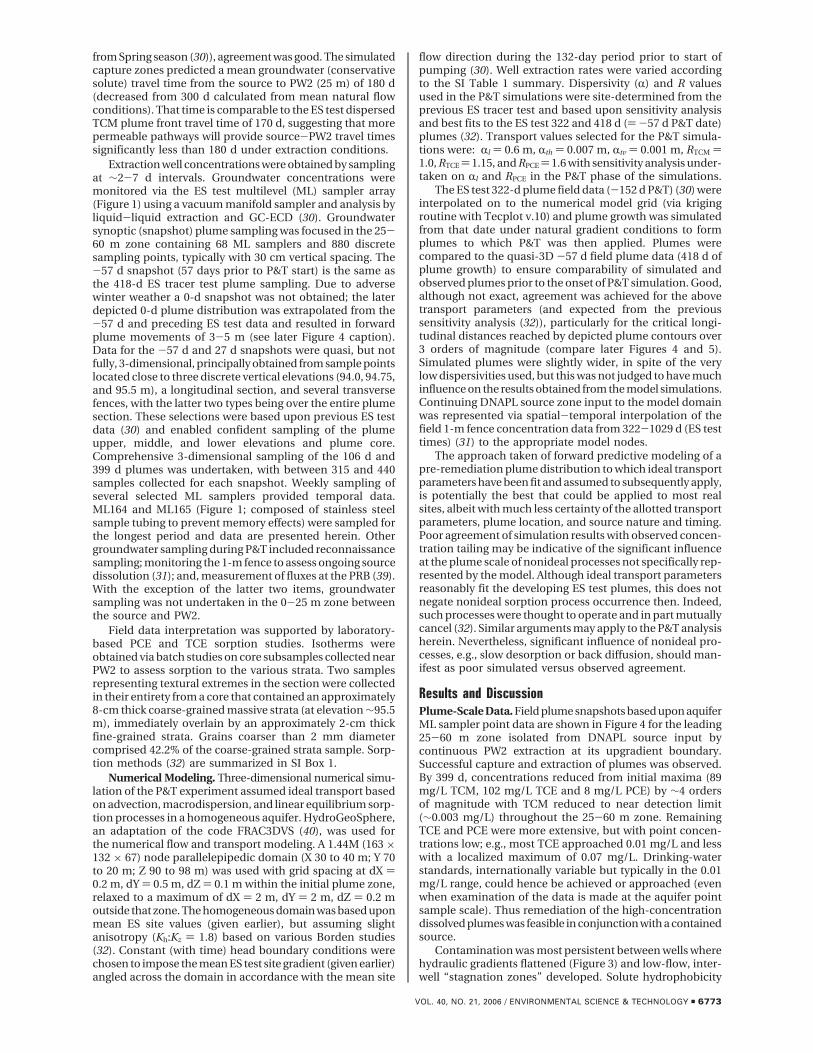
FIGURE 1. Plan view of the emplaced-source (ES) field experimentsite and P&T study area (the shown TCM plume position is basedupon ES test sampling (30) and extrapolation of pre-P&T samplingdata as discussed herein).
VOL. 40, NO. 21, 2006 / ENVIRONMENTAL SCIENCE & TECHNOLOGY 9 6771

It was not optimized, although such an approach may haveadvantages of minimizing drawdown (9). Extraction wells(5 cm o.d.) were installed using hollow-stem augers with3-m screens placed to intersect plumes known to lie at ∼93-96 m elevation. Groundwater was extracted via a surfacecentrifugal pump, treated with granular activated carbon,and re-injected at a remote aquifer location.
Extraction well operating periods, flow rates, and cumu-lative extractions are summarized in Table 1 of the SupportingInformation (and detailed in SI Figure 3). The “0 days P&T”start time (5-Feb-91) for the P&T was 475 days after theinitiation of the ES tracer test (emplacement of the DNAPLsource) and chosen to coincide with the commencement ofextraction from all three wells. Some prior pumping of PW4(from -21 days) was undertaken, however, to capture theleading edge of the TCM plume. After 125 d of P&T, azerovalent iron permeable reactive barrier (PRB) was installed∼7 m downgradient from the source (Figure 1; SI Figure 1)and was estimated to remove 90% of dissolved TCE and 85%
of dissolved PCE (39) emitted from the source zone. Anadditional well (PW-A) was installed immediately downgra-dient from the PRB that was proposed to capture contami-nants untreated by the PRB (Figure 1) and operated over theperiod 236-362 d (thereby influencing some late time PW2data). Later source-related remediation included a funnel-and-gate addition to the PRB, permanganate in-situ chemicaloxidation of the source, and a final confirmatory sourceexcavation. Only the PRB influenced the late-time P&T dataherein reported to 550 d of P&T (PW2 remained operationalbeyond that time with limited data collection).
Groundwater Monitoring. Water table elevation data werecollected from the piezometer network (Figure 1) to establishdrawdown influence. Data indicated extraction rates weresufficient to capture the plumes, which was endorsed by 3-Dnumerical flow simulations (later) and collapse of plumesinto the extraction wells. Figure 3 compares field water tabledata (at 29 d) with simulated capture zones. Other than thefield data showing slightly higher regional gradients (data
FIGURE 2. Hydraulic conductivity (K) profiles from laboratory falling-head permeameter tests on cores from the locations of multilevelsML164 and ML165 and cores in close proximity to extraction wells PW2 and PW3. Multilevel sampling point elevations referred to in thetext are indicated. K values have been reduced by a factor of 1.36 to adjust to a 10 °C field temperature.
FIGURE 3. Plan-view groundwater flow regime: (a) observed field data at 29 d; (b) head distribution and capture zones estimated by the3-D HydroGeoSphere model for average 0-141 d conditions (during which time pumping rates were relatively steady) at z ) 95 m.Streamtraces show markers at 20-d intervals for a conservative solute (equivalent to 12.5-d intervals for a retarded (PCE) solute withR ) 1.6).
6772 9 ENVIRONMENTAL SCIENCE & TECHNOLOGY / VOL. 40, NO. 21, 2006
from Spring season (30)), agreement was good. The simulatedcapture zones predicted a mean groundwater (conservativesolute) travel time from the source to PW2 (25 m) of 180 d(decreased from 300 d calculated from mean natural flowconditions). That time is comparable to the ES test dispersedTCM plume front travel time of 170 d, suggesting that morepermeable pathways will provide source-PW2 travel timessignificantly less than 180 d under extraction conditions.
Extraction well concentrations were obtained by samplingat ∼2-7 d intervals. Groundwater concentrations weremonitored via the ES test multilevel (ML) sampler array(Figure 1) using a vacuum manifold sampler and analysis byliquid-liquid extraction and GC-ECD (30). Groundwatersynoptic (snapshot) plume sampling was focused in the 25-60 m zone containing 68 ML samplers and 880 discretesampling points, typically with 30 cm vertical spacing. The-57 d snapshot (57 days prior to P&T start) is the same asthe 418-d ES tracer test plume sampling. Due to adversewinter weather a 0-d snapshot was not obtained; the laterdepicted 0-d plume distribution was extrapolated from the-57 d and preceding ES test data and resulted in forwardplume movements of 3-5 m (see later Figure 4 caption).Data for the -57 d and 27 d snapshots were quasi, but notfully, 3-dimensional, principally obtained from sample pointslocated close to three discrete vertical elevations (94.0, 94.75,and 95.5 m), a longitudinal section, and several transversefences, with the latter two types being over the entire plumesection. These selections were based upon previous ES testdata (30) and enabled confident sampling of the plumeupper, middle, and lower elevations and plume core.Comprehensive 3-dimensional sampling of the 106 d and399 d plumes was undertaken, with between 315 and 440samples collected for each snapshot. Weekly sampling ofseveral selected ML samplers provided temporal data.ML164 and ML165 (Figure 1; composed of stainless steelsample tubing to prevent memory effects) were sampled forthe longest period and data are presented herein. Othergroundwater sampling during P&T included reconnaissancesampling; monitoring the 1-m fence to assess ongoing sourcedissolution (31); and, measurement of fluxes at the PRB (39).With the exception of the latter two items, groundwatersampling was not undertaken in the 0-25 m zone betweenthe source and PW2.
Field data interpretation was supported by laboratory-based PCE and TCE sorption studies. Isotherms wereobtained via batch studies on core subsamples collected nearPW2 to assess sorption to the various strata. Two samplesrepresenting textural extremes in the section were collectedin their entirety from a core that contained an approximately8-cm thick coarse-grained massive strata (at elevation ∼95.5m), immediately overlain by an approximately 2-cm thickfine-grained strata. Grains coarser than 2 mm diametercomprised 42.2% of the coarse-grained strata sample. Sorp-tion methods (32) are summarized in SI Box 1.
Numerical Modeling. Three-dimensional numerical simu-lation of the P&T experiment assumed ideal transport basedon advection, macrodispersion, and linear equilibrium sorp-tion processes in a homogeneous aquifer. HydroGeoSphere,an adaptation of the code FRAC3DVS (40), was used forthe numerical flow and transport modeling. A 1.44M (163 ×132 × 67) node parallelepipedic domain (X 30 to 40 m; Y 70to 20 m; Z 90 to 98 m) was used with grid spacing at dX )0.2 m, dY ) 0.5 m, dZ ) 0.1 m within the initial plume zone,relaxed to a maximum of dX ) 2 m, dY ) 2 m, dZ ) 0.2 moutside that zone. The homogeneous domain was based uponmean ES site values (given earlier), but assuming slightanisotropy (Kh:Kz ) 1.8) based on various Borden studies(32). Constant (with time) head boundary conditions werechosen to impose the mean ES test site gradient (given earlier)angled across the domain in accordance with the mean site
flow direction during the 132-day period prior to start ofpumping (30). Well extraction rates were varied accordingto the SI Table 1 summary. Dispersivity (R) and R valuesused in the P&T simulations were site-determined from theprevious ES tracer test and based upon sensitivity analysisand best fits to the ES test 322 and 418 d () -57 d P&T date)plumes (32). Transport values selected for the P&T simula-tions were: Rl ) 0.6 m, Rth ) 0.007 m, Rtv ) 0.001 m, RTCM )1.0, RTCE ) 1.15, and RPCE ) 1.6 with sensitivity analysis under-taken on Rl and RPCE in the P&T phase of the simulations.
The ES test 322-d plume field data (-152 d P&T) (30) wereinterpolated on to the numerical model grid (via krigingroutine with Tecplot v.10) and plume growth was simulatedfrom that date under natural gradient conditions to formplumes to which P&T was then applied. Plumes werecompared to the quasi-3D -57 d field plume data (418 d ofplume growth) to ensure comparability of simulated andobserved plumes prior to the onset of P&T simulation. Good,although not exact, agreement was achieved for the abovetransport parameters (and expected from the previoussensitivity analysis (32)), particularly for the critical longi-tudinal distances reached by depicted plume contours over3 orders of magnitude (compare later Figures 4 and 5).Simulated plumes were slightly wider, in spite of the verylow dispersivities used, but this was not judged to have muchinfluence on the results obtained from the model simulations.Continuing DNAPL source zone input to the model domainwas represented via spatial-temporal interpolation of thefield 1-m fence concentration data from 322-1029 d (ES testtimes) (31) to the appropriate model nodes.
The approach taken of forward predictive modeling of apre-remediation plume distribution to which ideal transportparameters have been fit and assumed to subsequently apply,is potentially the best that could be applied to most realsites, albeit with much less certainty of the allotted transportparameters, plume location, and source nature and timing.Poor agreement of simulation results with observed concen-tration tailing may be indicative of the significant influenceat the plume scale of nonideal processes not specifically rep-resented by the model. Although ideal transport parametersreasonably fit the developing ES test plumes, this does notnegate nonideal sorption process occurrence then. Indeed,such processes were thought to operate and in part mutuallycancel (32). Similar arguments may apply to the P&T analysisherein. Nevertheless, significant influence of nonideal pro-cesses, e.g., slow desorption or back diffusion, should man-ifest as poor simulated versus observed agreement.
Results and DiscussionPlume-Scale Data. Field plume snapshots based upon aquiferML sampler point data are shown in Figure 4 for the leading25-60 m zone isolated from DNAPL source input bycontinuous PW2 extraction at its upgradient boundary.Successful capture and extraction of plumes was observed.By 399 d, concentrations reduced from initial maxima (89mg/L TCM, 102 mg/L TCE and 8 mg/L PCE) by ∼4 ordersof magnitude with TCM reduced to near detection limit(∼0.003 mg/L) throughout the 25-60 m zone. RemainingTCE and PCE were more extensive, but with point concen-trations low; e.g., most TCE approached 0.01 mg/L and lesswith a localized maximum of 0.07 mg/L. Drinking-waterstandards, internationally variable but typically in the 0.01mg/L range, could hence be achieved or approached (evenwhen examination of the data is made at the aquifer pointsample scale). Thus remediation of the high-concentrationdissolved plumes was feasible in conjunction with a containedsource.
Contamination was most persistent between wells wherehydraulic gradients flattened (Figure 3) and low-flow, inter-well “stagnation zones” developed. Solute hydrophobicity
VOL. 40, NO. 21, 2006 / ENVIRONMENTAL SCIENCE & TECHNOLOGY 9 6773
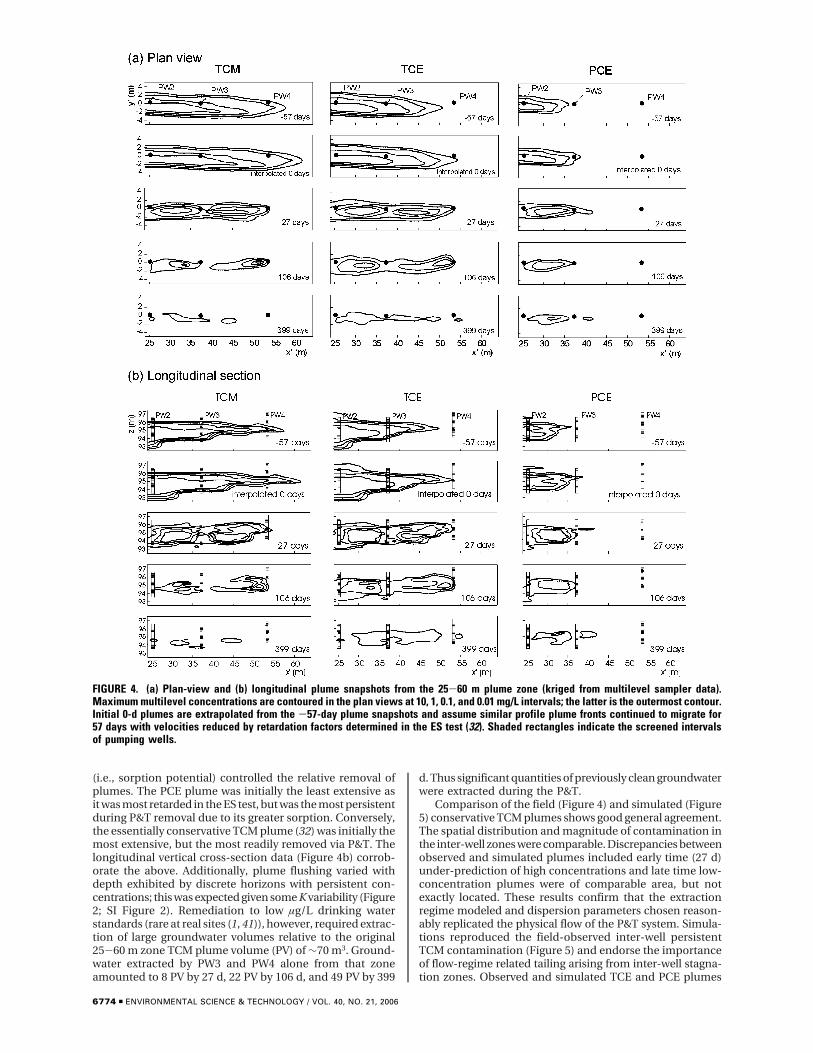
(i.e., sorption potential) controlled the relative removal ofplumes. The PCE plume was initially the least extensive asit was most retarded in the ES test, but was the most persistentduring P&T removal due to its greater sorption. Conversely,the essentially conservative TCM plume (32) was initially themost extensive, but the most readily removed via P&T. Thelongitudinal vertical cross-section data (Figure 4b) corrob-orate the above. Additionally, plume flushing varied withdepth exhibited by discrete horizons with persistent con-centrations; this was expected given some K variability (Figure2; SI Figure 2). Remediation to low µg/L drinking waterstandards (rare at real sites (1, 41)), however, required extrac-tion of large groundwater volumes relative to the original25-60 m zone TCM plume volume (PV) of ∼70 m3. Ground-water extracted by PW3 and PW4 alone from that zoneamounted to 8 PV by 27 d, 22 PV by 106 d, and 49 PV by 399
d. Thus significant quantities of previously clean groundwaterwere extracted during the P&T.
Comparison of the field (Figure 4) and simulated (Figure5) conservative TCM plumes shows good general agreement.The spatial distribution and magnitude of contamination inthe inter-well zones were comparable. Discrepancies betweenobserved and simulated plumes included early time (27 d)under-prediction of high concentrations and late time low-concentration plumes were of comparable area, but notexactly located. These results confirm that the extractionregime modeled and dispersion parameters chosen reason-ably replicated the physical flow of the P&T system. Simula-tions reproduced the field-observed inter-well persistentTCM contamination (Figure 5) and endorse the importanceof flow-regime related tailing arising from inter-well stagna-tion zones. Observed and simulated TCE and PCE plumes
FIGURE 4. (a) Plan-view and (b) longitudinal plume snapshots from the 25-60 m plume zone (kriged from multilevel sampler data).Maximum multilevel concentrations are contoured in the plan views at 10, 1, 0.1, and 0.01 mg/L intervals; the latter is the outermost contour.Initial 0-d plumes are extrapolated from the -57-day plume snapshots and assume similar profile plume fronts continued to migrate for57 days with velocities reduced by retardation factors determined in the ES test (32). Shaded rectangles indicate the screened intervalsof pumping wells.
6774 9 ENVIRONMENTAL SCIENCE & TECHNOLOGY / VOL. 40, NO. 21, 2006

(compare Figure 4a with Figure 5b, and SI Figure 4) werealso comparable. Discrepancies for PCE at early time generally
related to a slight underprediction of the high-concentrationplume core extent toward PW3. At late time (∼400 d),
FIGURE 5. Simulated (base case) plan view (maximum concentrations at a given x,y location) dissolved-phase plumes for (a) TCM and(b) PCE (Source is located at (0, 0)). The boxed area delimits the 25-60 m zone depicted in Figure 4.
VOL. 40, NO. 21, 2006 / ENVIRONMENTAL SCIENCE & TECHNOLOGY 9 6775

observed PCE distributions remaining were slightly under-estimated by the model and potentially indicative of non-ideal tailing (discussed later).
Extraction Well Data. Initial concentration increases weresometimes observed as high-concentration plume corestraveled to the extraction wells (Figure 6 (SI Figure 5). PW3and PW4 demonstrated exponential tailing over 2-4 ordersof magnitude to attain 0.001-0.01 mg/L concentrations(typical drinking-water standards). Simulations for PW3 andPW4 (Figure 6b and c) generally reproduced the overallpatterns of peaks and declines and times to reach low
concentrations. Peak concentrations were, however, under-predicted in magnitude and, for PW4, delayed in time. Thisis ascribed to the initial slight underpredictions of high-concentration plume core extents toward PW4 (TCM andTCE) and PW3 (PCE).
The source-containment well PW2 (Figure 6a, SI Figure5) initially declined from high concentrations to form a 100-250 d near-steady concentration “plateau” (TCE ∼0.7 mg/Land PCE ∼0.25 mg/L). This was consistent with PW2’sinteraction with the DNAPL source and continuous captureof dissolved plumes expected to generate over decades (31,
FIGURE 6. Observed and simulated (base case) extraction well concentrations for (a) PW2, (b) PW3, and (c) PW4.
6776 9 ENVIRONMENTAL SCIENCE & TECHNOLOGY / VOL. 40, NO. 21, 2006

33). Brief rebounds in concentration (∼220 d) were attributedto temporary suspensions of extraction (∼1 week). TCM,however, exponentially declined to below detection limits(∼0.003 mg/L) by 400 d due to its complete dissolution fromthe DNAPL confirmed by concurrent source monitoring (31).Comparison of PW2 mass removal rates with source dis-solution data confirms the approximate steady-state source-well interaction (SI Figure 6). During the 100-250 d plateauperiod the TCE mass extraction rate (2.5-4.5 g/d) approx-imately equalled its source dissolution rate (2-4 g/d)(allowing for travel time). Such extraction well interactionswith DNAPL sources are often surmised at real sites, but arerarely proven due to uncertainties regarding DNAPL presence.From 250-550 d, gradual TCE and PCE declines wereconsistent with their significant (but not complete) removalby the PRB (39).
PW2 simulations (Figure 6a) replicated the initial declines,plateau periods, and late tailing declines. TCM agreementspanned 4 orders of magnitude (differences in tailingconcentrations after 300 d are <0.004 mg/L, i.e., insignificant)as it was flushed from the aquifer and DNAPL source,suggesting that marked nonideal physical heterogeneityinfluences were largely absent. Nonideal sorption influenceswere potentially expected for PCE after ∼250 d when thelong-term resident, high-concentration plume core wasflushed from the aquifer downgradient of the PRB. ObservedPCE concentrations showed, surprisingly, less tailing thanthat simulated over 300-400 d before reverting to marginallygreater tailing at later times, as would be anticipated if non-ideal slow desorption was significant. These trends can bepotentially explained by our lab sorption data (later Figure8b). Initial faster PCE decline may be due to nonlinear andcompetitive sorption effects causing lower sorption of higherconcentrations of PCE in the competitive presence of elevatedTCE concentrations. At late time, PCE sorption may increasedue to its lower concentration and lower competition withTCE. Unambiguous interpretation, however, was not possibleas late-time conditions were less well-known. Uniform PRBremoval efficiencies were assumed of TCM 100%, TCE 90%,and PCE 85% based upon modest amounts of PRB MLsampler data (39) that suggest efficiency uncertainties were<(5% (but without supporting data). Late-time temporalsource zone dissolution was also less reliably simulated asobserved data were more limited (31) (SI Figure 6), as wasthe temporally variable capture of contamination breakingthrough the PRB by the extraction well PW-A locatedimmediately downgradient of the PRB (SI Figure 7, andcaption for discussion). Hence, late time differences insimulated and observed PW2 data cannot be confidentlyassigned to nonideal influences alone; the main hindrancebeing the <100% treatment efficiency of the PRB causingpartial source containment.
Concentration variation caused by extraction rate changeswas observed and simulated (Figure 6). Reduced PW4extraction rates at 230 d yielded slower observed andsimulated concentration declines. Observed ∼220 d PW2 andPW4 concentration rebounds after unplanned operationalshutdowns and reduced extraction just prior were simulated.Such rebounds are typically ascribed to rate-limited masstransfer from low-flow zones (e.g., intragranular porosity,low permeability strata) and rate-limited desorption (2, 42,43). None of these processes were explicitly simulated (TCMsimulations assume no sorption) and hence simulationrebounds, and a significant component of field rebounds,were attributed to flow-related plume redistribution pro-cesses. For example, upgradient contamination in the vicinityof a well may migrate to and surround the well screen duringthe non-extraction period, leading to greater concentrationwhen extraction starts again.
Observed and simulated mass removal rates for PW2(which extracted the majority of mass) demonstrated goodagreement (SI Figure 8). TCE was closely matched, decliningfrom near 30 g/d to <1 g/d at late time with the only notablediscrepancy at ∼140-215 d when extraction rates wereincreased at PW2. Mass removal rate rebound variations inthe intermittent pumping period at ∼215-230 d weresimulated. Manipulation of extraction rates (PW2 and PW3were both increased at 141 d) to enhance mass extractionproved of little advantage with only very marginal, short-lived rate increases observed. Cumulative mass removalsshowed less agreement (SI Figure 9), particularly for PW3and PW4 for which the overall masses extracted were sensitiveto the masses initially between wells at commencement ofP&T. Slight discrepancies in the estimated initial extent ofthe high-concentration plume cores were judged responsiblefor underestimation of PW3 and PW4 and over estimationof PW2 extracted masses.
Overall, the above plume and extraction well data analysissupports that much of the contaminant behavior is “ideal”in the sense that it can be reasonably predicted by an idealtransport model with appropriate specification of the sourceterm and pumping regime. Further, it suggests at other sites,at least those with mild aquifer heterogeneity, that significantaspects of the P&T behavior can be simulated if the sourceterm and initial plume are properly characterized.
Aquifer Point Monitoring Data. ML164 and ML165breakthrough curves generally rose to a peak as the plumecore was drawn through these monitoring points (Figure 7,SI Figures 10-12). Substantial declines occurred over 50-100 d, followed by lengthy tailing over 4 orders of magnitudeto low µg/L concentrations, i.e., at, or approaching typicaldrinking water standards. Tails could be relatively log-linear(SI Figure 10), or variable (Figure 7) with the latter partlyascribed to increased PW3 extraction at 141-210 d. Thiscaused inadvertent (unwanted) up-coning of the sulfate-rich leachate plume located in the lower ∼2 m of the aquifer(confirmed by the second sulfate peak, Figure 7). Concurrentconcentration declines were induced in some points asplumes were vertically displaced. Such flow-related influenceswere in part simulated; e.g., Figure 7 and SI Figures 11 and13 showed concentration-trend variations at the beginningand end of the 141-210 d period, albeit much less marked.Other ML samplers were monitored and showed similarfeatures; e.g., ML95 is shown in SI Figure 14 that was morerapidly flushed due to its proximity to the plume boundary.
Sorption-related controls on plume removal were evidentin the aquifer point data (e.g., SI Figures 10 and 12). TCMprofiles compare to the conservative sulfate plume (untilsulfate nears background). PCE exhibited slowest declineswith final absolute concentrations greatest despite initialconcentrations an order of magnitude lower than othersolutes. Contaminant removal exhibited variation with depth(Figure 7) that was expected to arise from a complex interplayof initial concentration distributions, aquifer K, and sorptionnonideality. Persistent contamination in the 95-96 melevation zone was co-incident with greatest aquifer hetero-geneity, e.g., for ML164#6 which was initially the leastcontaminated, but located adjacent to the least permeablehorizon (SI Figure 12).
Exact matching of the temporal aquifer point profiles wasnot anticipated due to model assumptions (e.g., homoge-neous domain, macrodispersion approach, uniform flow-field). Rather, the range of simulated profiles was anticipatedto envelope the range of observed behavior unless nonidealprocesses were significant. In general, the range was reason-ably enveloped or overpredicted by the simulations sug-gesting nonideal contributions to tailing were not thatsignificant, or else mutually cancelling (Figure 7 and SI Figure13). Simulations tended to exhibit lower maxima, were more
VOL. 40, NO. 21, 2006 / ENVIRONMENTAL SCIENCE & TECHNOLOGY 9 6777
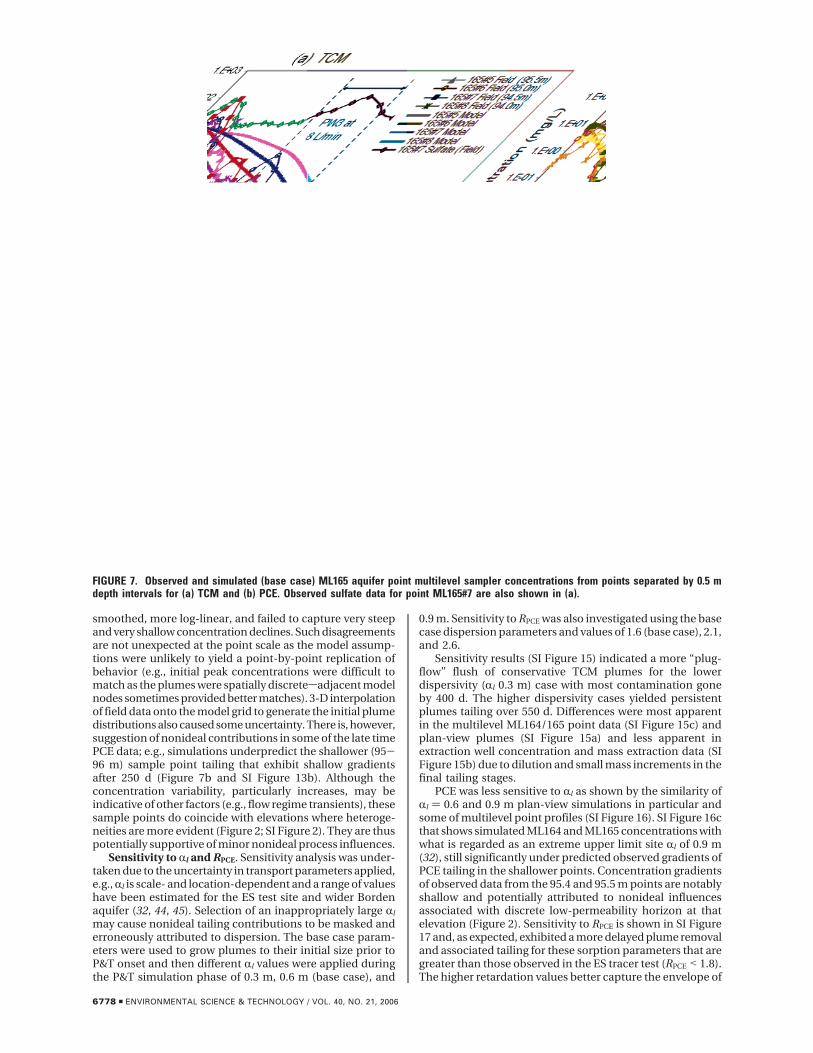
smoothed, more log-linear, and failed to capture very steepand very shallow concentration declines. Such disagreementsare not unexpected at the point scale as the model assump-tions were unlikely to yield a point-by-point replication ofbehavior (e.g., initial peak concentrations were difficult tomatch as the plumes were spatially discretesadjacent modelnodes sometimes provided better matches). 3-D interpolationof field data onto the model grid to generate the initial plumedistributions also caused some uncertainty. There is, however,suggestion of nonideal contributions in some of the late timePCE data; e.g., simulations underpredict the shallower (95-96 m) sample point tailing that exhibit shallow gradientsafter 250 d (Figure 7b and SI Figure 13b). Although theconcentration variability, particularly increases, may beindicative of other factors (e.g., flow regime transients), thesesample points do coincide with elevations where heteroge-neities are more evident (Figure 2; SI Figure 2). They are thuspotentially supportive of minor nonideal process influences.
Sensitivity to Rl and RPCE. Sensitivity analysis was under-taken due to the uncertainty in transport parameters applied,e.g., Rl is scale- and location-dependent and a range of valueshave been estimated for the ES test site and wider Bordenaquifer (32, 44, 45). Selection of an inappropriately large Rl
may cause nonideal tailing contributions to be masked anderroneously attributed to dispersion. The base case param-eters were used to grow plumes to their initial size prior toP&T onset and then different Rl values were applied duringthe P&T simulation phase of 0.3 m, 0.6 m (base case), and
0.9 m. Sensitivity to RPCE was also investigated using the basecase dispersion parameters and values of 1.6 (base case), 2.1,and 2.6.
Sensitivity results (SI Figure 15) indicated a more “plug-flow” flush of conservative TCM plumes for the lowerdispersivity (Rl 0.3 m) case with most contamination goneby 400 d. The higher dispersivity cases yielded persistentplumes tailing over 550 d. Differences were most apparentin the multilevel ML164/165 point data (SI Figure 15c) andplan-view plumes (SI Figure 15a) and less apparent inextraction well concentration and mass extraction data (SIFigure 15b) due to dilution and small mass increments in thefinal tailing stages.
PCE was less sensitive to Rl as shown by the similarity ofRl ) 0.6 and 0.9 m plan-view simulations in particular andsome of multilevel point profiles (SI Figure 16). SI Figure 16cthat shows simulated ML164 and ML165 concentrations withwhat is regarded as an extreme upper limit site Rl of 0.9 m(32), still significantly under predicted observed gradients ofPCE tailing in the shallower points. Concentration gradientsof observed data from the 95.4 and 95.5 m points are notablyshallow and potentially attributed to nonideal influencesassociated with discrete low-permeability horizon at thatelevation (Figure 2). Sensitivity to RPCE is shown in SI Figure17 and, as expected, exhibited a more delayed plume removaland associated tailing for these sorption parameters that aregreater than those observed in the ES tracer test (RPCE < 1.8).The higher retardation values better capture the envelope of
FIGURE 7. Observed and simulated (base case) ML165 aquifer point multilevel sampler concentrations from points separated by 0.5 mdepth intervals for (a) TCM and (b) PCE. Observed sulfate data for point ML165#7 are also shown in (a).
6778 9 ENVIRONMENTAL SCIENCE & TECHNOLOGY / VOL. 40, NO. 21, 2006

tailing behavior in ML164/165 (SI Figure 17b) suggestingenhanced sorption is influencing these point data. However,they overpredict the observed 400 d plume concentrations(SI Figure 17a) suggesting their more global application atthe plume scale is not warranted. The above indicates thatalthough the Rl and R sensitivity analysis lends some supportfor nonideal sorption influences, their influence on the P&Tplume remediation in this mildly heterogeneous aquifer isnot that easily discerned; they appear to have played arelatively minor role at the plume scale studied.
Mass Balance and Persistent Aquifer Mass. Contaminantmass balance estimates were made for the whole site (SITable 2) and for the 25-60 m zone (not shown). Mass balancesachieved were very good (<(4%, SI Table 2) compared tovery poor balances typically obtained at real sites (1, 3).Neither, however, provided a sensitive means of estimatingpersistent contaminant mass remaining in the aquifer orimproving understanding of plume remediation processes;thus discussion of these aspects and the influence of agedplumes (recognizing the study plume was young) are restric-ted to the Supporting Information (SI Box 2).
Quantification of Nonideal Sorption Parameters. Labsorption studies were undertaken to better quantify whetherheterogeneity extremes, the wide concentration range, andmulti-solute plume condition could have been expected toyield significant nonideal tailing influences at the site.Example isotherms are shown in SI Figure 18 and sorptionparameters are shown in SI Table 3. PCE sorption parametersfor the strata differ significantly from those measured for thebulk aquifer sediment, demonstrating vertical variability suchas that documented previously by others (36, 46, 47). Themaximum PCE Freundlich partition coefficients (Kf) for thecoarse- and fine-grained strata were approximately ten andtwo times greater than the depth-integrated sample Kf,respectively. These findings are consistent with prior reportsof elevated sorption coefficients associated with low- andhigh-permeability extremes (36, 47). Such relationships havenot been invoked in modeling studies that generally assumea simple inverse correlation of K and sorption coefficient(21, 48, 49). Freundlich fits of the PCE sorption isothermbulk sample data (32) and the fine- and coarse-grained strata(SI Table 3) all indicated similar nonlinearity with an indexof ∼0.9.
Figure 8a predicts PCE retardation (RPCE) as a function ofconcentration for the strata samples tested based upon theobserved sorption isotherms (SI Table 1) and eq 1 (sorptionis assumed nonlinear, reversible and at local equilibrium(50)):
The figure illustrates that “local” concentration andequilibrium sorption variability may cause RPCE to potentiallyvary from ∼1.5 to ∼20 for the various strata and concentra-tions observed within the P&T remediation. Due to the greaterKf values associated with the fine and coarse strata extremes,significantly increased retardation may be associated withsuch strata, particularly at late times when concentrationsbecome low. At early times in the P&T remediation, the highconcentrations in the plume would have depressed adsorp-tion. Such lab-based predictions lend support to the tentativeconclusions of potential nonideal influences at shallowerhorizons associated with greater heterogeneity.
The combined effects of nonlinear sorption and com-petitive TCE sorption on RPCE (Figure 8b) are projected forthe wide range of TCE/PCE concentration ratios detected inthe 25-60 m zone ML164 and ML165 samplers (SI Figure 19)using ideal adsorbed solution theory (IAST) (32) and depth-integrated sample isotherm parameters (SI Table 3). Com-
petition effects were mainly significant at early time whenhigh TCE concentrations favor minimum local RPCE (Figure8b, open squares and triangles). By 50 d of P&T, most watersfor a given CPCE plot close to the PCE-alone trend suggestingin this case low competition nonideal influences and thatgreatest sorption at low PCE concentrations is more relatedto the nonlinearity of the PCE isotherm. Thus, the sample-scale lab study predicts nonideal sorption effects would leadto enhanced sorption (tailing): (i) toward the end of the P&Tremediation when concentrations were dilute; (ii) when singlesolutes rather than multi-solute mixtures are present (towardthe end of P&T when PCE predominates); and, (iii) whenstrata of permeability extremes exist. Such predictions arenot inconsistent with the evidence of nonideal influencessuggested in the field plume-modeling analysis.
Ri ) 1 + (Fb
η )( 1ni
)KfiCi
[(1/ni)-1] (1)
FIGURE 8. (a) Predicted local RPCE for samples from different strataas a function of aqueous concentration for sorption observations(symbols) or using isotherm parameters (lines) from SI Table 1 andeq 1. Data for >2 mm coarse strata material is off-scale at RPCE ∼35for concentrations ∼0.02 mg/L. (b) Predicted local RPCE as they varywith PCE concentration (CPCE) for ML164 and ML165 data classifiedaccording to various sampling time intervals. The figure predictsthe effect of TCE competitive sorption and nonlinear PCE sorptionon RPCE using the isotherm parameters from the depth-integratedsample (SI Table 3) and the method described in Rivett and Allen-King (32).
VOL. 40, NO. 21, 2006 / ENVIRONMENTAL SCIENCE & TECHNOLOGY 9 6779
Good overall agreement achieved between the idealtransport model simulations and observed P&T data suggeststhat the influence of nonideal processes was minor at theplume scale studied. This is reasonably ascribed to the mildheterogeneity present and the infrequent occurrence of lowpermeability horizons of very limited thickness (1-3 cm)(Figure 2, SI Figure 2). The lab sorption predictions (Figure8) nevertheless confirm that an increase in heterogeneity atthis site (and others) would be expected to significantlyenhance nonideal tailing contributions with greater sorptionmagnitude, range, and temporal variability. Such tailingwould be significantly amplified by diffusion-based exchangewith the lower permeability layers present. The applicabilityof ideal transport models is accordingly reduced and moreexplicit representation of controlling nonideal processesrequired via nonideal, multi-process numerical modeling (21,48, 49). Our field and lab datasets, supplemented with param-eters from other Borden studies (42, 43), may be used as abasis for such modeling and to evaluate sensitivity of plumeremoval to nonideal sorption processes and increasing levelsof heterogeneity.
AcknowledgmentsFinancial support was provided by the Waterloo Solvents-in-Groundwater Research Program funded by Boeing, CibaGeigy, Eastman Kodak, General Electric, Laidlaw Environ-mental Services, the Natural Sciences and EngineeringResearch Council of Canada, and the Ontario ResearchIncentive Fund at the time of the field study.
Supporting Information AvailablePlates of ES site (SI Figure 1), plate of aquifer cores (SI Figure2), extraction well rates and volumes (SI Figure 3), simulatedTCE plume (SI Figure 4), extraction-well concentrations (SIFigure 5), source dissolution and PW2 mass extraction rates(SI Figure 6), extraction well PW-A data (SI Figure 7),extraction well mass rate removals (SI Figure 8), extractionwell cumulative mass removals (SI Figure 9), multilevelsampler ML164/165 field data (SI Figures 10-12), multilevelsampler ML164/165 simulated and field data (SI Figures 13),multilevel sampler ML95 data (SI Figure 14); simulationsshowing Rl sensitivity (SI Figures 15 and 16); simulationsshowing RPCE sensitivity (SI Figure 17); PCE sorption isotherms(SI Figure 18); TCE/PCE concentration ratios for ML164 andML165 as a function of PCE concentration (SI Figure 19);extraction well operating conditions (SI Table 1); massbalance estimates (SI Table 2); lab-determined sorptionparameters (SI Table 3); laboratory batch sorption meth-odology (SI Box 1); mass balance discussion (SI Box 2). Thisinformation is available free of charge via the Internet athttp://pubs.acs.org.
Literature Cited(1) NRC. Alternatives for Groundwater Cleanup; National Academy
Press: Washington DC, 1994.(2) Mackay, D. M.; Cherry, J. A. Groundwater contamination: Pump-
and-treat remediation. Environ. Sci. Technol. 1989, 23, 630-636.
(3) U.S. EPA. Evaluation of groundwater extraction remedies: PhaseII, 1. Summary report; U.S. Environmental Protection Agency,Office of Emergency and Remedial Response: Washington, DC,1992.
(4) Stroo, H. F.; Unger, M.; Ward, C. G.; Kavanaugh, M. C.; Vogel,C. Remediating chlorinated solvent source zones. Environ. Sci.Technol. 2003, 37, 224A-230A.
(5) U.S. EPA. The DNAPL remediation challenge: Is there a case forsource depletion? Report EPA/600/R-03/143; U.S. EnvironmentalProtection Agency: Washington, DC, 2003.
(6) Hoffman, F. Groundwater remediation using smart pump andtreat. Ground Water 1993, 31, 98-106.
(7) U.S. EPA. Pump-and-treat ground-water remediation: A guidefor decision makers and practitioners; U.S. Environmental
Protection Agency, Office of Research and Development:Washington, DC, 1996.
(8) Ko, N. Y.; Lee, K. K.; Hyun, Y. Optimal groundwater remediationdesign of a pump and treat system considering clean-up time.Geosci. J. 2005, 9, 23-31.
(9) Christ, J. A.; Goltz, M. N. Containment of groundwater con-tamination plumes: minimizing drawdown by aligning capturewells parallel to regional flow. J. Hydrol. 2004, 286, 52-68.
(10) Zheng, C. M.; Wang, P. P. A field demonstration of the simulationoptimization approach for remediation system design. GroundWater 2002, 40, 258-265.
(11) Boice, R. Extraction rate problems lead to increased costs atpump-and-treat facilities: A call to improve reporting of rates.Ground Water Monit. Rem. 2002, 22, 76-81.
(12) Russell, K. T.; Rabideau, A. J. Decision analysis for pump-and-treat design. Ground Water Monit. Rem. 2000, 20, 159-168.
(13) U.S. EPA. Groundwater cleanup: Overview of operating experi-ence at 28 sites; Report EPA542-R-99-006; U.S. EnvironmentalProtection Agency: Washington, DC, 1999.
(14) Feenstra, S.; Cherry, J. A. In Dense Chlorinated Solvents andother DNAPLs in Groundwater; Waterloo Press: Portland OR,1996; pp 395-473.
(15) LaBolle, E. M.; Fogg, G. E. Role of molecular diffusion incontaminant migration and recovery in an alluvial aquifersystem. Transp. Porous Media 2001, 42, 155-179.
(16) Aksoy, A.; Culver, T. B. Effect of sorption assumptions on aquiferremediation designs. Ground Water 2000, 38, 200-208.
(17) Oostrom, M.; Hofstee, C.; Walker, R. C.; Dane, J. H. Movementand remediation of trichloroethylene in a saturated, heteroge-neous porous medium 2. Pump-and-treat and surfactantflushing. J. Contam. Hydrol. 1999, 37, 179-197.
(18) Huang, C.; Mayer, A. S. Pump-and-treat optimization using welllocations and pumping rates as decision variables. Water Resour.Res. 1997, 33, 1001-1012.
(19) Aly, A. H.; Peralta, R. C. Optimal design of aquifer cleanupsystems under uncertainty using neural network and a geneticalgorithm. Water Resour. Res. 1999, 35, 2523-2532.
(20) Berglund, S.; Cvetkovic, V. Pump-and-treat remediation ofheterogeneous aquifers: Effects of rate-mited mass transer.Ground Water 1995, 33, 675-685.
(21) Rabideau, A. J.; Miller, C. T. 2-Dimensional modeling of aquiferremediation influenced by sorption nonequilibrium and hy-draulic conductivity heterogeneity. Water Resour. Res. 1994,30, 1457-1470.
(22) Ball, W. P.; Liu, C. X.; Xia, G. S.; Young, D. F. A diffusion-basedinterpretation of tetrachloroethene and trichloroethene con-centration profiles in a groundwater aquitard. Water Resour.Res. 1997, 33, 2741-2757.
(23) Mackay, D. M.; Wilson, R. D.; Brown, M. J.; Ball, W. P.; Xia, G.;Durfee, D. P. A controlled field evaluation of continuous vs.pulsed pump- and-treat remediation of a VOC-contaminatedaquifer: site characterization, experimental setup, and overviewof results J. Contam. Hydrol. 2000, 41, 81-131.
(24) Liu, C. X.; Ball, W. P. Back diffusion of chlorinated solventcontaminants from a natural aquitard to a remediated aquiferunder well-controlled field conditions: Predictions and meas-urements. Ground Water 2002, 40, 175-184.
(25) Chapman, S. W.; Parker, B. L. Plume persistence due to aquitardback diffusion following dense nonaqueous phase liquid sourceremoval or isolation. Water Resour. Res. 2005, 41, W12411.
(26) Bahr, J. M. Analysis of nonequilibrium desorption of volatileorganics during field test of aquifer decontamination. J. Contam.Hydrol. 1989, 4, 205-222.
(27) Thorbjarnarson, K. W.; Mackay, D. M. A field test of tracertransport and organic contaminant elution in a stratified aquiferat the Rocky Mountain Arsenal (Denver, Colorado, USA). J.Contam. Hydrol. 1997, 24, 287-312.
(28) Blue, J. E.; Brusseau, M. L.; Srivastava, R. Simulating tracer andresident contaminant transport to investigate the reducedefficiency of a pump-and-treat operation. In GroundwaterQuality ’98; IAHS Publ. No. 250; International Association ofHydrological Sciences: Wallingford, Oxfordshire, U.K., 1998;pp 537-543.
(29) Zhang, Z. H.; Brusseau, M. L. Non-ideal transport of reactivesolutes in heterogeneous porous media 5. Simulating regional-scale behavior of a trichloroethene plume during pump-and-treat remediation. Water Resour. Res. 1999, 35, 2921-2935.
(30) Rivett, M. O.; Feenstra, S.; Cherry, J. A. A controlled fieldexperiment on groundwater contamination by a multicompo-nent DNAPL: Creation of the emplaced-source and overviewof dissolved plume development. J. Contam. Hydrol. 2001, 49,111-149.
6780 9 ENVIRONMENTAL SCIENCE & TECHNOLOGY / VOL. 40, NO. 21, 2006
(31) Rivett, M. O.; Feenstra, S. Dissolution of an emplaced sourceof DNAPL in a natural aquifer setting. Environ. Sci. Technol.2005, 39, 447-455.
(32) Rivett, M. O.; Allen-King, R. M. A controlled field experimenton groundwater contamination by a multicomponent DNAPL:Dissolved plume retardation. J. Contam. Hydrol. 2003, 66, 117-146.
(33) Frind, E. O.; Molson, J. W.; Schirmer, M.; Guiguer, N. Dissolutionand mass transfer of multiple organics under field conditions:The Borden emplaced source. Water Resour. Res. 1999, 35, 683-694.
(34) Rivett, M. O. Soil-gas signatures from volatile chlorinatedsolvents - Borden field experiments. Ground Water 1995, 33,84-98.
(35) Farrell, D. A.; Woodbury, A. D.; Sudicky, E. A.; Rivett, M. O.Stochastic and deterministic analysis of dispersion in unsteadyflow at the Borden tracer test site, Ontario, Canada J. Contam.Hydrol. 1994, 15, 159-185.
(36) Allen-King, R. M.; Halket, R. M.; Gaylord, D. R.; Robin, M. J. L.Characterizing the heterogeneity and correlation of perchloro-ethene sorption and hydraulic conductivity using a facies-basedapproach. Water Resour. Res. 1998, 34, 385-396.
(37) Broholm, K.; Feenstra, S. Laboratory measurements of theaqueous solubility of mixtures of chlorinated solvents. Environ.Toxicol. Chem. 1995, 14, 9-15.
(38) U.S. EPA. Soil Screening Guidance; U.S. Environmental Protec-tion Agency, Office of Emergency and Remedial Response:Washington, DC, 1996.
(39) O’Hannesin, S. F.; Gillham, R. W. Long-term performance of anin situ “iron wall” for remediation of VOCs. Ground Water 1998,36, 164-170.
(40) Therrien, R.; Sudicky, E. A. Three-dimensional analysis ofvariably-saturated flow and solute transport in discretely-fractured porous media. J. Contam. Hydrol. 1996, 23, 1-44.
(41) Bartow, G.; Davenport, C. Pump-and-Treat Accomplishments- a Review of the Effectiveness of Ground-Water Remediationin Santa-Clara Valley, California. Ground Water Monit. Rem.1995, 15, 140-146.
(42) Ball, W. P.; Roberts, P. V. Long-term sorption of halogenatedorganic-chemicals by aquifer material. 1. Equilibrium. Environ.Sci. Technol. 1991, 25, 1223-1236.
(43) Ball, W. P.; Roberts, P. V. Long-term sorption of halogenatedorganic-chemicals by aquifer material. 2. Intraparticle diffusion.Environ. Sci. Technol. 1991, 25, 1237-1249.
(44) Freyberg, D. L. A natural gradient experiment on solute transportin a sand aquifer, 2. Spatial moments and the advection anddispersion of nonreactive tracers. Water Resour. Res. 1986, 22,2031-2046.
(45) Rajaram, H.; Gelhar, L. W. 3-Dimensional spatial momentsanalysis of the Borden tracer test. Water Resour. Res. 1991, 27,1239-1251.
(46) Mackay, D. M.; Ball, W. P.; Durant, M. G. Variability of aquifersorption properties in a field experiment on groundwatertransport of organic solutes: Methods and preliminary results.J. Contam. Hydrol. 1986, 1, 119-132.
(47) Allen-King, R. M.; Divine, D. P.; Robin, M. J. L.; Alldredge, J. R.;Gaylord, D. R. Spatial distributions of perchloroethylene reactivetransport parameters in the Borden Aquifer. Water Resour. Res.2006, 42, W01413.
(48) Burr, D. T.; Sudicky, E. A.; Naff, R. L. Nonreactive and reactivesolute transport in 3-dimensional heterogeneous porous-media- Mean displacement, plume spreading, and uncertainty. WaterResour. Res. 1994, 30, 791-815.
(49) Brusseau, M. L.; Srivastava, R. Non-ideal transport of reactivesolutes in heterogeneous porous media - 2. Quantitativeanalysis of the Borden natural-gradient field experiment. J.Contam. Hydrol. 1997, 28, 115-155.
(50) Fetter, C. W. Contaminant Hydrology, 2nd ed.; Prentice Hall:Upper Saddle River, NJ, 1999.
Received for review February 8, 2006. Revised manuscriptreceived August 2, 2006. Accepted August 3, 2006.
ES0602748
VOL. 40, NO. 21, 2006 / ENVIRONMENTAL SCIENCE & TECHNOLOGY 9 6781