pulsed rf heating simulations in normal-conducting l-band
TRANSCRIPT

Pulsed RF heating simulations in normal-conductingL-band cavities.
V.V. Paramonov, A.K. SkasyrskayaInstitute for Nuclear Research, 117312, Moscow, Russia
Abstract
In some special parts of present projects, such as X-FEL and ILC, normal con-ducting cavities are applied, operating with high electric and magnetic fields. RF guncavities with an electric field up to 60MV
m at the photo cathode are now under develop-ment. Capture cavities in the ILC positron source should operate with an acceleratinggradient of up to 15MV
m , practically the same value (14MVm ), as for the CDS booster
cavity in the Photo Injector Test Facility at DESY in Zeuthen (PITZ). Such operatingconditions, together with long (∼ 1ms) RF pulse, lead to the apparent cavity pulsedheating effect.In this report we describe the procedure and results of pulsed heating effect simulationsin L-band cavities, operating with high pulsed RF loss density and long RF pulse.
1 Introduction
The source for cavity heating is RF losses, generated during RF pulse, due to final cavitymaterial conductivity, in the thin surface skin layer. The thickness of this surface layer, theskin depth δ:
δ =
√1
μ0πfσc, Rs =
√μ0πf
σc, (1)
is ∼ 2μm for operating frequency f = 1300MHz. In (1) σc is the copper electric conductivity,Rs is the copper RF surface resistance, Rs = 9.4 · 10−3Ohm.With a pulsed cavity operation, cavity heating is also a pulsatile process. Once generatedin thin surface layer, heat starts propagating from the surface into the cavity body. But itis a slow process, with a typical velocity ∼ cm
sec. The own copper heat conductivity is not
sufficient to transfer all the heat, generated in a surface layer, into the cavity body for thetime of a RF pulse. Surface temperature rise takes place. Between RF pulses, heat leavesthe heated surface layer, surface temperature decreases and temperature distribution in thecavity body comes to ’average’ (over time) distribution. But, another RF pulse arrives andcycle repeats.For the pulsed heating the pulse dissipated RF power (equal to the input RF pulse power
Pi) and a related pulse surface density power Pd are of main importance, Pd = RsH2τ
2, where
Hτ is the magnetic field strength at the cavity surface. Average dissipated RF power Pa
defines the average temperature distribution in the cavity body. For 10Hz repetition rateoperation with a RF pulse duration of 1ms we have Pa = 0.01Pi.RF pulsed heating is a well known problem for a very high frequency (≥ 3 · 109Hz), highRF power hardware and makes conditional upon wishes for high electric fields. There are alot of papers describing this topic study, for example [3] and related references. At L-bandfrequency the maximal electric and related magnetic fields are lower. Together with a lowersurface resistance Rs ∼
√f , it leads to lower (in order) values of maximal dissipated RF
power density Pd, as compared, for example, with X-band NLC or 30GHz CLIC accelerating
1
TESLA-FEL Report 2007-04
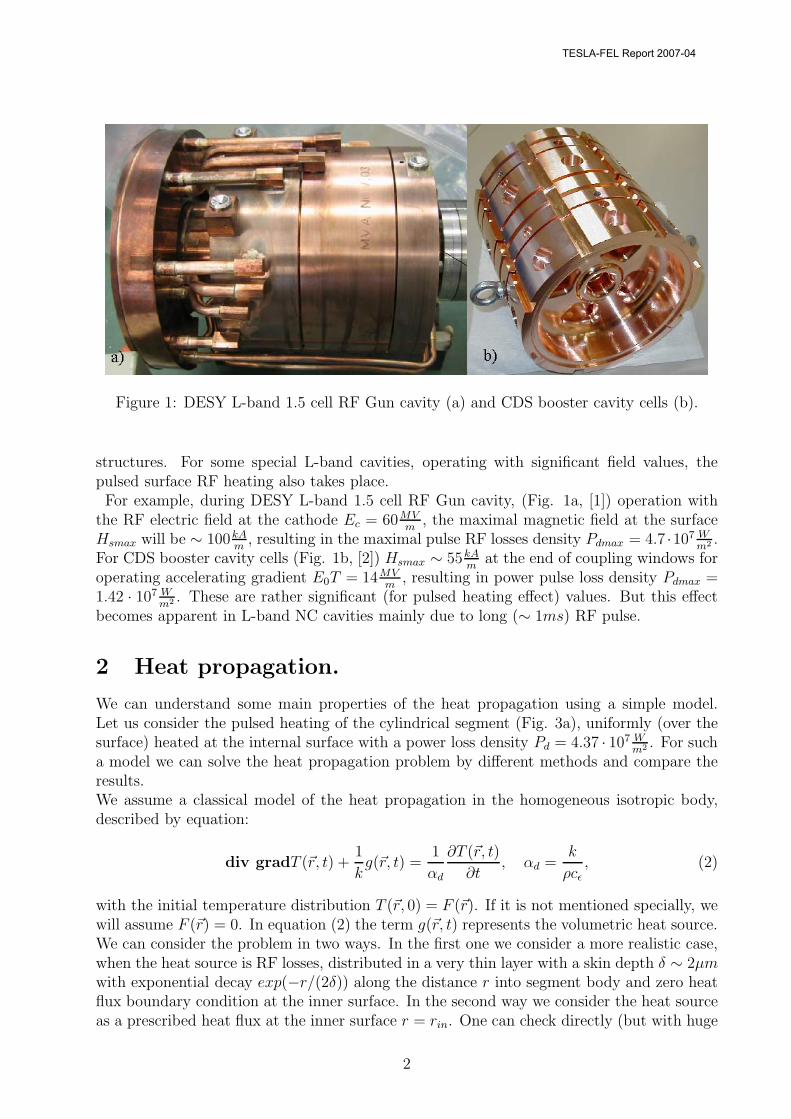
Figure 1: DESY L-band 1.5 cell RF Gun cavity (a) and CDS booster cavity cells (b).
structures. For some special L-band cavities, operating with significant field values, thepulsed surface RF heating also takes place.For example, during DESY L-band 1.5 cell RF Gun cavity, (Fig. 1a, [1]) operation with
the RF electric field at the cathode Ec = 60MVm
, the maximal magnetic field at the surfaceHsmax will be ∼ 100kA
m, resulting in the maximal pulse RF losses density Pdmax = 4.7 ·107 W
m2 .For CDS booster cavity cells (Fig. 1b, [2]) Hsmax ∼ 55kA
mat the end of coupling windows for
operating accelerating gradient E0T = 14MVm
, resulting in power pulse loss density Pdmax =1.42 · 107 W
m2 . These are rather significant (for pulsed heating effect) values. But this effectbecomes apparent in L-band NC cavities mainly due to long (∼ 1ms) RF pulse.
2 Heat propagation.
We can understand some main properties of the heat propagation using a simple model.Let us consider the pulsed heating of the cylindrical segment (Fig. 3a), uniformly (over thesurface) heated at the internal surface with a power loss density Pd = 4.37 · 107 W
m2 . For sucha model we can solve the heat propagation problem by different methods and compare theresults.We assume a classical model of the heat propagation in the homogeneous isotropic body,described by equation:
div gradT (�r, t) +1
kg(�r, t) =
1
αd
∂T (�r, t)
∂t, αd =
k
ρcε, (2)
with the initial temperature distribution T (�r, 0) = F (�r). If it is not mentioned specially, wewill assume F (�r) = 0. In equation (2) the term g(�r, t) represents the volumetric heat source.We can consider the problem in two ways. In the first one we consider a more realistic case,when the heat source is RF losses, distributed in a very thin layer with a skin depth δ ∼ 2μmwith exponential decay exp(−r/(2δ)) along the distance r into segment body and zero heatflux boundary condition at the inner surface. In the second way we consider the heat sourceas a prescribed heat flux at the inner surface r = rin. One can check directly (but with huge
2
TESLA-FEL Report 2007-04

Figure 2: Temperature (a) and temperature gradient (b) distributions near surface forpulse heated OFE tube for different RF pulse length, Pd = 4.37 · 107 W
m2 .
calculations) - the difference in temperature distribution T (r) in the body is negligible, andtakes place only in the skin layer. The first approach is more complicated for simulationseven for 1D approximation and can not be realized for 3D Finite Elements Method (FEM)simulations with ANSYS. So, in future we consider g(�r, t) = 0 and use the prescribed heatflux boundary condition at the inner surface:
k(�ngradT ) = Ps, Ps = 0, t < 0, , Ps = Pd, 0 < t < τ, Ps = 0, τ < t. (3)
In equations (2), (3) ρ = 8.95 · 103 kgm3 , k = 391 W
m·K and cε = 385 Jkg·K are the density, the
heat conductivity and the specific heat for OFE copper, respectively. The copper thermaldiffusivity is αd = 1.135 · 10−4 m2
sec.
For our model of the cylindrical segment the problem is one dimensional and heat propagationtakes place only in radial direction. Anyhow, even for 1D approximation we cannot solvethe problem in a simple analytical form. A solution, based on Green’s function technique,is given in [3] and also requires numerical calculations for special functions. To have thereference temperature distributions, we apply direct numerical integration for equation withboundary conditions (3).Numerically integrated (1D) temperature T (r) and gradient G(r) distributions are shown inFig. 2.Two parameters are most important for this effect description - a surface temperature rise
Ts at the RF pulse τ time with respect the initial temperature value before RF pulse, anda diffusion length Dd - the distance of temperature decreasing (along the normal directioninside cavity body) e times, see for example, [4]:
Ts =Pd
√τ
2√
πρkcε
, Dd =
√kτ
ρcε
=√
αdτ , Ts =PdDd
2√
πk, (4)
These analytical expressions were obtained in 1D approximation. During RF pulsed heat-ing we have heat propagation from the surface into cavity body with rather sharp tem-perature front. For the pulse length τ = 0.5ms; 1.0ms; 1.5ms the Dd values (4) areDd = 238μm; 337μm; 413μm respectively. Due to low propagation velocity at the timeof ∼ (1÷ 2)ms heat penetrates into the cavity body at the length of ∼ 2Dd and the heated
3
TESLA-FEL Report 2007-04

Figure 3: FEM simulated temperature (a), temperature gradient (b), displacements (c)and stress (d) distributions for pulse heated segment of OFC tube, Pd = 4.37 · 107 W
m2 ,τ = 1ms, (e) - the mesh example for ’shell’ analysis.
layer can be considered as a thin shell at the cavity surface. In normal n (to the cavity sur-face) direction we have fast change both in temperature T (n) and in temperature gradientG(n), Fig. 1.3.The surface temperature rise finishes together with a RF pulse finish. Between RF pulses atemperature distribution smoothing takes place - the heat propagates from the heated surfacelayer into the cavity body. Surface temperature decreases fast- for t = 2τ, T = 0.41Tsmax,for t = 10τ, T = 0.18Tsmax. Temperature distribution at the cavity surface aspires to’average’ over time value.
2.1 Numerical Procedure
To investigate 3D cavities, we improve our previous procedure of the closed-loop 3D cavitiesanalysis [5]. A special meshing technique has been developed (Fig. 1.4e) to ensure precisecomplete thermal-stress analysis in very thin (∼ (1.5÷ 2.0)Dd) 3D shell layer at the surfaceof relatively big ≈ 200mm cavity, together with the cavity itself, with reasonable computingresources. The thermal analysis is performed by direct numerical solution of non-stationaryheat transfer equation (2) for the time of RF pulse τ using usual ANSYS possibilities.The procedure has been tested at the segment of uniformly pulsed heated tube, consideredabove, where thermal parameters and distributions were precisely calculated with anotherway, Fig. 2.In our simulations we integrate equation (2) with a time step dt ∼ 5μs during RF pulse.
Numerically calculated Ts value at the cavity surface is not so sensitive to the mesh sizeand time integration step, if dt < 10μs, and well coincides with the value, obtained withestimation (4). Relative difference is ∼ 10−4.To obtain correct temperature distribution in normal direction, which is important for reli-able stress problem solution, we need a dense mesh, even using second order elements. Butsmall element size is only required in normal direction. To provide controlled mesh, withsmall mesh size in normal and relatively large one in tangential directions, we generate aspecial solid model, Fig. 4, with a special multi-layers shell at the cavity surface, which isa part of the cavity body. The layers number in the shell and each layer thickness depend
4
TESLA-FEL Report 2007-04

Figure 4: Solid model for RF Gun cavity pulsed heating simulations.
on the heat propagation distance during the RF pulse. The total shell thickness should be(∼ (1.5 ÷ 2.0)Dd) with mesh size in normal direction (∼ (0.2 ÷ 0.3)Dd) - it is necessary fornumerical approximation of both temperature (Fig. 1.3a) and temperature gradient (Fig.1.3b) distributions at the length of fast changing.Numerical simulations with finite elements are a consuming procedure with respect to com-puter memory and CPU time requirements and we are limited with total mesh-points num-ber. To keep reasonable compromise between description of thin layers and remaining cavitybody, together with RF volume, we can place in layers approximately half of the total num-ber of mesh points. With the reasonable mesh-size (∼ 100μm) in layers along the normaldirection, we have to restrict our model with minimal part of the total geometry - 1/8 forRF Gun cavities with rotational symmetry and 1/4 for CDS one. We also restrict the nu-merically considered RF pulse length with 1ms. For longer RF pulses scaling relations andgiven above time dependencies should be used. In our FEM simulations we assume constantvalues for material parameters. For the practical Pd and τ values the surface temperaturerise Ts is significant to provide apparent effect on cavity parameters, but is not significantfor sufficient change in material properties. The simulations with temperature dependentmaterial parameters are much more consuming in CPU time, but the difference of final re-sults for considered practical cases - frequency shift values, is in the range of precision forsuch simulations.
3 Calculated surface temperature rise due to RF pulsed
heating for RF Gun cavities
DESY RF Gun cavities have two (or 1.5 in some references) cells. At the cathode, Fig. 4,is the electric field Ec and E2 is maximal Ez value at the cavity axis in the second cell.For tuned RF Gun cavity should be Frat = Ec
E2= 1. According to RF Gun philosophy, the
maximal electric axis field should be at the cathode. In the second cell the maximal electricfield at cavity axis can be in limits E2 ∼ (1.0 ÷ 0.9)Ec, 1.1 ≥ Frat ≥ 1.0 [6].
5
TESLA-FEL Report 2007-04

Figure 5: Temperature rise Ts distributions at the surface of RF Gun cavities. τ = 1000μs,Pi = 8MW . a) - Gun 3, Frat = 0.979, b) - Gun 3, Frat = 1.10, c) - Gun 4, Frat = 1.00, d) -BESSY Gun, Frat = 0.944, e) - a surface temperature distribution in normal direction into
cavity body, enlarged scale.
The BESSY Gun [7], also considered for the pulsed heating effect, has the same RF volumeshape, as DESY Guns, but has quite different design of cooling circuit and is totally con-structed from copper components. In this case, for temperature simulations, and especiallyfor further cavity deformation simulations we have no problem with correct definition ofthermal and elastic parameters of cavity components.The temperature rise Ts distributions are shown in Fig. 5 for Gun 3, Gun 4 and BESSY Guncavities, assuming that input RF power is Pi = 8MW and RF pulse length is τ = 1000μs.During RF pulse, heat penetrates into the cavity body at a length of ∼ 2Dd ≤ 1mm. Forτ = 1000μs, = 2000μs, and τ = 3000μs, Dd = 337μm, = 413μm and Dd = 447μm, respec-tively. All elements of the cavity design, such as cooling channels, as a rule, are placed atlarger distance from the surface. Heat propagation in tangential directions during RF pulseis also negligible, due to smooth Pd distribution and small variation in Pd at a distance of∼ Dd. Such cavity shape elements, as rounding, also have a curvature radius > Dd. ForRF pulse length, until Dd is small, there is no heat reflection from internal cavity designelements and there is no essential deviation from 1D model of heat penetration into thecavity body, the cavity engineering design is not important for pulsed thermal effect. At thecavity surface Ts (1) distribution repeats very well the Pd one. For the given cavity andoperational regime there are no methods for the pulsed surface temperature risecontrol.One can see confirmation of this statement in temperature distributions, shown in Fig. 5.
All RF cavities, shown in Fig. 5, have the same RF field distribution inside the cell. Thefinal Pd distribution depends on the field balance between the cells. We also have to remem-ber that Pd ∼ E2
c,2. Perfectly tuned case Frat = 1.0 leads to the temperature distribution,shown in Fig. 5c for Gun 4 cavity. As one can see from Fig. 5c, the surface temperaturerise in the second sell is higher than in the cathode half cell. The temperature distribution,shown in Fig. 5b corresponds to tolerable fields ratio Frat = 1.1. Comparing temperaturedistributions in Fig. 5a, Fig. 5b, and taking into account the corresponding Frat values,one can understand the difference - in the example, shown in Fig. 5a the maximal surface
6
TESLA-FEL Report 2007-04

Figure 6: Surface temperature distributions just before (a,b) and just after (c,d) RF pulsefor DESY Gun4 (a,c) and BESSY Gun (b,d) cavities. Ec = 60MV
m, τ = 1000μs, RR− 10Hz.
temperature is in the second cell, and for example, shown in Fig. 5b - in the first one. Alsocomparing temperature distributions, shown in Fig 5, one can see that reasonably significantspread in Frat value, from 0.944 to 1.1, doesn’t result in proportional spread of the maximalsurface temperature.In the thin heated layer a rather big heat energy Wh is deposited during RF pulse, Wh =Piτ ∼ (6 ÷ 7)kJ for Ec = 60MV
moperation.
3.1 Total surface heating for RF Gun cavities
We should remember that the pulsed RF surface heating is an additional temperature effect,which, for the cavity surface, arises during RF pulse and is added to the stationary averagesurface temperature due to the average cavity heating, related with a high value of averagedissipated RF power. The pulsed surface temperature rise is sharp splashes, added to theaverage surface temperature Ts−av. Let us define Ts−av as the steady-state temperature sup-posing continuous cavity heating with average RF power Pa. It is a good approximation forsurface temperature distribution before RF pulse. In Fig. 6 the temperature distributionsare shown for Gun 4 and BESSY Gun just before and just after RF pulse.The average RF power assumed for Ts−av simulation is PA ≈ 67kW , cooling water temper-ature is 30Co. For average heating the maximal temperature value takes place also at thecavity surface. The cavity engineering design and cooling regime are important for Ts−av
value and, hence, for maximal surface temperature values after RF pulse.It should be pointed out here that precise simulation of average temperature distributionis a separate problem and distributions in Fig. 6 have the main purpose to show that wehave a sufficiently high surface temperature even for average heating, and to this value asignificant addition will be applied due to pulsed temperature rise, resulting in unexpectedlyhigh surface temperature value during the main part of RF pulse.
7
TESLA-FEL Report 2007-04

Figure 7: The schematic sketch of a thin non uniformly (T (n)) heated film at the surface ofa body.
4 Cavities pulsed deformations due to pulsed RF heat-
ing
Due to RF pulsed heating, at the surface of the cavity there exists a non uniformly heatedthin layer which expands, both in normal �n, and tangential �τ1, �τ1, directions. In Fig. 7 aschematic sketch is shown for thin non uniformly (T (n)) heated film at the surface of a body.The general equation of thermal expansion is [8]:
3(1 − ν)
1 + νgrad div�x − 3(1 − 2ν)
2(1 + ν)rot rot�x = αgradT, (5)
where α = 1.67 · 10−5 1K
, ν = 0.345 and Eel = 1.23GPa are the linear expansion coeffi-cient, Poisson ratio and Young module for fully annealed OFE copper. Considering 1Dapproximation, from (5) one can find:
3(1 − ν)
1 + ν
∂2xn
∂2n= α
∂T
∂n,
3(1 − ν)
1 + ν
∂xn
∂n= αT, unn =
∂xn
∂n(6)
From general relation between principal displacements and stresses [8] we have:
σn =αTEel
3(1 − 2ν), στ1,2 =
αTEelν
3(1 − 2ν)(1 − ν), (7)
For normal displacements xn, from (6) it directly follows that xn ∼ ∫T (n)dn. The stresses
σn, στ1,2 have the dimension of the pressure, which is the force, applied to the unit surface.To evaluate the force values in tangential directions, we have to integrate στ1,2 over surfaceS1 and S2, see Fig. 7, respectively:
Fτ1,2 =∫
dS1,2
στ1,2dS = dl∫
στ1,2dn ∼ dl∫
T (n)dn. (8)
For elastic deformations xi ∼ Fi, but proportionality coefficient between xi and Fi dependson the cavity design, material and constrains under mounting. Taking it into account and
8
TESLA-FEL Report 2007-04

multiplying∫
T (n)dn by cε value, we get:
xi ∼ Fi ∼∫
cεT (n)dn
cε∼ Wh
cε(9)
for all components of the displacements. According to the perturbation theorem, the cavityfrequency shift δf for small surface displacements is:
δf ∼ xi ∼ Fi ∼Wh
cε
. (10)
Basing on the above given relations, we can formulate the following conclusions for defor-mations of pulsed heated cavities:a) - the stress values in the thin heated layer are proportional to the layer tem-perature rise, until we neglect material properties change with this rise and theheated layer is thin;b) - the deforming forces and induced displacements are proportional to theheat value, deposited in the layer, but depend on the cavity design, materialand constrains under cavity mounting;c) - for the constant RF input power, the heat value, deposited in the layer, isproportional to the time during RF pulse;d) - the cavity frequency shift is proportional to the time from the RF pulsebeginning;and the parameter
Sf =δf
τPi
, [kHz
ms · MW], (11)
is the property of the given cavity and can be used to estimate the cavity frequency shift fordifferent RF input power levels and RF pulse length.The estimations (5), (10) describe general relations. For complicated cavity geometry, takinginto account cavity engineering design, the parameter Sf should be defined in numericalsimulations. Especially for these simulations (numerical solution of equation (5)) the meshparameters in multi layer film at the cavity surface, see Fig. 3e, Fig. 4, are extremelyimportant. Comparing results of our numerical simulations for the model, shown in Fig. 3,with analytical solution (one can find it in [8]), for our solid model, shown in Fig. 4 , (withappropriate mesh parameters), we can estimate the relative errors in Sf and σi calculationsat the level ±(15 ÷ 20)%.
5 Calculated pulsed deformations and frequency shifts
for RF Gun cavities.
In Fig. 8 the distributions of displacements, induced by pulsed heating, for DESY Gun3 (Fig. 8a,a1,a2), Gun 4 (Fig. 8b,b1,b2) and BESSY Gun (Fig. 8c,c1,c2) after the endof RF pulse with τ = 1000μs, Pi = 8MW are shown. In Fig. 8a,b,c one can see thetotal displacements, in Fig. 8a1,b1,c1 the radial components of displacements, and in Fig8a2,b2,c2 - the longitudinal ones. In simulations the left side of the cavity is rigidly fixed, theright one is free. In each picture the maximal value of appropriate displacement is printedin micrometers.
9
TESLA-FEL Report 2007-04

Figure 8: Displacements, induced by pulsed heating, for DESY Gun 3 (a,a1,a2), Gun 4(b,b1,b2) and BESSY Gun (c,c1,c2) cavities after the RF pulse end with τ = 1000μs,
Pi = 8MW . a), b), c) - the total displacements; a1), b1), c1) - the displacements in radialdirection; a2), b2), c2) - the displacements in longitudinal direction. The left side of thecavity is rigidly fixed, the right one is free. 1 - segregated stainless steel jacket in DESY
Guns design.
All DESY Gun cavities have a Stainless Steel (SS) jacket, Fig. 8, which improves the cavityrigidity. The BESSY Gun cavity is constructed totally from OFE copper. In this case weremove one degree of possible uncertainty in simulations - for a cavity with uniform materialthe calculated values of displacements and the corresponding frequency shift do not dependon material Young module value.As one can see from Fig. 8a,b,c, the total displacements picture is rather complicated anddepends on cavity design. Especially large qualitative difference in deformations we see,comparing DESY Guns and BESSY Gun designs. Qualitatively, the displacements valuesare of order ≈ 10μ for all considered cavities under the conditions of RF pulse applied. Thestress values, caused by such deformations, (≈ 107Pa), lie well below the copper yield limit,and cavity deformations are elastic. The energy Wel, stored in elastic deformations, (for theconditions of RF pulse applied) is Wel ∼ 2J � Wh ∼ 7kJ . It is by a factor 103 smaller thanthe heat energy Wh, stored in the thin heated layer. In this case we can consider the effectsof pulse heating and induced deformations as independent ones.RF Gun cavities are naturally closer to cylindrical shape, and we specially show in thepictures radial xr components (Fig. 8a1,b1,c1) and longitudinal xz ones (Fig. 8a2,b2,c2), toemphasize cavity elements displacements in transversal and longitudinal directions.The calculated Sf values are Sf ≈ −3.0 kHz
ms·MWfor DESY Gun 3, Sf ≈ −2.7 kHz
ms·MWfor DESY
Gun 4 and Sf ≈ −3.8 kHzms·MW
for BESSY Gun. In general, there are no big differences in thevalue of frequency sensitivity to the pulsed heating between considered Gun designs. Lowervalues for DESY Guns can be explained well by SS jacket influence, which restricts the radialdisplacements in the cavity. The operating mode in Gun cavities cells can be classified asthe TM010 one and the frequency shift for such a mode is more sensitive to transversal cell
10
TESLA-FEL Report 2007-04

Figure 9: Displacements, induced by pulsed heating, for DESY Gun 3 (a,a1,a2) and Gun 4(b,b1,b2) cavities after the RF pulse end with τ = 1000μs, Pi = 8MW . a), b) - the total
displacements; a1), b1) - the displacements in radial direction xr; a2), b2) - thedisplacements in longitudinal direction xz. 1 - joint solid stainless steel jacket.
shape displacements.It should be pointed out here that we confidently show the calculated negative frequencyshift for RF Guns normal design, instead of the positive frequency shift value, extractedfrom the experimental data treatment in [9]. One can see in Fig. 8a1,b1,c1 negativeradial displacements (inside the cavity) in the cavity regions with a strong electrical field(iris nose) and positive radial displacements (outside the cavity) at the outer cylindricalwall (the region with a strong magnetic field). According to perturbation theorem, suchdisplacements should result in frequency decreasing.The DESY Guns have segregated SS jackets, which conditionally divides the cavity in threeparts. Comparing longitudinal deformations for DESY Guns, Fig. 8a2,b2, and for BESSYGun, Fig. 8c2, one can see approximately uniform (along the cavity length) xz deformationsfor BESSY cavity design. For DESY cavities one can pick out three regions in xz distributionalong the cavity. The three cavity parts, each clamped by its own part of the segregatedSS jacket, move, approximately, as a unit. The main part of longitudinal deformations,marked by red circles and exclamation marks in Fig. 8, takes place between these cavityparts. Taking into account the pulsed RF operation, these regions of the cavity should gethigher cyclic fatigue, as compared to other cavity components. It should be also pointed outthat due to cavity design and construction technology in these regions brazed junctions areplaced, which are not the strongest element, as compared to solid material.
11
TESLA-FEL Report 2007-04

Figure 10: Displacements, induced by pulsed heating, for DESY Gun 3 (a,a1,a2) and Gun4 (b,b1,b2) cavities after the RF pulse end with τ = 1000μs, Pi = 8MW . a), b) - the total
displacements; a1), b1) - the displacements in radial direction xr; a2), b2) - thedisplacements in longitudinal direction xz . 1 - segregated copper jacket.
5.1 Possible design modifications for RF Gun cavities
In our simulations we can investigate not only normal cavity design, but can also considersome cavity engineering design modifications, to estimate possibilities and limits in thecontrol of the pulsed cavity frequency shift.In Fig. 9 the distributions of displacements, induced by pulsed heating, for DESY Gun 3(Fig. 9a,a1,a2) and Gun 4 (Fig. 9b,b1,b2) after the end of RF pulse with τ = 1000μs,Pi = 8MW , assuming the joint solid SS jackets for the whole cavity, are shown. In Fig. 9a,bone can see the total displacements, in Fig. 9a1,b1 the radial component xr of displacements,and in Fig.9a2,b2 - the longitudinal xz component of the displacements.Comparing the longitudinal displacements values xz for the normal design with a segregatedSS jacket, (Fig. 8a2,b2), and for the joint solid one, (Fig. 9a2,b2), one can see that xz isreduced several times for the case of joint jacket. Such a jacket restricts the cavity expansionin longitudinal direction. Also longitudinal deformations are more uniform along the cavity- we do not see deformation concentration in the place of brazed junctions. The radialdisplacements are practically the same in value. But now the maximal xr value takes placenear iris foundation, instead of the places of brazed junctions, as it is for the case of segregatedjacket, see Fig. 8a1,b1.The total cavity shape deformations are smaller for the joint SS jacket case, and are more
uniformly distributed in the cavity body. The calculated frequency shift sensitivity valuesSf are also lower in the case of joint SS jacket, Sf ≈ −2.32 kHz
ms·MWfor Gun 3 case and
Sf ≈ −2.07 kHzms·MW
for Gun 4 cavity design.With respect to the pulsed RF Gun cavity deformations and related frequency shift, the joint
12
TESLA-FEL Report 2007-04

Figure 11: Displacements, induced by pulsed heating, for DESY Gun 3 cavity after the RFpulse end with τ = 1000μs, Pi = 8MW . a),a1),a2) - the total, radial and longitudinal
displacements distributions, respectively, assuming infinitely rigid jacket (1); b),b1),b2) -the total, radial and longitudinal displacements distributions, respectively, assuming rigidly
fixed plates (2).
solid SS jacket has a preference of lower cavity deformations, the cavity becomes more rigid,as compared to the design with a segregated SS jacket. But the effect of pulsed deformationsremains, just decreases, and technical realization of the joint jacket is more difficult.Another possible design modification is just opposite, with respect to the joint SS jacketcase, considered above. Let us suggest some segregated copper jackets in the Rf Gun design.In Fig. 10 the distributions of displacements, induced by pulsed heating, for DESY Gun 3(Fig. 10a,a1,a2) and Gun 4 (Fig. 10b,b1,b2) after the end of RF pulse with τ = 1000μs,Pi = 8MW are shown, assuming a segregated copper jacket. In Fig. 10a,b one can seethe total displacements, in Fig. 10a1,b1 the radial component xr of displacements, and inFig.10a2,b2 - the longitudinal xz component of the displacements.In this case, as a sequence of the segregated jacket concept, we have practically the same totaland longitudinal displacements, as one can see comparing with the values and displacementsdistributions, given in Fig. 10 and Fig. 8 for the normal case design. There are alsodisplacements concentrations near brazed junctions. The cavity becomes softer and moresensitive to the effect of pulsed deforming forces. The calculated frequency shift sensitivityvalues Sf are higher, as compared to segregated SS jacket, and Sf ≈ −4.13 kHz
ms·MWfor Gun
3 and Sf ≈ −3.8 kHzms·MW
for Gun 4 cavity design.The option with a segregated copper jacket has no preferences with respect to the pulsed
deformations, as compared to the existing design with SS jackets.
13
TESLA-FEL Report 2007-04

5.2 Different constrains for RF Gun cavities
We can also discuss the effect of different cavities constrains, simulating in this way possiblerestrictions for the mounted cavity and response for the pulsed deformations.Let us suppose that we prohibit cavity expansion in radial direction by using an infinitelyrigid segregated jacket. The distributions of the cavity displacements for this case are shownin Fig. 11a,a1,a2. With the restriction in radial direction, we have slightly enlarged longitu-dinal displacements, Fig. 11a2. In radial direction we see deformation inside the cavity, Fig.11a1. In this picture (Fig. 11a1) one can see the evidence of sensitivity for our simulations- blue regions at the cavity inner surface reflect the cooling channels structure inside thecavity wall. The result of frequency shift estimation shows interesting particularity - thecalculated Sf value is small enough and has a positive sign, Sf ≈ +0.48 kHz
ms·MW.
With the rigid cavity fixation between two plates, we have interesting pictures for cavitydeformations, see Fig. 11b,b1,b2. If we keep the RF coupler part rigidly, the outer partof the cavity moves. The calculated Sf value is maximal for all considered Gun 3 cavityoptions, Sf ≈ −4.65 kHz
ms·MW
6 Pulsed RF heating effect for CDS booster cavity cell
The CDS booster cavity [2] cells, Fig. 12a, have essentially 3D shape with coupling win-dows and magnetic field concentration at windows ends. For maximal operating regimeE0T = 14MV
mthe maximal magnetic field value at the windows is Hsmax ≈ 56kA
m.
Calculated distribution of the surface temperature rise Ts after τ = 1ms RF pulse is shownin Fig. 12b, resulting in Tsmax ≈ 27Co. As one can see, we have in temperature distributionlocalized hot spots at the windows ends with respect to moderate temperature rise in themain part of the cell surface.
To find correct solution of equation (5) for periodical structure, we have to apply itera-tive procedure, described in [5], defining equilibrium conditions. The distributions of thetotal cell deformations and components of deformations in radial, angular and longitudinaldirections, are shown in Fig. 12c,d,e,f, respectively. The maximal value of cell deformationis ∼ 1μm, Fig. 12c. It is a rather small value and here can arise a question about pre-cision of such small displacements calculations. But in Fig. 12d one can see the evidenceof sensitivity (and related precision) for our model - the hot spots in a radial componentof displacements reflect the blind holes positions with a reduced cavity wall thickness. So,our numerical model in deformations simulations reflects very delicate details of the cavitydesign. To illustrate more evidently the cell deformations, in Fig. 12c,d,e,f the initial, notdeformed contour of the cell shape is shown for each component of deformations.As one can see from the displacements distributions, there are shape deformations inside thecavity at the blind holes positions, Fig. 12d, together with angular expansion of windowsends inside the cavity, Fig. 12e. These deformations are in the region of a high magnetic fieldand lead to the frequency increasing. Moreover, the interaction of deforming forces, inducedby pulsed heating, with the cell (not simple in shape) body results in the longitudinal drifttubes displacement, Fig. 12e. The distance between the drift tubes noses in the accelerat-ing cell increases at ≈ 1μm, also leading to operating frequency increasing. the calculatedfrequency shift for CDS operating mode is positive, δf ≈ 4kHz after RF pulse τ = 1000μsfor operating regime with E0T = 14MV
m. The calculated quality factor decreasing during RF
pulse (see below for definition) for CDS booster cavity cells is ≤ 1%.
14
TESLA-FEL Report 2007-04

Figure 12: a) - CDS cells, b) temperature rise Ts distributions at the CDS cell surface afterτ = 1000μs RF pulse, E0T = 14MV
m, c) the total cell deformations distribution, d),e),f) -
the radial, angular and longitudinal components distributions of the cell deformations,respectively.
For periodical structures we cannot introduce the parameter Sf so naturally as it was donefor single RF Gun cavities. In this case we provide the frequency shift value and describeconditions. For another operating regime the result scaling is δf ∼ τ ∼ (E0T )2.A CDS structure was considered and proposed for application in normally conducting pre-accelerator [10] in the Positron Source for International Linear Collider (ILC) [11]. Thecritical point in the PPA structure is the capture sections, which should operate with ac-celerating gradient E0T ≈ 15MV
mand τ = 1000μs RF pulse length - practically repeating
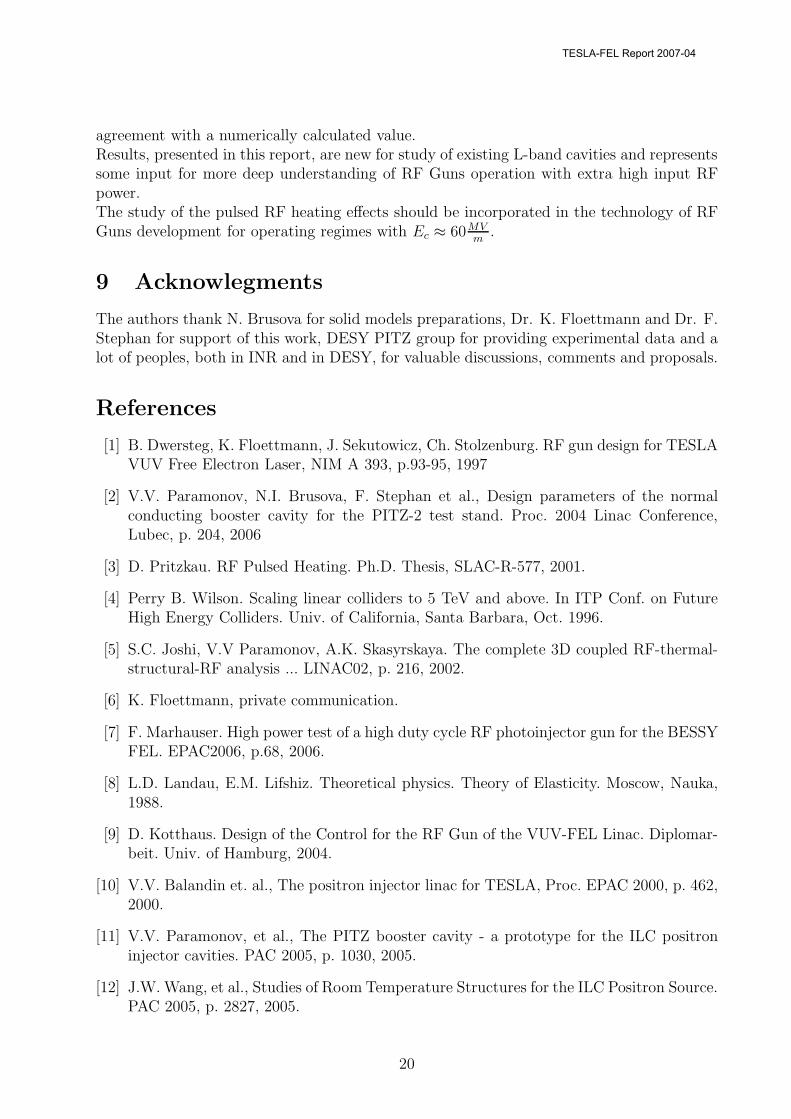
PITZ CDS booster operating regime. For PPA applications a CDS cells shape has beenmodified slightly for Esmax and Hsmax decreasing. A RF pulsed heating effect in PPA CDShas been considered and compared with such effect in a simple π-mode structure [12], whichis another possible option for ILC PS capture sections.Due to practically the same operating regimes, the pulsed RF heating effect for PITZ CDSand ILC CDS has no big differences. A temperature rise Ts distribution and typical for CDSangular displacements at the windows ends are shown in Fig. 2.7a,c, respectively. In Fig.2.7b a stress distribution at the cell surface is shown. A maximal stress value, due to pulseddeformations, takes place all the time at the cell surface and for the described operatingregime is well below the yield point for OFE copper. The calculated frequency shift afterRF pulse is also ≈ +4kHz, as for PITZ CDS case.In the simple π-mode structure the magnetic field is more uniformly distributed at the outercell surface and there are no regions with a strong field concentration, as it is at the CDSwindows ends. A temperature rise Ts distribution is shown in Fig. 13d and Tsmax ≈ 9Co.Due to more uniform magnetic field distribution, simple structure has a lower Tsmax value,but also has a large part of the surface with such increased temperature, see Fig. 2.7d.Due to such a temperature distribution - local higher Ts hot spot in CDS and distributed,but higher Ts value in a simple structure, the quality factor degradation at the RF pulse is
15
TESLA-FEL Report 2007-04
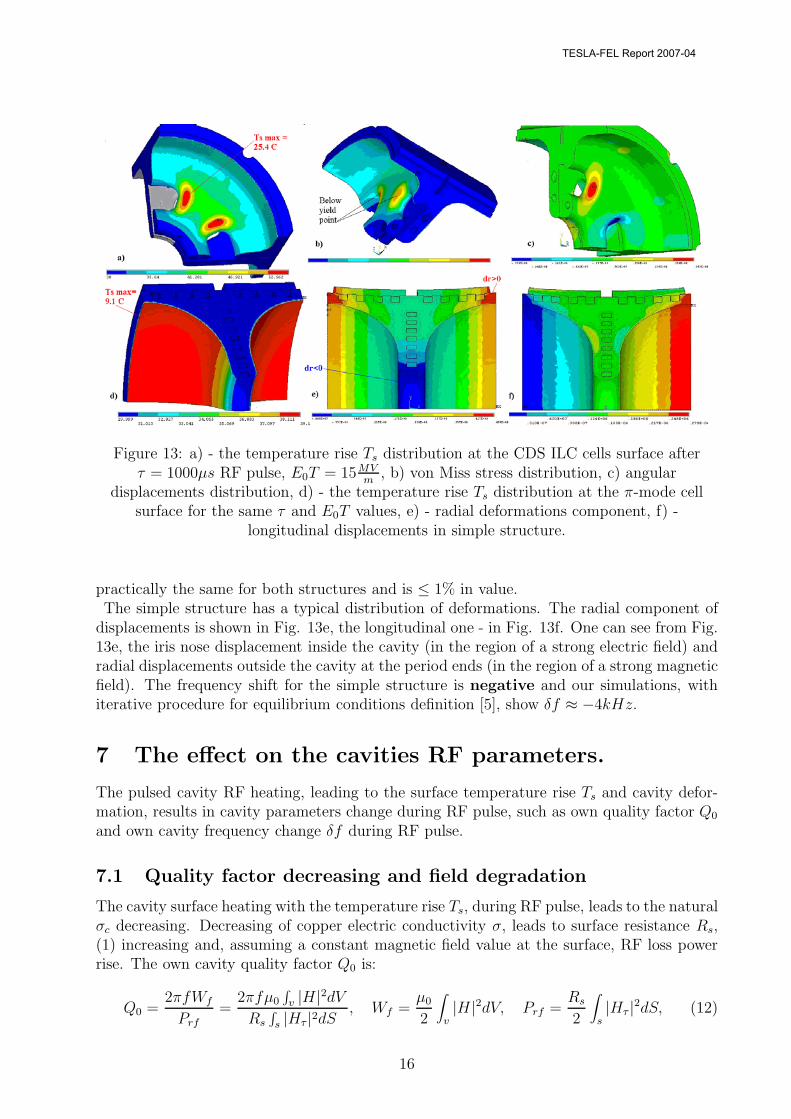
Figure 13: a) - the temperature rise Ts distribution at the CDS ILC cells surface afterτ = 1000μs RF pulse, E0T = 15MV
m, b) von Miss stress distribution, c) angular
displacements distribution, d) - the temperature rise Ts distribution at the π-mode cellsurface for the same τ and E0T values, e) - radial deformations component, f) -
longitudinal displacements in simple structure.
practically the same for both structures and is ≤ 1% in value.The simple structure has a typical distribution of deformations. The radial component of
displacements is shown in Fig. 13e, the longitudinal one - in Fig. 13f. One can see from Fig.13e, the iris nose displacement inside the cavity (in the region of a strong electric field) andradial displacements outside the cavity at the period ends (in the region of a strong magneticfield). The frequency shift for the simple structure is negative and our simulations, withiterative procedure for equilibrium conditions definition [5], show δf ≈ −4kHz.
7 The effect on the cavities RF parameters.
The pulsed cavity RF heating, leading to the surface temperature rise Ts and cavity defor-mation, results in cavity parameters change during RF pulse, such as own quality factor Q0
and own cavity frequency change δf during RF pulse.
7.1 Quality factor decreasing and field degradation
The cavity surface heating with the temperature rise Ts, during RF pulse, leads to the naturalσc decreasing. Decreasing of copper electric conductivity σ, leads to surface resistance Rs,(1) increasing and, assuming a constant magnetic field value at the surface, RF loss powerrise. The own cavity quality factor Q0 is:
Q0 =2πfWf
Prf=
2πfμ0
∫v |H|2dV
Rs
∫s |Hτ |2dS
, Wf =μ0
2
∫v|H|2dV, Prf =
Rs
2
∫s|Hτ |2dS, (12)
16
TESLA-FEL Report 2007-04

where Wf is the stored field energy in the cavity and Prf is the total RF losses. With theconstant RF power Pi from the klystron, all RF power, supplied in the cavity, should bedissipated in heat at the cavity surface. Let us neglect RF power reflection from the cavityor consider reflected RF power Pref as small Pref � Pi. If we suppose the constant RFpower dissipation in the cavity, but surface resistance increases during RF pulse, it canbe realized only by appropriate reduction in Hτ value at the surface and thecorresponding E, H reduction in the cavity volume. It leads to the Wf reduction andQ0 decreasing, according (12).We assume that for the copper electric conductivity σ the usual linear dependence on materialtemperature is:
σ =σref
1 + αT (T − Tref), (13)
where σref is the copper electric conductivity value at reference temperature Tref ( in hand-books σref value is usually given for Tref = 20Co), αT ≈ 1
273is the linear coefficient. Let us
suppose the Tref value as the equivalent (or averaged) cavity surface temperature before RFpulse. In this case in (13) T − Tref = Ts. Supposing Prf = const, and taking into account(1), from (12) one can get:
Rs ∼√
1 + αTs, E ∼ H ∼√
Pi√1 + αTs
, Qo ∼Q0ref√1 + αTs
. (14)
The dependences of E and Q0 reductions on time during RF pulse are clear from the ex-pressions in (14) and Ts ∼
√t dependence (4). To find values, we have to take into account
Ts and Pd distributions at the cavity surface. The calculated value for RF losses increasingfor RF Gun cavities for τ = 1000μs, Pi = 8MW and Ts distributions at the cavities surface,shown in Fig. 1.7, is ≈ 8.4%. It should result in the same relative Q- factor reduction and≈ 4.2% field reduction at the RF pulse end. For other Pi and τ values it can be estimatedby using scaling relations for Ts and dependences in (14).
7.2 Frequency shift estimation
The RG Gun frequency shift δf during RF pulse was estimated in experiments [9] by aspecial method with the RF signal decay treatment. Let us remind that our simulationsshow another sign for δf .We can consider another method for δf estimation, based on the treatment of experimentaldata for forward and reflected waves parameters. In Fig. 14 the experimental data forforward and reflected power (Fig. 14a) during RF pulse, vector sum and phase (Fig. 14b,Fig. 14c) of the resulting wave in the waveguide are plotted for Gun 3 operation withτ = 900μs, Pi = 3.51MW RF pulse at the PITZ facility. The cavity reflection coefficient is:
ρ =ρ0 − iQl
2δff
1 + iQl2δff
, ρ0 =Q0 − Qe
Q0 + Qe
, Ql =Q0Qe
Q0 + Qe
, (15)
where δf is the cavity detuning with respect to driving signal frequency, ρ0 is the initialreflection coefficient at resonant frequency due to natural small cavity mismatch, Ql and Qe
are the loaded and external quality factors of the cavity, respectively.To use data for vector sum and phase, we have several unknowns - ρ0 and Ql values. Insteadof phase data (Fig. 14c), which are most precise, for δf approximate estimation we will use
17
TESLA-FEL Report 2007-04

Figure 14: Experimental readings during RF pulse for Gun 3 operation with τ = 900μs,Pi = 3.51MW at the PITZ facility. a) - forward (1) and reflected (2) RF power, in dBm,
b) vector sum amplitude, c) vector sum phase.
Figure 15: The absolute ρ values, extracted from RF power readings, in original form (a)and after smoothing with third order curve by least-square method (b).
data for forward and reflected RF power. Transferring data, plotted in Fig. 14a from dBmunits to Watts, we can find absolute ρ value according to definition as an amplitudes ratioof reflected and forward waves. the obtained data for absolute ρ value are plotted in Fig.15a in original form and in Fig. 15b after smoothing with third order curve by least-squaremethod.If we take into account such suggestions, as described in the previous section - Q0 dependenceon the time during RF pulse, hence Ql and ρ0 are time dependent, we will get not treatableexpression in (15). Moreover, formula (15) is valid for cavities with constant parameters.For δf estimation we will neglect effects, described in the previous Section, considering ρ0
and Ql as constant values.From the plot in Fig. 15b one can find minimal |ρ| = |ρ0| value at resonant frequency and|ρ0| = 0.091957. Denoting the generalized cavity detuning as γ = 2δf
Qlf, we transform equation
(15) to the form:
ρ =(ρ0 − γ2) − iγ(1 + ρ0)
1 + γ2, |ρ| =
√(ρ0 − γ2)2 + γ2(1 + ρ0)2
1 + γ2, (16)
By fitting γ value, we can find γ1, γ2 values, corresponding to the left and right ends of thecurve in Fig. 15b - the RF pulse beginning and end. In this case we have to consider two
18
TESLA-FEL Report 2007-04

options - positive (cavity over matching) and negative (cavity under matching) ρ0 values.Fortunately, for the given |ρ0| = 0.091957 it is not so important - in (16) ρ0 is several ordersof magnitude greater than γ2. The generalized cavity detuning at the RF pulse beginningand end are found as γ1 = 0.0601385, γ2 = 0.1110462. To define the cavity detuning, one hasto know Ql value. The calculated Q0-factor for RF Gun cavities is ≈ 23400. Assuming 15%Q0 reduction due to all possible reasons - surface quality, high operating temperature andalso keeping in mind cavity mismatch, we can estimate Ql = 0.85Q0
2≈ 10000. For operating
frequency f = 1300MHz, from the given γ1, γ2 values we get cavity detuning during the RFpulse δf = −11.1kHz.For the RF pulse parameters τ = 900μs, Pi = 3.51MW , using Sf ≈ −3.0 kHz
ms·MWvalue,
calculated for RF Gun 3 design, we obtain δfc ≈ −9.47kHz, which is 15% lower thanthe estimated δf = −11.1kHz. This disagreement is inside the declared precision for oursimulations of a thin not uniformly heated layer and further displacements simulations atthe ≈ 10μm level.
8 Conclusion
As compared to UHF X-band or HF S-band RF devices, in L-band NC cavities the pulsedsurface heating has softer behavior, due to lower magnetic field values and lower surfaceresistance, resulting in much lower RF loss power density. Even for cavities with significantPd ∼ 4.7 · 107 W
m2 values in L-band case the surface temperature rise ∼ 50Co takes placemainly due to longer RF pulse ∼ 1ms.For the RF pulse time (1 ÷ 3)ms the heat penetrates into the cavity body at a depth of(330 ÷ 440)μm and the heat propagation can be described well in a 1D thin film approxi-mation. The distribution of the pulsed temperature rise at the cavity surface reflects wellthe RF loss density distribution. Enough high heat energy ∼ (6 ÷ 7)kJ is stored in a thinheated film during a long RF pulse. A cavity engineering design is not important for pulsedsurface temperature rise and for the given cavity shape and operational regime there are nomethods for the pulsed surface temperature rise control.Added to a steady-state surface temperature, the pulsed rise can provide high surface tem-perature values, at ∼ (60 ÷ 100)Co higher (depending on engineering design) with respectto cooling water input temperature.The expansion of a thin pulsed heated film at the cavity surface leads to the cavity de-formations. These deformations depend on both RF pulse heating parameters and cavityengineering design. Depending on the cavity design, there can be regions with large defor-mations concentrations, providing higher possibility for material cyclic fatigue.Instead of nonlinear surface temperature Ts rise and complicated temperature distributionin the heated surface layer, the cavity deformations and related frequency shift, are pro-portional to the deposited heat energy. For the constant RF input power value it means alinear rise of the cavity frequency shift during RF pulse. For RF Gun cavities operation withτ = 1000μs, Pi = 8MW , the calculated frequency shift is ≈ −30kHz, which is comparablewith the cavity bandwidth. Leading to the surface temperature rise, RF pulsed heating leadsalso to the surface resistance and cavity quality factor reduction. Assuming a constant RFpower value from RF source, it should also lead to the field amplitude reduction during RFpulse.The estimated RF Gun cavity detuning, from forward and reflected power values, is in good
19
TESLA-FEL Report 2007-04
agreement with a numerically calculated value.Results, presented in this report, are new for study of existing L-band cavities and representssome input for more deep understanding of RF Guns operation with extra high input RFpower.The study of the pulsed RF heating effects should be incorporated in the technology of RFGuns development for operating regimes with Ec ≈ 60MV
m.
9 Acknowlegments
The authors thank N. Brusova for solid models preparations, Dr. K. Floettmann and Dr. F.Stephan for support of this work, DESY PITZ group for providing experimental data and alot of peoples, both in INR and in DESY, for valuable discussions, comments and proposals.
References
[1] B. Dwersteg, K. Floettmann, J. Sekutowicz, Ch. Stolzenburg. RF gun design for TESLAVUV Free Electron Laser, NIM A 393, p.93-95, 1997
[2] V.V. Paramonov, N.I. Brusova, F. Stephan et al., Design parameters of the normalconducting booster cavity for the PITZ-2 test stand. Proc. 2004 Linac Conference,Lubec, p. 204, 2006
[3] D. Pritzkau. RF Pulsed Heating. Ph.D. Thesis, SLAC-R-577, 2001.
[4] Perry B. Wilson. Scaling linear colliders to 5 TeV and above. In ITP Conf. on FutureHigh Energy Colliders. Univ. of California, Santa Barbara, Oct. 1996.
[5] S.C. Joshi, V.V Paramonov, A.K. Skasyrskaya. The complete 3D coupled RF-thermal-structural-RF analysis ... LINAC02, p. 216, 2002.
[6] K. Floettmann, private communication.
[7] F. Marhauser. High power test of a high duty cycle RF photoinjector gun for the BESSYFEL. EPAC2006, p.68, 2006.
[8] L.D. Landau, E.M. Lifshiz. Theoretical physics. Theory of Elasticity. Moscow, Nauka,1988.
[9] D. Kotthaus. Design of the Control for the RF Gun of the VUV-FEL Linac. Diplomar-beit. Univ. of Hamburg, 2004.
[10] V.V. Balandin et. al., The positron injector linac for TESLA, Proc. EPAC 2000, p. 462,2000.
[11] V.V. Paramonov, et al., The PITZ booster cavity - a prototype for the ILC positroninjector cavities. PAC 2005, p. 1030, 2005.
[12] J.W. Wang, et al., Studies of Room Temperature Structures for the ILC Positron Source.PAC 2005, p. 2827, 2005.
20
TESLA-FEL Report 2007-04