pulsed-field gel electrophoresis of very large dna...
TRANSCRIPT

Ann. Rev. Biophys. Biophys. Chern. 1988. 17: 287-304 Copyright © 1988 by Annual Reviews Inc. All rights reserved
PULSED-FIELD GEL
ELECTROPHORESIS OF VERY
LARGE DNA MOLECULES
Charles R. Cantor
Department of Genetics and Development, College of Physicians and Surgeons, Columbia University, New York, NY lO032
Cassandra L. Smith
Departments of Microbiology and Psychiatry, College of Physicians and Surgeons, Columbia University, New York, NY 10032
Mathew K. Mathew
Department of Genetics and Development, College of Physicians and Surgeons, Columbia University, New York, NY 1 0032
CONTENTS
PERSPECTIVES AND OVERVIEW......................................................................................... 288
LIMITATIONS OF CONVENTIONAL DNA AGAROSE ELECTROPHORESIS.................................... 288
PULSED-FIELD GEL ELECTROPHORESIS.............................................................................. 289
FACTORS THAT AFFECT PFG SEPARATIONS........................................................................ 294 Molecular Properties ............................................... .................................... ............. 294 Pulse Times............................................................................................................... 295 Electrical Field Shape ............................................................................................... 296 Electrical Field Strength ........................................................................................... 297 Gel Concentration.......... ............................................ ............................................... 298 DNA Concentration ..................................................................................... ............. 299 Temperature ................................................ . . . ............................ ................. ............. 299
THEORETICAL ANALYSIS OF PFG ................................................................................ ...... 300 DNA Shape ............................................. ................................................................. 300 DNA Reorientation................................................................................................... 301
287 0883-9182/88/0610-0287$02.00
Ann
u. R
ev. B
ioph
ys. B
ioph
ys. C
hem
. 198
8.17
:287
-304
. Dow
nloa
ded
from
arj
ourn
als.
annu
alre
view
s.or
gby
Bos
ton
Uni
vers
ity o
n 04
/13/
10. F
or p
erso
nal u
se o
nly.

288 CANTOR, SMITH & MATHEW
PERSPECTIVES AND OVERVIEW
It is four years since the first demonstration that alternating electrical field direction dramatically facilitates the fractionation of large DNA molecules by size (27). There is now a large body of experimental results on various experimental configurations and the experimental parameters critical to high-resolution size separation (1, 1 0, 34, 35). Separation of large DNA molecules has been used as a tool for a variety of biological problems (16, 33, 37, 39, 43, 45). These applications have stimulated wide interest in this new technique. Here, however, our main focus is on the technique itself. While the separation behavior of DNA in alternating fields has the poten-
. tial to provide new insights about the molecular properties of large molecules, these insights will depend on the proper blending of experimental and theoretical approaches. The present understanding of the mechanism of these separations is still incomplete. Therefore we concentrate on those lines of experimental endeavor that are likely to elaborate the physical picture of large DNA separations.
LIMITATIONS OF CONVENTIONAL DNA AGAROSE ELECTROPHORESIS
DNA behaves as a freely draining coil during electrophoresis in free aqueous solution (25). This means that each unit length of the DNA helix experiences the full frictional drag of the solvent. The electrical force on the DNA molecule is also constant per unit length, since each base pair has the same net negative charge. The electrophoretic velocity is dependent on the ratio of the electrical force and the frictional force. Since both forces depend linearly on DNA length, the electrophoretic velocity is independent of size (25). Thus free-solution electrophoresis is not a useful tool for DNA fractionation. The limitations are exactly analogous for SDS-protein micelles.
Electrophoresis of DNA molecules in gel matrices is an effective method for size fractionation. Acrylamide gels are applicable for DNA molecules ranging in size from a few base pairs to few kilobase pairs (kb), while agarose gels work best in the 0.2-20-kb size range. Here we limit our discussion to agarose gels. For DNA molecules less than a few kilo bases long, and at low electrical field strengths (less than 1 V cm -I), sieving is the major mechanism that provides separation. Thus mobilities are observed to vary logarithmically with DNA size. At higher field strengths the shape of the DNA is distorted by the field, and simple sieving behavior is no longer seen.
Ann
u. R
ev. B
ioph
ys. B
ioph
ys. C
hem
. 198
8.17
:287
-304
. Dow
nloa
ded
from
arj
ourn
als.
annu
alre
view
s.or
gby
Bos
ton
Uni
vers
ity o
n 04
/13/
10. F
or p
erso
nal u
se o
nly.

PFG ANALYSIS OF LARGE DNA 289
The radius of the pores in typical 1 % agarose gels is estimated to be about 100 nm, which is comparable to the 60-nm persistence length of DNA chains under typical electrophoresis conditions (4 , 28). In free solution the behavior of DNA is well modeled by a stiff, wormlike coil. Thus DNA molecules larger than a few hundred base pairs must become distorted in shape in order to enter the gel pores. In the upper size limit of DNA, one would expect the molecules to move through the gel by a reptation mechanism. Each DNA molecule should become highly extended and snake along its contour through the gel pores under the influence of the applied field. In this limit mobilities would be expected to depend on the inverse of the molecular size; thus reasonably effective size fractionations should be possible. However, the actual behavior observed under typical electrophoresis conditions is a loss in the size dependence of mobility for DNA molecules much larger than 20 kb.
The DNA size at which agarose gel electrophoretic mobility becomes independent of molecular weight depends strongly on the electrical field strength and the gel concentration (17, 42) because the DNA molecules tend to remain oriented along the direction of the applied electrical fields (18). Several different but related theories suggest that the mobility achieved by aligned molecules is independent of size (20, 31). In practice, it is difficult to achieve useful resolution for DNA molecules larger than 50-1 00 kb in conventional electrophoresis. Even in the 10-50-kb size range the separation power of ordinary gel electrophoresis is limited. It can be enhanced by operation at very low field strengths and gel concentrations, but these are not very satisfactory experimental conditions because of the long running times required and the mechanical difficulties involved in handling very dilute gels (13).
PULSED-FIELD GEL ELECTROPHORESIS
The new technique of pulsed-field gel electrophoresis (PFG) takes advantage of the elongated and oriented configuration of large DNA molecules in agarose gels at finite field strengths. Thus separation is explicitly based on the factors that limit ordinary electrophoresis. Unlike virtually all other separation methods, PFG relies on the ability of applied forces to perturb molecular shape rather than just produce a shape-dependent translational motion. Thus although PFG-like separations have been demonstrated only in DNA electrophoresis, similar separation principles should be applicable for other applied forces and other target molecules.
In typical PFG experiments, DNA molecules are present in an ordinary agarose gel matrix in conventional low-ionic strength buffers. An electrical
Ann
u. R
ev. B
ioph
ys. B
ioph
ys. C
hem
. 198
8.17
:287
-304
. Dow
nloa
ded
from
arj
ourn
als.
annu
alre
view
s.or
gby
Bos
ton
Uni
vers
ity o
n 04
/13/
10. F
or p
erso
nal u
se o
nly.

290 CANTOR, SMITII & MA TIIEW
field, usually 10 V cm -I but sometimes considerably lower, is applied alternately in two directions. To migrate through the gel matrix, the DNA molecules must change their direction of motion in response to the changing electrical field. Separation is achieved because the time required to change direction depends on the size of the DNA. In most cases the apparent reorientation time increases with DNA size; larger molecules move more slowly than smaller ones. The critical experimental variable is the pulse time, which is the time a field is applied in one direction before it is switched abruptly to another direction. The pulse time selected usually sets an effective upper limit on the size separation range. If the pulse time is much shorter than the molecular reorientation time, it seems likely that the molecules will eventually reach a configuration in the agarose gel that represents a response to the average of the two applied electrical fields. The molecules will then move in response to the net applied field, and since they do not change direction, all separation due to molecular reorientation will be lost. Thus all molecules above a certain size will move with the same mobility. In a complex sample this effect produces a band of mixed DNA species, which has been called the compression zone.
Since the original demonstration of the PFG effect (27), many different experimental variations on the technique have appeared (Figure 1). Although the fundamental physics behind these separations should be the same, the different methods produce somewhat different experimental results. The various methods differ in the angle between the two applied
A B
D E - +
:(0): D + -
F
c
+ +
0240 2400
o o o o 0 0 0
120360 360120
Figure 1 A schematic illustration of some of the different types of pulsed-field gel electrophoresis. Boldface and lightface indicate alternating gel or energized electrode configurations, respectively. Short bars indicate sample wells. Plus and minus signs or open circles indicate point electrodes; lines indicate continuous electrodes. (A) Orthogonal fields or double nonhomogeneous fields; (B) rotating or swinging gel; (C) vertical PFG; (D) contour clamped homogeneous electrical fields or hexagonal fields; (E) field inversion; (F) voltage ramp.
Ann
u. R
ev. B
ioph
ys. B
ioph
ys. C
hem
. 198
8.17
:287
-304
. Dow
nloa
ded
from
arj
ourn
als.
annu
alre
view
s.or
gby
Bos
ton
Uni
vers
ity o
n 04
/13/
10. F
or p
erso
nal u
se o
nly.

PFG ANALYSIS OF LARGE DNA 291
electrical fields and in the shapes of these fields. An analysis of the effect of these parameters promises to help refine our physical picture of the mechanism of PFG separations. Different experimental methods also vary in the symmetry of the applied fields (26, 39), the number of different applied fields (22), and the electrical or mechanical methods used to induce field switching. These parameters do not seem fundamentally important, and they are not discussed in detail here.
Almost every variation on PFG has been given a different name. The nomenclature is unnecessarily confusing and belies the common physical mechanism of the methods. Here we call all of these variants PFG. Three basic experimental configurations are in wide use today:
1. Two nominally perpendicular inhomogeneous fields are alternated with equal pulse times (7, 26, 27). Because of the field inhomogeneity, the angles between the two applied fields vary throughout the gel matrix. Use of this configuration has been called orthogonal field alternating gel electrophoresis (OF AGE), which is actually a misnomer since the two applied fields are actually at greater than 90° in configurations that provide effective separations. Another variant is vertical pulsed field gel electrophoresis (14).
2. Two nominally homogeneous fields are alternated with equal pulse times at a constant angle. Techniques using this configuration have been called voltage clamp (9), voltage ramp (5), and cross field or swinging gel electrophoresis (41); rotatory pulsed field gel electrophoresis (RPFG) (15); or rotating gel electrophoresis (29), depending on the method used to alternate the fields.
3. Two nominally homogeneous fields at 180° are alternated in either duration or strength (6). Use of this configuration has been called field inversion gel electrophoresis (FIGE).
All of these different PFG configurations can be used to separate DNA molecules up to 1 Mb in size, and some experimental conditions allow the fractionation of molecules that are an order of magnitude larger. The methods differ in the dependence of mobility on molecular weight and in the sharpness and straightness of DNA bands and sample lanes. To assess relative performance, it is useful to have sets of DNA molecules that differ in constant size increments. Such samples in the size range of interest for PFG are most conveniently provided by tandemly annealed bacteriophage DNAs (1, 8,36, 39). DNA molecules containing from one to 30 or more repeats can be prepared in relatively uniform yields by incubating a concentrated DNA sample. We have found it most effective to prepare the DNA by lysing the bacteriophage in situ in the agarose and then annealing the sample in the agarose (33). Samples prepared in this way show a
Ann
u. R
ev. B
ioph
ys. B
ioph
ys. C
hem
. 198
8.17
:287
-304
. Dow
nloa
ded
from
arj
ourn
als.
annu
alre
view
s.or
gby
Bos
ton
Uni
vers
ity o
n 04
/13/
10. F
or p
erso
nal u
se o
nly.

292 CANTOR, SMITH & MATHEW
uniform grid of DNA bands resembling the steps of a ladder and are conventionally called DNA ladders.
The oligomeric DNAs are held together noncovalently through base pairing between complementary sticky ends. Therefore annealed DNA samples can only be used at temperatures low enough so that the dissociation of the paired ends takes significantly longer than the 20-1 40 hr required for experimental separation. In practice, no difficulties are observed at the usual PFG temperatures of 10-20°e. For higher-temperature work, it is possible to ligate the DNAs in the oligomers covalently, although this may limit the accessible size range of the ladder if any significant nuclease activities contaminate the DNA ligases.
With two electrical fields at a fixed or variable angle less than 1800, typical PFG fractionation of a DNA ladder shows three major resolution zones (Figure 2). The first zone contains molecules below a particular size, which show a linear decrease in mobility with increasing molecular weight, M. This dependence on M is quite different from the M-1 dependence expected from typical reptation models. The second zone, containing larger DNA, begins fairly abruptly; the linear relationship between size and mobility is still observed, but the size dependence is roughly twice as steep as in the first zone. In this zone DNA bands are usually somewhat broader, and under some conditions the lanes in which the DNA migrates show considerable curvature. Above the second zone are molecules beyond a critical size, which all show effectively the same mobility. This is the compression region. Under some experimental conditions the compression zone is the most slowly migrating DNA band. Under other conditions, however, it actually migrates faster than the largest molecules in the second zone.
The dependence of mobility on DNA size in field inversion electrophoresis is more complex. If a constant ratio of forward and backward pulse times or voltages is employed, the mobility exhibits a parabolic dependence on DNA size (8). Small and large DNAs move rapidly; DNAs of intermediate sizes move more slowly, and molecules of a critical size barely move at all. This behavior undoubtedly provides a significant clue to the mechanism of the separation, but it is not ideal for routine analytical applications. Similar behavior has recently been observed in ordinary DNA electrophoresis in certain critical ranges of DNA size, field strength, and agarose gel concentration (24). These effects have been attributed to condensed loop structures transiently formed by the DNA.
The exact relationship between the lack of monotonic behavior in ordinary and in field-inversion electrophoresis needs to be established. However, in the latter technique it is clear that the size of the least mobile
Ann
u. R
ev. B
ioph
ys. B
ioph
ys. C
hem
. 198
8.17
:287
-304
. Dow
nloa
ded
from
arj
ourn
als.
annu
alre
view
s.or
gby
Bos
ton
Uni
vers
ity o
n 04
/13/
10. F
or p
erso
nal u
se o
nly.

PFG ANALYSIS OF LARGE DNA 293
Figure 2 A typical PFG separation of a set of oligomeric bacteriophage DNA size standards. The data were obtained .using a 20-cm square 1% agarose gel with fields of 10 V cm-I in a 33-cm double nonhomogeneous apparatus (LKB Pulsaphore) with a IOO-sec pulse time at 15°C for 40 hr. The lanes and monomeric DNA sizes are: a and e, Avir, 43 kb; b, P4, II kb; c, P2, 33 kb; d, Acl857, 48.5 kb. The bright band seen midway up the Avir ladders is a contaminant.
,
DNA increases as the ratio between the forward and backward pulse times (or field strengths) decreases. Thus one can create a monotonic relationship between size and mobility by using a program of different pulse-time ratios (6). For reasons that are not clear, field inversion has not been as successful as other PFG variants for separating DNA molecules in the l-lO-Mb size range. It is not known whether this is a fundamental limitation or just a reflection that the appropriate separation conditions have not yet been found. However, in many inverted-field fractionations the widths of DNA bands increase substantially as molecules approach the megabase size range.
Ann
u. R
ev. B
ioph
ys. B
ioph
ys. C
hem
. 198
8.17
:287
-304
. Dow
nloa
ded
from
arj
ourn
als.
annu
alre
view
s.or
gby
Bos
ton
Uni
vers
ity o
n 04
/13/
10. F
or p
erso
nal u
se o
nly.

294 CANTOR, SMITII & MA lHEW
FACTORS THAT AFFECT PFG SEPARATIONS
PFG separations are sensitive to a variety of different molecular and environmental variables. Here we summarize some of the major observations to date, since any quantitative understanding of the technique must incorporate a rational explanation for this sensitivity. The principle significant variables are molecular properties of the DNA, the pulse time, the electrical field shape, the electrical field strength, the gel composition, the sample concentration, and the temperature. Because so many different variables are important, it has been difficult to explore all of them systematically.
Molecular Properties
At least two properties of DNA molecules are known to affect their PFG behavior: topology and sequence. Neither effect is well understood at present.
Tandemly annealed DNA oligomers provide the only dense set of linear molecules of known size in the IOO-kb to I-Mb range. If size were the only determinant of mobility in PFG, then ladders formed from different DNA monomers would have consistent mobilities. In actuality, the molecular weight dependence of mobility in both the first and second zones of Figure 2 is the same for different concatemeric sets of DNAs. However, the transition point between the two zones varies over at least 50 kb (M. K. Mathew, C. L. Smith & c. R. Cantor, in preparation). This disparity introduces significant uncertainty into the size determined by PFG for DNAs larger than 700 kb.
We know nothing at present about which features of the DNA determine the transition point between the first two zones. Plausible candidates are stiffness, which depends on base composition; bent regions, which depend on base sequence; and easily melted regions, which might facilitate folding or hairpin formation of the DNA in the gel. A systematic exploration of these variables is needed. As long as their contributions are unknown, the best way to obtain an accurate size estimate for a DNA molecule in the l-lO-Mb size range is to cleave the molecule with a restriction enzyme into a small number of subfragments. The subfragments can then be sized accurately, and the sum of their sizes will provide the size of the parent molecule. Alternatively, it is possible to use quantitative densitometry of
an ethidium-stained gel, since the fluorescence appears to be linear with size for DNA up to 2 Mb (J. Fan, C. L. Smith, O. Niwa, M. Yanagida & C. R. Cantor, in preparation).
DNA molecules with nonlinear topologies have dramatically different
Ann
u. R
ev. B
ioph
ys. B
ioph
ys. C
hem
. 198
8.17
:287
-304
. Dow
nloa
ded
from
arj
ourn
als.
annu
alre
view
s.or
gby
Bos
ton
Uni
vers
ity o
n 04
/13/
10. F
or p
erso
nal u
se o
nly.

PFG ANALYSIS OF LARGE DNA 295
PFG properties. Both supercoiled and relaxed circular DNAs migrate considerably slower than their similarly sized linear counterparts (26). Supercoiled molecules have been examined systematically only in the 10-50-kb size range. Here the striking finding was that the PFG behavior of these molecules was independent of the 1-10 sec pulse times that strongly modulated the mobility of linear molecules in the same size range. However, when O. l-sec pulse times were used, the resolution of 20-50-kb supercoiled DNAs was enhanced (3). This result suggests that supercoiled DNAs behave like much shorter species than linear DNAs. If this explanation is correct, systematic studies of PFG may ultimately provide insights into the tertiary structure of supercoiled DNA.
It is not surprising that the mobility of relaxed DNA circles is retarded compared with that of linear or supercoiled molecules, since similar effects are seen in ordinary electrophoresis. In fact, relaxed circular DNA larger than 16 kb do not migrate at all in ordinary agarose electrophoresis, presumably because they become impaled on projections of the agarose matrix (23). Lower voltages or transverse pulsing can relieve this impalement (30). Short 1800 reversed pulses dramatically improved the ability of large relaxed circles to electrophorese in agarose (19). This observation supports the notion that impalement is the major hindrance to the migration of such DNA and suggests a method for fractionating them and estimating their sizes.
Occasional anomalies in PFG behavior have been noted for DNA molecules that are believed to be linear structures. The best known example is chromosome 12 of Saccharomyces cerevisiae. This molecule migrates more slowly or quickly than chromosome 4 depending on the temperature and other experimental conditions (8). Under some conditions this molecule and other large DNAs fail to enter the agarose gel at all (44). The reasons for these anomalies are unknown. One possibility is that chromosome 4 is not a simple linear structure. For example, it may have an easily melted region, a stable replication eye, or a stable intramolecular loop such as might be formed by a Holliday recombination intermediate.
Pulse Times
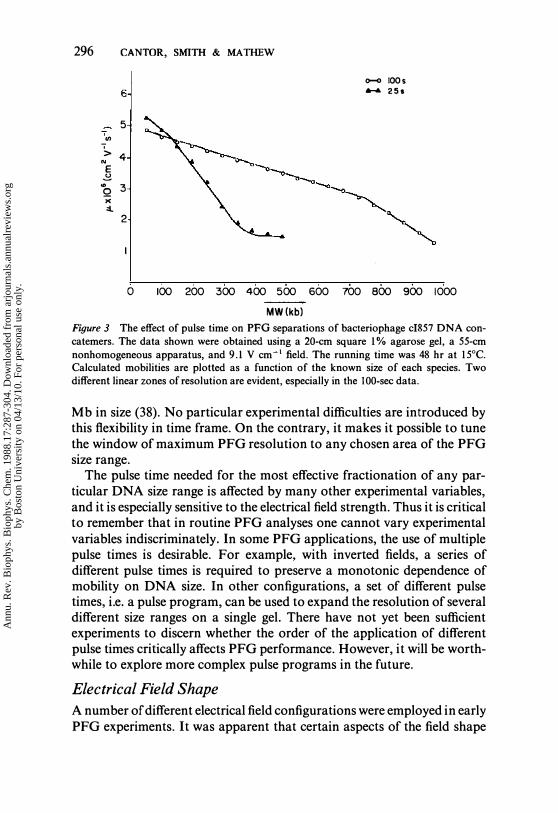
In a typical PFG experiment a single pulse time is used. This sets an upper limit to the separation range and the compression zone, and also defines the approximate boundary between the two zones of linear size resolution (Figure 3). The size of the largest resolved DNA molecule depends in a roughly linear way on the pulse time (26, 38). Therefore pulse times of almost four orders of magnitude are commonly used in PFG separations, ranging from 0.1 sec for molecules smaller than 10 kb to 1000 sec or more for the chromosomal DNAs of Saccharomyces pombe, which approach 10
Ann
u. R
ev. B
ioph
ys. B
ioph
ys. C
hem
. 198
8.17
:287
-304
. Dow
nloa
ded
from
arj
ourn
als.
annu
alre
view
s.or
gby
Bos
ton
Uni
vers
ity o
n 04
/13/
10. F
or p
erso
nal u
se o
nly.
296 CANTOR, SMITH & MATHEW
0-0 IOOs 6 ..... 25 •
5 .. (/) '> 4 N
E � "' 3 Q x ::l
2
o 100 200 300 400 500 600 700 800 900 1000
MW(kb) Figure 3 The effect of pulse time on PPG separations of bacteriophage cI857 DNA concatemers. The data shown were obtained using a 20-cm square 1% agarose gel, a 55-cm nonhomogeneous apparatus, and 9.1 V cm-1 field. The running time was 48 hr at 15°C. Calculated mobilities are plotted as a function of the known size of each species. Two different linear zones of resolution are evident, especially in the 100-sec data.
Mb in size (38). No particular experimental difficulties are introduced by this flexibility in time frame. On the contrary, it makes it possible to tune the window of maximum PFG resolution to any chosen area of the PFG size range.
The pulse time needed for the most effective fractionation of any particular DNA size range is affected by many other experimental variables, and it is especially sensitive to the electrical field strength. Thus it is critical to remember that in routine PFG analyses one cannot vary experimental variables indiscriminately. In some PFG applications, the use of multiple pulse times is desirable. For example, with inverted fields, a series of different pulse times is required to preserve a monotonic dependence of mobility on DNA size. In other configurations, a set of different pulse times, i.e. a pulse program, can be used to expand the resolution of several different size ranges on a single gel. There have not yet been sufficient experiments to discern whether the order of the application of different pulse times critically affects PFG performance. However, it will be worthwhile to explore more complex pulse programs in the future.
Electrical Field Shape
A number of different electrical field configurations were employed in early PFG experiments. It was apparent that certain aspects of the field shape
Ann
u. R
ev. B
ioph
ys. B
ioph
ys. C
hem
. 198
8.17
:287
-304
. Dow
nloa
ded
from
arj
ourn
als.
annu
alre
view
s.or
gby
Bos
ton
Uni
vers
ity o
n 04
/13/
10. F
or p
erso
nal u
se o
nly.

PFG ANALYSIS OF LARGE DNA 297
were critical in achieving high-resolution PFG separations. From a series of studies carried out in several different laboratories we now know that the critical variable affecting PFG behavior is the angle between the two applied fields (5, 9, 41). Angles of 90° or smaller are not effective, probably because the DNA molecules easily become oriented midway between the two applied fields. Angles larger than 90° are more effective (29). While more complete studies on optimum angles are needed, it is clear that angles in the range of 120-150° provide very high resolution. Angles of 180° may also be used, as described earlier, providing that the pulsing is asymmetric.
Most early PFG separations employed nonhomogeneous electrical fields, with field gradients both parallel and perpendicular to the direction of net DNA motion. We now know that these gradients are unnecessary for the basic PFG effect, since good resolution across a wide size range can be achieved in the absence of any significant field heterogeneities (5, 6,9, 15,29,4 1). However, field gradients do modulate PPG behavior, in both favorable and unfavorable ways. Field strengths that decrease, or angles that increase, progressively along the direction of the net DNA motion produce band sharpening because the molecules at the front of each DNA zone always migrate more slowly than those at the rear. However, field heterogeneities transverse to the net DNA motion lead to the curvature of the sample lanes seen in many typical PPG experiments. It is hard with typical experimental configurations to eliminate these undesirable features while preserving the desirable ones. Thus in practice it is necessary to choose between maximizing the resolution and straightening the lanes.
We know little about the relationship between electrical field shape and the size range for optimal DNA separations. However, it does seem that some configurations are more easily extended than others to DNA molecules larger than a few megabases. For example, with inverted fields, a progressive broadening of the DNA bands with increasing size limits resolution for DNA molecules larger than 1 Mb.
Electrical Field Strength
The electrophoretic mobility is defined as the velocity per unit field. In most ordinary electrophoresis the mobility is independent offield strength. This independence is expected if the properties of the molecules are not directly altered by either the applied field or the rate of molecular flow during the separation process. However, the high charge density and the enormous size of DNA leads to field-dependent mobilities even in the separation range of ordinary DNA electrophoresis. These effects are believed to arise from the orientation and stretching of the coiled configuration of the DNA by the applied field as described earlier (17, 18, 20,
Ann
u. R
ev. B
ioph
ys. B
ioph
ys. C
hem
. 198
8.17
:287
-304
. Dow
nloa
ded
from
arj
ourn
als.
annu
alre
view
s.or
gby
Bos
ton
Uni
vers
ity o
n 04
/13/
10. F
or p
erso
nal u
se o
nly.

298 CANTOR, SMITH & MATHEW
31, 42). With molecules less than 1 kb the observed dependence of mobility on field strength is modest, while much larger effects are seen with DNAs ten times larger.
Electrical field effects observed in PFG are presumably related to those seen in conventional DNA electrophoresis, but there may be some differences. The field strength affects the mobility in two ways. The mobilities of 1OQ-500-kb DNA show an approximately linear dependence on field strength; thus the actual velocities appear to increase as the square of the applied field across a range of field strengths from 5 to 15 V cm-1 (M. K. Mathew, C. L. Smith & c. R. Cantor, in preparation). The field strength affects both the DNA size of the transition between the two zones of resolution, and the compression zone (M. K. Mathew, C. L. Smith & c. R. Cantor, in preparation). However, the size dependence of PPG mobility, as measured by the slope of a plot of mobility versus size, is field independent, at least for DNAs 500 kb and smaller. Presumably these effects reflect both field-induced distortion of the shape of the DNA in the gel and field-induced reorientation of the DNA in response to alternating field directions. However, there has been no quantitative explanation of these field-strength effects.
Gel Concentration
Early attempts to separate large DNA molecules by conventional agarose electrophoresis revealed that some modest improvement in size resolution of molecules above 50 kb could be achieved by decreasing the gel concentration and thus increasing the pore size (13). Unfortunately, the gels rapidly become too dilute for routine laboratory manipulation.
The effect of gel concentration on PFG separations is quite different from that in ordinary electrophoresis. Most strikingly, higher gel concentrations lead to much slower mobilities with little effect on the overall separation pattern. The resolution of PFG actually improves somewhat when the average pore diameter drops to just below 120 nm (1 % agarose), but it is relatively insensitive above or below this size range (M. K. Mathew, C. L. Smith & c. R. Cantor, in preparation). Since 120 nm is about twice the DNA persistence length, this observation must contain a clue about the mechanism of PFG, but it is not clear how to exploit this clue. It is certain, however, that there is no justification for carrying out PPG separations above 1.2% agarose. Furthermore, the enhanced resolution seen at agarose concentrations of I % or above may not often justify the twofold increase in running time required over that required for 0.8% agarose.
It is not surprising that PPG separations improve with increased gel concentration. Even without a detailed understanding of the mechanism
Ann
u. R
ev. B
ioph
ys. B
ioph
ys. C
hem
. 198
8.17
:287
-304
. Dow
nloa
ded
from
arj
ourn
als.
annu
alre
view
s.or
gby
Bos
ton
Uni
vers
ity o
n 04
/13/
10. F
or p
erso
nal u
se o
nly.

PFG ANALYSIS OF LARGE DNA 299
of DNA reorientation in PFG, it seems clear that the more elongated the molecules, the more size dependent their reorientation should be. With smaller gel pores, DNAs should be more elongated. This effect is likely to saturate once the DNA is as fully extended as possible; perhaps with the 10 V em-I electrical fields typically employed, saturation occurs when the pores are 120 nm in diameter.
The nature of the gel matrix may also be an important variable in PFG. No studies on any matrices other than agarose have yet been reported. However, agarose does not necessarily have the ideal pore size distribution for PFG. Indeed, some theoretical pictures of the technique suggest that much higher resolution might result if a matrix with more uniform pore sizes could be found.
DNA Concentration
Most separation procedures and transport processes are concentration dependent, and PFG is no exception. In typical PFG experiments the total original sample concentration is 10--100 p.g ml-I. [Earlier studies used much higher concentrations (26), but it is now clear that higher concentrations lead to considerable band broadening, which is unacceptable for most applications.] These samples may resolve into 10--100 bands, respectively; thus the typical concentration of DNA in each band is around 1 Jig ml-1• At such concentrations PFG mobilities are virtually concentration independent, but above these concentrations a significant retardation with increasing concentration is observed. In many applications of PFG, such as restriction mapping using partial digests, an absolute determination of molecular size is needed (32, 36). In such applications sufficiently dilute concentrations must be used, or else length standards must be mixed directly with the sample.
The molecular origins of the concentration dependence of PFG are unknown. It must partially -result from the local viscosity, since direct alteration of the solution viscosity by addition of low-molecular weight solutes modulates PFG behavior. However, it is possible that direct intermolecular interference during reorientation may also contribute. Invertedfield PFG is unusually concentration dependent (2); thus sizes estimated using this procedure must be viewed with considerable caution. Why concentration effects are particularly severe with inverted fields is unknown.
Temperature
PFG separations are markedly temperature dependent, whereas the dependence seen in ordinary DNA electrophoresis is comparably modest. The reasons are unclear. The temperature dependence of ordinary DNA e1ec-
Ann
u. R
ev. B
ioph
ys. B
ioph
ys. C
hem
. 198
8.17
:287
-304
. Dow
nloa
ded
from
arj
ourn
als.
annu
alre
view
s.or
gby
Bos
ton
Uni
vers
ity o
n 04
/13/
10. F
or p
erso
nal u
se o
nly.

300 CANTOR, SMITH & MATHEW
trophoresis is accounted for by the resulting decrease in the viscosity of the solvent (17, 48). However, the temperature dependence of the solution viscosity is not large enough to account for the dramatic increase in PPG mobility seen as temperature is raised over even small intervals, e.g. from 15 to 20°C. Perhaps the enhanced temperature dependence ofPPG reflects a microviscosity effect. Alternatively, it may arise from the activation energy of a critical step in DNA reorientation, such as the melting or kinking required for the DNA to make a sharp bend or hairpin in the gel.
We do not yet know if certain temperature ranges are optimal for the separation of particular molecular weights. It has been reported that increased temperature enhances the separation of the largest DNAs (40), but we have not seen such effects in our own experiments. The magnitude of the temperature sensitivity ofPPG poses severe experimental problems, since temperature heterogeneities or fluctuations during an experiment can lead to serious loss in resolution or to lane curvature. Thus unusual care must be taken to maintain a constant and homogeneous temperature. This is not trivial to accomplish, as the running gel generates 60 W.
THEORETICAL ANALYSIS OF PFa
The above discussion shows the enormous sensitivity of PPG separations to a set of experimental variables. We assume that most or all of these affect the reorientation process, presumably by modulating the shape of the DNA in the gel. A successful theory of PPG will have to explain all of these effects, and today no such theory exists. The major limitation appears to be the paucity of direct evidence on the shape of the DNA in the gel and on the nature of the field-induced reorientation process.
DNA Shape
In principle, information on the shape of DNA in the gel is available from a variety of techniques including direct light microscopic examination of fluorescent stained DNA, linear dichroism, fluorescence depolarization (18), and X-ray, light, or neutron scattering. At present all such techniques are in their infancy, so theoretical treatments must either assume DNA
. shapes or include them as experimental variables. It is not even clear that the same models for DNA shapes will apply for all types of PPG separations or even for different resolution domains of a single separation mode. Por example, the three resolution zones in most typical PPG separations may reflect three different time domains with DNA reorientation much slower than, comparable to, and much faster than the pulse time. The average shape of the DNA molecules may differ in these three domains.
The major DNA shape variables that must be considered are, presum-
Ann
u. R
ev. B
ioph
ys. B
ioph
ys. C
hem
. 198
8.17
:287
-304
. Dow
nloa
ded
from
arj
ourn
als.
annu
alre
view
s.or
gby
Bos
ton
Uni
vers
ity o
n 04
/13/
10. F
or p
erso
nal u
se o
nly.

PFG ANALYSIS OF LARGE DNA 301
ably, the net orientation of the DNA relative to the electrical field directions and the number and distribution of kinks or bends in an otherwise largely extended DNA coil. Some of the possible shapes that merit consideration are shown schematically in Figure 4. Some existing theories ofPFG assume that the DNA is fully extended by the end of each pulse (20, 31 , 41). However, it is difficult to reconcile such a picture with the success of the field-inversion method. There must be some way to distinguish the front and back of an otherwise highly extended DNA molecule. A one-bend DNA hairpin is one simple possibility, but many other asymmetric structures are also plausible.
In the compression zone the reorientation of DNA is presumably too slow to keep up with the alternating electrical fields. Thus the net orientation of the DNA is presumably along the average of the two fields (26). However, the DNA is unlikely to be fully extended, since segments of it will be able to align during each field pulse by biased reptation. Thus it is likely that the DNA folds in response to the alternating fields as shown in Figure 4.
DNA Reorientation
Since the discovery of the PFa phenomenon, there have been several attempts to provide a physical explanation of the effect. These attempts differ significantly in their assumptions about the mechanism of DNA reorientation. Extreme models are shown schematically in Figure S. In early theories DNA was thought to reorient by biased reptation, so that one end of the DNA could (but would not always) remain the leading segment (Figure SA) (20, 31). It would be difficult to use such theories to explain more recent findings such as the need for field angles greater than 90° and the success of the field-inversion method.
The ratchet or switchback theory (Figure SB) postulates that with field angles greater than 90° a DNA molecule cannot reorient by continuing its forward progress, since a sharp bend is required in response to the new electrical field. Instead the molecule reverses direction with each field pulse
A
Figure 4 Possible shapes of DNA molecules during PFG separations: (A) extended linear
chain; (B) hairpin; (C) oriented chain with superimposed oscillations; (D) partially oriented chain; (F) partially condensed chain.
Ann
u. R
ev. B
ioph
ys. B
ioph
ys. C
hem
. 198
8.17
:287
-304
. Dow
nloa
ded
from
arj
ourn
als.
annu
alre
view
s.or
gby
Bos
ton
Uni
vers
ity o
n 04
/13/
10. F
or p
erso
nal u
se o
nly.

302 CANTOR, SMITH & MATHEW
.-field E2 Fi'ld�
Figure 5 Possible reorientation mechanisms of DNA molecules in PFG. In each panel,
successive vertical drawings indicate molecular configurations after progressively longer times following a switch in electrical field direction. (A) Biased reptation; (B) ratchet or switchback; (C) hairpins or kinked DNA; (D) partially oriented DNA.
(41). This picture has a number of appealing aspects. It readily explains the linear resolution seen at low molecular weights, in the first zone. It explains why zones of higher resolution might exist, and it accounts, at least qualitatively, for some of the complex lane shapes seen when heterogeneous fields are used. However, this picture fails to explain the success of the inverted-field method, and it also does not deal quantitatively with the observed field-strength and temperature dependence ofPFG.
Two other theoretical models are being examined that propose more complex DNA shapes. In one, DNA kinking is postulated as the major reorientation mechanism (Figure 5C) (11). In the other, DNA is allowed to assume a complex curvilinear path through the gel (Figure 5D) (46, 47). The adequacy of these theories should be tested in the near future. All of these theories seem able to explain the basic PFG phenomenon of linear size resolution across a moderate size range, probably because all conform to the simple picture shown in Figure 6. Consider any reorientation mechanism that predicts a linear dependence of reorientation time on DNA size. As long as the predicted reorientation time is less than the pulse time, the mobility is inevitably linearly dependent on size, because the mobility depends only on the fraction of each pulse time remaining for net migration. Thus an understanding of more complex aspects of PFG behavior, such as dependence on field strengths and angles and the existence of multiple resolution zones, will be needed to provide critical tests of existing and future theories. We have stressed these complexities as a challenge and a stimulus to future experimental and theoretical studies on the PFG phenomenon.
Ann
u. R
ev. B
ioph
ys. B
ioph
ys. C
hem
. 198
8.17
:287
-304
. Dow
nloa
ded
from
arj
ourn
als.
annu
alre
view
s.or
gby
Bos
ton
Uni
vers
ity o
n 04
/13/
10. F
or p
erso
nal u
se o
nly.

PFG ANALYSIS OF LARGE DNA 303
pulse time t------7
~
relaxation time
ACKNOWLEDGMENTS
Figure 6 Dependence ofPFG mobility on the fraction of the pulse time needed for reorientation. The two panels show expected results for two DNAs of different size. Arrows show the amount of forward motion occurring in each pulse cycle after reorientation has been completed.
This work was supported by grants from the NIH (GM14825), the NCI (CA 39782), the DOE (DE-F602-87ER-GD582), the Hereditary Disease Foundation, and LKB Produkter, Ab. Our PFG studies have been helped considerably by the participation of Stephanie Klco and Andras Gaal. We are very grateful to a number of authors for providing copies of their manuscripts prior to publication.
Literature Cited
I. Anand, R. 1986. Trends Genet. 2: 278-83
2. Barlow, D. P., Lehrach, H. 1987. Trends Genet 3: 167-71
3. Cantor, C. R., Bondopadhyay, S., Bramachari, S. K., Hui, C.-F., McClelland, M., et al. 1987. In Unusual DNA Structures, ed. R. Wells. New York: SpringerVerlag. In press
4. Cantor, C. R., Schimmel, P. R. 1980. Biophysical Chemistry, 2: 679-82. San Francisco: Freeman
5. Cantor, C. R., Warburton, P. E., Smith, C. L., Gaal, A. 1986. In Electrophoresis '86, ed. M. Dunn, pp. 161-71. Weinheim: VCH
6. Carle, G. F., Frank, M., Olson, M. V. 1986. Science 232: 65-68
7. Carle, G. F., Olson, M. V. 1985. Nucleic Acids Res. 12: 5647-64
8. Carle, G. F., Olson, M. V. 1985. Proc. Natl. Acad. Sci. USA 82: 3756--60
9. Chu, G., Vollrath, D., Davis, R. W. 1986. Science 234: 1582-85
10. Dawkins, H. J. S. 1987. Parasitol. Today 3:60--62
11. Deutsch, J. M. 1987. Phys. Rev. Lett. 59: 1255-58
12. Deleted in proof 13. Fangman, W. L. 1978. Nucleic Acids
Res. 5: 653-{j5 14. Gardiner, K., Laas, W., Patterson, D.
1986. Somatic Cell Mol. Genet. 12: 185-95
15. Gemmill, R. M., Coyle-Morris, J. F., McPeek, F. D. Jr., Ware-Uribe, L. F., Hecl;,J.t, F. 1987. Gene Anal. Tech. In press
16. Gibson, W. C. 1985. Parasitol. Today 1: 64-65
17. Hervet, H., Bean, C. P. 1987. Biopolymers 26: 727-42
18. Hurley, I. 1986. Biopolymers 25: 539-54
19. Levene, S. D., Zimm, B. H. 1987. Proc. Natl. Acad. Sci. USA 84: 4054-57
20. Lumpkin, O. J., Dejardin, P., Zimm, B. H. 1985. Biopolymers 24: 1573-93
21. Deleted in proof 22. McPeek, F. D. Jr., Coyle-Morris, J. F.,
Gemmill, R. M. 1986. Anal. Biochem. 156:274-85
Ann
u. R
ev. B
ioph
ys. B
ioph
ys. C
hem
. 198
8.17
:287
-304
. Dow
nloa
ded
from
arj
ourn
als.
annu
alre
view
s.or
gby
Bos
ton
Uni
vers
ity o
n 04
/13/
10. F
or p
erso
nal u
se o
nly.

304 CANTOR, SMITH & MATHEW
23. Mickel, S., Arena, V., Bauer, W. 1977. Nucleic Acids Res. 4: 1465-82
24. Noolandi, J., Rousseau, J., Slater, G. W. 1987. Phys. Rev. Lett. 58: 2428-32
25. Olivera, B. M., Baine, P., Davidson, N. 1984. Biopolymers 2: 245-57
26. Schwartz, D. C., Cantor, C. R. 1984. Cell 37: 67-75
27. Schwartz, D. C., Saffran, W., Welsh, J., Haas, R., Goldenberg, M., Cantor, C. R. 1983. Cold Spring Harbor Symp. Quant. BioI. 42: 189-95
28. Serwer, P. 1983. Electrophoresis 4: 375-82
29. Serwer, P. 1987. Electrophoresis 8: 301-4
30. Serwer, P., Hayes, S. J. 1987. Electrophoresis 8: 244-46
31. Slater, G. W., Noolandi, J. 1986. Biopolymers 25: 431-54
32. Smith, C. L., Cantor, C. R. 1986. Cold Spring Harbor Symp. Quant. Bioi. 51: 115
33. Smith, C. L., Cantor, C. R. 1987. Methods Enzymol. 155: 449-67
34. Smith, C. L., Cantor, C. R. 1986. Nature 319: 701-2
35. Smith, C. L., Cantor, C. R. 1987. Trends Biochem. Sci. 12: 284--87
36. Smith, C. L., Econome, J. G., Schutt, A., Klco, S., Cantor, C. R. 1987. Science 236: 1448-53
37. Smith, C. L., Lawrence, S. K., Gillespie, G. A., Cantor, C. R., Weissman, S. M., Collins, F. S. 1987. Methods Enzymol. 151: In press
38. Smith, C. L., Tomohiro, M., Niwa, 0., Klco, S., Fan, J.-B., et al. 1987. Nucleic Acids Res. 15: 4481-89
39. Smith, C. L., Warburton, P. E., Gaal, A., Cantor, C. R. 1986. Genet. Eng. 8: 45-70
40. Snell, R. G., Wilkins, R.I. 1986. Nucleic Acids Res. 14: 4401-6
41. Southern, E. M., Anand, R., Brown, W. R. A., Fletcher, D. S. 1987. Nucleic Acids Res. 15: 5925-44
42. Stellwagen, N. C. 1985. Biopolymers 24: 2243-55
43. Van der Ploeg, L. H. T. 1987. Am. Biotechnol. Lab. 5: 8-16
44. Van der Ploeg, L. H. T., Schwartz, D. C., Cantor, C. R., Borst, P. 1984. Cell 37: 77-84
45. Van Ommen, G. J. N., Verkerk, J. M. H. 1986. In Human Genetic Diseases, A Practical Approach, ed. K. Davies, pp. 113-33. Oxford: IRL
46. Viovy, J.-L. 1987. Biopolymers 26: 1929-40
47. Viovy, J.-L. 1987. C. R. Acad. Sci. 305: 181-84
48. West, R. 1987. Biopolymers 26: 607-8
Ann
u. R
ev. B
ioph
ys. B
ioph
ys. C
hem
. 198
8.17
:287
-304
. Dow
nloa
ded
from
arj
ourn
als.
annu
alre
view
s.or
gby
Bos
ton
Uni
vers
ity o
n 04
/13/
10. F
or p
erso
nal u
se o
nly.