pulsed electromagnets for emats
TRANSCRIPT
PULSED ELECTROMAGNETS FOR EMATS
C. N. FORTUNKO* Fracture and Deformation Division
National Bureau of Standards Boulder, CO 80303
and
D. MACLAUCHLAN* New Mexico Engineering Research Institute
University of New Mexico Albuquerque, NM 87111
ABSTRACT
In many industrial NDE applications pulsed electromagnets may be more desirable than large static electromagnets or permanent magnets for magnetic biasing of electromagnetic acoustic transducers (EMAT's). Since electromagnetic acoustic transduction is confined to one skin depth at the operating frequency of the EMAT, the transduction efficiency can be enhanced by the dynamic concentration of the magnetic flux near the surface. This paper describes a number of physical phenomena associated with EMAT generation under pulsed-magnetic-field bias. In particular, it is observed that for maximum transduction efficiencies the ultrasonic pulse must be retarded relative to the initiation of the current pulse to the electromagnet windings. A second maximum in the transduction efficiency is observed when the pulsed magnet-EMAT system is operated on ferromagnetic steel (1020). The second maximum is associated with magnetostrictive effects. Operation of pulsed magnet-EMAT systems at elevated temperatures {400°C) is demonstrated on aluminum.
INTRODUCTION
The use of a large, pulsed current to generate a biasing field is well suited to EMAT applications, where the ultrasonic system need to be active ·only for the relatively short period of time when the ultrasonic waves are in the immediate vicinity of the transmitter and receiver transducers. In practice, much of the time between pulses is not used for useful inspection processes because one must wait for the acoustic reverberations to dampen out. During this time, the coil can be switched off, allowing much of the heat generated in the electromagnet by the large current pulse to dissipate. Much higher peak currents can therefore be obtained in a pulsed electromagnet than in a static magnet of the same size. Another advantage of using a pulsed-magnetic bias on the H1AT arises from the fact that the eddy currents induced in the surface of the meta 1 part by pulsed fields act to oppose the applied field and lead to a time dependent flux concentration at the surface. Since the electromagnetic transduction action is confined to a thin surface layer of depth equal to the electromagnetic skin depth at the EMAT-coil-drive frequency, this dynamic concentration of flux can be used to enhance the efficiency of the transducer. Obviously, such enhancement will depend strongly on the geometry of the pulsed electromagnet, the conductivity and permeability of the surface material and the shape of the current pulse to the coil. In this paper a number of practical pulsed-magnet-EMAT configurations are described and the relationship between the ultrasonic transduction efficiency and time development of the pulsed magnetic field is studied experimentally on aluminum and ferromagnetic steel samples. In addition, the operation of a pul sed-magnet-H1AT system is demonstrated at eleva ted samp 1 e temperatures (400°C).
PULSED-~1,\GNET SYSTW :JES Ifi~l
Pulsed electromagnets, just as static electromagnets, obey the fundamental magnet design rules which relate the magnetomotive force (ampere-turns in the coil), the magnetic flux and the reluctance of the total magnetic circuit. However, when a pulsed electromagnet is operated in the vicinity of a (ferromagnetic) conductor, the reluctance can be expected to be time dependent. Little control can be exercised over the magnetic reluctance of the sample being magnetized by the pulsed electromagnet, but the reluctance of the pulsed coil can be significantly reduced by using a ferromagnetic core constructed of insulated laminations to reduce retardation of the magnetic pulse by eddy current effects.
A simple design formulal can be used to relate the magnetic flux density in the air gap (neglecting dynamic effects) to the electrical parameters of the discharge circuit:
B (1)
where B is the average value of the magnetic field in the air gap beneath the center post, V0 is the discharge voltage of the capacitor bank, N is the number of turns in the coil, A is the effective area of the air gao, and w0 is the characteristic frequency, (LC)-1/2, of the current pulse. The parameters K, S, and D account for the finite reluctance of the magnetic circuit outside the air gap, the uniformity of the magnetic field and the dissipation {damping) rate of the discharge, respectively. For a critically damped circuit, the factor D is lfe. The factors K and S are less than one and must be determined experimentally. Typical
*Work performed while both authors were with International Corporation, Albuquerque, Nt4
the Albuquerque Development Laboratory, Science Center, Rockwell 87105.
528
values are 0.25 and 0.50, respectively. It is seen from Eq. (l) that trade-offs can be made by varying the values of the capacitor bank, the number of turns in the coil, N, and the charging voltage, V . However, practical design values are established 0
primarily by the voltage and current breakdown characteristics of the capacitor bank and the switch. Although it would be advantageous to generate very short magnetic pulses (large w0 ), to make use of magnetic field enhancement by dynamic effects, practical values for the coil inductance, L, and the energy storage capacitor, C, limit this approach.
Some of the design parameters of two laminatedcore electromagnets are summarized in Table l, below. Both electromagnets used "E-core" transformer grade laminations of 0.5 mm (0.020 in.) thickness and were wound with #14 AWG insulated copper wire. A flux-sensing coil was also attached to the center post of the core. The coil was used in conjunction with a Miller integrator circuit to determine instantaneously the average value of the magnetic flux in the air gap beneath the center post of the pulsed electromagnet.
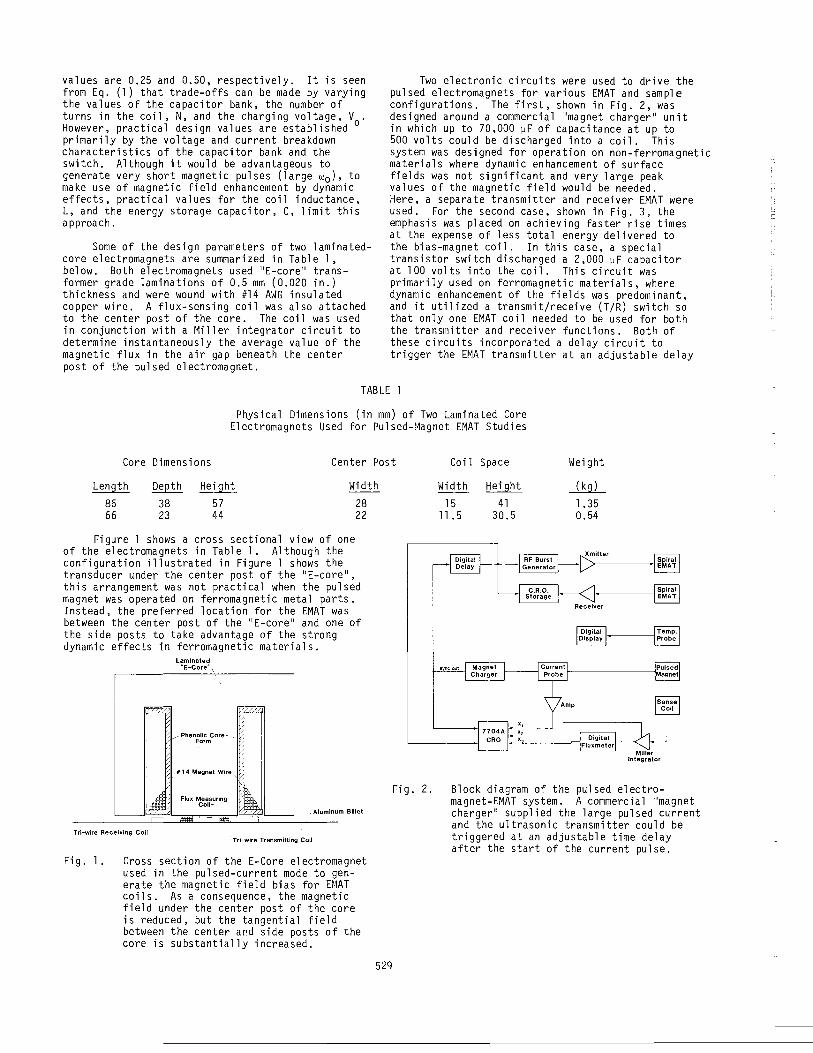
Two electronic circuits were used to drive the pulsed electromagnets for various EMAT and sample configurations. The first, shown in Fig. 2, was designed around a commercial "magnet charger" unit in which up to 70,000 ~F of capacitance at up to 500 volts could be discharged into a coil. This system was designed for operation on non-ferromagnetic materials where dynamic enhancement of surface fields was not significant and very large peak values of the magnetic field would be needed. Here, a separate transmitter and receiver EMAT were used. For the second case, shown in Fig. 3, the emphasis was placed on achieving faster rise times at the expense of less total energy delivered to the bias-magnet coil. In this case, a special transistor switch discharged a 2,000 ~F capacitor at 100 volts into the coil. This circuit was primarily used on ferromagnetic materials, where dynamic enhancement of the fields was predominant, and it utilized a transmit/receive (T/R) switch so that only one H1AT coil needed to be used for both the transmitter and receiver functions. Both of these circuits incorporated a delay circuit to trigger the EMAT transmitter at an adjustable delay
TABLE l
Physical Dimensions (in mm) of Two Laminated Core Electromagnets Used for Pulsed-Magnet EMAT Studies
Core Dimensions Center Post
Length 86 66
Depth Height Width
38 57 28 23 44 22
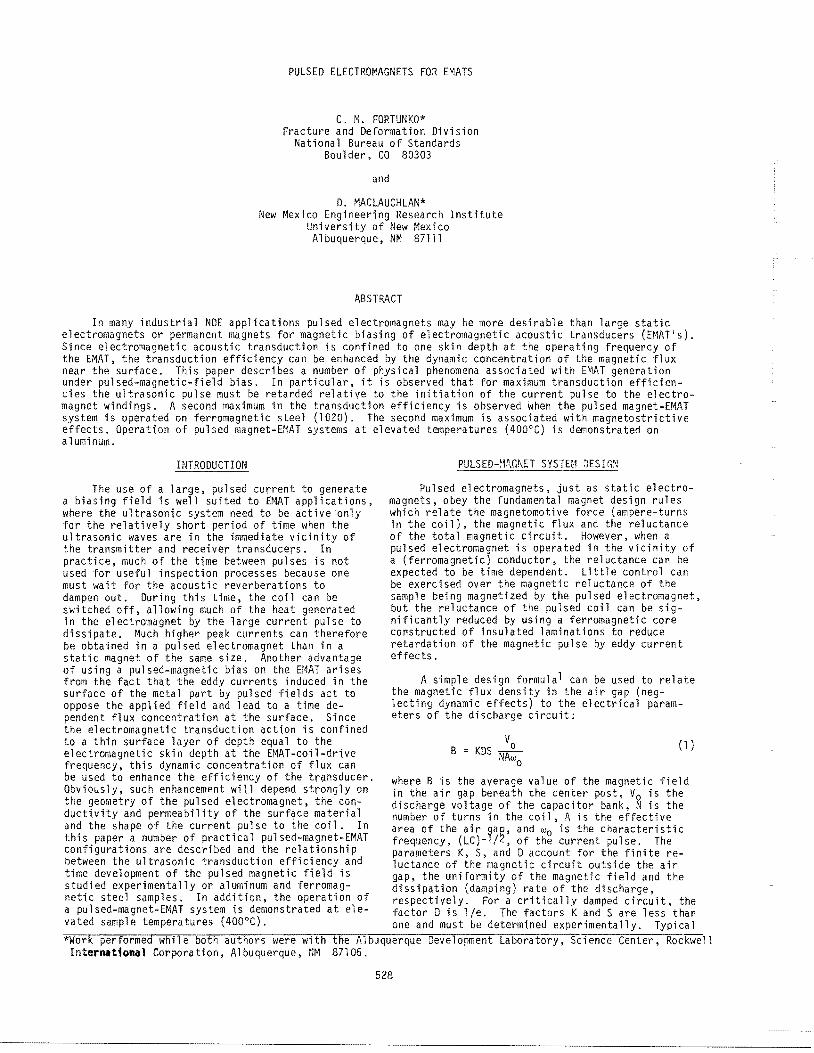
Figure shows a cross sectional view of one of the electromagnets in Table l. Although the configuration illustrated in Figure l shows the transducer under the center post of the "E-core", this arrangement was not practical when the pulsed magnet was operated on ferromagnetic metal parts. Instead, the preferred location for the EMAT was between the center post of the "E-core" and one of the side posts to take advantage of the strong dynamic effects in ferromagnetic materials.
Laminated "E-Core~ \
, Aluminum Billet
Tri-wire Receiving Coil
Fig. l .
Tri-wire Transmitting Coil
Cross section of the E-Core electromagnet used in the pulsed-current mode to generate the magnetic field bias for H1AT coils. As a consequence, the magnetic field under the center post of the core is reduced, but the tangential field between the center ard side posts of the core is substantially increased.
529
Fig. 2.
Coil Space
Width Height
15 41 11.5 30.5
Weight
_llil_ l. 35 0.54
~lite' Spiral EMAT
Digital~ Display~
Block diagram of the pulsed electromagnet-EMAT system. A commercial "magnet charger" supplied the large pulsed current and the ultrasonic transmitter could be triggered at an adjustable time delay after the start of the current pulse.
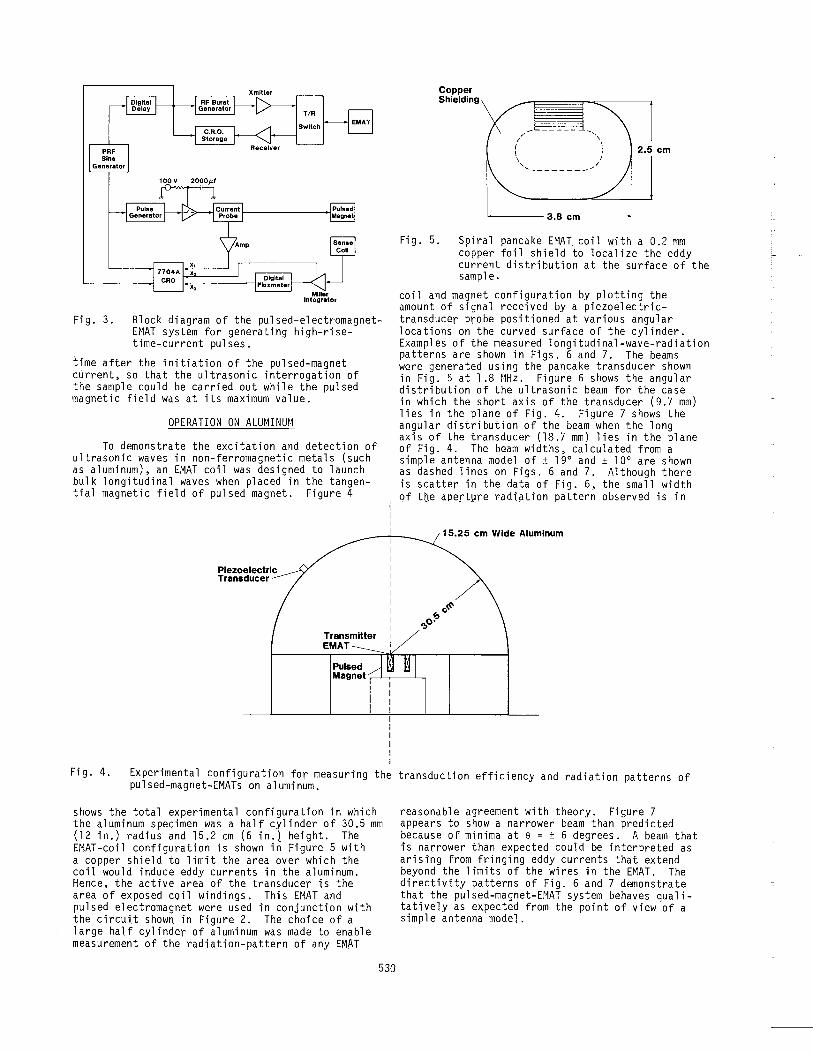
Fig. 3. Block diagram of the pulsed-electromagnetEMAT system for generating high-rise-time-current pulses.
time after the initiation of the pulsed-magnet current, so that the ultrasonic interrogation of the sample could be carried out while the pulsed magnetic field was at its maximum value.
OPERATION ON ALUMINUM
To demonstrate the excitation and detection of ultrasonic waves in non-ferromagnetic metals (such as aluminum), an EMAT coil was designed to launch bulk longitudinal waves when placed in the tangential magnetic field of pulsed magnet. Figure 4
Fig. 4.
Piezoelectric Transducer
Transmitter EMAT
Experimental configuration for measuring pulsed-magnet-EMATs on aluminum.
shows the total experimental configuration in which the aluminum specimen was a half cylinder of 30.5 mm (12 in.) radius and 15.2 em (6 in.) height. The EMAT-coil configuration is shown in Figure 5 with a copper shield to limit the area over which the coil would induce eddy currents in the aluminum. Hence, the active area of the transducer is the area of exposed coil windings. This EMAT and pulsed electromagnet were used in conjunction with the circuit shown in Figure 2. The choice of a large half cylinder of aluminum was made to enable measurement of the radiation-pattern of any EMAT
530
Copper Shielding
----~ I 1 2.5 em
I ________ _.../
1----- 3.8 em ___ ___,
Fig. 5. Spiral pancake E~AT. coil with a 0.2 mm copper foil shield to localize the eddy current distribution at the surface of the sample.
coil and magnet configuration by plotting the amount of signal received by a piezoelectrictransducer probe positioned at various angular locations on the curved surface of the cylinder. Examples of the measured longitudinal-wave-radiation patterns are shown in Figs. 6 and 7. The beams were generated using the pancake transducer shown in Fig. 5 at 1.8 ~1Hz. Figure 6 shows the angular distribution of the ultrasonic beam for the case in which the short axis of the transducer (9.7 mm) lies in the plane of Fig. 4. Figure 7 shows the angular distribution of the beam when the long axis of the transducer (18.7 mm) lies in the plane of Fig. 4. The beam widths, calculated from a simple antenna model of± 19° and ± 10° are shown as dashed lines on Figs. 6 and 7. Although there is scatter in the data of Fig. 6, the small width of tbe aperture radiation pattern observed is in
15.25 em Wide Aluminum
transduction efficiency and radiation patterns of
reasonable agreement with theory. Figure 7 appears to show a narrower beam than predicted because of minima ate=± 6 degrees. A beam that is narrower than expected could be interpreted as arising from fringing eddy currents that extend beyond the limits of the wires in the EMAT. The directivity patterns of Fig. 6 and 7 demonstrate that the pulsed-magnet-EMAT system behaves qualitatively as expected from the point of view of a simple antenna model.
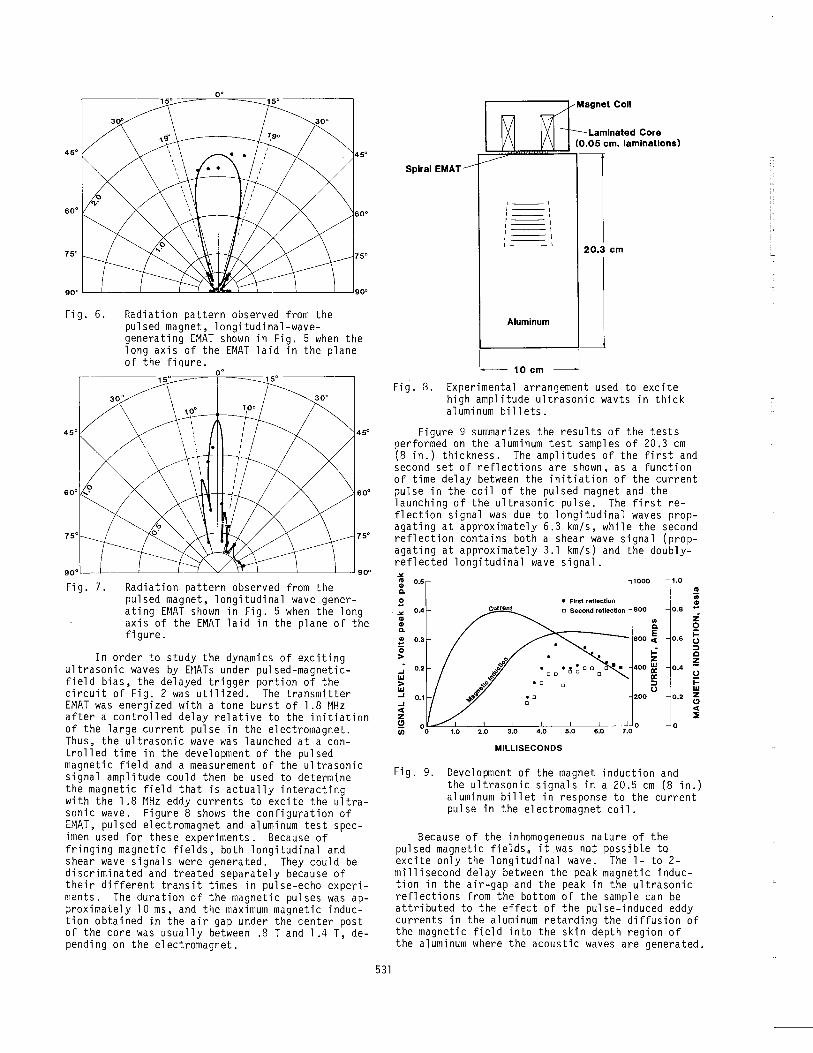
Fig. 6.
Fig. 7.
Radiation pattern observed from the pulsed magnet, longitudinal-wavegenerating EMAT shown in Fig. 5 when the long axis of the EMAT laid in the plane of the fiqure.
Radiation pattern observed from the pulsed magnet, longitudinal wave generating EMAT shown in Fig. 5 when the long axis of the EMAT laid in the plane of the figure.
In order to study the dynamics of exciting ultrasonic waves by a1ATs under pulsed-magneticfield bias, the delayed trigger portion of the circuit of Fig. 2 was utilized. The transmitter EMAT was energized with a tone burst of 1.8 MHz after a controlled delay relative to the initiation of the large current pulse in the electromagnet. Thus, the ultrasonic wave was launched at a controlled time in the development of the pulsed magnetic field and a measurement of the ultrasonic signal amplitude could then be used to determine the magnetic field that is actually interacting with the 1 .8 MHz eddy currents to excite the ultrasonic wave. Figure 8 shows the configuration of EMAT, pulsed electromagnet and aluminum test specimen used for these experiments. Because of fringing magnetic fields, both longitudinal and shear wave signals were generated. They could be discriminated and treated separately because of their different transit times in pulse-echo experiments. The duration of the magnetic pulses was ap~roximately 10 ms, and the maximum magnetic induction obtained in the air gap under the center post of the core was usually between .8 T and 1 .4 T, depending on the electromagnet.
531
Spiral EMAT
Laminated Core (0.05 em. laminations)
.....!=:!;il.=b:::!::::d..,"~~
1---1 , ___ , '---1 ~=====\ ,---1 ,---1 r ====== \
Aluminum
L 10em _j
20.3 em
Fig. 8. Experimental arrangement used to excite high amplitude ultrasonic wavts in thick aluminum billets.
Figure 9 summarizes the results of the tests performed on the aluminum test samples of 20.3 em (8 in.) thickness. The amplitudes of the first and second set of reflections are shown, as a function of time delay between the initiation of the current pulse in the coil of the pulsed magnet and the launching of the ultrasonic pulse. The first reflection signal was due to longitudinal waves propagating at approximately 6.3 km/s, while the second reflection contains both a shear wave signal (propagating at approximately 3.1 km/s) and the doublyreflected longitudinal wave signal . .., : 0.5 c. .2 ~ 0.4 .. ., c. !! 0.3
0 > ..J w > w ..J ..J c( z
• First reflection
o Second reflection
• 0
• 0 0
1000 1.0 .. a;
800 0.8 .!
"' ;i
c. 0
600 ~ 0.6 j: u
..: :J c z :!:
400 ~ 0.4 u a: j: :J
u w 200 0.2 z
(.') c(
:E 0 0
1.0 2.0 3.0 4.0 5.0 6.0 7.0 * ooLc~i-_ _L_~ __ L__i_ _ _L_~_
MILLISECONDS
Fig. 9. Development of the magnet induction and the ultrasonic signals in a 20.5 em (8 in.) aluminum billet in response to the current pulse in the electromagnet coil.
Because of the inhomogeneous nature of the pulsed magnetic fields. it was not possjble to excite only the longitudinal wave. The 1- to 2-millisecond delay between the peak magnetic induction in the air-gap and the peak in the ultrasonic reflections from the bottom of the sample can be attributed to the effect of the pulse-induced eddy currents in the aluminum retarding the diffusion of the magnetic field into the skin depth region of the aluminum where the acoustic waves are generated.
This delay cannot be explained in terms of the ultrasonic wave travel time because the round-trip transit time for longitudinal waves in a 20.3 em (8 in.) billet is only 64.5 microseconds.
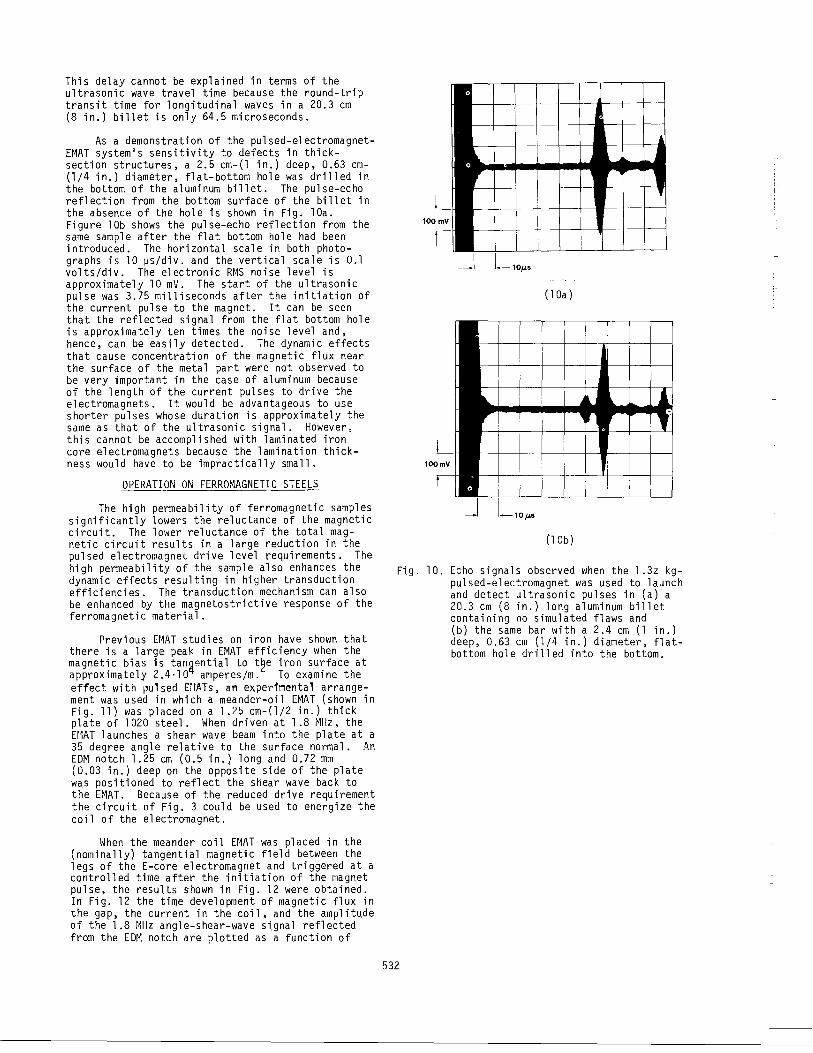
As a demonstration of the pulsed-electromagnetEMAT system's sensitivity to defects in thicksection structures, a 2.5 cm-(1 in.) deep, 0.63 cm(l/4 in.) diameter, flat-bottom hole was drilled in the bottom of the aluminum billet. The pulse-echo reflection from the bottom surface of the billet in the absence of the hole is shown in Fig. lOa. Figure lOb shows the pulse-echo reflection from the same sample after the flat bottom hole had been introduced. The horizontal scale in both photographs is 10 ~s/div. and the vertical scale is 0.1 volts/div. The electronic RMS noise level is approximately 10 mV. The start of the ultrasonic pulse was 3.75 milliseconds after the initiation of the current pulse to the magnet. It can be seen that the reflected signal from the flat bottom hole is approximately ten times the noise level and, hence, can be easily detected. The dynamic effects that cause concentration of the magnetic flux near the surface of the metal part were not observed to be very important in the case of aluminum because of the length of the current pulses to drive the electromagnets. It would be advantageous to use shorter pulses whose duration is approximately the same as that of the ultrasonic signal. However, this cannot be accomplished with laminated iron core electromagnets because the lamination thickness would have to be impractically small.
OPERATION ON FERROMAGNETIC STEELS
The high permeability of ferromagnetic samples significantly lowers the reluctance of the magnetic circuit. The lower reluctance of the total magnetic circuit results in a large reduction in the pulsed electromagnet drive level requirements. The high permeability of the sample also enhances the dynamic effects resulting in higher transduction efficiencies. The transduction mechanism can also be enhanced by tile magnetostrictive response of the ferromagnetic material.
Previous EMAT studies on iron have shown that there is a large peak in EMAT efficiency when the magnetic bias is tana~ntial to t~e iron surface at approximately 2.4·10 amperes/m. To exQmine the effect with pulsed EitATs, an experimental- arrangement was used in which a meander-oil EMAT (shown in Fig. 11) was placed on a 1.25 cm-(l/2 in.) thick plate of 1020 steel. When driven at 1.8 MHz, the EMAT launches a shear wave beam into the plate at a 35 degree angle relative to the surface normal. An EDM notch 1.25 em (0.5 in.) long and 0.72 mm (0.03 in.) deep on the opposite side of the plate was positioned to reflect the shear wave back to the EMAT. Because of the reduced drive requirement the circuit of Fig. 3 could be used to energize the coil of the electromagnet.
\~hen the meander coil E~1AT was placed in the (nominally) tangential magnetic field between the legs of the E-core electromagnet and triggered at a controlled time after the initiation of the magnet pulse, the results shown in Fig. 12 were obtained. In Fig. 12 the time development of magnetic flux in the gap, the current in the coil, and the amplitude of the 1.8 1·1Hz angle-shear-wave signal reflected from the EDM notch are plotted as a function of
( 1 Oa)
10JLS
(1 Db)
Fig. 10. Echo signals observed when the 1.3z kgpulsed-electromagnet was used to launch and detect ultrasonic pulses in (a) a 20.3 em (8 in.) long aluminum billet containing no simulated flaws and
532
(b) the same bar with a 2.4 em (1 in.) deep, 0.63 em (1/4 in.) diameter, flatbottom hole drilled into the bottom.
2.5
3.8
'---tt-'--' '-- '---NOTE:
All dimensions In em
'---
LJ_0.4
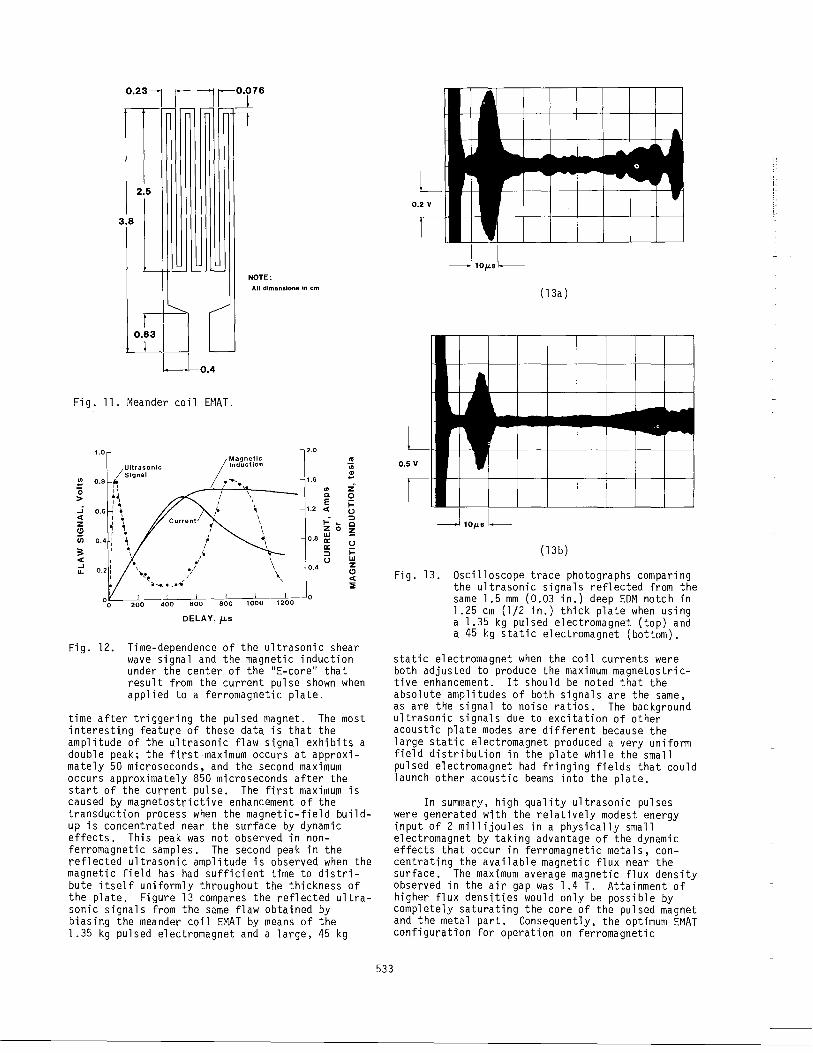
Fig. 11. Meander coil EMAT.
1.0 2.0 /Magnetic "' /Ultrasonic Induction iii
en Signal
1.6 ! 0.8 1': .............
£ 0 ,, I '
en > •• I ' c. 0
I I I I E i= _; ' . I.
I 1.2 <( • ' u <( • I ..: ::::> z
•• • 0 c (.!) I z ~ Ui I I 0.8 UJ • a:
' I a: u :: • i= I It, ::::> <( .. I
I u UJ ..J
/•/ I 0.4 z u..
·~~ • (.!)
' <(
ill--~-- .... ::;;
200 400 600 BOO 1000 1200
DELAY, fLS
Fig. 12. Time-dependence of the ultrasonic shear wave signal and the magnetic induction under the center of the "E-core" that result from the current pulse shown when applied to a ferromagnetic plate.
time after triggering the pulsed magnet. The most interesting feature of these data is that the amplitude of the ultrasonic flaw signal exhibits a double peak; the first-maximum occurs at approximately 50 microseconds, and the second maximum occurs approximately 850 microseconds after the start of the current pulse. The first maximum is caused by magnetostrictive enhancement of the transduction process when the magnetic-field buildup is concentrated near the surface by dynamic effects. This peak was not observed in nonferromagnetic samples. The second peak in the reflected ultrasonic amplitude is observed when the magnetic field has had sufficient time to distribute itself uniformly throughout tne thickness of the plate. Figure 13 compares the reflected ultrasonic signals from the same flaw obtained by biasing the meander coil EMAT by means of the 1 .35 kg pulsed electromagnet and a large, 45 kg
533
( 13a)
10p.s~--(13b)
Fig. 13. Oscilloscope trace photographs comparing the ultrasonic signals reflected from the same 1.5 mm (0.03 in.) deep EDM notch in 1.25 em (1/2 in.) thick plate when using a 1.35 kg pulsed electromagnet (top) and a 45 kg static electromagnet (bottom).
static electromagnet when the coil currents were both adjusted to produce the maximum magnetostrictive enhancement. It should be noted that the absolute amplitudes of both signals are the same, as are the signal to noise ratios. The background ultrasonic signals due to excitation of other acoustic plate modes are different because the large static electromagnet produced a very uniform field distribution in the plate while the small pulsed electromagnet had fringing fields that could launch other acoustic beams into the plate.
In summary, high quality ultrasonic pulses were generated with the relatively modest energy input of 2 millijoules in a physically small electromagnet by taking advantage of the dynamic effects that occur in ferromagnetic metals, concentrating the available magnetic flux near the surface. The maximum average magnetic flux density observed in the air gap was 1.4 T. Attainment of higher flux densities would only be possible by completely saturating the core of the pulsed magnet and the metal part. Consequently, the optimum EMAT configuration for operation on ferromagnetic
1oaterials should take advantage of the tangential magnetic field bias and magnetostrictive signal enhancement. This configuration also results in minimum pulsed-electromagnet-drive-current requirement.
OPERATION AT ELEVATED TEMPERATURES
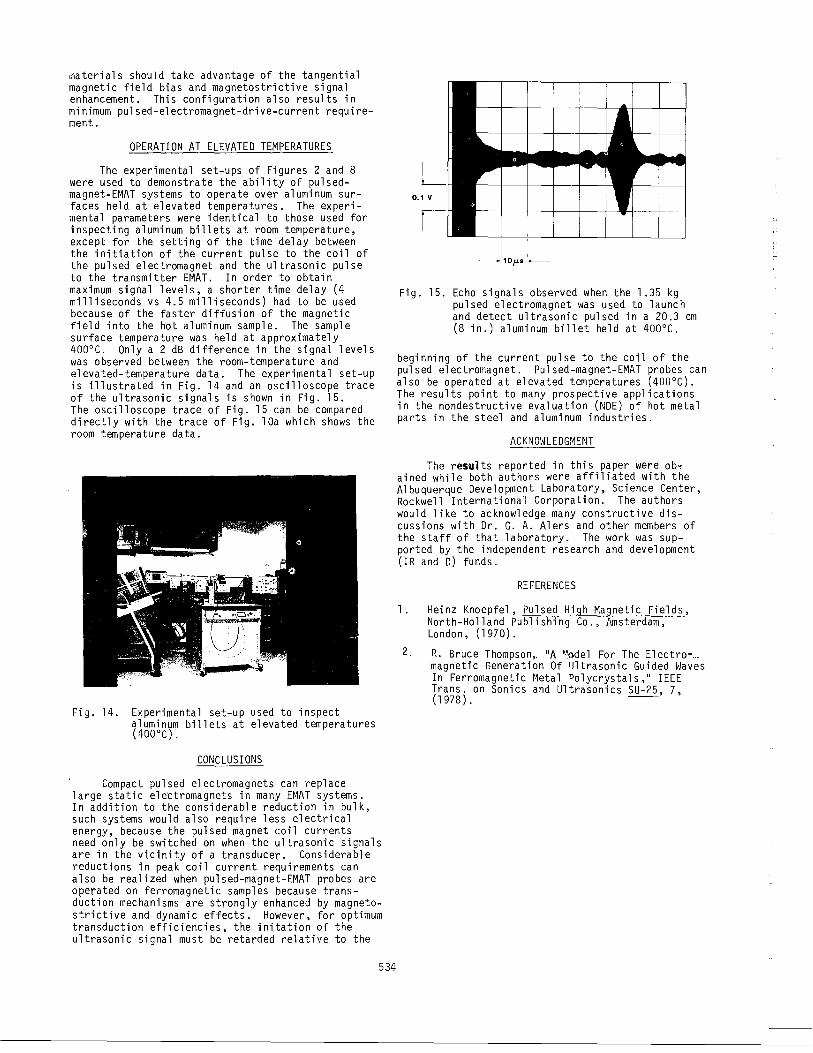
The experimental set-ups of Figures 2 and 8 were used to demonstrate the ability of pulsedmagnet-EMAT systems to operate over aluminum surfaces held at elevated temperatures. The experimental parameters were identical to those used for inspecting aluminum billets at room temperature, except for the setting of the time delay between the initiation of the current pulse to the coil of the pulsed electromagnet and the ultrasonic pulse to the transmitter EMAT. In order to obtain maximum signal levels, a shorter time delay (4 milliseconds vs 4.5 milliseconds) had to be used because of the faster diffusion of the magnetic field into the hot aluminum sample. The sample surface temperature was held at approximately 400°C. Only a 2 dB difference in the signal levels was observed between the room-temperature and elevated-temperature data. The experimental set-up is illustrated in Fig. 14 and an oscilloscope trace of the ultrasonic signals is shown in Fig. 15. The oscilloscope trace of Fig. 15 can be compared directly with the trace of Fig. lOa which shows the room temperature data.
Fig. 14. Experimental set-up used to inspect aluminum billets at elevated temperatures (400°C).
CONCLUSIONS
Compact pulsed electromagnets can replace large static electromagnets in many EMAT systems. In addition to the considerable reduction in bulk, such systems would also require less electrical energy, because the pulsed magnet coil currents need only be switched on when the ultrasonic signals are in the vicinity of a transducer. Considerable reductions in peak coil current requirements can also be realized when pulsed-magnet-EMAT probes are operated on ferromagnetic samples because transduction mechanisms are strongly enhanced by magnetostrictive and dynamic effects. However, for optimum transduction efficiencies, the initatfon of the ultrasonic signal must be retarded relative to the
534
Fig. 15. Echo signals observed when the 1.35 kg pulsed electromagnet was used to launch and detect ultrasonic pulsed in a 20.3 em (8 in.) aluminum billet held at 400°C.
beginning of the current pulse to the coil of the pulsed electromagnet. Pulsed-magnet-EMAT probes can also be operated at elevated temperatures (400°C). The results point to many prospective applications in the nondestructive evaluation (NDE) of hot metal parts in the steel and aluminum industries.
ACKNOWLEDGMENT
The results reported in this paper were ob~ ained while both authors were affiliated with the Albuquerque Development Laboratory, Science Center, Rockwell International Corporation. The authors would like to acknowledge many constructive discussions with Dr. G. A. Alers and other members of the staff of that laboratory. The work was supported by the independent research and development (IR and D) funds.
REFERENCES
1. Heinz Knoepfel, Pulsed High Magnetic Fields, North-Ho 11 and Pub 1 i shi ng Co., Amsterdam, London, (1970).
2. R. Bruce Thompson,. ~A ~odel For The Electro~. magnetic Generation Of Ultrasonic Guided Waves In Ferromagnetic Metal Polycrystals," IEEE Trans. on Sonics and Ultrasonics SU-25 7 (1978). __ , ,
INSPECTION OF WING LAP JOINTS FOR SECOND LAYER CRACKS WITH EMATS
J. F. Martin, P. J. Hodgetts, and R. B. Thompson Rockwell International Science Center
Thousand Oaks, California 91360
ABSTRACT
The detection of laboratory grown fatigue cracks in the second layer of aircraft wing lap joint fastener holes is demonstrated with EMATs (electromagnetic acoustic transducers). Operating at a 200 kHz central frequency, the EMATs employ acoustic waves in reflection and transmission to measure the presence of both fatigue cracks and loose fasteners. A minicomputer-based data acquisition and analysis system acquires, gates, apodizes and Fourier transforms each received time waveform. The resulting spectra are then compared to the spectra of uncracked holes with tight fasteners to determine the presence of a crack or loose fastener. A method for distinguishing the difference between a crack and a loose fastener is demonstrated. A suggested design for a fieldable instrument capable of the same abilities is presented.
INTRODUCTION
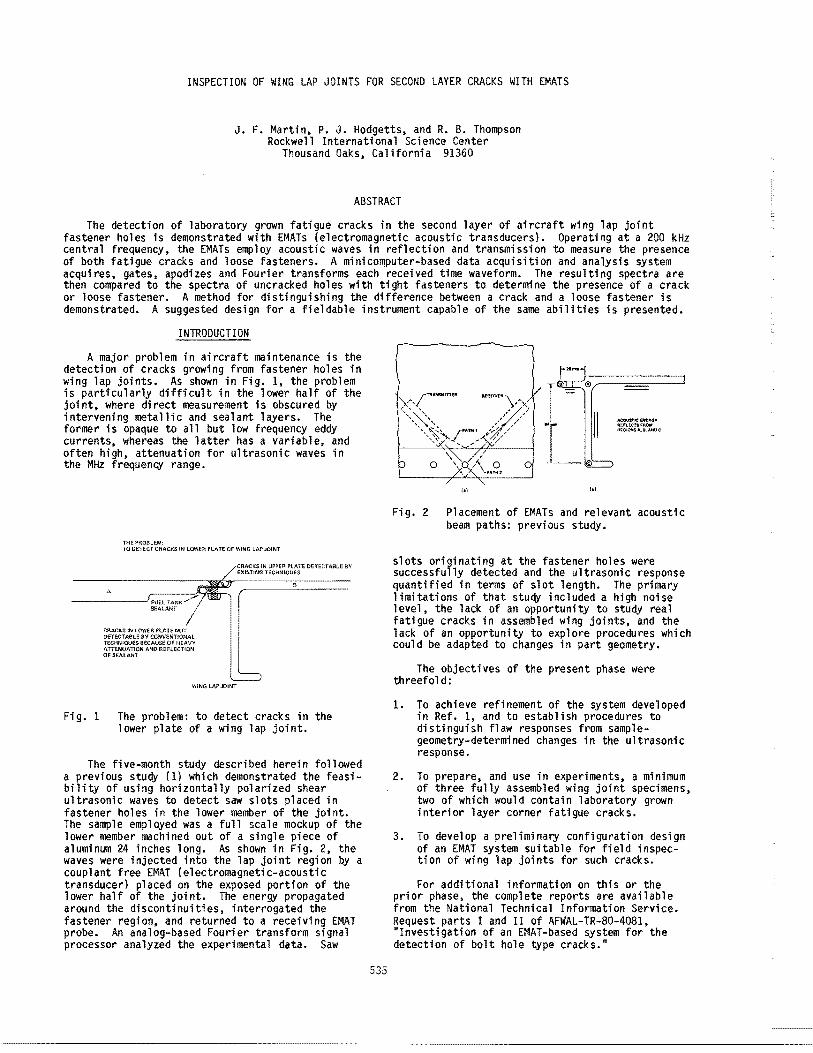
A major problem in aircraft maintenance is the detection of cracks growing from fastener holes in wing lap joints. As shown in Fig. 1, the problem is particularly difficult in the lower half of the joint, where direct measurement is obscured by intervening metallic and sealant layers. The former is opaque to all but low frequency edqy currents, whereas the latter has a variable, and often high, attenuation for ultrasonic waves in the MHz frequenc,y range.
LOWER PLATE OF WING LAP JOINT
CRACKS lN lOWER ?lATE NOT DETECT ABlE BY CONVENTIONAL TECHNIQUES BECAUSE OF HEAVY ATTENUATION AND REFLECTION OF SEALANT.
WING LAP JOINT
CfiACKS IN UPPER PLATE DETECTABLE BY EXISTING TECHNIQUES
Fig. 1 The problem: to detect cracks in the lower plate of a wing lap joint.
The five-month stuqy described herein followed a previous stuqy (1) which demonstrated the feasibility of using horizontally polarized shear ultrasonic waves to detect saw slots placed in fastener holes in the lower member of the joint. The sample employed was a full scale mockup of the lower member machined out of a single piece of aluminum 24 inches long. As shown in Fig. 2, the waves were injected into the lap joint region by a couplant free EMAT (electromagnetic-acoustic transducer) placed on the exposed portion of the lower half of the joint. The energy propagated around the discontinuities, interrogated the fastener region, and returned to a receiving EMAT probe. An analog-based Fourier transform signal processor analyzed the experimental data. Saw
535
,,,
~IHEIUJ¥ l'llifl.tC'tlfMOM! R(QIQH$A,9,ANOC
Fig. 2 Placement of EMATs and relevant acoustic beam paths: previous study.
slots originating at the fastener holes were successfully detected and the ultrasonic response quantified in terms of slot length. The primary limitations of that study included a high noise 1 eve 1 , the 1 ack of an opportunity to study rea 1 fatigue cracks in assembled wing joints, and the lack of an opportunity to explore procedures which could be adapted to changes in part geometry.
The objectives of the present phase were threefold:
1. To achieve refinement of the system developed in Ref. 1, and to establish procedures to distinguish flaw responses from samplegeometry-determined changes in the ultrasonic response.
2. To prepare, and use in experiments, a minimum of three fully assembled wing joint specimens, two of which would contain laboratory grown interior layer corner fatigue cracks.
3. To develop a preliminary configuration design of an EMAT system suitable for field inspection of wing lap joints for such cracks.
For additional information on this or the prior phase, the complete reports are available from the National Technical Information Service. Request parts I and II of AFWAL-TR-80-4081, "Investigation of an EMAT-based system for the detection of bolt hole type cracks."
APPROACH
A. Summary
In order to achieve the above objectives, the following program was conducted. First, the previously used apparatus was modified in several ways to improve the quality and reproducibility of the experimental data. These included changes in probe design, probe positioning hardware, and signal processing techniques.
In order to verify that the new apparatus was functioning properly and represented an improved capability, a series of experiments were performed on the unassembled mock-up sample used in the previous study. The successful results represented a completion of the first half of objective 1.
A set of four, fully assembled samples were then constructed and assembled to evaluate the technique. Two contained 0.030 in. (.076 em) and 0.100 in. (0.254 em) corner fatigue cracks in the lower half of the lap joint, grown in a laboratory MTS load-cycling machine under tension-tension fatigue conditions. These two samples lacked the stiffening rib to obtain fabrication savings. A third sample was a section of an actual wing lap joint in which corner EDM notches of the same dimensions had been placed. The fourth was the previously used mock-up, now fully assembled for the first time, which contained saw slots of various lengths.
Experiments were then performed on the assembled samples. The results indicated that the spectral differences between the cracked and uncracked holes were reduced upon assembly to a level which would be difficult to reliably detect. Hence, some recent developments in acoustic theory were applied in order to gain a deeper understanding of the problem. The result of that effort pointed toward some new experiments which proved to be more successful in this problem.
A number of results on the slotted samples and cracked samples are described in detail in Ref. 1. However, the most significant finding is that the 0.100 in (0.254 em) fatigue crack and radial EDM notches were reliably detected using several different techniques, completing the performance of objective 2. The 0.030 in. (0.076 em) fatigue crack was also detected, but with lower reliability. Further work is needed for this size of flaw before reduction to practice can be seriously contemplated. In addition, a technique was also defined which allowed the same procedure to be applied to samples of different geometry. This represents a partial attainment of the second half of objective 1. However, some more work is required before a completely unambiguous technique for differentiating flaws from geometrical responses is attained. Finally, going beyond the initial objectives, a technique was found for identifying loose fasteners.
Based on these results, a preliminary configuration design and inspection procedure have been prepared, completing the performance of objective 3. These are reported on briefly in Section IV. In the AFWAL reports mentioned above, a proposed program to reduce this technique to practice, using the cited configuration and procedure, is presented.
536
B. System Refinement
The system was first refined to improve the quality and reproducibility of the experimental data. Included therein were three major changes. First, the central operating frequency was lowered from 250 kHz to 200 kHz. This placed the operating point further below that point at which higher order modes of the lap joint plate would propagate and produce interfering signals (see Appendix of Ref. 1). It also was designed to place the interference null, used in the previous study for flaw detection and sizing, at the center of the transducer passband rather than at its edge (for the geometry of the original mock-up sample). Second, an improved positioning apparatus was constructed to allow higher quality data to be attained at multiple angles. This was needed for studies aimed at separating flaw from geometric responses. Finally, a digital signal processing system was employed which elfmi nated the previously observed fluctuations in system outputs, produced a higher signal-to-noise ratio through signal averaging, and allowed much greater flexibility in data analysis.
1. Probes - Four EMATs (electromagneticacoustic transducers) were fabricated to generate or receive ultrasonic horizontally polarized shear waves in aluminum, propagating at a grazing angle to the surface. These were implemented as one transmitter and three receivers. Appropriate analog electronic circuits were constructed for the generation of a 5-cycle tone burst and the amplification of the received signal.
2. Probe Positioning- Two new goniometers were constructed, one of plastic and one of brass/ aluminum. These were used to accurately and repeatably position the probes with respect to the fastener holes and lap joint. The brass device was designed for more precise control of the angles (±17 mr) and positions (±0.5 mm) of the EMATs. The plastic device was used as a prototype of a hand-held fixture such as might be used in the field.
3. Signal Processing- Using these goniometers, three transmitter-receiver configurations were employed in the program (Fig. 3). The ultrasonic results from each of these varied as a function of angles a, a, and y. Data was analyzed on a digital signal processing system consisting of a Data General S200 minicomputer-Biomation 8100 combination operating under the control of the Interpretive Signal Processing (ISP} Program. This system was created at the Science Center and is unique in the field of NDE. ISP is a large multitasking program which runs on the S200 under the command of an external terminal. It is tailored for flexible data collection and signal processing applications and capable of over 40 distinct operations including several for graphics. It was designed and developed at the Science Center and is constantly being upgraded for new NDE applications.
C. Fabrication of Samples
Four samples were utilized in experiments reported here and are described in Ref. 1 in detail. A large fraction of the fabrication effort was performed at another division of Rockwell, the North American Aircraft Division
SC79-6897 TRANSMITTER
BOTTOM LAP SECTION
END OF TOP LAP
'\ ~ J'"'"'' ~-+-~----"-I mm \_END OF BOTTOM LAP
.Ij
0 0
1:=======
I
r I
TOP LAP SECTION -~-RECEIVER
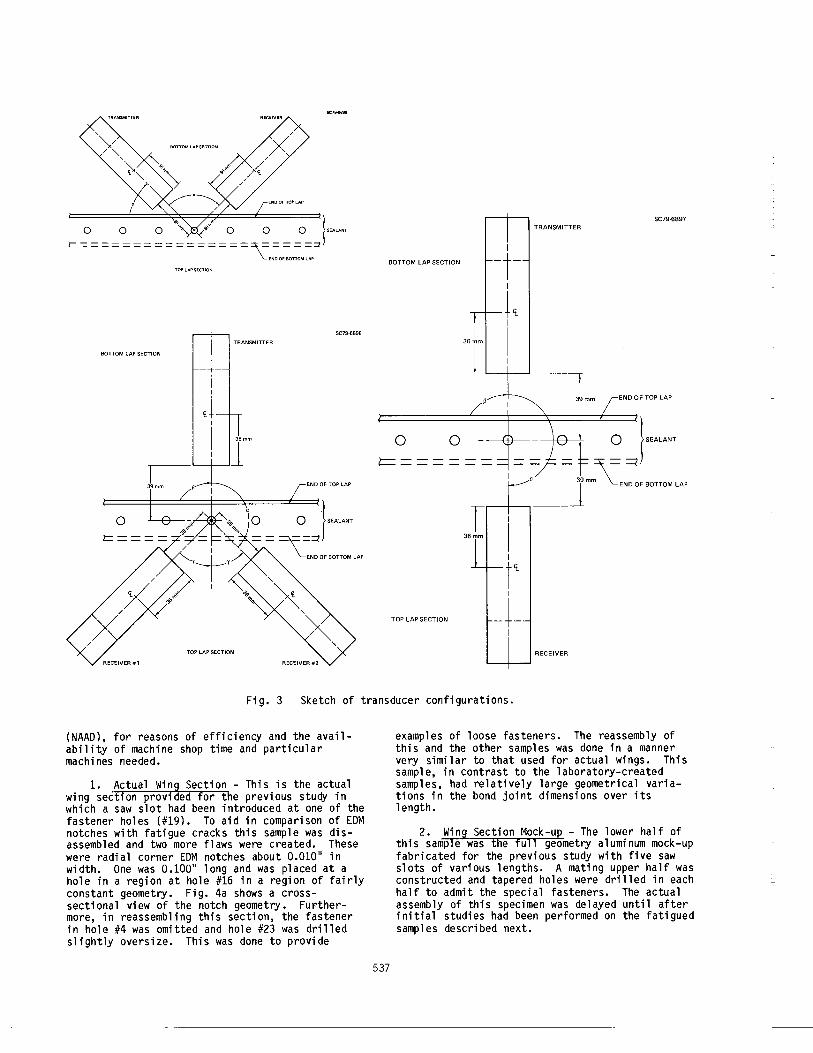
Fig. 3 Sketch of transducer configurations.
(NAAD), for reasons of efficiency and the availability of machine shop time and particular machines needed.
1. Actual Win~ Section - This is the actual wing section prov1 ed for the previous study in which a saw slot had been introduced at one of the fastener holes (#19). To aid in comparison of EDM notches with fatigue cracks this sample was disassembled and two more flaws were created. These were radial corner EDM notches about 0.010" in width. One was 0.100" long and was placed at a hole in a region at hole #16 in a region of fairly constant geometry. Fig. 4a shows a crosssectional view of the notch geometry. Furthermore, in reassembling this section, the fastener in hole #4 was omitted and hole #23 was drilled slightly oversize. This was done to provide
537
examples of loose fasteners. The reassembly of this and the other samples was done in a manner very similar to that used for actual wings. This sample, in contrast to the laboratory-created samples, had relatively large geometrical variations in the bond joint dimensions over its length.
2. Wing Section Mock-up - The lower half of this sample was the full geometry aluminum mock-up fabricated for the previous study with five saw slots of various lengths. A mating upper half was constructed and tapered holes were drilled in each half to admit the special fasteners. The actual assembly of this specimen was delayed until after initial studies had been performed on the fatigued samples described next.
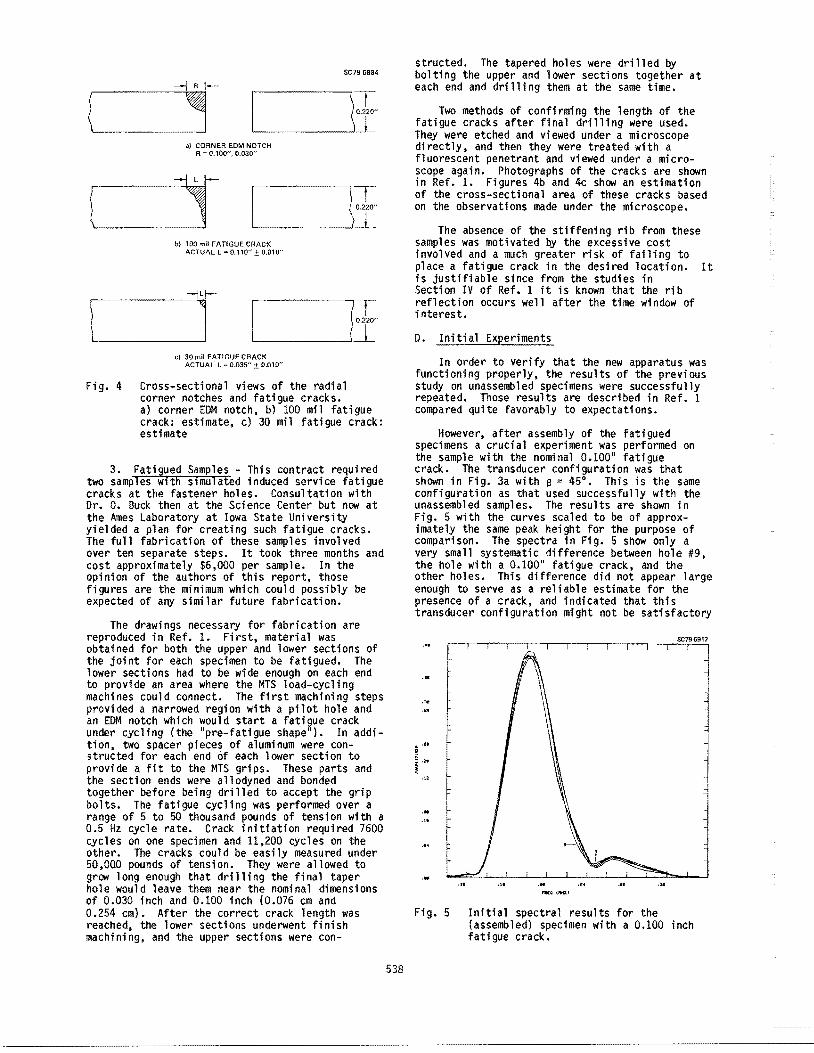
a) CORNER EDM NOTCH R = 0.100", 0.030"
b) 100 mil FATIGUE CRACK ACTUAL L = 0. 110" 0.010"
c) 30 mil FATIGUE CRACK ACTUAL L = 0,035" ± 0.010"
SC79·6884
Fig. 4 Cross-sectional views of the radial corner notches and fatigue cracks. a} corner EDM notch, b} 100 mil fatigue crack: estimate, c) 30 mil fatigue crack: estimate
3. Fatigued Samples - This contract required two samples with simulated induced service fatigue cracks at the fastener holes. Consultation with Dr. o. Buck then at the Science Center but now at the Ames Laboratory at Iowa State University yielded a plan for creating such fatigue cracks. The full fabrication of these samples involved over ten separate steps. It took three months and cost approximately $6,000 per sample. In the opinion of the authors of this report, those figures are the minimum which could possibly be expected of any similar future fabrication.
The drawings necessary for fabrication are reproduced in Ref. 1. First, material was obtained for both the upper and lower sections of the joint for each specimen to be fatigued. The lower sections had to be wide enough on each end to provide an area where the MTS load-cycling machines could connect. The first machining steps provided a narrowed region with a pilot hole and an EDM notch which would start a fatigue crack under cycling (the "pre-fatigue shape"}. In addition, two spacer pieces of aluminum were constructed for each end of each lower section to provide a fit to the MTS grips. These parts and the section ends were allodyned and bonded together before being drilled to accept the grip bolts. The fatigue cycling was performed over a range of 5 to 50 thousand pounds of tension with a 0.5 Hz cycle rate. Crack initiation required 7600 cycles on one specimen and 11,200 cycles on the other. The cracks could be easily measured under 50,000 pounds of tension. They were allowed to grow long enough that drilling the final taper hole would leave them near the nominal dimensions of 0.030 inch and 0.100 inch (0.076 em and 0.254 em}. After the correct crack length was reached, the lower sections underwent finish machining, and the upper sections were con-
538
structed. The tapered holes were drilled by bolting the upper and lower sections together at each end and drilling them at the same time.
Two methods of confirming the length of the fatigue cracks after final drilling were used. They were etched and viewed under a microscope directly, and then they were treated with a fluorescent penetrant and viewed under a microscope again. Photographs of the cracks are shown in Ref. 1. Figures 4b and 4c show an estimation of the cross-sectional area of these cracks based on the observations made under the microscope.
The absence of the stiffening rib from these samples was motivated by the excessive cost involved and a much greater risk of failing to place a fatigue crack in the desired location. It is justifiable since from the studies in Section IV of Ref. 1 it is known that the rib reflection occurs well after the time window of interest.
D. Initial Experiments
In order to verify that the new apparatus was functioning properly, the results of the previous study on unassembled specimens were successfully repeated. Those results are described in Ref. 1 compared quite favorably to expectations.
However, after assembly of the fatigued specimens a crucial experiment was performed on the sample with the nominal 0.100" fatigue crack. The transducer configuration was that shown in Fig. 3a with s = 45°. This is the same configuration as that used successfully with the unassembled samples. The results are shown in Fig. 5 with the curves scaled to be of approximately the same peak height for the purpose of comparison. The spectra in Fig. 5 show only a very small systematic difference between hole #9, the hole with a 0.100" fatigue crack, and the other holes. This difference did not appear large enough to serve as a reliable estimate for the presence of a crack, and indicated that this transducer configuration might not be satisfactory
SC79-6917
Fig. 5 Initial spectral results for the (assembled) specimen with a 0.100 inch fatigue crack.
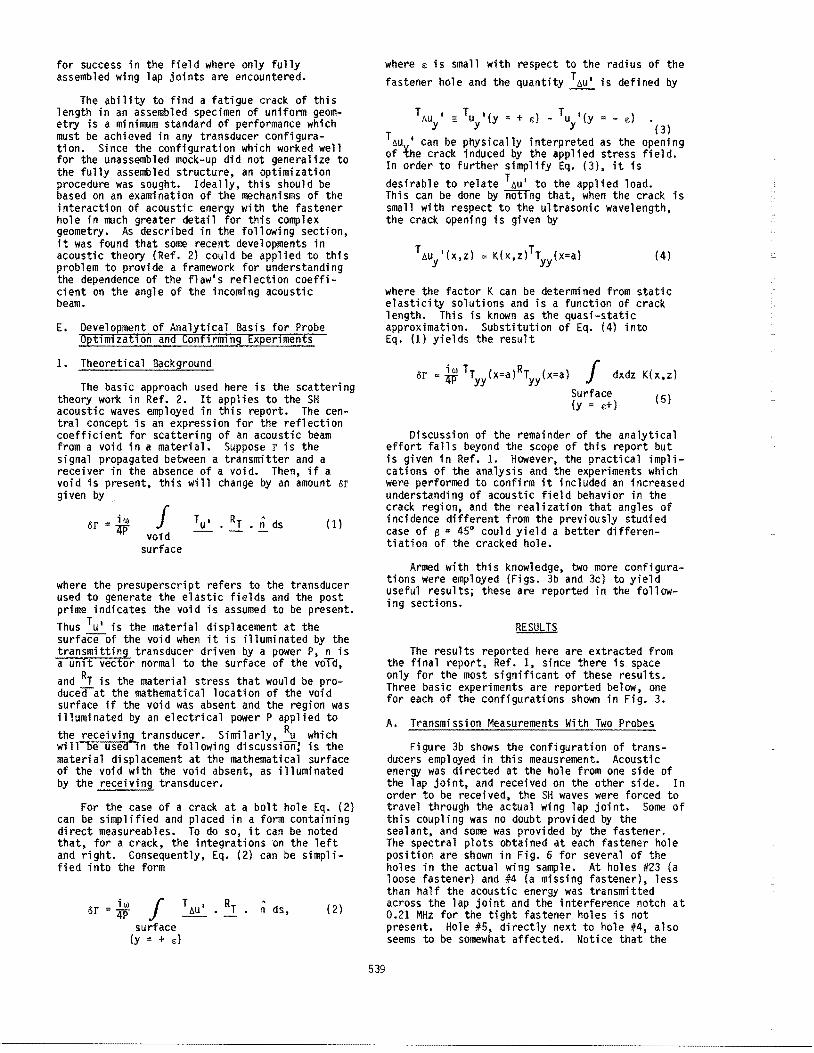
for success in the field where only fully assembled wing lap joints are encountered.
The ability to find a fatigue crack of this length in an assembled specimen of uniform geometry is a minimum standard of performance which must be achieved in any transducer configuration. Since the configuration which worked well for the unassembled mock-up did not generalize to the fully assembled structure, an optimization procedure was sought. Ideally, this should be based on an examination of the mechanisms of the interaction of acoustic energy with the fastener hole in much greater detail for this complex geometry. As described in the following section, it was found that some recent developments in acoustic theory (Ref. 2} could be applied to this problem to provide a framework for understanding the dependence of the flaw's reflection coefficient on the angle of the incoming acoustic beam.
E. Development of Analytical Basis for Probe Opt1mization and Confirming Experiments
1. Theoretical Background
The basic approach used here is the scattering theory work in Ref. 2. It applies to the SH acoustic waves employed in this report. The central concept is an expression for the reflection coefficient for scattering of an acoustic beam from a void in a material. Suppose r is the signal propagated between a transmitter and a receiver in the absence of a void. Then, if a void is present, this will change by an amount or given by
or=~ J void
surface
I • RT • n ds (1}
where the presuperscript refers to the transducer used to generate the elastic fields and the post prime indicates the void i.s assumed to be present, Thus Tu 1 is the material displacement at the surface-of the void when it is illuminated by the transmitting transducer driven by a power P, n is a unit vector normal to the surface of the volld, and RT is the material stress that would be producecr-at the mathematical location of the void surface if the void was absent and the region was illuminated by an electrical power P applied to the receiving transducer. Similarly, Ru which will be used 1n the following discussion: is the material displacement at the mathematical surface of the void with the void absent, as illuminated by the receiving transducer.
For the case of a crack at a bolt hole Eq. (2} can be simplified and placed in a form containing direct measureables. To do so, it can be noted that, for a crack, the integrations on the left and right. Consequently, Eq. (2} can be simplified into the form
or = !P J T flU 1
• RT surface
(y = + e:}
n ds, ( 2}
539
where e: is small with respect to the radius of the fastener hole and the quantity T flU 1 is defined by
T liU I T u I (y = + e:) - T u I (y - e:} y y y (3}
T t.u 1 can be physically interpreted as the opening of the crack induced by the applied stress field. In order to further simplify Eq. (3}, it is desirable to relate Tt.u' to the applied load. This can be done by ~ng that, when the crack is small with respect to the ultrasonic wavelength, the crack opening is given by
(4}
where the factor K can be determined from static elasticity solutions and is a function of crack length. This is known as the quasi-static approximation. Substitution of Eq. (4) into Eq. (1} yields the result
or " fro TT (x=a)RT (x=a} j dxdz K(x,z} iW yy yy Surface (y e:+) (5}
Discussion of the remainder of the analytical effort falls beyond the scope of this report but is given in Ref. 1. However, the practical implications of the analysis and the experiments which were performed to confirm it included an increased understanding of acoustic field behavior in the crack region, and the rea 1 i zati on that angles of incidence different from the previously studied case of ~ = 45° could yield a better differentiation of the cracked hole.
Armed with this knowledge, two more configurations were employed (Figs. 3b and 3c} to yield useful results; these are reported in the following sections.
RESULTS
The results reported here are extracted from the final report, Ref. 1, since there is space only for the most significant of these results. Three basic experiments are reported below, one for each of the configurations shown in Fig. 3.
A. Transmission Measurements With Two Probes
Figure 3b shows the configuration of transducers employed in this meausrement. Acoustic energy was directed at the hole from one side of the lap joint, and received on the other side. In order to be received, the SH waves were forced to travel through the actual wing lap joint. Some of this coupling was no doubt provided by the sealant, and some was provided by the fastener. The spectral plots obtained at each fastener hole position are shown in Fig. 6 for several of the holes in the actual wing sample. At holes #23 (a loose fastener} and #4 (a missing fastener), less than half the acoustic energy was transmitted across the lap joint and the interference notch at 0.21 MHz for the tight fastener holes is not present. Hole #5, directly next to hole #4, also seems to be somewhat affected. Notice that the

C,! •••
Fig. 6 Amplitude versus frequency for transducer configuration of Fig. 3b - actual wing sample.
effect of a loose fastener in this configuration was much larger than the effect of any notch or slot (included in the tight fastener set) and was not strongly influenced by the geometrical variations in this sample, which were rather large (see Ref. 1). This technique was used on the mockup wing section, where some fasteners were also 1 oosened, with equa 1 ly good results. Thus it appears that this transducer configuration would be likely to yield a capability for discovering loose fasteners in a large variety of wing lap geometries. Since for a loose fastener the amount of acoustic energy transmitted is strongly damped and the interference notch is eliminated, the signature for a loose fastener should be correspondingly easy to recognize.
B. Three-Probe Measurements
A second set of experiments employed the transducer configuration shown in Fig. 5c. This was motivated by the need to find a configuration which would be less sensitive to the geometry of the wing lap joint than those previously studied. Motivated partly by the theoretical analysis, the signal from one of the two receiver transducers was subtracted from the other and the frequency spectrum of the result found.
It might initially be thought that this difference would vanish for a crack normal to the plate edge by symmetry. However, close examination shows that for shear waves, the two receiver positions are not equivalent since the transducer polarization defines a preferred direction. Moreover, it can be intuitively argued that the degree of this difference is a measure of crack size.
In order to obtain a reproducible spectrum, extreme care was necessary in the alignment of the receiver signals. This is because the difference signal is generally quite small, and it is sensitive to any errors in transducer positioning as well as to the presence of a crack. In general,
540
features in frequency space would not repeat from one data collection to another unless the signal alignment was better than 1% of the period. This tolerance was met using a simple loop feature of ISP to replot the signals from each transducer until the correct mechanical location was secured. Figure 7 exhibits the results for the 0.100 in. fatigue crack. The cracked hole is #9 and displays a significantly different signature from the other non-cracked holes.
SC79-6919
JU ~ ,~ .~1?~~~~.~16~------.~2~0---====.2=4==~==~.2-8--~
:o1 ~~ .~12~~---.=1~6------~.2~0-------.2-4-=~===.-28--~
FREQ <MHZ l
I Jl ~i ---===========--0.~00:--,~~iH~ .12 .16 .20 .24 .28
:UI~ .12 .16 .20 .24 .28
JU , ~ .12 .16 .20 .24 .28
FREQ <MHZl
Fig. 7 Amplitude versus frequency for transducer configuration of Fig. 3c - sample with 0.100 inch crack.
The signature appears as a significantly depressed spectrum, as if constructive interference is occurring over the whole frequency range as well as at 200 kHz. A similar result, although not as large, was obtained in the sample with a 0.030 inch crack. Applied to the actual wing section, the phenomenon of a depression or notch at 200 kHz was again correlated with the hole being flawed. However, this technique did not work on the full aluminum mockup with saw slots. This was due to the fact that the fraction of transmitted acoustic energy was three times smaller than in the other samples. The resulting signal to noise ratio was too small and the noise destroyed the capability of this configuration to find the saw slots. The short length of time left in the contract did not permit any investigation of the reasons for the loss of transmission in this sample. Therefore, the efficacy of this method and this transducer configuration must be left as an open question. It is possible that each geometry has its own particular signature for non-cracked holes and that signature would have to be established before cracked holes could be identified. Nevertheless, the success this configuration exhibited with the range of geometrical variation in the first three samples is striking, and it may be the most likely starting point for future investigations.
A final comment is that the configuration 3c is probably sensitive to the quality of the seal at the fastener hole being interrograted. This should be kept in mind when assessing the usefulness of this configuration.
c. Reflection Experiments - Two Probes
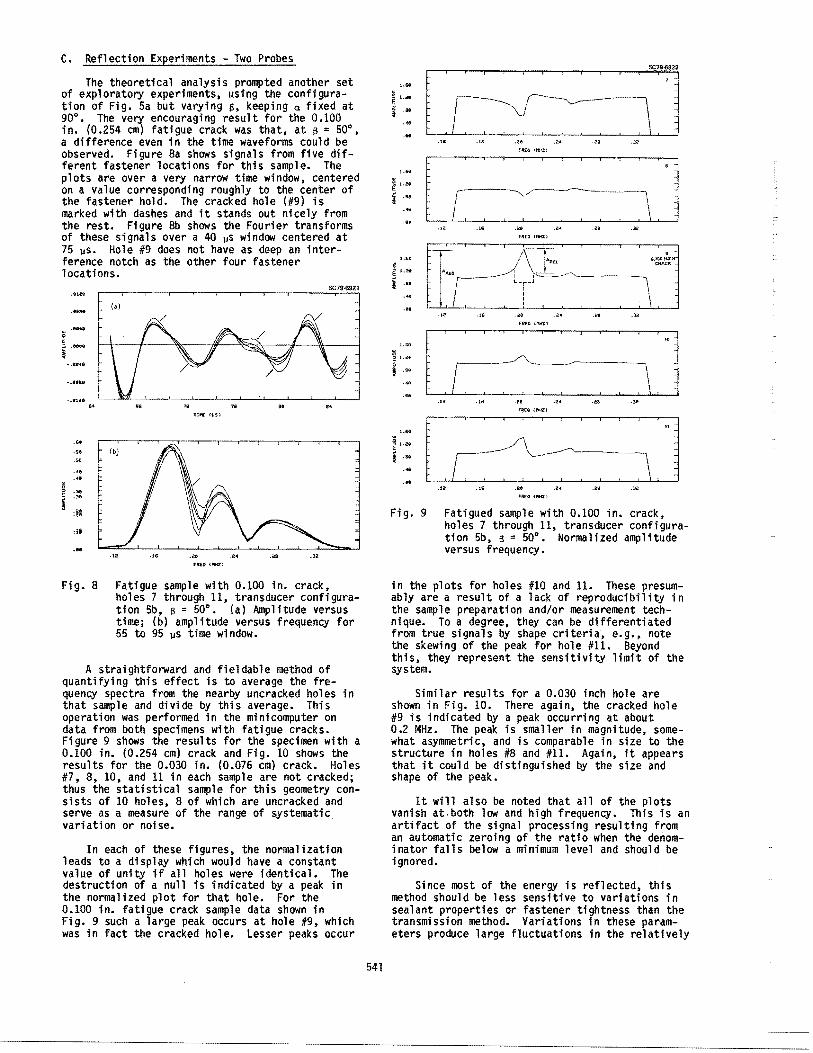
The theoretical analysis prompted another set of exploratorY experiments, using the configuration of Fig. 5a but varying e. keeping a fixed at 90°. The verY encouraging result for the 0.100 in. (0.254 em) fatigue crack was that, at e = 50°. a difference even in the time waveforms could be observed. Figure Sa shows signals from five different fastener locations for this sample. The plots are over a very narrow time window, centered on a value corresponding roughly to the center of the fastener hold. The cracked hole (#9) is marked with dashes and it stands out nicely from the rest. Figure 8b shows the Fourier transforms of these signals over a 40 ~s window centered at 75 ~s. Hole #9 does not have as deep an interference notch as the other four fastener locations.
SC79·6921
l• I
• 9040
~ j .Mail
~.01)4&
-.eese
.. .. 76 .. .. TU£ HJSl
...
... ... ~ ... ~
_,.
Jl
,u
Fig. 8 Fatigue sample with 0.100 in. crack, holes 7 through 11, transducer configuration 5b, fl = 50°. !a) Amplitude versus time; {b) amplitude versus frequency for 55 to 95 ~s time window.
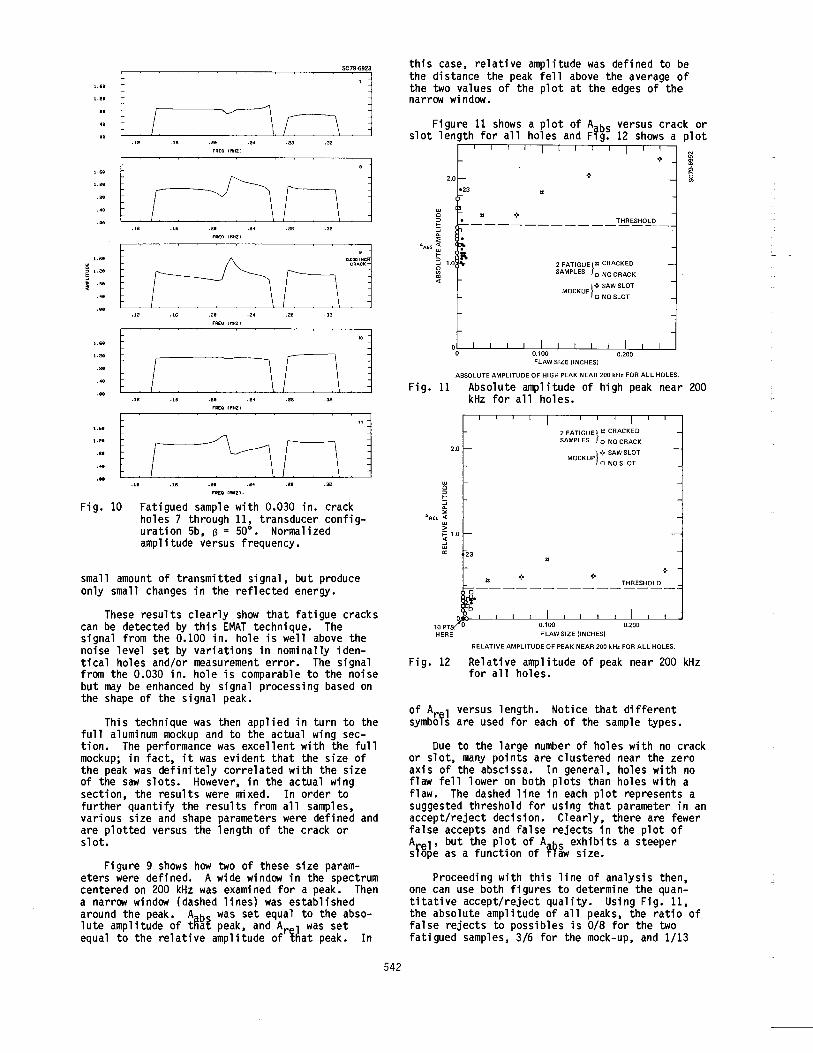
A straightforward and fieldable method of quantifying this effect is to average the frequency spectra from the nearby uncracked holes in that sample and divide by this average. This operation was performed in the minicomputer on data from both specimens with fatigue cracks. Figure 9 shows the results for the specimen with a 0.100 in. (0.254 em) crack and Fig. 10 shows the results for the 0.030 in. (0.076 em) crack. Holes #7, 8, 10, and 11 in each sample are not cracked; thus the statistical sample for this geometry consists of 10 holes, 8 of which are uncracked and serve as a measure of the range of systematic_ variation or noise.
In each of these figures, the normalization leads to a displ~ which would have a constant value of unity if all holes were identical. The destruction of a null is indicated by a peak in the normalized plot for that hole. For the 0.100 in. fatigue crack sample data shown in Fig. 9 such a large peak occurs at hole #9, which was in fact the cracked hole. Lesser peaks occur
541
,_ .. ...
... . .. ·" fR£<1 tl'!lfll
! \ ·"
' G,1001NCH CRACK
... ...
I \ ... ·" f~O (lltfll
....
. ..
. .. f'~O {l'tHZl
Fig. 9 Fatigued sample with 0.100 in. crack, holes 7 through 11, transducer configuration 5b, fl 50°. Normalized amplitude versus frequency.
in the plots for holes #10 and 11. These presumably are a result of a 1 ack of reproducibility in the sample preparation and/or measurement technique. To a degree, they can be differentiated from true signa 1 s by shape criteria, e.g. , note the skewing of the peak for hole #11. Beyond this, they represent the sensitivity limit of the system.
Similar results for a 0.030 inch hole are shown in Fig. 10. There again, the cracked hole #9 is indicated by a peak occurring at about 0.2 MHz. The peak is smaller in magnitude, somewhat asymmetric, and is comparable in size to the structure in holes #8 and #11. Again, it appears that it could be distinguished by the size and shape of the peak.
It will also be noted that all of the plots vanish at-both low and high frequency. This is an artifact of the signal processing resulting from an automatic zeroing of the ratio when the denominator falls below a minimum level and should be ignored.
Since most of the energy is reflected, this method should be less sensitive to variations in sealant properties or fastener tightness than the transmission method. Variations in these parameters produce large fluctuations in the relatively
..
FREQII"'HZ)
l I ...
Fig. 10 Fatigued sample with 0.030 in. crack holes 7 through 11, transducer configuration Sb, B = 50°. Normalized amplitude versus frequency.
small amount of transmitted signal, but produce only small changes in the reflected energy.
These results clearly show that fatigue cracks can be detected by this EMAT technique. The signal from the 0.100 in. hole is well above the noise level set by variations in nominally identical holes and/or measurement error. The signal from the 0.030 in. hole is comparable to the noise but may be enhanced by signal processing based on the shape of the signal peak.
This technique was then applied in turn to the full aluminum mockup and to the actual wing section. The performance was excellent with the full mockup; in fact, it was evident that the size of the peak was definitely correlated with the size of the saw slots. However, in the actual wing section, the results were mixed. In order to further quantify the results from all samples, various size and shape parameters were defined and are plotted versus the length of the crack or slot.
Figure 9 shows how two of these size parameters were defined. A wide window in the spectrum centered on 200 kHz was examined for a peak. Then a narrow window (dashed lines) was established around the peak. Aabs was set equal to the absolute amplitude of tnat peak, and Ar 1 was set equal to the relative amplitude of ihat peak. In
542
this case, relative amplitude was defined to be the distance the peak fell above the average of the two values of the plot at the edges of the narrow window.
Figure 11 shows a plot of Aabs versus crack or slot length for all holes and F1g. 12 shows a plot
a -:-- __________ THRESHOLD_
2 FATIGUEltr: CRACKED
SAMPLES 0 NO CRACK
l
<Qo SAW SLOT MOCKUP
0 NO SLOT
FLAW SIZE {INCHES)
ABSOLUTE AMPLITUDE OF HIGH PEAK NEAR 200kHz FOR ALL HOLES.
Fig. 11 Absolute amplitude of high peak near 200 kHz for all holes.
w c " t-:::i ~
AAEL <{ w >
2.0
~ 1.0
a:
10 PT HERE
Fig. 12
0.100
2 FATIGUEl tr: CRACKED SAMPLES o NO CRACK
l
¢- SAW SLOT MOCKUP
0 NO SLOT
THRESHOLD
0.200 FLAW SIZE (INCHES)
RELATIVE AMPLITUDE OF PEAK NEAR 200kHz FOR ALL HOLES.
Relative amplitude of peak near 200 kHz for all holes.
of Arel versus length. Notice that different symbols are used for each of the sample types.
Due to the large number of holes with no crack or slot, many points are clustered near the zero axis of the abscissa. In general, holes with no flaw fell lower on both plots than holes with a flaw. The dashed line in each plot represents a suggested threshold for using that parameter in an accept/reject decision. Clearly, there are fewer false accepts and false rejects in the plot of Arel• but the pl?t of Aabs ex~ibits a steeper slope as a funct1on of tlaw s1ze.
Proceeding with this line of analysis then, one can use both figures to determine the quantitative accept/reject quality. Using Fig. 11, the absolute amplitude of all peaks, the ratio of false rejects to possibles is 0/8 for the two fatigued samples, 3/6 for the mock-up, and 1/13
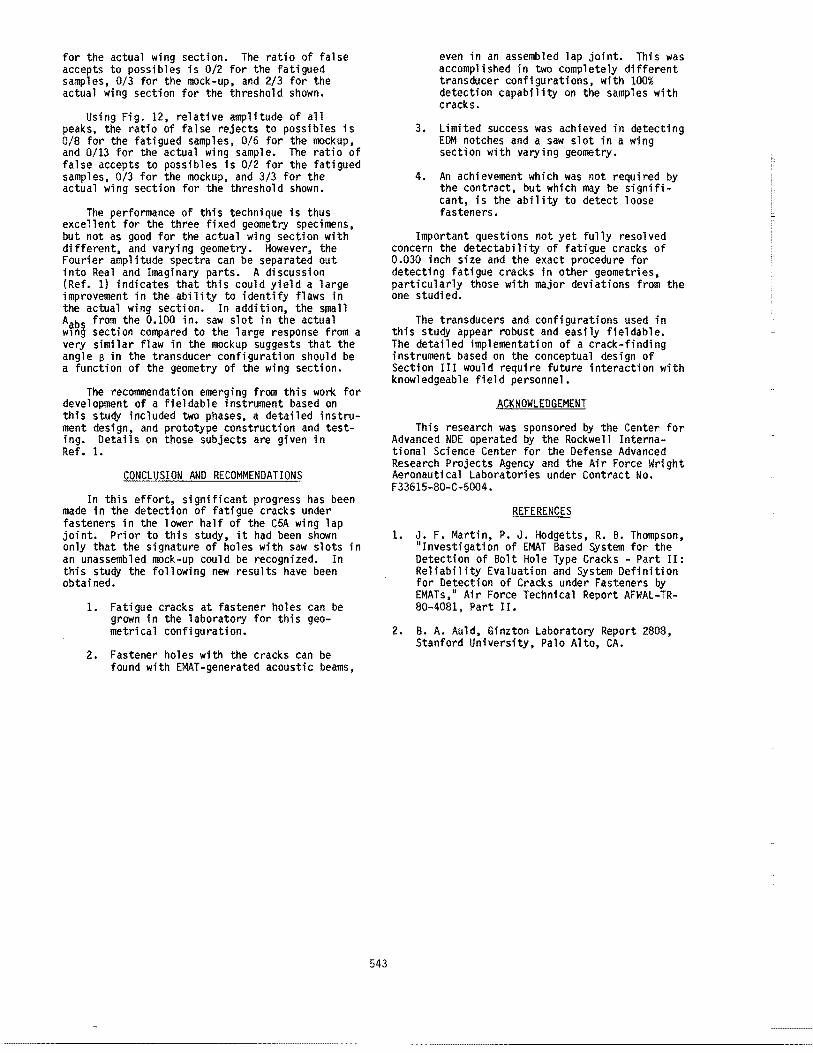
for the actual wing section. The ratio of false accepts to possibles is 0/2 for the fatigued samples, 0/3 for the mock -up, and 2/3 for the actual wing section for the threshold shown.
Using Fig. 12, relative amplitude of all peaks, the ratio of false rejects to possibles is 0/8 for the fatigued samples, 0/6 for the mockup, and 0/13 for the actual wing sample. The ratio of false accepts to possibles is 0/2 for the fatigued samples, 0/3 for the mockup, and 3/3 for the actual wing section for the threshold shown.
The performance of this technique is thus excellent for the three fixed geometry specimens, but not as good for the actual wing section with different, and varying geometry. However, the Fourier amplitude spectra can be separated out into Real and Imaginary parts. A discussion (Ref. 1) indicates that this could yield a large improvement in the ability to identify flaws in the actual wing section. In addition, the small Aabs from the 0.100 in. saw slot in the actual w1ng section compared to the large response from a very similar flaw in the mockup suggests that the angle a in the transducer configuration should be a function of the geometry of the wing section.
The recommendation emerging from this work for development of a fieldable instrument based on this stuey included two phases, a detailed instrument design, and prototype construction and testing. Details on those subjects are given in Ref. 1.
CONCLUSION AND RECOMMENDATIONS
In this effort, significant progress has been made in the detection of fatigue cracks under fasteners in the lower half of the C5A wing lap joint. Prior to this study, it had been shown only that the signature of holes with saw slots in an unassembled mock-up could be recognized. In this stuqy the following new results have been obtained.
1. Fatigue cracks at fastener holes can be grown in the laboratory for this geometrical configuration.
2. Fastener holes with the cracks can be found with EMAT-generated acoustic beams,
543
even in an assembled lap joint. This was accomplished in two completely different transducer configurations, with 100% detection capability on the samples with cracks.
3. Limited success was achieved in detecting EDM notches and a saw slot in a wing section with varying geometry.
4. An achievement which was not required by the contract, but which may be significant, is the ability to detect loose fasteners.
Important questions not yet fully resolved concern the detectability of fatigue cracks of 0.030 inch size and the exact procedure for detecting fatigue cracks in other geometries, particularly those with major deviations from the one studied.
The transducers and configurations used in this stuey appear robust and easily fieldable. The detailed implementation of a crack-finding instrument based on the conceptual design of Section III would require future interaction with knowledgeable field personnel.
ACKNOWLEDGEMENT
This research was sponsored by the Center for Advanced NDE operated by the Rockwell International Science Center for the Defense Advanced Research Projects Agency and the Air Force Wright Aeronautical Laboratories under Contract No. F33615-80-C-5004.
REFERENCES
1. J. F. Martin, P. J. Hodgetts, R. B. Thompson, "Investigation of EMAT Based System for the Detection of Bolt Hole Type Cracks- Part II: Reliability Evaluation and System Definition for Detection of Cracks under Fasteners by EMATs." Air Force Technical Report AFWAL-TR-80-4081, Part II.
2. B. A. Auld, Ginzton Laboratory Report 2808, Stanford University, Palo Alto, CA.