pulse profile of bg cmi in x-rayold.apctp.org/bh2006/talks/choi_cs.pdf · white dwarf which has...
TRANSCRIPT

Pulse Profile of BG Pulse Profile of BG CMiCMiin Xin X--ray ray Chul-Sung Choi
(Korea Astronomy & Space Science Institute)
Abstract
We present the results of analyzing the X-ray data observed with ROSAT in 1992 March and with ASCA in 1996 April. From timing analysis of the data, we find that the pulse profile consists of 4 pulses (or peaks) over the pulse period of 913.5 s. Among the 4 pulses, the highest one is coincident with an optical pulse maxima expected from the ephemerides. The total pulse fraction increases with decreasing X-ray energy from 17% to 68% in 0.8 – 10 keV. The pulse phase spectroscopy of the source reveals for the first time in this study that the pulsed X-ray spectrum is softer than the spectrum of unpulsed X-ray, suggesting that an accretion matter cools down while it travels toward the magnetic poles of the white dwarf.

Kim, Y. G. et al. (2005)
• BG CMi is known as an intermediate polar (IP) with an orbital period of 3.235 hr. The primary star, exhibiting pulsation of flux in X-ray, optical, and IR, is known to a rotating, magnetic white dwarf. Its magnetic field strength is inferred to be B = (2 – 6) × 106 G based on the circular polarization observations in optical & IR. However, there is a lack of information on the fundamental properties of the secondary, including the system parameters.
• A pulsation with profile of a quasi-sinusoidal single peak is clearly seen in the optical data of BG CMi at the period 913.5 s, together with an orbital modulation of brightness over the period 3.235 hr. The pulsation and orbital modulation have also been observed in X-ray at the periods (e.g. Parker et al. 2005). The earlier X-ray studies of BG CMi revealed that the pulse profile is non-sinusoidal together with a hint of multiple peaks (e.g. Terada et al. 2004).
Introduction

The data• We here use the ROSAT and ASCA data acquired from the public archives (HEASARC).
• BG CMi was observed with ROSAT in 1992 March 28 through 29 with on-source time of 8.4 × 10³
s. It was observed two times with ASCA with an interval of 2 days: 1996 April 14 through 15 with on-source time of 3.7 × 10⁴ s and 1996 April 17 through 18 with on-source time of 3.6 × 10⁴ s.
• According to the 2nd catalogue of pointed observations with PSPC, there are (possible) other X-ray sources within a circular region of radius 0.1o from BG CMi. A caution therefore should be given to the X-ray data analysis of this source.
• Taking into account of this situation, we restrict a source extraction region to a circular region of radius r = 3´ which is centered at the position of BC CMi. We note that, under the restriction of the source-extraction region, some loss of soft X-rays are inevitable for GIS data below ~1 keV.
• We use the screened data for ROSAT PSPC and use the raw data for ASCA SIS and GIS. A very strict data screening criteria are applied to the SIS and GIS data to reduce possible contaminations from the Earth’s bright limb and from the regions of high particle background.

Nearby X-ray Sources

Pulse Period• To confirm whether X-ray pulsations exist consistently in the current data, we do a period search using an epoch folding method and obtain the result shown in the right figure (GIS data). In this search, we did not correct the effect of orbital motion of the primary.
• The best period, which is determined by fitting a Gaussian function to the centroid of χ2-peak, is P = 913.6 ± 0.3 s for PSPC data and is P = 913.5 ± 0.1 s for GIS data. These are consistent with those reported in X-ray and optical.
• It is noted from the figure that there are harmonics of the period P, labeled (1/2)P, (1/3)P, and (1/4)P, and beats between orbital and pulse periods, labeled with Pb1 and Pb2, suggesting that the period P is the fundamental period and is the spin period of the white dwarf.

Pulse Profile PSPC
SIS + GIS
• The ROSAT data were folded at the period 913.6 s from the epoch MJD 48709.28492 (TDB), whereas the ASCA data were at the period 913.5 s from the epoch MJD 50187.79824 (TDB).
• To identify which pulse (or peak) matches with an optical pulse maximum, we calculate an epoch for the maximum which is near the start time of the X-ray data using the recently presented ephemerides: the number 1 at the top of the figure is from Kim et al. (2005), 2 is from Pych et al. (1996), and 3 is from Hellier(1997). In this plot, we did not correct the difference between heliocentric time and TDB (Barycentric Dynamical Time), because the difference is negligibly small, < 2.5 s, compared with the pulse period.
• Taking into account the uncertainties in the optical ephemerides, ~0.02 – 0.03 in phase, we conclude that the RP1 and AP2 pulses are well consistent with the expected optical pulse maxima.

Energy-Resolved Pulse Profile• To interpret the profiles quantitatively, we choose the model ofconstant plus two or four Gaussians.• The two pulses which correspond to AP1 & AP4 seem to be absent in the ROSAT data of the same energy band 0.8 – 2.0 keV. But the fit values enable us to realize that there is a hint of such pulses: the width of RP1 pulse is almost identical to the AP2 whereas the width of RP2 is broader than the AP3. This broader width can be interpreted as the superposition of two pulses AP3 & AP4 like the ASCA data. Furthermore, a broad hump marked with arrow supports this idea too. Based on this analysis, we conclude that the ROSAT pulse profile is actually the same as the ASCA inthe point of the number of peaks.
• By analyzing the energy-resolved profiles, we obtain the followings: 1. Each pulse shows no significant phase shift; the separation of the AP1 & AP3 and those of AP2 & Ap4 pulses are sustained to be consistent, 0.5 in phase; 2. The pulse widths for RP1 & AP2 decrease with decreasing X-ray energy; 3. Pulsed flux for AP2 & AP3 (major pulses) are ~2 – 5 times larger than the flux for AP1 & AP4 (minor pulses); 4. Total pulse fraction increases with decreasing the energy from 17% to 68% in 0.8 – 10 keV (ASCA data).

Unpulsed X-ray Spectrum• To obtain an idea for spectral fit, we plot the pulsed and unpulsed fluxes as displayed in the right figure, in which each symbol represents the mean pulsed flux for each pulse, and short- and long-dashed histograms indicate the unpulsed flux level (note that the unpulsed levels are over the entire phase). This figure suggests that the spectral decomposition of the pulses is not easy in particular to the minor pulses.
• From analysis of the plot, we see that the mean pulsed flux for AP1 & AP4 in 2 – 10 keV are much lower, ~30%, than the fractional unpulsed flux. Therefore, this spectrum can be roughly considered as the spectrum of unpulsed X-ray as seen below.
• Through trials to fit the spectrum with various spectral models in XSPEC, we find that the spectrum is basically approximated with either the model of power-law plus a Gaussian with the index of α = 0.7 or the model of blackbody plus a Gaussian with the temperature of kT = 2.3 keV. A different model, e.g., ‘mekal’(optically thin hot plasma emission model) plus power-law, cannot be ruled out.
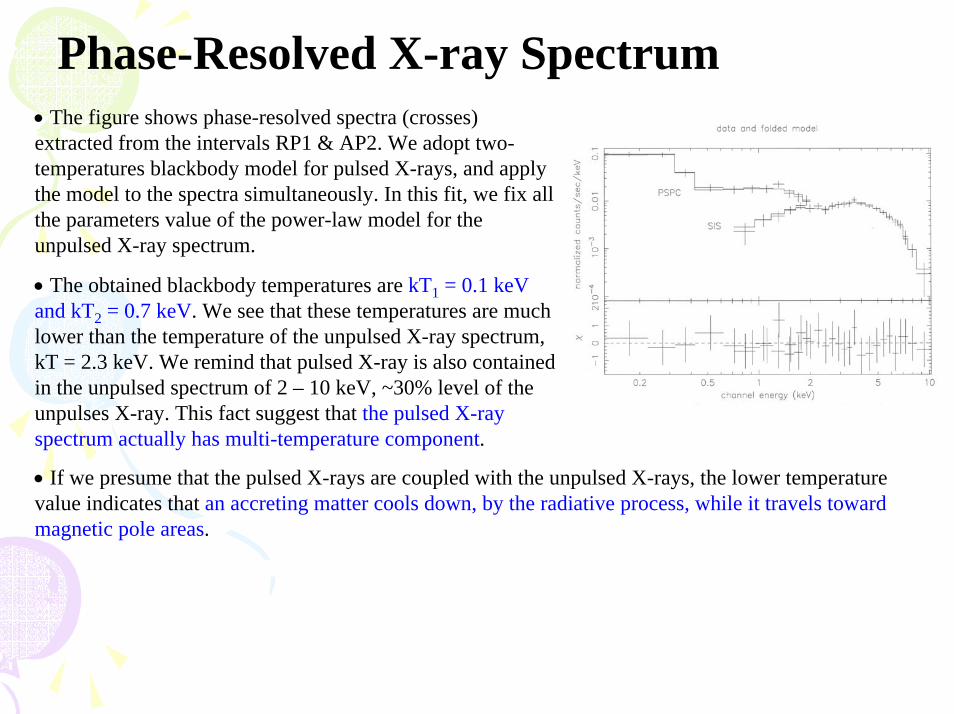
Phase-Resolved X-ray Spectrum• The figure shows phase-resolved spectra (crosses) extracted from the intervals RP1 & AP2. We adopt two-temperatures blackbody model for pulsed X-rays, and apply the model to the spectra simultaneously. In this fit, we fix allthe parameters value of the power-law model for the unpulsed X-ray spectrum.
• The obtained blackbody temperatures are kT1 = 0.1 keVand kT2 = 0.7 keV. We see that these temperatures are much lower than the temperature of the unpulsed X-ray spectrum, kT = 2.3 keV. We remind that pulsed X-ray is also contained in the unpulsed spectrum of 2 – 10 keV, ~30% level of the unpulses X-ray. This fact suggest that the pulsed X-ray spectrum actually has multi-temperature component.
• If we presume that the pulsed X-rays are coupled with the unpulsed X-rays, the lower temperature value indicates that an accreting matter cools down, by the radiative process, while it travels toward magnetic pole areas.

Discussion• Almost all the present results could be interpreted as the framework of a single, rotating, magnetic, white dwarf which has unusually large polar caps: the pulse profile and the spectral softening.• However, a postulate that the pulse profile is attributed to a quadruple magnetic field geometry of the primary star may not be ruled out completely, although it seems that this geometry is hard to be generated in a white dwarf. (comment please !!)
• It may also be speculated that the primary consists of unresolved two compact stars which are both spinning and magnetized, because the separation of the two pulses AP1 & AP3 and of the other pulses AP2 & Ap4 are sustained to be consistent, 0.5 in phase, irrespective of the chosen energy bands. But, this possibility looks unlikely since the optical pulse-period studies report that the primary is spinning up (e.g., Kim et al. 2005). Furthermore, even if it is possible, this case could undergo a serious difficulty to explain the obtained pulse profile, because a mass accretion should occur simultaneously and continuously to the compact stars.
• The spectral softening can be understood as the large polar cap hypothesis, because in this case the channeled matter could not suffer from a shock during the travel onto the pole areas. This conclusion may be conflict of the conventional idea that the matter shock-heated during the travel in most case of mCVs and thereby the emission temperature increases as high as a few tens keV. In this sense, BG CMi is unusual but not unique because a similar phenomenon is observed in AE Aqr which is also classified as an intermediate polar (Choi et al. 1999; Choi & Dotani 2006).

References
• Choi, C. S., & Dotani, T. 2006, ApJ, submitted
• Choi, C. S., Dotani, T., & Agrawal, P. C. 1999, ApJ, 525, 399
• Hellier, C. 1997, MNRAS, 288, 817
• Kim, Y. G., Andronov, I. L., Park, S. S., & Jeon, Y.-B. 2005, A&A, 441, 663
• Parker, T. L., Norton, A. J., & Mukai, K. 2005, A&A, 439, 213
• Pych, W., Semeniuk, I., Olech, A., & Ruszkowski, M. 1996, Acta Astronomica, 46, 279
• Terada, Y., Ishida, M., & Makishima, K. 2004, PASJ, 56, 533

Thank you for Thank you for attention!attention!

McHardy et al. (1987)

Norton et al. (1992)

• BG CMi was observed twice with ASCA: 1. 1996 April 14 (18h17m) – 15 (23h04m): ~8 × Porb
2. 1996 April 17 (10h28m) – 18 (12h50m): ~11 × Porb
• We acquired these data from the HEASARC archival data center
• We note that these data are not fully analyzed and are not yet published (except light curve presented by Parker et al. 2005)
• ASCA has 4 focal plane detectors with moderate spectral resolution: two identical Gas Imaging Spectrometers (GIS2 & GIS3; 0.8 – 10 keV; FOV of ~40´) and two Solid-state Imaging Spectrometers (SIS0 & SIS1; 0.4 – 10 keV; FOV of ~22´ × 22´)

• Each of the SISs consists of 4 CCD chips (where 1 CCD chip consists of 420 × 422 pixels)
• During the observations of BG CMi, SISs were operated in 2 CCD mode and GISs were operated in Pulse Height (PH) mode
• The time resolution of the SISs in 2 CCD mode is 8 s and it is 62.5/500 ms (high/medium telemetry bit rate) for the GISs in PH mode

Light Curves

Periodicities
Patterson & Thomas (1993)