pulse plating - eugen g. leuze verlag kg · pulse plating in the third millennium the purpose of...
TRANSCRIPT
Pulse Plating
Wolfgang E. G. Hansal, Sudipta Roy
1st Edition including 176 Illustrations and 25 Tables
Pulse Plating in the Third Millennium
The purpose of this contribution is to review a sample of papers published in recent years, on pulse plating (PP). The sample is taken largely from the journal Transactions of The Institute of Metal Finishing. Of course, other journals - notably Galvanotechnik - are important to both authors and readers, but the intention is to be critical rather than comprehensive and I hope that the papers covered will be sufficiently representative of the field to generate useful discussion and, perhaps, some post-symposium thoughts.
In the new millennium we inherit earlier work and, at the outset, it is proper to acknowledge e.g. the insight on mechanism provided by J.-Cl. Puippe et al. [a1-V3].
In the 1st European Pulse Plating Seminar, Wolfgang E. G. Hansal pointed out that the development of an appropriate pulse sequence is necessary for each deposition system; prop-erly, this development is knowledge-based, requiring fundamental electrochemical input; a specific sequence can rarely be obtained by trial and error [a4]. A good example of the ra-tional approach, actually to pulse reverse plating (PRP), is due to Pearson [a5] who modelled Faradaic current waveforms for the acid copper system containing organic additives. Most authors do not adopt an ad hoc approach although there may be more or less post hoc hypoth-esising in explaining promising results. Pearson used impedance measurements and linear polarization experiments to establish the adsorption behaviour of the additives. In contrast, the application of impedance spectroscopy by Hu and Chan [a6] in a study of the electrodepo-sition of nickel-SiC composites by pulse plating is unclear. The equivalent circuit chosen leads to negative values of an adsorption capacitance and a desorption resistance which seem unrealistic, although the pulse charge transfer currents apparently derived by using them are unexceptional. A more direct approach to establishing charging currents, adsorption effects and charge transfer resistances during deposition is based on the ‘double impulse’ technique due, originally to Gerischer and Krause [a7] (see also [a8, V9]). This has been applied, with considerable success, by A. N. Gulivets et al. [a10], both to acquire understanding of the pulse electrochemistry and in synthesis. To summarise, the purpose of electrochemical measure-ments within the working pulse is to separate constituent processes on a time scale, thereby to follow first the behaviour of adsorbed entities and then the development of the Faradaic process.
In assessing a paper for its content of fundamental electrochemistry two criteria may help:
− are the kinetics adequate to contribute to future studies on similar systems? − would they contribute significantly to the design of a programme of industrial
development?Electroplating lies between the fundamentalism of electrochemistry and the engineering imperatives for materials research: it is an applied science and as such the work should be targeted. A number of targets can be discerned in the recent literature:
6 Preface
− Alloy deposition is exemplified by a Chinese study [a11] of zinc-nickel alloy coatings for the protection of the Mg engineering alloy AZ91. Optimum depositi-on conditions are reported but there are no details of corrosion tests. S. K. Ghosh et al. [a12] used the pulse plating of nanocrystalline nickel-copper alloys to compare stress levels with those in comparable DC deposits. There has also been strong Ukrainian interest in the metal-metalloid alloys (Ni-P [a10, V13]), partly in determining the thermal stability of amorphous / nanocrystalline deposits with unique physical and chemical properties. The authors have made a similar study of copper-phosporus [a14, V15], including its magnetic properties [a16].
− Compositionally modulated deposits have been obtained by Bahrololoom, Gabe and Wilcox [a17] using a computer aided pulse plater. They produced zinc, cobalt multilayers with enhanced corrosion resistance. Eagleton and Farr [a18, V19] have studied (using DC and pulse plating) the crystal structure and magnetic properties of the cobalt-copper layer produced for giant magneto resistive (GMR) devices by stepped potential plating. Typically, pure copper layers are obtained at low current densities; at 10 mAcm-2 the copper layer contains 3 % of copper but useful films still result (see also the review by F. Walsh et al. [a20]).
− Pulse plating has been applied to the production of composites for more than 30 years [a21]. N. Spyrellis et al. [a22, V23] have studied nickel-SiC composites obtained by pulse plating for applications in textile machinery. They show that microhardness of the as-deposited films depends on the plating conditions as well as on the incorporated particle size and distribution; and they report the effects of thermal treatment. In a series of papers N. S. Qu et al. report the production and properties of nanocrystalline nickel by pulse plating [a24, V25] leading to the fabrication of graded nickel-quasicrystal(Al-Cu-Fe) composites by varying current density [a26, V27]. This approach might well excite some interest in the pulse plating community.
− The attainment of desirable properties is a constant and explicit aim in pulse pla-ting. However measurements are often restricted, e.g. in tribology to hardness, but not extending to wear. Stress was a concern of Ghosh et al. [a12], also of Rehrig and Mandich for gold [a28], Mohan et al. [a29] made corrosion studies on chro-mium deposited from a conventional chromium(VI) electrolyte finding improve-ment using pulse plating but they did not report any measurements of efficiency, throwing power or any microscopy.
− The interaction of pulse plating parameters on the thickness and hardness of copper deposits and on deposition current efficiency, throwing power and their interaction with additives has been explored by Mohan and Raj [a30] who also compared DC and pulse plating gold deposits [a31].
− A uniform and fine morphology is generally approved. Since the scanning elec-tron microscope is user-friendly SEM micrographs frequently decorate papers. However, although much more difficult to acquire the less frequent TEM micro-graphs often reveal a truly nano-scale of crystallinity (e.g. [a22]), X-ray diffrac-tion and EXAFS are under-applied.
Two topics are missing. There has been no great concern with the decorative aspects of pulse plating coatings. Possibly this has been taken for granted as a requirement. The use of pulse

1 An Overview of Pulse Deposition
1.1 Introduction
Pulse plating can be generally defi ned as electrochemical deposition using a periodic (pulsed) current. The key distinguishing feature of pulse plating compared to direct current (DC) plating is that it exploits the dynamic processes at the electrode accompanying the application of current pulses. During DC plating the reactions at the electrode surface as well as the electrolyte conditions remain essentially unchanged during the entire process. In contrast, deposition by pulse currents occurs under continuously changing conditions. In fact, the essence of employing pulse plating lies in the ability to exploit and manipulate these dynamic conditions [1-4].
In pulse plating, a variety of current (or potential) waveforms can be employed, including sinusoidal, saw-tooth and square-wave pulsations. Usually, however, square or rectangular pulses are employed. This is mainly because the changes accompanying a sudden rise or fall in current or potential forces the system to rapidly react to the new conditions, and by doing this repetitively, pulse plating allows one to achieve deposits which are signifi cantly different from those obtained using DC plating.
In order to use this technique effectively, a thorough understanding of electrochemical processes is required. Pulse deposition can infl uence a wide range of electrochemical phe-nomena including charge transfer kinetics, electrocrystallisation, the action of additives and non-steady state mass transfer. On the other hand, if not controlled appropriately, it can produce unexpected results and frustrate attempts to improve a plating process.
In this chapter, some key characteristics of pulse plating are introduced in a qualitative way. In subsequent chapters, the fundamental aspects of electrochemical systems are discussed in greater detail. In each case, the relevance of these fundamental aspects to pulse plating is examined, so that the reader can directly see their practical implications. The aim of these chapters, therefore, is to enable the reader to understand what pulse current deposition can offer, and which parameters can be used to affect improvements in a process. In subsequent chapters the implementation of pulse plating and its use in various applications and special processes is discussed.
An Overview of Pulse Deposition20
1.2 Basic Defi nitions
An electrochemical reaction differs from a chemical reaction in that a charge carrier, either an electron or ion, is transferred across an electric double layer, from one phase to another, against a potential controlled activation energy barrier [5-7]. An electrochemical process, such as deposition or dissolution, can only proceed if a potential (which allows the reacting species to surmount this energy barrier) is applied across the electrode-electrolyte inter-face. This fundamental difference gives such processes their special name: electrochemical as opposed to chemical deposition and dissolution.
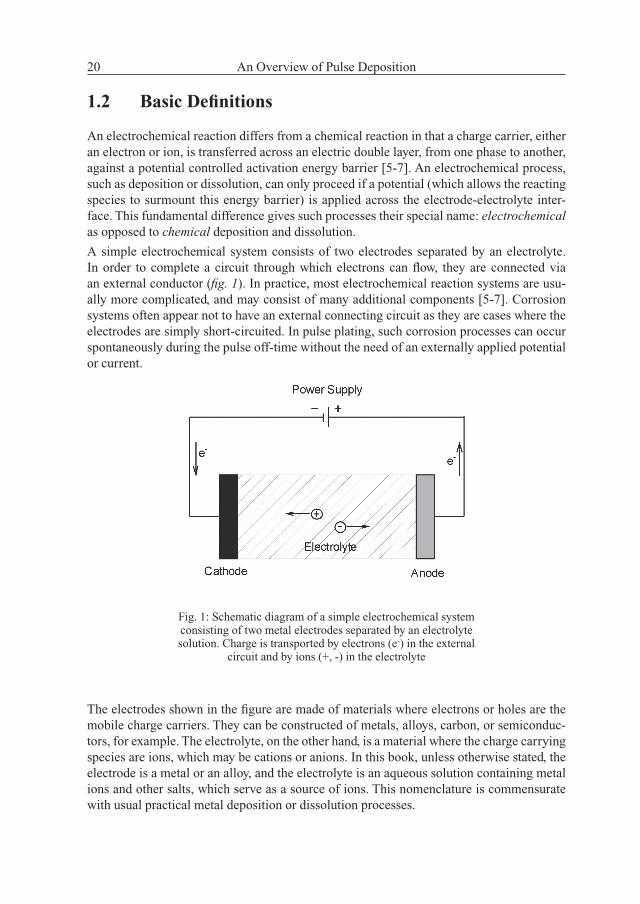
A simple electrochemical system consists of two electrodes separated by an electrolyte. In order to complete a circuit through which electrons can fl ow, they are connected via an external conductor (fi g. 1). In practice, most electrochemical reaction systems are usu-ally more complicated, and may consist of many additional components [5-7]. Corrosion systems often appear not to have an external connecting circuit as they are cases where the electrodes are simply short-circuited. In pulse plating, such corrosion processes can occur spontaneously during the pulse off-time without the need of an externally applied potential or current.
Fig. 1: Schematic diagram of a simple electrochemical system consisting of two metal electrodes separated by an electrolyte solution. Charge is transported by electrons (e-) in the external
circuit and by ions (+, -) in the electrolyte
The electrodes shown in the fi gure are made of materials where electrons or holes are the mobile charge carriers. They can be constructed of metals, alloys, carbon, or semiconduc-tors, for example. The electrolyte, on the other hand, is a material where the charge carrying species are ions, which may be cations or anions. In this book, unless otherwise stated, the electrode is a metal or an alloy, and the electrolyte is an aqueous solution containing metal ions and other salts, which serve as a source of ions. This nomenclature is commensurate with usual practical metal deposition or dissolution processes.
21Practical Electrodeposition Systems
An electrode where a metal ion is reduced is called the cathode and that where a metal is oxidised is termed as the anode. For the purposes of this book, a metal reduction reaction is a cathodic reaction and a metal dissolution reaction is an anodic reaction. In some pulse plating processes, bipolar waveforms are used and therefore both cathodic and anodic reac-tions can proceed at the same electrode at different times in the pulse cycle.
As per the above defi nitions, electrons do not fl ow through an electrolyte, whereas ions cannot move through electrodes. Therefore, any current fl ow is enabled in this system only when the charge carried by electrons within the electrode is transferred to ions in the elec-trolyte. This is only possible via an electrochemical reaction occurring at the phase bound-ary between the electrode and the electrolyte. In this manner the circuit is completed and a fl ow of charge is ensured. The electrons released at one electrode (anode) are balanced by consumption at the other electrode (cathode).
In practice, all electrochemical processes require some degree of measurement and control. In particular, the current fl owing in the external circuit and the potential of the cathode or anode needs to be measured. The electrode potentials are typically measured against a third electrode known as a reference electrode. In simple terms, this electrode can be considered as an externally introduced reference from which the potential of an electrode can be meas-ured or controlled. Although the use of reference electrodes is common practice in labora-tory studies, its use in industrial-scale plating is more diffi cult. These issues are discussed in the forthcoming section.
1.3 Practical Electrodeposition Systems
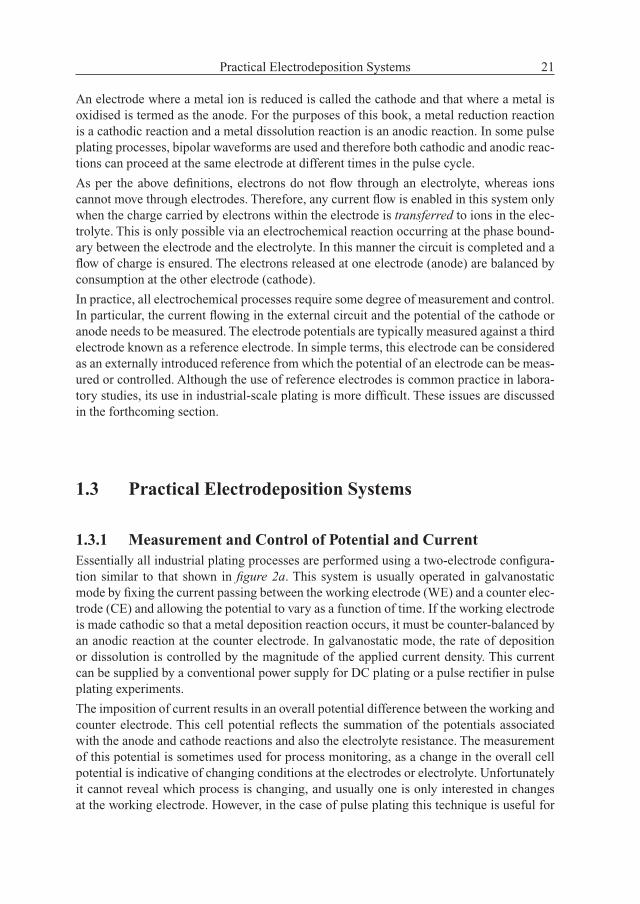
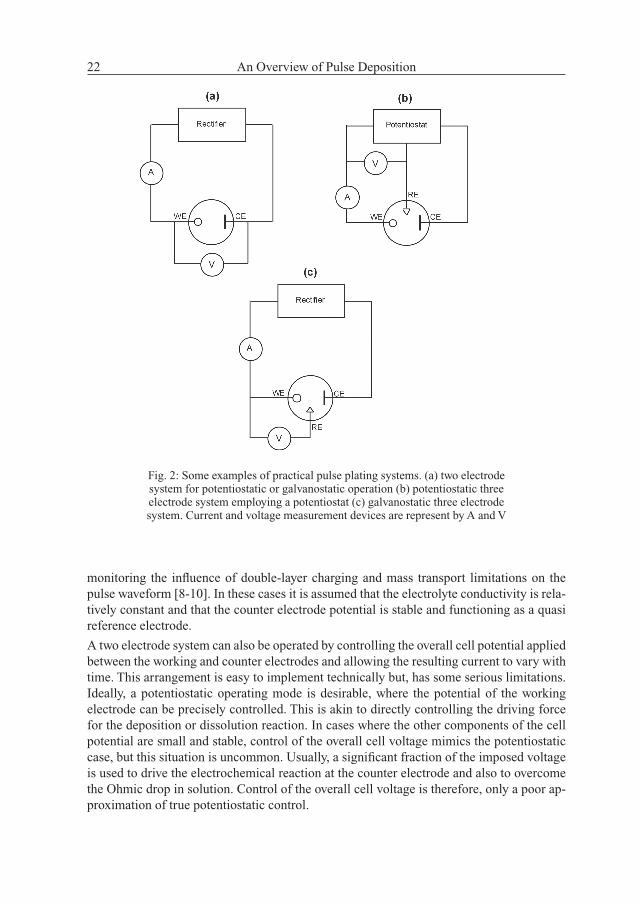
1.3.1 Measurement and Control of Potential and Current Essentially all industrial plating processes are performed using a two-electrode confi gura-tion similar to that shown in fi gure 2a. This system is usually operated in galvanostatic mode by fi xing the current passing between the working electrode (WE) and a counter elec-trode (CE) and allowing the potential to vary as a function of time. If the working electrode is made cathodic so that a metal deposition reaction occurs, it must be counter-balanced by an anodic reaction at the counter electrode. In galvanostatic mode, the rate of deposition or dissolution is controlled by the magnitude of the applied current density. This current can be supplied by a conventional power supply for DC plating or a pulse rectifi er in pulse plating experiments.
The imposition of current results in an overall potential difference between the working and counter electrode. This cell potential refl ects the summation of the potentials associated with the anode and cathode reactions and also the electrolyte resistance. The measurement of this potential is sometimes used for process monitoring, as a change in the overall cell potential is indicative of changing conditions at the electrodes or electrolyte. Unfortunately it cannot reveal which process is changing, and usually one is only interested in changes at the working electrode. However, in the case of pulse plating this technique is useful for
An Overview of Pulse Deposition22
monitoring the infl uence of double-layer charging and mass transport limitations on the pulse waveform [8-10]. In these cases it is assumed that the electrolyte conductivity is rela-tively constant and that the counter electrode potential is stable and functioning as a quasi reference electrode.
A two electrode system can also be operated by controlling the overall cell potential applied between the working and counter electrodes and allowing the resulting current to vary with time. This arrangement is easy to implement technically but, has some serious limitations. Ideally, a potentiostatic operating mode is desirable, where the potential of the working electrode can be precisely controlled. This is akin to directly controlling the driving force for the deposition or dissolution reaction. In cases where the other components of the cell potential are small and stable, control of the overall cell voltage mimics the potentiostatic case, but this situation is uncommon. Usually, a signifi cant fraction of the imposed voltage is used to drive the electrochemical reaction at the counter electrode and also to overcome the Ohmic drop in solution. Control of the overall cell voltage is therefore, only a poor ap-proximation of true potentiostatic control.
Fig. 2: Some examples of practical pulse plating systems. (a) two electrode system for potentiostatic or galvanostatic operation (b) potentiostatic three electrode system employing a potentiostat (c) galvanostatic three electrode system. Current and voltage measurement devices are represent by A and V
2 Thermodynamics
2.1 Introduction
As noted in chapter 1, a thorough knowledge of the thermodynamics of electrochemical systems is essential to understand the fundamentals of pulse plating. While pulse elec-trodeposition is carried out very far away from thermodynamic equilibrium, aspects of electrochemical equilibria, especially those associated with the electrode-electrolyte in-terface, are of considerable importance. For example, when an electrochemical reaction attains equilibrium, it results in the formation of an electrical double layer at the electrode-electrolyte interface. This double layer has an associated capacitance and, as will be seen later, places important constraints on the choice of pulse parameters.
The most useful thermodynamic data that can be obtained from the interfacial region relates to the measurement of electrode potentials. As will be discussed later, these equi-librium potentials can be related to the activity or concentration of all species involved in the electrode reaction using the well-known Nernst equation. These potentials serves to rationalise what deposition and dissolution reactions are possible, and can be used to examine the feasibility of co-depositing two different metals to form an alloy. While other factors (e.g. mass transport and kinetics) may also be important, thermodynamics provides the fundamental answers to questions of what reactions and processes are possible. Finally, the concept of equilibrium is also important in the understanding of electrochemical kinet-ics (chap. 3) as many kinetic parameters are defi ned relative to the equilibrium potential.
In this chapter we will be mainly concerned with a thermodynamic analysis of metal ion reactions occurring at the electrode-electrolyte interface. Apart from a brief discussion of metal ion complexation, aspects of solution equilibria are not discussed. Similarly, the thermodynamics associated with the nucleation and growth of deposits will be discussed later in chapter 4. The present description is a highly condensed one, but more complete discussions of electrochemical thermodynamics are available in a number of standard textbooks [23-28].
2.2 Electrochemical Equilibrium at Interfaces
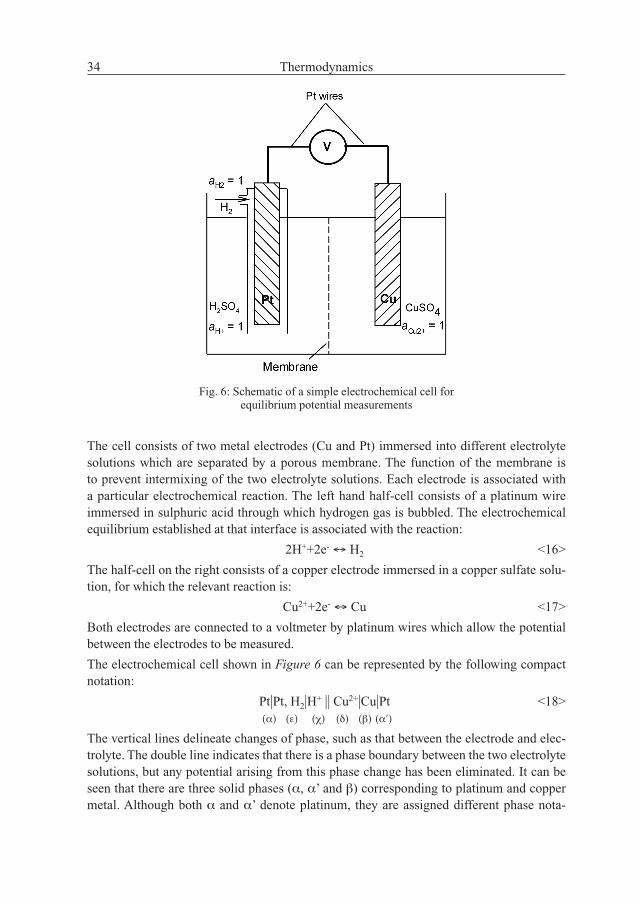
In order to develop an understanding of electrochemical equilibrium, it is instructive to examine a simple electrochemical cell such as that shown in fi gure 6.
Thermodynamics34
The cell consists of two metal electrodes (Cu and Pt) immersed into different electrolyte solutions which are separated by a porous membrane. The function of the membrane is to prevent intermixing of the two electrolyte solutions. Each electrode is associated with a particular electrochemical reaction. The left hand half-cell consists of a platinum wire immersed in sulphuric acid through which hydrogen gas is bubbled. The electrochemical equilibrium established at that interface is associated with the reaction:
2H++2e- ↔ H2 <16>
The half-cell on the right consists of a copper electrode immersed in a copper sulfate solu-tion, for which the relevant reaction is:
Cu2++2e- ↔ Cu <17>
Both electrodes are connected to a voltmeter by platinum wires which allow the potential between the electrodes to be measured.
The electrochemical cell shown in Figure 6 can be represented by the following compact notation:
Pt|Pt, H2|H+ || Cu2+|Cu|Pt <18>
(α) (ε) (χ) (δ) (β) (α′)
The vertical lines delineate changes of phase, such as that between the electrode and elec-trolyte. The double line indicates that there is a phase boundary between the two electrolyte solutions, but any potential arising from this phase change has been eliminated. It can be seen that there are three solid phases (α, α’ and β) corresponding to platinum and copper metal. Although both α and α’ denote platinum, they are assigned different phase nota-
Fig. 6: Schematic of a simple electrochemical cell for equilibrium potential measurements
35The Origin of Electrochemical Potentials and the Nernst Equation
tion, because their electrochemical states may be different even if their chemical state are the same. The phase χ and d denotes the electrolyte phases containing H2SO4 and CuSO4, respectively. Finally, ε denotes the gaseous phase associated with the H2 species.
The equilibrium between adjacent phases can be examined thermodynamically, but the one of most interest in electrochemistry is that between the two electrodes and their respective solution phases. It is the establishment of these equilibria which lead to the development of an electrical potential across the interface. These potentials can be measured experimen-tally and can be used to assess whether the electrochemical reactions are at equilibrium. Although both metal-solution interfaces are of interest we will concentrate our analysis on the right hand half-cell corresponding to the equilibrium between the copper electrode and copper ions in solution. This is the situation which corresponds closely to the deposition and dissolution of metals.
A reference to equilibrium often conjures up images of static or inert systems but the actual system is the direct opposite of this. When a copper electrode is placed in contact with a solution of its ions then considerable transfer of species may occur between the phases. This arises because initially the conditions for reaction <17> to be at equilibrium will generally not be fulfi lled. In order to satisfy it either deposition of copper ions on to the electrode or dissolution of copper into solution must take place. Therefore, the condition for electrochemical equilibrium is in reality a dynamic one. In the present example, equi-librium is reached when the deposition of copper is occurring at a rate equal to its dissolu-tion. Under these conditions, there is no nett transfer of charge across the interface and therefore no measurable current.
2.3 The Origin of Electrochemical Potentials and the Nernst Equation
For two phases to reside at a thermodynamic equilibrium the electrochemical potential,~μ, of a component present in both phases must be the same. For example, for the right-hand half cell in fi gure 6 this corresponds to: ~μδ
Cu = ~μβCu <19>
The electrochemical potential is related to the more familiar chemical potential, μ,which describes the energetic state of a neutral species (e.g. Cu atom) in a phase. For a species i the chemical potential is given by the expression:
μi = μi0+RTlnai <20>
where ai is the activity of species i in the phase and μi0 is the chemical potential in the
standard state. The activity of a species is formally defi ned as the work required to move it from one phase to another, and therefore indicates its restlessness within the initial phase. The greater the activity, the more willing the species is to leave that phase.
For charged species such as the Cu2+ ion the energetic state in a phase is defi ned by the electrochemical potential µ, and has both a chemical and an electrical component. That is to
Thermodynamics36
say the energy of the ion depends on both its activity and the potential, φ of the phase. This can be expressed as: ~μi = ~μ0
i+RTlnai+ziFφ <21>
where ai is the activity of species i, zi is its formal charge and ~μ0i is the electrochemi-
cal chemical potential in the standard state. Similarly, for an electron the electrochemical potential includes only the electrical component and we can write:
~μe = ~μ0e-Fφ <22>
The quantity φ is known as the inner or Galvani potential and is a property of any phase. It relates to the energy required to move an idealised charge particle to a point inside that phase. If the electrolyte solution has a potential φS and the metal electrode φM we can also defi ne the Galvani potential difference between the two phases as:
Δφ = φΜ−φΣ <23>
Neither f or Df can be directly measured but, as will be shown later, they can be converted to a more meaningful (and measurable) potential scale.
If we consider reaction <17> above, at equilibrium the following relationship exists among the electrochemical potentials [3, 4]:
~μCu2++2~μe = μCu <24>
Substituting equations <20-22> into <24> and re-arranging we can obtain the expression:
Δφ =
μ0Cu2++2μe
0-μ0Cu +
RT ln
aCu2+ 2F 2F aCu
<25>
This equation shows explicitly that the establishment of equilibrium between the elec-trode and electrolyte phases requires the development of a potential difference between thephases.
If all the standard chemical potential terms are collected into a single standard Galvani potential difference term Δφ the following expression is obtained:
This equation is essentially the Nernst equation applied to electrochemical reaction <17>, but expressed in terms of the Galvani potential difference. It can be shown that the absolute potential can be replaced using relative potential differences, E so that:
where Er is known as the reversible or equilibrium potential. Note that the activity of any pure metal is by defi nition one so the equation can be simplifi ed further:
The above equations describe the fundamental relationship between the activity of all chemical species involved in the electrode reaction to the electrode potential when the interface is at equilibrium.
Δφ = Δφ0+
RT ln
aCu2+
2F aCu <26>
Er = E0+
RT ln
aCu2+
2F aCu <27>
Er = E0+
RT
2F lnaCu2+
<28>
3 Reaction Kinetics
3.1 Introduction
As discussed in chapter 1, metal deposition and dissolution reactions are examples of a more general class of electrochemical reactions known as ion transfer reactions [46]. In its simplest form, this is a process where the metal ion is transferred from the solution to a surface site on the metal electrode across the double layer region (or vice versa). The formation of such ad-ions ( ad-atoms) is followed by additional steps involving surface dif-fusion to other sites and incorporation into the metal lattice, but here we will only consider the charge transfer reaction itself. These steps are discussed in detail in chapter 4 which deals with various aspects of nucleation and crystallisation. Similarly, we will assume that the transport of reactants and products to and from the electrode are not rate limiting so that the deposition current is controlled purely by charge transfer kinetics.
The ion transfer process is fundamentally different from that of electron transfer, but conveniently they are both governed by a similar phenomenological rate expression (i.e. the Butler-Volmer equation). In this chapter the basic rate expression describing an ion transfer reaction at the metal-solution interface will be developed. This will follow the derivation originally outlined by Vetter [47] but descriptions of the kinetics of ion transfer reactions are also available in other monographs [46, 48, 49]. This equation will then be applied to a number of model deposition and dissolution systems and the relevant reaction mechanism will be elaborated. Finally, the relevance of this kinetic and mechanistic information to pulse plating will be addressed.
3.2 Simple Charge Transfer Kinetics
In our simplifi ed model we will consider the ion transfer reaction associated with the deposition and dissolution of a single cation:
Mz++ze- ↔ M <45>
This process involves the movement of a hydrated Mz+ ion from the outer Helmholtz plane (OHP) to the electrode surface where it gains electron(s) to become an ad-atom. The disso-lution of the metal (M) can be considered the reverse of this process. As noted earlier, this is an oversimplifi cation of the actual processes involved but will allow a relatively straight-forward derivation of the charge transfer equation.
kc''
ka''
Reaction Kinetics52
From conventional chemical kinetics the rates, ν, of the anodic and cathodic reactions for equation <45> can be expressed as:
νa = k''a cM <46>
νc = k''c cMz+ <47>
where k′a and k′
c represent fi rst order rate constants which are functions of the potential applied across the interface and cM and cMz+ are the concentration of the metal and metal ion respectively.
The net reaction rate is then given by:
ν = νa - νc = k''a cM - k''c cMz+ <48>
In electrochemical experiments the rate of a charge transfer reaction is measured in terms of the current density j = zFv so that this equation can be re-written as:
j = ja+ jc = Fk''a cM - Fk''c cMz+ <49>
This equation describes the dependency of the ion transfer rate on the concentration of the reactants and rate constants but the crucial issue is to determine how the latter depend on the applied potential. To derive this relationship we need to apply transition state theory to the reactions occurring at the interface.
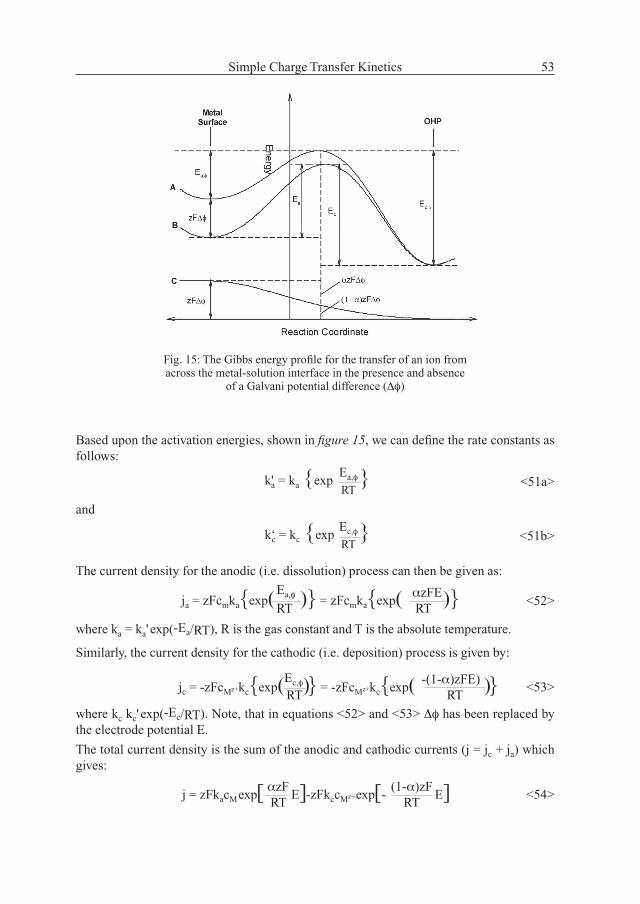
The kinetics of the ion transfer processes across the metal-solution interface can be conven-iently analysed in terms of a plot of the Gibbs energy versus the reaction co-ordinate (fi g. 15). In the present (simplifi ed) case the reaction co-ordinate corresponds to the distance be-tween the surface and the ion. As the metal ion approaches the electrode surface it loses part of its hydration sphere and also displaces water molecules from the surface. The Gibbs energy therefore increases at fi rst but then decreases as the ion approaches the surface and chemically interacts with it (curve A in fi g. 15). The resulting maximum in free energy cor-responds to the transition state for the ion transfer process.
For a metal ion located at the OHP there is an activation energy Ec associated with the transition state to be overcome before it can be deposited. Similarly, an ad-atom on the electrode surface must overcome Ea to become an ion in solution. If a Galvani potential difference Δφ is now imposed across the metal-solution interface then this contributes an additional free energy (curve C) to the original profi le and the activation energies are modifi ed as follows:
Ea,φ = Ea - αzFΔφ <50>
Ec,φ = Ec+ (1-α) zFΔφ <51>
This situation is indicated as curve B in fi gure 15. The factor α is known as the transfer coeffi cient (the term α is also commonly referred to as the symmetry factor and sometimes designated as β) and it describes the fraction of the potential induced free energy change that is used to modify the activation energy (i.e. the rate) of the cathodic and anodic proc-esses. In the present case a positive potential (Δφ > 0) has been applied so that the anodic process has its activation energy reduced while for the cathodic process it is increased. Referring to fi gure 15 it can be seen that the magnitude of α depends on how far along the reaction co-ordinate the transition state is found. If this state is found close to the electrode surface then α will tend to 0; if it is nearer to the OHP then α will tend to 1.
53
jc = -zFcMz+kc{exp( Ec,φ)} = -zFcMz+kc{exp( -(1-α)zFE)
RT RT )} <53>
Simple Charge Transfer Kinetics
Fig. 15: The Gibbs energy profi le for the transfer of an ion from across the metal-solution interface in the presence and absence
of a Galvani potential difference (Δφ)
The current density for the anodic (i.e. dissolution) process can then be given as:
where ka = ka' exp(-Ea/RT), R is the gas constant and T is the absolute temperature.
Similarly, the current density for the cathodic (i.e. deposition) process is given by:
where kc kc' exp(-Ec/RT). Note, that in equations <52> and <53> Δφ has been replaced by the electrode potential E.
The total current density is the sum of the anodic and cathodic currents (j = jc + ja) which gives:
j = zFkacM exp[ αzF
E]-zFkccMz+ exp[- (1-α)zF
RT RT E] <54>
ja = zFcmka{exp( Ea,φ )} = zFcmka{exp( αzFE
RT RT )} <52>
Based upon the activation energies, shown in fi gure 15, we can defi ne the rate constants as follows:
k'a = ka {exp Ea,φ }
RT <51a>
and
k‘c = kc {exp Ec,φ }
RT <51b>

Reaction Kinetics54
This equation describes the complete current-potential dependence of an ion transfer reac-tion. The notable aspect of this equation is that it is expressed as a summation of an anodic and a cathodic part. The sum of the two rates of charge transfer gives rise to a measurable current. Imposing a potential, therefore, should not be confused with initiating the reaction. As was discussed in chapter 2, the surface is undergoing continuous deposition and dis-solution even when there is no net observable current. The role of the applied potential is simply to alter the relative rates of the anodic and cathodic processes.
The above equation can be expressed in a more compact form by noting that, at the equilib-rium potential, Er, the relationship jc = ja = j0 holds. By replacing the electrode potential, E, in equation <54> with Er we obtain:
The term j0 is known as the exchange current density and is effectively a measure of how fast the ion transfer process occurs. The value of j0 is related to the rate constants for the anodic and cathodic processes but also to the concentrations of the species that participate in the electrode reaction. Therefore, if j0 is used to compare the relative rates of charge transfer reactions, allowances should be made for any differences in reactant concen-trations. The magnitude of j0 depends on many factors related to the composition of the electrolyte and the condition of the electrode surface, but for metal ion reactions j0 values of between 10-4 A/dm2 and 1 A/dm2
are typical.
Defi ning the overpotential as η = E - Er the following equation can be derived:
j0 = FkacMexp[ αzF
Er] = FkccMz+exp[- (1-α)zF
RT RT Er] <55>
The ion transfer equation <56> is very similar in appearance to the Butler-Volmer equa-tion <57> used to describe electron transfer reactions except that the former includes the charge transfer valency, z.
j = j0{exp( αzF
η)-exp(- (1-α)zF
RT RT η)} <56>
Nominally equations <56> and <57> look very similar but there are some important differences. Firstly, it is generally thought that only a single electron can be transferred across the interface at a time, so that a charge transfer reaction involving more than a single electron can only occur by consecutive steps. In contrast, for ion transfer it is possible for more than one unit of elementary charge (e.g. a divalent ion) to be transferred across the double layer in a single step. The second point relates to the value of the transfer coeffi cient. For electron transfer, on theoretical grounds it is expected that α ≈ 0.50 but for ion transfer there is no a priori reason why this needs to be the case [46, 50]. According to Figure 15, α will depend on the position of the transition state on the reaction co-ordinate and the only constraint is that 0 < α > 1.
This situation for ion transfer from a multivalent ion is, however, more complex than that described above. While it is possible that the divalent ion (M2+) can transferred in a single step to the surface, theoretical studies have shown that this is unlikely [51, 52]. For exam-ple, Schmickler [51] has shown that that the transfer of the M2+ ion to the surface would require a complete loss of its hydration sheath in one step and this is energetically unfa-
j = j0{exp( αF
η)-exp(- (1-α)F
RT RT η)} <57>
4 Nucleation and Morphology
4.1 Introduction
The infl uence of (short) current pulses on the nucleation and the crystallisation is among the best-described phenomena induced by pulse deposition [104, 108, 120, 121]. Pulse plating can favour the nucleation over the growth of existing crystals leading to a signifi cant grain refi nement of the resulting deposits. This goes, following basically the Hall-Petch relation, hand in hand with an increase in deposit density and (micro) hardness. While this industri-ally useful effect is mostly related to pulse deposition only, the deposition of nanocrystal-line coatings is not necessarily limited to the use of pulse plating techniques. Especially by the addition of special organic additives to the plating electrolyte, fi ne to nano-grained coatings can be produced easily [138-140].
In order to being able to use pulse plating for grain refi nement, the mechanism of depo-sition has to be known for the electrolyte system used. It has to be considered, that the optimum parameters for a fi ne grain structure might be in a region that is far of the opti-mum of current distribution (thus leading to non-uniform coatings) or mass transport (thus being under limiting current conditions and rough, porous coatings). Since short pulses with high current density will favour nucleation (and thus reduce grain size), especially the charging and discharging time of the electrolytic double layer may limit the possibilities and have to be known. The general line/bath set up might also infl uence or even counteract the efforts, e.g. by cable inductance (see also chap. 8 and 9).
4.2 Mechanism of the Electrochemical Metal Deposition
The simplest form of describing a metal deposition is by the reduction of a metal ion via electron transfer at a cathode surface.
Men++ ne- ↔ Me0 <89>
Assuming that the active metal ions are present as metal complexes in the aqueous solution that will be reduced at the cathode surface, equation <89> can be written as [105]:
[Men+Xm]solution+ ne- ↔ Me0Surface+ mX <90>

73Mechanism of the Electrochemical Metal Deposition
with X being the complex building neutral molecules (e.g. H2O, NH3) or anions (e.g. chlorides, cyanide,..). In this simplifi cation, a metal ion surrounded by m water dipoles is seen as an aqueous complex [105]. In this simple model, the deposit will grow layer-wise (similar to the growth of a single crystal). There are two ways a metal ion can be discharged and incorporated into the metal grid: it can be discharged at the outer Helmholtz layer (chap. 2) to an adsorbed atom ( ad-atom) that will consecutively diffuse at the surface to-wards the next growth site or it might directly be incorporated from the outer Helmholtz layer at the growth site after the charge transfer (without surface diffusion). Two competing reactions will occur at the surface after an ad-atom is formed at the surface: the ad-atom might start a new nuclei (nucleation) or might diffuse towards an existing (and growing) nuclei and be incorporated there ( crystal growth). Figure 25 shows the schematic of these possible reactions at the cathode surface [105].
For the mechanism including surface diffusion the ad-atoms are built at the surface and will diffuse towards the edges of the next growth site. If the distance between two growth sites is defi ned to be 2x0 than the step density (lines per cm) Ls and x0 is given by:
X0 = ½LS <91>
Fig. 25: Schematic of the single elementary steps of metal deposition: a) charge transfer, building of an ad-atom and sur-face diffusion towards the next growth site; b) charge transfer
directly at the growth site; and c) charge transfer and two-dimensional nucleation [105]
Nucleation and Morphology74
If the surface diffusion is rate determining (slow in comparison to the charge transfer) and there is an equilibrium between the ad-atoms and the atoms incorporated at the growing edges, than we can defi ne a concentration of ad-atoms of c0
ad during deposition. In a dis-tance far from the growth site a constant concentration of ad-atom will be established cad > c0
ad. This concentration will depend on the applied current density and overpotential η and thus the velocity of deposition. The difference between cad - c
0ad is related to the crystallisa-
tion overpotential ηK according to:
This crystallisation overpotential can be expected in case of rate determining surface diffusion or with rate determining nucleation but not in case of direct discharge at the growth sites. Taking this into account for the calculation of the current-potential plot will lead to the following equation:
with Dad being the coeffi cient of the surface diffusion and the second and the third term being representative for the time related change of the ad-atom concentration due to the cathodic and anodic partial current density and cad the concentration of ad-atoms at the point x. Under assumption of fast mass transport the concentration of metal ions at the elec-trode surface should be the same, making the cathodic term of equation <93> independent from the actual location at the electrode. Thus the equations for the partial current densities can be written as:
∂cad = Dad
∂cad +
j-(η) - (j+(η)
∂t ∂x2 nF nFc0ad
cad(x) <93>
j-(η) = j0,adexp[-
(1-α)nF
RT η] <94>
with j0,ad being the exchange current density of the deposition reaction of the ad-atoms.
For the simplifi cation of one-dimensional diffusion and steady state conditions (j = j+ + j-) equation <93> can be solved [105]:
j+(η) = j0,adexp[-
αnF RT
η] <95>
with λ0 being:
j = j0,ad{exp[ αnF η]-exp[-
(1-α)nF η]} λ0 tanh x0
RT RT x0 λ0 <96>
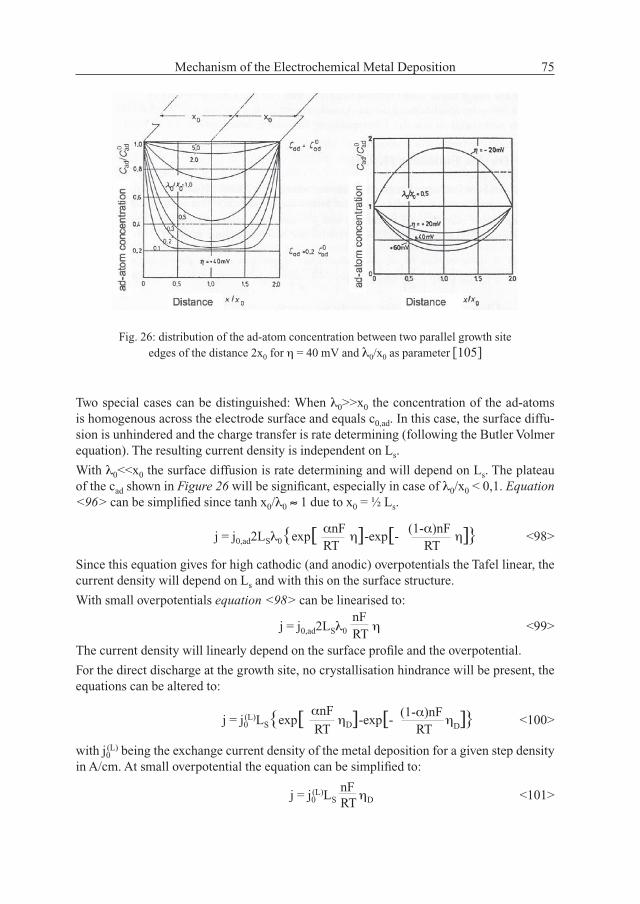
The ad-atom concentration between two parallel growth site edges is depicted in Figure 26, with λ0/x0 as parameter for an anodic overpotential of 40 mV (cad < c0,ad) [105]. Since λ0 is proportional to the coeffi cient of the surface diffusion √Dad it is a quantifi cation of the surface diffusion penetration in the x-direction.
ηK =
RT ln c0
ad
nF cad <92>
λ0 = ( nFDadc
0ad )
½
exp[- αnF
j0,ad 2RT η] <97>
75Mechanism of the Electrochemical Metal Deposition
Fig. 26: distribution of the ad-atom concentration between two parallel growth site edges of the distance 2x0 for η = 40 mV and λ0/x0 as parameter [105]
Since this equation gives for high cathodic (and anodic) overpotentials the Tafel linear, the current density will depend on Ls and with this on the surface structure.
With small overpotentials equation <98> can be linearised to:
j = j0,ad2LSλ0{exp[ αnF
η]-exp[- (1-α)nF
RT RT η]} <98>
The current density will linearly depend on the surface profi le and the overpotential.
For the direct discharge at the growth site, no crystallisation hindrance will be present, the equations can be altered to:
j = j0,ad2LSλ0
nF RT
η <99>
with j0(L) being the exchange current density of the metal deposition for a given step density
in A/cm. At small overpotential the equation can be simplifi ed to:
j = j0(L)LS{exp[ αnF ηD]-exp[-
(1-α)nF RT RT
ηD]} <100>
j = j0
(L)LS nF
RT ηD <101>
Two special cases can be distinguished: When λ0>>x0 the concentration of the ad-atoms is homogenous across the electrode surface and equals c0,ad. In this case, the surface diffu-sion is unhindered and the charge transfer is rate determining (following the Butler Volmer equation). The resulting current density is independent on Ls.
With λ0<<x0 the surface diffusion is rate determining and will depend on Ls. The plateau of the cad shown in Figure 26 will be signifi cant, especially in case of λ0/x0 < 0,1. Equation <96> can be simplifi ed since tanh x0/λ0 ≈ 1 due to x0 = ½ Ls.