pulp and paper industry outlook - maineforest.org
TRANSCRIPT

September 20th, 2021
Pulp and Paper Industry Outlook
Prepared for the Maine Forest Products Council

We Help Companies Use Data to Make Exponentially Better Decisions
Pulp / Paper Value Chains Forest Value Chains Chemical Value Chains

Pulp and Paper Industry TrendsContainerboard and e-Commerce
Investment and ConversionChina
SustainabilityMaine

Source: FisherSolve™ Next. Fisher International, Inc.
Global Market Pulp, Paper and Tissue Capacity
Over the Long Run, the Industry Is Still Growing 2.0% AnnuallyFueled by Packaging, Far and Away the Largest Segment in the Industry
4
0
100
200
300
400
500
600
700
2007
2008
2009
2010
2011
2012
2013
2014
2015
2016
2017
2018
2019
2020
2021
e
2022
e
2023
e
Mill
ion
Tons
Africa Asia Pacific Europe Latin America Middle East North America
2.0% CAGR
0
50
100
150
200
250
300
350
400
2007
2008
2009
2010
2011
2012
2013
2014
2015
2016
2017
2018
2019
2020
2021
e
2022
e
2023
e
Mill
ion
Tons
Packaging Market Pulp NewsprintPrinting and Writing Specialties Tissue and Towel
Source: FisherSolve™ Next. Fisher International, Inc.
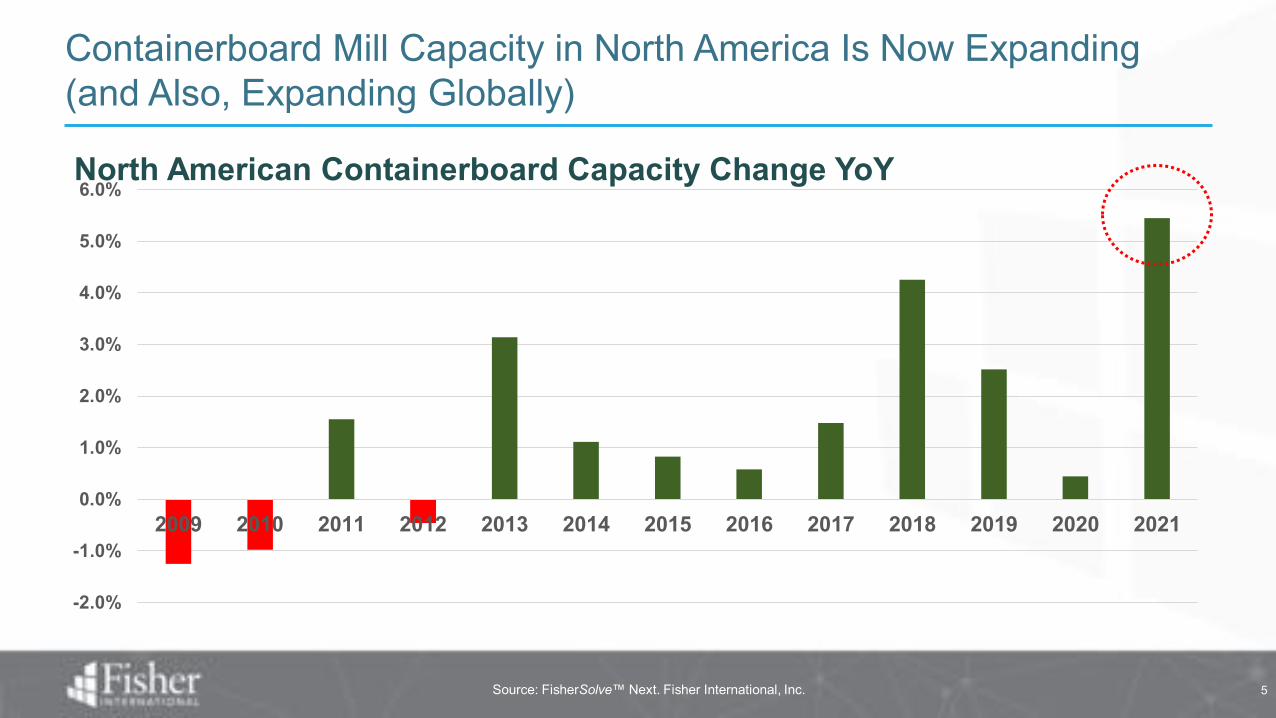
North American Containerboard Capacity Change YoY
Containerboard Mill Capacity in North America Is Now Expanding (and Also, Expanding Globally)
5
-2.0%
-1.0%
0.0%
1.0%
2.0%
3.0%
4.0%
5.0%
6.0%
2009 2010 2011 2012 2013 2014 2015 2016 2017 2018 2019 2020 2021
Source: FisherSolve™ Next. Fisher International, Inc.
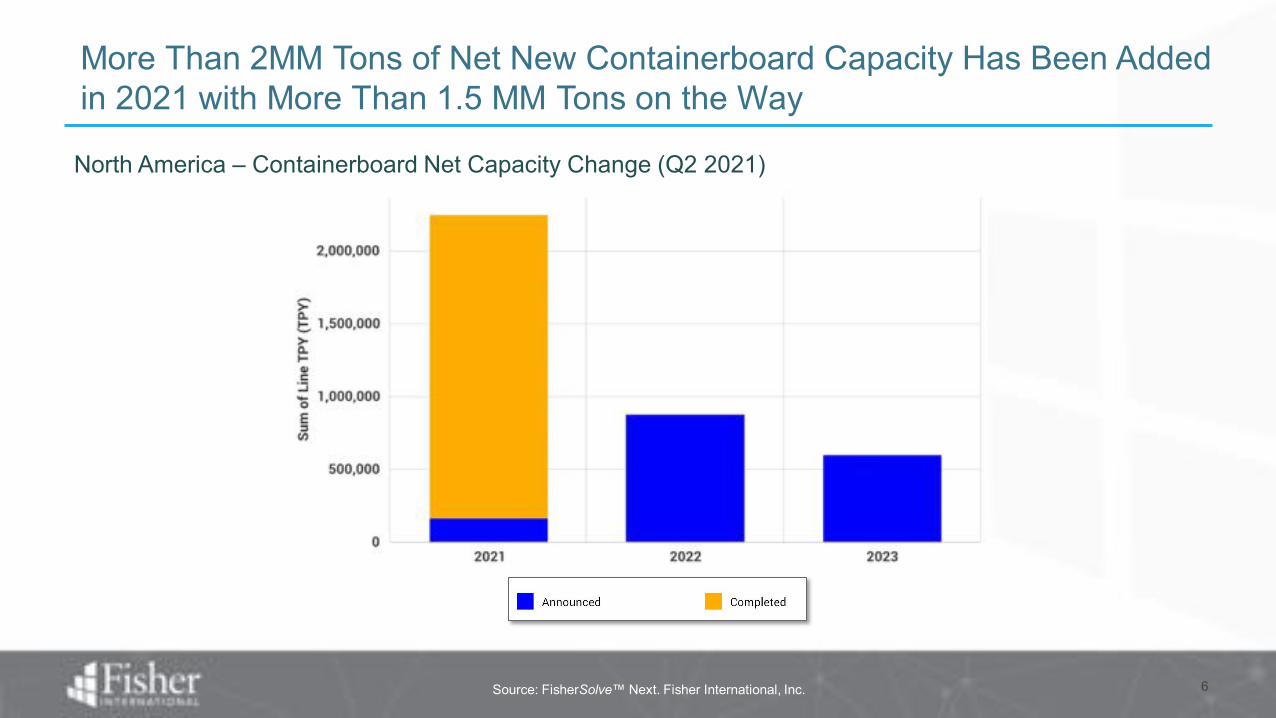
North America – Containerboard Net Capacity Change (Q2 2021)
More Than 2MM Tons of Net New Containerboard Capacity Has Been Added in 2021 with More Than 1.5 MM Tons on the Way
6

One of These Things is Not Like the Other→Not Your Normal Recession
U.S. Corrugated Demand Growth Less US GDP Growth (2006-2020)
FRED, FBA, FIsher
-10.00%
-8.00%
-6.00%
-4.00%
-2.00%
0.00%
2.00%
4.00%
6.00%
8.00%
10.00%
Box
Dem
and
Lags
GD
PB
ox D
eman
d B
eats
GD
P
2008
2020

E-Commerce Saved Corrugated and Containerboard from a Certain Downturn in 2020
The Three Main Drivers of U.S. Corrugated Demand (2019=100) During the Pandemic
FRED, Fisher-STE System Dynamics
0
20
40
60
80
100
120
140
160
Indu
stria
l Pro
duct
ion
or S
ales
(E
-Com
mer
ce)
Non-Durable Durable E-Commerce
E-commerce accelerated, offsetting declines in other sectorsDurable and non-durable goods (about
85% of demand) behaved as expected during the first economic shock

• How much penetration will E-Retail sales reach?
• Does e-commerce packaging evolve so that less paper is needed?
‒ Ship in own container (SIOC)‒ Right-sizing (less box area per package)‒ Lightweighting (lightweight liners and
mediums)
• What happens as e-commerce becomes an increasingly larger share of containerboard demand, AND its packaging gets optimized to result in a lower box intensity?
E-Commerce and Containerboard

Source: FisherSolve™ Next. Fisher International, Inc.
Fisher Modeled U.S. Containerboard Cut-Up By E-Commerce Box Optimization Assumption*
The Answer Is (Very) ImportantWhat Will U.S. Containerboard Demand Be in the Future?
10
2016 2017 2018 2019 2020 2021 2022 2023 2024 2025Box Intensity the Same Optimization at 1% p.a. Optimization at 2% p.a. Optimization at 3% p.a.
1.5 MM st additional containerboard demand
1.5 MM st of containerboard not needed
*Also assumes e-commerce sales grow at pre COVID rate.

11
We Know That Packaging Will Change As E-Commerce Growth Continues: Changing Substrates, Packages, and “Merging” of Consumer and Industrial
Coated Recycled
BoardCUK /
Linerboard
Retail Ready to “E-Retail Ready” Merging of Substrates
“The Package Becomes the Symbol that Implies Favorable or Unfavorable Meaning About the Product” Underwood, et al, 2001

Investment and Conversion

Every Reaction…
No Office or School: No Copy Paper
Fisher, DocuSign company filings
Estim
ated
Pap
er C
onsu
mpt
ion
(lbs
/ yea
r)
Office Workers At Home Workers
Contracts Don’t Need Paper, Either
Source: FisherSolve™ Next. Fisher International, Inc.
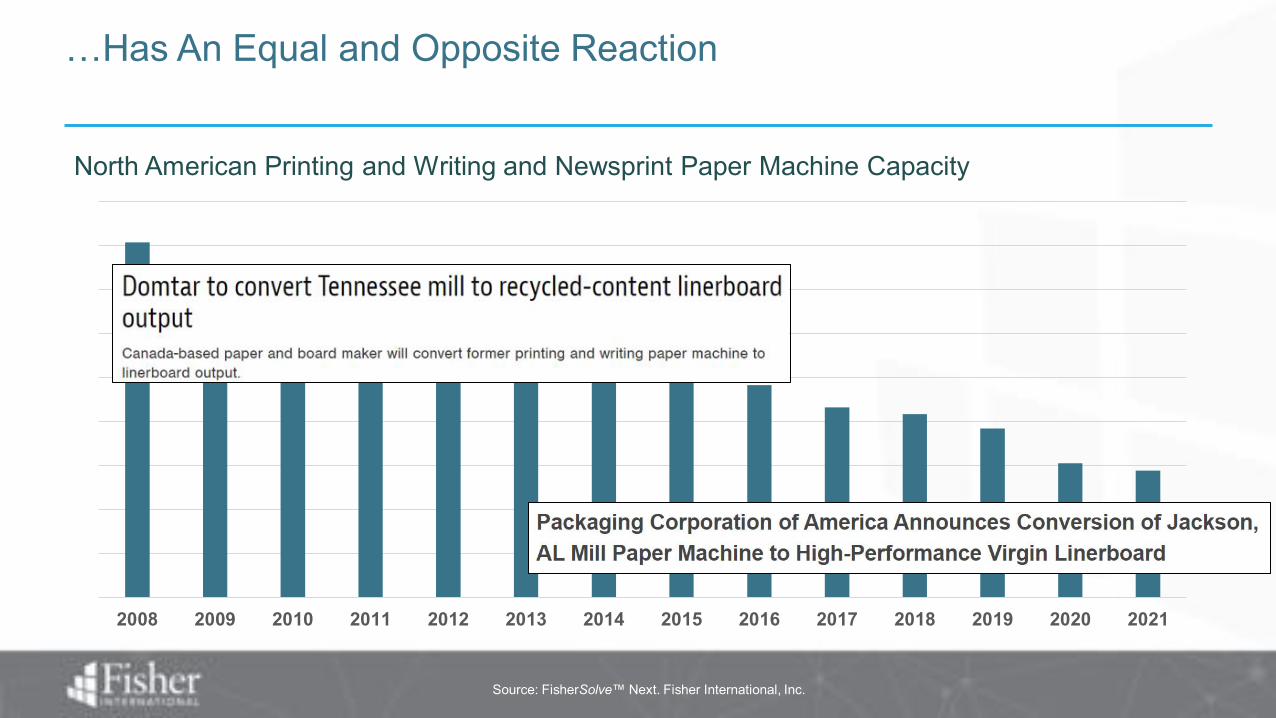
2008 2009 2010 2011 2012 2013 2014 2015 2016 2017 2018 2019 2020 2021
North American Printing and Writing and Newsprint Paper Machine Capacity
…Has An Equal and Opposite Reaction

There Are Approximately 65 Pulp Integrated Sites Producing "Stressed Grades" in North America
15
Integrated Printing & Writing and Newsprint Mills
Recycled Integrated
Virgin & Recycled Integrated
Virgin Integrated
Sites with viable pulp assets could be excellent acquisition or conversion candidates

Source: FisherSolve™ Next. Fisher International, Inc.
North American Containerboard – Operated Capacity Evolution by Company
Is a Different Landscape Emerging in North American Containerboard?
16
2015 2016 2017 2018 2019 2020 2021 2022 2023

Source: FisherSolve™ Next. Fisher International, Inc.
North American Containerboard – Operated Capacity Evolution by Company
Is A Different Landscape Emerging in North American Containerboard?
17
2015 2016 2017 2018 2019 2020 2021 2022 2023
50% growth in smaller player capacity

Source: FisherSolve™ Next. Fisher International, Inc.
Investments in Recycled Containerboard products – Present and Future
Source: FisherSolve™ Next. Fisher International, Inc.
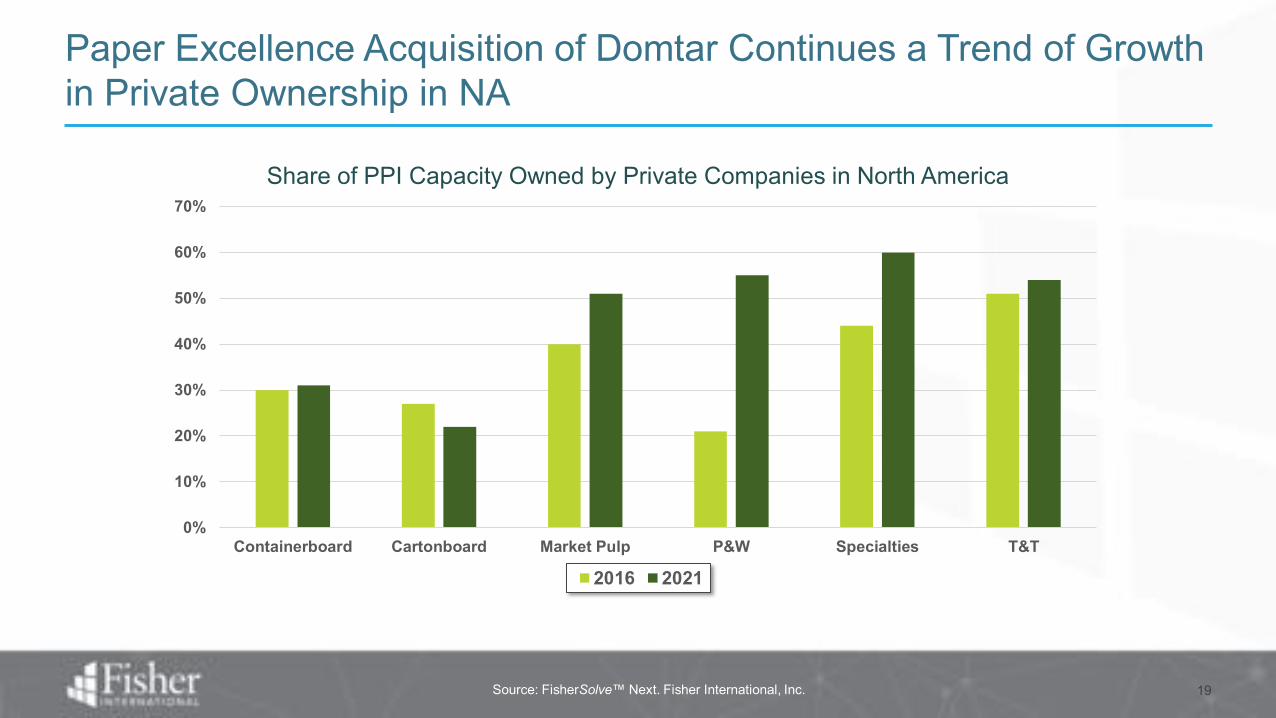
Paper Excellence Acquisition of Domtar Continues a Trend of Growth in Private Ownership in NA
19
0%
10%
20%
30%
40%
50%
60%
70%
Containerboard Cartonboard Market Pulp P&W Specialties T&T
Share of PPI Capacity Owned by Private Companies in North America
2016 2021

China

Source: FisherSolve™ Next. Fisher International, Inc.
Actual and Announced Capacity Changes in China 2020-2022
China’s Pulp and Paper Industry Continues to Grow

OCC Exports from the US Rotate Away from China and toward SE Asia, as China OCC Ban and Relocation of Chinese Manufacturing Continues
Source: USATradeOnline 22
-
500
1,000
1,500
2,000
2,500
3,000
3,500
4,000
Q12017
Q22017
Q32017
Q42017
Q12018
Q22018
Q32018
Q42018
Q12019
Q22019
Q32019
Q42019
Q12020
Q22020
Q32020
Q42020
Q12021
US
OC
C E
xpor
ts (0
00 -
ST)
China India Indonesia Korea, South Taiwan Thailand Vietnam ROW
2017 – 2021 YTD US OCC Exports (short tons)
23
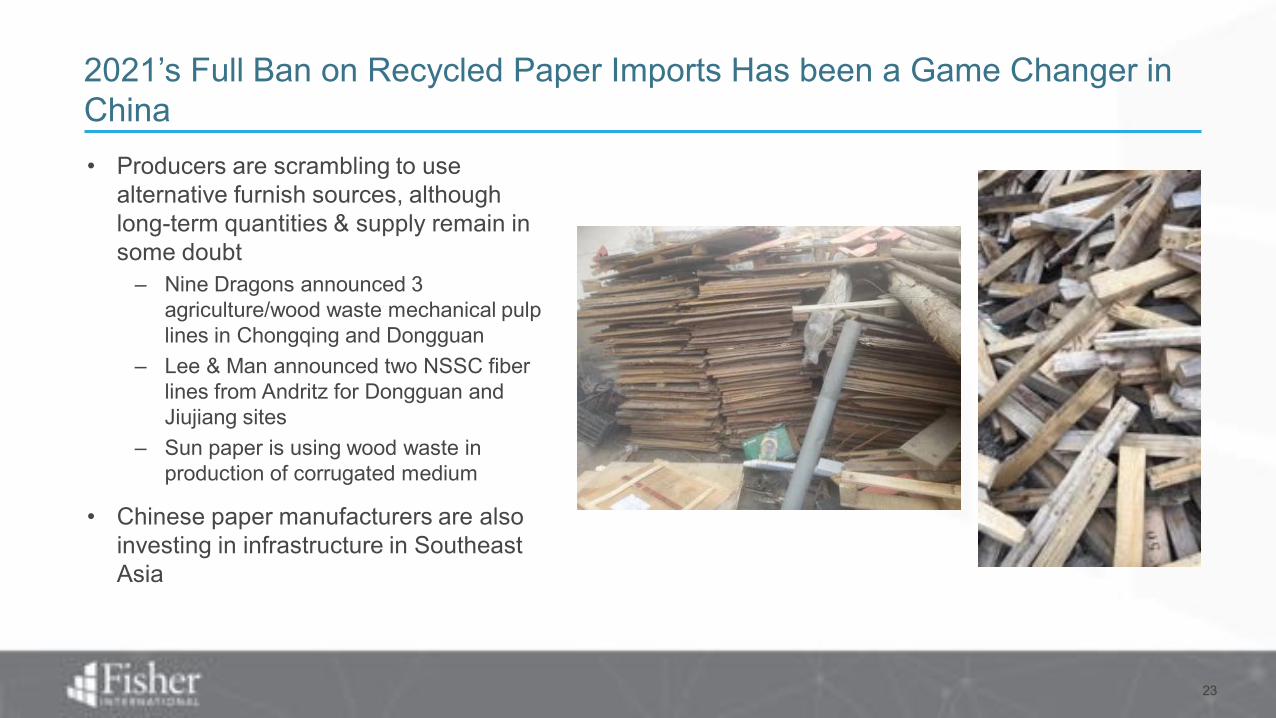
• Producers are scrambling to use alternative furnish sources, although long-term quantities & supply remain in some doubt
– Nine Dragons announced 3 agriculture/wood waste mechanical pulp lines in Chongqing and Dongguan
– Lee & Man announced two NSSC fiber lines from Andritz for Dongguan and Jiujiang sites
– Sun paper is using wood waste in production of corrugated medium
• Chinese paper manufacturers are also investing in infrastructure in Southeast Asia
2021’s Full Ban on Recycled Paper Imports Has been a Game Changer in China

Source: FisherSolve™ Next. Fisher International, Inc.
Asia Has the Highest Carbon Emission Equivalentper Ton of Paper Compared to Other Regions
© 2021 Fisher International, Inc. 24
According to Fisher’s carbon emission model, the carbon emission equivalent per ton of paper in Asia is the highest in the world.

Sustainability
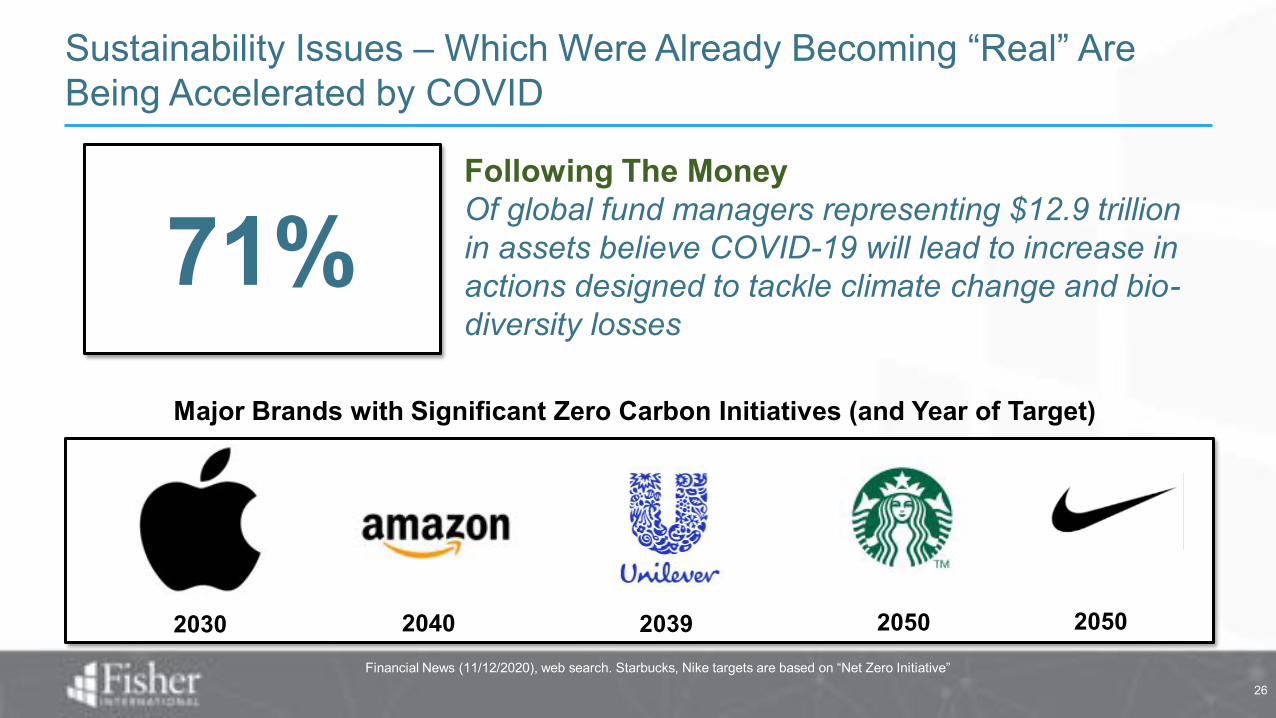
Sustainability Issues – Which Were Already Becoming “Real” Are Being Accelerated by COVID
Financial News (11/12/2020), web search. Starbucks, Nike targets are based on “Net Zero Initiative”26
71%Following The MoneyOf global fund managers representing $12.9 trillion in assets believe COVID-19 will lead to increase in actions designed to tackle climate change and bio-diversity losses
Major Brands with Significant Zero Carbon Initiatives (and Year of Target)
2030 2040 2039 2050 2050

• President Biden wrote one of the first climate bills in the U.S. Senate.
• He has promised an “enforcement mechanism” to limit carbon emissions.
• He has promised to cut U.S. Greenhouse emissions in half by 2030.
• Janet Yellen, the new Treasury secretary, favors market-based mechanisms
• The administration has said that a system targeting sector-specific standards is preferred. (Similar to California ETS)
It Is a Matter of “When”, “Not if”, Carbon Will Hit Your Bottom Line
Janet Yellen, Treasury Secretary

Source: FisherSolve™ Next. Fisher International, Inc.
North American Containerboard Greenhouse Gas Emissions by Mill
Carbon Taxes (or Their Equivalent) Could Create Wide Differences in Costs for North American Mills
4X as much carbon for highest emitting mills
Source: FisherSolve™ Next. Fisher International, Inc.
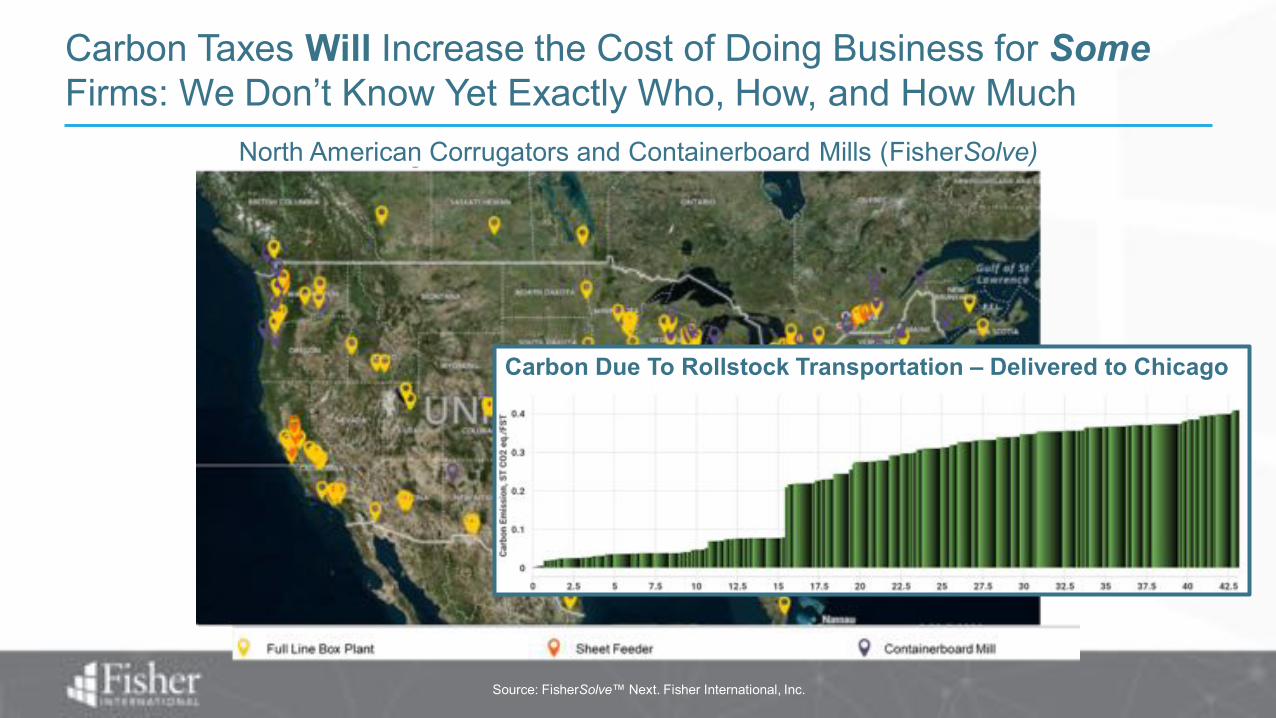
Carbon Taxes Will Increase the Cost of Doing Business for SomeFirms: We Don’t Know Yet Exactly Who, How, and How Much
Carbon Due To Rollstock Transportation – Delivered to Chicago
North American Corrugators and Containerboard Mills (FisherSolve)

Bioproduct Facilities and Anti-Plastic Measures Seem Promising for the European Industry of the Future, but Will Regulation Continue On?
• Initial studies have identified that roughly one-quarter of EU plastic packaging use could be cut reduced without significant compromise, representing ~4.5 Mt of packaging
• New EU single use plastic tax 80 €/t is expected to accelerate the shift in demand from plastics to fiber-based materials
• Initial increases are expected in bags segment
Source: https://materialeconomics.com/publications/sustainable-packaging 30
While the initial thinking could be a positive for the industry, future phases of discussed regulation may enforce limits on single use products… of any type

Maine
Source: FisherSolve™ Next. Fisher International, Inc.
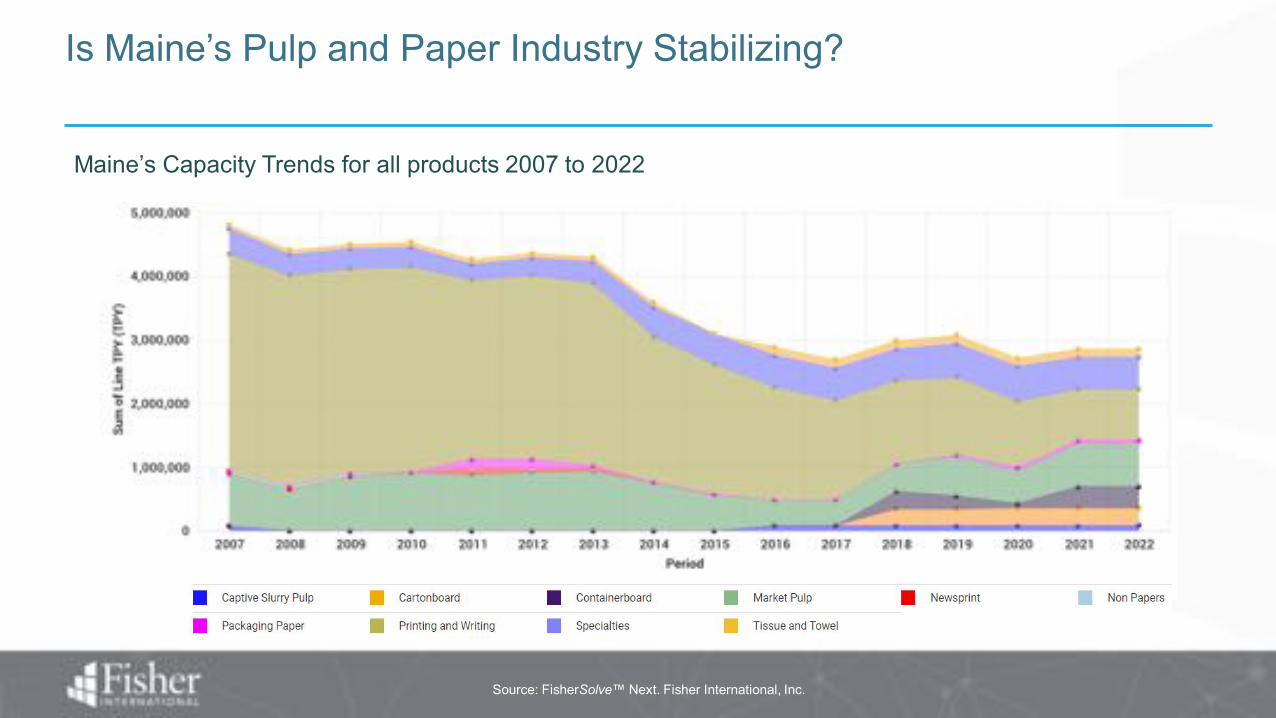
Maine’s Capacity Trends for all products 2007 to 2022
Is Maine’s Pulp and Paper Industry Stabilizing?
Source: FisherSolve™ Next. Fisher International, Inc.
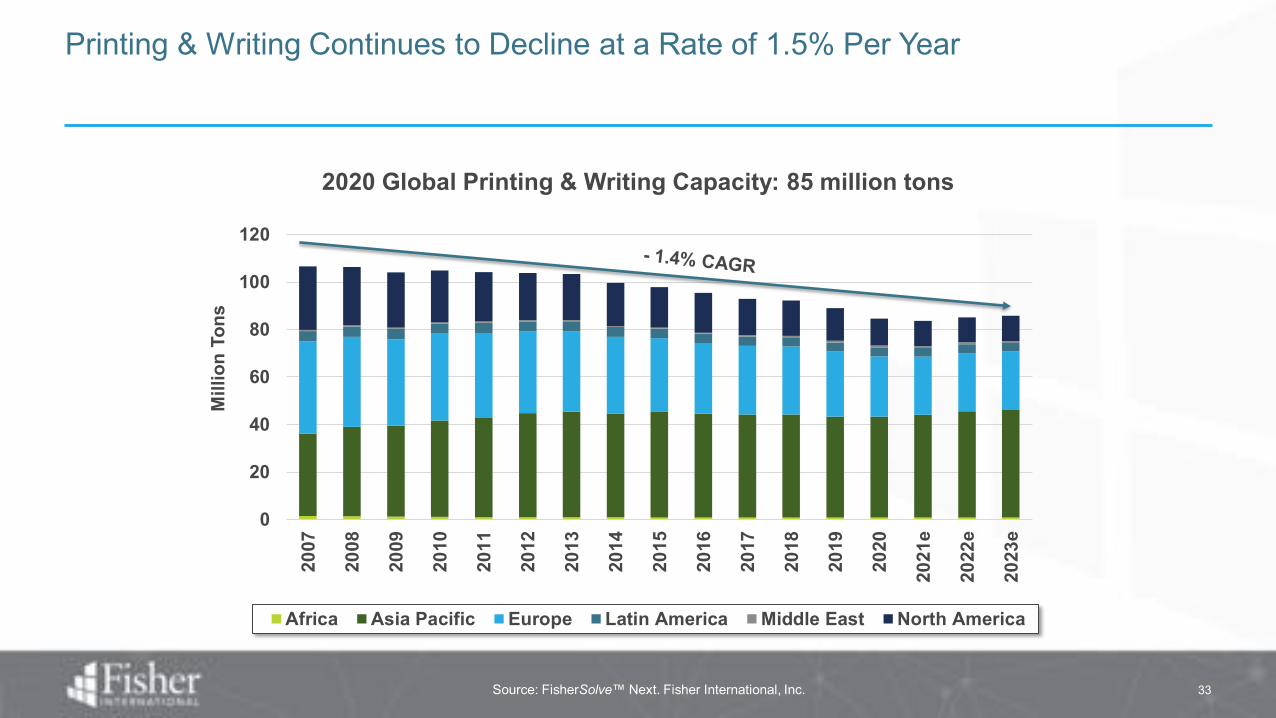
Printing & Writing Continues to Decline at a Rate of 1.5% Per Year
33
0
20
40
60
80
100
120
2007
2008
2009
2010
2011
2012
2013
2014
2015
2016
2017
2018
2019
2020
2021
e
2022
e
2023
e
Mill
ion
Tons
Africa Asia Pacific Europe Latin America Middle East North America
2020 Global Printing & Writing Capacity: 85 million tons

Source: FisherSolve™ Next. Fisher International, Inc.
2007
Maine’s Capacity Evolution in the 2000’s – Moving away from Printing and Writing
2021

Source: FisherSolve™ Next. Fisher International, Inc.
Average price (USD/FST) of Market Pulp products from 2017 to 2021
Kraft Market Pulp products show increasing trend

Source: FisherSolve™ Next. Fisher International, Inc.
2020 Global Specialties Capacity: 25 million tons
Specialty Grades – Particularly Release Paper – Are Displaying Steady Growth with Asia, Europe and North America Announcing Additional Capacity
36
0
5
10
15
20
25
30
2007
2008
2009
2010
2011
2012
2013
2014
2015
2016
2017
2018
2019
2020
2021
e
2022
e
2023
e
Mill
ion
Tons
Africa Asia Pacific Europe Latin America Middle East North America

• Pulp and Paper production less concentrated in Printing and Writing– Diversification into grades in markets exhibiting growth
• Market Pulp• Specialties• Containerboard• Tissue & Towel
• Potential for investment– Virgin pulp availability continuing to decline– Stressed assets/grades can be attractive for investors– Availability of raw materials could attract other forest bioproducts investment
• Challenges– Impact of EPR legislation
• What does it mean for current producers?• How will this impact decisions for potential investors?
– Impact of Carbon legislation
Maine’s Pulp and Paper Industry Moving Forward

NORTH AMERICA • LATIN AMERICA • EUROPE • NORDICS • ASIA
BETTER INTELLIGENCE. BETTER DECISIONS.
Corporate Headquarters15720 Brixham Hill Ave #550
Charlotte, NC 28277 USAT +1 704.540.1440www.fisheri.com
www.forest2market.com www.orbichem.com
Sage DuguayBusiness Intelligence Consultant