pulaski county snapshot
TRANSCRIPT

Data SnapShot Series 1.1May 2015
DATA SNAPSHOTPulaski County

2
Hometown Collaboration InitiativeThis report has been produced by the Purdue Center for Regional Development as a part of the Indiana Hometown Collaboration Initiative (HCI). HCI is funded, in part, by the Indiana Office of Community and Rural Affairs.

Table of contents
Introduction01Demography02
Economy03Labor Market04

Purpose
About Pulaski County
01introductio
n

5
Purpose
This document provides information and data about Pulaski County that can be used to guide local decision-making activities.
The Data SnapShot showcases a variety of demographic, economic and labor market information that local leaders, community organizations and others can use to gain a better perspective on current conditions and opportunities in their county.
To strengthen the value and usability of the information, we showcase the data using a variety of visual tools, such as charts, graphs and tables. In addition, we offer key points about the data as a way of assisting the user with the interpretation of the information presented.
Finally, short takeaway messages are offered at the end of each section in order to highlight some of the more salient findings.
Introduction
section 01

6
About Pulaski CountyIntroduction
section 01
County Background
Established 1839
CountySeat
Winamac
Area 435 sq. mi.
NeighboringCounties
Cass, INFulton, INJasper, IN
Marshall, INStarke, INWhite, IN

Population change
Population pyramids
Race
Ethnicity
Educational attainment
Takeaways
02demograp
hy

8
13,755
13,402
13,007
13,053
Population change
Components of Population Change, 2000-2013
Total Change -617*
Natural Increase 48
International Migration
33
Domestic Migration
-615
The total population is projected to remain the same between 2013 and 2020.
Demography
Sources: STATSIndiana, U.S. Census Bureau – 2000 Decennial Census, 2010 Decennial Census, 2013 Estimates, Estimates of the Components of Resident Population Change
section 02
Pulaski County’s total population decreased by 5 percent between 2000 and 2013. The major contributor to that contraction was domestic migration (the difference between the number of people moving into the county versus moving out) with a net loss of over 600 persons.
International migration had a positive effect on population with a net increase of 33, indicating that the county experienced a minor influx of new people from outside the U.S. Finally, natural Increase (births minus deaths over that span of time) also contributed 48 people to the population of Pulaski County.
Total population projections
2000
2010
2013
2020
*Total change in population differs from the sum of the components due to Census estimation techniques. Residuals (not reported here) make up the difference.

9
0-9
10-19
20-29
30-39
40-49
50-59
60-69
70-79
80+
9 6 3 0 3 6 9
6.3%
7.1%
5.5%
5.9%
6.5%
8.1%
5.9%
3.7%
1.9%
5.5%
6.4%
5.1%
5.5%
6.6%
7.4%
5.9%
4.0%
2.8%
Percent of Total PopulationA
ge C
oh
ort
0-9
10-19
20-29
30-39
40-49
50-59
60-69
70-79
80+
9 6 3 0 3 6 9
7.2%
8.2%
5.5%
7.0%
7.9%
6.0%
4.0%
3.1%
1.6%
6.7%
7.4%
4.8%
6.7%
7.5%
5.5%
4.4%
3.8%
2.8%
Percent of Total Population
Ag
e C
oh
ort
Population pyramidsPopulation pyramids are visual representations of the age distribution of the population by gender.
Approximately 49.6 percent of the population was female in 2000 (6,817) and that percent remained about the same in 2013. What did change is the distribution of people across the various age categories. A larger share of people shifted into the higher age groupings over the 2000 to 2013 time period.
Demography
Source: U.S. Census Bureau – 2000 Decennial Census and 2013 Annual Population Estimates
section 02
In particular, people 50 and over swelled from 14.7% to 19.6% for males and from 16.6% to 20.1% for females between 2000 and 2013. Individuals of prime working age (20-49 years old) dipped from 20.4% to 17.9% for males and from 19.0% to 17.2% for females. The percentage of residents under 20 years of age also declined.
Male
Female
20132000
Male
Female

10
White97%
Black
Asian
Native
Two or More Races
White98%
Black
Asian
Native
Two or More Races
Race
The number of non-White residents in Pulaski County increased by 1 percentage point between 2000 and 2013.
Every race, except White, experienced a numerical increase. The number of individuals of Two or More Races increased the most, by 56 residents, and the population of people who are Native American or of Asian descent in Pulaski County nearly doubled since 2000.
Growth in the non-White population helped to modestly expand the population of Other Races from 2 percent to 3 percent of the total population by 2013.
Demography
Race Data Source: U.S. Census Bureau – 2000 Decennial Census and 2013 Annual Population Estimates
section 02
2000
2013

11
EthnicityHispanics are individuals of any race whose ancestry is from Mexico, Puerto Rico, Cuba, Spain, the Dominican Republic or any other Spanish-speaking Central or South American country.
There were 187 Hispanics residing in Pulaski County in 2000. This figure expanded to 355 by 2013, a 47.3 percent increase.
As a result, Hispanics now make up 3 percent of the overall population, a significant increase since 2000.
Demography
Source: U.S. Census Bureau – 2000 Decennial Census and 2013 Annual Population Estimates
section 02
3%
1%
Hispanics - 2000
Hispanics - 2013

12
No High School;
15%
High School;
45%
Some Col-lege; 21%
Asso-ciate's Degree;
6%
Bachelor's Degree or More; 13%
No High School;
20%
High School;
45%
Some College;
19%
Asso-ciate's Degree;
5%
Bachelor's Degree or More; 10%
Educational attainment Pulaski County experienced a 4
percentage point increase in the number of adults (25 and older)
with an associate’s, bachelor’s, or graduate degree between 2000
and 2013.
The proportion of adults 25 years of age and older with a high school
education or more improved from 80 percent in 2000 to 85 percent by
2013. Those with only a high school degree remained at the 45 percent
level in both 2000 and 2013.
Adults with a college degree increased from 15 percent in 2000 to
19 percent in 2013. This was due to a 1 percentage point increase in the
proportion of residents with associate’s degrees (5 percent
versus 6 percent), while the proportion of adults with at least a
bachelor's degree increased by 3 percentage points (to 13 percent).
Demography
Source: U.S. Census Bureau – 2000 Decennial Census and 2013 ACS
section 02
2000
2013

13
Takeaways Pulaski County has witnessed a modest decline in its population since 2000, mainly due to domestic out-migration (more people moved out of the county for other U.S. locations than moved into the county).
The age structure of Pulaski County is changing. The population is aging and the largest age group of workers (50-59) is nearing retirement age. Additionally, the number of men and women of prime working age (20-29, 30-39 and 40-49) is slowly declining. Moreover, the racial and ethnic make-up of the county is gradually diversifying. In order to maintain the size of the labor force, Pulaski County will have to consider ways to build a vibrant economy with an expanding senior population and a declining pool of workers of prime working age.
The educational attainment of adults 25 and over has improved since 2000, but the percentage
of adults with a high school education remains sizable (at 45 percent). Taking time to assess whether local economic development opportunities might be impeded by the presence of a sizable number of adults with a terminal high school degree may be worthy of attention. While one in five adult residents of the county have an associate’s, bachelor’s, or higher education, this figure is about 11 percent below the figure for the state of Indiana as a whole.
Pulaski County may wish to assess the workforce skills of workers with a high school education only. Enhancing their skills so that they match the needs of local businesses and industries may be a worthy investment.
Demography
section 02

Establishments
Industries
Occupations
Income and poverty
Takeaways
03economy

15
Establishments
Components of Change for Establishments
Total Change (2000-11) 311
Natural Change (births minus deaths) 311
Net Migration 0
The number of establishments in Pulaski County increased 31 percent from 2000 to 2011.
The steady growth of establishments was due to natural change. That is, 991 units were launched in the county between 2000 and 2011, while 680 closed, resulting in a gain of 311 establishments. There was no net gain or loss of establishments in the county over the past decade or so.
Economy
Source: National Establishment Time Series (NETS) – 2012 Database
section 03
An establishment is a physical business
location. Branches, standalones and
headquarters are all considered types of
establishments.
Definition of Company Stages
0 12 3
4
Self-employed
2-9 employees
10-99employees
100-499employees
500+employees
Note: The 2011 figures use 2012 data to include all gains and losses over the entire
year. Establishment information was calculated in-house and may differ slightly from publicly available data.
16
*ReferenceUSA indicates one Stage 4 company, however, NETS records this company astwo separate establishments. Additional information is available on the next slide.
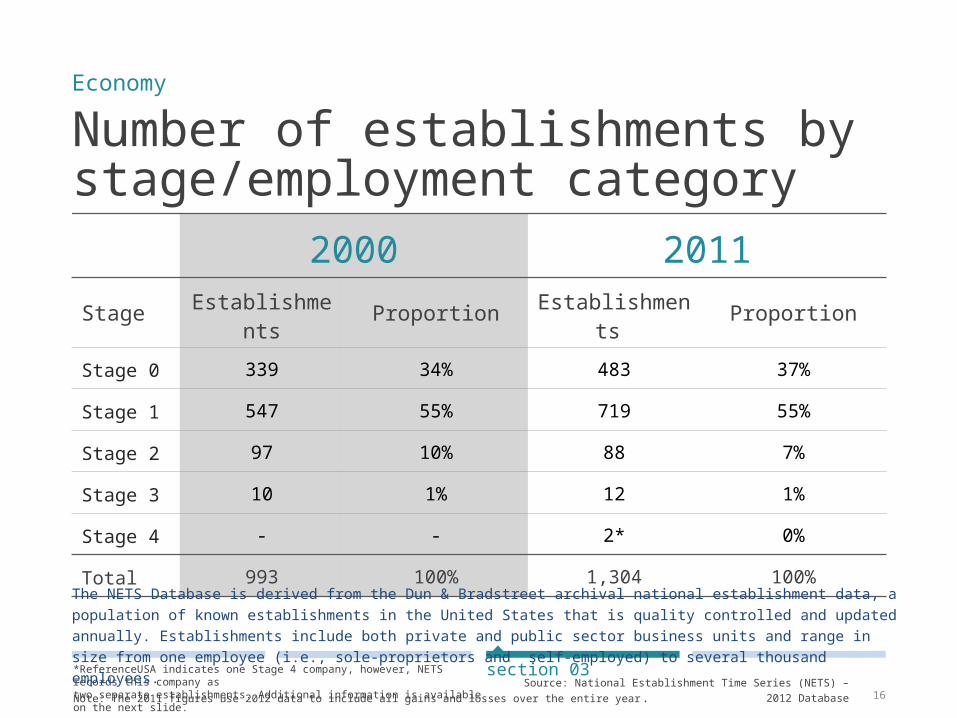
Number of establishments by stage/employment category
Economy
Source: National Establishment Time Series (NETS) – 2012 Database
section 03
2000 2011
Stage Establishments Proportion Establishment
s Proportion
Stage 0 339 34% 483 37%
Stage 1 547 55% 719 55%
Stage 2 97 10% 88 7%
Stage 3 10 1% 12 1%
Stage 4 - - 2* 0%
Total 993 100% 1,304 100%
Note: The 2011 figures use 2012 data to include all gains and losses over the entire year.
The NETS Database is derived from the Dun & Bradstreet archival national establishment data, a population of known establishments in the United States that is quality controlled and updated annually. Establishments include both private and public sector business units and range in size from one employee (i.e., sole-proprietors and self-employed) to several thousand employees.
17
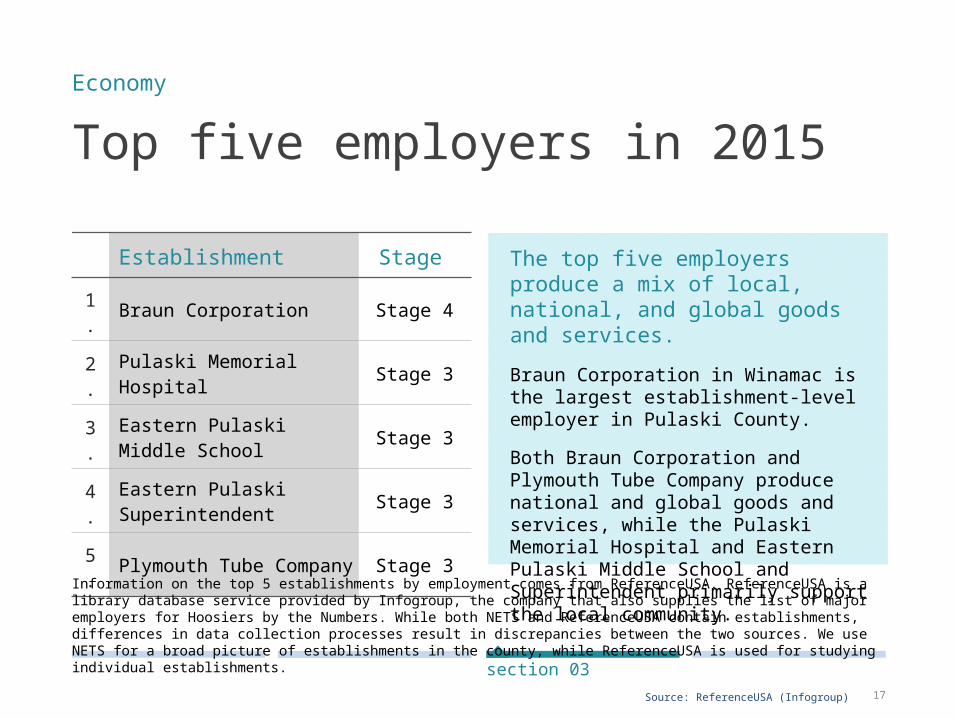
Top five employers in 2015Economy
Source: ReferenceUSA (Infogroup)
section 03
Establishment Stage
1. Braun Corporation Stage 4
2. Pulaski Memorial Hospital
Stage 3
3. Eastern Pulaski Middle School
Stage 3
4. Eastern Pulaski Superintendent
Stage 3
5. Plymouth Tube Company Stage 3
The top five employers produce a mix of local, national, and global goods and services.
Braun Corporation in Winamac is the largest establishment-level employer in Pulaski County.
Both Braun Corporation and Plymouth Tube Company produce national and global goods and services, while the Pulaski Memorial Hospital and Eastern Pulaski Middle School and Superintendent primarily support the local community.
Information on the top 5 establishments by employment comes from ReferenceUSA. ReferenceUSA is a library database service provided by Infogroup, the company that also supplies the list of major employers for Hoosiers by the Numbers. While both NETS and ReferenceUSA contain establishments, differences in data collection processes result in discrepancies between the two sources. We use NETS for a broad picture of establishments in the county, while ReferenceUSA is used for studying individual establishments.

18
Number of jobs by stage/employment category
Economy
Source: National Establishment Time Series (NETS) – 2012 Database
section 03
2000 2011Stage Jobs* Proportion Jobs* Proportion
Stage 0 339 6% 483 6%
Stage 1 1,943 32% 2,184 27%
Stage 2 2,218 36% 2,275 28%
Stage 3 1,604 26% 2,060 26%
Stage 4 - - 1,000 13%
Total 6,104 100% 8,002 100%
Note: The 2011 figures use 2012 data to include all gains and losses over the entire year.*Includes both full-time and part-time jobs

19
Amount of sales (2011 dollars) by stage/employment category
Economy
Source: National Establishment Time Series (NETS) – 2012 Database
section 03
2000 2011Stage Sales Proportion Sales Proportion
Stage 0 $ 41,107,292 6% $ 31,926,285 5%
Stage 1 $261,424,850 35% $187,571,070 26%
Stage 2 $264,983,170 35% $191,523,554 27%
Stage 3 $184,005,268 24% $168,192,671 24%
Stage 4 - - $127,897,600 18%
Total $751,520,580 100% $707,111,180 100%
Note: The 2011 figures use 2012 data to include all gains and losses over the entire year.
20
Manufacturing19.5%
Government15.8%
Agriculture, Forestry, Fishing
& Hunting14.1%
Retail Trade9.3%
Health Care & Social Assis-tance6.5%
All Other Indus-tries
34.8%
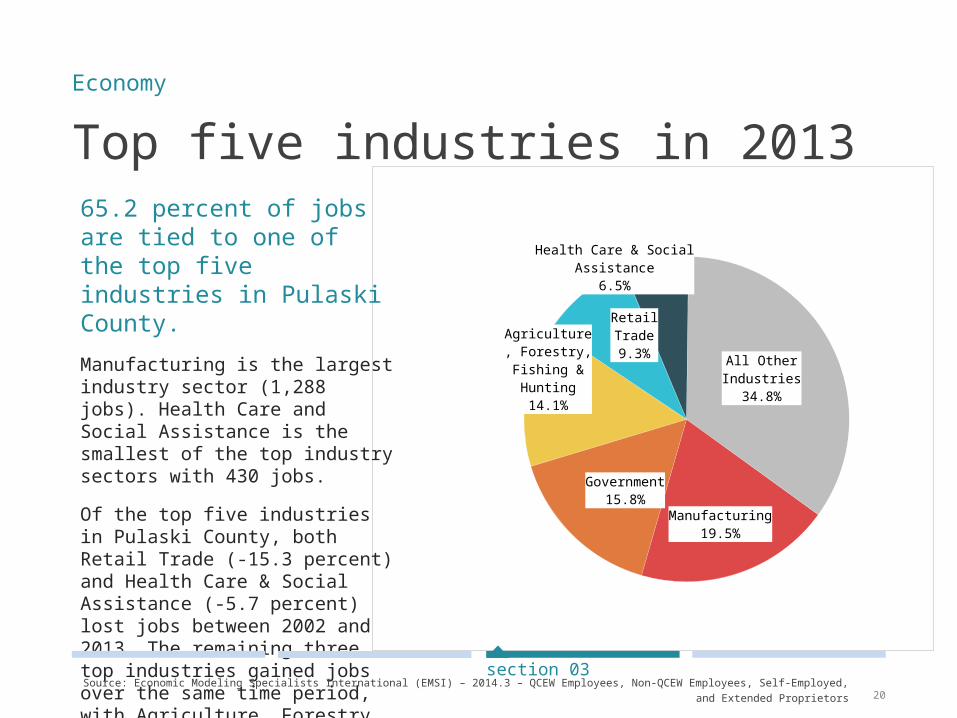
Top five industries in 201365.2 percent of jobs are tied to one of the top five industries in Pulaski County.
Manufacturing is the largest industry sector (1,288 jobs). Health Care and Social Assistance is the smallest of the top industry sectors with 430 jobs.
Of the top five industries in Pulaski County, both Retail Trade (-15.3 percent) and Health Care & Social Assistance (-5.7 percent) lost jobs between 2002 and 2013. The remaining three top industries gained jobs over the same time period, with Agriculture, Forestry, Fishing, & Hunting gaining the most (percentage-wise) with a 6.3 percent increase in jobs between 2002 and 2013.
Economy
Source: Economic Modeling Specialists International (EMSI) – 2014.3 – QCEW Employees, Non-QCEW Employees, Self-Employed, and Extended Proprietors
section 03

21
Industry distribution and changeNAICS Code
Description Jobs 2002
Jobs 2013
Change (2002-2013)
% Change (2002-2013)
Average Total
Earnings 2013
11Agriculture, Forestry, Fishing & Hunting 875 930 55 6% $34,013
21Mining, Quarrying, & Oil & Gas Extraction 27 21 -6 -22% $172,439
22 Utilities 0 0 0 0% $0 23 Construction 311 271 -40 -13% $36,022 31-33 Manufacturing 1,240 1,288 48 4% $54,353 42 Wholesale Trade 294 275 -19 -6% $58,284 44-45 Retail Trade 727 616 -111 -15% $22,139 48-49 Transportation & Warehousing 199 198 -1 -1% $50,805 51 Information 49 28 -21 -43% $48,553 52 Finance & Insurance 228 257 29 13% $38,849 53 Real Estate & Rental & Leasing 125 203 78 62% $22,139
54Professional, Scientific & Technical Services 122 153 31 25% $28,045
55Management of Companies and Enterprises 42 34 -8 -19% $63,121
56 Administrative & Waste Management 112 154 42 38% $13,937 61 Educational Services (Private) 15 20 5 33% $5,866 62 Health Care & Social Assistance 456 430 -26 -6% $27,682 71 Arts, Entertainment & Recreation 68 77 9 13% $10,842 72 Accommodation and Food Services 205 218 13 6% $10,470
81Other Services (except Public Administration) 386 392 6 2% $16,303
90 Government (includes public schools) 1,044 1,048 4 0% $44,711 99 Unclassified Industry <10 0 - -100% $0 All Total 6,528 6,613 85 1% $37,395
Economy
Source: Economic Modeling Specialists International (EMSI) – 2014.3 – QCEW Employees, Non-QCEW Employees, Self-Employed, and Extended Proprietors
section 03Note: Average total earnings include wages, salaries, supplements and earnings frominvestments and proprietorships. Industries and occupations with a value of <10 have insufficient data for change and earnings calculations.

22
Industry distribution and change
The largest percentage gains in employment in Pulaski County occurred in: Real Estate and Rental and
Leasing (+62.4 percent) Administrative, Support,
Waste Management, and Remediation Services (+37.5 percent)
The largest percentage losses in employment occurred in: Information (-42.9 percent) Mining, Quarrying, and Oil and
Gas Extraction (-22.2 percent)
Economy
Source: Economic Modeling Specialists International (EMSI) – 2014.3 – QCEW Employees, Non-QCEW Employees, Self-Employed, and Extended Proprietors
section 03
Employment Increase
Employment Decrease
Industries with the largest gains and losses in employment numbers between 2002 & 2013:
Real Estate & Leasing(+78)
Agriculture & Forestry(+55)
Retail Trade(-111)
Construction(-40)

23
Production 14.4%
Management12.0%
Sales & Re-lated 11.5%
Office & Administra-tive Support
9.6%
Transportation & Material Moving
7.0%
All Other Occupations
45.5%
Top five occupations in 2013The top five occupations in Pulaski County represent 54.5 percent of all jobs.
Production (954 jobs) and Management (795 jobs) are the top two occupations in Pulaski County. Transportation & Material Moving is the smallest of the top five occupations with 463 jobs.
Of the five top occupations in Pulaski County, only Production (+12.5 percent) had an increase in jobs between 2002 and 2013. There was no change in the number of jobs in Sales & Related occupations. The three other top five occupations lost jobs, with Office & Administrative Support losing the largest share of jobs (-11.7 percent).
Economy
Source: Economic Modeling Specialists International (EMSI) – 2014.3 – QCEW Employees, Non-QCEW Employees, Self-Employed, and Extended Proprietors
section 03

24
SOC Description Jobs
2002Jobs 2013
Change (2002-2013)
% Change (2002-2013)
Hourly Earnings
201311 Management 797 795 -2 0% $20.49 13 Business & Financial Operations 179 208 29 16% $22.80 15 Computer & Mathematical 42 40 -2 -5% $24.71 17 Architecture & Engineering 91 79 -12 -13% $26.47 19 Life, Physical & Social Science 18 15 -3 -17% $23.01 21 Community & Social Service 68 72 4 6% $17.84 23 Legal 31 28 -3 -10% $30.42 25 Education, Training & Library 241 356 115 48% $19.78
27Arts, Design, Entertainment, Sports & Media 110 103 -7 -6% $13.63
29 Health Care Practitioners & Technical 270 207 -63 -23% $25.93 31 Health Care Support 168 138 -30 -18% $11.26 33 Protective Service 107 104 -3 -3% $16.20 35 Food Preparation & Serving Related 270 261 -9 -3% $9.49
37Building & Grounds Cleaning Maintenance 178 224 46 26% $9.89
39 Personal Care & Service 242 272 30 12% $8.91 41 Sales & Related 758 758 0 0% $14.19 43 Office & Administrative Support 718 634 -84 -12% $13.68 45 Farming, Fishing & Forestry 274 305 31 11% $12.88 47 Construction & Extraction 279 239 -40 -14% $16.42 49 Installation, Maintenance & Repair 285 280 -5 -2% $16.40 51 Production 848 954 106 13% $14.88 53 Transportation & Material Moving 478 463 -15 -3% $16.99 55 Military 45 43 -2 -4% $18.61 99 Unclassified 32 37 5 16% $10.90 All Total 6,528 6,613 85 1% $16.01
Occupation distribution and change
Economy
Source: Economic Modeling Specialists International (EMSI) – 2014.3 – QCEW Employees, Non-QCEW Employees, Self-Employed, and Extended Proprietors
section 03

25
Occupation distribution and change
Economy
Source: Economic Modeling Specialists International (EMSI) – 2014.3 – QCEW Employees, Non-QCEW Employees, Self-Employed, and Extended Proprietors
section 03
The largest percentage gains in jobs in Pulaski County occurred in: Education, Training, and
Library (+47.7 percent) Building and Grounds
Cleaning and Maintenance (+25.8 percent)
The largest percentage loss in employment occurred in: Healthcare Practitioners and
Technical (-23.3 percent) Healthcare Support (-17.9
percent)
Occupations with the largest gains and losses in employment numbers between 2002 & 2013:
Education, Training, &
Library(+115)
Production(+106)
Office & Administrative
(-84)
Healthcare Practitioners &
Technical(-63)
Employment Increase
Employment Decrease

26
Income and poverty
2000 2006 2013
Total Population in Poverty 9.5% 11.7% 14.3%
Minors (up to age 17)in Poverty
12.1% 17.0% 19.9%
Real Median Household Income (2013)*
$48,335 $47,136 $44,821
Real Per Capital Income (2013)* $31,200 $33,020 $38,620
The median household income in Pulaski County dipped by $3,500 between 2000 and 2013 in real dollars (that is, adjusted for inflation), while average income per person rose by $7,400 in real dollars over the same time period.
The total population in poverty swelled from 9.5 percent to 14.3 percent between 2000 and 2013. The rate for minors was even higher, increasing by nearly 8 percentage points over the same period of time.
Economy
Source: U.S. Census Bureau – Small Area Income and Poverty Estimates (SAIPE) and U.S. Bureau of Economic Analysis – Regional Personal Income Summary
section 03
*Real median household income is the middle income value in the county. Half of the county’s households fall above this line and half below. Real per capita personal income is the average income per person in the county.

27
2000
2001
2002
2003
2004
2005
2006
2007
2008
2009
2010
2011
2012
2013
28,000
32,000
36,000
40,000
44,000
48,000
52,000
0
4
8
12
16
20
24
Rea
l Inco
me
(2013 d
olla
rs)
Popula
tion
in P
over
ty (
per
cent)
Median House-hold Income
Minors in Poverty
All Ages in Poverty
Per Capita Income
Income and povertyMedian household income in Pulaski County has experienced significant fluctuation over time, generally decreasing since 2005. However, per capita income as been increasing since 2003. Poverty rates for minors has stabilized over the past two years, although the rates remain high relative to the early 2000s.
Economy
Source: U.S. Census Bureau – Small Area Income and Poverty Estimates (SAIPE) and U.S. Bureau of Economic Analysis – Regional Personal Income Summary
section 03

28
Takeaways Growth in the number of establishments in Pulaski County occurred primarily in businesses with fewer than 10 employees (the self-employed and Stage 1 enterprises), components of the local economy that are often overlooked but deserve closer attention by local leaders.
Pulaski County might consider focusing on economic development efforts that seek to strengthen high-growth Stage 1 and 2 establishments since they employ several people and capture sizable sales. At the same time, employment associated with Stage 3 establishments has expanded at an impressive pace since 2000.
Real median income has undergone some dramatic swings since 2000, following a trend of declining income. While poverty rates for minors
have dipped since 2010, they remain much higher than in 2000. As for the percent of the total population in poverty, the rate in 2013 was higher than at any point since 2000.
The decline in real median income experienced between 2005 and 2013 may be tied to employment changes in various industries in the county during that time period. The largest employment gains between 2000 and 2013 occurred in industries paying average earnings of $30,000 or less and in occupations paying less than $15 per hour. At the same time, the occupation that experienced the greatest job losses paid approximately $25 per hour (Health Care Practitioners & Technical).
No doubt, the ability of the county to capture good paying jobs will depend on the availability of a well-trained and educated workforce, something that may be challenging in light of the smaller percentage of adults in the county with an associate’s degree or higher. Exploring the need for people with technical education may be worthwhile in light of the important role that manufacturing continues to play in the county.
Economy
section 03

Labor force and unemployment
Commuteshed
Laborshed
Workforceinflow/outflow
Takeaways
04labor
market

30
Labor force and unemployment
2002 2013
Labor Force 6,810 6,677
Unemployment Rate 5.7% 6.3%
The labor force in Pulaski County decreased by 1.9 percent between 2002 and 2013.
This decrease could be due to a rise in the number of individuals who are either officially unemployed or who have given up looking for a job, or the result of an increase in the number of adults who have left the workforce due to retirement.
Labor market
Source: U.S. Bureau of Labor Statistics – Local Area Unemployment Statistics (2013 Annual Data Release)
section 04

31
20002001
20022003
20042005
20062007
20082009
20102011
20122013
0
2
4
6
8
10
12
4.2%
5.7%
4.2%
10.5%
6.3%
Unem
plo
yment
Rate
(perc
ent)
Unemployment rateUnemployment increased dramatically after 2007, peaking at 10.5 percent in 2009. Since that time, the rate has been on a slow but steady decline, dipping to 6.3 percent by 2013.
Labor market
Source: U.S. Bureau of Labor Statistics – Local Area Unemployment Statistics (2013 Annual Data Release)
section 04
32
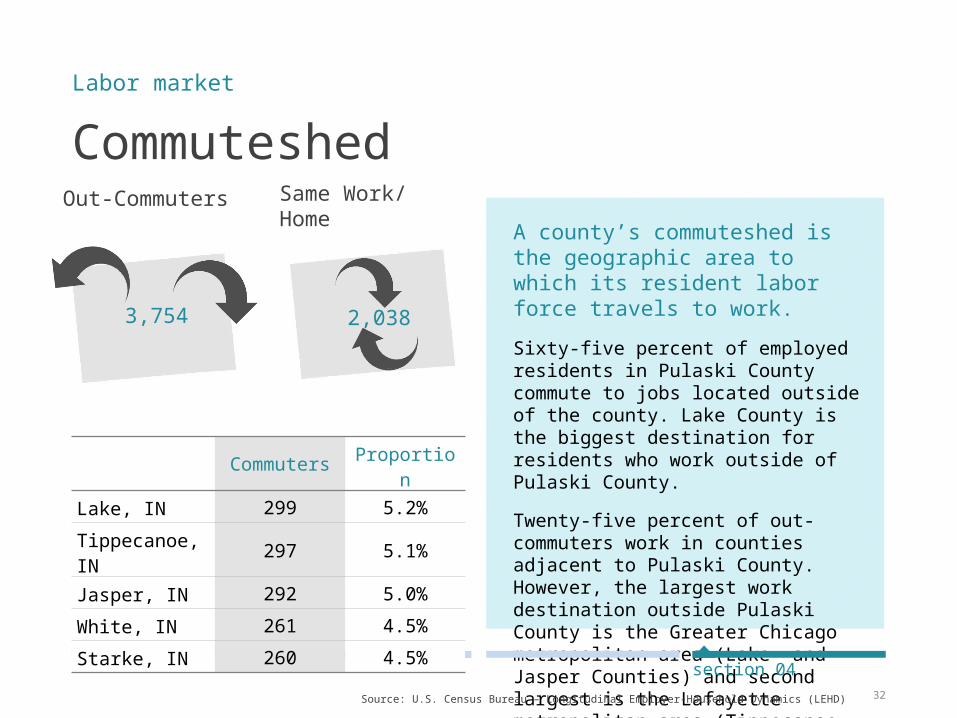
Commuteshed
A county’s commuteshed is the geographic area to which its resident labor force travels to work.
Sixty-five percent of employed residents in Pulaski County commute to jobs located outside of the county. Lake County is the biggest destination for residents who work outside of Pulaski County.
Twenty-five percent of out-commuters work in counties adjacent to Pulaski County. However, the largest work destination outside Pulaski County is the Greater Chicago metropolitan area (Lake and Jasper Counties) and second largest is the Lafayette metropolitan area (Tippecanoe County).
Labor market
Source: U.S. Census Bureau – Longitudinal Employer-Household Dynamics (LEHD)
section 04
3,754
Out-Commuters
2,038
Same Work/Home
Commuters Proportion
Lake, IN 299 5.2%
Tippecanoe, IN
297 5.1%
Jasper, IN 292 5.0%
White, IN 261 4.5%
Starke, IN 260 4.5%

33
Commuteshed in 2011Labor market
section 04
Source: U.S. Census Bureau, OTM, LEHD, PCRD
Seventy percent of Pulaski County’s working residents are employed either in Fulton, Jasper, Lake, Marion, Pulaski, Starke, Tippecanoe or White Counties. Another 5 percent commute to Cass County or Porter County. An additional 5 percent travel to jobs in Marshall County.
Collectively, these 11 counties represent 80 percent of the commuteshed for Pulaski County.

34
Laborshed
Commuters Proportion
Starke, IN 294 6.3%
Cass, IN 246 5.3%
Fulton, IN 234 5.0%
White, IN 209 4.5%
Jasper, IN 174 3.7%
Labor market
Source: U.S. Census Bureau – Longitudinal Employer-Household Dynamics (LEHD)
section 04
2,614
In-Commuters
2,038
Same Work/Home
A county’s laborshed is the geographic area from which it draws employees.
Fifty-six percent of individuals working in Pulaski County commute from another county. Over one in four of these in-commuters reside in counties that are adjacent to Pulaski County.
Starke and Cass Counties are the biggest sources of labor to Pulaski County. Together, they represent nearly 12 percent of Pulaski County’s labor force.

35
Laborshed in 2011Labor market
section 04
Source: U.S. Census Bureau, OTM, LEHD, PCRD
The bulk (70 percent) of Pulaski County’s workforce is
drawn from Cass, Fulton, Jasper, Pulaski, Starke or
White Counties. Another 5 percent is drawn from
Bartholomew, Miami and Montgomery Counties. An
additional 5 percent comes from Clarke, Harrison,
Tippecanoe, Warrick and Washington Counties.
Combined, the 14 counties represent 80 percent of
Pulaski County’s laborshed.

36
Workforce inflow and outflow in 2011
Labor market
section 04
Source: U.S. Census Bureau, OTM, LEHD, PCRD
Pulaski County has more laborers traveling out of the county for work than into the county for work.
Net commuting is negative, with a loss of 1,140 commuters. The resulting situation is that for every 100 employed residents, Pulaski County has 80 jobs.
CountProporti
on
Employed in Pulaski County
4,652 100%
Both employed andliving in the county 2,038 44%
Employed in the county but living outside
2,614 56%
Living in Pulaski County
5,792 100%
Both living andemployed in the county
2,038 35%
Living in the county but employed outside 3,754 65%

37
Takeaways The Great Recession that impacted the U.S. economy between 2007 and 2009 took a major toll on the Pulaski County’s unemployment rate. While the rate was low in 2000, it skyrocketed to over 10 percent by 2009. Recent figures make clear that the unemployment rate has improved significantly since 2010, now hovering around 6.3 percent.
Despite the modest growth in the population over the past decade or more, the county’s labor force has decreased in size since 2002. While it is difficult to pinpoint the exact reason for the drop in the county’s labor force, two possible explanations come to mind. First, an increasing number of unemployed individuals may be discouraged workers who have given up trying to find a job. Or second, more people in the workforce may have opted to retire and their positions have been eliminated or left unfilled.
Over 60 percent of Pulaski County’s residents in the workforce are gainfully employed outside of the county. This represents a sizable loss of human talent that is unavailable to contribute to the social and economic vitality of the county. Conversely, Pulaski draws a number of its employees from surrounding counties in the region.
It may be worthwhile for local leaders and industries to determine the human capital attributes of workers who commute to jobs outside the county as well as those who live somewhere else but who travel to jobs in Pulaski County. By so doing, local leaders would have a better understanding of the labor force dynamics in the county and determine how they might spur the growth of good paying jobs. In so doing, they could help reduce the number of workers who now commute out of Pulaski County but who would work in their county of residence if decent paying jobs were present.
The laborshed and commuteshed data offer solid evidence of the value of pursuing economic and workforce development strategies on a regional (multi-county) basis.
Labor market
section 04
38
Notes
LAUS (Local Area Unemployment Statistics):LAUS is a U.S. Bureau of Labor Statistics (BLS) program that provides monthly and annual labor force, employment and unemployment data by place of residence at various geographic levels. LAUS utilizes statistical models to estimate data values based on household surveys and employer reports. These estimates are updated annually. Annual county-level LAUS estimates do not include seasonal adjustments.
LEHD (Longitudinal Employer-Household Dynamics):LEHD is a partnership between U.S. Census Bureau and State Department of Workforce Development (DWD) to provide labor market and journey to work data at various geographic levels. LEHD uses Unemployment Insurance earnings data and Quarterly Census of Employment and Wages from DWDs and census administrative records related to individuals and businesses.
NETS (National Establishment Time Series): NETS is an establishment-level database, not a company-level database. This means that each entry is a different physical location, and company-level information must be created by adding the separate establishment components.
OTM (On the Map):OTM, a product of LEHD program, is used in the county snapshot report to develop commuting patterns for a geography from two perspectives: place of residence and place of work. At the highly detailed level of census blocks, some of the data is synthetic to maintain confidentiality of the worker. However, for larger regions mapped at the county level, the commuteshed and laborshed data are fairly reasonable.
OTM includes jobs for a worker employed in the reference as well as previous quarter. Hence, job counts are based on two consecutive quarters (six months) measured at the “beginning of a quarter.” OTM data can differ from commuting patterns developed from state annual income tax returns, which asks a question about “county of residence” and “county of work” on January 1 of the tax-year. OTM can also differ from American Community Survey data, which is based on a sample survey of the resident population.
SAIPE (Small Area Income and Poverty Estimates):SAIPE is a U.S. Census Bureau program that provides annual data estimates of income and poverty statistics at various geographic levels. The estimates are used in the administration of federal and state assistance programs. SAIPE utilizes statistical models to estimate data from sample surveys, census enumerations, and administrative records.

39
Report ContributorsThis report was prepared by the Purdue Center for Regional Development in partnership with Purdue University Extension.
Data AnalysisIndraneel Kumar, Ph.D.Ayoung Kim
Report AuthorsElizabeth DobisBo Beaulieu, Ph.D.
Report DesignTyler Wright

FOR MORE INFORMATION
Purdue Center for Regional Development (PCRD) . . .seeks to pioneer new ideas and strategies that contribute to regional collaboration, innovation and prosperity.
Purdue Extension Community Development (CD) . . . works to strengthen the capacity of local leaders, residents and organizations to work together to develop and sustain strong, vibrant communities.
Please contact
Natalie FedererCounty Extension Director and 4-H Youth Development [email protected]
PCRDMann Hall, Suite 266Purdue [email protected]
OR