publications - universidad de...
TRANSCRIPT

RESEARCH ARTICLE10.1002/2013WR014838
A modeling approach reveals differences in evapotranspirationand its partitioning in two semiarid ecosystems in NorthwestMexicoLuis A. M�endez-Barroso1, Enrique R. Vivoni1,2, Agustin Robles-Morua1,3, Giuseppe Mascaro2,Enrico A. Y�epez3, Julio C. Rodr�ıguez4, Christopher J. Watts5, Jaime Garatuza-Pay�an3,and Juan A. Sa�ız-Hern�andez6
1School of Earth and Space Exploration, Arizona State University, Tempe, Arizona, USA, 2School of SustainableEngineering and the Built Environment, Arizona State University, Tempe, Arizona, USA, 3Departamento de Ciencias delAgua y del Medio Ambiente, Instituto Tecnol�ogico de Sonora, Sonora, Mexico, 4Departamento de Agricultura y Ganader�ıa,Universidad de Sonora, Sonora, Mexico, 5Departamento de F�ısica, Universidad de Sonora, Sonora, Mexico, 6Departamentode Ingenier�ıa Civil y Minas, Universidad de Sonora, Sonora, Mexico
Abstract Seasonal vegetation changes during the North American monsoon play a major role in modify-ing water, energy, and momentum fluxes. Nevertheless, most models parameterize plants as a static com-ponent or with averaged seasonal variations that ignore interannual differences and their potential impacton evapotranspiration (ET) and its components. Here vegetation parameters derived from remote sensingdata were coupled with a hydrologic model at two eddy covariance (EC) sites with observations spanningmultiple summers. Sinaloan thornscrub (ST) and Madrean woodland (MW) sites, arranged at intermediateand high elevations along mountain fronts in northwest Mexico, occupy specific niches related to climateconditions and water availability that are poorly understood. We found that simulations with a dynamic rep-resentation of vegetation greening tracked well the seasonal evolution of observed ET and soil moisture(SM). A switch in the dominant component of ET from soil evaporation (E) to plant transpiration (T) wasobserved for each ecosystem depending on the timing and magnitude of vegetation greening that isdirectly tied to rainfall characteristics. Differences in vegetation greening at the ST and MW sites lead to adominance of transpiration at ST (T/ET 5 57%), but evaporation-dominant conditions at MW (T/ET 5 19%).Peak transpiration occurred at 5 and 20 days after the full canopy development in the ST and MW sites,respectively. These results indicate that evapotranspiration timing and partitioning varies considerably inthe two studied ecosystems in accordance with different modes of vegetation greening. Intermediate-elevation ecosystems follow an intensive water use strategy with a rapid and robust transpiration responseto water availability. In contrast, higher elevation sites have delayed and attenuated transpiration, suggest-ing an extensive water use strategy persisting beyond the North American monsoon.
1. Introduction
Vegetation is a key dynamical factor that modifies the water, energy, and momentum fluxes occurring atthe land surface [e.g., Arora, 2002; Van den Hurk et al., 2003; Vivoni et al., 2008]. Plant canopies affect thewater balance through rainfall interception and plant water uptake during transpiration, while playing arole in the energy balance through radiation attenuation and modifications of surface roughness andalbedo [e.g., Eltahir, 1998; M�endez-Barroso and Vivoni, 2010]. Nevertheless, the impact of vegetation green-ing on land-atmosphere exchanges is not well understood, in particular during seasonal changes inducedby radiation or water availability. This problem is exacerbated when plant transpiration (T) is lumped withsoil evaporation (E) and evaporation of intercepted water (I) into a single term, evapotranspiration (ET), asthis mixes vegetation and soil-mediated processes occurring over disparate temporal and spatial scales. Theability to partition ET into its underlying components would improve our understanding of plant wateruptake and its feedback to the carbon and water cycle [e.g., Newman et al., 2006; Y�epez et al., 2007]. To date,only a few studies have addressed ET partitioning and consensus has not been achieved across differentmethodologies on the relative importance of each component, even for similar ecosystems [Reynolds et al.,2000; Stannard and Weltz, 2006; Scott et al., 2006; Moran et al., 2009; Raz-Yaseef et al., 2012; Yang et al.,2013].
Special Section:Eco-hydrology of SemiaridEnvironments: ConfrontingMathematical Models withEcosystem Complexity
Key Points:� Simulations with time-varying
vegetation greening compare well tofield data� A temporal switch in the dominant
component of evapotranspirationwas simulated� Intensive and extensive water use
strategies are used in differentecosystems
Correspondence to:E. R. Vivoni,[email protected]
Citation:M�endez-Barroso, L. A., E. R. Vivoni, A.Robles-Morua, G. Mascaro, E. A. Y�epez,J. C. Rodr�ıguez, C. J. Watts, J.Garatuza-Pay�an, and J. A.Sa�ız-Hern�andez (2014), A modelingapproach reveals differences inevapotranspiration and its partitioningin two semiarid ecosystems inNorthwest Mexico. Water Resour. Res.,50, doi:10.1002/2013WR014838.
Received 3 OCT 2013
Accepted 15 MAR 2014
Accepted article online 8 MAR 2014
M�ENDEZ-BARROSO ET AL. VC 2014. American Geophysical Union. All Rights Reserved. 1
Water Resources Research
PUBLICATIONS
J_ID: WRCR Customer A_ID: WRCR20845 Cadmus Art: WRCR20845 Ed. Ref. No.: 2013WR014838RR Date: 24-March-14 Stage: Page: 1
ID: nagarajulum Time: 13:26 I Path: N:/3b2/WRCR/Vol00000/140131/APPFile/JW-WRCR140131

One approach for estimating ET and its components is through the use of models that incorporate vegeta-tion greening either through prognostic equations [e.g., Kucharik et al., 2006; Lawrence et al., 2007; Ivanovet al., 2008] or via remote sensing observations [e.g., Matsui et al., 2005; Cleugh et al., 2007; Vivoni, 2012].Satellite-derived products, such as the Normalized Difference Vegetation Index (NDVI) and Leaf Area Index(LAI), have been used to provide vegetation parameters for land-atmosphere models instead of the directsimulation of plant processes, at a range of scales from regional to global [Yan et al., 2012]. Thus, a first stepto include vegetation greening in simulation models has been through comparisons of static and seasonallyvarying vegetation parameters. Van den Hurk et al. [2003], for example, conducted climate simulations toinvestigate the impact of seasonally varying LAI on evapotranspiration, finding a larger range of values dueto increases in summer ET and decreases in winter ET, as compared to static conditions. Furthermore, Tanget al. [2012] showed that the interannual variability of seasonal (summer) changes in LAI were important toaccount for when predicting spatiotemporal patterns of evapotranspiration using a hydrologic model, inparticular during periods of vegetation green-up. While promising, open questions remain with respect tothe seasonal and interannual variations of ET and its components and how these are linked to readily avail-able information about an ecosystem, such as precipitation or vegetation greening. Furthermore, few stud-ies have accounted for the complete set of changes to plant processes (e.g., radiation, interception,transpiration) that simultaneously occur during vegetation greening.
In a recent study, Vivoni [2012] conducted hydrologic simulations using the Triangulated Irregular Network(TIN)-based Real-time Integrated Basin Simulator (tRIBS) [Ivanov et al., 2004; Vivoni et al., 2007a] thataccounted for seasonal variations in vegetation parameters. The study was focused on an intermediate-sized watershed (�100 km2) experiencing dramatic vegetation greening during the North American mon-soon (NAM). The NAM is a summertime atmospheric circulation occurring in the southwestern U.S. andnorthwestern Mexico that leads to increased precipitation, soil moisture, evapotranspiration, and stream-flow in the arid and semiarid area. A large number and variety of ecosystems respond to the rainy seasonthrough biomass production, leading to regional patterns in vegetation greenness [Watts et al., 2007;M�endez-Barroso et al., 2009; Liz�arraga-Celaya et al., 2010; Forzieri et al., 2011]. Vivoni [2012] found thatecosystem-specific variations in vegetation greening were responsible for the simulated spatiotemporalpatterns of ET components. For example, subtropical scrubland ecosystems, such as Sinaloan thornscrub(ST), exhibited early greening in the summer season that favored high plant transpiration, whereas oaksavanna ecosystems, such as Madrean woodland (MW), had a more delayed and prolonged green-up withsustained plant transpiration into the early fall. However, the focus of Vivoni [2012] on a single summer didnot permit an assessment of the interannual variations in evapotranspiration and its partitioning or on thedifferences among ecosystems.
In this study, we seek to understand how variations in vegetation greening affect ET partitioning in twosemiarid ecosystems (ST and MW) in northwestern Mexico. By virtue of their organization along semiaridmountain fronts, these ecosystems occupy specific niches related to climate conditions and water availabil-ity that also likely occur in other semiarid regions. To do so, we utilize the tRIBS model applied to an eddycovariance tower site in each ecosystem, while accounting for the impact of seasonal greening on the vege-tation parameters in the model. For the first time, this approach allows a direct comparison between the STand MW ecosystems, arranged from intermediate (�600 to 1200 m for ST) to high (�1200 to 1700 m forMW) elevations, in terms of both observations and simulations. Based on data availability, multiple summerperiods are studied in each ecosystem to cover a range of seasonal precipitation amounts. We are inter-ested in answering the following questions that are broadly applicable to other ecosystems: How do sea-sonal variations in vegetation greening in the different ecosystems affect ET partitioning? and Dointerannual differences in rainfall and vegetation greening affect ET and its components? While we focusprimarily on ET, the surface soil moisture and sensible heat flux are also inspected due to its importance incontrolling ET rates or serving as a complementary measure of the surface energy balance.
2. Methods
2.1. Study RegionThe study region is located in northern Sonora, Mexico, in a rural, sparsely populated area characterized bynorth to south trending mountain ranges and valleys that are part of the Sierra Madre Occidental.
J_ID: WRCR Customer A_ID: WRCR20845 Cadmus Art: WRCR20845 Ed. Ref. No.: 2013WR014838RR Date: 24-March-14 Stage: Page: 2
ID: nagarajulum Time: 13:26 I Path: N:/3b2/WRCR/Vol00000/140131/APPFile/JW-WRCR140131
Water Resources Research 10.1002/2013WR014838
M�ENDEZ-BARROSO ET AL. VC 2014. American Geophysical Union. All Rights Reserved. 2

Ecosystems in the region vary from desert shrublands toconifer pine forests, with a significant proportion of sub-tropical species [M�endez-Barroso and Vivoni, 2010]. Over-all, site climate is considered steppe or semiarid (BSh),according to the K€oppen-Geiger classification [Peel et al.,2007], characterized by hot, arid conditions, and wintertemperatures above 0�C. The two study sites are locatedin the R�ıo San Miguel basin (3796 km2), which have meanannual precipitation values (61 standard deviation) rang-ing from 481 6 181 mm/yr (Ray�on, near ST) to 496 6 204mm/yr (Meresichic, near MW), over 1981–2006. Table T11presents the site-specific monthly and summer seasonalprecipitation values over the periods with available data.Mean annual air temperatures in the region range from21.4 6 6.4�C (Ray�on, near ST) to 18.9 6 6.1�C (Meresichic,near MW), over 1981–2006. The Sinaloan thornscrub (ST)site is located on top of an alluvial foothill near Ray�on
(29.74�N, 110.54�W) at an elevation of 632 m, while the Madrean woodland (MW) site is found on a gentlemountain slope, �21 km southeast of Meresichic (29.96�N, 110.46�W) at an elevation of 1314 m. Figure F11depicts the location of the study region and the elevation and ecosystem characteristics of the two sites.Transects A-A0 and B-B0 clearly show how the sites represent intermediate and high elevations along thesesemiarid mountain fronts [cf., Vivoni et al., 2007b, 2010]. All ecosystems in the region respond by greeningto the seasonal precipitation from the NAM extending from July to September and leading to 60–70% ofthe annual precipitation [M�endez-Barroso et al., 2009].
2.2. Field and Remote Sensing ObservationsAn eddy covariance (EC) tower was deployed at each site in an area of homogeneous vegetation coverwithin the EC fetch to measure water, energy, and carbon fluxes, as well as site meteorology, during thesummer season (1 June to 30 September) over multiple years. Figure F22 provides details of the characteristicsof each site, including a high-resolution (�1 m) terrain model obtained using site surveying and a 1 m satel-lite image depicting the vegetation patterns. The ST site was installed in 2004 as part of the SMEX04 (Soil
Figure 1. (a) Location of the study site in Sonora, Mexico. (b) Location of two eddy covariance (EC) tower sites and their relation to ecosys-tem and topographic distributions in the region. Note that the Sinaloan thornscrub is represented as transparent. MW is at A0 and ST is atB (square symbols). (c) Elevation cross sections along the mountain fronts containing the two EC sites with extents of ST and MW ecosys-tems labeled.
Table 1. Mean Monthly Precipitation and 61 MonthlyStandard Deviation (sd) and Summer Season (JJAS)Precipitation at Sinaloan Thornscrub and MadreanWoodland Sites Over 2004–2009
Month orYear
Mean (61 sd) Precipitation (mm)
SinaloanThornscrub
MadreanWoodland
Jun 28 (627) 39 (621)Jul 169 (638) 180 (6113)Aug 165 (661) 177 (659)Sep 84 (688) 41 (612)2004 2782006 5492007 4902008 519 5512009 397 321
J_ID: WRCR Customer A_ID: WRCR20845 Cadmus Art: WRCR20845 Ed. Ref. No.: 2013WR014838RR Date: 24-March-14 Stage: Page: 3
ID: nagarajulum Time: 13:26 I Path: N:/3b2/WRCR/Vol00000/140131/APPFile/JW-WRCR140131
Water Resources Research 10.1002/2013WR014838
M�ENDEZ-BARROSO ET AL. VC 2014. American Geophysical Union. All Rights Reserved. 3

Moisture Experiment 2004) experiment [Bindlish et al., 2008] and was operated for summers 2006–2009 aspart of this study for five summers of observations. Vegetation at the ST site includes thorny, deciduoustrees, and shrubs, as well as cacti and succulents, with low amounts of grass cover [see Brown, 1994, for adescription of ST]. Watts et al. [2007], M�endez-Barroso and Vivoni [2010], Vivoni et al. [2010], Tang et al.[2012], and Tar�ın et al. [2014] have reported on the EC data at the ST site. On the other hand, the MW sitewas installed in 2007 and operated in 2008 and 2009 allowing for only two summers (as with ST, the EC sys-tem continues to be operated during short periods). Vegetation at the MW site is primarily oak trees inter-spersed with grasses and succulents [Brown, 1994]. To date, the EC data at the MW site have not beenreported on, though M�endez-Barroso et al. [2009] described the precipitation, soil moisture, and vegetationat a nearby site, and detailed simulations have not been conducted at the site. Both the ST and MW EC sys-tems form part of a growing network of flux measurements in Mexico [Vargas et al., 2013]. Figure F33 shows
Figure 2. Topographic and vegetation characteristics at EC tower sites. (a) Topographic survey, (b) tower photograph, and (c) 1 m IKONOSimage at the Sinaloan thornscrub site near Ray�on, Sonora. (d) Topographic survey, (e) tower photograph, and (f) 1 m IKONOS image at theMadrean woodland, 16.6 km northeast of Opodepe, Sonora.
J_ID: WRCR Customer A_ID: WRCR20845 Cadmus Art: WRCR20845 Ed. Ref. No.: 2013WR014838RR Date: 24-March-14 Stage: Page: 4
ID: nagarajulum Time: 13:26 I Path: N:/3b2/WRCR/Vol00000/140131/APPFile/JW-WRCR140131
Water Resources Research 10.1002/2013WR014838
M�ENDEZ-BARROSO ET AL. VC 2014. American Geophysical Union. All Rights Reserved. 4

the seasonal evolution of rainfall and surface soil moisture (SM, top 10 cm) for the 2004–2009 summers inthe ST and MW sites as bi-weekly averages and 61 standard deviations.
Both EC systems have a standard configuration consisting of a three-dimensional, sonic anemometer(CSAT3, Campbell Scientific, Logan, UT) and an open-path Infrared Gas Analyzer (LI7500, LI-COR, Lincoln,NE) aligned to the dominant wind direction of 225� [Moncrieff et al., 2000]. EC sensors were placed at 9 mabove ground (installed at 2 m above the canopies). Net shortwave and longwave radiation were measured(CNR2, Kipp and Zonen, Delft, Netherlands), along with incoming solar radiation (CMP3, Campbell Scientific).Ground heat flux was measured using two soil plates (HFP01SC, Hukseflux, Manorville, NY) placed at 2 cmdepth. Site rainfall was measured using a tipping-bucket rain gauge (TB3, Hydrological Services, Sydney,Australia at ST and TR-52USW, Texas Electronic, Dallas, TX at MW), while soil moisture was measured usingsoil dielectric sensors (Stevens Hydra sensor, Portland, OR) at each site at 5 and 10 cm depths, with MW hav-ing additional sensors at 15 and 30 cm. We used here the 5 and 10 cm depth soil moisture sensors due totheir greater data availability at both sites. It should be noted that the soil moisture response at MW beyond
Figure 3. Seasonal evolution of l, surface soil moisture (SM, top 10 cm), Normalized Difference Vegetation Index (NDVI), Leaf Area Index (LAI)and albedo over 2004–2009. Rainfall is accumulated during biweekly intervals, while SM is averaged over this period. NDVI, LAI, and albedorepresent 16 day composites from MODIS. Symbols depict biweekly averages and error bars are 61 standard deviations across all years.
J_ID: WRCR Customer A_ID: WRCR20845 Cadmus Art: WRCR20845 Ed. Ref. No.: 2013WR014838RR Date: 24-March-14 Stage: Page: 5
ID: nagarajulum Time: 13:27 I Path: N:/3b2/WRCR/Vol00000/140131/APPFile/JW-WRCR140131
Water Resources Research 10.1002/2013WR014838
M�ENDEZ-BARROSO ET AL. VC 2014. American Geophysical Union. All Rights Reserved. 5

10 cm was similar to the shallower sensors (not shown). Sensors were connected to CR5000 dataloggers(Campbell Scientific) with the EC sensors operating at 20 Hz and averaging data to 30 min periods. Cova-riances of vertical wind speed, temperature, and water vapor concentration were processed to obtain thesensible (H) and latent heat (kE) flux using EdiRe (University of Edinburgh). Turbulent flux corrections for theEC measurements followed Scott et al. [2004] and included data filtering (i.e., data removal after or duringrain events and outliers), the Webb method for density correction [Webb et al., 1980], the quality checkmethod described by Mauder and Foken [2004] and the planar fit as a method of rotation [Wilczak et al.,2001]. The planar fit method is deemed appropriate for correcting EC measurements for nonzero mean ver-tical velocity in the sloping terrain at both sites [Lee et al., 2004], but more markedly at MW (Figure 2).Ground heat flux (G) was corrected for heat storage in the upper 2 cm using the change in soil temperaturemeasured by two thermocouples at 2 cm depth (TCAV-L, Campbell Scientific) and the volumetric water con-tent at 5 cm depth [Campbell Scientific, Inc., 2012]. The soil temperature readings from the thermocoupleswere averaged and then used to calculate the soil heat storage and compute the corrected ground heatflux. Canopy heat storage is expected to be small in short vegetation types (less than 8 m) and wasneglected in this study [Wilson et al., 2002].
Energy balance closure was evaluated for each site using a least squares comparison between turbulent fluxes(kE 1 H) and available energy (Rn 2 G, where Rn is net radiation) and the seasonal energy balance ratio (ENR,defined as the cumulative sums of turbulent fluxes divided by the available energy) obtained for all availablesummers. The ST site had a slope of 0.75 (60.04), an intercept of 16 (62) W/m2, a correlation coefficient (r2) of0.93 (60.005) and an ENR of 0.83 (60.02), while the MW site had a slope of 0.81 (60.05), an intercept of 27(618) W/m2, a correlation coefficient (r2) of 0.90 (60.06) and an ENR of 0.81 (60.10), where the errors are com-puted as interannual standard deviations among the summers. Reported values for MW were affected by a netradiometer malfunction in June 2009, after which a replacement sensor led to a large improvement in theenergy balance closure (i.e., increase in the slope from 0.60 to 0.81). These metrics are close to values reportedfor Wilson et al. [2002] for the energy balance closure at FLUXNET sites and as such we opted not to correct theEC turbulent flux measurements to account for ENR in these heterogeneous and open canopies that are subjectto larger systematic errors [Baldocchi et al., 2000; Kustas et al., 2000]. To validate the simulated fraction of planttranspiration to evapotranspiration (T/ET), we used a field data set of T/ET obtained through the stable isotopemethod described by Y�epez et al. [2003]. These daily integrated values of T/ET were sampled during 24–27 July2007, and 15–16 July, 2008, by Tar�ın et al. [2014] in the subtropical scrubland. These 4 days exhibited relativelysmall measurement errors due to the wet soil conditions experienced at the site from recent storms.
We complemented the field observations with an analysis of remote sensing data on vegetation greeningusing the MODerate resolution Imaging Spectroradiometer (MODIS) sensors on board the EOS Terra andAqua satellites, following M�endez-Barroso et al. [2009] and Liz�arraga-Celaya et al. [2010]. One of the limita-tions of remote sensing data in the visible and near infrared regions is the presence of cloud cover duringthe NAM. To overcome this, we used composite products: 16 day composites of NDVI (MOD13Q1, 250 mspatial resolution) and white-sky shortwave albedo (MOD43B, 1 km), along with 8 day composites of LAIand fraction of Photosynthetically Active Radiation (fPAR, MOD15A2, 1 km). We spatially averaged the 250m NDVI data to 1 km to match the resolution of the other products. NDVI, fPAR, and LAI from MODIS havebeen shown to represent vegetation conditions well in semiarid regions as compared to ground measure-ments [Privette et al., 2002; Fensholt et al., 2004; Ryu et al., 2012]. Figure 3 illustrates the seasonal evolutionof NDVI, albedo and LAI for summer periods at the ST and MW sites as biweekly averages and 61 standarddeviations. Data sets spanned from 1 June to 30 September over 2004 to 2009 and included the extractionof the 1 km area around each EC tower using the MODIS Data Subsetting and Visualization Tool. Compo-sites were linearly interpolated to daily values to allow for a gradual progression of vegetation changes. Inaddition, a smoothing technique that included the combination of weighted local regression and a second-degree polynomial model (with a span of 5%) was applied to the raw data to eliminate noise. This alsoaccounts for the uncertainty in the timing of measured values within the composite. The resulting timeseries of NDVI, LAI, fPAR, and albedo at the ST and MW sites constituted the basis for deriving vegetationparameters used in the modeling efforts described next.
2.3. Hydrologic Model and its ApplicationHydrologic simulations were performed using the tRIBS model applied to the ST and MW sites independ-ently. A single, hexagonal Voronoi polygon (or model element) was generated from a 30 m Digital Elevation
J_ID: WRCR Customer A_ID: WRCR20845 Cadmus Art: WRCR20845 Ed. Ref. No.: 2013WR014838RR Date: 24-March-14 Stage: Page: 6
ID: nagarajulum Time: 13:27 I Path: N:/3b2/WRCR/Vol00000/140131/APPFile/JW-WRCR140131
Water Resources Research 10.1002/2013WR014838
M�ENDEZ-BARROSO ET AL. VC 2014. American Geophysical Union. All Rights Reserved. 6

Model (DEM) derived from the Advance Space-borne Thermal Emission and Reflection Radiometer (ASTER).A model element with an area of 98.77 m2, a soil depth of 1 m (based on a soil pit dug at each site) and agentle slope was used at each location. In this study, tRIBS is used as a one-dimensional model to simulatehydrologic processes that track the response to meteorological forcing, including: (1) rainfall interception,(2) evaporation from bare soil (E) and intercepted water (I) and plant transpiration (T), (3) infiltration andmoisture redistribution, and (4) runoff production. Appendix A details the evapotranspiration calculations intRIBS and how ET is partitioned into E, T, and I. Ivanov et al. [2004] provides a description of infiltration intothe sloped, heterogeneous soil above an impermeable layer. Single infiltration fronts interact with a pres-torm moisture profile, determined from hydrostatic equilibrium, and the water table position. This interac-tion leads to a range of possible soil moisture states, which influence infiltration and runoff generation viainfiltration-excess, saturation-excess, perched return flow and groundwater exfiltration mechanisms.
Meteorological forcings to the hydrologic model were obtained from measurements at each site over thestudy periods (1 June to 30 September at 30 min time step). The month of May was also included in eachyear (2004, 2006–2009 at ST and 2008–2009 at MW) to allow for an initial drying period that helped reducesoil moisture to low values near the residual level (hr) prior to the onset of the NAM. This initialization is pos-sible due to the annual resetting of the soil moisture conditions during the dry spring prior to the summerrainy season [Vivoni et al., 2010]. Model forcings consisted of precipitation (mm), atmospheric pressure (Pa),relative humidity (%), wind speed (m/s), air temperature (�C), and incoming solar radiation (W/m2) with atime resolution of 30 min. Gaps in the meteorological observations due to periods of no data collectionwere filled in with ground-adjusted forcing from the North American Land Data Assimilation System(NLDAS) [Mitchell et al., 2004], following Robles-Morua et al. [2012]. The percentage of time with gap-filledforcing ranged from 13% to 67% of the periods, depending on the site and year, with the largest gaps for2006–2007 (ST, 61% and 67%) and 2008 (MW, 63%).
Soil parameters were obtained through a manual calibration process that focused on the 2006 and 2008summer periods for ST and MW sites, respectively. In this process, the soil parameters remained constant intime for each site. Initial parameter values were obtained from soil pedotransfer functions based on particlesize fraction and bulk density [Van Genuchten, 1980; Rawls et al., 1983; Rawls and Brakensiek, 1989; Lapham,1989]. At the ST site, soil analyses indicated a sandy loam texture in the top 30 cm and sandy clay in thelower profile down to about 75 cm. At the MW site, soil analyses revealed a sandy loam texture in the upper40 cm of soil and a sandy clay loam down to the 55 cm of sampling depth. Manual adjustments to soilparameters within feasible ranges were performed independently at each site for the calibration periodsonly, based on the comparison of observed and simulated surface soil moisture (SM, top 10 cm) and evapo-transpiration (ET) using the Mean Absolute Error (MAE), correlation coefficient (CC), and Bias (B, see Appen-dix B). Sensible heat flux (H) was inspected for model validation purposes only using similar metrics, whileroot zone soil moisture (top 1 m) was not used in the model calibration or testing due to a lack of similarobservations. Table T22 presents the soil parameters for each site and their source. Note the manual proce-dure allowed us to retain well-constrained values from pedotransfer functions, while focusing on parame-ters with higher uncertainty, such as the pore distribution index. Model testing was then performed for theremaining summer periods (2004, 2007–2009 at ST and 2009 at MW).
Table 2. Soil Parameters Used in the Simulationsa
Parameter Variable (Unit) Sinaloan Thornscrub Madrean Woodland
Saturated hydraulic conductivity Ks (mm/h) 55 30Soil moisture at saturation hs 0.41 0.45Residual soil moisture hr 0.02 0.04Pore distribution index m 0.85 0.50Conductivity decay parameter f (mm21) 0.0001 0.0010Porosity n 0.45 0.48Volumetric heat conductivity ks (J/ms K) 0.20 0.20Soil heat capacity Cs (J/m3 K) 1.61 3 106 1.47 3 106
aFor the Sinaloan thornscrub, values were based on Vivoni et al. [2010] with minor adjustment to Ks. For the Madrean woodland, Ks,hs, and n were estimated using the pedotransfer functions of Rawls et al. [1983] using soil texture data; hr was obtained from Van Gen-uchten [1980]; m was estimated according to Rawls and Brakensiek [1989]; f was based on the logarithmic relation between Ks with soildepth following Robles-Morua et al. [2012]; and ks and Cs were determined from Lapham [1989].
J_ID: WRCR Customer A_ID: WRCR20845 Cadmus Art: WRCR20845 Ed. Ref. No.: 2013WR014838RR Date: 24-March-14 Stage: Page: 7
ID: nagarajulum Time: 13:27 I Path: N:/3b2/WRCR/Vol00000/140131/APPFile/JW-WRCR140131
Water Resources Research 10.1002/2013WR014838
M�ENDEZ-BARROSO ET AL. VC 2014. American Geophysical Union. All Rights Reserved. 7

Vegetation parameters were specified as time-varying quantities based on relationships to remotely senseddata from MODIS. Appendix C describes the empirical equations used to transform the linearly interpolated,daily MODIS observations of LAI, NDVI, fPAR, and albedo into the vegetation parameters defined in Table T33.The implemented relations are considered more sophisticated than the methods presented by Vivoni[2012], in particular with respect to S, p, and rs. Three scenarios were considered to examine the effects ofvegetation greening on the simulated ET and SM: (1) Dynamic (time-varying plant parameters for eachyear), (2) Leaf off (fixed or time-constant vegetation parameters with no leaves), and (3) Leaf on (fixed vege-tation parameters under full canopy conditions). For each scenario, the vegetation parameters apply to thevegetation fraction or green cover (vf) of the model element occupied by a subtropical tree species at STand an oak tree at the MW site, while the 1 2 vf fraction is treated as bare soil. Note that the green vegeta-tion fraction of a model element varies from near zero (Leaf off) to values near 0.7 or 1 (Dynamic) in Table 3.To obtain the Leaf off values, the mean of the minimum values of vf and S were calculated for each site overthe 2004–2009 period, while the mean of the maximum values of a, kt, p, and rs where utilized to representdormancy. In contrast, Leaf on conditions were based on the mean of the maximum vf and S and the meanof the minimum a, kt, p, and rs over 2004–2009. This selection implies that Leaf off and Leaf on scenarios arerepresentative of average minimum and maximum greenness over five summers. As a result, care must betaken when interpreting results from each summer at each site relative to this selection. Note that theDynamic scenario varies for each summer, thus effectively capturing interannual variations in vegetationgreening and its impact on all correlated plant processes.
Evapotranspiration partitioning depends on the ability of E and T to extract soil water from the surface androot zones, respectively [e.g., Newman et al., 2006]. In the model, this is parameterized using piecewise lin-ear relations between E and surface soil moisture (top 10 cm) and T and root zone soil moisture (top 1 m),which are controlled by stress factors (Appendix A) [Ivanov et al., 2004]. The selection of the soil evaporation(bE) and plant transpiration (bT) stress factors (Table 3) was based on a manual parameter sensitivity analysisfor the calibration periods in each ecosystem, as opposed to the fixed and equal factors used by Vivoni[2012]. The sensitivity analysis systematically varied bE and bT within the 0–1 range to explore all possiblecombinations at each site. We selected the pair of bE and bT that minimized the simulated errors in ET andSM with respect to the observations at each site using the MAE, CC, and B metrics. The resulting values indi-cate that soil evaporation stress factors are similar in each ecosystem (bE 5 0.55) which is consistent withthe sandy loam texture at each site. The plant transpiration stress factor, on the other hand, varied withplant functional type with bT having smaller values at ST (bT 5 0.1), as compared to MW (bT 5 0.55), due tothe greater capacity of ST to sustain plant T under lower soil moisture conditions [Vivoni et al., 2008]. This isalso consistent with the more rapid green-up in the subtropical scrubland, which suggests a more efficientuse of soil water by transpiration [M�endez-Barroso et al., 2009; Forzieri et al., 2011].
3. Results
3.1. Seasonal Evolution of Vegetation ParametersFigure F44 depicts the seasonal evolution of the vegetation parameters averaged over all simulation periods,including 61 standard deviations to represent interannual variability. Clearly, the onset of vegetation
Table 3. Vegetation Parameters at the Sinaloan Thornscrub and Madrean Woodland Sites for the Three Simulation Scenariosa
Parameter Variable (Unit)
Sinaloan Thornscrub Madrean Woodland
Dynamic Leaf Off Leaf On Dynamic Leaf Off Leaf On
Free throughfall coefficient p 0.09–0.78 0.75 0.13 0.06–0.51 0.51 0.06Maximum canopy storage S (mm) 0.07–0.75 0.09 0.67 0.23–0.94 0.23 0.97Albedo a 0.13–0.19 0.18 0.15 0.13–0.17 0.17 0.14Vegetation height h (m) 6 6 6 8 8 8Optical transmission coefficient kt 0.37–0.90 0.89 0.42 0.55–0.86 0.86 0.55Minimum canopy stomatal resistance rs (s/m) 19.5–247 197 23 18–94 85 18Vegetation fraction vf 0–0.95 0.00 0.76 0–0.68 0.00 0.61Soil evaporation stress factor bE 0.55 0.55 0.55 0.55 0.55 0.55Plant transpiration stress factor bT 0.10 0.10 0.10 0.55 0.55 0.55
aConstant bE and bT were obtained from model calibration. For the Dynamic scenario, parameter ranges shown represent minimum and maximum values.
J_ID: WRCR Customer A_ID: WRCR20845 Cadmus Art: WRCR20845 Ed. Ref. No.: 2013WR014838RR Date: 24-March-14 Stage: Page: 8
ID: nagarajulum Time: 13:27 I Path: N:/3b2/WRCR/Vol00000/140131/APPFile/JW-WRCR140131
Water Resources Research 10.1002/2013WR014838
M�ENDEZ-BARROSO ET AL. VC 2014. American Geophysical Union. All Rights Reserved. 8

greening in early July leads to largechanges in the representation ofvegetation parameters in the model.For example, the vegetation fraction(vf) increases from values near zeroto an average of 0.6 in the subtropi-cal scrubland and 0.5 in the oaksavanna. The interannual variabilityin vf is higher at the MW site, in par-ticular near the peak values. Overall,note that the ST site typically hasearlier maximum or minimum val-ues in vegetation parameters (mid-July) as compared to MW (mid-August). Since vegetation parame-ters were derived from remote sens-ing data, these all exhibit internallyconsistent temporal variations. Fur-thermore, differences between thetwo sites are consistent with fieldevidence [Vivoni et al., 2010; Tar�ınet al., 2014], indicating that ST has ahigher vegetation cover (higher vf)and shading (lower kt), but a lowerinterception capacity (lower S andhigher p). Overall, the time-varyingvf is a major difference between theecosystems since it has a strongcontrol on ET partitioning [Vivoni,2012]. Furthermore, the fraction1 2 vf is considered in the model asbare soil in both ecosystems, wheregrasses and forbs, cacti, or succu-lents may actually occupy theseunderstory spaces.
3.2. Seasonal and InterannualVariations in ET and SM
The multiple summer periods at the ST and MW sites allow for a comparison of the seasonal evolution of ETand SM for varying interannual conditions. As shown in Table 1, total summer precipitation (JJAS) can varysubstantially in the region, in accordance with the strength of the NAM [Higgins and Shi, 2001; Gutzler, 2004;Forzieri et al., 2011]. As compared to long-term averages at Ray�on (near ST site) and Meresichic (near MWsite but at lower elevation), the study periods fall into below-average (2004 and 2009) and average (2006–2008) categories. Soil moisture, vegetation greenness, and evapotranspiration are expected to vary inresponse to year-to-year differences in precipitation [e.g., Tang et al., 2012]. Furthermore, the onset anddemise of the NAM varies interannually, leading to changes in the timing and duration of greening and itsassociated effects on water and energy fluxes. As such, we first present the comparison of model simula-tions that capture vegetation seasonality in each summer to the observations in each site. For reference,the smoothed, daily NDVI time series is presented along with the composite NDVI values placed at the mid-point of the compositing period.
Figure F55 presents the seasonal evolution and interannual differences in observed rainfall, vegetation green-ing (NDVI), and surface soil moisture (average of top 10 cm of soil) as derived from available observations(average of sensors at 5 and 10 cm) and model simulations using the Dynamic scenario at the ST site. Notehow precipitation pulses affect the rapid vegetation green-up and their coincident influence on the surfacesoil moisture. Diurnal fluctuations are due to a temperature-dependence of the sensors when installed at
Figure 4. Seasonal evolution of vegetation parameters from MODIS for the Sinaloanthornscrub (gray solid line, 2004, 2006–2009) and Madrean woodland (black solid line,2008–2009) sites. Dashed lines depict 61 standard deviation in time for each ecosystemacross all summers. Vegetation parameters were estimated based on empirical relationsthat link vegetation fraction (vf), maximum canopy storage (S), optical transmission coeffi-cient (kt), minimum canopy stomatal resistance (rs), and free throughfall coefficient (p)with Leaf Area Index (LAI), fraction of photosynthetically active radiation (fPAR), and Nor-malized Difference Vegetation Index (NDVI).
J_ID: WRCR Customer A_ID: WRCR20845 Cadmus Art: WRCR20845 Ed. Ref. No.: 2013WR014838RR Date: 24-March-14 Stage: Page: 9
ID: nagarajulum Time: 13:27 I Path: N:/3b2/WRCR/Vol00000/140131/APPFile/JW-WRCR140131
Water Resources Research 10.1002/2013WR014838
M�ENDEZ-BARROSO ET AL. VC 2014. American Geophysical Union. All Rights Reserved. 9

shallow depths [Seyfried and Murdock, 2004; Vivoni et al., 2007b] and not a diurnal redistribution of soil mois-ture. The observed and simulated soil moisture (depicted volumetrically as m3/m3 at 30 min intervals)match well, in particular with respect to average conditions and the peak and recession characteristics ofeach wetting event across all summers. Model performance was inferior during periods when: (1) meteoro-logical forcings from the tower was missing and NLDAS products were used in their place (i.e., 2006 had ahigh percentage of missing tower forcing, 67%), and (2) soil moisture sensors did not operate correctly (i.e.,2009 had issues with soil moisture data availability and quality). Note that the same soil parameters (Table2) were used for each summer based on the calibration period, such that only meteorological forcing andvegetation parameters vary in time each summer in accordance with the observed conditions. Table T44 pro-vides a quantitative evaluation of SM at the 30 min resolution for the Dynamic scenario at the ST site,
Figure 5. Comparison of observed and simulated soil moisture (SM at 10 cm depth) at the Sinaloan thornscrub site for 2004 and 2006–2009. Model simulations account for the Dynamic scenario. For reference, NDVI shows the vegetation greenness variations at the site withthe squares indicating the composite data with the smoothed series as dashed lines. Gaps in the observations due to sampling protocolsor equipment malfunction are depicted by missing data.
J_ID: WRCR Customer A_ID: WRCR20845 Cadmus Art: WRCR20845 Ed. Ref. No.: 2013WR014838RR Date: 24-March-14 Stage: Page: 10
ID: nagarajulum Time: 13:27 I Path: N:/3b2/WRCR/Vol00000/140131/APPFile/JW-WRCR140131
Water Resources Research 10.1002/2013WR014838
M�ENDEZ-BARROSO ET AL. VC 2014. American Geophysical Union. All Rights Reserved. 10

showing a low MAE of 0.02 m3/m3, a B near 1.1, and a CC greater than �0.7 across all summers. Model per-formance varies depending on the metric and variable inspected, but is generally consistent across calibra-tion and testing periods, suggesting the model is transferable across the different summer periods. Inaddition, the model performance in terms of soil moisture is robust with respect to the time scale of evalua-tion, as shown by the daily averaged statistics in Table 4. Overall, the model captures the major features ofthe soil moisture data at the ST site, including how certain summer periods have sustained levels of highsoil water content (2006–2008), while others experience long interstorm periods with low soil moisture lev-els (2004, 2009).
The seasonal progression of soil wetting induces a vegetation green-up that increases ET in the subtropicalscrubland, as depicted across all summers in Figure F66. Only daytime periods are included in the comparison.Latent heat flux (kET, where k is the latent heat of vaporization) is low prior to the NAM onset (June) in boththe observations and model simulations (see 2008 and 2009). As SM and NDVI increase, the Dynamic sce-nario captures well the gradual rise in ET and its temporal variations in response to individual storms anddry periods. Reductions in ET during late summer are also captured well in response to lower water avail-ability and radiation, as well as the start of vegetation senescence. Table 4 shows the model performancemetrics with respect to latent and sensible heat flux (W/m2) at the ST site at both 30 min and daily scales.For the 30 min statistics, we obtained an average MAE of 41 W/m2, average B of 0.62, and average CC of0.68 for kE and an average MAE of 53 W/m2, average B of 0.53, and average CC of 0.61 for H across allsummers, consistent with daily total fluxes. Focusing on kE, the Bias indicates that under certain conditionsin mid-summer the model underestimates ET with respect to observations, as seen in 2008, likely due to aninability of the model to account for transpiration emanating from plant water uptake from deep (>1 m)soil layers occurring when the modeled (1 m) root zone has dried. Despite this, the major features of theseasonal evolution of ET and its interannual variation are nevertheless captured with reasonable accuracy towarrant a closer analysis of the underlying soil and vegetation contributions to the total ET.
Figure F77 presents the comparison of ET and SM observations and model simulations at the MW site for 2008and 2009 using the Dynamic scenario. Only daytime periods are included in the comparison. The wettersummer in 2008 (551 mm) leads to a higher NDVI than in the drier 2009 summer (321 mm), with vegetationgreenness slowly increasing during the NAM onset and peaking in mid-August in both periods. Differencesin time-varying vegetation parameters in the Dynamic scenario (under the same soil properties of Table 2)are able to capture well the interannual variations in ET and SM, with wetter soils and higher
Table 4. Model Performance for Periods With Simultaneous Observations and Simulations of Latent Heat Flux, Sensible Heat Flux andSurface Soil Moisture at the ST and MW Sites for the Dynamic Scenario for Both 30 Min and Daily Intervalsa
Year
Latent Heat Flux Sensible Heat Flux Surface Soil Moisture
BMAE (W/m2)or (MJ/m2/d) CC B
MAE (W/m2)or (MJ/m2/d) CC B
MAE(m3/m3) CC
Sinaloan Thornscrub, ST (30 Min Statistics)2004 0.53 31.46 0.71 0.72 58.40 0.69 0.90 0.02 0.752006 0.60 45.35 0.78 0.84 37.85 0.66 1.06 0.02 0.792007 0.87 28.52 0.68 0.46 47.33 0.61 1.05 0.02 0.652008 0.51 71.28 0.58 0.13 50.19 0.45 1.08 0.02 0.862009 0.58 30.32 0.66 0.48 71.10 0.63 1.14 0.02 0.66Sinaloan Thornscrub, ST (Daily Statistics)2004 0.48 76.63 0.85 0.77 90.73 0.67 0.90 0.02 0.782006 0.64 105.32 0.94 0.84 73.87 0.78 1.05 0.02 0.842007 0.92 53.02 0.84 0.46 138.66 0.72 1.04 0.02 0.762008 0.49 257.79 0.16 0.13 188.14 0.23 1.08 0.02 0.882009 0.56 37.47 0.91 0.48 206.36 0.72 1.12 0.02 0.79Madrean Woodland, MW (30 Min Statistics)2008 0.75 62.38 0.67 0.17 62.26 0.49 0.78 0.04 0.902009 0.91 39.86 0.57 0.91 74.04 0.59 1.00 0.02 0.74Madrean Woodland, MW (Daily Statistics)2008 0.75 135.33 0.46 0.18 170.60 0.31 0.77 0.05 0.932009 1.03 64.00 0.73 0.91 107.84 0.48 0.99 0.02 0.76
aItalicized years represent the model calibration periods. The statistical metrics used to measure model performance were bias (B),Mean Absolute Error (MAE), and correlation coefficient (CC). The units of MAE depend on 30 min (W/m2) or daily (MJ/m2/d) statistics forthe latent and sensible heat fluxes.
J_ID: WRCR Customer A_ID: WRCR20845 Cadmus Art: WRCR20845 Ed. Ref. No.: 2013WR014838RR Date: 24-March-14 Stage: Page: 11
ID: nagarajulum Time: 13:27 I Path: N:/3b2/WRCR/Vol00000/140131/APPFile/JW-WRCR140131
Water Resources Research 10.1002/2013WR014838
M�ENDEZ-BARROSO ET AL. VC 2014. American Geophysical Union. All Rights Reserved. 11

evapotranspiration losses in 2008 than in 2009. Table 4 shows that the model performance at the Madreanwoodland is comparable to the ST site in terms of latent and sensible heat fluxes and surface soil moisture,with a better match during the drier 2009 period, at both 30 min and daily scales. This suggests that modelperformance may improve in terms of certain variables above the calibration results depending on the mete-orological forcing and its subsequent vegetation response. For this ecosystem, the seasonal evolution of ETand SM are also captured well, as are the hydrologic responses to individual storms and subsequent dry-down periods. It is interesting to note that the MW site experiences higher soil moisture values with lowerrecession rates as compared to the ST ecosystem. The more frequent, smaller rainfall events at the higher ele-vation MW site [Gebremichael et al., 2007] also permit sustained ET throughout the summer season. Althoughthe model captured well the observations overall, it is important to note an underestimation in ET in Augustand September 2008, which are likely related to the high precipitation that year leading to plant water uptakefrom deep (>1 m) soil layers. In addition, high rainfall conditions and the presence of fog or dew during thisperiod may have interfered with the EC measurements causing unusually large and sustained ET observationsthat were not removed during standard data processing using the quality control method of Mauder andFoken [2004]. Among other identified sources of EC measurement error [e.g., Kochendorfer et al., 2012; Frank
Figure 6. Comparison of observed and simulated latent heat flux at the ST site for 2004 and 2006–2009 under the Dynamic scenario. Gapsin the observations are depicted by missing data. For reference, NDVI shows the vegetation greenness variations at the site with thesquares indicating the composite data with the smoothed series as dashed lines.
J_ID: WRCR Customer A_ID: WRCR20845 Cadmus Art: WRCR20845 Ed. Ref. No.: 2013WR014838RR Date: 24-March-14 Stage: Page: 12
ID: nagarajulum Time: 13:27 I Path: N:/3b2/WRCR/Vol00000/140131/APPFile/JW-WRCR140131
Water Resources Research 10.1002/2013WR014838
M�ENDEZ-BARROSO ET AL. VC 2014. American Geophysical Union. All Rights Reserved. 12

et al., 2013), the effects of standing water from fog, dew or precipitation on the LI7500 sensor are well knownand occur by obstructing passage of the infrared beam [e.g., Massman and Lee, 2002].
3.3. Comparisons of ET-SM Relation for Vegetation ScenariosThe two static scenarios (Leaf off and Leaf on) allow analyzing the effects of seasonal and interannual varia-tions of vegetation on the hydrologic conditions at the ST and MW sites. For simplicity, these scenarios aredescribed through a comparison of the relation between daily total ET and daily averaged SM for the top 10cm. Figure F88 presents the ET-SM relation for each summer period from the three scenarios as well as theavailable daily data (not used in the relations). For clarity, the simulations for all summer days are presentedas piecewise linear regressions, such that the lines are a visualization tool to compare the scenarios. Theregression parameters were identified through a semiautomatic procedure aimed at minimizing the rootmean square error (RMSE) between the pair of points (SM, ET) of the model simulations and the regressionlines. Note that the ET-SM relations are determined based on all simulated days, while the observations arelimited to only days (n) with available data. The regressions allow depicting the stressed ET (region with pos-itive slope) and the maximum ET (region with constant values) corresponding to low and high SM. From theobservations, it is clear that interannual variations exist in the ET and SM ranges at both sites, with wettersummers (2006–2008) exhibiting higher values. Due to its adjustment of vegetation parameters each
Figure 7. Comparison of observed and simulated latent heat flux and surface soil moisture (SM, top 10 cm) at the MW site for 2008–2009.Missing data are due to observational gaps. For reference, NDVI shows the vegetation greenness variations at the site with the squaresindicating the composite data with the smoothed series as dashed lines.
J_ID: WRCR Customer A_ID: WRCR20845 Cadmus Art: WRCR20845 Ed. Ref. No.: 2013WR014838RR Date: 24-March-14 Stage: Page: 13
ID: nagarajulum Time: 13:27 I Path: N:/3b2/WRCR/Vol00000/140131/APPFile/JW-WRCR140131
Water Resources Research 10.1002/2013WR014838
M�ENDEZ-BARROSO ET AL. VC 2014. American Geophysical Union. All Rights Reserved. 13

summer, the Dynamic scenario shows interannual differences in the ET-SM relation that visually match theobservations better than the Leaf off and Leaf on scenarios. This is corroborated by the lower RMSE in dailyET between observations and the piecewise linear regressions for the Dynamic scenario. When averagedover all summers and both sites, the Dynamic case has an RMSE of 1.73 mm/d, as compared to 1.93 and2.93 mm/d for the Leaf off and Leaf on scenarios. The ET-SM relation for the Dynamic scenario generally hasbetter performance relative to observations for the calibration periods (2006 at ST and 2008 at MW), with alower skill in the testing periods.
The Leaf on and Leaf off cases present an interesting comparison to the Dynamic scenario in each ecosys-tem. For the ST site, the Leaf on scenario has the highest ET for most SM values across all summer periods,
Figure 8. Interannual variability of the relation between daily evapotranspiration and surface soil moisture (SM, top 10 cm) for three vege-tation scenarios at the ST and MW sites. Daily observations (n is the number of available days) are included for comparison (circles) alongwith the root mean square error (RMSE) in evapotranspiration (mm/d) for the piecewise linear regression in each scenario.
J_ID: WRCR Customer A_ID: WRCR20845 Cadmus Art: WRCR20845 Ed. Ref. No.: 2013WR014838RR Date: 24-March-14 Stage: Page: 14
ID: nagarajulum Time: 13:28 I Path: N:/3b2/WRCR/Vol00000/140131/APPFile/JW-WRCR140131
Water Resources Research 10.1002/2013WR014838
M�ENDEZ-BARROSO ET AL. VC 2014. American Geophysical Union. All Rights Reserved. 14

indicating the full canopy development in the subtropical scrubland maximizes ET losses to the atmosphereand thus lowers SM. This suggests that plant transpiration is a more efficient means to extract soil moisturesince it acts over a deeper (1 m) profile and has a lower stress factor, bT (Table 3). In contrast, the Leaf offscenario has the lowest ET and highest SM, indicating that bare soil conditions at the ST site have lowerlosses, primarily due to a higher soil evaporation stress factor, bE (Table 3). Interestingly, the Dynamic sce-nario has a behavior that suggests that time-varying parameters result in an ET bounded by the two othercases, in particular for intermediate soil moisture values (i.e., 0.05–0.125 m3/m3).
In the oak savanna, comparisons between vegetation scenarios are limited to two summers. The Leaf onand Leaf off scenarios were selected from observations over a period of five summers and as a result repre-sent conditions not necessarily experienced in 2008 and 2009. In contrast to the ST site, the minimumgreenness in the Leaf off scenario leads to high ET and low SM, while the maximum greenness in the Leafon scenario leads to a lower ET and higher SM. Here the Dynamic scenario also exhibits an intermediate ET-SM relation as compared to the bounds presented by the other cases and matches the field data betterwhen averaged over the two seasons, as shown by the RMSE. Differences between MW and ST in the rela-tive performance of the Leaf off and Leaf on scenarios can be attributed to: (1) higher incoming solar radia-tion that favors greater ET at MW and (2) lower vegetation fraction in the oak savanna. Interestingly, theability of the Dynamic scenario to adjust the ET-SM relation to match the available data indicates that vege-tation greening plays a crucial role in modulating losses to the atmosphere in the oak savanna ecosystem. It
Figure 9. Simulated evapotranspiration partitioning under the Dynamic scenario at the ST and MW sites for 2008 and 2009. For reference, NDVI shows the observed vegetation green-ness variations at the sites.
J_ID: WRCR Customer A_ID: WRCR20845 Cadmus Art: WRCR20845 Ed. Ref. No.: 2013WR014838RR Date: 24-March-14 Stage: Page: 15
ID: nagarajulum Time: 13:28 I Path: N:/3b2/WRCR/Vol00000/140131/APPFile/JW-WRCR140131
Water Resources Research 10.1002/2013WR014838
M�ENDEZ-BARROSO ET AL. VC 2014. American Geophysical Union. All Rights Reserved. 15

also reveals that lower vegetation fractions at MW leads to a different behavior as compared to the ST site,with respect to the partitioning of ET between vegetation canopies and surrounding bare soil, as will beexplored in the following.
3.4. Temporal Variations of ET PartitioningThe simulated partitioning of evapotranspiration (Appendix C) permits an evaluation of the effect of vegeta-tion greening on soil and vegetation-mediated processes. Figure F99 presents the simulated ET partitioningfor two contrasting summers, the wetter 2008 and drier 2009 periods, at the ST and MW sites under theDynamic scenario. Both summers received rainfall events in late June and early July, but 2008 had more sus-tained precipitation in late August and September that allowed NDVI to remain higher. Prior to green-up, ETis dominated by soil evaporation (E) at both sites, as bare soil fractions (1 2 vf) are greater than 50%. In thesubtropical scrubland, a switch to transpiration (T) dominance was simulated after early to mid-July, reach-ing values of 5–7 mm/d in each summer, with an earlier green-up and a quicker transition to transpirationin 2009. In contrast, the oak savanna exhibited this switch only in the wetter 2008 period. The late greeningand low NDVI at MW in 2009 resulted in higher soil evaporation rates throughout the season. During thelate summer, precipitation determines whether ET is sustained (as in 2008) or rapidly decays (as in 2009),while the partitioning begins to favor E as NDVI decreases in response to lower radiation. Overall, transpira-tion rates at MW were consistently lower than at ST and contributed a lower fraction of the total ET. Since
Figure 10. Vegetation-mediated fraction, (T 1 I)/ET, under three vegetation scenarios at the ST and MW sites for 2008 and 2009.
J_ID: WRCR Customer A_ID: WRCR20845 Cadmus Art: WRCR20845 Ed. Ref. No.: 2013WR014838RR Date: 24-March-14 Stage: Page: 16
ID: nagarajulum Time: 13:28 I Path: N:/3b2/WRCR/Vol00000/140131/APPFile/JW-WRCR140131
Water Resources Research 10.1002/2013WR014838
M�ENDEZ-BARROSO ET AL. VC 2014. American Geophysical Union. All Rights Reserved. 16

total ET averaged over all summerswas higher at MW (465 mm) than atST (422 mm), E plays a dominantrole in the oak savanna due to asparser plant cover. As expected, theevaporation of intercepted water (I)had a small contribution to ET withmaximum values of 2 mm/d duringperiods of higher vf.
The impact of the vegetation green-ing on the ET partitioning is pre-sented in Figure 10 by comparingthe vegetation scenarios in terms ofthe vegetation-mediated fractionsor (T 1 I)/ET. Vegetation-mediatedprocesses are typically dominatedby transpiration and E/ET can beobtained as 1 2 (T 1 I)/ET. The com-parison in Figure 10 includes boththe ST and MW sites for the wetter2008 and drier 2009 summer periods. Note that the Leaf off scenario was entirely dominated by E/ET suchthat (T 1 I)/ET was near zero for all cases. Similarly, the Leaf on scenario exhibited (T 1 I)/ET primarilybetween 0.8 and 1 (ST) and 0.5 and 0.7 (MW), indicating a significantly lower contribution of E/ET at ST anda larger E/ET at MW. As such, the Leaf off and Leaf on scenarios are considered as hypothetical bounds onthe actual ET partitioning for each ecosystem under variable (day-to-day) meteorological forcing. TheDynamic scenario, on the other hand, represents well the seasonal evolution and interannual variations inET partitioning. (T 1 I)/ET exhibits a gradual increase in response to vegetation green-up and a peak amountand timing that varies according to the seasonal distribution of rainfall events. During peak greenness,(T 1 I)/ET can range from 0.5 to 1, with higher contributions at ST and for wetter periods. Interestingly, theday-to-day variations in (T 1 I)/ET seem to be higher for the drier 2009 period at both sites, indicating thatlower vegetation greenness leads to higher susceptibility to decreases in vegetation-mediated processesduring interstorm periods. The drier summer also has a lower seasonal recession of (T 1 I)/ET in each ecosys-tem. This indicates that ET partitioning is highly variable within and across summer seasons in response tovegetation differences.
3.5. Comparison of ET Partitioning in Two EcosystemsThe analysis over multiple summers in the two ecosystems allows determining the impact of seasonal rain-fall amounts on the partitioning of evapotranspiration. Establishing this relation would allow for a simpleapproach for estimating the vegetation effects on ET based on available rainfall data for the two differentecosystems. Figure F1111 shows the relation between the monthly vegetation-mediated losses to the atmos-phere, (T 1 I)/ET, and the cumulative rainfall over the current and previous months (Paccm) and the best-fitregressions obtained over a range of possible models. The ST site shows an asymptotic relation between(T 1 I)/ET and Paccm over the five summer periods (n 5 20 based on 4 months in five summers; (T 1 I)/ET 5 22.0 3 1026Paccm
2 1 2.5 3 1023Paccm 2 2.4 3 1022, R2 5 0.95). In contrast, the MW site exhibits a lin-ear increase in (T 1 I)/ET with the cumulative rainfall (n 5 8 for 4 months in two summers; (T 1 I)/ET 5 9.2 3
1024Paccm 2 5.7 3 1022, R2 5 0.92). In both cases, higher accumulated precipitation leads to a greateramount of vegetation-mediated processes due to the production of biomass supporting transpiration andevaporation of intercepted rainfall. For the subtropical scrubland, however, a threshold of 390 mm in 2month total rainfall yields a change in the slope of the (T 1 I)/ET relation with Paccm, as compared to the lin-ear increase in the MW site, indicating that additional rainfall does not appreciably increase vegetation-mediated losses. Nevertheless, the ST site sustains higher (T 1 I)/ET than the MW site at all rainfall amounts,indicating that subtropical scrublands have a greater ability to return soil moisture back to the atmospherethrough (T 1 I)/ET. Since plant interception is larger at the MW site, this implies that transpiration at the ST
Figure 11. Relation of vegetation-mediated fraction, (T 1 I)/ET, with cumulative seasonalrainfall, defined as the current and prior month totals. The black solid line is a regressionfor ST, while the gray dashed line is a regression for MW.
J_ID: WRCR Customer A_ID: WRCR20845 Cadmus Art: WRCR20845 Ed. Ref. No.: 2013WR014838RR Date: 24-March-14 Stage: Page: 17
ID: nagarajulum Time: 13:28 I Path: N:/3b2/WRCR/Vol00000/140131/APPFile/JW-WRCR140131
Water Resources Research 10.1002/2013WR014838
M�ENDEZ-BARROSO ET AL. VC 2014. American Geophysical Union. All Rights Reserved. 17
site is more sensitive to low rainfall (higher slope for Paccm< 390 mm), while being less sensitive at higheraccumulations (lower slope for Paccm> 390 mm), as compared to MW.
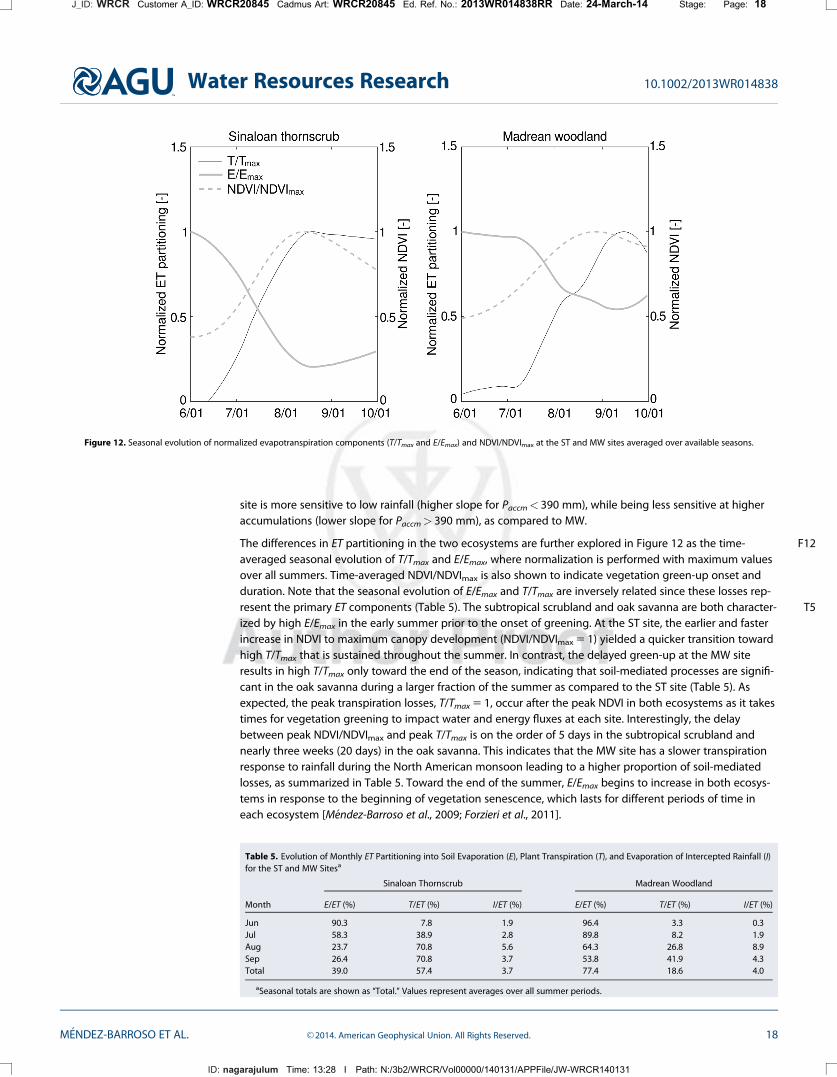
The differences in ET partitioning in the two ecosystems are further explored in Figure F1212 as the time-averaged seasonal evolution of T/Tmax and E/Emax, where normalization is performed with maximum valuesover all summers. Time-averaged NDVI/NDVImax is also shown to indicate vegetation green-up onset andduration. Note that the seasonal evolution of E/Emax and T/Tmax are inversely related since these losses rep-resent the primary ET components (Table T55). The subtropical scrubland and oak savanna are both character-ized by high E/Emax in the early summer prior to the onset of greening. At the ST site, the earlier and fasterincrease in NDVI to maximum canopy development (NDVI/NDVImax 5 1) yielded a quicker transition towardhigh T/Tmax that is sustained throughout the summer. In contrast, the delayed green-up at the MW siteresults in high T/Tmax only toward the end of the season, indicating that soil-mediated processes are signifi-cant in the oak savanna during a larger fraction of the summer as compared to the ST site (Table 5). Asexpected, the peak transpiration losses, T/Tmax 5 1, occur after the peak NDVI in both ecosystems as it takestimes for vegetation greening to impact water and energy fluxes at each site. Interestingly, the delaybetween peak NDVI/NDVImax and peak T/Tmax is on the order of 5 days in the subtropical scrubland andnearly three weeks (20 days) in the oak savanna. This indicates that the MW site has a slower transpirationresponse to rainfall during the North American monsoon leading to a higher proportion of soil-mediatedlosses, as summarized in Table 5. Toward the end of the summer, E/Emax begins to increase in both ecosys-tems in response to the beginning of vegetation senescence, which lasts for different periods of time ineach ecosystem [M�endez-Barroso et al., 2009; Forzieri et al., 2011].
Figure 12. Seasonal evolution of normalized evapotranspiration components (T/Tmax and E/Emax) and NDVI/NDVImax at the ST and MW sites averaged over available seasons.
Table 5. Evolution of Monthly ET Partitioning into Soil Evaporation (E), Plant Transpiration (T), and Evaporation of Intercepted Rainfall (I)for the ST and MW Sitesa
Month
Sinaloan Thornscrub Madrean Woodland
E/ET (%) T/ET (%) I/ET (%) E/ET (%) T/ET (%) I/ET (%)
Jun 90.3 7.8 1.9 96.4 3.3 0.3Jul 58.3 38.9 2.8 89.8 8.2 1.9Aug 23.7 70.8 5.6 64.3 26.8 8.9Sep 26.4 70.8 3.7 53.8 41.9 4.3Total 39.0 57.4 3.7 77.4 18.6 4.0
aSeasonal totals are shown as ‘‘Total.’’ Values represent averages over all summer periods.
J_ID: WRCR Customer A_ID: WRCR20845 Cadmus Art: WRCR20845 Ed. Ref. No.: 2013WR014838RR Date: 24-March-14 Stage: Page: 18
ID: nagarajulum Time: 13:28 I Path: N:/3b2/WRCR/Vol00000/140131/APPFile/JW-WRCR140131
Water Resources Research 10.1002/2013WR014838
M�ENDEZ-BARROSO ET AL. VC 2014. American Geophysical Union. All Rights Reserved. 18

4. Discussion and Conclusions
Seasonal vegetation greening affects the partitioning of water and energy fluxes in arid and semiarid eco-systems under the influence of the North American monsoon [e.g., Reynolds et al., 2000; Y�epez et al., 2003,2007; Scott et al., 2006; Watts et al., 2007; Vivoni, 2012]. As a result, modeling applications that assume con-stant parameters or represent each summer with a fixed seasonal cycle can miss important vegetationimpacts. In this study, we compared simulations that capture seasonally varying parameters inferred fromremotely sensed data to static scenarios representing no canopy and full canopy conditions for two ecosys-tems that are representative of intermediate and high elevation landscapes along mountain fronts in theNorth American monsoon region. We found good agreement between field observations of evapotranspira-tion and soil moisture and simulations from Dynamic scenarios, indicating that the hydrologic model canrepresent interannual differences in the water and energy fluxes in the two ecosystems. In contrast, theLeaf off and Leaf on scenarios had a limited ability to track the seasonal evolution and interannual differen-ces in ET and SM responding to precipitation-induced vegetation variations. While this result is robust overthe five summer period in the subtropical scrubland (ST site), additional data in the oak savanna (MW site)would be valuable for quantifying interannual ecosystem adjustments.
Precipitation events during the North American monsoon wet surface soils and induce a vegetationresponse that varies substantially across the two ecosystems. Early in the monsoon season, however, bothecosystems have dormant plants and soil evaporation is the dominant ET component. The switch towardtranspiration dominance occurs differentially in each ecosystem such that it takes 2–3 weeks for the fulltransition to take place in the subtropical scrubland and 6–8 weeks in the oak savanna. These model-basedestimates are consistent with field data in arid and semiarid ecosystems that respond to the North Americanmonsoon [e.g., Mielnick et al., 2005; Scott et al., 2006; Y�epez et al., 2007; Cavanaugh et al., 2011]. Furthermore,the model identified, for the first time, that the peak transpiration losses are delayed by 5 days and 20 days,on average, from the peak NDVI at the ST and MW sites, respectively. A longer lag time between peak NDVIand transpiration at the MW site as compared to the ST site is likely due to the slower production of morecostly leaves and ensuing activation of the photosynthetic process. This also suggests that rapid and robustvegetation greening in subtropical scrublands is linked directly to the dominance of vegetation-mediatedlosses, where T/ET was found to be 56 6 9% over the five summer periods, well within the range of valuesat shrubland sites with a high vegetation cover [e.g., Scott et al., 2006]. Recent efforts by Tar�ın et al. [2014]using an isotopic partitioning method found T/ET 5 59 6 6% at ST for four specific days. Model compari-sons for these days revealed a standard error of estimates (SEE) of 0.16, with the match varying from a 16%to a 40% difference for individual days. This suggests that the model is capturing ET partitioning well underthe limited conditions of the available data for the study periods. In contrast, delayed and attenuated vege-tation greening in the oak savanna is responsible for soil-mediated losses having a dominant role through-out the season, with T/ET of only 18 6 8%. The important role of soil evaporation in oak savannas has beenrecognized previously by Baldocchi and Xu [2007] and Pereira et al. [2009], but not placed in the context ofsummer vegetation greening. Overall, the seasonal evolution of ET components indicates that transpirationis in-phase with vegetation greenness at the ST site, but out-of-phase (or delayed) at the MW site, a signifi-cant new insight provided through the model. This is consistent with a stronger link between cumulativeprecipitation and vegetation-mediated losses, (T 1 I)/ET, in subtropical scrublands as compared to oaksavannas.
Based on long-term analyses of vegetation greening, Forzieri et al. [2011] found that deciduous subtropicalecosystems in the NAM region have high seasonality with a short period of intense greening occurring rap-idly after precipitation onset. Mountain woodlands including oak savannas, on the other hand, were foundto have more a prolonged period of moderate greenness that was delayed with respect to the precipitationonset but continued well into the fall season. Results described in this study identify the implications of thetwo ecosystem types on the water and energy fluxes, specifically on evapotranspiration and its partitioning,which have not been previously known. Intermediate-elevation subtropical scrublands have a high sensitiv-ity to precipitation, primarily during the early development of the NAM, that allow them to quickly transi-tion from soil to vegetation-mediated losses to the atmosphere. These intensive water users rapidly depleteavailable soil moisture through transpiration, subsequently leading to decreases in vegetation greennessand transpiration near the end of the summer. In contrast, high-elevation oak savannas, with a lower sensi-tivity of canopy development to precipitation, have a slower transition from evaporation to transpiration-
J_ID: WRCR Customer A_ID: WRCR20845 Cadmus Art: WRCR20845 Ed. Ref. No.: 2013WR014838RR Date: 24-March-14 Stage: Page: 19
ID: nagarajulum Time: 13:28 I Path: N:/3b2/WRCR/Vol00000/140131/APPFile/JW-WRCR140131
Water Resources Research 10.1002/2013WR014838
M�ENDEZ-BARROSO ET AL. VC 2014. American Geophysical Union. All Rights Reserved. 19

dominated periods. As a result, these extensive water users slowly deplete soil moisture during the NAM,preserving it for subsequent use to maintain greenness and transpiration during the fall. As discussed byRodr�ıguez-Iturbe et al. [2001], variations in plant water use between intensive and extensive strategies mayallow different ecosystems to occupy specific niches along the mountain front.
The noted variations in seasonal and interannual dynamics of ET and its components in the two ecosystemshave a number of implications on the ecological and hydrologic properties of semiarid mountain fronts inthe NAM region. First, the switch from soil to vegetation-mediated losses affects soil moisture storage sinceevaporation is primarily sourced from shallower layers. The delayed transition at higher elevations impliesthat deeper soil water is preserved for longer periods, potentially leading to mountain recharge [Wilson andGuan, 2004]. Second, the rapid transition toward transpiration in subtropical scrublands implies these sitesare more likely to be responsible for the precipitation-soil moisture-vegetation feedback mechanism [Domi-nguez et al., 2008; M�endez-Barroso and Vivoni, 2010]. Thus, the local precipitation recycling that sustains veg-etation greening during the NAM may be sourced primarily from intermediate elevations along mountainfronts rather than higher elevations. Finally, spatially variable consumption of precipitation in the differentecosystems through ET may have implications on runoff production [Robles-Morua et al., 2012]. However,the underlying processes that could distinguish runoff in subtropical scrublands and oak savannas have yetto be elucidated. Further, the model findings on the interannual variations of ET partitioning in the two eco-systems need to be corroborated by additional field studies, in particular at high elevation oak savannas. Asdemonstrated in this work, the comparative analysis of evapotranspiration and its partitioning in differentecosystems through the use of field observations, remote sensing estimates, and hydrological modeling is afruitful avenue of future work.
Appendix A
Three evaporation components are estimated in tRIBS: (1) bare soil evaporation (E), (2) evaporation of can-opy interception (I), and (3) plant transpiration (T). Total evapotranspiration (ET 5 E 1 I 1T) is estimated in astepwise fashion using the Penman-Monteith approach:
kET5
Dc ðRn2GÞ1 qmk
radqa
11 Dc 1 rs
ra
; (A1)
where D is the slope of the Clausius-Clayperon relation, c is the psychometric constant, k is the latent heatof vaporization, Rn is the net radiation, G is the ground heat flux, qm is the moist air density, dqa is the spe-cific humidity deficit, and ra and rs are the aerodynamic and canopy stomatal resistances. ra is estimatedusing wind speed observations and vegetation height (h) estimates under the assumption of a logarithmicvelocity profile [Shuttleworth, 1992]. In this study, the time-varying rs is obtained from remotely sensedmeasurements of LAI and fPAR (see Appendix C). Net radiation is impacted by the albedo (a) and opticaltransmission coefficient (kt) that characterize the plant canopy or soil surface (Table 3).
Interception occurs as a fraction of rainfall, (1 2 p)R, where p is the free throughfall coefficient and R is rain-fall. Evaporation of intercepted water on the canopy is fulfilled first in the stepwise calculations as [Eltahirand Bras, 1993]:
I5vf Ep for C > S
CS
vf Ep for C � S;
8<: (A2)
where C is the canopy storage volume, S is the maximum canopy storage (Table 3), and Ep is the potentialevaporation rate that excludes the effect of canopy stomatal resistance obtained as:
Ep5ETD1cð11rs=raÞ
D1c
� �: (A3)
The Rutter et al. [1971] approach to tracking the canopy water storage is utilized in the model.
J_ID: WRCR Customer A_ID: WRCR20845 Cadmus Art: WRCR20845 Ed. Ref. No.: 2013WR014838RR Date: 24-March-14 Stage: Page: 20
ID: nagarajulum Time: 13:28 I Path: N:/3b2/WRCR/Vol00000/140131/APPFile/JW-WRCR140131
Water Resources Research 10.1002/2013WR014838
M�ENDEZ-BARROSO ET AL. VC 2014. American Geophysical Union. All Rights Reserved. 20

Bare soil evaporation is then obtained for the bare soil fraction, independently of the plant transpiration,from the potential evaporation rate as [Deardorff, 1978]:
E5ð12vf ÞbSEp; (A4)
where vf is the vegetation fraction of a model element occupied by a plant functional type (i.e., tree orshrub) and represents the green vegetation cover that can be linked to NDVI (Appendix C), while 1 2 vf rep-resents the bare soil area, and bS is a function of soil moisture as:
bS5min 1;hsur2hr
bEhs2hr
� �; (A5)
where hsur is the surface soil moisture (top 10 cm), hs is the soil moisture at saturation, hr is the residual soilmoisture, and bE is the soil evaporation stress factor (Tables 2 and 3). The form of A5 is commonly used inhydrologic models [see Feddes et al., 1978; Mahfouf et al., 1996].
Plant transpiration (T) is calculated after accounting for the consumption of intercepted water by evapora-tion as:
T5bRvf ðEp2IÞ D1cD1cð11rs=raÞ
� �; (A6)
where bR accounts for soil moisture stress that limits the plant water uptake as:
bR5min 1;hroot2hr
bT hs2hr
� �; (A7)
where hroot is the root zone moisture (top 1 m) and bT is the plant transpiration stress factor. Thus, ET is com-posed of three components (ET 5 E 1 I 1 T) that depend on vegetation (vf, rs, p, S, bE, and bT) and soil (hs
and hr) properties, including soil moisture, as well as meteorological forcing, through a weighting based onthe areal proportions of bare soil and vegetation. For additional information, the reader is referred to Wig-mosta et al. [1994] and Ivanov et al. [2004].
Appendix B
Model performance is assessed using three metrics to compare observations (O) and simulations (S) oflatent heat flux and soil moisture over the number of time steps (N) with available data. The Mean AbsoluteError (MAE) describes the absolute differences between observations and simulations without emphasizingthe value of outliers as:
MAE51N
XN
i51
jOi2Si j: (B1)
The correlation coefficient (CC), which measures the linear relation between S and O, is:
CC5
XN
i51
ðOi2�OÞðSi2�SÞ
XN
i51
ðOi2�OÞ2" #0:5 XN
i51
ðSi2�SÞ2" #0:5 ; (B2)
J_ID: WRCR Customer A_ID: WRCR20845 Cadmus Art: WRCR20845 Ed. Ref. No.: 2013WR014838RR Date: 24-March-14 Stage: Page: 21
ID: nagarajulum Time: 13:28 I Path: N:/3b2/WRCR/Vol00000/140131/APPFile/JW-WRCR140131
Water Resources Research 10.1002/2013WR014838
M�ENDEZ-BARROSO ET AL. VC 2014. American Geophysical Union. All Rights Reserved. 21

where the overbar denotes a temporal mean value. CC varies from 21 (negative correlation) to 1 (positivecorrelation), with CC 5 0 indicating no correlation. The dimensionless bias (B) is obtained as the ratio oftemporal mean of the simulated and observed variables, as:
B5�S �O: (B3)
Appendix C
A set of empirical equations are used to link remote sensing data to vegetation parameters in tRIBS (Table3). In each case, coefficient values were locally calibrated by comparing the retrieved parameters to therange of values from available literature in similar ecosystems. Maximum canopy storage (S) controls rainfallinterception as a function of time-varying LAI from MODIS. For both sites, we used the relation, S 5 0.5LAI,from Pitman [1989] and Carlyle-Moses and Price [2007], with the coefficient verified with the data sets of Pit-man [1989] for shrubs and Andre et al. [2008] for oaks. The free throughfall coefficient (p) accounts for thefraction of rainfall not captured by plants. We relate p to time-varying LAI, following Pitman [1989], as:
p5exp ð21:5LAIÞ (C1)
The optical transmission coefficient (kt) is obtained from the Beer-Lambert law as:
kt5exp ð2kLAIÞ (C2)
where k 5 0.61 for ST [Maass et al., 1995] and k 5 0.31 for MW [Sugiyama et al., 1985], based on differencesin leaf architecture at the two sites. The minimum canopy stomatal resistance (rs) was obtained using anenergy-limited relation developed by Schulze et al. [1995] and upscaled from an individual leaf to the can-opy following Irmak et al. [2008]:
rs5bQ501Q
gmax QcLAI
; (C3)
where gmax is the maximum seasonal stomatal conductance specified as 0.03 m/s for drought deciduoustrees [Schulze et al., 1995] and assumed here to be constant in time and for different vegetation types. Adiurnal cycle is prescribed for stomatal resistance such that the minimum value (rs) occurs at noon. This rela-tion does not account for atmospheric conditions that are treated separately in the evapotranspiration esti-mate (A1). Q50 is the value of the absorbed photosynthetically active radiation (Q) obtained when gmax ishalf of its value. Q is obtained as:
Q50:45ISfPAR; (C4)
where Is is the incoming shortwave radiation, fPAR is the fraction of photosynthetically active radiation fromMODIS and the coefficient 0.45 represents the fraction of Is that is used by plants directly for photosynthesis[Meek et al., 1984]. Minimum stomatal resistance values (rs) for both sites were calibrated using the globalestimates of Dorman and Sellers [1989]. Vegetation fraction (vf) was estimated following Carlson and Ripley[1997] as:
vf 5NDVI2NDVImin
NDVImax 2NDVImin
� �2
; (C5)
where NDVImin and NDVImax are the minimum and maximum values of the time-varying NDVI obtained overthe MODIS record (2004–2009) at each site. NDVImin and NDVImax represent the background signal from thesoil during the driest period of the record and peak greenness during the wettest period of the record
J_ID: WRCR Customer A_ID: WRCR20845 Cadmus Art: WRCR20845 Ed. Ref. No.: 2013WR014838RR Date: 24-March-14 Stage: Page: 22
ID: nagarajulum Time: 13:28 I Path: N:/3b2/WRCR/Vol00000/140131/APPFile/JW-WRCR140131
Water Resources Research 10.1002/2013WR014838
M�ENDEZ-BARROSO ET AL. VC 2014. American Geophysical Union. All Rights Reserved. 22

[M�endez-Barroso et al., 2009]. In the model, the vegetated fraction carries out transpiration, while the 1-vf
fraction is considered to be bare soil and is subject to soil evaporation (Appendix A). Time-varying albedo(a) was obtained directly from MODIS. Other vegetation parameters, such as vegetation height (h), werekept constant in the simulations.
ReferencesAndre, F., M. Jonard, and Q. Ponette (2008), Precipitation water storage capacity in temperate mixed Oak-Beech canopy, Hydrol. Processes,
22, 4130–4141.Arora, V. (2002), Modeling vegetation as a dynamic component in soil-vegetation-atmosphere transfer schemes and hydrological models,
Rev. Geophys., 40(2), 1006, doi:10.1029/2001RG000103.Baldocchi, D. D., and L. Xu (2007), What limits evaporation from Mediterranean oak woodlands: The supply of moisture in the soil, physio-
logical control by plants or the demand by the atmosphere?, Adv. Water Resour., 30, 2113–2122.Baldocchi, D. D., B. E. Law, and P. M. Anthoni (2000), On measuring and modeling energy fluxes above the floor of a homogeneous and
heterogeneous conifer forest, Agric. For. Meteorol., 102, 187–206.Bindlish, R., T. J. Jackson, A. J. Gasiewski, B. Stankov, M. H. Cosh, I. Mladenova, E. R. Vivoni, V. Lakshmi, C. J. Watts, and T. Keefer (2008), Air-
craft-based soil moisture retrievals in mixed vegetation and topographic conditions, Remote Sens. Environ., 112, 375–390.Brown, D. (1994), Biotic Communities: Southwestern United States and Northwestern Mexico, 315 pp., Univ. of Utah Press, Salt Lake City.Campbell Scientific, Inc. (2012), Soil Heat Flux Plate Model HFP01, Instruction Manual, 18 pp. AQ1Carlson, T. N., and D. A. Ripley (1997), On the relation between NDVI, fractional vegetation cover, and leaf area index, Remote Sens. Environ.,
62, 241–252.Carlyle-Moses, D. E., and A. G. Price (2007), Modeling canopy interception loss from a Madrean pine-oak stand, Northeastern Mexico,
Hydrol. Processes, 21, 2572–2580.Cavanaugh, M., S. Kurc, and R. L. Scott (2011), Evapotranspiration partitioning in semiarid shrubland ecosystems: A two-site evaluation of
soil moisture control on transpiration, Ecohydrology, 4, 671–681.Cleugh, H. A., R. Leuning, Q. Mu, and S. W. Running (2007), Regional evaporation estimates from flux tower and MODIS satellite data,
Remote Sens. Environ., 106, 285–304.Deardorff, J. W. (1978), Efficient prediction of ground surface temperature and moisture with inclusion of a layer of vegetation, J. Geophys.
Res., 82, 1889–1903.Dorman, J. L., and P. J. Sellers (1989), A global climatology of albedo, roughness length and stomatal resistance for atmospheric general cir-
culation models as represented by Simple Biosphere Model (SiB), J. Appl. Meteorol., 28, 833–855.Eltahir, E. A. B. (1998), A soil moisture-rainfall feedback mechanism, theory and observations, Water Resour. Res., 34, 765–776.Eltahir, E. A. B., and R. L. Bras (1993), A description of rainfall interception over large areas, J. Clim., 6, 1002–1008.Feddes, R. A., P. J. Kowalik, and H. Zaradny (1978), Simulation of Field Water Use and Crop Yield, 188 pp., John Wiley, New York.Fensholt, R., I. Sanholt, and M. Schultz (2004), Evaluation of MODIS LAI, fAPAR and the relation between fAPAR and NDVI in a semiarid envi-
ronment using in situ measurements, Remote Sens. Environ., 91, 490–507.Forzieri, G., F. Castelli, and E. R. Vivoni (2011), Vegetation dynamics within the North American monsoon region, J. Clim., 24(6), 1763–1783.Frank, J., W. Massman, and B. Ewers (2013), Underestimates of sensible heat flux due to vertical velocity measurement errors in non-
orthogonal sonic anemometers, Agric. For. Meteorol., 171–172, 72–81.Gebremichael, M., E. R. Vivoni, C. J. Watts, and J. C. Rodr�ıguez (2007), Sub-mesoscale spatiotemporal variability of North American monsoon
rainfall over complex terrain, J. Clim., 20(9), 1751–1773.Gutzler, D. S. (2004), An index of interannual precipitation variability in the core of the North American monsoon region, J. Clim., 17, 4473–
4480.Higgins, R. W., and W. Shi (2001), Intercomparison of the principal modes of interanual and intraseasonal variability of the North American
monsoon system, J. Clim., 14, 403–417.Irmak, S., D. Mutiibwa, A. Irmak, T. J. Arkebauer, A. Weiss, D. L. Martin, and D. E. Eisenhauer (2008), On the scaling up leaf stomatal resistance
to canopy resistance using photosynthetic photon flux density, Agric. For. Meteorol., 148, 1034–1044.Ivanov, V. Y., E. R. Vivoni, R. L. Bras, and D. Entekhabi (2004), Catchment hydrologic response with a fully distributed triangulated irregular
network model, Water Resour. Res., 40, W11102, doi:10.1029/2004WR003218.Ivanov, V. Y., R. L. Bras, and E. R. Vivoni (2008), Vegetation-hydrology dynamics in complex terrain of semiarid areas. I: A mechanistic
approach to modeling dynamic feedbacks, Water Resour. Res., 44, W03429, doi:10.1029/2006WR005588.Kochendorfer, J., T. P. Meyers, J. Frank, W. J. Massman, and M. W. Heuer (2012), How well can we measure the vertical wind speed? Implica-
tions for fluxes of energy and mass, Boundary Layer Meteorol., 145(2), 383–398.Kustas, W. P., J. H. Prueger, J. L. Hatfield, K. Ramalingam, and L. E. Hipps (2000), Variability in soil heat flux from a mesquite dune site, Agric.
For. Meteorol., 103, 249–264.Lapham, W. W. (1989), Use of temperature profiles beneath streams to determine rates of vertical groundwater flow and vertical hydraulic
conductivity, USGS Water Supply Pap., 2337, 1–35.Lawrence, D., P. Thornton, K. Oleson, and G. Bonan (2007), The partition of evapotranspiration into transpiration, soil evaporation, and can-
opy evaporation in GCM: Impacts on land-atmosphere interactions, J. Hydrometeorol., 8, 862–880.Lee, X., J. Finnigan, and K. T. Paw U (2004), Coordinate systems and flux bias error, in Handbook of Micrometeorology: A Guide for Surface
Flux Measurements, edited by X. Lee, W. J. Massman, and B. E. Law, pp. 33–66, Kluwer Acad., Dordrecht, Netherlands.Liz�arraga-Celaya, C., C. J. Watts, J. C. Rodr�ıguez, J. Garatuza- Pay�an, R. L. Scott, and J. A. S�aiz-Hern�andez (2010), Spatio-temporal variations in
surface characteristics over the North American monsoon region, J. Arid Environ., 74, 540–548.Maass, J. M., J. M. Vose, W. Swankb, and A. Martinez-Yrizar (1995), Seasonal changes of leaf area index (LAI) in a tropical deciduous forest in
west Mexico, For. Ecol. Manage., 74, 171–180.Mahfouf, J.-F., C. Ciret, A. Ducharne, P. Irannejad, J. Noilhan, Y. Shao, P. Thorton, Y. Xue, and Z.-L. Yang (1996), Analysis of transpiration
results from the RICE and PILPS Workshop, Global Planet. Change, 13, 73–88.Massman, W. J., and X. Lee (2002), Eddy covariance flux corrections and uncertainties in long-term studies of carbon and energy
exchanges, Agric. For. Meteorol., 113, 121–144.
AcknowledgmentsWe acknowledge funding from theNOAA Climate Program Office(GC07–019), NSF IRES Program (OISE0553852), and a Consejo Nacional deCiencias y Tecnolog�ıa (CONACY)fellowship. We thank students fromthe United States and Mexico whoparticipated in the field work. Threeanonymous reviewers providedexcellent comments that helpedimprove the manuscript.
J_ID: WRCR Customer A_ID: WRCR20845 Cadmus Art: WRCR20845 Ed. Ref. No.: 2013WR014838RR Date: 24-March-14 Stage: Page: 23
ID: nagarajulum Time: 13:28 I Path: N:/3b2/WRCR/Vol00000/140131/APPFile/JW-WRCR140131
Water Resources Research 10.1002/2013WR014838
M�ENDEZ-BARROSO ET AL. VC 2014. American Geophysical Union. All Rights Reserved. 23

Matsui, T., V. Lakshmi, and E. E. Small (2005), The effects of satellite derived vegetation cover variability on simulated land-atmosphereinteractions in the NAMS, J. Clim., 18, 21–40.
Mauder, M., and T. Foken (2004), Documentation and Instruction Manual of the Eddy Covariance Software Package TK2, vol. 26, 44 pp., Univ.Bayreuth, Abt. Mikrometeorologie. AQ2
Meek, D. W., J. L. Hatfield, T. A. Howell, S. B. Idso, and R. J. Reginato (1984), A generalized relationship between photosynthetically activeradiation and solar radiation, Agron. J., 76, 939–945.
M�endez-Barroso, L. A., E. R. Vivoni, C. J. Watts, and J. C. Rodr�ıguez (2009), Seasonal and interannual relations between precipitation, soilmoisture and vegetation dynamics in the North American monsoon region, J. Hydrol., 377, 59–70.
M�endez-Barroso, L. A., and E. R. Vivoni (2010), Observed shift in land surface conditions during the North American monsoon: Implicationsfor a vegetation-rainfall feedback mechanism, J. Arid Environ., 74, 549–555.
Mielnick, P., D. A. Dugas, K. Mitchell, and K. Havstad (2005), Long-term measurements of CO2 flux and evapotranspiration in a Chihuahuandesert grassland, J. Arid Environ., 60, 423–436.
Mitchell, K. E., et al. (2004), The multi-institution North American Land Data Assimilation System (NLDAS): Utilizing multiple GCIP productsand partners in a continental distributed hydrological modeling system, J. Geophys. Res., 109, D07S90, doi:10.1029/2003JD003823.
Moncrieff, J. B., P. G. Jarvis, and R. Valentini (2000), Canopy fluxes, in Methods in Ecosystem Science, edited by O. E. Sala, pp. 161–181,Springer, New York.
Moran, M. S., R. L. Scott, T. O. Keefer, W. E. Emmerich, M. Hernandez, G. S. Nearing, G. B. Paige, M. H. Cosh, and P. E. O’Neill (2009), Partition-ing evapotranspiration in semiarid grassland and shrubland ecosystems using time series of soil surface temperature, Agric. For. Mete-orol., 149, 59–72.
Newman, B. D., B. P. Wilcox, S. Archer, D. D. Breshears, C. N. Dahm, C. J. Duffy, N. G. McDowell, F. M. Phillips, B. R. Scanlon, and E. R. Vivoni(2006), The ecohydrology of arid and semiarid environments: A scientific vision, Water Resour. Res., 42, W06302, doi:10.1029/2005WR004141.
Peel, M. C., B. L. Finlayson, and T. A. McMahon (2007), Updated world map of the K€oppen-Geiger climate classification, Hydrol. Earth Syst.Sci., 11, 1633–1644.
Pereira, F. L., J. H. C. Gash, J. S. David, T. S. David, P. R. Monteiro, and F. Valente (2009), Modelling interception loss from evergreen oak Med-iterranean savannas: Application of a tree-based modelling approach, Agric. For. Meteorol., 149(3–4), 680–688.
Pitman, J. I. (1989), Rainfall interception by bracken in open habitats relations between leaf area, canopy storage and drainage rate, J.Hydrol., 105, 317–334.
Privette, J. L., R. B. Myneni, Y. Knyazikhin, M. Mukelabai, and G. Roberts (2002), Early spatial and temporal validation of MODIS LAI productin the Southern Africa Kalahari, Remote Sens. Environ., 83, 232–243.
Rawls, W. J., and D. L. Brakensiek (1989), Estimation of soil water retention and hydraulic properties, in Unsaturated Flow in Hydrologic Mod-eling: Theory and Practice, pp. 275–300, Kluwer Acad., Dordrecht, Netherlands.
Rawls, W. J., D. L. Brakensiek, and N. Miller (1983), Green-Ampt infiltration parameters from soils data, J. Hydraul. Eng., 109(1), 62–70.Raz-Yaseef, N., D. Yakir, G. Schiller, and S. Cohen (2012), Dynamics of evapotranspiration partitioning in a semi-arid forest as affected by
temporal rainfall patterns, Agric. For. Meteorol., 157, 77–85.Reynolds, J. F., P. R. Kemp, and J. D. Tenhunen (2000), Effects of long-term rainfall variability on evapotranspiration and soil water distribu-
tion in the Chihuahuan Desert: A modeling analysis, Plant Ecol., 150, 145–159.Robles-Morua, A., E. R. Vivoni, and A. Mayer (2012), Distributed hydrologic modeling in Northwest Mexico reveals the links between runoff
mechanisms and evapotranspiration, J. Hydrometeorol., 13, 785–807.Rodr�ıguez-Iturbe, I., A. Porporato, F. Laio, and L. Ridolfi (2001), Intensive versus extensive use of soil moisture: Plant strategies to cope with
stochastic water availability, Geophys. Res. Lett., 28, 4495–4497.Rutter, A. J., K. A. Kershaw, P. C. Robins, and A. J. Morton (1971), A predictive model of rainfall interception in forests. 1: Derivation of the
model from observation in a plantation of Corsican pine, Agric. Meteorol., 9, 367–384.Ryu, Y., J. Verfaille, C. Macfarlane, H. Kobayashi, O. Sonnentag, R. Vargas, S. Ma, and D. Baldocchi (2012), Continuous observations of tree
leaf area index at ecosystem scale using upward-pointing digital cameras, Remote Sens. Environ., 126, 115–125.Schulze, E. D., R. Leuning, and F. M. Kelliher (1995), Environmental regulation of surface conductance for evaporation from vegetation, Veg-
etatio, 121, 79–87.Scott, R. L., E. A. Edwards, W. J. Shuttleworth, T. E. Huxman, C. J. Watts, and D. C. Goodrich (2004), Interannual and seasonal variations in
fluxes of water and carbon dioxide from a riparian woodland ecosystem, Agric. For. Meteorol., 122, 64–84.Scott, R. L., T. E. Huxman, W. L. Cable, and W. E. Emmerich (2006), Partitioning of evapotranspiration and its relation to carbon dioxide
exchange in a Chihuahuan desert shrubland, Hydrol. Processes, 20, 3227–3243.Seyfried, M. S., and M. D. Murdock (2004), Measurement of soil water content with a 50-MHz soil dielectric sensor, Soil Sci. Soc. Am. J., 68,
394–403.Shuttleworth, W. J. (1992), Evaporation, in Handbook of Hydrology, edited by D. R. Maidment, pp. 4.11–4.18, McGraw-Hill, New York.Stannard, D. I., and M. A. Weltz (2006), Partitioning evapotranspiration in sparsely vegetated rangeland using a portable chamber, Water
Resour. Res., 42, W02413, doi:10.1029/2005WR004251.Sugiyama, S., M. Yoneyama, N. Takahashi, and K. Gotoh (1985), Canopy structure and productivity of Festuca arundinacea Schreb, during
vegetative and reproductive growth, Grass Forage Sci., 40, 49–55.Tang, Q., E. R. Vivoni, F. Munoz-Arriola, and D. P. Lettenmaier (2012), Predictability of evapotranspiration patterns using remotely-sensed
vegetation dynamics during the North American monsoon, J. Hydrometeorol., 13, 103–121.Tar�ın, T. T., E. A. Y�epez, J. Garatuza-Pay�an, C. J. Watts, J. C. Rodr�ıguez, E. R. Vivoni, and L. A. M�endez-Barroso (2014), Evapotranspiration parti-
tioning with stable isotopes in ecohydrological studies, Water Technol. Sci., 5(3), in press. AQ3.Van den Hurk, B. J. J. M., P. Viterbo, and S. O. Los (2003), Impact of leaf area index seasonality on the annual land surface evaporation in a
global circulation model, J. Geophys. Res., 108(D6), 4191, doi:10.1029/2002JD002846.Van Genuchten, M. T. (1980), Predicting the hydraulic conductivity of unsaturated soil, Soil Sci. Soc. Am. J., 44, 892–898.Vargas, R., et al. (2013), Progress and opportunities for monitoring greenhouse gases fluxes in Mexican ecosystems: The MexFlux Network,
Atm�osfera, 26(3), 325–336.Vivoni, E. R. (2012), Diagnosing seasonal vegetation impacts on evapotranspiration and its partitioning at the catchment scale during
SMEX04-NAME, J. Hydrometeorol., 13, 1631–1638.Vivoni, E. R., D. Entekhabi, R. L. Bras, and V. Y. Ivanov (2007a), Controls on runoff generation and scale-dependence in a distributed hydro-
logic model, Hydrol. Earth Syst. Sci., 11(5), 1683–1701.
J_ID: WRCR Customer A_ID: WRCR20845 Cadmus Art: WRCR20845 Ed. Ref. No.: 2013WR014838RR Date: 24-March-14 Stage: Page: 24
ID: nagarajulum Time: 13:28 I Path: N:/3b2/WRCR/Vol00000/140131/APPFile/JW-WRCR140131
Water Resources Research 10.1002/2013WR014838
M�ENDEZ-BARROSO ET AL. VC 2014. American Geophysical Union. All Rights Reserved. 24

Vivoni, E. R., et al. (2007b), Variation of hydrometeorological conditions along a topographic transect in northwestern Mexico during theNorth American monsoon, J. Clim., 20(9), 1792–1809.
Vivoni, E. R., H. A. Moreno, G. Mascaro, J. C. Rodr�ıguez, C. J. Watts, J. Garatuza-Pay�an, and R. L. Scott (2008), Observed relation betweenevapotranspiration and soil moisture in the North American monsoon region, Geophys. Res. Lett., 35, L22403, doi:10.1029/2008GL036001.
Vivoni, E. R., J. C. Rodr�ıguez, and C. J. Watts (2010), On the spatiotemporal variability of soil moisture and evapotranspiration in a mountain-ous basin within the North American monsoon region, Water Resour. Res., 46, W02509, doi:10.1029/2009WR008240.
Watts, C. J., R. L. Scott, J. Garatuza-Pay�an, J. C. Rodr�ıguez, J. H. Prueger, W. P. Kustas, and M. Douglas (2007), Changes in vegetation condi-tion and surface fluxes during NAME 2004, J. Clim., 20, 1810–1820.
Webb, E. K., G. I. Pearman, and R. Leuning (1980), Correction of flux measurements for density effects due to heat and water vapour trans-fer, Q. J. R. Meteorol. Soc., 106, 85–100.
Wigmosta, M. S., L. Vail, and D. P. Lettenmaier (1994), A distributed hydrology-vegetation model for complex terrain, Water Resour. Res., 30,1665–1679.
Wilczak, J. M., S. P. Oncley, and S. A. Stage (2001), Sonic anemometer tilt correction algorithms. Boundary Layer Meteorol., 99, 127–150.Wilson, J. L., and H. Guan (2004), Mountain-block hydrology and mountain front recharge, in Groundwater Recharge in a Desert Environ-
ment: The Southwestern United States, Water Science and Applications, vol. 9, pp. 113–137, AGU, Washington, D. C.Wilson, K., A. Goldstein, E. Falge, M. Aubinet, and D. Baldocchi (2002), Energy balance closure at FLUXNET sites, Agric. For. Meteorol., 113,
223–243.Yan, H., et al. (2012), Global estimation of evapotranspiration using a leaf area index-based surface energy and water balance model,
Remote Sens. Environ., 124, 581–595.Yang, Y., R. L. Scott, and S. Shang (2013), Modeling evaporation and its partitioning over a semiarid shrub ecosystem from satellite imagery:
A multiple validation, J. Appl. Remote Sens., 7, 073495, doi:10.1117/1.JRS.7.073495.Y�epez, E. A., D. Williams, R. Scott, and G. Lin (2003), Partitioning overstory and understory evapotranspiration in a semiarid savanna wood-
land from the isotopic composition of water vapor, Agric. For. Meteorol., 119, 53–68.Y�epez, E., R. Scott, W. Cable, and D. Williams (2007), Intraseasonal variation in water and carbon dioxide flux components in a semiarid
riparian woodland, Ecosystems, 10, 1100–1115.
J_ID: WRCR Customer A_ID: WRCR20845 Cadmus Art: WRCR20845 Ed. Ref. No.: 2013WR014838RR Date: 24-March-14 Stage: Page: 25
ID: nagarajulum Time: 13:28 I Path: N:/3b2/WRCR/Vol00000/140131/APPFile/JW-WRCR140131
Water Resources Research 10.1002/2013WR014838
M�ENDEZ-BARROSO ET AL. VC 2014. American Geophysical Union. All Rights Reserved. 25