journal of arid environments -...
TRANSCRIPT
lable at ScienceDirect
Journal of Arid Environments 74 (2010) 603–610
Contents lists avai
Journal of Arid Environments
journal homepage: www.elsevier .com/locate/ jar idenv
Water use by perennial crops in the lower Sonora watershed
J.C. Rodrıguez a,*, J. Grageda b, C.J. Watts c, J. Garatuza-Payan f, A. Castellanos-Villegas e,J. Rodrıguez-Casas a, J. Saiz-Hernandez d, V. Olavarrieta d
a Departamento de Agricultura y Ganaderıa, Universidad de Sonora, Hermosillo, Sonora, Mexicob Campo Experimental Costa de Hermosillo-INIFAP, Hermosillo, Sonora, Mexicoc Departmento de Fısica, Universidad de Sonora, Hermosillo, Sonora, Mexicod Departamento de Ingenierıa Civil y Minas, Universidad de Sonora, Hermosillo, Sonora, Mexicoe Departamento de Investigaciones Cientıficas y Tecnologicas, Universidad de Sonora, Hermosillo, Sonora, Mexicof Instituto Tecnologico de Sonora, Cd Obregon, Sonora, Mexico
a r t i c l e i n f o
Article history:Received 27 February 2009Received in revised form17 November 2009Accepted 23 November 2009Available online 27 January 2010
Keywords:AquiferEddy correlationEvapotranspirationNAMTable grapesWater flux
* Corresponding author at: Departamento de Agversidad de Sonora, Luis Encinas y Rosales S/N, HermTel.: þ52 662 259 2108; fax: þ52 662 259 2109.
E-mail address: [email protected] (J.C. Rodrıgu
0140-1963/$ – see front matter � 2010 Elsevier Ltd. Adoi:10.1016/j.jaridenv.2009.11.008
a b s t r a c t
The North American Monsoon is the principal source of fresh water in northwest Mexico, accounting foralmost 70% of annual precipitation and around 80% of surface runoff. In the northern regions abovew28�N, there is insufficient surface runoff to satisfy urban, industrial and agricultural users and largecoastal aquifers are used to supply water for irrigation. The lower part of the Rıo Sonora watershed isdevoted to irrigated agriculture, where perennial cash crops account for 40% of the area. The major cropsare table grapes and pecan with cultivated areas of 100 km2 and 50 km2, respectively. Although efficientdrip irrigation systems have been installed for these crops, annual water use remains very high:w1150 mm for grapes and w1700 mm for pecan. During the 2005–2006 growing seasons, eddy corre-lation measurements of evapotranspiration (ET) were performed for two different grape varieties,obtaining 680 mm for Perlette and 776 mm for Superior. During theses measurement periods, theapplied irrigation depths were 1121 mm and 1088 mm, respectively. For pecans, the ET measurementwas 1297 mm and the applied irrigation was 1459 mm. In other words, the applied irrigation is in excessof the water consumed by the plants: about 50% for grapes and 10% for pecan. This conclusion is sup-ported by soil humidity (qv) measurements for grapes, where the values of qv between depths of 10 cmand 120 cm are larger than field capacity during most of the annual cycle. Therefore, it is proposed thatthe irrigation depth should be gradually reduced to 800–900 mm, which would save w30 hm3 of freshwater for other uses each year.
� 2010 Elsevier Ltd. All rights reserved.
1. Introduction
Water resources occupy a special place among naturalresources. During the past several decades water resources havebeen overexploited, reducing water quality and limiting its avail-ability (Shiklomanov, 2000). This impact is more evident in arid andsemi-arid regions and the majority of developing countries. In mostof these countries, agriculture is the main economic activity andaccounts for approximately 70% of the total water used (Cosgroveand RijsBerman, 2000).
In the northwest region of Mexico, the main source of water isthe summer precipitation (July–September). Rainfall during this
ricultura y Ganaderıa, Uni-osillo, Sonora 83000, Mexico.
ez).
ll rights reserved.
period accounts for 60–70% of the region’s annual precipitation(Douglas et al., 1993). In the state of Sonora, surface runoff is storedin several reservoirs, mainly within the Yaqui river system andother small dams across the state. In the northwestern part ofSonora, very little surface water is available and the main watersource for annual and perennial crop irrigation is groundwater(CONAGUA, 2006).
This applies to the Costa de Hermosillo aquifer, which hasbeen overexploited for more than 50 years, causing extensiveseawater intrusion and aquifer contamination (Rangel-Medinaet al., 2004). Currently, the mean annual withdrawal isw450 hm3, while the net annual ‘‘recharge’’ is w250 hm3, ofwhich only w150 hm3 is freshwater, the other w100 hm3 beingsaline water (Oroz, 2001).
In this area, pecan and table grapes are the main perennial cropsand represent about 30% of the total cropped area. These cropsprovide an important source of income from exports, as well asa hundreds of thousands of days of labor for farm workers. These
J.C. Rodrıguez et al. / Journal of Arid Environments 74 (2010) 603–610604
two crops consume more than 50% of the yearly aquifer rechargerequirements. Considering this unsustainable situation, the presentwork focuses on analysis of irrigation depths, evapotranspirationand soil moisture levels for these crops and addresses their impacton the aquifer.
2. Materials and methods
2.1. Site description
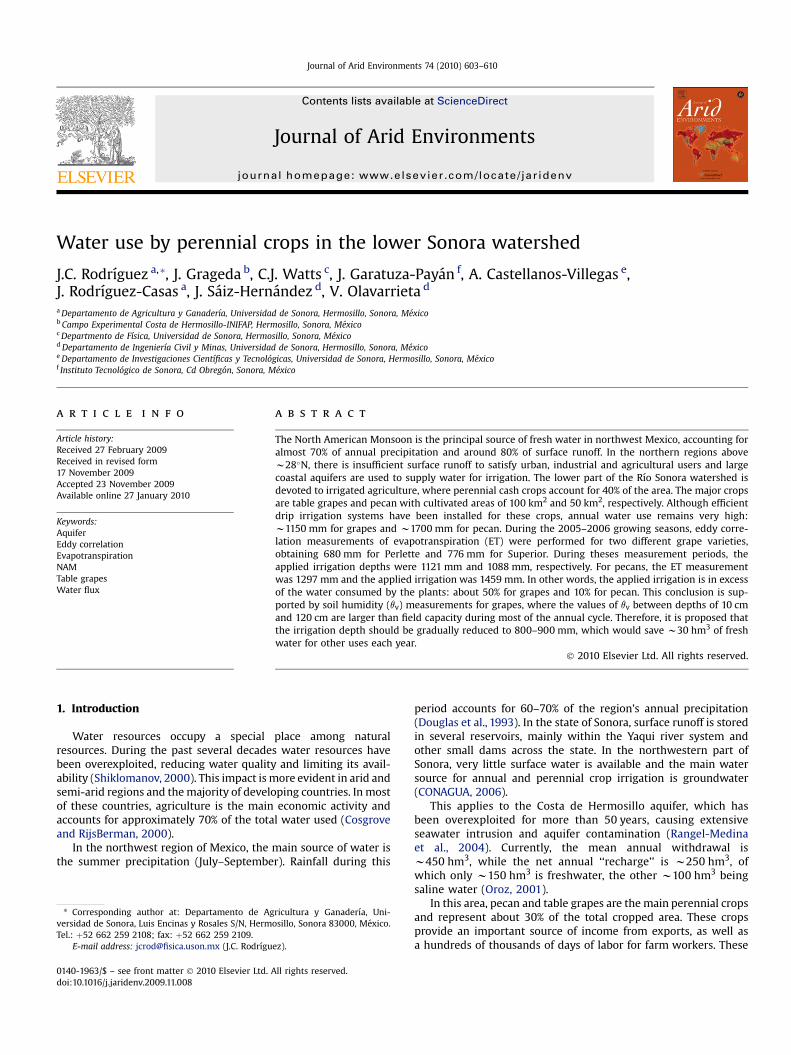
The Costa de Hermosillo is the lower part of Sonora riverwatershed in northwest Mexico (Fig. 1). This is mainly a flat agri-cultural area of 169,593 ha, where the annual and perennial cropsoccupy around 53,000 ha every year, irrigated using water fromsome 500 deep wells. The climate is arid with an annual rainfall ofaround 200 mm. The rainy season is from July to September(representing about 70% of the total annual rainfall) and there isvirtually no rainfall from March to June. The mean daily
Fig. 1. Experimental sites, eddy correlation system on table grapes, eddy co
temperatures range from 22 �C to 24 �C, with sporadic frosts in thewinter and temperatures that are frequently above 45 �C from theend of spring into summer.
2.2. Experimental sites
The study was conducted in 2005 and 2006 in two 10 ha tablegrape vineyards (Vitis vinifera L., cvs. Perlette and Superior) anda 50 ha pecan orchard (Carya illinoinensis (Wangenh.) K. Koch, cvs.
The soil texture classes, field capacity (FC) and wilting point(WP) were determined in the Soil Survey Laboratory of the Colegiode Posgraduados (http://www.colpos.mx). Soil textures wereobtained by the Bouyoucos hydrometer method, while FC and WPwere measured using the pressure membrane apparatus at�30 kPa and �1.5 MPa, respectively. The soils of vineyard wereclassified as sand clay loam ‘‘SCL’’ (64%, 22% and 14% sand, clay andsilt, respectively) and those for the pecan orchard as clay loam ‘‘CL’’(43%, 34% and 23% sand, clay and silt, respectively). These soil
rrelation system on pecans and Sonora watershed location on Mexico.
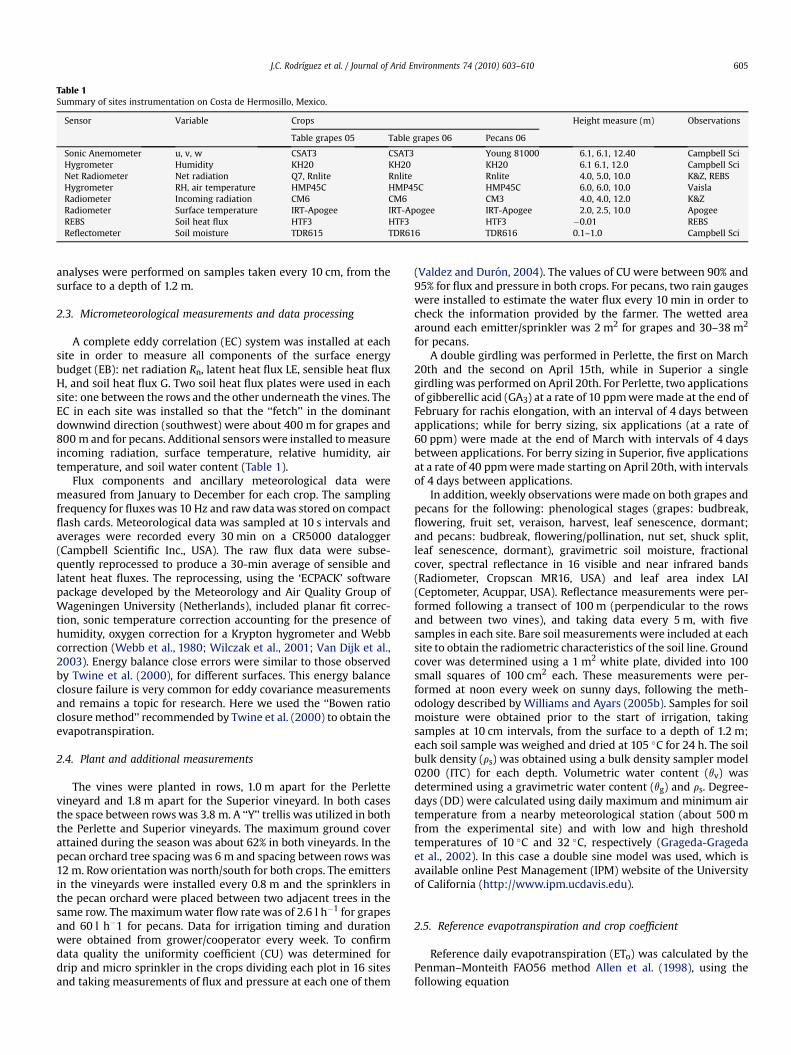
Table 1Summary of sites instrumentation on Costa de Hermosillo, Mexico.
Sensor Variable Crops Height measure (m) Observations
Table grapes 05 Table grapes 06 Pecans 06
Sonic Anemometer u, v, w CSAT3 CSAT3 Young 81000 6.1, 6.1, 12.40 Campbell SciHygrometer Humidity KH20 KH20 KH20 6.1 6.1, 12.0 Campbell SciNet Radiometer Net radiation Q7, Rnlite Rnlite Rnlite 4.0, 5.0, 10.0 K&Z, REBSHygrometer RH, air temperature HMP45C HMP45C HMP45C 6.0, 6.0, 10.0 VaislaRadiometer Incoming radiation CM6 CM6 CM3 4.0, 4.0, 12.0 K&ZRadiometer Surface temperature IRT-Apogee IRT-Apogee IRT-Apogee 2.0, 2.5, 10.0 ApogeeREBS Soil heat flux HTF3 HTF3 HTF3 �0.01 REBSReflectometer Soil moisture TDR615 TDR616 TDR616 0.1–1.0 Campbell Sci
J.C. Rodrıguez et al. / Journal of Arid Environments 74 (2010) 603–610 605
analyses were performed on samples taken every 10 cm, from thesurface to a depth of 1.2 m.
2.3. Micrometeorological measurements and data processing
A complete eddy correlation (EC) system was installed at eachsite in order to measure all components of the surface energybudget (EB): net radiation Rn, latent heat flux LE, sensible heat fluxH, and soil heat flux G. Two soil heat flux plates were used in eachsite: one between the rows and the other underneath the vines. TheEC in each site was installed so that the ‘‘fetch’’ in the dominantdownwind direction (southwest) were about 400 m for grapes and800 m and for pecans. Additional sensors were installed to measureincoming radiation, surface temperature, relative humidity, airtemperature, and soil water content (Table 1).
Flux components and ancillary meteorological data weremeasured from January to December for each crop. The samplingfrequency for fluxes was 10 Hz and raw data was stored on compactflash cards. Meteorological data was sampled at 10 s intervals andaverages were recorded every 30 min on a CR5000 datalogger(Campbell Scientific Inc., USA). The raw flux data were subse-quently reprocessed to produce a 30-min average of sensible andlatent heat fluxes. The reprocessing, using the ‘ECPACK’ softwarepackage developed by the Meteorology and Air Quality Group ofWageningen University (Netherlands), included planar fit correc-tion, sonic temperature correction accounting for the presence ofhumidity, oxygen correction for a Krypton hygrometer and Webbcorrection (Webb et al., 1980; Wilczak et al., 2001; Van Dijk et al.,2003). Energy balance close errors were similar to those observedby Twine et al. (2000), for different surfaces. This energy balanceclosure failure is very common for eddy covariance measurementsand remains a topic for research. Here we used the ‘‘Bowen ratioclosure method’’ recommended by Twine et al. (2000) to obtain theevapotranspiration.
2.4. Plant and additional measurements
The vines were planted in rows, 1.0 m apart for the Perlettevineyard and 1.8 m apart for the Superior vineyard. In both casesthe space between rows was 3.8 m. A ‘‘Y’’ trellis was utilized in boththe Perlette and Superior vineyards. The maximum ground coverattained during the season was about 62% in both vineyards. In thepecan orchard tree spacing was 6 m and spacing between rows was12 m. Row orientation was north/south for both crops. The emittersin the vineyards were installed every 0.8 m and the sprinklers inthe pecan orchard were placed between two adjacent trees in thesame row. The maximum water flow rate was of 2.6 l h�1 for grapesand 60 l h�1 for pecans. Data for irrigation timing and durationwere obtained from grower/cooperator every week. To confirmdata quality the uniformity coefficient (CU) was determined fordrip and micro sprinkler in the crops dividing each plot in 16 sitesand taking measurements of flux and pressure at each one of them
(Valdez and Duron, 2004). The values of CU were between 90% and95% for flux and pressure in both crops. For pecans, two rain gaugeswere installed to estimate the water flux every 10 min in order tocheck the information provided by the farmer. The wetted areaaround each emitter/sprinkler was 2 m2 for grapes and 30–38 m2
for pecans.A double girdling was performed in Perlette, the first on March
20th and the second on April 15th, while in Superior a singlegirdling was performed on April 20th. For Perlette, two applicationsof gibberellic acid (GA3) at a rate of 10 ppm were made at the end ofFebruary for rachis elongation, with an interval of 4 days betweenapplications; while for berry sizing, six applications (at a rate of60 ppm) were made at the end of March with intervals of 4 daysbetween applications. For berry sizing in Superior, five applicationsat a rate of 40 ppm were made starting on April 20th, with intervalsof 4 days between applications.
In addition, weekly observations were made on both grapes andpecans for the following: phenological stages (grapes: budbreak,flowering, fruit set, veraison, harvest, leaf senescence, dormant;and pecans: budbreak, flowering/pollination, nut set, shuck split,leaf senescence, dormant), gravimetric soil moisture, fractionalcover, spectral reflectance in 16 visible and near infrared bands(Radiometer, Cropscan MR16, USA) and leaf area index LAI(Ceptometer, Acuppar, USA). Reflectance measurements were per-formed following a transect of 100 m (perpendicular to the rowsand between two vines), and taking data every 5 m, with fivesamples in each site. Bare soil measurements were included at eachsite to obtain the radiometric characteristics of the soil line. Groundcover was determined using a 1 m2 white plate, divided into 100small squares of 100 cm2 each. These measurements were per-formed at noon every week on sunny days, following the meth-odology described by Williams and Ayars (2005b). Samples for soilmoisture were obtained prior to the start of irrigation, takingsamples at 10 cm intervals, from the surface to a depth of 1.2 m;each soil sample was weighed and dried at 105 �C for 24 h. The soilbulk density (rs) was obtained using a bulk density sampler model0200 (ITC) for each depth. Volumetric water content (qv) wasdetermined using a gravimetric water content (qg) and rs. Degree-days (DD) were calculated using daily maximum and minimum airtemperature from a nearby meteorological station (about 500 mfrom the experimental site) and with low and high thresholdtemperatures of 10 �C and 32 �C, respectively (Grageda-Gragedaet al., 2002). In this case a double sine model was used, which isavailable online Pest Management (IPM) website of the Universityof California (http://www.ipm.ucdavis.edu).
2.5. Reference evapotranspiration and crop coefficient
Reference daily evapotranspiration (ETo) was calculated by thePenman–Monteith FAO56 method Allen et al. (1998), using thefollowing equation
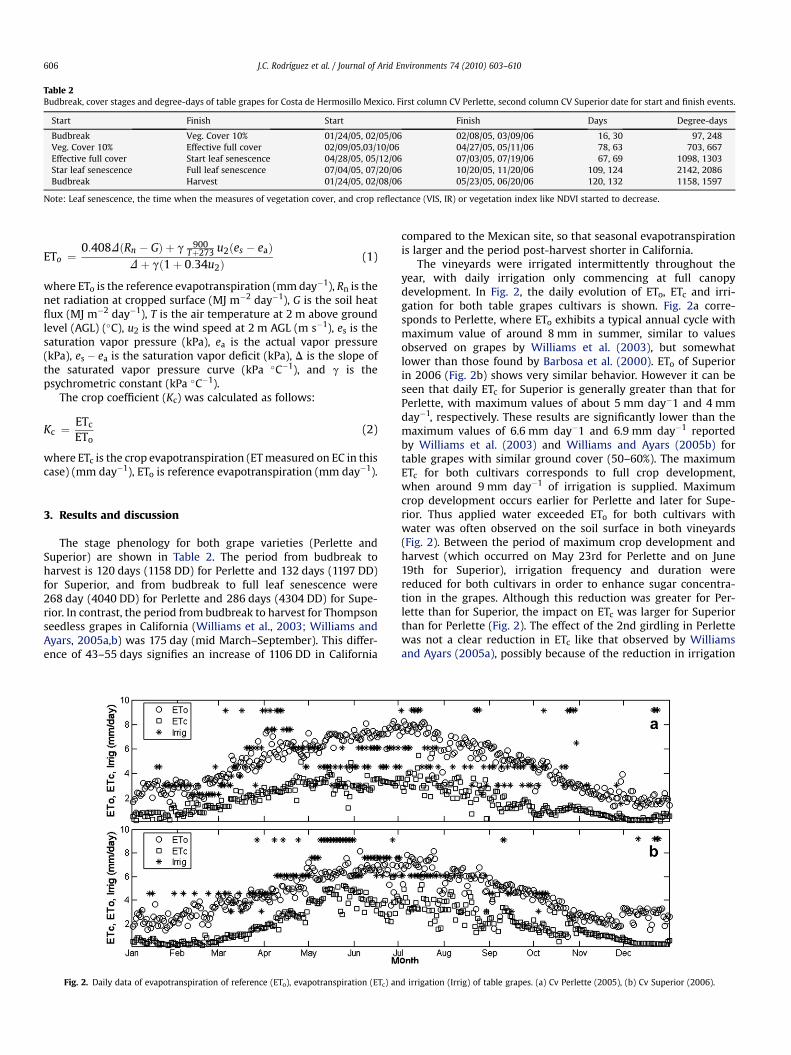
Table 2Budbreak, cover stages and degree-days of table grapes for Costa de Hermosillo Mexico. First column CV Perlette, second column CV Superior date for start and finish events.
Start Finish Start Finish Days Degree-days
Budbreak Veg. Cover 10% 01/24/05, 02/05/06 02/08/05, 03/09/06 16, 30 97, 248Veg. Cover 10% Effective full cover 02/09/05,03/10/06 04/27/05, 05/11/06 78, 63 703, 667Effective full cover Start leaf senescence 04/28/05, 05/12/06 07/03/05, 07/19/06 67, 69 1098, 1303Star leaf senescence Full leaf senescence 07/04/05, 07/20/06 10/20/05, 11/20/06 109, 124 2142, 2086Budbreak Harvest 01/24/05, 02/08/06 05/23/05, 06/20/06 120, 132 1158, 1597
Note: Leaf senescence, the time when the measures of vegetation cover, and crop reflectance (VIS, IR) or vegetation index like NDVI started to decrease.
J.C. Rodrıguez et al. / Journal of Arid Environments 74 (2010) 603–610606
ETo ¼0:408DðRn � GÞ þ g 900
Tþ273 u2ðes � eaÞDþ gð1þ 0:34u2Þ
(1)
where ETo is the reference evapotranspiration (mm day�1), Rn is thenet radiation at cropped surface (MJ m�2 day�1), G is the soil heatflux (MJ m�2 day�1), T is the air temperature at 2 m above groundlevel (AGL) (�C), u2 is the wind speed at 2 m AGL (m s�1), es is thesaturation vapor pressure (kPa), ea is the actual vapor pressure(kPa), es � ea is the saturation vapor deficit (kPa), D is the slope ofthe saturated vapor pressure curve (kPa �C�1), and g is thepsychrometric constant (kPa �C�1).
The crop coefficient (Kc) was calculated as follows:
Kc ¼ETc
ETo(2)
where ETc is the crop evapotranspiration (ET measured on EC in thiscase) (mm day�1), ETo is reference evapotranspiration (mm day�1).
3. Results and discussion
The stage phenology for both grape varieties (Perlette andSuperior) are shown in Table 2. The period from budbreak toharvest is 120 days (1158 DD) for Perlette and 132 days (1197 DD)for Superior, and from budbreak to full leaf senescence were268 day (4040 DD) for Perlette and 286 days (4304 DD) for Supe-rior. In contrast, the period from budbreak to harvest for Thompsonseedless grapes in California (Williams et al., 2003; Williams andAyars, 2005a,b) was 175 day (mid March–September). This differ-ence of 43–55 days signifies an increase of 1106 DD in California
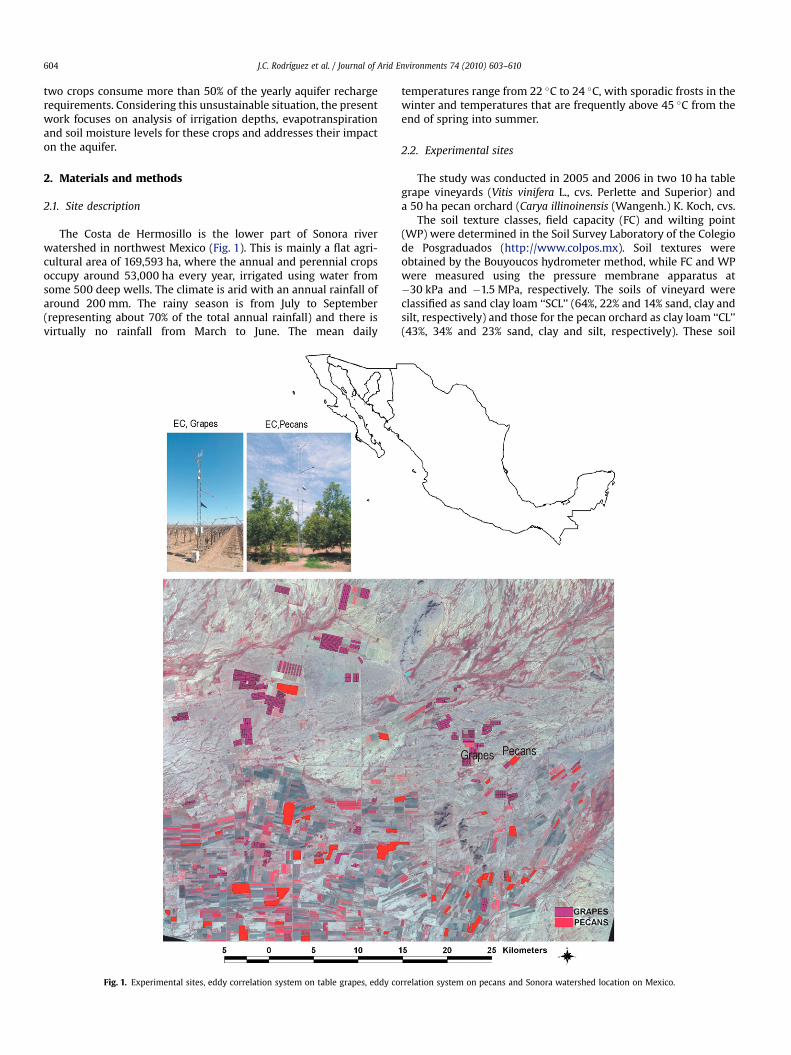
Fig. 2. Daily data of evapotranspiration of reference (ETo), evapotranspiration (ETc) an
compared to the Mexican site, so that seasonal evapotranspirationis larger and the period post-harvest shorter in California.
The vineyards were irrigated intermittently throughout theyear, with daily irrigation only commencing at full canopydevelopment. In Fig. 2, the daily evolution of ETo, ETc and irri-gation for both table grapes cultivars is shown. Fig. 2a corre-sponds to Perlette, where ETo exhibits a typical annual cycle withmaximum value of around 8 mm in summer, similar to valuesobserved on grapes by Williams et al. (2003), but somewhatlower than those found by Barbosa et al. (2000). ETo of Superiorin 2006 (Fig. 2b) shows very similar behavior. However it can beseen that daily ETc for Superior is generally greater than that forPerlette, with maximum values of about 5 mm day�1 and 4 mmday�1, respectively. These results are significantly lower than themaximum values of 6.6 mm day�1 and 6.9 mm day�1 reportedby Williams et al. (2003) and Williams and Ayars (2005b) fortable grapes with similar ground cover (50–60%). The maximumETc for both cultivars corresponds to full crop development,when around 9 mm day�1 of irrigation is supplied. Maximumcrop development occurs earlier for Perlette and later for Supe-rior. Thus applied water exceeded ETo for both cultivars withwater was often observed on the soil surface in both vineyards(Fig. 2). Between the period of maximum crop development andharvest (which occurred on May 23rd for Perlette and on June19th for Superior), irrigation frequency and duration werereduced for both cultivars in order to enhance sugar concentra-tion in the grapes. Although this reduction was greater for Per-lette than for Superior, the impact on ETc was larger for Superiorthan for Perlette (Fig. 2). The effect of the 2nd girdling in Perlettewas not a clear reduction in ETc like that observed by Williamsand Ayars (2005a), possibly because of the reduction in irrigation
d irrigation (Irrig) of table grapes. (a) Cv Perlette (2005), (b) Cv Superior (2006).
J.C. Rodrıguez et al. / Journal of Arid Environments 74 (2010) 603–610 607
applied and/or the effect of the AG3. For Superior the girdlingand AG3 application had no effect on water use, as was alsoobserved by Williams and Ayars (2005a).
The other crop evaluated in this study was a young Pecan stand,with a maximum height of 6.5 m and maximum vegetation cover of45%, during the period from spring to summer. Fig. 3 shows theseasonal behavior of daily ETo and ETc for this perennial crop. Theannual ETo curve exhibits a maximum of w8 mm day�1 at the endof spring and a minimum of w3 mm day�1 at the end of winter.These values are similar to those presented above for table grapesand also for other sites with similar climatic conditions (Barbosaet al., 2000; Sammis et al., 2004). ETc values follow typical seasonalbehavior, with maximum values of 7–8 mm day�1 at full plantdevelopment between mid May and mid September. These valuesare similar to those obtained for adult pecans (8 mm day�1) in NewMexico (Sammis et al., 2004). In the same figure, we observe thatthe crop received flood irrigation at the end of its dormancy periodin February, producing a sudden increase in ETc from 1 mm day�1 to3 mm day�1 as a consequence of soil evaporation. After about10 days ETc returned to its initial value. This is a common effect forsparse vegetation covers and is observed in other crops, e.g. cotton(Garatuza-Payan et al., 1998). Before the pecans were harvested, ETc
is around w6 mm day�1 and starts to decline due to the beginningof leaf senescence and reaches w1 mm day�1 at the end ofDecember. In this region, the period from budbreak to full leafsenescence is approximately 1 month longer than that observed inother pecan sites such as Las Cruces, New Mexico since the plantretains its leaves and continues to transpire due to the relativelyhigh air temperature during the fall. We can conclude that appliedwater to the pecan orchard was only slightly in excess of thedemand, so that it appears field application efficiency (FAE), that isthe rate of water transpired to the rate at which water is applied atfield level (Bos et al., 1993) is much higher for pecans than the FAEobserved for grapes.
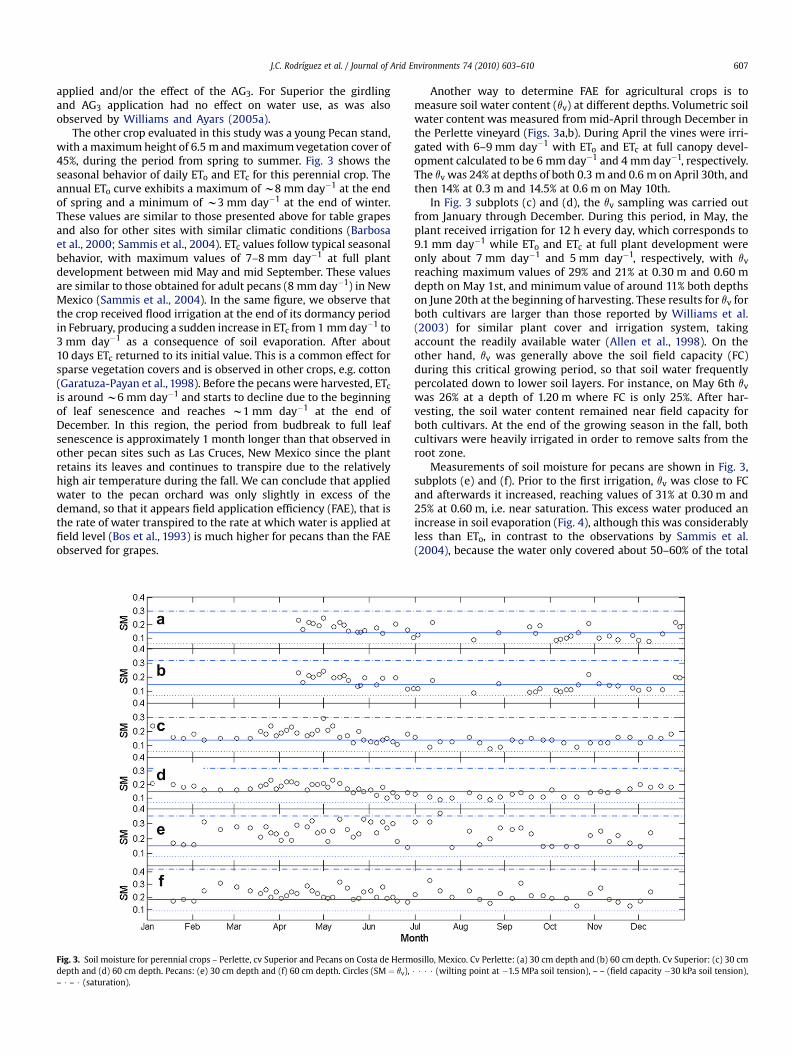
Fig. 3. Soil moisture for perennial crops – Perlette, cv Superior and Pecans on Costa de Hermdepth and (d) 60 cm depth. Pecans: (e) 30 cm depth and (f) 60 cm depth. Circles (SM ¼ qv),– $ – $ (saturation).
Another way to determine FAE for agricultural crops is tomeasure soil water content (qv) at different depths. Volumetric soilwater content was measured from mid-April through December inthe Perlette vineyard (Figs. 3a,b). During April the vines were irri-gated with 6–9 mm day�1 with ETo and ETc at full canopy devel-opment calculated to be 6 mm day�1 and 4 mm day�1, respectively.The qv was 24% at depths of both 0.3 m and 0.6 m on April 30th, andthen 14% at 0.3 m and 14.5% at 0.6 m on May 10th.
In Fig. 3 subplots (c) and (d), the qv sampling was carried outfrom January through December. During this period, in May, theplant received irrigation for 12 h every day, which corresponds to9.1 mm day�1 while ETo and ETc at full plant development wereonly about 7 mm day�1 and 5 mm day�1, respectively, with qv
reaching maximum values of 29% and 21% at 0.30 m and 0.60 mdepth on May 1st, and minimum value of around 11% both depthson June 20th at the beginning of harvesting. These results for qv forboth cultivars are larger than those reported by Williams et al.(2003) for similar plant cover and irrigation system, takingaccount the readily available water (Allen et al., 1998). On theother hand, qv was generally above the soil field capacity (FC)during this critical growing period, so that soil water frequentlypercolated down to lower soil layers. For instance, on May 6th qv
was 26% at a depth of 1.20 m where FC is only 25%. After har-vesting, the soil water content remained near field capacity forboth cultivars. At the end of the growing season in the fall, bothcultivars were heavily irrigated in order to remove salts from theroot zone.
Measurements of soil moisture for pecans are shown in Fig. 3,subplots (e) and (f). Prior to the first irrigation, qv was close to FCand afterwards it increased, reaching values of 31% at 0.30 m and25% at 0.60 m, i.e. near saturation. This excess water produced anincrease in soil evaporation (Fig. 4), although this was considerablyless than ETo, in contrast to the observations by Sammis et al.(2004), because the water only covered about 50–60% of the total
osillo, Mexico. Cv Perlette: (a) 30 cm depth and (b) 60 cm depth. Cv Superior: (c) 30 cm$ $ $ $ (wilting point at �1.5 MPa soil tension), – – (field capacity �30 kPa soil tension),
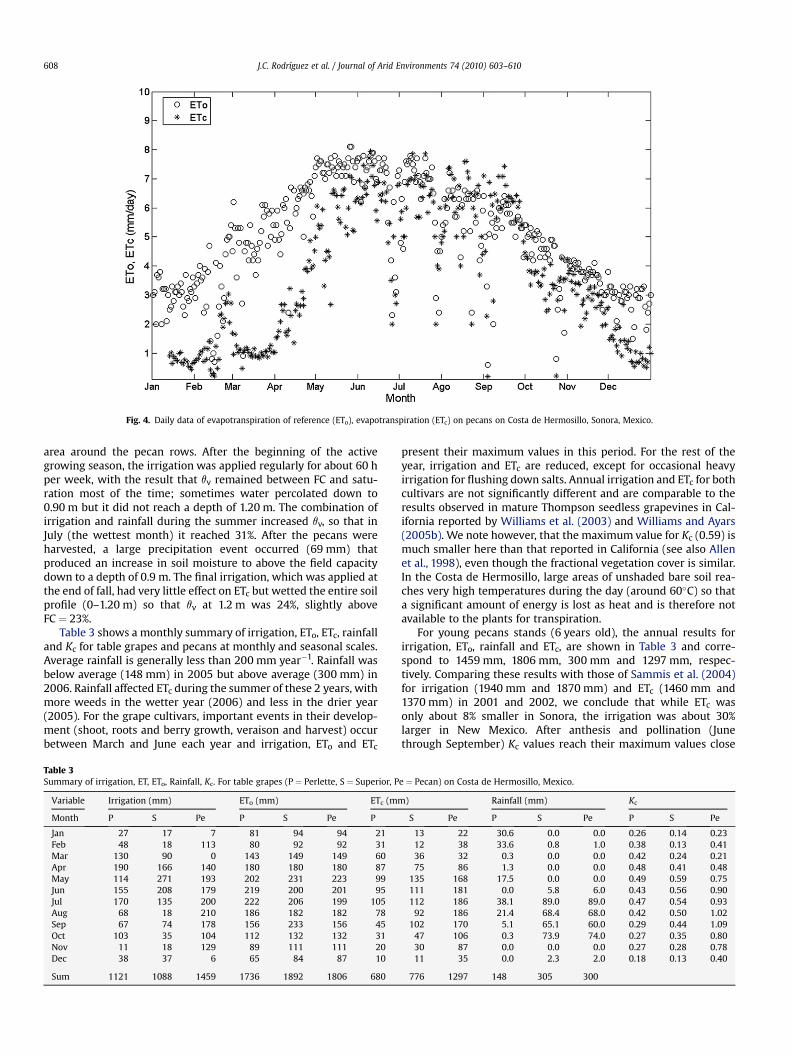
Fig. 4. Daily data of evapotranspiration of reference (ETo), evapotranspiration (ETc) on pecans on Costa de Hermosillo, Sonora, Mexico.
J.C. Rodrıguez et al. / Journal of Arid Environments 74 (2010) 603–610608
area around the pecan rows. After the beginning of the activegrowing season, the irrigation was applied regularly for about 60 hper week, with the result that qv remained between FC and satu-ration most of the time; sometimes water percolated down to0.90 m but it did not reach a depth of 1.20 m. The combination ofirrigation and rainfall during the summer increased qv, so that inJuly (the wettest month) it reached 31%. After the pecans wereharvested, a large precipitation event occurred (69 mm) thatproduced an increase in soil moisture to above the field capacitydown to a depth of 0.9 m. The final irrigation, which was applied atthe end of fall, had very little effect on ETc but wetted the entire soilprofile (0–1.20 m) so that qv at 1.2 m was 24%, slightly aboveFC ¼ 23%.
Table 3 shows a monthly summary of irrigation, ETo, ETc, rainfalland Kc for table grapes and pecans at monthly and seasonal scales.Average rainfall is generally less than 200 mm year�1. Rainfall wasbelow average (148 mm) in 2005 but above average (300 mm) in2006. Rainfall affected ETc during the summer of these 2 years, withmore weeds in the wetter year (2006) and less in the drier year(2005). For the grape cultivars, important events in their develop-ment (shoot, roots and berry growth, veraison and harvest) occurbetween March and June each year and irrigation, ETo and ETc
Table 3Summary of irrigation, ET, ETo, Rainfall, Kc. For table grapes (P ¼ Perlette, S ¼ Superior, P
Variable Irrigation (mm) ETo (mm) ETc (mm
Month P S Pe P S Pe P
Jan 27 17 7 81 94 94 21Feb 48 18 113 80 92 92 31Mar 130 90 0 143 149 149 60Apr 190 166 140 180 180 180 87May 114 271 193 202 231 223 99Jun 155 208 179 219 200 201 95Jul 170 135 200 222 206 199 105Aug 68 18 210 186 182 182 78Sep 67 74 178 156 233 156 45Oct 103 35 104 112 132 132 31Nov 11 18 129 89 111 111 20Dec 38 37 6 65 84 87 10
Sum 1121 1088 1459 1736 1892 1806 680
present their maximum values in this period. For the rest of theyear, irrigation and ETc are reduced, except for occasional heavyirrigation for flushing down salts. Annual irrigation and ETc for bothcultivars are not significantly different and are comparable to theresults observed in mature Thompson seedless grapevines in Cal-ifornia reported by Williams et al. (2003) and Williams and Ayars(2005b). We note however, that the maximum value for Kc (0.59) ismuch smaller here than that reported in California (see also Allenet al., 1998), even though the fractional vegetation cover is similar.In the Costa de Hermosillo, large areas of unshaded bare soil rea-ches very high temperatures during the day (around 60�C) so thata significant amount of energy is lost as heat and is therefore notavailable to the plants for transpiration.
For young pecans stands (6 years old), the annual results forirrigation, ETo, rainfall and ETc, are shown in Table 3 and corre-spond to 1459 mm, 1806 mm, 300 mm and 1297 mm, respec-tively. Comparing these results with those of Sammis et al. (2004)for irrigation (1940 mm and 1870 mm) and ETc (1460 mm and1370 mm) in 2001 and 2002, we conclude that while ETc wasonly about 8% smaller in Sonora, the irrigation was about 30%larger in New Mexico. After anthesis and pollination (Junethrough September) Kc values reach their maximum values close
e ¼ Pecan) on Costa de Hermosillo, Mexico.
) Rainfall (mm) Kc
S Pe P S Pe P S Pe
13 22 30.6 0.0 0.0 0.26 0.14 0.2312 38 33.6 0.8 1.0 0.38 0.13 0.4136 32 0.3 0.0 0.0 0.42 0.24 0.2175 86 1.3 0.0 0.0 0.48 0.41 0.48
135 168 17.5 0.0 0.0 0.49 0.59 0.75111 181 0.0 5.8 6.0 0.43 0.56 0.90112 186 38.1 89.0 89.0 0.47 0.54 0.93
92 186 21.4 68.4 68.0 0.42 0.50 1.02102 170 5.1 65.1 60.0 0.29 0.44 1.09
47 106 0.3 73.9 74.0 0.27 0.35 0.8030 87 0.0 0.0 0.0 0.27 0.28 0.7811 35 0.0 2.3 2.0 0.18 0.13 0.40
776 1297 148 305 300
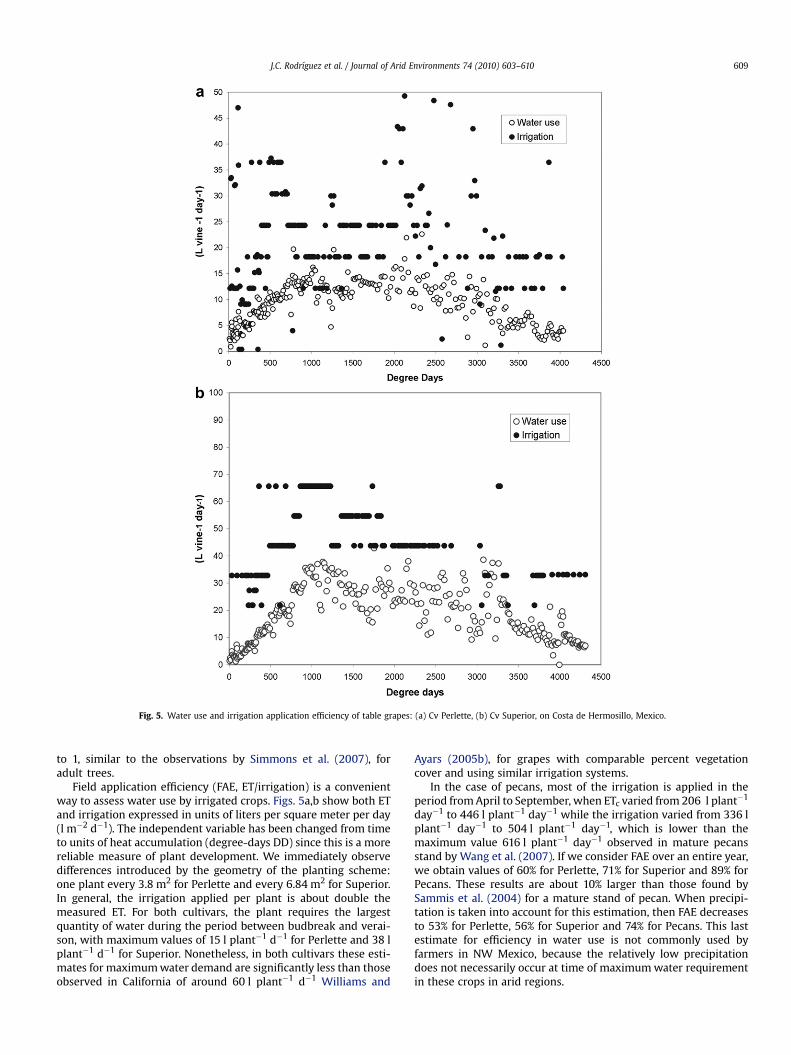
Fig. 5. Water use and irrigation application efficiency of table grapes: (a) Cv Perlette, (b) Cv Superior, on Costa de Hermosillo, Mexico.
J.C. Rodrıguez et al. / Journal of Arid Environments 74 (2010) 603–610 609
to 1, similar to the observations by Simmons et al. (2007), foradult trees.
Field application efficiency (FAE, ET/irrigation) is a convenientway to assess water use by irrigated crops. Figs. 5a,b show both ETand irrigation expressed in units of liters per square meter per day(l m�2 d�1). The independent variable has been changed from timeto units of heat accumulation (degree-days DD) since this is a morereliable measure of plant development. We immediately observedifferences introduced by the geometry of the planting scheme:one plant every 3.8 m2 for Perlette and every 6.84 m2 for Superior.In general, the irrigation applied per plant is about double themeasured ET. For both cultivars, the plant requires the largestquantity of water during the period between budbreak and verai-son, with maximum values of 15 l plant�1 d�1 for Perlette and 38 lplant�1 d�1 for Superior. Nonetheless, in both cultivars these esti-mates for maximum water demand are significantly less than thoseobserved in California of around 60 l plant�1 d�1 Williams and
Ayars (2005b), for grapes with comparable percent vegetationcover and using similar irrigation systems.
In the case of pecans, most of the irrigation is applied in theperiod from April to September, when ETc varied from 206 l plant�1
day�1 to 446 l plant�1 day�1 while the irrigation varied from 336 lplant�1 day�1 to 504 l plant�1 day�1, which is lower than themaximum value 616 l plant�1 day�1 observed in mature pecansstand by Wang et al. (2007). If we consider FAE over an entire year,we obtain values of 60% for Perlette, 71% for Superior and 89% forPecans. These results are about 10% larger than those found bySammis et al. (2004) for a mature stand of pecan. When precipi-tation is taken into account for this estimation, then FAE decreasesto 53% for Perlette, 56% for Superior and 74% for Pecans. This lastestimate for efficiency in water use is not commonly used byfarmers in NW Mexico, because the relatively low precipitationdoes not necessarily occur at time of maximum water requirementin these crops in arid regions.
J.C. Rodrıguez et al. / Journal of Arid Environments 74 (2010) 603–610610
Finally, since water is a scarce resource in the region and theagricultural sector uses about 80% of all the fresh water available,efficiency in the use of water should have a high priority. Theresults presented here may be summarized as follows. Theaverage area dedicated to grapes is around 9000 ha and 99.5 hm3
of irrigation is applied annually to satisfy a crop requirement thatis estimated to be about 65.5 hm3. In the case of Pecans, the areais 5000 ha the irrigation 72.9 hm3 and the estimated croprequirement 64.8 hm3. So it can be concluded that annualwastage of water is approximately 34 hm3 for grapes and 8 hm3
for Pecans. In other words, the annual wastage of water perhectare is about 3750 m3 for grapes and 1600 m3 per hectare forpecans.
4. Conclusions
Irrigation applications, ETo and ETc for two important perennialcrops on the Costa de Hermosillo, Mexico, were measured during 2consecutive years, 2005 and 2006. The maximum values observedfor ETc were about 15 l plant�1 day�1, 38 l plant�1 day�1 and 446 lplant�1 day�1 for Perlette, Superior and Pecans, respectively, whilethe irrigation applied was about 37 l plant�1 day�1, 65 l plant�1
day�1 and 504 l plant�1 day�1 for same crops. The total volume ofirrigation water is about 172 hm3 and the total volume of plantevapotranspiration is about 130 hm3. The difference is 42 hm3
(fresh water that is essentially wasted) which is equivalent to about30% of the freshwater recharge of the aquifer. The water use effi-ciency (equivalent to evapotranspiration divided by applied irri-gation) was 89% for pecans but only 65% for grapes. In the case ofgrapes, the soil moisture content was frequently above soil fieldcapacity, which means that excess water percolates to deep soillayers and is not available for use by the plants. Therefore it shouldbe possible to reduce the water application without reducing cropproduction through careful management, including soil moisturemonitoring, regular elimination of weeds, reduction of distancesbetween water supply points, optimized daily irrigation program,etc. This water savings can be used for other needs like urban orecological services.
The fact that seasonal ET for Perlette and Superior grapes in theCosta de Hermosillo, Sonora is less than that observed in othermore temperate regions such as California is rather surprising,given the very high maximum temperatures that are common inthe Sonoran desert. One factor may be that the period from bud-break to harvest is relatively short here and this is the period thatrequires intensive management practices and when most of theirrigation water is applied. While for pecans, the seasonal ET valueis high compared to the young pecan stand New Mexico. This maybe a consequence of transpiration from weeds which was not wellcontrolled by the farmer.
Finally we recognize that several factors influence a grower’sdecision before reducing the water application. The aerodynamicmethod (eddy correlation) for estimating ET is very complicatedand it can be difficult to assess the reliability of the data. Also, thedifferences between excess or deficit of water applied vs yield effectcan be quite small and difficult to quantify and growers will oftennot take a risk (i.e. reduce the water application) if they are notconvinced about the benefits to be realized. For this reason it will benecessary to collect additional data such as direct measurement ofdeep percolation. If it can be shown that significant quantities ofthese expensive resources, such as water and fertilizer, are beingwasted, it will probably be more effective in convincing farmersthat they will increase their income by reducing the amount ofirrigation. Additionally farmers who adopt these practices may beeligible for extra support from environmental agencies.
Acknowledgments
The authors wish to thank Alejandro Valenzuela, Martin Cani-zales and Tayde Lopez for your support on field experiments, and Mr.Carlos Copel and Eduardo Copel from Don Luis and Vinas farms. Thisfield research was carried out with support from Fundacion ProduceSonora, Farmers Association of Northern Sonora and CEDES. Theanalysis reported here was conducted as part of project Participatorymulti-Level EO-assisted tools for Irrigation water management andAgricultural Decision-Support (PLEIADES) with financial supportfrom the European Union. Finally, we are pleased to recognize thecontinued support of CONACYT and the University of Sonora.
Appendix. Supplementary data
Supplementary data associated with this article can be found inthe online version, at doi:10.1016/j.jaridenv.2009.11.008
References
Allen, R.G., Pereira, L.S., Raes, D., Smith, M., 1998. Crop Evapotranspiration: Guide-lines for Computing Crop Water Requirements. FAO Irrigation and drainagepaper No. 56. FAO, Rome, Italy, 300 pp.
Barbosa, B., Slack, D.C., Kilby, M.W., Hla, A.K., 2000. Measurements of waterrequirements of table grapes in Arizona. Revista Brasileira de Agrometeorologia8, 175–183.
Bos, M.G., Murria-Rust, D.H., Merrey, D.J., Jonson, H.G., Snellen, W.B., 1993. Meth-odologies for Assessing Performance or Irrigation and Drainage Management,Workshop of the Working Group on Irrigation and Drainage Performance. ICID15th International Congress, The Hague, The Netherlands.
CONAGUA, 2006, Estadısticas del agua en Mexico. SEMARNAT, 210 pp.Cosgrove, W.J., Rijsberman, F.R., 2000. Water World Vision: Making Water Every-
body’s Business. Earthscan Publications, London.Douglas, M.W., Maddox, R.A., Howard, K., 1993. The Mexican monsoon. Journal of
Climate 6, 1665–1677.Garatuza-Payan, J., Shuttleworth, W.J., Encinas, D., McNeil, D., Stewart, J.B., de
Bruin, H., Watts, C., 1998. Measurement and modeling evaporation for irrigatedcrops in north-west Mexico. Hydrological Process 12, 1397–1418.
Grageda-Grageda, J., Osorio, G., Fu, A., 2002. Uso de estaciones meteorologicasautomatizadas en la agricultura. INIFAP, folleto tecnico 24, Hermosillo, Mexico.
Oroz, L., 2001. Modelo conceptual hidrogeologico e hidrogeoquımico de la Costa deHermosillo, MSc Thesis, Universidad de Sonora.
Rangel-Medina, M., Monreal, R., Morales, M., Castillo, J., 2004. Estimation of thevulnerability to saline intrusion of the coast of Hermosillo aquifer, Sonora,Mexico. Geofısica Internacional 43, 611–621.
Sammis, T.W., Mexal, J.G., Millar, D., 2004. Evapotranspiration of food-irrigatedpecans. Agricultural Water Management 69, 179–190.
Shiklomanov, I.A., 2000. Appraisal and assessment of world water resources. WaterInternational 25 (1), 11–32.
Simmons, L.J., Wang, J., Sammis, T.W., Miller, D.R., 2007. An evolution of two inexpensiveenergy-balance techniques for measuring water use in flood-irrigated pecans(Carya illinoinensis). Agricultural Water Management 88, 181–191.
Twine, T.E., Kustas, W.P., Norman, J.M., Cook, D.R., Houser, P.R., Meyers, T.P.,Prueger, J.H., Starks, P.J., Wesely, M.L., 2000. Correcting eddy-covariance fluxunderestimates over a grassland. Agricultural and Forest Meteorology 103,279–300.
Valdez, V., Duron, L.J., 2004. Manejo del riego en vid de mesa, Seminario deViticultura, INIFAP-CECH, 18. Publicacion Especial, Hermosillo, Mexico. 47–54.
Van Dijk, A., Kohsiek, W., De Bruin, H.A.R., 2003. Oxygen sensitivity of Kripton andLymann-a hygrometers. Journal of Atmospheric and Oceanic Technology 20,143–151.
Wang, T., Miller, D.R., Sammis, T.W., Gutschick, V.P., Simmons, L.J., Andales, A.A.,2007. Energy balance measurements and a simple model for estimating pecanswater use efficiency. Agricultural Water Management 91, 92–101.
Webb, E.K., Pearman, G.I., Leuning, R., 1980. Correction of flux measurements fordensity effects due to heat and water vapour transfer. Quarterly Journal of theRoyal Meteorological Society 106, 85–100.
Wilczak, J., Oncley, S., Stage, S.A., 2001. Sonic anemometer tilt correction algorithms.Boundary-Layer Meteorology 99, 127–150.
Williams, L.E., Ayars, J.E., 2005a. Water use of Thompson seedless grapevines asaffected by the application of gibberellic acid (GA3) and trunk girdling-practicesto increase berry size. Agricultural and Forest Meteorology 129, 85–94.
Williams, L.E., Ayars, J.E., 2005b. Grapevine water use and crop coefficient are linearfunctions of the shaded area measured beneath the canopy. Agricultural andForest Meteorology 132, 201–211.
Williams, L.E., Phene, C.J., Grimes, D.W., Trout, T.J., 2003. Water use of matureThompson seedless grapevine in California. Irrigation Science 22, 11–18.