public transport values of time - white rose research...
TRANSCRIPT

This is a repository copy of Public transport values of time.
White Rose Research Online URL for this paper:http://eprints.whiterose.ac.uk/3393/
Article:
Wardman, M.R. (2004) Public transport values of time. Transport Policy, 11 (4). pp. 363-377. ISSN 0967-070X
https://doi.org/10.1016/j.tranpol.2004.05.001
[email protected]://eprints.whiterose.ac.uk/
Reuse
See Attached
Takedown
If you consider content in White Rose Research Online to be in breach of UK law, please notify us by emailing [email protected] including the URL of the record and the reason for the withdrawal request.

Universities of Leeds, Sheffield and York http://eprints.whiterose.ac.uk/
Institute of Transport StudiesUniversity of Leeds
This is an author produced version of a paper which appeared in Transport Policy, and has been uploaded with the permission of the publishers Elsevier. It has been peer reviewed but does not include the final publications formatting or pagination. White Rose Repository URL for this paper: http://eprints.whiterose.ac.uk/3393
Published paper Wardman, M.R. (2004) Public Transport Values of Time. Transport Policy, 11(4), pp.363-377
White Rose Consortium ePrints Repository [email protected]

PUBLIC TRANSPORT VALUES OF TIME
Mark Wardman 1. INTRODUCTION In 1980 the UK Department of Transport commissioned a major study of the value of travel time savings. This pioneering study was extensive in its coverage of methodological issues and different modes, contexts, journey lengths and forms of travel time (MVA et al, 1987). A second national study was commissioned in 1993, building upon the experiences of several other national value of time studies, to provide updated values (Hague Consulting Group et al., 1999). It covered car travel, in considerable detail, road freight and coach operators, but neither public transport users nor the key variables of walk time, wait time and headway. In September 2000, the Department of Transport commissioned a further study to address outstanding issues arising from the second national study, and its recommendations were set out in Mackie et al. (2003). This paper covers the research that dealt with:
• The valuations of public transport time relative to car travel time; • The valuations of the walk time, wait time and service headway attributes
associated with public transport use. This aspect of the study took the form of a review, absent from the second national study, and the findings are based on new material which adds to that used in a previous meta-analysis of values of time and service quality (Wardman, 2001a). Section 2 considers the insights theory provides into the valuation of public transport time relative to car time and the valuations of walk time, wait time and headway and also reviews the empirical evidence. This review demonstrates the need for further research, which here takes the form of meta-analysis, an increasingly used technique (Baaijens and Nijkamp, 2000; Button et al.,1999; Nijkamp and Pepping, 1998; Van den Bergh, 1999; Wardman, 1998a, 2001a) whose attractions are set out in section 3. A description of the assembled evidence is given in section 4. Section 5 reports the results of the analysis and explains the key variations in the valuations that were uncovered and concluding remarks are provided in section 6. 2. BACKGROUND 2.1 Theoretical Considerations Theoretical considerations provide some insights into the valuations of different forms of travel time and how they might vary. Since the value of travel time is the ratio of the marginal utilities of time and money, and in turn the marginal utility of time is determined by the opportunity cost of time spent travelling and the actual disutility of time spent travelling, variations in any of these marginal utilities will lead to variations in the value of travel time. One of the key variations in the value of time is according to mode, and it is essential that we distinguish at the outset between two separate but often confounded issues. One is that we expect the value of time to vary across users of different modes, not least because of income variations which will impact on the marginal utility of money. We refer to this as User Type variation. The other is that the value of time may vary according to the mode in which the time is spent, due to differences in the comfort and conditions of travel which impact on the marginal utility of time. We refer to this as Mode Valued variation. The user type effect relates to all monetary values whereas the mode valued effect relates solely to the value of

in-vehicle time (IVT). However, there are corresponding marginal utility of time effects on the values of walk, wait and headway.
Public transport use involves walking to and from services or transfer between vehicles or modes1. Walk time can be expected to have a premium value since it incurs greater effort than IVT, there are fewer opportunities for making productive use of time and it may be undertaken in a less pleasant environment. The same goes for access time which, since it includes vehicular access, will also contain aspects of cost, interchange and unreliability. Another undesirable feature of public transport is that the extent to which a journey can be made at the desired time depends on the frequency of service. Public transport users can either plan their activities around scheduled departure times, which involves inconvenience and transaction costs along with some amount of wait time, or else turn up at the departure point at random, which avoids the scheduling costs but incurs additional waiting which on average equals half the headway. Unreliability of arrival times and transfer between vehicles or modes also incur waiting time. Wait time will have a premium valuation because of the stress and frustration involved and also to the extent that less productive use can be made of waiting time and it involves more effort and less comfort than seated on a vehicle. Assuming a regular headway and preferred arrival times to be uniformly distributed with respect to the service schedule, Bates (2003) specifies the average headway disutility (UH) due to schedule inconvenience as:
HU H γββγ+
= 21
(1)
where β and γ are the utility weights for early and late schedule delay respectively and H is the service headway. Table 1 illustrates how the headway valuation in units of IVT varies according to the weights associated with early and late schedule delay relative to the IVT weight (α). The examples cover schedule delay being more and less highly valued than IVT. Table 1: Valuations of Headway Due to Schedule Delay γ=4α γ=2α γ=α γ=½α β=2α 0.67 0.50 0.33 0.20 β=α 0.40 0.33 0.25 0.17 β=½α 0.22 0.20 0.17 0.13 β=¼α 0.12 0.11 0.10 0.08 To these figures would be added effects due to any unreliability and unawareness of the precise departure times associated with a regular interval timetable. However, lower values apply to travellers who can adjust their preferred arrival times to accommodate the timetable. The overall headway valuation depends on the balance between planned and random departures. As service frequencies deteriorate, planned departures become increasingly attractive since expected schedule delay is half expected wait time and thus increases at half the rate. It seems reasonable, however, to conclude that the value of headway in units of IVT will be less than one.
1 This study does not cover time spent walking as a mode in its own right.
2

Theory therefore provides insights into whether walk time, wait time and headway are expected to be valued more or less highly than IVT, and how they might be expected to vary with travel and user characteristics, but empirical research is required to determine the magnitude of the effects. It is to this that we now turn. 2.2 Research Background: National Studies and Reviews What Gunn and Rohr (1996) term national value of time studies have been conducted in Great Britain, the Netherlands, Norway, Sweden, Finland, New Zealand and the United States. Some of these did not consider public transport (Calfee and Winston, 1996; Hague Consulting Group et al., 1999; Hensher, 2001; Small et al, 1999) whilst those that did placed the emphasis firmly on IVT rather than the other aspects of journey time (Dillen and Algers, 1999; Gunn et al., 1999; Hague Consulting Group, 1990; MVA et al., 1987; Pursula and Kurri, 1996; Ramjerdi et al., 1997). Car users’ valuations of IVT have received most attention followed by public transport users’ valuations of IVT and then valuations of walk and wait time. As far as review studies are concerned, the focus has, not surprisingly, been on IVT valuations. Where walk and wait time are covered, they are typically secondary to the value of IVT (Hensher, 1978; Jennings and Sharp, 1978; McKnight, 1982; ITS and ME&P, 1994; Waters, 1992; Steer Davies Gleave, 1997; Booz Allen and Hamilton, 2000). However, some notable reviews of out-of-vehicle time (OVT) do exist (MVA, 1992; Wardman, 2001a; Faber Maunsell 2003). 2.2.1 Evidence on Out-of-Vehicle Time Values The first study in Britain to estimate walk and wait time values was that of Quarmby (1967). He found that, “walking and waiting times are worth between two and three times in-vehicle time”. Subsequent re-analysis of Quarmby’s data by Daly and Zachary (1975) found that walk and wait time were respectively valued 1.6 times and 2.6 times a generic car-bus value of IVT. In Davies and Rogers (1973) the average weight attached to walk time was 2.4 across eight valuations whilst for wait time it was 2.7 across seven valuations. Daly and Zachary (1977) estimated the value of walking and waiting time to be 0.9 and 3.5 times public transport time. McKnight (1982) reviewed evidence from 17 studies covering 4 countries on the relationships between the values of walking, waiting and IVT. The mean walk time value was 1.85 but the wait time values had a larger mean of 2.4. Of the ten disaggregate studies providing walk and wait time values covered in a review of international evidence (TRRL, 1980), walk time was on average valued close to twice IVT and, excepting a study with a very high valuation, wait time was valued around three times IVT. The evidence cited in the review by Waters (1992) also supports wait time values in excess of twice IVT whilst Ortúzar (1994) reviewed 10 mainly revealed preference (RP) Chilean studies conducted between 1983 and 1993 and, on average, walk and wait time were valued at 2.4 and 5.4 times IVT. The early evidence points to walk and wait time being valued two or more times IVT with support for wait time more highly valued than walk time. The emphasis after the first British study (MVA et al., 1987) quite distinctly switched to stated preference (SP) data, and a different pattern of results emerges. Much of the subsequent SP dominated British evidence is covered in the meta-analysis reported in Wardman (2001a). It was found that the values of walk, wait and headway were, on average, valued at 1.66 (±0.12), 1.47 (±0.18) and 0.80 (±0.08) times IVT respectively. In a review of evidence from a number of countries, Steer Davies Gleave (1997, p23) concluded that, “walking time is usually valued at between 1.8 and 2.4 times IVT. An average of 2.0 is recommended for simplicity” and that “waiting time is sometimes valued higher than walking time, up to 4.5 times higher. A ratio of 3 times is recommended”.
3

The more recent national value of time studies conducted in Norway, Sweden and the Netherlands also cast some light on the valuations of walk and wait time. The first Dutch national study estimated public transport users’ values of walk time, interchange time and service headway (Gunn and Rohr, 1996). For the three purposes of commuting, business and other, walk time was valued at 1.0, 1.6 and 1.3 times IVT. The corresponding figures for interchange time were 2.1, 1.6 and 1.6 whilst for headway they were 0.65, 0.70 and 0.85. Algers et al. (1996) found the IVT value of transfer time to vary between 1.4 and 2.5 and the valuation of headway to vary between 0.1 and 0.5. Ramjerdi et al. (1997) estimated the IVT value of headway to be 0.37 for leisure journeys less than 50 km but only 0.21 for journeys longer than this. The corresponding figures for business travel were 0.64 and 0.30. What emerges from the more recent findings, both in Britain and elsewhere, is a challenge to the convention of valuing walk and particularly wait time at twice the rate of IVT. This is at odds with the earlier RP based evidence. As far as headway is concerned, there is considerable variation in the value but it is clearly less than the value of IVT as expected. 2.2.2 Evidence on Public Transport Relative to Car Values Although many studies have estimated values of time, there are two reasons why there is not a great deal of evidence of how these values vary with mode. Firstly, studies which are concerned with valuation per se tend to focus on mode specific rather than mode choice exercises in order to avoid the additional noise associated with choice data in the latter context. Secondly, it is often the case that mode choice models specify a common time parameter across modes and rely on a mode specific constant to discern quality differences. Most of the national value of time studies have estimated public transport and car values. However, what has tended to happen is that car values are estimated for car users and public transport values for public transport users (MVA et al., 1987; Algers et al., 1996; Pursula and Kurri 1996; Gunn et al., 1999). The user type and mode valued effects are therefore confounded. The most comprehensive account of value of time variation due to both user type and mode in a national value of time study is provided in the first Dutch study (Gunn and Rohr, 1996). Table 2 indicates how values of IVT vary by user type and mode relative to the value of car IVT for car users. A car driver’s value of IVT on a commuting train journey is therefore 1.492 (1.327 × 1.124) times higher than the value of IVT for a car trip whilst train users value car IVT as 1.284 (1.142 × 1.124) times higher than car drivers. Train as a mode is here found to have a higher value than car with train users generally having higher values. It is noticeable that user type here has a lesser influence than mode, but inclusion of bus and air users would lead to more influence from user type. Also notable is the higher value attached to train or car time when it is a rejected (alternative) mode. This might be a genuine ‘self selectivity’ effect but the presence of ‘justification bias’ cannot be discounted. Table 2: Dutch Values of Time Relative to Car Driver Values of Car Time Commute Business Other Train Mode +32.7% +20.4% +1.7% Train User +14.2% -2.7% +1.2% Rejected Mode +12.4% +7.7% +1.0%
4

Gunn and Rohr (1996) also report separate SP analysis where, compared to the value of IVT for car drivers in urban traffic, train users had a value of train time which was 6% larger for commuting, 18% lower for business and little different for leisure travel. These figures are not entirely consistent with the findings in Table 2. For bus and tram users, the values were 9% lower for commuting, 22% lower for business and 25% lower for leisure, indicating the dominance of user type over mode. An RP mode choice model specified alternative specific time coefficients for car and train. The train coefficient was 30% lower for commuting trips, 37% lower for business trips and 4% higher for leisure travel. These seem inconsistent with the SP based evidence in Table 2. Although the findings could in part stem from sampling variation, they also could point to differences between RP and SP based valuations. The second Dutch study (Gunn et al., 1999) did not distinguish between user type and mode valued, but the results are consistent with the user type effect dominating the mode valued. The Swedish (Algers et al., 1996) and the Norwegian (Ramjerdi et al., 1997) studies offered car and public transport users SP exercises relating to both their chosen mode and an alternative to examine variations in the value of IVT by mode. However, analysis which distinguishes variations in the value of IVT according to user type and mode valued was not reported but again there is support for a stronger impact from user type than mode valued. In a review of 444 values of IVT, Wardman (1997) compared the values for different modes estimated in the same mode choice model by means of mode specific parameters. This controls for user type effects. In the urban context and for 20 comparisons, car had a mean value of 3.84 pence per minute compared to 4.25 for combinations of bus, rail and the two combined. However, 6 comparisons for urban car and rail found the averages to be 2.86 and 2.85 respectively. In the inter-urban context, 7 comparisons of car and rail had mean values of 8.61 and 8.60 respectively whereas the mean values of coach and rail across 6 comparisons were 7.81 and 6.22. Although the evidence is based on small samples, because the specification of mode specific parameters in mode choice models is not common practice, and none of the differences were statistically significant, a pattern does emerge: the values of car and train time are similar and less than the values of bus time. As expected, the evidence indicates that user type effects exceed mode valued effects and that train and car users have higher values but time on these modes is valued less than bus time. However, most studies fail to disentangle the user type and mode valued effects. 2.3 The Research Need One of the oldest and most widespread conventions of transport planning is the valuation of walk and wait time at twice the value of IVT. Official recommendations and default values for walk and wait time are, in many contexts and countries, based on this conventional wisdom. It seems to have first emerged as an official recommendation in the UK Department of the Environment’s Mathematical Advisory Unit Note 179 (McIntosh and Quarmby, 1970). However, there seems to be a conflict between the older mainly RP based evidence and the more recent largely SP based evidence. In addition, the empirical evidence seems to indicate that wait time should have a higher value than walk time. These issues require further examination. Since headway has received little attention both in review studies and official recommendations, it too justifies further investigation. The emphasis on IVT in general and car travel time in particular is hardly surprising given the dominance of car both in terms of mode share and the subject of cost-benefit analysis. In some countries, there is little direct empirical evidence other than that relating to car whilst there tends to be a failure to clearly distinguish between user type and mode valued effects even in countries where there is a greater amount of value of time evidence. Further insights
5

in this context could provide an important means of generalising available evidence to other modes and clarifying between variations in IVT valuations due to user type and mode. 3. METHOD The method of investigation adopted here is meta-analysis of a large amount of value of time evidence which is pooled and subjected to regression analysis to determine the key causal influences. This approach has its limitations, largely centred around the level of detail with which issues can be addressed. However, it has a number of significant attractions: • Drawing together a wealth of evidence and explaining variations in the values allows
conclusions to be drawn about the preferred values to be used in a range of different circumstances. This is particularly valuable in contexts where the value of time evidence is limited. It is also useful where there is conflicting evidence across studies and in providing a means of interpreting the results of a single study.
• It is generally preferable to base recommended values on or challenge established
conventions with the results of numerous studies rather than a few or a single one.
• Insights can be obtained into methodological issues, such as values of time varying according to the type of data upon which they are estimated.
• It is possible to draw conclusions relating to spatial and particularly temporal variations in
valuations that are beyond the scope of a single study. • Results not otherwise in the public domain for reasons of commercial confidentiality can
be exploited because the means of analysis maintains their anonymity. • Traditional reviews focus on mean values rather than the variation and there is always a
risk that a comparison of means is distorted by confounding effects. 4. DATA ASSEMBLY AND FEATURES The research here builds upon that reported in Wardman (2001a) by collecting additional data in order to obtain more precise estimates and to cover a broader range of issues. Table 3 lists the number of money values of IVT, walk, wait, access and headway contained in the previous and current data sets. The dominance of valuations of IVT is immediately apparent. Table 3: Sample of Money Values Previous Current Increase IVT 539 719 33% Walk 131 174 33% Wait 33 61 85% Access 46 54 17% Headway 140 159 14% The maximum level of segmentation of values in the data set was mode, journey purpose and distance. Values segmented by other factors were not collected. The 1167 values were obtained from 171 British studies covering the years 1963 to 2000 and the studies are listed
6

in Wardman (1998b & 2001b). Information was also collected on a wide range of variables that could possibly explain variations in values of time and key features of the data are given in Table 4. Most values relate to urban trips, are derived from SP data and apply to more recent years, but there is generally an adequate spread across the different categories. Table 4: Key Characteristics of Data Feature IVT Walk/Access Wait Headway Urban InterUrban All
57.9% 36.6% 5.5%
81.6% 18.4% 0.0%
86.9% 13.1% 0.0%
69.2% 30.2% 0.6%
Commuting Leisure Business Combinations
26.2% 24.3% 15.1% 34.4%
37.3% 23.9% 4.8% 34.0%
55.7% 18.0% 0.0% 26.3%
22.6% 25.1% 11.9% 49.6%
Car Bus Rail Underground Car and PT PT All Air
40.7% 9.7% 24.4% 3.2% 8.5% 4.2% 7.2% 2.1%
47.8% 17.1% 6.6% 0.0% 13.6% 6.6% 8.3% 0.0%
6.6% 18.0% 6.6% 18.0% 13.1% 19.7% 18.0% 0.0%
43.4% 20.1% 10.7% 8.8% 6.3% 2.5% 6.9% 1.3%
RP SP
8.9% 91.1%
14.9% 85.1%
36.1% 63.9%
6.9% 93.1%
1960’s 1970’s 1980’s 1990’s
2.5% 1.4% 17.4% 78.7%
2.7% 3.9% 14.9% 78.5%
8.2% 13.1% 16.4% 62.3%
0.0% 0.0% 15.7% 84.3%
Table 5 summarises the IVT values in terms of key dimensions. Inter-urban trips generally have higher values and, as expected, business trips have higher values. For urban trips, commuting journeys have higher values than leisure trips for all modes other than car but there is little difference for inter-urban trips. The values of IVT vary quite appreciably according to the mode used. For urban journeys, underground (UG) users appear to have the highest values whilst, not surprisingly, air travellers have the highest values amongst inter-urban travellers. Bus users have the lowest values as expected. The figures seem to indicate that rail users have higher values than car users, particularly for inter-urban trips.
7

Table 5: Monetary Values of IVT Urban Inter-Urban Purpose Mode Mean SE n Mean SE n
Car 6.0 0.4 64 10.5 1.8 11 Bus 4.2 1.0 17 Rail 7.2 0.9 17 12.6 0.8 21
Commuting
UG 9.2 0.9 5 Car 6.5 0.5 73 9.2 1.1 23 Bus 2.6 0.3 22 Rail 6.5 1.0 14 13.3 1.2 44
Leisure
UG 7.3 0.7 16 Car 13.2 3.6 11 18.3 2.6 16 Bus 3.2 0.3 27 Rail&UG 19.2 9.0 8 32.2 3.5 34 Rail1st 52.3 5.7 17
Business
Air 90.2 19.3 12 Note: Categories involving combinations of purposes or modes are not included. A GDP elasticity of one has been used to account for income variations across years. Table 6 provides summary statistics for the IVT values of walk time, wait time and headway. There are too few observations to sensibly segment by mode and purpose simultaneously. Table 6: Values of Walk, Access, Wait and Headway in Units of IVT Walk Access Wait Headway Context Mean SE n Mean SE n Mean SE n Mean SE n Overall 1.68 0.05 183 1.77 0.10 60 1.76 0.10 62 0.77 0.04 164 Urban 1.69 0.06 170 1.40 0.11 23 1.77 0.11 52 0.82 0.04 114 Urban Comm 1.64 0.07 115 1.30 0.13 16 2.02 0.14 34 0.73 0.05 61 Urban Leis 1.67 0.14 32 1.63 0.21 7 1.43 0.19 9 0.91 0.11 22 Urban EB - - - - - - - - - 1.22 0.25 5 Urban Car 1.55 0.07 88 1.42 0.16 13 1.53 0.18 4 0.83 0.06 62 Urban Bus 1.79 0.12 36 1.78 0.28 4 1.59 0.22 11 0.79 0.09 31 Urban Rail 1.53 0.13 3 - - - 1.17 0.04 11 0.59 0.09 3 Inter 1.51 0.14 13 2.01 0.14 37 1.70 0.28 10 0.67 0.06 50 Inter Comm 1.56 0.18 10 1.74 0.14 11 1.35 0.20 8 0.81 0.14 17 Inter Leis 1.41 0.08 2 2.33 0.27 15 3.13 0.02 2 0.52 0.07 17 Inter EB - - - 1.83 0.22 11 - - - 0.69 0.11 14 Inter Car - - - 1.60 0.23 5 - - - 0.63 0.14 7 Inter Rail 1.66 0.17 9 1.11 0.23 5 1.19 0.22 5 0.49 0.08 16 Note: The sample sizes do not correspond with Tables 3 and 4 since categories, such as combined purposes, are here omitted and these values are in IVT rather than money units. The values of walk and wait both appear to be less than two, although there is no clear relationship between them, and the values are lower for longer distance journeys. The value of walk time varies little by mode whereas the value of wait time amongst rail users is low. The value of access time is somewhat greater for longer distance journeys, presumably because on these journeys access times are greater and the values will thus contain aspects of cost, interchange and unreliability associated with vehicular modes. The headway value
8

9
jk
q
kjk
p
ji
Zn
ii eXV
∑∑−
==∏=
=
1
11
1
βατ
overall is less than one, as expected. It is lower for inter-urban journeys, in part because travellers are more likely to plan their departures. The headway value is a little higher for car users, who are accustomed to convenience and presumably value it highly, and there is some evidence that headway is particularly important for business travellers. These overall figures provide some useful insights into the values of IVT, walk, wait and headway. However, there could be confounding effects which such simple but traditional disaggregations fail to detect. A quantitative model which aims to explain variations in values as a function of relevant socio-economic and trip characteristics would provide a significant advance upon these tabulations. It is to such a model that we now turn. 5. RESULTS 5.1 Valuation Regression Model The variables about which we have collected information are either continuous or categorical. The form of model used to explain variations in the monetary values (V) takes the form:
(2)
where there are n continuous variables (Xi) and p categorical variables having q categories (Zjk). We specify q-1 dummy variables for a categorical variable of q levels and their coefficient estimates are interpreted relative to the arbitrarily omitted level. The αi coefficients are interpreted as elasticities, denoting the proportionate effect on the valuation after a proportionate change in Xi. The exponential of βjk denotes the proportionate effect on the valuation of a level of a categorical variable relative to its omitted level. A logarithmic transformation of equation 2 allows the estimation of the parameters by ordinary least squares. Two types of variable were specified. Main effects relate to the independent effect of a particular variable, such as distance or mode, on a valuation. Interaction effects are essentially the product of two main effects, thereby permitting, say, the effect of distance to depend on mode. Table 7 lists the variables that were examined as main effects and also reports those interaction effects that were retained. The interactions tested were: user type with mode valued, journey purpose, attribute, distance, GDP and location; mode valued with purpose and distance; journey purpose with attribute, distance and GDP; GDP with attribute and distance; and attribute with distance and the number of variables in an SP exercise.

Table 7: Independent Variables – Definitions and Outcomes Variable Categories/Definition Base Category Outcome Terms in Table 8 Definitions of Terms Attribute IVT, Walk, Wait, Access, Headway IVT Only Headway retained Headway Whether value is of headway Attribute Level Mean level of walk, wait, headway
in study Continuous Walk and wait retained WalkTime
Wait Time Level of mean walk time elasticity Level of mean wait time elasticity
Income GDP per capita Continuous Retained but no interaction effects
GDP GDP elasticity applies to all values
Distance Length of overall journey in miles Continuous Miles elasticity and interactions with attribute and mode
Miles Miles-Headway Miles-WalkWait Miles-Car
Distance elasticity for all attributes Incremental effect for Headway Incremental effect for Walk and Wait Incremental effect for Car Time
Distance Band Urban (≤30 miles), Inter-Urban (>30 miles), No distinction
Urban Retained Inter-Urban Inter Applies to all values for inter-urban travel
Journey Purpose Business, Business 1st Class, Commuting, Peak, Leisure, Off Peak, Various Combinations
Leisure Merged Commuting and Peak, Leisure and Off-Peak
EB EB1st Comm
Employer’s Business Incremental effect for 1st Class Employer’s Business Commuting/Peak
User Type and Mode Valued (IVT)
Car, Bus, Train, Underground, Air and various combinations for both user type and mode valued.
Bus Users’ values of Bus Time
Retained effects are car users valuing car and rail time, bus time, and combined car and PT time, rail users valuing rail time, UG users valuing UG time, all users valuing combined car and PT time, air users valuing combined rail and air time and rail and air users valuing combined rail and air time
Car-CarRail Car-Bus Car-CarPT Rail-Rail UG-UG All-CarPT Air-RailAir RailAir-RailAir
Car users’ value of car or rail time Car users’ value of bus time Car users’ value of combined car and a PT time Rail users’ value of rail time Underground users’ value of underground time Car, bus and rail users’ value of car and a PT time Air users’ value of combined rail and air time Rail and air users’ value of combined rail and air time
User Type (Non IVT)
Car, Bus, Train, Underground, Air and various combinations
Bus Users Retained effects are car users valuing walk, wait and headway, rail users valuing walk, wait and headway, PT users valuing both walk and wait time, combined car and a PT user valuing walk and headway and all users valuing walk and headway
Car-Walk Car-Wait Car-Headway Rail-Walk RailUG-Wait RailUG-Headway PT-WalkWait CarPT-Walk CarPT-Headway All-Walk All-Headway
Car users’ value of walk time Car users’ value of wait time Car users’ value of headway Rail users‘ value of walk time Rail users’ value of wait time Rail users’ value of headway Public transport users’ value of walk/wait time Car and a PT users’ value of walk time Car and a PT users’ value of headway Car, bus and rail users’ value of walk time Car, bus and rail users’ value of headway

Cost Numeraire Parking, Toll, Petrol, Fare, Various Combinations
Petrol Only Toll retained Toll Incremental effect if value estimated to toll numeraire
Data Source RP, SP Choice, SP Ranking SP Choice Interacts with Attribute. Only RP retained
RP-Walk RP-Wait
Incremental effect for RP based value of walk time Incremental effect for RP based value of wait time
SP Presentation Computer, Cards, Pen and Paper Computer Interacts with attribute. Only Pen & paper retained
PaperIVT Incremental effect of pen and paper method for IVT valuation
Variables in SP 2 or 3, 4, 5 or more 2 or 3 None retained Location London & South East, Metropolitan
Areas, Other Urban, Rural Metropolitan Only London & South East
retained LSE Incremental effect if value relates to London and
South East Study Purpose Valuation, Forecasting Valuation Retained for interaction
with business EBFore Incremental effect on an employer’s business value
if purpose of study was forecasting PT Cost One way or round trip presentation
of public transport fare One-way Retained round trip Round Incremental effect of public transport fares
presented as round trip Choice Context Mode Choice, Route Choice,
Abstract Choice Mode Choice None retained
Logic Tests Irrational SP responses removed, non traders removed, no removals
No removals None retained
11

Table 8 presents the model estimated to the 1167 IVT, walk, access, wait and headway valuations expressed in pence per minute in quarter 3 2000 prices. The adjusted R2 goodness of fit measure of 0.62 is quite respectable given the disparate nature of the studies, the inherent inability of this type of approach to examine detailed variations in elasticities, and the sampling distribution surrounding any individual value of time estimate. It is assumed that the variation in the values which cannot be explained by the key variables examined is randomly distributed across the sample. A large number of statistically significant, correct sign and plausible variations in the values of time have been estimated. Some variables whose coefficients were not significant at the usual 5% level were considered to merit retention on the grounds that the results seem sensible and the t ratios were not unreasonably small. Variables removed as not having a significant effect included all the interactions listed above except those between user type and mode valued, distance and attribute, user type and attribute, type of data and attribute and limited interactions between purpose and attribute and purpose and mode. Table 8: Valuation Regression Model
Variable Coeff (t) Elasticity or Effect
Coeff (t) Elasticity or Effect
Intercept Inter Urban Inter Distance Miles +Miles-Headway +Miles-WalkWait +Miles-Car User Type-Mode Valued (IVT) Car-CarRail Car-Bus Car-CarPT Rail-Rail UG-UG All-CarPT Air-RailAir RailAir-RailAir User Type (NON IVT) Car-Walk Car-Wait Car-Headway Rail-Walk RailUG-Wait RailUG-Headway PT-WalkWait CarPT-Walk CarPT-Headway All-Walk All-Headway
-5.019 (4.2) 0.258 (3.5)
0.184 (6.3) -0.197 (4.1) -0.073 (3.1) 0.075 (3.6)
0.379 (4.8) 0.714 (4.0) 0.447 (5.7) 0.634 (7.8) 0.482 (3.5) 0.517 (6.9) 1.680 (8.0) 1.403 (5.6)
0.694 (3.9) 0.789 (2.5) 0.464 (4.1) 0.368 (1.5) 0.612 (3.0) 0.755 (5.2) 0.199 (1.5) 0.232 (2.4) 1.378 (6.6) 0.317 (1.8) 0.879 (4.4)
+29%
0.184 -0.197 -0.073 0.075
+46% +104% +56% +89% +62% +68% +437% +307%
+100% +120% +59% +44% +84% +113% +22% +26% +297% +37% +141%
Attribute Specific Headway Purpose EB +EB1st +EBFore Comm Purpose Specific EB-Headway Mode and Purpose Comm-UG Income GDP Data RP-Walk RP-Wait Level WalkTime Wait Time Numeraire Toll Units Round Region LSE Presentation PaperIVT Adj R2
Obs
-0.237 (1.7)
0.498 (5.6) 0.754 (5.2) 0.470 (4.3) 0.100 (2.7)
0.211 (1.5)
0.520 (2.8)
0.723 (4.6)
0.379 (2.4) 0.886 (5.2)
0.271 (8.2) 0.157 (2.4)
-0.212 (2.2)
-0.076 (1.8)
0.147 (3.6)
-0.141 (3.1)
0.620 1167
-21%
+65%
+113% +60% +11%
+23%
+68%
0.723
+46%
+143%
0.271 0.157
-19%
-7%
+16%
-13%
In order to be able to use the model to calculate values, the GDP per capita index has to be known. This is 3451 in 2000 quarter 3 prices. The money value of IVT (VoIVT) for a commuting journey of 25 miles by train in the South East is calculated as:
min/43.10253451 184.0723.0147.0100.0634.0019.5 peVoIVT == +++− (3)

The scale factor (τ) is the exponential of the estimated intercept of -5.019. 0.634 denotes the rail effect and 0.100 relates to commuting trips. The South East effect is represented by 0.147 whilst 0.723 is the GDP elasticity and 0.184 is the distance elasticity for rail applied here to a 25 mile journey. Attribute Specific Variables Dummy variables were specified for walk time, wait time, access time and headway to determine whether, after accounting for the influences of the other variables in the model, there was any remaining difference in the values of these attributes in relation to each other and to IVT. The coefficients relating to walk time, wait time and access time were far from statistically significant. We have retained a term for headway whose effect is not far from significant at the usual 5% level. In general, we had little success when distinguishing between walk and access time and hence the two are combined. It is not surprising that the values are found to be similar, although the small number of access observations makes it more difficult to discern a statistically significant difference. Journey Distance Effects Variations in the value of time are due to variations in the marginal utilities of time and money. Ideally, we would model these explicitly, but this is not practical in a study of this type. We therefore use distance as a proxy for the combined effects of the levels of time and cost on their respective marginal utilities. The disutility of a unit of IVT may increase with journey duration, as fatigue, boredom and discomfort set in. Time savings on longer distance journeys will therefore be more highly valued. The distance effect would also impact on the OVT values insofar as the marginal utilities depend on door-to-door travel time. Whilst there may also be a relationship between the values and levels of walk time, wait time and headway, this is not specific to the distance of the overall journey and we return to this issue below. The opportunity cost of travel time is presumably greater for longer distance journeys. The activities being pursued must be relatively important otherwise the time and expense involved would not be warranted. In addition, there are more pressures on the total time budget where longer amounts of time are spent travelling. Shorter distance trips tend to be made more frequently. To the extent to which an SP exercise is taken to apply to all trips of the type in question, then a given payment for a time saving implies a larger income effect for more frequent trips which would translate into greater cost sensitivity and lower values for shorter distance journeys. In contrast, congested travel conditions form a greater proportion of urban travel time, leading to higher values for shorter distance trips given that congested time is relatively highly valued. Travellers may value variations in cost or time, including the OVT components, in line with the proportion that they form of total cost or time or indeed of generalised cost. If the proportionality effect is stronger upon cost (time) then the value of time will increase (fall) with distance. However, theory provides no clear indication. We might expect headway to be less highly valued for longer distance journeys. In part this might be an issue of expectations, since travellers would not regard low frequencies to be unreasonable on longer distance journeys but may well do so on shorter distance journeys. It may also be because longer distance journeys tend to be more planned and hence the convenience of high frequencies is less important.
13

There might be factors which are correlated with distance which are not otherwise explicitly accounted for. A potentially important confounding effect is that those with higher incomes travel longer distances and a positive distance effect is implied where, as in this study, there is no segmentation of the values of time by income. However, we note that the cross-sectional income elasticity tends to be somewhat below unity (Gunn, 2001; Wardman, 2001c) and that the impact of income on the distance travelled is not strong (Mackie et al., 2003; TRL et al., 2004). The distance elasticity relating to all valuations (Miles) is 0.184 and is precisely estimated. Three other significant effects of an incremental form were also detected. Walk and wait time values do not vary as strongly as IVT, and the above discussion indicates that this is reasonable. The incremental effect for walk and wait time (Miles-WalkWait) implies a distance elasticity of 0.111 for these values. The incremental effect for headway (Miles-Headway) implies a small negative distance elasticity of –0.013. As seems reasonable, headway becomes less important as journey distance increases. An incremental effect was specified for car as a mode (Miles-Car) which shows that its distance elasticity (0.259) is greater than for other modes. Presumably this reflects a fatigue effect and perhaps additional distance related discomfort which is not apparent for rail. In addition to the distance elasticity, an improvement in fit was obtained by the specification of a term denoting inter-urban trips (Inter) of over 30 miles. All values are 29% higher when inter-urban travel is concerned. User Type and Mode Valued In-Vehicle Time Values Given the correlation between mode valued and user type, the two effects could well be confounded if we simply specified a series of dummy variables relating to user type and a series of variables relating to mode valued. We therefore specify variables based on combinations of user type and mode valued. Wardman (2001b) provides more detail of the numbers in various categories. The base category was taken to be bus users valuing bus IVT (Bus-Bus), although it subsequently contained some other minor categories whose coefficients were not significant. The largest values, as expected, relate to air travellers and combined rail and air travellers. This applies even after allowing for journey purpose and distance effects and is presumably because business travellers in these categories are more senior and the leisure travellers have relatively high incomes. Not surprisingly, air users have higher values of combined rail and air time (Air-RailAir) than do combined rail and air users (RailAir-RailAir). Of the more common modes of travel, rail users have the highest values, presumably due to higher incomes. Underground users also value IVT on the underground relatively highly. Insofar as the latter have similarly higher incomes as other London and South East travellers, the income effect would have been detected by the variable (LSE) specified to represent this effect. However, travel on the underground can involve relatively high discomfort, unpleasantness and effort. The Car-Bus coefficient indicates that car users have, as expected, much higher values than bus users. It is the car user sample that provides the information on the relative disutilities of the different modes since there were insufficient observations of bus and rail users valuing other modes. This is not surprising since in Britain considerable attention has been paid to the possibilities for attracting motorists to other modes. For car users, the coefficients for rail and car were very similar and hence combined (Car-CarRail). However, this does not mean that these two modes are valued the same, since the
14

Miles-Car coefficient provides an additional effect. The Car-Bus coefficient indicates that bus is regarded as being somewhat inferior to train and to car travel. The All-CarPT coefficient relates to all user types valuing combined car and bus or car and train time. It seems plausible given the previous results and that car users will be well represented in this category. It might be argued that RP data provides more evidence on variation by mode valued, since RP mode choice models cannot split by user type, yet SP data provides much evidence on variations in IVT by user type since SP models are often calibrated to particular types of users. It could then be concluded that there are confounding effects at work, with possible differences between RP and SP values influencing the findings for the user type and mode valued effects. However, we do not find this entirely likely, since the RP data contains variation by user type from route choice and within rail choice contexts whilst SP based values demonstrate differences due solely to user type, solely to mode valued and to both. User Type and Out-of-Vehicle Time Values We would expect the income differences across users types to influence the monetary valuations of the OVT attributes. However, there might be other factors that are correlated with user type which have an additional bearing on how the values of walk, wait and headway vary. The base category is bus users and the Air and Rail-Air users for whom there were insufficient values. Car users have high values of walk time (Car-Walk) and wait time (Car-Wait). They are much less used to either than users of public transport modes, they have relatively high incomes and their aversion to walk and wait time may have contributed to them being a car user. Surprisingly, car users have a low value of headway (Car-Headway) compared to most other categories of user. We have a concern that some car users fail to fully appreciate the concept of service headway. Indeed, in our experience it is often the public transport variable about which car users have the poorest information and the one for which the results in choice models tend to be least satisfactory. We have no walk time values for underground users, but their values of wait and headway were very similar to rail users and hence combined terms have been specified (RailUG-Wait and RailUG-Headway). These show that rail and underground users value wait time relatively highly, in line with the findings for IVT, but lower than for car users given the particular aversion of the latter to wait time. The same pattern is apparent for rail users’ values of walk time (Rail-Walk). Rail and underground users also have relatively high values of headway. The findings seems to be consistent with those for IVT in terms of the effects that income might be expected to have but with a moderating influence as a result of car users’ particular dislike of OVT. Of the remaining effects, the relatively low incremental effects for PT-WalkWait, CarPT-Walk and All-Walk all seem plausible given the findings for the user types separately. However, it is not clear why CarPT-Headway and All-Headway are so high. Influence of Data Type We have discerned significant effects from RP data on the values of walk and wait time but not on the value of headway. The relatively small amount of data may have been a contributory factor in the case of headway. However, in anticipation of the reasons advanced to explain the walk and wait findings, headway valuations can be more readily tailored to the circumstances faced by individuals and, like cost which is also under the control of the operator, variations will not be deemed to be unrealistic.
15

The value of walk time is 46% larger when obtained from RP data whilst the value of wait time is 143% larger. This is consistent with our discussions in section 2.2 that the early work based largely on RP data tended to obtain larger values of walk and wait time than the more recent largely SP based research and also that the divergence was greater for wait time. Although it could be claimed that the RP values are too low because a substantial proportion of the evidence relates to early studies where the choice contexts, amount of data and modelling techniques would not generally be regarded to be as satisfactory as in recent studies, there is no real reason to suspect that these will have had a systematic influence on the values of walk and wait time obtained. Indeed, to the extent that early RP studies calculated wait time as half service headway, this would have operated to reduce the value of wait time since actual wait times are less than half the service headway. There are, however, a number of factors which could cause SP values of walk and wait time to be too low. Firstly, more attention in SP exercises is paid to the realism of cost and IVT. Unrealistic walk and wait times may be ignored, which will lead to their coefficients being lower than they would otherwise be. Secondly, variations in walk and wait time may be introduced which are unrealistic and which are therefore discounted, yet this is less likely with IVT and cost. A good example is the walking time to train stations and bus stops, which it is unrealistic to vary or which is varied without any proper explanation of why this could possibly occur. SP studies that have obtained values of walk time less than the value of IVT are not uncommon. Similarly, some travellers might plan to arrive at the station or bus stop a short while before the service’s scheduled departure and thus specifying other amounts of wait time would be unrealistic and may well be ignored. Thirdly, SP exercises are artificial and some attributes might receive less attention than they should in order to simplify the choice task. If cost and IVT are more significant to choice, then the importance of other attributes might be understated in relation to them. Finally, there may be a greater element of uncertainty about walk and wait time than IVT and cost. Undervaluation could result from a failure to fully appreciate the unattractiveness of the walk and wait time involved in public transport use. It could, however, be argued that the RP wait time values are too high insofar as the reported wait times contain an element of relatively highly valued unreliability whereas the wait times of SP exercises are interpreted as certain outcomes. We are more inclined to a view that this might contribute to the larger effect estimated for wait time than walk time rather than accounting for the divergence between RP and SP values of wait time. Levels of Walk Time, Wait Time and Headway Data was collected on the mean level of walk time, wait time and headway in an SP experiment or covered in an RP study. Although this is a highly aggregate means of exploring this issue, there is little analysis within disaggregate choice modelling of how the values of walk time, wait time and headway vary with their levels. Significant and plausible elasticities to the levels of walk and wait time were estimated. A 10% increase in walk time would increase the value of walk time by 2.7% whilst a 10% increase in wait time would lead to a 1.6% increase in the value of wait time. It could be that such non-linearities to some extent explain the variation in walk and wait time values apparent in the findings reviewed in section 2.2. It is not surprising that the non-linearity is stronger for walk than wait time. It is consistent with the large reduction in walking trips as walking time increases and is presumably because the effort and fatigue involved have a sharply increasing effect on the marginal utility as walk time increases. In contrast, the corresponding effect attributable to effort,
16

stress and frustration as wait time increases will be moderated to the extent that larger amounts of wait time can be put to more productive use. Higher wait time values can stem from relatively highly valued unreliability effects and thus could produce the result apparent in Table 8. However, this relates to RP models, which provide a minority of the wait time values, whilst some of the larger wait times are associated with interchange where lower values can sometimes be expected given the productive use that can be made of the wait time. Other ‘Common’ Issues Although some further interesting results were obtained, they do not impact on the relativities of concern here. A plausible GDP elasticity of 0.723 was estimated with a 95% confidence interval of ±43%. A more detailed examination of inter-temporal variations in the value of time is contained in Wardman (2001c). With the exception of the somewhat larger impact of business travel on the value of headway (EB-Headway), the journey purpose effects will not impact upon the relativities of interest here. The estimated journey purpose effects are much as we would anticipate. The values for business trips (EB) are by far the highest followed by commuters. Additional effects are due to first class business travellers (EB1st) and where the purpose of the study was forecasting (EBFore). Our feeling is that studies whose purpose was forecasting were more likely to require the respondent to consider what their company would permit and hence the valuations will be closer to the employer’s valuations. London and South East (LSE) travellers have values which are 16% higher than elsewhere, reflecting their higher average incomes and the generally more unpleasant, crowded and congested travelling conditions. The only significant effect attributable to the numeraire was for toll charge (Toll) where values of time are 19% lower, presumably reflecting protest responses towards such charges. It was found that IVT values obtained using the pen and paper method of SP presentation (PaperIVT) were 13% lower. We regard this method to be the least satisfactory means of presentation. Finally, offering public transport fares in round trip units (Round) leads to 7% lower values. Whilst the return fare is the natural unit of cost for some public transport journeys, particularly inter-urban, presenting these alongside one-way journey times, which is the natural unit for this attribute, may lead to respondents trading-off the two amounts as if they were in the same one-way units. 1.0 Relative Values of Time The estimated valuation model can be used to derive expressions for the values of IVT for different user types relative to car users’ values, for which evidence is most commonly available, and to derive values for different modes in relation to each other. The latter is dependent on the evidence obtained for car users. The expressions are set out in Table 9. Given that hardly any of the extensive interaction effects that were examined were statistically significant, the relative values vary only according to distance.
17
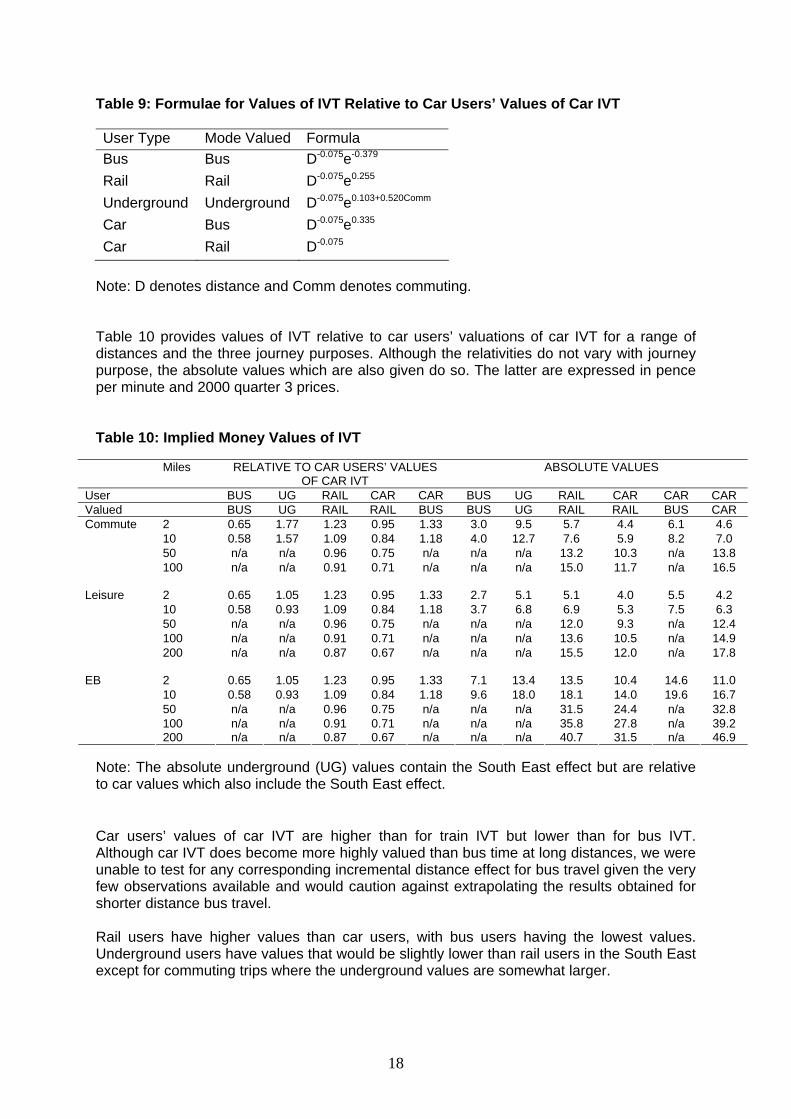
Table 9: Formulae for Values of IVT Relative to Car Users’ Values of Car IVT User Type Mode Valued Formula Bus Bus D-0.075e-0.379
Rail Rail D-0.075e0.255
Underground Underground D-0.075e0.103+0.520Comm
Car Bus D-0.075e0.335
Car Rail D-0.075
Note: D denotes distance and Comm denotes commuting. Table 10 provides values of IVT relative to car users’ valuations of car IVT for a range of distances and the three journey purposes. Although the relativities do not vary with journey purpose, the absolute values which are also given do so. The latter are expressed in pence per minute and 2000 quarter 3 prices. Table 10: Implied Money Values of IVT
Miles RELATIVE TO CAR USERS’ VALUES OF CAR IVT
ABSOLUTE VALUES
User BUS UG RAIL CAR CAR BUS UG RAIL CAR CAR CAR Valued BUS UG RAIL RAIL BUS BUS UG RAIL RAIL BUS CAR
2 0.65 1.77 1.23 0.95 1.33 3.0 9.5 5.7 4.4 6.1 4.6 10 0.58 1.57 1.09 0.84 1.18 4.0 12.7 7.6 5.9 8.2 7.0 50 n/a n/a 0.96 0.75 n/a n/a n/a 13.2 10.3 n/a 13.8
Commute
100 n/a n/a 0.91 0.71 n/a n/a n/a 15.0 11.7 n/a 16.5
2 0.65 1.05 1.23 0.95 1.33 2.7 5.1 5.1 4.0 5.5 4.2 10 0.58 0.93 1.09 0.84 1.18 3.7 6.8 6.9 5.3 7.5 6.3 50 n/a n/a 0.96 0.75 n/a n/a n/a 12.0 9.3 n/a 12.4 100 n/a n/a 0.91 0.71 n/a n/a n/a 13.6 10.5 n/a 14.9
Leisure
200 n/a n/a 0.87 0.67 n/a n/a n/a 15.5 12.0 n/a 17.8
2 0.65 1.05 1.23 0.95 1.33 7.1 13.4 13.5 10.4 14.6 11.0 10 0.58 0.93 1.09 0.84 1.18 9.6 18.0 18.1 14.0 19.6 16.7 50 n/a n/a 0.96 0.75 n/a n/a n/a 31.5 24.4 n/a 32.8 100 n/a n/a 0.91 0.71 n/a n/a n/a 35.8 27.8 n/a 39.2
EB
200 n/a n/a 0.87 0.67 n/a n/a n/a 40.7 31.5 n/a 46.9 Note: The absolute underground (UG) values contain the South East effect but are relative to car values which also include the South East effect. Car users’ values of car IVT are higher than for train IVT but lower than for bus IVT. Although car IVT does become more highly valued than bus time at long distances, we were unable to test for any corresponding incremental distance effect for bus travel given the very few observations available and would caution against extrapolating the results obtained for shorter distance bus travel. Rail users have higher values than car users, with bus users having the lowest values. Underground users have values that would be slightly lower than rail users in the South East except for commuting trips where the underground values are somewhat larger.
18

The distance and journey purpose effects are readily apparent in the values presented in Table 10. The variations by user type and mode valued are not trivial, with the user type effect being the stronger of the two. The figures are in stark contrast to current official recommendations (DETR, 2001) in that they exhibit a considerable amount of variation. Clearly, the relative disutilities of different modes will vary according to the type of car, bus and train in question and the facilities it provides. Allowing for this in practical evaluation would, however, be a major task. In any event, evidence on this issue is scarce. For example, the ‘covariate analysis’ reported in Hague Consulting Group et al. (1999) unearthed a large number of effects on the value of IVT from socio-economic and trip characteristics but the particular features of the car was not one of them. 5.3 Values of Walk, Wait and Headway The formulae for the values of walk time, wait time and headway in units of IVT are: VoWK = D-0.073-0.075CarTimeWK0.271 e0.379-0.020UseCar-0.601UseRail-0.449UseUG+0.335CarTime+0.335RailUGTime (4) VoWT = D-0.073-0.075CarTimeWT0.157 e0.886+0.075UseCar-0.357UseRail-0.205UseUG+0.335CarTime+0.335RailUGTime (5) VoH = D-0.197-0.075CarTime e-0.237+0.211EB-0.250UseCar-0.214UseRail-0.062UseUG+0.335CarTime+0.335RailUGTime (6) where D denotes the overall journey distance and WK and WT are the amounts of walk and wait time respectively. Additional modifiers are for car users, rail users and underground users, and according to whether the numeraire is car time or rail/underground time. The base numeraire and user type is bus. It is assumed that underground time is valued the same as train time, and that the underground term in Table 8 (UG-UG) is effectively reflecting user type effects, and that underground users value walk time the same as rail users.
19

Table 11 presents the IVT values of walk and wait time implied by the model. The values do not differ by journey purpose, but they do differ by distance, since the distance elasticity is lower for walk and wait than for IVT, and also by user type and mode valued. The numeraire is the value of IVT for the same mode as user type. Hence the rail values reported are the money values of walk and wait time for rail users divided by rail users’ values of rail IVT. Table 11: Implied IVT Values of Walk and Wait Time WALK WAIT
MILES CAR
BUS
RAIL
UG
Walk Wait Walk Wait Walk Wait Walk Wait 2 2.18 3.68 1.68 2.57 1.28 2.51 1.50 2.93 5 2.79 4.25 2.15 2.97 1.65 2.90 1.93 3.38 10 3.37 4.73 2.59 3.31 1.99 3.24 2.31 3.77 20
2
4.07 5.28 3.13 3.69 2.40 3.61 2.79 4.20 2 1.72 2.90 1.49 2.29 1.14 2.24 1.33 2.60 5 2.20 3.35 1.91 2.64 1.46 2.58 1.70 3.01 10 2.66 3.73 2.30 2.94 1.77 2.88 2.06 3.35 20
10
3.21 4.16 2.78 3.28 2.13 3.21 2.48 3.74 2 1.35 2.28 1.32 2.03 1.02 1.99 1.18 2.31 5 1.74 2.64 1.70 2.35 1.30 2.30 1.52 2.67 10 2.09 2.94 2.05 2.62 1.57 2.56 1.83 2.98 20
50
2.53 3.28 2.47 2.92 1.90 2.85 2.21 3.32 2 1.22 2.06 1.26 1.93 0.97 1.89 1.12 2.20 5 1.57 2.38 1.61 2.23 1.24 2.18 1.44 2.54 10 1.89 2.65 1.95 2.49 1.49 2.43 1.74 2.83 20
100
2.28 2.96 2.35 2.77 1.80 2.71 2.10 3.16 2 1.10 1.86 1.20 1.84 0.92 1.80 1.07 2.09 5 1.41 2.15 1.53 2.12 1.18 2.07 1.37 2.42 10 1.71 2.39 1.85 2.36 1.42 2.31 1.65 2.69 20
200
2.06 2.67 2.23 2.64 1.71 2.58 1.99 3.00 The most noticeable feature of the IVT values of walk and wait is that they vary considerably. In part this is because of differences in the money value of IVT by user type and mode, but there are other strong influences at work. The increase in the IVT values of walk and wait time as the levels of walk and wait time (denoted in the first column) increase is quite clear, as is the fall in the values as distance increases. For corresponding levels of walk and wait time and the same journey distance, the values of wait time tend to be greater than the value of walk time. This is consistent with the review of past evidence considered in section 2.2. The figures do, however, suggest that the value of walk time is more centred around the convention of twice the value of IVT than is the value of wait time. Table 12 provides the implied IVT values of headway across distance and purpose which are the factors along with user type and mode valued which influence it. There is not a great deal of variation according to the combination of user type and mode valued. However, the strong distance effect is very much apparent. Despite the considerable variation in values in Table 12, the results are in line with our expectations that the value of headway is less than the value of IVT and that the difference can be substantial.
20

Table 12: Implied IVT Values of Headway MILES PURPOSE CAR BUS RAIL UG 2 Business 0.88 0.85 0.96 1.12 2 Non Business 0.71 0.69 0.78 0.91 10 Business 0.57 0.62 0.70 0.81 10 Non Business 0.46 0.50 0.57 0.66 50 Business 0.37 0.45 0.51 0.59 50 Non Business 0.30 0.37 0.41 0.48 100 Business 0.30 0.39 0.44 0.52 100 Non Business 0.25 0.32 0.36 0.42 200 Business 0.25 0.34 0.39 0.45 200 Non Business 0.20 0.28 0.31 0.37
6. CONCLUSIONS This paper reports on analysis of a large data set of British evidence relating to the value of time. Its aim was to explain the values as a function of key variables and the model developed has been used to explore the relationships between public transport and car values of IVT and between the values of walk time, wait time, headway and IVT. The results have contributed to the recommendations made concerning the values of time to use in project appraisal in a recently completed study for the UK Department for Transport (Mackie et al., 2003). Formulae have been reported which express public transport users’ values relative to car users’ values, public transport IVT values relative to car IVT values and walk, wait and headway values relative to IVT values. These relationships allow the generalisation of results for car users, which tend to be the most widely available and reliable evidence, to a broader range of contexts, and provide insights into a number of important issues. Of particular significance here has been the testing of the long established convention in transport planning of valuing walk and wait time at twice the rate of IVT. McKnight (1982) stated that, “Early work (see Hogg, 1970) indicated that waiting and walking times were valued around twice in-vehicle times as they were the more ‘distressing’ activities for an individual. This notion has prevailed through later work and generally only slight variations to these factors occur, although their adoption is only rarely confirmed by empirical analysis before use”. In recent years, empirical research has challenged the convention. For example, Wardman (2001a) concluded that, “….. the large body of empirical evidence that we have reviewed leads us to recommend that appraisal procedures should value walking and waiting time only 60% higher than in-vehicle time” whilst Gunn and Rohr (1996) also claimed that the traditional weights seemed too large. Our conclusion is that recent results have been strongly and erroneously influenced by SP evidence and that this produces values of walk and wait time which are too low. The recommendation here is that, as far as average values are concerned, it is reasonable to value walk time at twice IVT but that a weight of 2½ is more appropriate in the case of wait time. As far as SP practice is concerned, particular attention should be paid to the realism of the absolute values of walk and wait time and the variations in them that are presented to respondents. These conclusions would not be drawn on the basis of a traditional review which examined mean valuations and neglected to explain variations across studies, whilst they carry greater weight than if based on the results of only a few or a single study.
21

In addition, walk and wait time values can be expected to vary according to a wide range of socio-economic and situational factors. There is little evidence on how the values vary with factors other than journey purposes. The findings presented here offer an enhanced approach where the values of walk and wait time depend upon the levels of walk and wait time whilst there is also a strong effect from the overall journey distance. As far as headway is concerned, the formula provided offers a more straightforward treatment of service frequency than does the evaluation of the implied levels of schedule delay for planned departures and of wait time for random departures. There is relatively little by way of official recommendations for headway values: the formula advanced here allows the value of headway in IVT units to depend upon journey purpose and distance. In addition to the issues relating directly to the subject of this paper, the estimated value of time model provides a number of other important insights into, for example, how values vary over time or according to journey purpose, the impact of the numeraire and various methodological issues surrounding SP. As far as policy implications are concerned, the results for walk and wait time provide support for the recent phenomenon in the British bus market of providing high service frequencies but concentrated on core routes rather than the post deregulation experimentation with minibuses providing greater accessibility but at the expense of frequency. However, the results also point to the need for service differentiation. A low cost product can cater for what might be termed the traditional bus market, but in order to tempt car users it is essential to provide faster, more frequent and accessible services with measures taken to reduce or compensate the high value attached to bus time. The research reported here has provided an improved understanding of variations in the values of walk time, wait time and headway and of how the value of IVT varies by mode. However, much further work remains to be conducted into non-linear effects and how the conditions of travel, as opposed to the characteristics of the individual, influence the valuations. Such issues are relevant not only to transport appraisals in different contexts but could have an important bearing on how values vary over time. References Algers, S., Dillen, J.L. and Widlert, S. (1996) The National Swedish Value of Time Study. Paper presented at PTRC International Conference on the Value of Time. Baaijens, S. and Nijkamp, P. (2000) Meta-Analytic methods for comparative and exploratory policy research. Journal of Policy Modelling, 22(7), pp. 821-858. Bates, J. (2003) Departure Time Shifts, Waiting and Headway. Appendix B in Faber Maunsell (2003) Public Transport Quality Literature Review. Prepared for the Department for Transport. Booz Allen and Hamilton (2000) PEM Benefit Parameter Project: Development of Research Approaches. Prepared for Transfund New Zealand. Button, K.J., Jongma, S.M. and Kerr, J. (1999) Meta-analysis approaches and applied micro economics. International Journal of Development Planning Literature, 14, pp. 75-101. Daly, A.J. and Zachary, S. (1975) Commuters’ Values of Time. Report T55, Local Government Operational Research Unit, Reading
22

Daly, A.J. and Zachary, S. (1977) The Effect of Free Public Transport on the Journey to Work. Transport and Road Research Laboratory Supplementary Report SR 338, Crowthorne, Berkshire. Davies, A.L. and Rogers, K.G. (1973) Modal Choice and the Value of Time. Report C143, Local Government Operational Research Unit, Reading. Department of the Environment, Transport and the Regions (2001) Transport Economics Note. DETR, London. Dillen, J.L and Algers, S. (1999) Further Research on the National Swedish Value of Time Study. Proceedings of the 8th World Conference on Transport Research, pp.135-148 Volume 3 Transport Modelling/Assessment. Edited by Meersman, H., Van de Voorde, E. and Winkelmans, W., Pergamon, Amsterdam. Faber Maunsell (2003) Public Transport Quality Literature Review. Prepared for the Department for Transport. Gunn, H.F. (2001) Spatial and Temporal Transferability of Relationships between Travel Demand, Trip Cost and Travel Time. Transportation Research E, 37, 2-3, pp.163-189. Gunn, H.F., Bradley, M. and Rohr, C.(1996) The 1994 National Value of Time Study of Road Traffic in England. Paper presented at PTRC International Conference on the Value of Time. Gunn, H.F. and Rohr, C. (1996) The 1985-1996 Dutch Value of Time Studies. Paper presented at PTRC International Conference on the Value of Time. Gunn, H.F., Tuinenga, J.G., Cheung, Y.H.F. and Kleijn, H.J. (1999) Value of Dutch Travel Time Savings in 1997. Proceedings of the 8th World Conference on Transport Research, pp.513-526. Volume 3 Transport Modelling/Assessment. Edited by Meersman, H., Van de Voorde, E. and Winkelmans, W., Pergamon, Amsterdam.` Hague Consulting Group (1990) The Netherlands' Value of Time Study: Final Report. Report to Dienst Verkeerskunde, Rijkswaterstaat, The Hague. Hague Consulting Group, Accent Marketing and Research and Department of the Environment, Transport and Regions (1999) The Value of Travel Time on UK Roads. The Hague, Netherlands. Hensher, D.A. (1978) Valuation of Journey Attributes: Some Existing Empirical Evidence. In Hensher, D.A. and Dalvi, Q. (eds), Determinants of Travel Choice, Saxon House, Farnborough, Hampshire, England. Hensher, D.A. (2001) Measurement of the Valuation of Travel Time Savings. Journal of Transport Economics and Policy, 35 (1), pp.71-98. ITS and ME&P (1994) Cost-Benefit and Multi-Criteria Analysis for New Road Construction. Doc EURET/385/94, Prepared by Institute for Transport Studies University of Leeds and Marcial Echenique and Partners for Directorate General for Transport, Commission of the European Communities. Jennings, A. and Sharp, C. (1978) The Value of Travel Time Savings and Transport Investment Appraisal. In Heggie, I.G. (Editor) Modal Choice and the Value of Travel Time. Clarendon Press, Oxford
23

Mackie, P.J., Wardman, M., Fowkes, A.S., Whelan, G., Nellthorp, J. and Bates, J. (2003) Values of Travel Time Savings in the UK. Report prepared for Department of Transport. Institute for Transport Studies, University of Leeds. McIntosh, P.T. and Quarmby, D.A. (1970) Generalised Costs and the Estimation of Movement Costs and Benefits in Transport Planning. Mathematical Advisory Unit Note 179, Department of the Environment, London. McKnight, A. (1982) The Value of Travel Time Savings in Public Sector Evaluation. Occasional Paper 51, Bureau of Transport Economics, Canberra, Australia. MVA Consultancy (1992) Quality of a Journey. Prepared for the Department of Transport. MVA Consultancy, ITS University of Leeds, TSU University of Oxford (1987) Value of Travel Time Savings. Policy Journals, Newbury, Berks. Nijkamp, P. and Pepping, G. (1998) Meta-analysis for explaining the variances in public transport demand elasticities in Europe. Journal of Transportation and Statistics, 1, 1, pp.1-14. Ortúzar, J. de D. (1994) Valor del Tiempo para Evaluacion de Proyectos.Executive Report to FONDECYT, Department of Transport Engineering, Pontificia Universidad Catolica de Chile. Pursula, M. and Kurri, J. (1996) Value of Time Research in Finland. Paper presented at PTRC International Conference on the Value of Time. Quarmby, D.A. (1967) Choice of Travel Mode for the Journey to Work. Journal of Transport Economics and Policy 1, pp.273-314. Ramjerdi, F., Rand, L. and Sælensminde, K. (1997) The Norwegian Value of Time Study: Some Preliminary Results. Institute of Transport Economics, Oslo, Norway. Small, K.A., Noland, R., Chu, X. and Lewis, D. (1999) Valuation of Travel-Time Savings and Predictability in Congested Conditions for Highway User-Cost Estimation. National Cooperative Highway Research Program. Report 431, Transportation Research Board, Washington DC. Steer Davies Gleave (1997) Transport Quality and Values of Travel Time. Prepared for TRENEN II STRAN, Trinity College Dublin. Transport and Road Research Laboratory (1980) The Demand for Public Transport. Report of the International Collaborative Study of the Factors Affecting Public Transport Patronage. Crowthorne, Berkshire. TRL, Centre for Transport Studies University College London, Institute for Transport Studies University of Leeds, Transport Studies Unit University of Oxford and Transport Studies Group University of Westminster (2004) Demand for Public Transport: A Practical Guide. Report TRL593, Crowthorne, Berkshire. Van den Bergh, J.C., Button, K., Nijkamp, P. and Pepping, G. (1999) Meta-Analysis in Environemental Policy Analysis. Kluwer, Dordrecht. Wardman, M. (1997) A Review of Evidence on the Value of Travel Time in Great Britain. Working Paper 495, Institute for Transport Studies, University of Leeds
24

Wardman, M. (1998a) The Value of Travel Time: A Review of British Evidence. Journal of Transport Economics and Policy 32 (3), pp. 285-316. Wardman, M. (1998b) A Review of British Evidence on the Valuations of Time and Service Quality. Working Paper 525, Institute for Transport Studies, University of Leeds. Wardman, M. (2001a) A Review of British Evidence on Time and Service Quality Valuations. Transportation Research E, 37, 2-3, pp. 107-128. Wardman, M. (2001b) Public Transport Values of Time. Working Paper 564, Institute for Transport Studies, University of Leeds. Wardman, M. (2001c) Inter-temporal Variations in the Value of Time. Working Paper 566, Institute for Transport Studies, University of Leeds. Waters II, W.G. (1992) The Value of Time Savings for the Economic Evaluation of Highway Investments in British Columbia. Centre for Transportation Studies, University of British Columbia.
25