public perception towards nuclear waste disposal… · department of mechanical and aerospace...
TRANSCRIPT

Department of Mechanical and Aerospace Engineering
PUBLIC PERCEPTION TOWARDS
NUCLEAR WASTE DISPOSAL: A CASE
STUDY WITH KUDANKULAM NUCLEAR
POWER PLANT
Author: NIKITHAA SURESH
Supervisor: PAUL TUOHY
A thesis submitted in partial fulfilment for the requirement of the degree
Master of Science
Sustainable Engineering: Renewable Energy Systems and the Environment
2013
Copyright Declaration
This thesis is the result of the author’s original research. It has been composed by the
author and has not been previously submitted for examination which has led to the
award of a degree.
The copyright of this thesis belongs to the author under the terms of the United
Kingdom Copyright Acts as qualified by University of Strathclyde Regulation 3.50.
Due acknowledgement must always be made of the use of any material contained in,
or derived from, this thesis.
Signed: NIKITHAA SURESH Date: 06.09.2013

i
ABSTRACT
Nuclear Power, in this current world, is one of the principle sources of energy world-wide.
Electricity demand has to be met and nuclear power has the capacity needed for heat
production in order to run the large turbines that generate electricity. Though this kind of
power generation produces maximum power, it is a non-renewable source of energy and its
effect on the environment is not predictable. Nuclear power relies directly on the usage of
radioactive materials for the nuclear fission process. They leave highly radioactive material
as residue and this poses a major threat to the environment. This paper, will aim at
understanding the risks associated with nuclear waste and how perception of the society
towards nuclear risk, known as “perceived risk”, varies from the actual technical risks. The
Kudankulam Nuclear Power Plant (KKNP), which is located in Tamil Nadu, India, is chosen
as a case study for this project. The VVER (Version V-412) that is in use here is an advanced
PWR, which incorporates all the features of a modern PWR as per the current Russian,
Western and IAEA standards. Probabilistic Risk Assessment (PRA) techniques, such as Fault
Trees, FMEA etc., are carried out in this study to analyse risks from a geological waste
repository that is used for permanent disposal of waste. Also, a survey (using survey monkey)
is taken to understand how safe the society thinks nuclear waste can be handled in India.
Comparison of results from the base case model and the survey show that public awareness
about the methods employed for ensuring safety with regards to waste disposal is very less.
Though the issue is largely a huge one, the actual impact on the environment is very less, if
the disposal is carefully handled.

ii
DEDICATION:
This work is my dedication to Meenkulathi Bhagavathi Amman, whose grace and blessings
made it possible for me to embark on this programme and to finish it successfully. It is also
dedicated to my Father and Mother for giving me an opportunity to come abroad to start a
new career path.
ACKNOWLEDGMENTS:
I wish to acknowledge and appreciate Amma for her love, grace, mercy and provision for me
throughout the period of the programme. I appreciate my father and mother for supporting me
and taking care of me even while I was away. I am grateful to my sister, Nivithaa, for
constantly cheering me up with different topics during stressful times. I thank my
grandmother for constantly wishing me good luck and keeping me in her prayers all the time.
I appreciate my friend Kumaran Rajarathinam’s help for being a shoulder to lean on
whenever i needed one. I am also thankful to all my friends and family, here and abroad for
their constant support and motivation.
I acknowledge the support and assistance of my supervisor, Professor Paul Tuohy for guiding
me through this project. He helped me go ahead with this project which was of my own
choice to help me understand the nuclear sector better. His ideas and thoughts have only
helped me shape this project in a better way and to finally choose sides.
I finally would like to thank Dr Paul Strachan for accepting this project and for suggesting
working with Prof. Paul for my project. I thank you for being such a wonderful course mentor
and guide.

iii
Table of Contents
Chapter 1: Introduction ...................................................................................................... 1
1.1: Aim .............................................................................................................................. 1
1.2: Objective...................................................................................................................... 2
1.3: Scope ........................................................................................................................... 2
Chapter 2: Literature Review ............................................................................................. 2
2.1: A Nuclear Fuel Cycle .................................................................................................. 2
2.2: Classification of Waste ................................................................................................ 4
2.3: Spent Fuel Storage ....................................................................................................... 6
2.4: Radioactive Waste Management ................................................................................. 7
2.5: How safe is safe enough? .......................................................................................... 10
Chapter 3: Site Description ............................................................................................... 12
3.1: Site Selection ............................................................................................................. 12
3.2: Nuclear Reactor in use ............................................................................................... 13
3.3: Risk Analysis Techniques ......................................................................................... 15
3.3.1: Fault tree Analysis13
............................................................................................... 15
3.3.2: Failure Modes and Effects Analysis (FMEA) ........................................................ 19
Chapter 4: Analysis and Results ....................................................................................... 20
4.1: The Big Picture .......................................................................................................... 20
4.2: Failure during long-term disposal of waste ............................................................... 25
4.3 Public Perception towards Nuclear waste and Disposal ............................................. 28
Chapter 5 Discussion and Conclusions ............................................................................ 31
REFERENCES ..................................................................................................................... 39
Appendix A: Pressurised Water Reactor .............................................................................. 40
Appendix B: FMEA Calculation .......................................................................................... 43

iv
LIST OF FIGURES
Figure 1: The Stages of a nuclear fuel cycle .............................................................................. 4
Figure 2 : A one sided picture of the site [1] ........................................................................... 13
Figure 3 : VVER reactor design [10] ....................................................................................... 15
Figure 4 : A simple fault tree ................................................................................................... 18
Figure 5 : Fault tree showing different pathways leading to radioactive release ..................... 23
Figure 6 : An example model of geological repository ........................................................... 25
Figure 7: Fault tree model for failure during long-term disposal ............................................ 26
LIST OF TABLES
Table 1: Commonly used fault tree symbols ........................................................................... 16
Table 2: Gates and their Boolean expressions ......................................................................... 17
Table 3: Calculation of RPN; FMEA Matrix [14] ................................................................... 20

1
Chapter 1: Introduction
It is a well- known fact that the Chernobyl power plant in Ukraine was considered to be one
of the proudest technological achievements of The Soviet Union. The Chernobyl accident in
1986 created a revolution in the way nuclear power and safety was viewed. Nuclear Safety
became the highest priority and ways to re-establish nuclear power proved to be difficult for
quite some time. The scars of Hiroshima and Nagasaki blasts are still afresh in the minds of
its people and this accident just added some more fuel to the fire. It is definitely not a surprise
that there exist large anti-nuclear group all over the world. Greenpeace is one such global
organisation that has been actively protesting against nuclear power. “We have created a
monster”, they say.
Some experts have a difference in opinion about the “monster” that we have created. Even
nuclear power has its own advantages. Without accidents, a nuclear power plant delivers a
cleaner energy than fossil-fuels such as coal, gas or oil. The contribution to global warming is
more from a fossil fuel. Also fossil fuels are being used up so quickly and it’s only a matter
of time before we run out of them. So will we not run out of Uranium? Considering the rate at
which nuclear power plants are being built, yes, we will also run out of uranium eventually,
but it will be at a considerably slower rate than fossil fuels because even a small chunk of
Uranium can produce as much as energy as a 5000 tonnes of coal1.
When it comes to the society, there is always an air of uneasiness with respect to nuclear
power. This is true in most of the countries, especially in India. But the question here is, do
they REALLY know the risks involved with nuclear power? This is an area that definitely
needs to be addressed as it is very important for the growth of the nuclear industry. Great
secrecy has always surrounded the production of nuclear power because of its close
connection and a direct link with nuclear weapons.
1.1: Aim
To understand the attitude of the public towards a nuclear waste disposal site
To understand why and how scientific results vary greatly with perception.

2
1.2: Objective
1. Understanding a nuclear fuel cycle and the types of waste produced
2. Reviewing waste management techniques and PRA methods to assess waste
3. Building a base fault tree model of a geological waste repository for an Indian
environment using Reliability Workbench v.11 to find out a probabilistic value for
radioactive material to come into contact with the environment.
4. Undertaking a survey using Survey Monkey to understand perceived risks as seen by
people.
1.3: Scope
The scope of this work entails assessing the impact of a public opinion on a powerful industry
sector such as the Nuclear power industry. An attempt is made here to build a base case
model using fault tree analysis for the KKNP site based on assumptions and historical data as
no exact data is available for the site chosen. In addition to the quantification of the technical
risk – the perceived risks are also quantified and a direct comparison between the two is
made. It is essential to remember that this work is an attempt of an individual to understand
the nuclear sector out of pure interest, with no prior experience in this field of expertise.
Chapter 2: Literature Review
The following review of literature aims to understand the nuclear fuel cycle and the efforts
taken to reprocess the waste fuel. The review endeavours to understand the process of
analysing risks associated with nuclear waste and what type of harmful effects it can have on
the environment.
2.1: A Nuclear Fuel Cycle
In order to describe nuclear “waste”, it is important to understand what goes in to a nuclear
power plant and what comes out. As the name suggests, a nuclear fuel “cycle” is a sequence
of technique through which the elements used for power production pass through2. It begins
with Uranium Mining and Extraction and ends with the final disposal of waste materials.

3
There is some amount of waste produced in every stage of the fuel cycle and they can be
classified according to origin or by the amount of radioactive content3. The types of waste
will be dealt with in the sections to come.
A nuclear fuel cycle consists of the following steps2;
Mining, Extraction and Milling of Uranium: Uranium is a slightly radioactive material that is
commonly found in the earth’s crust. Mining can be done in three different ways;
underground mines, open pit mines and in-situ leaching where uranium is leached directly
from the ore. In-situ leaching (ISL), also known as solution mining, involves recovering the
minerals from the ore by dissolving and pumping the pregnant solution to the surface where
the minerals can be recovered and leaving the ore as it is in the ground. No tailings or waste
rock is generated in this process. However, the ore-body needs to be permeable to the liquids
used, and properly located to avoid contaminating the groundwater. Milling is a chemical
process where the mined uranium ore is crushed and treated to get the uranium separated.
This uranium is then converted to a concentrated “yellow cake” of Uranium Oxide (U3O8).
The extracted uranium is then converted to a gaseous form, Uranium Hexafluoride (UF6) to
enable uranium enrichment.
Uranium Enrichment: Natural Uranium has 2 isotopes, U- 238(99.3%) and U-235(0/7%). U-
235 is responsible for the fission process but its available quantity is less when compared to
U-238. Enrichment process is done to increase the concentration of U-235 isotope. It is
normally enriched to contain about 5% of Uranium. Gaseous diffusion, gaseous centrifuge
and laser separation are commonly employed techniques. But there are chances of
mishandling the enriched uranium, which could potentially lead to a criticality accident.
Fuel Fabrication: This is last stage in the preparation of nuclear fuel prior to its use in a
reactor. The fabrication process consists of three steps where uranium, after enrichment is
converted into an oxide or metal by undergoing a series of chemical reactions. It is then
loaded into metal tubes filled with gas and is sealed (metal claddings). The filled tubes are
then assembled as clusters and prepared for insertion into the nuclear reactor.
Power reactor Operation: Nuclear Fission is the process by which the uranium atom splits to
give off heat. This splitting causes a chain reaction to take place, which is called a nuclear
reaction. Along with heat, other nuclear fission products are also released, most of which are

4
radioactive. In addition to these, atoms heavier than uranium, such as Plutonium, Curium, and
Americium are also produced.
Fuel Reprocessing: The spent fuel is reprocessed to recover unburnt fuel and plutonium from
the waste. The remaining is considered as waste and is either stored or disposed. The
plutonium recovered from the spent fuel can be used to fuel fast breeder reactors.
Waste Management: A variety of waste is produced in every stage of a nuclear fuel cycle.
Some of the waste might be highly radioactive. Carefully managing waste in such a way that
it does not compromise the health and safety of the workers and the general public is a very
important aspect. This includes interim storage and disposal of waste into a suitable
repository in the future.
Figure 1: The Stages of a nuclear fuel cycle
2.2: Classification of Waste
Like mentioned before, waste can be classified either according to their origin or with the
amount of radioactive content in it. By “origin”, it means the waste that comes out from the
different stages in the fuel cycle, either as leakages or residues.
When it comes to radioactive content, wastes can be classified into 3 types3.
Low Level Waste (LLW): They contain very small concentrations of radionuclide,
particularly those with shorter half-lives; those that take relatively less time to decay. Such
low level wastes are not highly radioactive and they form the bulk of all the waste produced.

5
Intermediate Level Waste (ILW): These contain a higher concentration level of radionuclide.
But the volume of these wastes is less compared to LLW.
High Level Waste (HLW): These contain the major part of radioactivity produced in the
nuclear fuel cycle. They have high radioactive content and the heat given away from them
during decay is very significant and harmful.
Waste Disposal is a broad topic and a huge issue in hand that is faced by almost all the
countries that do work on nuclear power. Depending on whether the spent fuel is reprocessed
or not, there are three main commonly identified fuel cycle types5.
1. Once-through fuel cycle: As the name suggests, the fuel passes through the cycle only once
and the spent fuel is considered as a waste. It is kept in storage till it can be disposed in a
suitable geological site/ repository. Though this method is currently employed by certain
countries and is very much in practice, it has certain disadvantages; the most important of
them all being the disposal of long-lived Transuranium Isotopes (TRU), fission products (FP)
and Plutonium.
2. Thermal reactor fuel cycle: The spent fuel is reprocessed and the remaining uranium and
generated plutonium are separated from the fission products. The fission products are stored
in liquid form for a few years before they are sent for vitrification, where they are stored in
engineered storage facilities. The vitrified waste is a HLW and it has to be disposed off along
with the TRUs.
3. Fast Breeder reactor cycle: This uses the spent fuel not only from the core but also from
the surrounding blanket region to reprocess. The uranium-plutonium product separated from
it can again be used in the reactor.
The choice of a specific fuel cycle depends on various inter-related factors. Environmental
considerations, policies and politics, price of uranium in the market, availability of uranium,
and cost of electricity production from uranium are some of the factors that play an important
role in deciding the right choice of fuel cycle. The choice of the fuel cycle will also influence
the type of waste that is being produced. Earlier, these factors were predictable to an extent.
But in this present world, energy demand is rocketing to such a height that it is becoming
highly impossible to forecast the future of the energy industry.

6
2.3: Spent Fuel Storage
Spent Fuel is the fuel that no longer has the ability to undergo nuclear activity. The storage
method adopted for spent fuel and other radioactive materials in the nuclear site ensures
minimal exposure to on-site operators as well as the public. Initially, this spent fuel is stored
in pools in the reactor site. The storage of spent fuel requires a lot of facilities like 1:
shielding to handle the fuel, 2: cooling to maintain fuel temperature, 3: criticality safety
control, 4: controlling water chemistry, 5: decontamination5. Of these, maintaining fuel
temperature and cooling it is the most important of them all.
There are two commonly accepted types of fuel storage; Pool storage method and the Dry
Storage method. The two methods are briefly discussed below;
Pool Storage: Storing spent fuel assemblies under at least 20 feet of water. It provides adequate
shielding from the radiation. The assemblies are moved into the water pools from the reactor along the
bottom of water canals, so that the spent fuel is always shielded to protect workers. About one-fourth
to one-third of the total fuel load from the pools is spent and removed from the reactor every 12 to 18
months and replaced with fresh fuel6.
Dry Storage: For increasing spent fuel storage capacity, utilities began looking at options such as dry
cask storage as the need for alternative storage began to grow when pools at many nuclear reactors
began to fill up. Spent fuel that has already been cooled in the pool for at least one year, is stored in a
container called a cask. The cask contains an inert gas that surrounds the fuel. The casks are typically
cylinders made up of steel that are either welded or bolted closed. The steel cylinder provides a leak-
tight confinement of the spent fuel. To provide radiation shielding to workers and the public, each
cylinder is surrounded by additional steel, concrete, or other material. Some of the cask designs can
also be used for safe transportation6.
There are specific features that characterize the safety of each type of spent fuel storage. The
following factors define the main safety requirements 7:
Minimizing the danger of hermetic sealing damage (leading to release of radioactivity
by the fuel)
Minimizing the release of radioactivity and its migration to the environment in case of
fuel-element cladding damage
Minimizing the mechanical damage of spent nuclear fuel elements as a result of
external impacts (earthquakes, fires, explosions, projectiles, fall of flying objects).

7
The continuous production of spent fuel and the delay in developing the required re-
processing capacity has led to increasing the pool storage capacity by expanding the existing
pool capacity, building new facilities and re-racking. So this provides room for accidents and
disturbances to happen. These include loss of power, component failures, fuel handling
mishaps and leakage of pool water.
Radioactive contamination of pool water is one of the issues associated with wet storage of
spent fuel. If defective fuel rods are not identified and isolated before they are placed inside
the pool then this will lead to water contamination. For occupational safety, the
contamination must be maintained at 30MBq/m3. If the heat of the fuel increases so much
that the fuel cladding loses its integrity or if there is a massive impact on the stored fuel then
this might lead to a significant release of radioactive material to the environment, along with
some gaseous material.
Maintaining the level of pool water is by far the most important condition that has to be
satisfied for storing spent fuel under water. Pool water helps maintain the fuel temperature
and loss of water will trigger the increase of temperature due to decay heat. The pool water
can either be lost due to leakage or due to the failure of the system itself, thereby leading to
evaporation and overheating of the pool. When it comes to increasing the capacity of a
storage facility or re-racking the fuel assemblies, the extra heat load might raise the
temperature of the water to an unacceptable level.
Even though such bizarre accidents can be restrained from happening by taking the right
action at the right time, the probability of risk leading to a contamination or leakage still
exists and so it will always remain as an area of concern.
2.4: Radioactive Waste Management
Any kind of waste that cannot be recycled or destroyed can be dealt with in two ways. It can
either be stored for a long period of time or it can be disposed. With respect to radioactive
waste, both these kinds are employed. It is necessary to understand the difference between
“storage” and “disposal” to avoid confusions, especially when it comes to talking about
radioactive waste. When we say that the waste is “stored”, it means that the waste is placed
under a supervised facility, away from human contact, but in recoverable conditions when
required. But in the case of “disposal”, the waste cannot be recovered. The quantity of waste

8
produced greatly depends upon the reactor type and its construction, operating conditions,
site conditions and by the way the fuel is treated2.
Waste from fuel reprocessing is responsible for generating almost all the high level
radioactive waste. After removing uranium and plutonium through fuel reprocessing, the
residual waste contains about 99% of the total fission product activity which is highly
volatile2. This waste has to be isolated from the biosphere mainly because of its high toxic
content. Wastes such as STRONTIUM-90 and CAESIUM-137 require longer periods of
isolation as they have half lives for about 30 years. Studies have been made on ways to
manage such kind of wastes. Perhaps, the most practical strategy would be to convert all the
long-lived nuclides to short-lived ones through processes such as “nuclear incineration”3.
What is achieved out of this method is the reduction in the volume of waste. Though this
method reduces the amount of long lived nuclides, it also increases the quantity of short-lived
nuclides and this only causes an increase in the total amount of waste. What should not be
forgotten is that, incineration does not reduce the radioactivity of the waste.
Wastes such as the high level and the medium level ones can be immobilized for the purpose
of long-term storage and can be later disposed in geological repositories that are very deep.
This type is generally not considered as the best option mainly because it places a huge
burden on the future generations. A site once used for disposal/storage of radioactive content
can never be used again. Apart from this, there are also accidental risks associated with the
storage sites. Medium Level Liquid Waste (MLLW) is subjected to a flocculation treatment
and the supernatant (the liquid lying above a solid residue) is discharged as a low level liquid
waste into natural water bodies such as oceans or streams and the sludge from the treatment is
embedded in cement and stored as solid waste5. Gaseous radionuclide particles such as
KRYOTPN-85, IODIONE-129, HYDROGEN-3, CARBON-14 and other aerosols are
subjected to chemical scrubbing and physical filtration with the help of high-efficient
particulate air filters (HEPA). Of all the wastes that have to be managed, HLW requires
greater attention than the rest of them because it is highly radioactive. It produces significant
amount of heat and this condition persists for a long time, maybe even for a few hundred
years. The highly radioactive wastes are mainly from the contaminated swarf or metal
cladding that is removed from irradiated fuel before reprocessing. A number of very exotic
suggestions such as firing waste into space and burial in polar ice caps were made2. But these
are not practical solutions at all. Polar ice caps are already weak and melting and burying

9
toxic in ice caps might only lead to unimaginable catastrophic events. Disposing them in deep
repositories is the most sorted out solution for this, and is even currently employed.
Effort is taken in this literature survey to understand the working of such a repository. A
repository aims at preventing any radioactivity from causing harm or damage to mankind.
Selection of the right rock environment and massive engineering techniques help make this
kind of safety possible. Multiple layers of barriers are always preferred to keep the toxicity of
the waste material intact. The rocks used can generally be classified as either dry or wet. Dry
rock like salt or anhydrite does not contain a groundwater flow mechanism so this might
prevent the degradation of the engineered barriers and also prevent the transportation of the
radionuclide to the surface of the repository. Wet rocks contain mobile groundwater but it
will not pose as a problem provided the level of flow is low. The favourable low flow
condition is ensured by the geography of the chosen site. Absence of oxygen in such deep
sites is necessary as the presence of dissolved oxygen could lead to corrosion of the barriers
or the dissolution of nuclide. Other than providing a physical protection, the rock has other
important barrier roles to play. Sorption of nuclides on the rock will greatly reduce the
transportation of any released radionuclides from the repository.
The performance of any repository is assessed based on the time-scale of the hazardous
waste, which is usually a few hundred years. Taking a granite host rock in Northern
Switzerland as an example, the depth at which a repository construction can take place would
be at 1200 meters. The expected water flow rate at this depth for this site is less than 1 litre
per year. The groundwater is chemically near neutral and the ambient rock temperature is
about 60◦ C. The Swiss Disposal concept includes the following details:
A Glass Matrix that restricts release of radioactive material
A Steel Canister, covering the glass matrix; that prevents penetration of water into the
glass matrix
Bentonite clay that holds the canister. It restricts water penetration and delays the
release of material
The host rock, where the above arrangement is buried. It’s placed in the Repository
zone which has limited water supply and holds favourable chemical conditions
A sedimentary overburden, above the host rock, that provides additional retardation of
transportation of radioactive material to the surface and long-term stability

10
The most likely failure for a repository like this is the gradual degradation of the engineered
barriers due to the inflow of groundwater. Studies suggest that by the time the radioactive
material escapes all these barriers, its radioactivity content would have reduced so much that
it cannot possibly cause any harm to the environment. Most radioactive nuclides will decay
completely within the engineered barriers. It will even take very long lived radionuclides a
thousand years or even more to reach the surface.
So, if a repository is really a safe option, then why is this frenzy about nuclear power being
dangerous? Why do people not accept that long term disposal of nuclear wastes can be safe?
2.5: How safe is safe enough?
A very common question that is asked when it comes to risk analysis of nuclear power is,
“how safe is safe enough?” From what is recorded and noted, no matter how hard scientists
try to prove that nuclear power is safe, there is always someone somewhere to prove it
otherwise. Disposing nuclear waste in a geological site is by far the most “feared” risk of
them all. Public support is very essential for such big industries to survive. This diverse
group receives all of its information from the media and it is not in their nature to give a
balanced presentation8. Starr (1969) in his research noted that “individuals seem to accept a
much higher risk if it is voluntary, e.g. sky-diving, than if it is imposed, such as, by electric
power”. He concluded with a LAW OF ACCEPTABLE RISK, which states that, “Risk
Acceptability is proportional to the cube of the benefits”. While nuclear power has the least
risk, it also has the least perceived benefits8. So it’s only natural that people prefer other
methods of electricity production where the benefits are more. When it comes to taking
surveys, as studied by Covello (1981), people tend to respond with the first things that strike
their mind when they read a question. It is possible to get answers from them even when they
have very little knowledge about the topic under discussion8.
Cohen B.L (1998) used nuclear energy to show that “public perception can be completely out
of touch with the results of scientific risk analysis”9. Refusal of the media to communicate
direct results to the public, especially results pertaining to probabilities is the underlying
problem. Media has complete control over public perception and the messages they transmit
are not influenced by scientific analysis. The only two popular public concerns with regards
to generation of electricity from nuclear power are the release of radio-active materials due to
a bad reactor accident and the proper disposal of radioactive waste. The second issue remains
11
to be (and will remain to be) an unsolved problem. Our interests lie with public perception of
radioactive waste management.
Seeing this from a scientific analysis point of view, the solution to proper disposal is, as
discussed before, burying in a geological repository site. It is not within the scope of a PRA
(Probabilistic Risk Assessment) to develop an accurate model for a geological repository
because far-future geological events and climatic changes are impossible to predict. But by
determining the rate at which an average rock under a given depth will be dissolved by water,
it is possible to build a PRA. The result is a total of 0.02 deaths over a million of years, from
one reactor-year of electricity generation. When similar kind of studies were conducted for
generation of electricity from coal, the numbers were a thousand times more.
What is the difference between the way a scientist and public person address the same issue?
A public person (politician/ media)
Does not attend scientific meetings where such kind of issues are debated
Provides/ gains information through press-talks and talks non-scientific audiences
Do not provide papers with results to prove their point that another peer person can
criticize
Clearly, media is the only direct link between the commons and the intellectuals. The public
gets all of its information from the media and it is a well known fact that the results from a
PRA have never once been published or even mentioned in any of the news paper articles or
TV programmes. They conveniently choose to thrash nuclear power but without any
underlying facts. Any technology will have its own risks and those risks can be made more
dangerous by assuming further failures. Because of this kind of negligence, the importance
and the role nuclear activity plays in medicine, agriculture, engineering etc is unknown to the
public. This battle between public perception of risk and the actual scientific risks has been
going on since the early 70’s. Environmental groups found it easier to target the safety aspect
of nuclear power and question it in order to gain media’s attraction. Now, why did the media
support this and publicize them? Just for the same reason as the environmental groups,
“attract audience”. Scaring people with “mystery” and “suspicion” is by far the easiest way to
increase sales/ growth. Many call it marketing strategy.

12
Deeper review shows that, though the scientists are the ones with the facts, only the “other
side” has a strong hold on the public and so no matter with how many facts they come up
with, they will always fail to reach the public. The scientists have no time for political battles
and even if they did, they are not well educated in these lines to face one. Both sides come
from very different backgrounds and each one is a winner in their own field. While one was
absorbed in laboratory work, the other was busy establishing political relationships. In a
political campaign, it is necessary to demonstrate “selectivity” and they choose to select and
present in such a way that makes nuclear industry look bad. Their influence is so strong, that
there is absolutely no room for nuclear scientists to reach out and prove their point.
From the above review, it is very clear that public perception of a nuclear hazard is
completely different from calculated risks. This difference is tested in this project by taking
KKNP located in India as the case study. An attempt is made to quantify the technical risks
using fault trees where as the perceived risks are quantified with the help of a survey that is
structured with the idea of targeting audience who have a very general outline and perception
about the nuclear industry. A comparison is made between the two and the results are
discussed.
Chapter 3: Site Description
The following sections will concentrate on describing the geographical location of the
Kudankulam power plant, the PWR in use in the site and a multiple barrier repository system
concept. To understand the working of a PWR in general, please refer to Appendix A.
3.1: Site Selection
The Nuclear Power Corporation of India Limited (NPCIL), in collaboration with Atom Stroy
Export, built this nuclear power plant in Kudankulam. The site is located along the cost of
Gulf of Mannar, 25km north-east of Kanyakumari. The Site Selection Committee of the
Department of Atomic Energy decided to go ahead with this location after considering
several aspects including the guidelines set by the International Atomic Energy Agency
(IAEA). Some of them include assessment of seismicity, location of faults, geology,
foundation conditions, meteorology, potential of flooding (from tsunami, storm surge, etc. at
coastal sites and from rain, upstream dam break, etc. at inland sites), proximity to airports,
military installations, facilities storing explosive and toxic substances, etc. The site is located

13
in low seismic area, zone-II as per the Indian Standards of Classification. It has no active
faults in the vicinity and provides preferable foundation conditions, ambient for building
structures. The site is free from severe cyclonic activities and has low potential of Tsunami
effects10
. Nuclear Power Corporation of India Limited has acquired the land within the 2 km
radius from the main plant. About 40% of 2 km radius areas acquired lie in the Gulf of
Mannar. The balance portion is mostly barren lands and without any habitation. The
radiological impact on the site is said to be lower than the stipulated regulatory requirements.
The environmental clearances have been obtained from State and Central Government
statutory authorities. The activity will not in any way affect the marine life nor curtail the
fishing activities of the fishermen living nearby. Nuclear reactors provide clean power and
there is no release of gases like sulphur dioxide, carbon monoxide and carbon dioxide. This
will also not affect the Vivekananda Rock Memorial (a sacred monument), located nearby.
The requirements of fresh water are very small and will be drawn from the Pechiparai
Reservoir. The fresh water requirements will thus not affect the drinking water and
agricultural needs of the local population 10
.
Figure 2 : A one sided picture of the site [1]
3.2: Nuclear Reactor in use
The type of reactor in use here is an advanced 1000 MWe design of VVER reactors. VVER
stands for “Vada Vada Energy Reactor” which means it is a water-cooled, water moderated
energy reactor. These reactors fall under the category of pressurized water reactors; light

14
water reactors. Uranium, enriched to about 4% is used to fuel the reactor. The KK-VVER has
a 3 year fuel cycle. Approximately 55 fuel assemblies are required for the purpose of
refuelling annually (filling one-third of the core). Four circulating loops and a pressurizing
system are connected to the reactor 10
. Each loop contains a horizontal steam generator, a
main circulating pump and passive part of emergency core cooling system (accumulators).
Interconnecting pipes are used to connect the loops with the reactor pressure vessel assembly.
The reactor plant also consists of a reactor protection and regulation system, engineered
safety features, auxiliary system, fuel handling and storage system, etc.
Some of the main design features of a VVER are as follows;
Reactor core has hexahedral assemblies
Horizontal steam generators
Ability to arrange the spent fuel pool inside the containment
No openings in the reactor bottom
Fuel rod claddings of zirconium-niobium alloy
Carbon alloy steel reactor vessel
The reactor vessel is designed to contain the fuel assemblies of the core and the vessel
internals. The reactor is placed in a concrete pit inside the containment. Heat generated in the
reactor core is transferred by the Reactor Coolant System (RCS) to the steam generators. The
steam generators produce the required steam to run the turbine generators. The coolant used
in the coolant system is borated demineralised water and this also acts a neutron moderator,
reflector and as a solvent for neutron absorption. The pressure boundary of the coolant
system acts a barrier against the release of radioactive material to the environment 12
.
The reactor core can hold one hundred and sixty-three fuel assemblies in a hexahedral lattice
pattern with the help of stainless steel supporting structures. There are 331 locations in each
fuel assembly out of which 18 are for the control rods, one for instrumentation tubes and the
rest 311 contain enriched uranium di-oxide pellets placed inside tubes made of Zr-Nb.

15
Figure 3 : VVER reactor design [10]
3.3: Risk Analysis Techniques
The following section will describe the risk analysis techniques researched and employed in
this study in order to undertake an analysis to understand the risks associated from a nuclear
waste disposal repository.
3.3.1: Fault tree Analysis13
Fault tree analysis uses simple logical relationships like AND, OR, XOR, etc., to relate
events that interact to produce other undesirable events. This allows us to build a methodical
structure that represents the system as a whole. In order to construct a fault tree, it is
mandatory to understand the functioning of the system under analysis. A flow diagram or a
functional logic diagram can be used for this purpose. Another method used frequently to
understand failure modes is Failure Modes and Effects Analysis (FMEA). An introduction to
FMEA will be dealt with in the following chapters.
The top event in a fault tree is the system failure event that is to be studied. In other words,
the top event is the “undesirable event”. Logical event connections are then used to link and
relate subordinate failure events that might lead to the occurrence of the top event. The
subordinate events are once again broken down to their logical connections and by this way, a
fault tree is created. When a contributing event cannot be broken down further into other sub
events, then the corresponding branch is terminated with a “basic event”. This basic event is
responsible for the top event to occur.

16
When constructing a fault tree, the first step to it is selecting the top failure event. The events
following it will be considered according to the effect they place on the top event. The next
step is to find contributing events that will lead to the occurrence of the top event. There are
at least four possibilities that exist (these are applicable to any kind of fault tree construction).
Failure of the device to receive an input signal
Failure of the device itself to operate
Human error
Failure due to external events
Each branch from the first level of contributing events must then be examined for further
breakdown. If a given event cannot be broken down further, then it is treated as a basic event
and is graphically represented with a circle. The final level of the fault tree will only consist
of independent basic events.
Some of the commonly used symbols to represent logical relationships between events are as
follows;
Symbol Name Description
Rectangle Fault event (resulting from
the logical combinations of
other events)
Circle Independent primary fault
event
Diamond
Underdeveloped fault event
OR gate Output occurs if one or more
of the input event occurs
AND gate Output occurs only if all the
input events occur
Triangle Transferring the tree
construction to another sheet
Table 1: Commonly used fault tree symbols
After constructing, the fault tree can be evaluated by following a set of Boolean Algebraic
equations depending on the type of gates used in the tree. Table 2 shows the gates that are
commonly used in fault trees and their Boolean logic. For each gate, the input variables are
the independent variables and the output is the dependent variable. Solving the Boolean
equations will help us to individually express all the events in terms of minimal cut sets. A
minimal cut set expresses the top event as a collection of multiple scenarios that will cause
17
the top event to occur. Using Boolean functions to analyse fault trees is called qualitative
analysis.
Type Boolean Expression
OR A+B
AND A.B
Table 2: Gates and their Boolean expressions
Another approach to evaluating a fault tree is by the quantitative approach where the
probability of occurrence of the top event is calculated. There are two methods for this
approach. If there is data available about the minimal cut sets, then the probability of the top
event occurring will just be the probability of the union of the minimal cut sets. If the cut sets
are not known and if the fault tree is not complex, then the probability can be found by
manual calculation. In this case, the probabilities can be found by applying the following
equations;
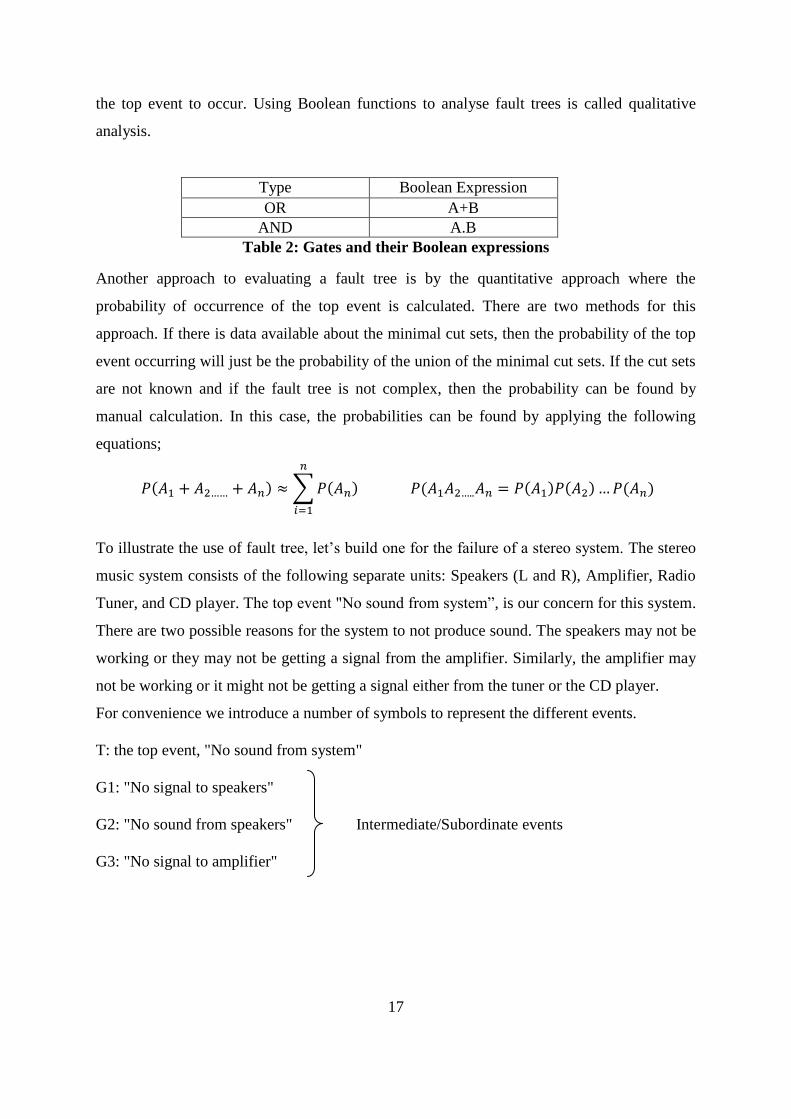
To illustrate the use of fault tree, let’s build one for the failure of a stereo system. The stereo
music system consists of the following separate units: Speakers (L and R), Amplifier, Radio
Tuner, and CD player. The top event "No sound from system”, is our concern for this system.
There are two possible reasons for the system to not produce sound. The speakers may not be
working or they may not be getting a signal from the amplifier. Similarly, the amplifier may
not be working or it might not be getting a signal either from the tuner or the CD player.
For convenience we introduce a number of symbols to represent the different events.
T: the top event, "No sound from system"
G1: "No signal to speakers"
G2: "No sound from speakers" Intermediate/Subordinate events
G3: "No signal to amplifier"
18
Figure 4 : A simple fault tree
C: "CD failure"
R: "Radio Tuner failure" Basic events
A: "Amplifier failure"
LS: "Left Speaker failure"
RS: "Right Speaker failure"
Using the respective Boolean expressions for the gates, we see that
T=G1+G2
Where G1=G3+A, G3=C.R, and G2=LS.RS
By substituting we arrive at,
T=G1+G2
=G3+A+G2
= C.R+A+LS.RS
19
This gives the Boolean expression and the minimal cut sets that will together result in no
sound coming from the sound system. This method will later be used to build an elaborate
fault tree to understand the ways in which nuclear waste can reach the environment.
3.3.2: Failure Modes and Effects Analysis (FMEA)
This tool helps to systematically identify all modes contributing to failure and analyse their
resulting effect on the system. Nuclear power applications frequently use this when a detailed
analysis that involves fault trees and event trees is not needed. In FMEA, the failure or
malfunction of each component of the system is considered along with the mode of failure.
These effects are then traced through the system to analyse the ultimate effect on the
system13
. FMEA includes reviewing the following 14
;
Steps in the process
Failure modes (What could go wrong?)
Failure causes (Why would the failure happen?)
Failure effects (Consequence of each failure)
For each failure mode, a numeric value, known as the Risk Priority Number (RPN) is
assigned for likelihood of occurrence, likelihood of detection, and severity. Assigning RPNs
helps to prioritize areas to focus on and can also help in assessing opportunities for
improvement. For every failure mode identified, it is necessary to answer the following
questions and assign a score from 1 to 10, with 1 being the least and 10 the highest.
Likelihood of occurrence: How likely is it that this failure mode will occur?
(1 - Very unlikely to occur; 10 - very likely to occur)
Likelihood of detection: If this failure mode occurs, how likely is it for the failure to be
detected?
(1 -very likely to be detected; 10 -very unlikely to be detected)
Severity: If this failure mode occurs, how likely is it that harm will occur?
(1-very unlikely that harm will occur; 10-very likely that severe harm will occur)
The below table can be used to tabulate the values and calculate the RPN value.
RPN value = Likelihood of occurrence * Likelihood of detection * Severity

20
FMEA is one of the several variations of an inductive approach. FMEA considers only one
failure at a time. It does not consider multiple failures or common cause failures and this
poses as a main disadvantage in this method. Nevertheless, it is a simple application and can
provide an orderly examination of the hazardous conditions in a system. The use of this tool
for this study will be demonstrated in the following sections.
Steps
in the
process
Failure
mode
Failure
causes
Failure
effects
Likelihood
of
occurrence
(1-10)
Likelihood
of
detection
(1-10)
Severity
(1-10)
Risk
Profile
Number
(RPN)
Actions to
reduce
occurrence
1
2
3
Table 3: Calculation of RPN; FMEA Matrix [14]
Chapter 4: Analysis and Results
This section will introduce the fault tree built to analyze the probability of failure of a nuclear
waste repository site. Also, a bigger fault tree is built to show all the possible ways nuclear
waste can come in contact with the environment.
4.1: The Big Picture
It is worthy to note that there is so far no repository site identified or located in India for
permanent disposal of waste. Nuclear waste generated in India is too small to deserve a
separate geological repository. India's existing nuclear waste site is located at Tarapur where
high-level radioactive waste is first converted into inert and stable materials which are kept
inside stainless steel canisters sealed with lead covers. Almost 75 per cent of this solid
storage surveillance facility is still vacant. But the country will eventually need a geological
21
repository, considering its ambitious expansion and to generate 63000 MW of electricity with
the help of nuclear power by 203215
. Also, absence of a repository is one of the crucial
arguments used by anti-nuclear groups to oppose against nuclear power amongst other
reasons such as security and the nuclear liability act.
Even though there are many currently running projects in India, Kudankulam Nuclear power
plant is chosen as the case study because this site is known for its many controversies and
oppositions it has been getting since 2011. The plant is relatively new and its units became
functional only in July 2013. The following are a few of the many reasons for opposing a
nuclear power plant in this area.
People claim they were made false promises such as 10,000 jobs, water from Pechiparai
dam in Kanyakumari district, and fantastic development of the region.
The Environmental Impact Assessment (EIA), Site Evaluation Study and Safety Analysis
Report were not shared with the people, or the people’s representatives or the press. No
public hearing or democratic decision-making or public approval is known for this
project.
The Tamil Nadu Government establishes clearly that the “area between 2 to 5 km radius
around the plant site, [would be] called the sterilization zone.” This means that people in
this area could be displaced. But the KNPP authorities promised orally that nobody from
the neighbouring villages would be displaced. This causes suspicion and fear of
displacement in the future.
The population living within the 30 km radius of the KNPP far exceeds the AERB
(Atomic Energy Regulatory Board) stipulations. It is quite impossible to evacuate this
many people quickly and efficiently in case of a nuclear disaster at Kudankulam.
The coolant water and low-grade waste from the KNPP will be dumped into the sea
which will have a severe impact on fish production and catch. This will undermine the
fishing industry, push the fisher folk into deeper poverty and affect the food security of
the entire Southern Tamil Nadu and Southern Kerala.
Even when the KNPP projects functions normally without any incidents and accidents,
they would be emitting Iodine 131, 132, 133 isotopes, Caesium 134, 136, 137 isotopes,

22
Strontium, Tritium, Tellurium and other such radioactive particles into the ecosystem.
Also, the question of “where will the waste go” remains a mystery.
The quality of construction and the pipe work and the overall integrity of the KNPP
structures have been called into question by the workers and contractors who work in
Kudankulam. There have been international concerns about the design, structure and
workings of the Russian-made VVER reactors.
Many political leaders and bureaucrats try to reassure us that there would be no natural
disasters in the Kudankulam area. But it impossible to give such an assurance. In-fact, the
2004 December tsunami did flood the KNPP installations.
Finally, the Indian government’s mindless insistence on nuclear power, utmost secrecy in
all of its nuclear agreements and activities, and its sheer unwillingness to listen to the
people’s concerns and fears makes the society very doubtful about the real benefactors of
this energy sector.
Concentrating on the environmental aspect, the release of radioactive waste material into the
ecosystem will be the area of concern for this study. There are different pathways in which
nuclear waste can come into contact with the system. Four pathways have been identified and
a fault tree is built to show the connection.
The top event as seen in the fault tree is the “release of radioactive material into the
environment, which as described before is the “undesirable event”. The next level of sub-
ordinate events gives the four possible pathways that have been identified that could lead to
the occurrence of the top event. An OR gate is used here to show that the occurrence of even
one of the events will lead to the release of radioactive material. The four pathways are as
follows;
1. Failure of High-level waste tanks
2. Failure during glasification process
3. Failure during interim storage
4. Failure during long-term disposal of waste

23
Figure 5 : Fault tree showing different pathways leading to radioactive release

24
Failure of High-level waste tanks: As mentioned in the previous section, spent fuel is
reprocessed and stored in engineered tanks for years before it is sent for the vitrification
process. There are two possible ways for the waste tanks to fail that might cause a release of
the material; 1. Insufficient cooling during storage 2. Containment failure. OR gate is once
again used in the fault tree to indicate the relationship. Cooling is very important during
storage and loss in the level of pool water has the potential to cause major problems which
will ultimately lead to the top event. Cooling can also be lost if the electrical system fails to
operate. In the fault tree, the relationship is again denoted with an OR gate for the subordinate
event to occur. “Loss of pool water” and “Failure of electrical system” are shown with a
circle representing basic events.
Containment failures can occur due to corrosion. The containers are made of steel and
increased oxygen content may corrode the steel making the container weak. There are
possibilities of leakage to occur. Also change in the chemical conditions of the nuclear
material in storage could alter the strength of the containment. “Failure due to corrosion” and
“change in chemical conditions” are the two basic events that will lead to a containment
failure. The relationship between the two levels is denoted with an OR gate.
Failure during Glasification: It is the process of turning radioactive waste into glass. In a
hardened state, the radioactive material is encased, to prevent it from leaking. Waste, stored
in tanks, is combined with molten glass. The glass is then sealed in steel containers. The
waste should remain stable as the radioactivity dissipates. Failure during glasification process
can happen because of two reasons; Temperature increase can lead to a devitrification
process that might lead to leakage of radioactive waste. Failure of air filters will cause an
increase in temperature, which again will lead to devitrification and finally leakage. The
relationship is shown with an OR gate.
Failure during interim storage: There are four pathways that can lead to a failure during
interim storage. If the steel containers are of poor quality and are not strong enough to hold
the waste, it will become a pathway for leakage of radioactive waste into the environment.
Reduced ventilation and loss of cooling will lead to increase in temperature of the waste,
which might alter the strength and durability of the steel container. In the fault tree, these
basic events are once again connected with an OR gate to show their relationship with the
upper node.

25
Failure during long- term disposal of waste: This path is discussed in detail in the next
section.
4.2: Failure during long-term disposal of waste
In the previous section, we discussed and built a fault tree for the different possible ways for
a nuclear waste to come into contact with the environment. This section will concentrate
solely on the last part of the previously built fault tree, “failure during long-term disposal of
waste” and expanding it further by building another fault tree for it and performing the
necessary analysis to find the probability of a possible release of nuclear waste from a waste
repository. Long term disposal is the final stage for any nuclear waste and it is at this point
that the public start to panic and oppose to the idea of permanently disposing it in the deep
pits. As mentioned before, the anti-nuclear groups use the uncertainty in the safety of long
term disposal as a reason to lobby against nuclear power.
So let us consider a nuclear waste repository site with the following barrier system characters;
A Glass Matrix that restricts release of radioactive material
A Steel Canister, covering the glass matrix; that prevents penetration of water into the
glass matrix
Bentonite clay that holds the canister. It restricts water penetration, delays the release
of material
Figure 6 : An example model of geological repository [3]

26
So let us discuss the probability of failure for a geological repository over a period of 1000
years. The fault tree for the same is given below.
Figure 7: Fault tree model for failure during long-term disposal
The top event, as seen in the above figure, is the “release of radioactive material from a
disposal site” and there are three possible pathways of which one is an engineered effect. The
first level of sub-ordinate events (Failure of barrier system, Collisions with the site, Seismic
activities) are all related with an OR gate to the top event. Any kind of collision that can
have a huge impact on the repository site is an undesirable event and three paths have been
identified for this; 1. Activities caused by nuclear weapons; war etc 2. Aircraft collisions and
3. Accidental drilling in the disposal site. Of the three, accidental drilling has a higher
probability of occurrence than the other two events. The probability calculations for each of

27
the events will be shown in the following sections. External events such as volcanic activities
or earthquakes depend on the geography of the location. Probability estimation of such kind
of seismic activities cannot be predicted correctly. Timescale for such predictions is very hard
to set.
Let’s consider the failure of the barrier system. The waste from the nuclear power plant is
permanently disposed in a repository which is a multiple barrier system consisting of a
combination of both natural and engineered barrier. After the waste package is placed and
the tunnel is filled, the engineered barrier will begin to degrade. Gradual degradation of the
barriers caused by the increased level of inflowing groundwater is by far, the most likely
failure mechanism. The Bentonite buffer will begin to swell and adsorb the water that
reinvaded into the zones of the host rock. But because of the low hydraulic conductivity of
the backfill, this resaturation process will take a long time to completely have some effect on
the barrier system. Corrosion will occur when this wetting comes in contact with the steel
canister. The rate of corrosion is affected by the build of oxyhydroxides. Once the canister is
corroded, the fluid will come into contact with the glass matrix. Once the fluid is out of the
matrix, it is transported to the surface of the environment and thus comes in contact with the
environment. But the rate at which the transportation occurs depends entirely on the rate of
diffusion of the Bentonite pores, the magnitude of different retardation process that will occur
and on the level of water flow into the host rock.
Following the laws Boolean expression, the below equations are obtained for each of the
levels.
Top event: TP1 = GT1 + GT2 + GT4
Where GT1 = (GT5)* (GT6) * (GT7)
GT7= GT8 + GT9 +GT11
GT2= EV2 +GT10 + EV3
GT4= EV4 + EV5
Substituting in the expression for top event, we get;
TP1 = ((GT5)* (GT6) *(GT8 + GT9 +GT11)) + (EV2 +GT10 + EV3) + (EV4 + EV5)
The FMEA method that is employed to predict the unknown probabilities is shown in
Appendix B. Substituting the probabilities of each failure event in the above equation, the
probability for the top event to occur is 2.4963 x 10⁻¹⁰
.

28
4.3 Public Perception towards Nuclear waste and Disposal
A survey, using SURVEY MONKEY is taken to understand public perception towards
nuclear waste and disposal. This section will explain the questions along with their choices
asked in the survey and the reason for choosing the given set of questions. The results
obtained from this survey will be dealt with in the next section.
Description of Survey (for the public):
“Nuclear waste disposal is an unresolved issue in most of the countries that utilize nuclear
energy to produce electricity. This survey is to understand public perception towards nuclear
waste and disposal.
As a participant, you are expected to only read the below questions carefully and answer
them to your level best. This survey is solely for research purpose and will remain
confidential. It is completely voluntary and should you wish to quit the survey, you are free to
do so any time.
Thank you for your time!”
Survey Questions:
1. The most practical way to produce electricity to meet demands is with a. Fossil fuel
b. Nuclear c. Renewable
Reason: Power production by means of coal is hugely relied upon in India. As recently as
August 26th
2013, there have been talks on installing 28 more power projects in India.
Nuclear power is the next power generation technique used to generate power. Renewables
are greatly in use in the country but ways to use this power is still a question. Answer to this
question will help to form an opinion about how many people think nuclear power can be
used as a solution to the power crisis in the country. This will help ascertain how many prefer
nuclear over the other two forms of power generation.
2. Exposure to harmful radioactive material can cause more harm to the human health
than drinking alcohol or smoking.
a. Strongly agree b. Agree c. Neutral d. Disagree e. Strongly Disagree
Reason: It is a common belief that radioactive material will cause more harm than drinking
alcohol or smoking. While it might be true, most people do not realise that more than half of

29
the Indian population is exposed to smoking and drinking alcohol, while exposure to
radioactive material is only confined to a certain location. Besides, the population is exposed
to so many other harmful materials and chemicals that it is difficult to solely pin down the
harm caused on radioactive materials. For e.g. there are chemical substances that enter into
the human body through the food and other substance that is consumed. Answer to this
question will help determine if the public perceive radioactive material to cause more harm
than regular drinking alcohol and smoking.
3. Disposal of nuclear waste in a geological site is the safest solution to mankind and
the environment.
a. Strongly agree b. Agree c. Neutral d. Disagree e. Strongly Disagree
Reason: A solution has to be reached sooner or later with regards to nuclear waste disposal
and disposing in a geological site is one possible practical solution. There have been other
options like transporting the waste into outer space, using the ice caps as a disposing site and
so on. Though they sound as a viable option, they are impractical. This question is asked to
analyse how many people understand and agree along with other scientists to use a geological
site to dispose nuclear waste. When a participant chooses option C. Neutral, then it is to
understand that the person either has no knowledge about the topic under discussion or is
neutral towards the entire nuclear proceeding that is taking place in the country.
4. If nuclear waste is buried in solid rock, below the Earth's surface, it will be isolated
from the living environment for 10,000 years.
a. Strongly agree b. Agree c. Neutral d. Disagree e. Strongly Disagree
Reason: From the previous fault tree results and from prior research, it is understood that
when the barrier system fails to function efficiently, it takes a long time for the waste to seep
through the system to reach the environment; say 10,000 years. By the time this reaches the
environment, most of the radioactive material would have lost its radioactivity. There is also
a linkage between questions 3 and 4. Those who agree with question 3 should normally agree
with question 4. If this is not the case, then it can be concluded that public awareness is less.

30
5. Are you aware of the way nuclear waste is reprocessed and prepared for storage? a.
Yes b. No
6. Are you aware of the risk assessment techniques employed to ensure environmental
safety? a. Yes b. No
7. The results published by the media about nuclear power and its development are
always true and exact.
a. Strongly agree b. Agree c. Neutral d. Disagree e. Strongly Disagree
8. How do you educate yourself about the nuclear industry and its developments
a. Media b. Personal research c. None of the above
Reason: The above questions are asked to understand if the public is actually aware of the
techniques that are employed in a nuclear industry or if it is just blind faith in the media. It is
well known that the media plays a very important role in the growth of an industry. The news
is catered according to what news will attract the public. If a certain publisher chooses to
support the anti-nuclear campaign, then the news released will portray nuclear power and its
relation to terrorism or other similar activities. Before a person chooses to protest against
something, some knowledge has to be gained about the sector, not just from the media, but
from other academic publications and journals that state numbers facts and views of other
scientists working in the field; in short, personal research is important.
9. What type of person would you categorize yourself as?
a. Pro-nuclear b. Neutral c. Anti-nuclear
Reason: Categorizing one into the above three options will help classify how much the public
accepts nuclear power. Those who perceive nuclear power to be a risk and a potential threat
to the environment will not support this technology and will naturally fall under the anti-
nuclear category.
It is important to understand that no technology can survive without the support of the
public. It is necessary to recognize what they think about a certain technology and show or
prove to them the good uses of it. A survey is just one way of “asking people”. The ability to
investigate respondents is a task by itself. It helps to collect a wide range of data (attitudes,
opinions, beliefs, values, behaviour, factual). Addressing the concerns of the public is
mandatory and survey will help to understand what they need/think.

31
Chapter 5 Discussion and Conclusions
From the technical risk analysis that was conducted using fault trees, it is seen that the
probability for the radioactive material to reach through the various paths designed is
approximately 2.4963 x 10⁻¹⁰
; which means that it has no immediate impact on the
environment even if the barrier system fails to work. With respect to the Indian scenario,
there are still no concrete talks about a permanent disposal, so this analysis is based on
assumptions and other historical data. When actual data is produced, this risk analysis
technique can then be employed to calculate risks. Also, the nature of the geological structure
will not remain constant throughout. Changes in the geological background might affect the
working of the barrier. Hence, continuous monitoring and update of the numbers is essential.
Nevertheless, geological disposal is a safe and viable option and the engineered barrier
system will prevent the radioactive materials from reaching the environment. Safe disposal is
definitely feasible with the current technology.
Waste is a product of all industries and nuclear power is responsible for some types of waste
which are particularly unattractive. But, such wastes are produced only in low quantities
when compared to the end product value which is electricity. Hence repositories involving
high-level barrier system design can be used to provide a high degree of safety. The only
issue now is to convince the public that such kind of technology is safe to use. Nuclear power
is a much need amenity for the power sector in India and considering the regular power-cuts
for almost 15 hours a day, the country can very well use the power generated from a nuclear
source, apart from the electricity generated from hydro, fossil fuel and renewable. Giving up
this additional source of power is harmful for the country. When it was necessary to ascertain
the radiation levels in the surrounding areas, it was found to be minimal when compared to
the upper limits as prescribed by the Atomic Energy Regulatory Board (AERB). The Nuclear
Power Corporation has taken steps to create awareness and spread confidence among the
civilians by issuing booklets and publicising through radio, but the task goes in vain. People
are still not satisfied with the effort that is taken by the government to show that nuclear
power is safe.
Let’s analyse the responses collected from the survey. The survey was distributed through
online social networking site; Facebook and the targeted number for this survey was 50. The
number of people who answered the survey was 59. The participant was not required to

32
disclose any personal details, such as name, phone number or email address. Since the
account created in survey monkey was a basic one, it did not include options to download the
results and so the print-screen option has been used instead.
Looking into Questions 1 and 2, we see that 55.9 % think renewables is the most practical
way of producing electricity. But the problem is, they cannot give a stable output and as of
Aug 29th
2013, the population is once again experiencing power cuts because of the lack of
power supply from the wind energy sector. So, power generation through renewables cannot
be completely relied upon. More stable source of power is required for maximum production.
Out of the 59 who answered, only 13 believe nuclear to be a practical solution to the power
crisis that India is facing, which is an indicator to the level of confidence the public has on
nuclear power. The reason behind this can be seen in question 2; where 66.1 % strongly feels
that exposure to radioactive material will cause more harm than drinking alcohol or smoking.
They perceive it to be harmful by just reading the question. What they do not realise is that
exposure to radioactive material is confined to a very close proximity, whereas drinking
alcohol and smoking is a day to day activity of the population. Even passive smoking has its
own effect on the human body and it has been medically recorded and proven. Clearly, public
perception matters and questions 1 and 2 are a direct link to what they think.

33
Let’s look into questions 3 and 4. When asked if disposal of nuclear waste in a geological site
is the safest solution, it can be seen that the answers are almost equally divided. 30.5 % of the
respondents agree to the question, while there a 28.8 % neutral to the question. It can be
concluded that the reason for them to agree to it, is perhaps because of the great reduction in
the amount of radioactivity. Only 26 out of the 59 believe it be a safe solution, whereas 16
out of the 59 think it is not a safe solution. If the survey were to be conducted for a longer
period, covering more number of people, then it acceptable to assume that this trend might
have continued. In question 4, we can again see that the majority chose between “agree” and
“neutral”. Generally when a respondent chooses the “neutral” option, it can be assumed that
they either do not have prior knowledge about the topic under discussion or they do not want
to take sides; as in, remain neutral. But having a majority of the respondents falling under this
category is not good too. It means that the government has failed to reach out to the majority
of the population and convince them to support nuclear power. Also, 17 out of the 59 who
took the survey do not agree to question 4. This can be because of 2 reasons, lack of
knowledge or fear. There might be some who think that the ground cannot hold so much of
waste for such a long period of time, which is not true. This might be because of the lack of
knowledge in this field or because of the blind belief in what the media gives to the society.
Either way, there is still a lot of work that has to be done in order to gain trust.

34
In questions 5 and 6 , it can bee seen that the majority of the people who answered the survey
do not know about the technical processes undertaken to assure safety. Now, is the public at
fault for not knowing about it or is it the goverments fault for not keeping the records open to
the public? There have been concerns raised by the anti-nuclear groups stating that the
goverment is reluctant on revealing the findings of the environmental impact assessments .
this makes it easier for them to create fear among the people. On the other hand, there are
journal papers and other case studies that are available and open for public use. Only those
who interested will take the pain of downloading the documents and reading them. The rest
will only believe what they hear. Going against a technology with no prior knowledge about
it or self research to ascertain the details is a total act of injustice . Once an image is formed
with the public, it is very hard to change it and nuclear power is a clear example for it. The
goverment needs to act mor vigilantly because they can expect protests much worse when it
comes to choosing a proper disposal site.

35
In question 7, we see that 27 of them have a neutral opinion about the media publications on
this topic and 25 out of 59 believe that the media publications are not always true. In question
8, it can be seen that 26 out of 59 educate themselves through the media. It is now confusing
to analyse what they exactly understand from the media when most of them believe that
media does not give true facts. It can also be assumed that its not just the media who play a
role in casting a dim light on nuclear power. Politicians and policy makers also have a huge
role to play in this matter and it is very difficult for scientists to get past them to convince the
public. Also there is a 10% who do not use the media or personal research option to educate
themselves about nuclear power. It can be assumed that they are either with or against nuclear
power based on what they hear from their surroundings through conversations with others.
They form easy targets to talk to and manipulate their thoughts about nuclear. Spreading the
news about nuclear through pamphlets or public talks will help them to form an opinion by
themselves and help boost confidence level.

36
The final question shows us that 49.2 % are neutral towards nuclear power whereas there is a
27.1 % against nuclear. so it can be concluded that the majority either do not know which
side to take or are anti-nuclear, which is not a good thing. The various nuclear accidents
across different parts of the world have left the people to believe that nuclear power is
dangerous. Radiation exposure following the nuclear accident at Fukushima-Daiichi did not
cause any immediate health effects. It is unlikely to be able to attribute any health effects in
the future among the general public and the vast majority of workers. The only form of
health effects from the Fukushima accident are stemming from the stresses of evacuation and
unwarranted fear of radiation.
So what can we conclude from this study?
i) It has been shown that operating nuclear power plants does not cause cancer to the
residents of nearby communities from normal operations;
ii) Over the past 40 years nuclear power has in fact saved almost 2 million lives through a
real reduction in pollution by not burning fossil fuels and its resultant health impacts;

37
iii) Radiation has not harmed any of the people of Japan and is unlikely to do so in the future,
even after the biggest nuclear accident.
Considering these kinds of results, why aren’t we seeing this reported in the main stream
media? With this kind of story there should be universal praise of nuclear power and strong
support for its expansion. Frankly, if it were any technology other than nuclear that was
reported to have saved millions of lives we likely would have seen it in the headlines of
media report. So why is the world not blown away by this fantastic evidence of the benefits
to our lives of nuclear power?
The reality is that some people will never change their view of nuclear power and will oppose
it no matter what evidence is brought before them. Nuclear power is a positive hope for the
future. But overcoming fear is no easy task. Fear is a powerful emotion. It will take hard
work, commitment – and most of all - time. But if all goes well then there is a bright future
ahead. The time has come to get the message out and show how much nuclear power
contributes to society, and how necessary it is in a high energy resource intensive world. We
have both the pro and the anti nuclear sides debating about facts, but the most important thing
is how the facts feel. Perception of risk is not a purely rational, fact-based process. It is found
that risk perception is an affective combination of facts and fears, intellect and instinct,
reason and gut reaction. Research into how people perceive and respond to risk has identified
several psychological characteristics that make nuclear radiation particularly frightening:
• It is undetectable by our senses, which makes us feel powerless to protect ourselves, and
lack of control makes any risk scarier.
• Radiation causes cancer, a particularly painful outcome, and the more pain and suffering
something causes the more afraid of it we are likely to be.
• Radiation from nuclear power is human-made, and human-made risks evoke more fear than
natural threats.
• Nuclear power plants can have accidents and people are intrinsically more afraid of risks
associated with a single large-scale “catastrophic” event than they are of risks that cause
greater harm spread over space and time.

38
• Many people don’t trust the nuclear industry or government nuclear regulators and the less
we trust, the more we fear.
Whether this is rational or irrational, right or wrong, is irrelevant. It is, inescapably, how it is.
Our response to risk can pose a danger all by itself. Our fear of nuclear power has led to
energy economics that favour coal and oil for electricity, at great cost to human and
environmental health. Particulate pollution from fossil fuels kills tens of thousands of people
every year, and CO2 emissions fuel a potentially calamitous shift in global climate.
No amount of education or good communication can get around this. Subjective risk
perception is hard-wired into our architecture and chemistry. What governments can do is to
learn what psychological research has established: our perceptions, as real as they are and as
much as they must be respected in a democracy, can create their own perils.
With that understanding, government risk assessment can account not only for the facts, but
also for how the public feel about them and how it behaves. That way, conflict over nuclear
power and other risk issues can be reduced and wiser and more productive policies for public
and environmental health can be fostered.

39
REFERENCES
[1] Pawl Dowswell. The Chernobyl Disaster 26th April 1986. London: Hodder
Wayland; 2003.
[2] World Health Organisation. Health Implications of Nuclear Power Production.
WHO. Report number: ISBN 9290201037, 1977.
[3] Ian.G.McKinley. The Management of Long-lived Nuclear waste. Energy Policy
1992; (10): 683-692.
[4] TradeTech. Nuclear Fuel cycle. http://www.uranium.info/nuclear_fuel_cycle.php
(accessed 15 July 2013).
[5] OECD. The Safety of the Nuclear Fuel cycle. OECD. Report number: ISBN
9264138242, 1993.
[6] NRC. Spent Fuel Pools. http://www.nrc.gov/waste/spent-fuel-storage/pools.html
(accessed 15 July 2013).
[7] R.R Fullwood R Hall (Robert). Probabilistic Risk Assessment in the Nuclear
power industry: Fundamentals and Applications. New York: Pergamon Press;
1988.
[8] Cohen BL. Public Perception versus Results of Scientific Analysis. Reliability
Engineering and System Safety 1998; 59(): 101-105.
[9] Agrawal SK, Chauhan A,Mishra A. The VVERs at Kudankulam. Nuclear
engineering and design 2005; 236(2006): 812-835.
[10] Venkatesan J. Another PIL against Kudankulam project', The Hindu. 17
September 2012: 13.
[11] Farmer FRN. Nuclear Reactor Safety. : Academic press; 1977.
[12] Norman J. McCormick. Reliability and Risk Analysis: Methods and Nuclear
Power Applications. New York: Academic press; 1981.
[13] Kalyan Ray. India keen on having nuclear waste repository', Deccan Herald.
02 September 2013: 14.
[14] Institute for Healthcare Improvement (2004) Failure Modes and Effects
Analysis (FMEA)

40
Appendix A: Pressurised Water Reactor
A nuclear reactor produces and controls the release of energy from splitting the atoms of
certain elements. In a nuclear power reactor, the energy released is used as heat to make
steam to generate electricity. In a research reactor the main purpose is to utilise the actual
neutrons produced in the core. In most naval reactors, steam drives a turbine directly for
propulsion.
The principles for using nuclear power to produce electricity are the same for most types of
reactor. The energy released from continuous fission of the atoms of the fuel is harnessed as
heat in either a gas or water, and is used to produce steam. The steam is used to drive the
turbines which produce electricity (as in most fossil fuel plants). The pressurised water
reactor (PWR) has water at over 300°C under pressure in its primary cooling/heat transfer
circuit, and generates steam in a secondary circuit. The less numerous boiling water reactors
(BWR) make steam in the primary circuit above the reactor core, at similar temperatures and
pressure. Both types use water as both coolant and moderator, to slow neutrons. Since water
normally boils at 100°C, they have robust steel pressure vessels or tubes to enable the higher
operating temperature. (Another type uses heavy water, with deuterium atoms, as moderator.
Hence the term ‘light water’ is used to differentiate.)
Components of a nuclear reactor:
There are several components common to most types of reactors:
Fuel: Uranium is the basic fuel. Usually pellets of uranium oxide (UO2) are arranged in tubes
to form fuel rods. The rods are arranged into fuel assemblies in the reactor core.
In a new reactor with new fuel a neutron source is needed to get the reaction going. Usually
this is beryllium mixed with polonium, radium or other alpha-emitter. Alpha particles from
the decay cause a release of neutrons from the beryllium as it turns to carbon-12. Restarting a
reactor with some used fuel may not require this, as there may be enough neutrons to achieve
criticality when control rods are removed.
Moderator : Material in the core which slows down the neutrons released from fission so that
they cause more fission. It is usually water, but may be heavy water or graphite.

41
Control rods: These are made with neutron-absorbing material such as cadmium, hafnium or
boron, and are inserted or withdrawn from the core to control the rate of reaction, or to halt it.
In some PWR reactors, special control rods are used to enable the core to sustain a low level
of power efficiently. In fission, most of the neutrons are released promptly, but some are
delayed. These are crucial in enabling a chain reacting system (or reactor) to be controllable
and to be able to be held precisely critical.
Coolant: A fluid circulating through the core so as to transfer the heat from it. In light water
reactors the water moderator functions also as primary coolant. Except in BWRs, there is
secondary coolant circuit where the water becomes steam.
Pressure vessel or pressure tubes: Usually it is a robust steel vessel containing the reactor
core and moderator/coolant, but it may be a series of tubes holding the fuel and conveying the
coolant through the surrounding moderator.
Steam generator: It is a part of the cooling system where the high-pressure primary coolant
bringing heat from the reactor is used to make steam for the turbine, in a secondary circuit.
Reactors may have up to four 'loops', each with a steam generator. These are large heat
exchangers for transferring heat from one fluid to another – here from high-pressure primary
circuit in PWR to secondary circuit where water turns to steam. Each structure weighs up to
800 tonnes and contains from 300 to 16,000 tubes about 2 cm diameters for the primary
coolant, which is radioactive due to nitrogen-16 (N-16, formed by neutron bombardment of
oxygen, with half-life of 7 seconds). The secondary water must flow through the support
structures for the tubes. The whole thing needs to be designed so that the tubes don't vibrate
and fret, operated so that deposits do not build up to impede the flow, and maintained
chemically to avoid corrosion. Tubes which fail and leak are plugged, and surplus capacity is
designed to allow for this. Leaks can be detected by monitoring N-16 levels in the steam as it
leaves the steam generator.
Containment : The structure around the reactor and associated steam generators which is
designed to protect it from outside intrusion and to protect those outside from the effects of
radiation in case of any serious malfunction inside. It is typically a metre-thick concrete and
steel structure.

42
Pressurised Water Reactor (PWR)
This is the most common type, with over 230 in use for power generation and several
hundred more employed for naval propulsion. The design of PWRs originated as a submarine
power plant. PWRs use ordinary water as both coolant and moderator. The design is
distinguished by having a primary cooling circuit which flows through the core of the reactor
under very high pressure, and a secondary circuit in which steam is generated to drive the
turbine. In Russia these are known as VVER types - water-moderated and -cooled. A PWR
has fuel assemblies of 200-300 rods each, arranged vertically in the core, and a large reactor
would have about 150-250 fuel assemblies with 80-100 tonnes of uranium. Water in the
reactor core reaches about 325°C , hence it must be kept under about 150 times atmospheric
pressure to prevent it boiling. Pressure is maintained by steam in a pressuriser. In the primary
cooling circuit the water is also the moderator, and if any of it turned to steam the fission
reaction would slow down. This negative feedback effect is one of the safety features of the
type. The secondary shutdown system involves adding boron to the primary circuit. The
secondary circuit is under less pressure and the water here boils in the heat exchangers which
are thus steam generators. The steam drives the turbine to produce electricity, and is then
condensed and returned to the heat exchangers in contact with the primary circuit.

43
Appendix B: FMEA Calculation
The following FMEA calculation is done to determine failure rates for those events whose
probabilities were not known. In practices, such calculations are done in groups but because
this is an individual presentation, the below calculations are made by just one person.
For a period of one year;
Steps in
the
process
Failure
mode
Failure
causes
Failure
effects
Likeliho
od of
occurren
ce (1-10)
Likelih
ood of
detecti
on (1-
10)
Sever
ity (1-
10)
Risk
Profil
e
Num
ber
(RPN
)
Actions
to
reduce
occurren
ce
1
Unfavour
able
chemical
conditions
Will
lead to
the
failure
of the
barrier
system
Chang
es in
the
chemic
al
conditi
ons of
the
radioac
tive
materia
l stored
Will
result in
the
release
of
radioact
ive
material
into the
environ
ment
3 2 8 48 Ensure
favourab
le
chemical
conditio
ns of the
material
2
Increased
Oxygen
content
Will
cause
corrosi
on of
steel
contai
ner
Increas
e in
oxygen
level in
the
reposit
ory site
Corrosi
on of
steel,
thereby
leading
to
leakage
of
stored
radioact
ive
waste
3 2 8 48 Provide
corrosio
n
resistant
steel
containe
r.

44
3
inflowing
ground
water
increase
Will
transp
ort
radioa
ctive
waste
to the
surface
Chang
es in
geogra
phical
structu
re,
leading
to
cracks
Will
lead to
exposur
e of
radioact
ive
material
3 2 8 48 Careful
location
of site
Many different strategies for the management of
HLW have been studied. 5 Perhaps the most attractive,