public company accounting oversight board - m … · public company accounting oversight board –...
TRANSCRIPT

Public Company Accounting Oversight Board – Dr. Michael Kwatinetz, CPA (inactive)
Written Statement
Issue: What is the best means of preventing audit failures?
Board’s Question: What viable alternatives exist to mandatory rotation of auditors that would enhance Independence, Objectivity and professional skepticism of auditors thereby leading to better quality audits which in turn reduce audit failures?
1. I won’t enumerate the potential benefits of audit rotation as that appears to be a built in assumption and the potential benefits have been well documented by the Oversight Board.
2. I would like to list a number of concerns I have regarding Auditor Rotation: a. Cost – the cost of an audit would increase, at a minimum for the first two years of the new relationship.
Besides all the extra work in becoming familiar with the business, a new firm would have to review basic documents (that existing auditors don’t need to repeat their work on each year). Examples might be: all leases, key contracts with suppliers and customers that haven’t changed from the prior year, historic basis for assets, etc.
b. Selling Costs for audit firms – with rotation, the frequency of selecting new auditors would require the audit firms to expend more dollars on selling and marketing
c. Internal Cost – when a firm changes auditors, internal staff of that firm are required to spend more time in the selection process. Subsequent to the selection, extra time is required to educate the new audit firm on the company’s business, respond to basic requests and correct erroneous findings. An informal survey indicates that this varies from 5%‐15% additional time.
d. Risk of Unfamiliarity – as an audit firm works longer on a client, the audit professionals become increasingly familiar with the business, internal controls, accounting policies, etc. And our company’s experience is that an audit is fine‐tuned each year where the auditors can dig deeper and deeper as they become more and more familiar with business practices. Such knowledge decreases the potential for the firm being audited to have material misstatements that go undetected. While there is some offsetting risk that auditors that become too familiar with a client might be inclined to allow something to pass, I believe that is a far lesser risk than that of unfamiliarity.
e. Risk of Lower Industry Expertise – the number of major, international, audit firms has been reduced severely in recent years. And in some industries there may be only one with strong expertise regarding a particular industry. Forcing a company that is using the one firm with strong knowledge of its industry to rotate to someone else may substantially increase the risk of material misstatements being missed. It also has several other consequences. A firm that doesn’t understand an industry may require the entity to change accounting methods in a way that, while technically correct, lowers the quality of financial statements. A firm that has numerous clients in the same industry can share knowledge of “best practices”.
f. Opinion Shopping – currently, there is a stigma that can be attached to switching audit firms. With rotation that stigma will disappear and the ability to “opinion shop” will be enhanced.
g. Loss of Valuable Advice – in the dialog I’ve seen, little is mentioned of the potential that auditors can provide very good advice to a company in helping them better understand their business. Rotation would reduce the possibility of this (at least in the first few years after a change) and in turn, potentially weaken some companies.
h. Unintended Consequences – when restrictions were placed on Wall Street research analysts few realized that an unintended consequence would be weakening the IPO market and creating more market volatility, especially regarding smaller public companies. Any major change in the way core processes work in auditing has the potential for parallel unintended consequences.

3. Potential Alternatives to Mandatory Rotation a. Partner Rotation within a firm – such a process does create added independence while preserving
the ability for the partner rotated out to still be available to the new partner. However, it doesn’t solve the key issues that concern the Oversight Board, namely the potential that an audit firm may become too close to a client or concerned about losing the “annuity” associated with the audit. So, while I believe partner rotation is beneficial, it does not appear to be sufficient to overcome some of the issues that have caused the board to consider mandatory rotation.
b. Independent Manager Placement – I believe this is very viable as an alternative to mandatory rotation. And think the board ought to consider it. What follows below is a rough sketch of how it could work. If the Board agrees that this might lead to an alternative to mandatory rotation, it should modify what is outlined below to create an improved process that helps accomplish the goals. This requirement could be in addition to audit firms requiring its partner on the audit to change every 5 years (or so)
i. Every major firm would require each of its audit managers to participate in audits by other firms for at least one year before they could be considered for partner.
ii. Every audit firm would be required to utilize at least one manager every other (or third) year from another firm on every major audit (or possibly even annually for larger audits with multiple managers). The manager (s) would be randomly chosen but would need to be from another firm. This could be in addition to partner rotation within the same firm.
iii. The manager(s) selected would replace one of the prior year’s managers (from the firm conducting the audit) and participate in audit planning, have access to all work papers and participate in each step of the audit. At the end of the audit, the manager would be required to fill out a short report commenting on issues he or she thought relevant to the Oversight Board (which could be shared with the client’s audit committee).
iv. This process would introduce an independent player into the audit without adding to cost or reducing the overall expertise and knowledge of the audit team. Each person in rotation would continue to be paid by their existing firm.
v. Since audit firms would be aware that an independent manager would be part of their team (every other year), they would have extra inducement to be more independent, more objective and more skeptical on every audit.
c. If independent manager placement is adopted as an alternative to mandatory rotation, and an audit firm was found to have a number of deficiencies related to a specific client, audit rotation for that client could be mandated by the PCAOB.
4. Other Issues that are relevant to prevent misleading investors. I assume that the broader issue for the PCAOB is to ensure that financial statements are of the highest quality so that users of these statements are properly informed for decision making. In considering alternatives to auditor rotation I am responding to the broader question here. a. Financial Reporting Standards have increasingly moved towards “purist” accounting
i. In theory everyone should want accounting standards to lead to the most correct representation of a company’s financial results. But what if a requirement that is more theoretically correct (which appears to be the goal of current accounting standards) also leads to inconsistent reporting among companies in the same industry, creates more opportunity for misstatements of results (that are difficult for auditors to detect), reduces transparency to ordinary users of financial statements and/or adds cost that may outweigh the benefits? I believe that setting of accounting standards should take each of these issues into account and that material misstatements would be reduced if that was done. Currently, these issues do not appear to be priorities when creating accounting standards.

ii. In a number of areas of reporting, accounting standards are moving more towards methods that give an appearance of enhanced objectivity when in fact they are more subjective than ever. While this, in theory, can be audited, in practice the knowledge to do so is unlikely to be possessed by the auditor. So while this may create an illusion of better theoretical accuracy, in practice it can lead to inconsistent reporting by comparable companies and the potential for increased misstatements.
b. Because Financial Reporting Standards do not place understanding current operating performance as the priority, many investors rely on company proforma statements which are subject to less scrutiny and regulation but better reflect ongoing earnings potential.
i. A few examples of material differences between GAAP and Proforma earnings include Salesforce.com, Zynga and Nvidia. Wall Street Research Analyst reports focus completely on proforma earnings and barely mention the GAAP number.
ii. For fiscal 2012 Salesforce reported a GAAP earnings per share loss of (0.09) and proforma earnings of $1.36. In the Credit Suisse research report shown in Attachment 1, no mention of GAAP earnings appears on the first page and proforma earnings (non‐GAAP) is what is referred to as EPS in multiple places on the page. On the second page, the entire historic and projected income statement is shown based on pro forma results with the GAAP EPS appearing, almost like a footnote, underneath. On page 3 of the attachment we switch from the Credit Suisse report to a table showing the items that the company provided to reconcile pro forma earnings with GAAP earnings.
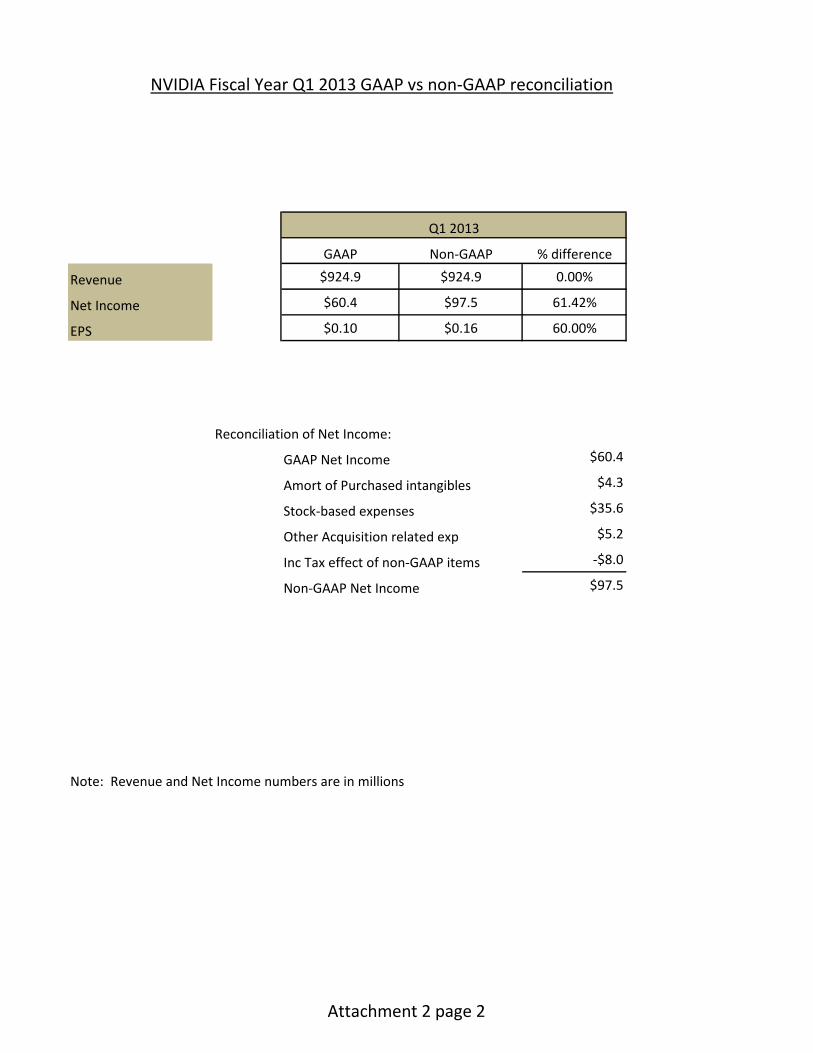
iii. For Q1 of fiscal 2013 Nvidia reported GAAP earnings per share of $0.10 and proforma earnings of $0.16. In the first page of Attachment 2 we show the beginning of the Nvidia CFO’s commentary on results. Gross margins, operating expenses, net income and earnings per share all differ between the non‐GAAP (proforma) and GAAP reporting. The second page of Attachment 2 has a table showing the items that the company provided to reconcile proforma earnings and GAAP earnings.
iv. For the first quarter of fiscal 2012, Zynga reported a GAAP earnings loss of ($85 million), proforma “adjusted EBITDA” of $87 million profit and proforma net income of $47 million. This can easily lead to confusion and in fact Adam Martin wrote in The Atlantic Wire: “The first Reuters headline on Zynga’s first quarter earnings blared that the company had lost $85 million.” The article later points out: “The Associated Press reports: “Adjusted earnings of 6 cents per share beat Wall Street’s expectations.” The first number is the GAAP number (pretty much ignored by Wall Street analysts) and the second the proforma number. Since most reporting focuses on the analyst estimates (proforma) some individual investors may have taken an action after the initial Reuters report that was based on the mis‐belief that Zynga had missed estimates.
v. On page 3 of a Zynga information release titled “Q1 2012 Earnings GAAP to Non‐GAAP reconciliation” Zynga provides some of the reasons why they report pro forma (non‐GAAP) earnings (see Attachment 3). Zynga points out: “We believe that both management and investors benefit from referring to these non‐GAAP financial measures in assessing our performance and when planning, forecasting and analyzing future periods. We believe these non‐GAAP financial measures are useful to investors because they allow for greater transparency with respect to key financial metrics we use in making operating decisions and because our investors and analysts use them to help assess the health of our business.” The fact that investors and analysts that follow Zynga rely on proforma results leads to another issue – these results may not be reported in the same way, reducing the ability to compare performance of companies in the same industry. In the same information release (Attachment 3), Zynga states: “Other companies, including companies in our industry, may calculate bookings, adjusted EBITDA, non‐GAAP net income and non‐GAAP EPS differently, or not at all, which reduces their usefulness as a comparative measure.”

vi. While this discussion may seem a sidetrack from auditor rotation, it is very relevant to what I perceive as the Oversight Board’s broader goal of ensuring that users of financial statements are properly informed for decision making. Investors may buy or sell a stock upon hearing the initial GAAP number thinking the company has fallen far short of analyst estimates. In this case releasing GAAP earnings first can result in an investor making a wrong decision since analysts and the press have consistently been reporting non‐GAAP (proforma) earnings estimates as the expected earnings. And, as we’ve shown with examples, GAAP earnings may materially differ.
c. Financial Reporting Standards sometimes require “theoretically correct accounting” that is not useful in helping investors understand current operating results. For example, little effort has been made to require footnotes of items that may distort the investor’s view of the company.
i. While there are many areas that this could impact, one that I have substantial personal knowledge of is the lack of easily accessible information for an investor to separate organic revenue growth from acquired revenue growth. Since revenue growth influences a company’s valuation, this information is quite relevant as acquired growth won’t persist beyond one year.
ii. Purchase accounting does not consider revenue from any period prior to the acquisition to be part of the consolidated company’s history. Disclosure of the information required to separate organic from acquired revenue growth is not required and when offered is not standardized.
iii. This means that a company can purchase another that has half as much revenue as it and for the following 4 quarters it will appear that the acquirer’s revenue growth rate is 50% higher than it actually is. Since no disclosure is required, companies can decide whether or not to put this in their footnotes. Without having the information, investors could overprice the stock.
iv. While this may seem theoretical, as a Wall Street analyst I witnessed this exact situation when Compaq Computer acquired DEC. The company took the position that the (approximately) 36% reported growth in revenue (in q3 of 1998) was going to continue where an examination of the apples to apples comparison (not required in their reporting even as a disclosure) showed that organic revenue growth was actually negative (about ‐7%) for the combined entities (see Attachment 4).
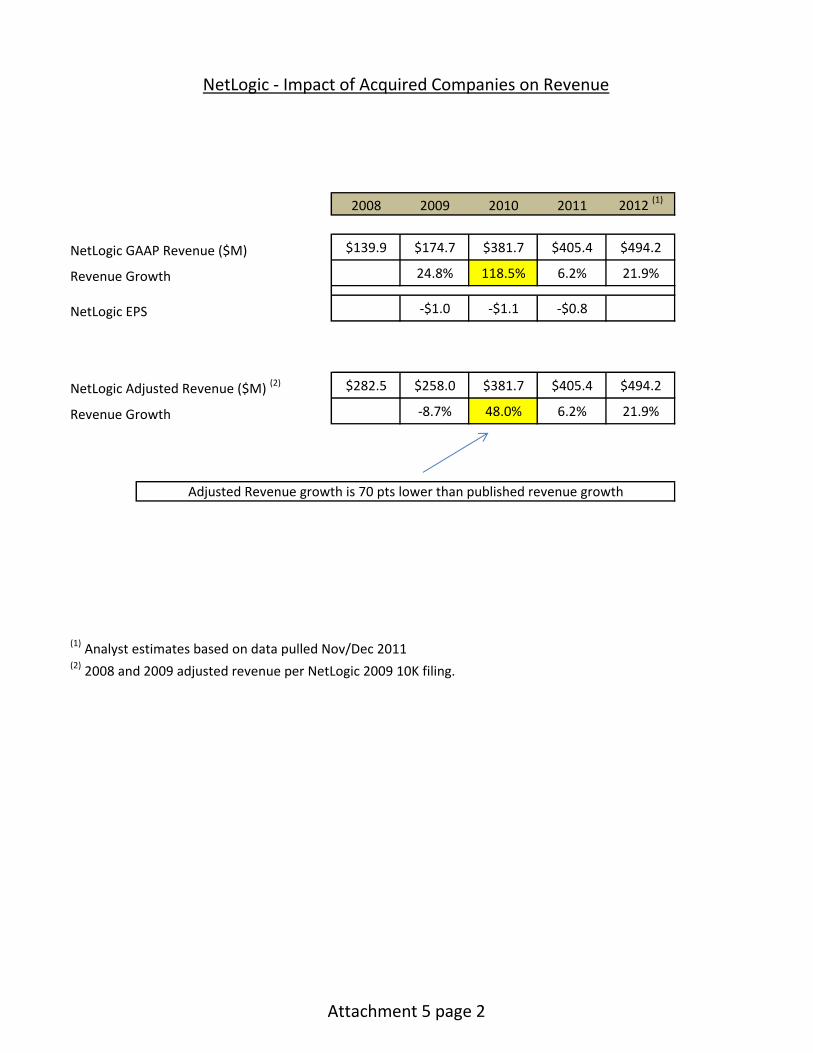
v. A more recent example of organic growth and reported growth differing widely is found in Net Logic’s 2011 10K. GAAP revenue is reported as $175 million in 2009 and $382 million in 2010, a growth rate of 119%. The actual organic revenue growth appears at most to be 48% (see Attachment 5 page 2). In this case, despite not being required to disclose it, the company revealed on page 47 of its 10K that 70% of reported GAAP revenue growth was from two of its acquisitions (see Attachment 5 page 1). While this implies that organic growth was the remaining 48%, I can’t be certain as there may have been other less material acquisitions not discussed or I may be mis‐interpreting the limited footnote. Unfortunately, since footnotes of this type are not required, disclosures are not standardized and it is difficult to be sure of this information. Why is this relevant? Knowing the accurate organic growth helps predict the following year’s revenue and earnings and can substantially impact valuation. A company whose revenue is growing 119% could be valued at a much higher multiple then one growing 48%.
5. Summary a. I believe the Oversight Board’s goal of reducing material misstatements in financial
reporting is a worthy one. b. The current approach appears to be very specific – whether or not to require rotation of
auditors. c. I believe this approach has more negatives than positives and could lead to higher costs
and less detection of misstatements.

d. I have suggested 2 other means of improvement. One is placing independent audit managers (from other firms) in larger audits on a rotating basis (in addition to partner rotation within the same firm). As part of this process, the PCAOB could require auditor rotation for any client of an existing auditor where the independent manager found substantial issues with audit quality. The second is shifting the emphasis of accounting standards from “purist accounting” towards accounting that is more relevant to users of financial statements and more easily auditable.
e. In any case, I think a very careful, explicit and objective cost/benefit analysis needs to be performed on all alternatives considered.
Note: Dr Kwatinetz has a PhD in mathematical modeling, an MBA in accounting and has earned his CPA. His past experience includes being a manager at Ernst & Young (where he was often asked to help on accounting theory), a CEO of a startup, President of a public company subsidiary, and being a highly ranked Wall Street Research Analyst. He has also served on the FASB Advisory Board. He is currently is one of the managing partners at Azure Capital.
Statement of Attachments
Attachment 1:
• Pages 1‐2: Credit Suisse Analysis of Salesforce.com • Page 3: Salesforce.com Fiscal Year 2012 GAAP vs. non‐GAAP reconciliation
Attachment 2:
• Page 1: NVIDIA CFO Commentary on First Quarter Fiscal Year 2013 Results • Page 2: NVIDIA Fiscal Year Q1 2013 GAAP vs. non‐GAAP reconciliation
Attachment 3: Page 3 from the Zynga Q1 2012 Earnings GAAP to non‐GAAP Reconciliation
Attachment 4: Compaq post DEC Acquisition‐Table showing difference between reported GAAP revenue growth and actual revenue growth Attachment 5:
• Page 1: Page 47 from NetLogic’s 2011 10K • Page 2: NetLogic – Impact of Acquired Companies on Revenue

DISCLOSURE APPENDIX CONTAINS ANALYST CERTIFICATIONS AND THE STATUS OF NON-US ANALYSTS. U.S. Disclosure: Credit Suisse does and seeks to do business with companies covered in its research reports. As a result, investors should be aware that the Firm may have a conflict of interest that could affect the objectivity of this report. Investors should consider this report as only a single factor in making their investment decision.
CREDIT SUISSE SECURITIES RESEARCH & ANALYTICS BEYOND INFORMATION®
Client-Driven Solutions, Insights, and Access
05 June 2012
Americas/United States
Equity Research
Software
Salesforce.com Inc. (CRM) ACQUISITION
Salesforce Makes a New Friend
Buddy Media Acquisition. Salesforce.com announced an agreement to acquire Buddy Media for $689 million, including $467 million in cash, $184 million in common stock, and $38 million in vested options and restricted stock. Buddy Media enables customers to publish content, place, and optimize social advertising and measure the effectiveness of social media marketing programs.
Analysis. As we highlighted in The Apps Revolution Manifesto —Volume 1: The Technologies and The Apps Revolution Manifesto —Volume 2: The Markets, we believe that the convergence of multiple technologies, including both social and cloud, is having more dramatic effects across both the B2B and B2C CRM markets than any other applications segment. Salesforce.com plans to tightly integrate Buddy Media’s technology with the social media content monitoring and listening capabilities of its Radian6 offering in order to launch a single comprehensive platform to address more stages of the social marketing lifecycle. We believe that Buddy Media strengthens Salesforce.com’s strategy to integrate social functionality with its sales, service, and marketing offerings. We expect Salesforce.com to remain acquisitive and potentially expand its offerings into community platform management (e.g., Bazaarvoice, Lithium, Get Satisfaction, Mzinga, IGLOO, or INgage), B2B marketing (e.g., HubSpot), and sales analytics. We view Salesforce.com well positioned to monetize the “social enterprise” opportunity across both the B2C and B2B segments of the CRM market and expect more details on Salesforce.com’s evolving Marketing Cloud during Dreamforce 2012.
Estimates. As a result, we are adjusting our FY2013 outlook to $3.012 billion in revenue and EPS of $1.47 from $2.950 billion and $1.61.
Outlook. We view Salesforce.com as the company in our coverage universe most leveraged to the massive technology refresh and expansion cycle across the B2B and B2C CRM segments (as well as the emerging, high-growth social enterprise and PaaS markets). Therefore, we reiterate our Outperform rating and target price of $185, which implies a NTM EV/UFCF multiple of 36.4x.
Share price performance
97
117
137
157
Jun-11 Sep-11 Dec-11 Mar-12
Daily Jun 06, 2011 - Jun 05, 2012, 6/06/11 = US$142.83
Price Indexed S&P 500 INDEX
On 06/05/12 the S&P 500 INDEX closed at 1285.5
Quarterly EPS Q1 Q2 Q3 Q4 2012A 0.28 0.30 0.34 0.43 2013E 0.37 0.39 0.30 0.41 2014E 0.41 0.54 0.48 0.61
Financial and valuation metrics
Year 01/12A 01/13E 01/14E 01/15E EPS - (Excl. ESO) (US$) 1.36 1.47 2.04 2.56 EPS (CS adj.) (US$) 1.36 1.47 2.04 2.56 Prev. EPS (CS adj.) (US$) — 1.62 2.12 2.67 P/E (CS adj., x) 98.2 90.7 65.7 52.2 P/E rel. (CS adj., %) 712.0 718.0 585.0 514.8 Revenue (US$ m) 2,266.5 3,012.0 3,879.7 4,889.9 EBITDA (US$ m) 418.8 569.7 784.5 962.4 Net debt (US$ m) -282 -170 -1,043 -2,171 OCFPS (US$) 4.16 4.75 5.79 7.28 P/OCF (x) 28.1 28.1 23.1 18.4
Number of shares (m) 138.00 Price/sales(x) 6.74 BV/share (Next Qtr., US$) 12.8 P/BVPS (x) 11.1 Net debt (Next Qtr., US$ m) -309.8 Dividend (Next Qtr., US$) — Dividend yield (%) —
Source: Company data, Credit Suisse estimates.
Rating OUTPERFORM* Price (05 Jun 12, US$) 133.74 Target price (US$) 185.00¹ 52-week price range 159.57 - 97.48 Market cap. (US$ m) 18,456.12
*Stock ratings are relative to the relevant country benchmark.
¹Target price is for 12 months.
Research Analysts
Philip Winslow, CFA
212 325 6157
Sitikantha Panigrahi
212 325 2686
Daniel Morrison
212 325 9827

05 June 2012
Salesforce.com Inc. (CRM) 2
Estimates Exhibit 1: Historical and Projected Income Statement US$ in millions, unless otherwise stated
Fiscal 2012 by Quarter Fiscal 2013 by Quarter
Apr-11 Jul-11 Oct-11 Jan-12 Apr-12 Jul-12E Oct-12E Jan-13E 2011 2012 2013E 2014E
Total revenue 504.4$ 546.0$ 584.3$ 631.9$ 695.5$ 727.3$ 771.1$ 818.1$ 1,657.1$ 2,266.5$ 3,012.0$ 3,879.7$
Subscription and support 473.5 509.3 549.2 594.3 655.2 685.7 727.5 772.6 1,551.1 2,126.2 2,841.0 3,672.4
% of revenue 93.9% 93.3% 94.0% 94.0% 94.2% 94.3% 94.4% 94.4% 93.6% 93.8% 94.3% 94.7%
Professional services and other 30.9 36.7 35.1 37.6 40.2 41.6 43.5 45.5 106.0 140.3 171.0 207.3
% of revenue 6.1% 6.7% 6.0% 6.0% 5.8% 5.7% 5.6% 5.6% 6.4% 6.2% 5.7% 5.3%
Cost of subscription and support 66.1 72.8 78.8 82.9 91.3 97.4 103.7 109.4 194.5 300.7 401.7 515.7
% of subscription and support 14.0% 14.3% 14.4% 14.0% 13.9% 14.2% 14.3% 14.2% 12.5% 14.1% 14.1% 14.0%
Cost of professional services & other 24.2 27.4 28.1 31.0 35.6 35.5 37.8 39.2 103.4 110.7 148.1 179.0
% of professional services & other 78.3% 74.6% 80.2% 82.3% 88.3% 85.3% 86.8% 86.1% 97.6% 78.9% 86.6% 86.4%
Total cost of revenue 90.3 100.2 107.0 113.9 126.9 132.9 141.5 148.6 297.9 411.4 549.8 694.7
Gross profit 414.0 445.8 477.3 518.0 568.6 594.4 629.5 669.5 1,359.3 1,855.2 2,462.1 3,185.0
Gross margin 82.1% 81.7% 81.7% 82.0% 81.8% 81.7% 81.6% 81.8% 82.0% 81.9% 81.7% 82.1%
Operating expenses:
Research and development 57.5 62.2 63.9 65.9 79.1 83.0 90.2 94.8 169.0 249.5 347.0 438.0
% of revenue 11.4% 11.4% 10.9% 10.4% 11.4% 11.2% 11.7% 11.4% 10.2% 11.0% 11.5% 11.3%
Sales and marketing 229.4 253.6 274.5 289.1 324.4 333.8 370.1 368.5 732.2 1,046.6 1,396.7 1,764.4
% of revenue 45.5% 46.4% 47.0% 45.8% 46.6% 45.9% 48.0% 45.0% 44.2% 46.2% 46.4% 45.5%
General and administrative 72.1 72.5 73.7 79.3 85.2 87.2 93.4 101.4 220.5 297.6 367.4 463.1
% of revenue 14.3% 13.3% 12.6% 12.6% 12.3% 12.0% 12.1% 12.4% 13.3% 13.1% 12.2% 11.9%
Total operating expenses 359.0 388.3 412.0 434.4 488.7 504.0 553.7 564.7 1,121.7 1,593.7 2,111.1 2,665.5
Operating income 55.1 57.5 65.3 83.6 79.9 90.4 75.8 104.8 237.6 261.5 351.0 519.5
Operating margin 10.9% 10.5% 11.2% 13.2% 11.5% 12.4% 9.8% 12.8% 14.3% 11.5% 11.7% 13.4%
Stock options compensation expense 47.6 54.6 57.0 70.1 81.3 85.5 92.5 107.6 120.4 229.3 366.9 468.7
% of revenue 9.4% 10.0% 9.8% 11.1% 11.7% 11.8% 12.0% 13.2% 7.3% 10.1% 12.2% 12.1%
Interest and other, net 6.3 0.7 4.0 3.0 2.3 3.3 (0.2) (1.3) 20.7 14.1 4.1 10.8
Pretax income 61.4 58.3 69.3 86.6 82.2 93.7 75.7 103.5 258.3 275.6 355.1 530.3
Pro forma taxes 21.5 15.2 20.3 25.0 27.7 35.6 28.8 39.3 92.1 82.0 131.4 201.5
Effective tax rate 35.1% 26.1% 29.3% 28.8% 33.7% 38.0% 38.0% 38.0% 35.7% 29.7% 37.0% 38.0%
Pro forma net income 39.9$ 43.1$ 49.0$ 61.6$ 54.5$ 58.1$ 46.9$ 64.2$ 166.1$ 193.6$ 223.7$ 328.8$
Pro forma net margin 7.9% 7.9% 8.4% 9.8% 7.8% 8.0% 6.1% 7.8% 10.0% 8.5% 7.4% 8.5%
Pro forma EPS (fully-diluted) $0.28 $0.30 $0.34 $0.43 $0.37 $0.39 $0.30 $0.41 $1.22 $1.36 $1.47 $2.04
GAAP EPS (fully-diluted) $0.00 ($0.03) ($0.03) ($0.03) ($0.13) ($0.10) ($0.26) ($0.16) $0.47 ($0.08) ($0.66) ($0.23)
FD shares outstanding, (000s) 141.1 143.5 142.2 141.8 146.1 150.0 154.1 156.6 135.9 142.1 151.7 161.5
Fiscal Year Ends January
Source: Company data, Credit Suisse estimates.

GAAP Non-GAAP % difference
Revenue $2,267.5 $2,267.5 0.00%
Net Income -$11.6 $193.6 1768.97%
EPS -$0.09 $1.36 1611.11%
Reconciliation of Net Income:
GAAP Net Income -$11.6
Amort of Purchased intangibles $67.3
Stock-based expenses $229.3
Amort of Debt discount, net $12.3
Inc Tax effect of non-GAAP items -$103.7
Non-GAAP Net Income $193.6
Note: Revenue and Net Income numbers are in millions
FY 2012
Salesforce.com Fiscal Year 2012 GAAP vs non-GAAP reconciliation
Attachment 1 page 3

The fo SUMM
*Non‐Gacquisi
For thmidpowith o REVEN
Revenperce
(i
Rev
Gro
Ope
Net
Earn
(i
Rev
Gro
Ope
Net
Earn
G
P
C
T
CFO
ollowing infor
MARY RESULTS
GAAP earnings e
ition‐related cos
he first quarteoint of our exoperating exp
NUE
nue for first qent from $953
in millions ex
enue
ss margin
erating expen
income
nings per sha
in millions ex
venue
oss margin
erating expen
t income
nings per sha
(in mil
GPU
Professional S
Consumer Pro
Total
O Commen
rmation has b
excluded stock‐b
sts, a legal settle
er of fiscal yeaxpectations. Rpenses slightly
quarter of fisc3.2 million in t
GA
xcept per shar
ses
re
Non‐G
xcept per sha
nses
re
GA
llions)
olutions
oducts
P
ntary on Fi
been prepared
based compensa
ement in the fou
ar 2013, our eRevenue and y above, on a
cal 2013 was $the prior qua
AAP Quarterl
re data)
GAAP Quarte
re data)
AAP Quarterl
Q1 F
Page 1 of 5
irst Quarte
d on a GAAP
ation, amortizati
rth quarter of fi
earnings per gross margin
a GAAP and n
$924.9 millionrter.
ly Financial C
Q1 FY13
$924
50.
$390
$60
$0
erly Financial
Q1 FY13
$924
50.4
$348
$97
$0.
ly Revenue Co
Y13
$579.7
212.6
132.6
$924.9
er Fiscal Ye
basis except
ion of acquisitio
scal 2012, and t
diluted sharens were both on‐GAAP bas
n, at the high
Comparison
Q4 F
4.9
1%
0.5
0.4
.10
l Comparison
Q4 F
4.9
4%
8.0
7.5
.16
omparison
Q4 FY12
$621
221
109
$953
ear 2013 R
where noted.
n‐related intang
the tax impact as
e came in sligat the high‐esis.
h‐end of our o
FY12
$953.2
51.4% d
$367.7
$116.0
$0.19
n*
FY12
$953.2
52.5% d
$325.2
$158.1
$0.26
Q
1.5 d
1.9 d
9.8
3.2 d
Results
.
gible assets, othe
ssociated with s
htly above thend of our out
outlook, and d
Q/Q
down 3%
down 1.3 p.p.
up 6.2%
down 47.9%
down 47.4%
Q/Q
down 3%
down 2.1 p.p
up 7%
down 38.3%
down 38.5%
Q/Q
own 6.7%
own 4.2%
up 20.8%
own 3.0%
er
uch items.
he tlook,
down 3.0
GAAP Non-GAAP % difference
Revenue $924.9 $924.9 0.00%
Net Income $60.4 $97.5 61.42%
EPS $0.10 $0.16 60.00%
Reconciliation of Net Income:
GAAP Net Income $60.4
Amort of Purchased intangibles $4.3
Stock-based expenses $35.6
Other Acquisition related exp $5.2
Inc Tax effect of non-GAAP items -$8.0
Non-GAAP Net Income $97.5
Note: Revenue and Net Income numbers are in millions
Q1 2013
NVIDIA Fiscal Year Q1 2013 GAAP vs non-GAAP reconciliation
Attachment 2 page 2

Non-GAAP Financial Measures:We have provided in this presentation non-GAAP financial information including bookings, adjusted EBITDA, free cash flow, non-GAAP net income and non-GAAP EPS, as a supplement to the consolidated financial statements, which are prepared in accordance with generally accepted accounting principles (“GAAP”). Management uses these non-GAAP financial measures internally in analyzing our financial results to assess operational performance and liquidity. The presentation of this financial information is not intended to be considered in isolation or as a substitute for the financial information prepared in accordance with GAAP. We believe that both management and investors benefit from referring to these non-GAAP financial measures in assessing our performance and when planning, forecasting and analyzing future periods. We believe these non-GAAP financial measures are useful to investors because they allow for greater transparency with respect to key financial metrics we use in making operating decisions and because our investors and analysts use them to help assess the health of our business. We have provided reconciliations between our historical non-GAAP financial measures to the most directly comparable GAAP financial measures. However, we have not provided reconciliation of bookings outlook to revenue, adjusted EBITDA outlook to net income (loss), non-GAAP effective tax rate outlook to GAAP effective tax rate or non-GAAP EPS outlook to GAAP EPS because certain reconciling items necessary to accurately project revenue (including the projected mix of virtual goods sold in our games, and the projected estimated average lives of durable virtual goods for our games) are not in our control and cannot be reasonably projected due to variability from period to period caused by changes in player behavior and other factors. As revenue and/or net income for the applicable future period is a necessary input to determine all of these comparable GAAP figures, we are not able to provide these reconciliations. Accordingly, a reconciliation to revenue, net income (loss), GAAP effective tax rate and GAAP EPS for our outlook is not available without unreasonable effort.
Some limitations of bookings, adjusted EBITDA, non-GAAP net income, free cash flow and non-GAAP EPS are:• Adjusted EBITDA and non-GAAP net income do not include the impact of stock-based expense;• Bookings, adjusted EBITDA and non-GAAP net income do not reflect that we defer and recognize revenue over the estimated average life of virtual
goods or as virtual goods are consumed;• Adjusted EBITDA does not reflect income tax expense;• Adjusted EBITDA does not include other income and expense, which includes foreign exchange gains and losses and interest income;• Adjusted EBITDA excludes both depreciation and amortization of intangible assets, while non-GAAP net income excludes amortization of intangible
assets from acquisitions. Although depreciation and amortization are non-cash charges, the assets being depreciated and amortized may have to be replaced in the future;
• Adjusted EBITDA and non-GAAP net income do not include gains and losses associated with legal settlements; • Free cash flow is derived from net cash provided by operating activities less cash spent on capital expenditures, and removing the excess income tax
benefits or costs associated with stock-based awards; • Non-GAAP EPS treats shares of convertible preferred stock as if they had converted into common stock at the beginning of the applicable period
presented; • Non-GAAP EPS gives effect to all dilutive awards outstanding, including stock options, warrants and unvested restricted stock units that were excluded
from the GAAP diluted earnings per share calculation and• Other companies, including companies in our industry, may calculate bookings, adjusted EBITDA, non-GAAP net income and non-GAAP EPS
differently or not at all, which will reduce their usefulness as a comparative measure.
Because of these limitations, you should consider bookings, adjusted EBITDA, non-GAAP net income, free cash flow and non-GAAP EPS along with other financial performance measures, including revenue, net income and our financial results presented in accordance with GAAP. See the GAAP to non-GAAP reconciliations below for further details.
3

QE September 1998
DEC CPQ CPQ + DEC CPQ
Revenue $2,960 $6,474 $9,434 $8,791
Reported (GAAP) Revenue Growth (1)35.8%
Actual (Pro forma) Revenue Growth (2)-6.8%
(1) Compares Compaq revenue in Q3 1998 (which includes DEC) to Compaq revenue
in Q3 1997 (which does not include DEC)(2) Compares Compaq revenue in Q3 1998 (which includes DEC) to Compaq revenue
plus DEC revenue in Q3 1997
QE September 1997
DEC / Compaq - Impact of Acquired Companies on Revenue
Attachment 4

Table of Contents Results of Operations Comparison of Year Ended December 31, 2010 to Year Ended December 31, 2009 Revenue, cost of revenue and gross profit The table below sets forth our revenue, cost of revenue and gross profit data for the years ended December 31, 2010 and 2009 (in thousands, except percentage data):
Year ended
December 31, 2010
Percentage of
Revenue
Year endedDecember 31,
2009
Percentageof
Revenue Year-to-Year
Change Percentage
Change Revenue $ 381,745 100.0 % $ 174,689 100.0% $ 207,056 118.5%Cost of revenue 173,427 45.4 % 99,251 56.8% 74,176 74.7%
Gross profit $ 208,318 54.6 % $ 75,438 43.2% $ 132,880 176.1%
Revenue. Revenue for the year ended December 31, 2010 increased by $207.1 million compared with that of the year ended December 31, 2009. Revenue from sales to Wintec, Cisco and Cisco's contract manufacturers (collectively "Cisco") represented $102.6 million of our total revenue for the year ended December 31, 2010, compared with $61.7 million during the year ended December 31, 2009. The increase in sales to Cisco was primarily due to an increase of $24.1 million from sales of knowledge based processors, $13.8 million in revenue from sales of NetLite processors and network search engine products, and $3.0 million in revenue from sales of communication processors. Revenue from non-Cisco customers represented $279.2 million of total revenue for the year ended December 31, 2010 compared with $113.0 million during the year end December 31, 2009. Increased revenues from sales of our products to non-Cisco customers primarily consisted of $70.9 million from communication processors, $16.5 million from physical layer products, $29.8 million from NetLite processors and network search engine products, $25.5 million from knowledge based processors, and $23.1 million from ultra low-power embedded processors. During the year ended December 31, 2010, Alcatel-Lucent accounted for 10% of our total revenue compared with 13% in 2009, and Huawei accounted for 12% of our total revenue compared with 10% in 2009. The IDT NSE acquisition which closed in July 2009 added products to our existing networks search engine solutions while the RMI acquisition which closed in October 2009 broadened our product offerings to include communication processors and ultra-low power embedded processors. Of the 119% increase in revenue in the year ended December 31, 2010 over the same period in 2009, 70% was represented by revenue from products that we acquired in the IDT NSE and RMI acquisitions in 2009. Cost of Revenue/Gross Profit/Gross Margin. Cost of revenue for the year ended December 31, 2010 increased by $74.2 million compared with that of the year ended December 31, 2009. Cost of revenue increased primarily due to the increase in product sales, an increase in the provision for excess/obsolete inventory, an increase in amortization of intangible assets, partially offset by a decrease in fair value adjustments related to acquired inventory. As a result of IDT NSE and RMI acquisitions during 2009, amortization of intangible assets increased from $18.9 million for the year ended December 31, 2009 to $39.5 million for the year ended December 31, 2010. Due to the depletion of acquired inventory, fair market value adjustments for acquired inventory decreased from $20.4 million for the year ended December 31, 2009 to $16.0 million for the year ended December 31, 2010. In addition, provision for excess/obsolete inventory increased from $1.9 million for the year ended December 31, 2009 to $6.1 million for the year ended December 31, 2010. Gross margin for the year ended December 31, 2010 increased to 54.6% compared with 43.2% for the year ended December 31, 2009, primarily due to higher sales levels to absorb charges such as amortization of intangible assets and fair value adjustments related to acquired inventory, and a favorable change in product mix.
47
From NetLogic 2011 10K
2008 2009 2010 2011 2012 (1)
NetLogic GAAP Revenue ($M) $139.9 $174.7 $381.7 $405.4 $494.2
Revenue Growth 24.8% 118.5% 6.2% 21.9%
NetLogic EPS -$1.0 -$1.1 -$0.8
NetLogic Adjusted Revenue ($M) (2) $282.5 $258.0 $381.7 $405.4 $494.2
Revenue Growth -8.7% 48.0% 6.2% 21.9%
(1) Analyst estimates based on data pulled Nov/Dec 2011(2) 2008 and 2009 adjusted revenue per NetLogic 2009 10K filing.
Adjusted Revenue growth is 70 pts lower than published revenue growth
NetLogic - Impact of Acquired Companies on Revenue
Attachment 5 page 2