public pension oversight board
TRANSCRIPT
Teachers’ Retirement System of the State of Kentucky
Public Pension
Oversight Board
July 20, 2021Gary L. Harbin, CPA
Executive Secretary

9.105%
Pension
3.75%
Retiree Health Care
Non-university members
12.855% of Salary
Member Contributions
Non-University Members
12.355%
Pension & Life
0.75%
Retiree Health Care
Non-university members
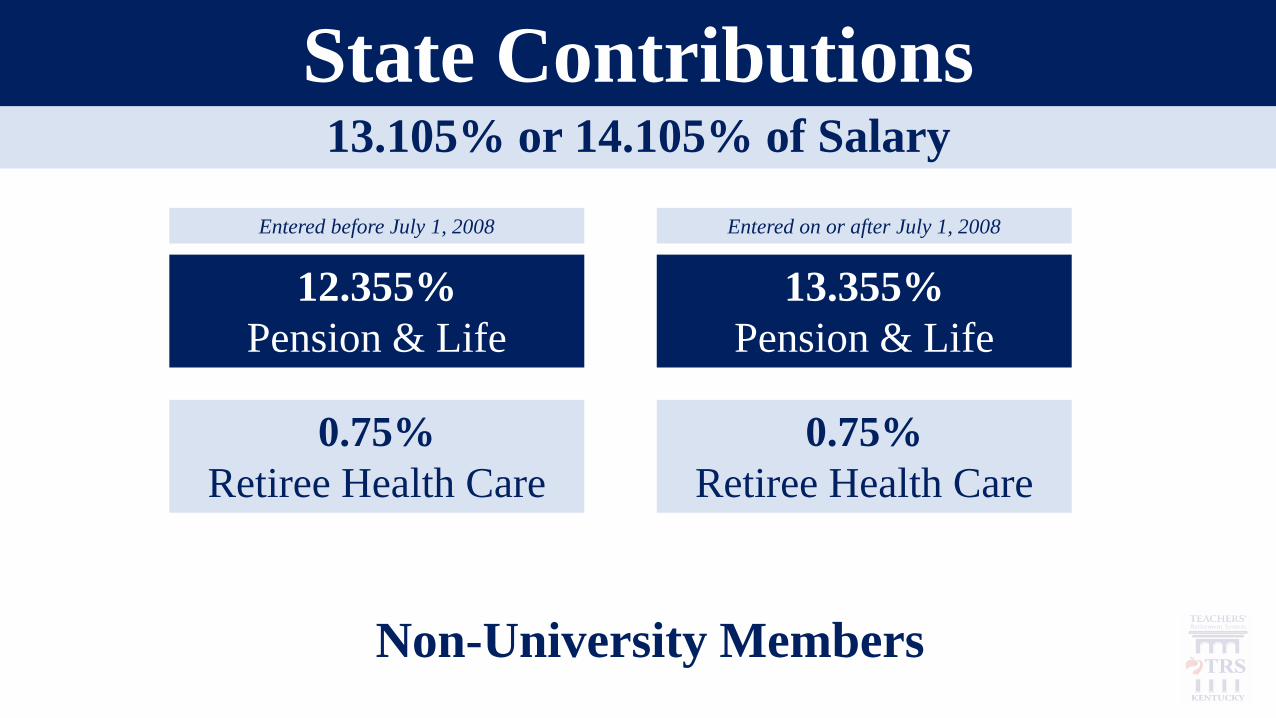
13.105% or 14.105% of Salary
State Contributions
Non-University Members
13.355%
Pension & Life
0.75%
Retiree Health Care
Entered before July 1, 2008 Entered on or after July 1, 2008
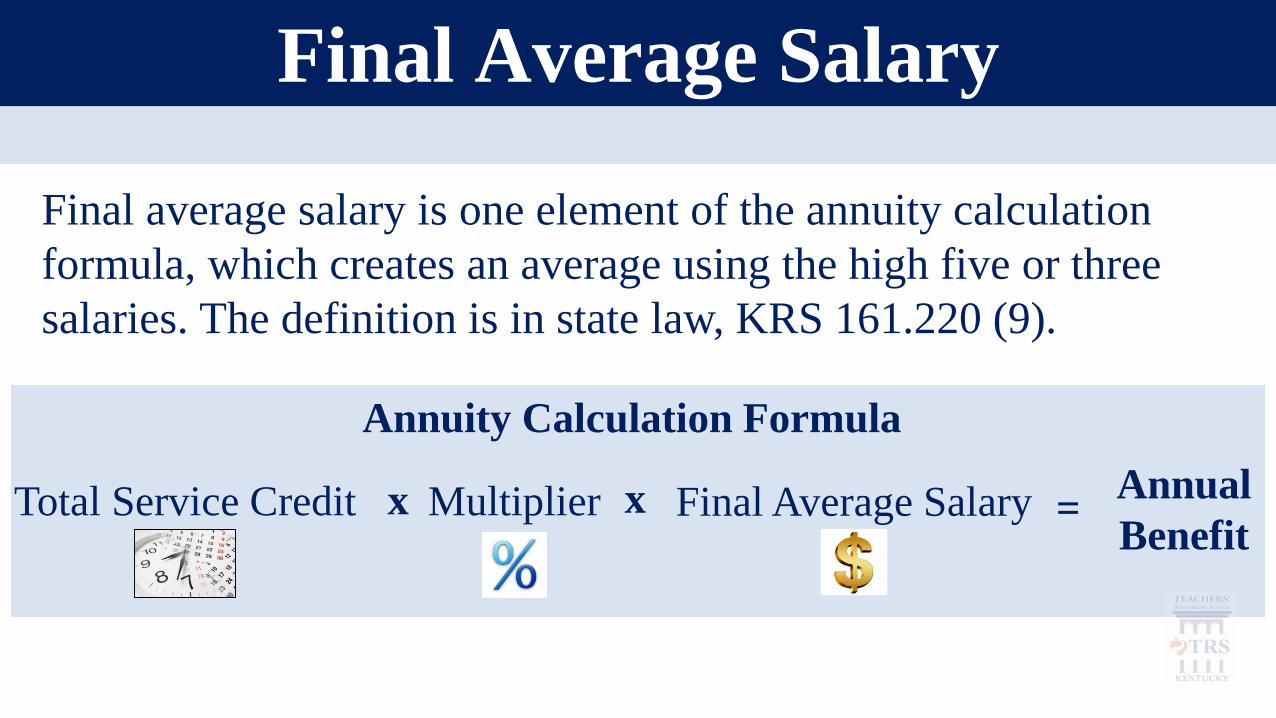
Final average salary is one element of the annuity calculation
formula, which creates an average using the high five or three
salaries. The definition is in state law, KRS 161.220 (9).
Final Average Salary
Total Service Credit Final Average Salaryx xMultiplier =Annual
Benefit
Annuity Calculation Formula
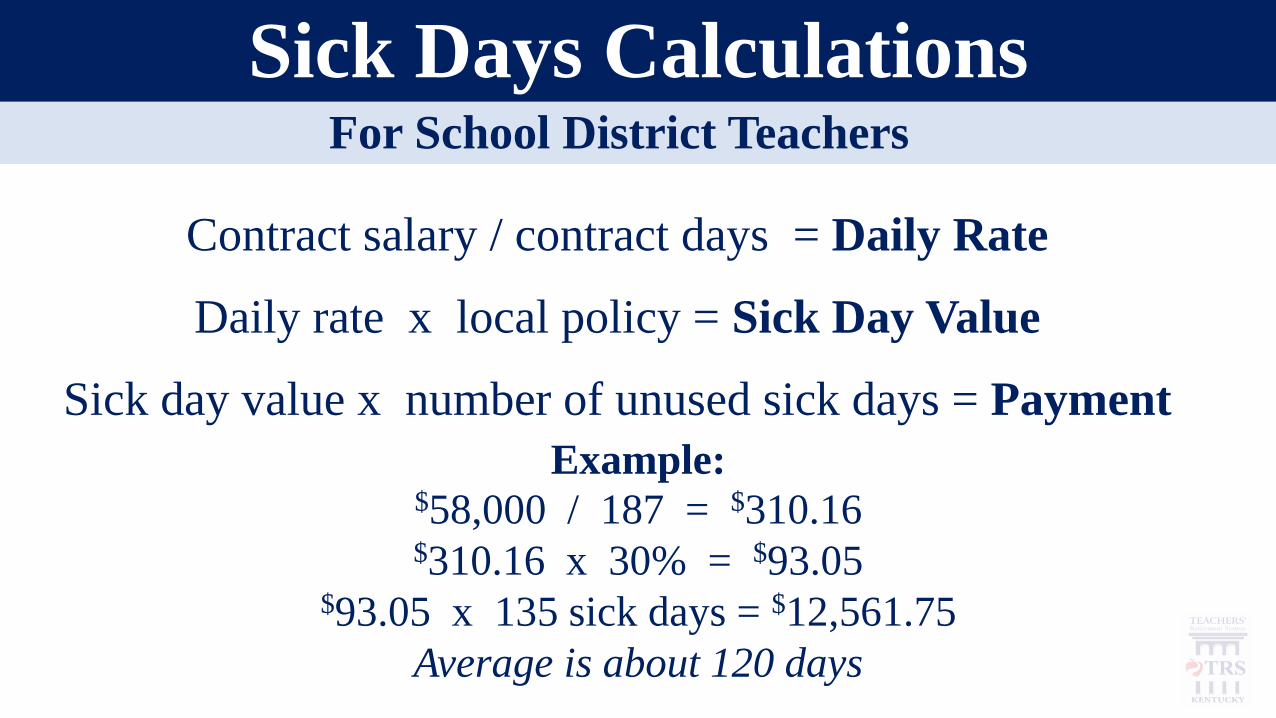
$58,000 / 187 = $310.16$310.16 x 30% = $93.05
$93.05 x 135 sick days = $12,561.75
Average is about 120 days
Sick day value x number of unused sick days = Payment
Contract salary / contract days = Daily Rate
Daily rate x local policy = Sick Day Value
Example:
Sick Days CalculationsFor School District Teachers

Years 27
Salaries for averaging 5
Total multiplier 67.5%
Unused sick days 0 135
Leave payment 0 $ 12,561
FAS $ 57,400 $ 59,912
Annual benefit $ 38,745 $ 40,440
Last salary $ 58,000
Percent of last salary 67% 70%
How Sick Leave Impacts RetirementFor School District Teachers
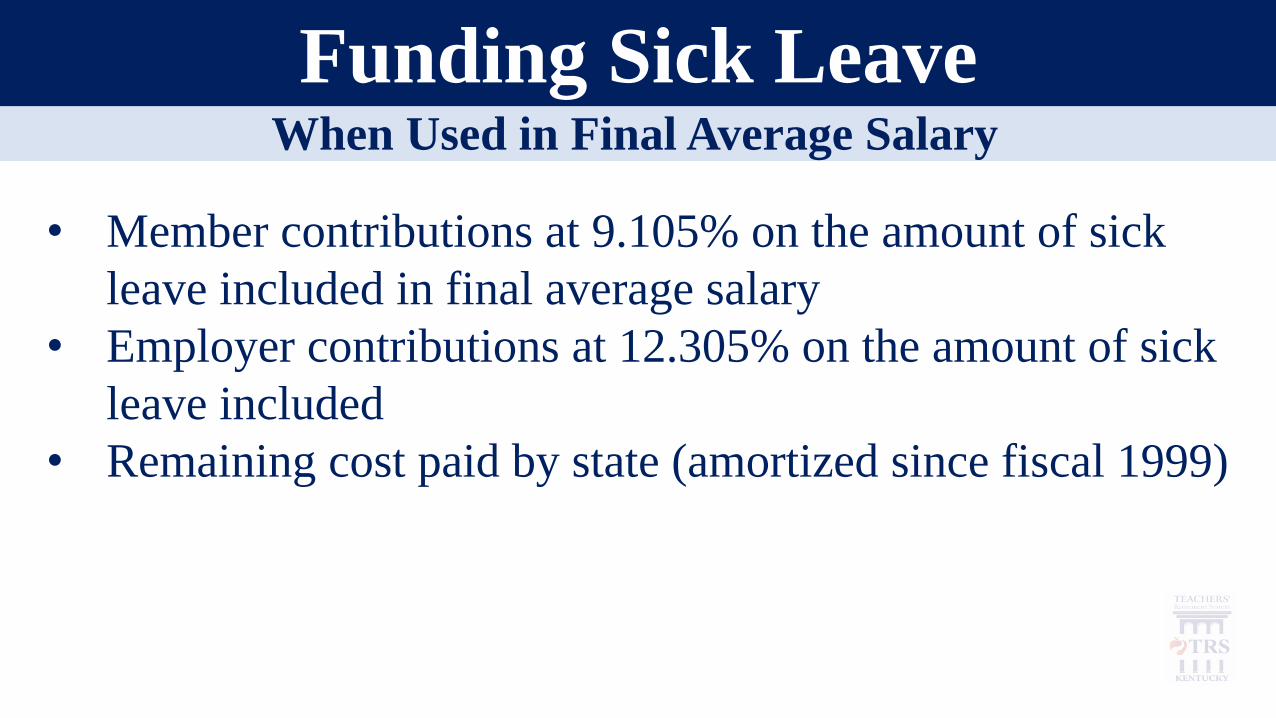
Funding Sick LeaveWhen Used in Final Average Salary
• Member contributions at 9.105% on the amount of sick
leave included in final average salary
• Employer contributions at 12.305% on the amount of sick
leave included
• Remaining cost paid by state (amortized since fiscal 1999)
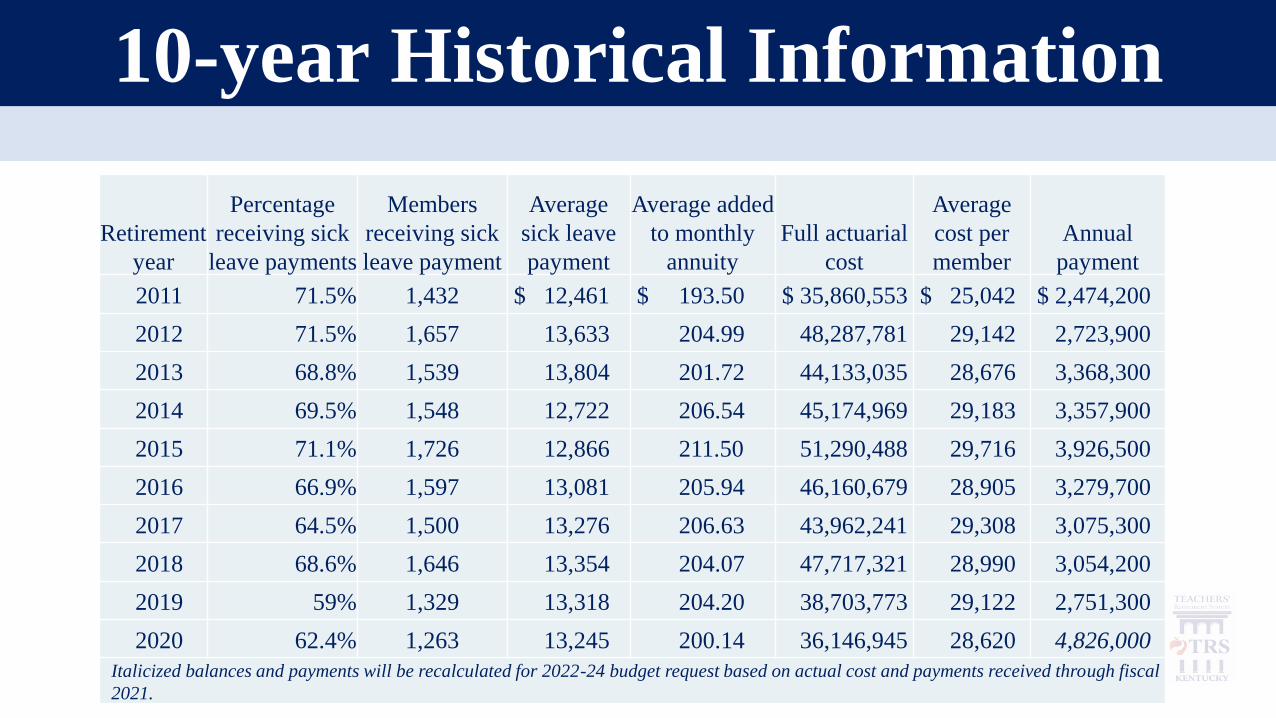
10-year Historical Information
Retirement
year
Percentage
receiving sick
leave payments
Members
receiving sick
leave payment
Average
sick leave
payment
Average added
to monthly
annuity
Full actuarial
cost
Average
cost per
member
Annual
payment
2011 71.5% 1,432 $ 12,461 $ 193.50 $ 35,860,553 $ 25,042 $ 2,474,200
2012 71.5% 1,657 13,633 204.99 48,287,781 29,142 2,723,900
2013 68.8% 1,539 13,804 201.72 44,133,035 28,676 3,368,300
2014 69.5% 1,548 12,722 206.54 45,174,969 29,183 3,357,900
2015 71.1% 1,726 12,866 211.50 51,290,488 29,716 3,926,500
2016 66.9% 1,597 13,081 205.94 46,160,679 28,905 3,279,700
2017 64.5% 1,500 13,276 206.63 43,962,241 29,308 3,075,300
2018 68.6% 1,646 13,354 204.07 47,717,321 28,990 3,054,200
2019 59% 1,329 13,318 204.20 38,703,773 29,122 2,751,300
2020 62.4% 1,263 13,245 200.14 36,146,945 28,620 4,826,000
Italicized balances and payments will be recalculated for 2022-24 budget request based on actual cost and payments received through fiscal
2021.
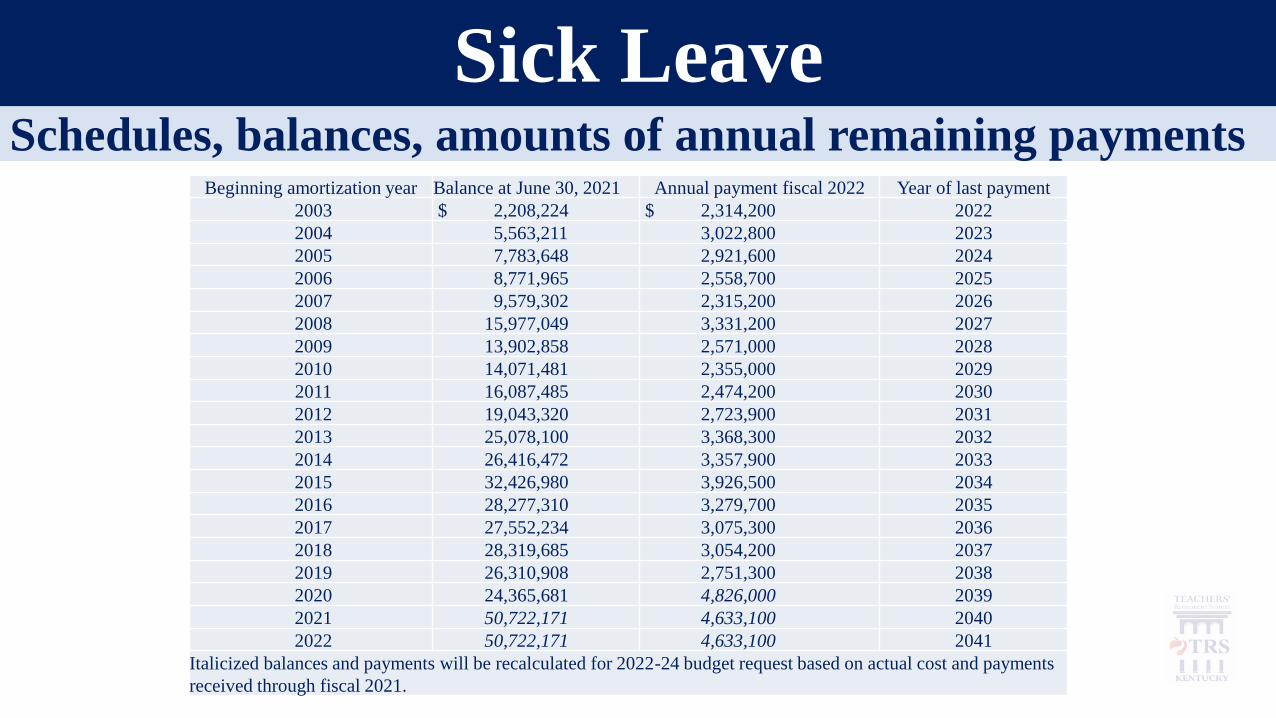
Sick Leave
Beginning amortization year Balance at June 30, 2021 Annual payment fiscal 2022 Year of last payment
2003 $ 2,208,224 $ 2,314,200 2022
2004 5,563,211 3,022,800 2023
2005 7,783,648 2,921,600 2024
2006 8,771,965 2,558,700 2025
2007 9,579,302 2,315,200 2026
2008 15,977,049 3,331,200 2027
2009 13,902,858 2,571,000 2028
2010 14,071,481 2,355,000 2029
2011 16,087,485 2,474,200 2030
2012 19,043,320 2,723,900 2031
2013 25,078,100 3,368,300 2032
2014 26,416,472 3,357,900 2033
2015 32,426,980 3,926,500 2034
2016 28,277,310 3,279,700 2035
2017 27,552,234 3,075,300 2036
2018 28,319,685 3,054,200 2037
2019 26,310,908 2,751,300 2038
2020 24,365,681 4,826,000 2039
2021 50,722,171 4,633,100 2040
2022 50,722,171 4,633,100 2041
Italicized balances and payments will be recalculated for 2022-24 budget request based on actual cost and payments
received through fiscal 2021.
Schedules, balances, amounts of annual remaining payments
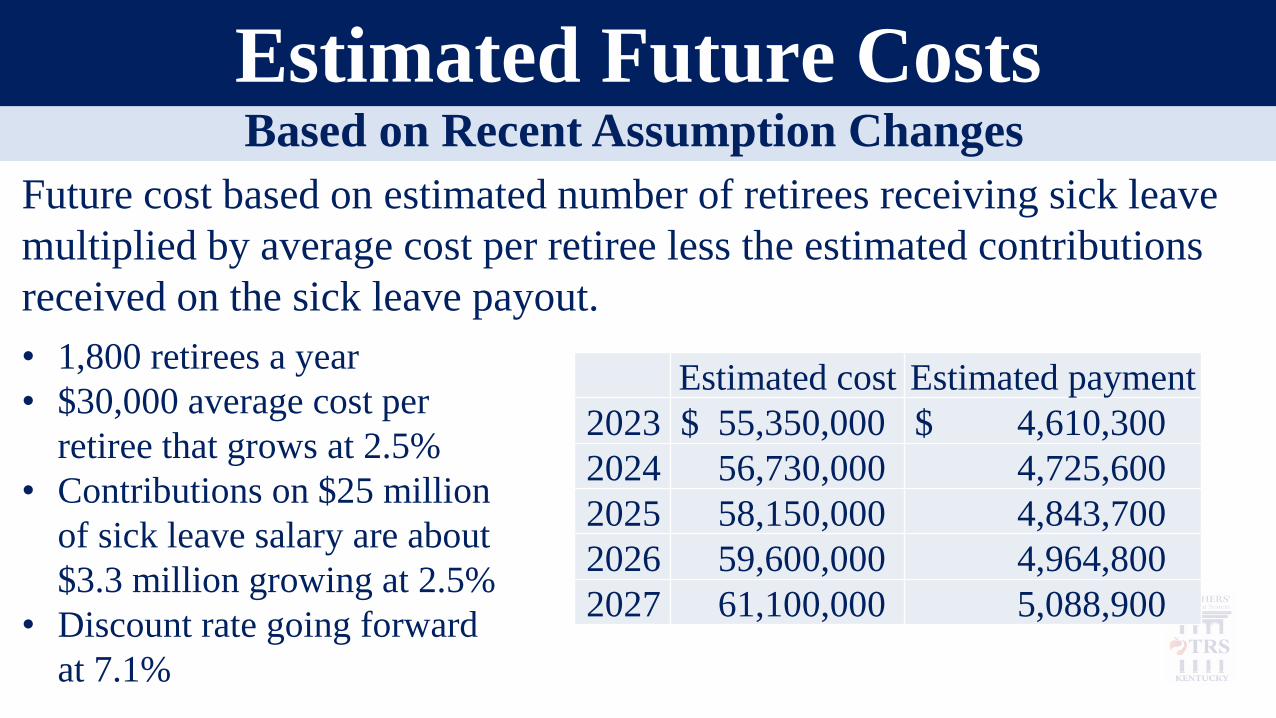
Estimated Future Costs
Estimated cost Estimated payment
2023 $ 55,350,000 $ 4,610,300
2024 56,730,000 4,725,600
2025 58,150,000 4,843,700
2026 59,600,000 4,964,800
2027 61,100,000 5,088,900
Based on Recent Assumption Changes
Future cost based on estimated number of retirees receiving sick leave
multiplied by average cost per retiree less the estimated contributions
received on the sick leave payout.
• 1,800 retirees a year
• $30,000 average cost per
retiree that grows at 2.5%
• Contributions on $25 million
of sick leave salary are about
$3.3 million growing at 2.5%
• Discount rate going forward
at 7.1%
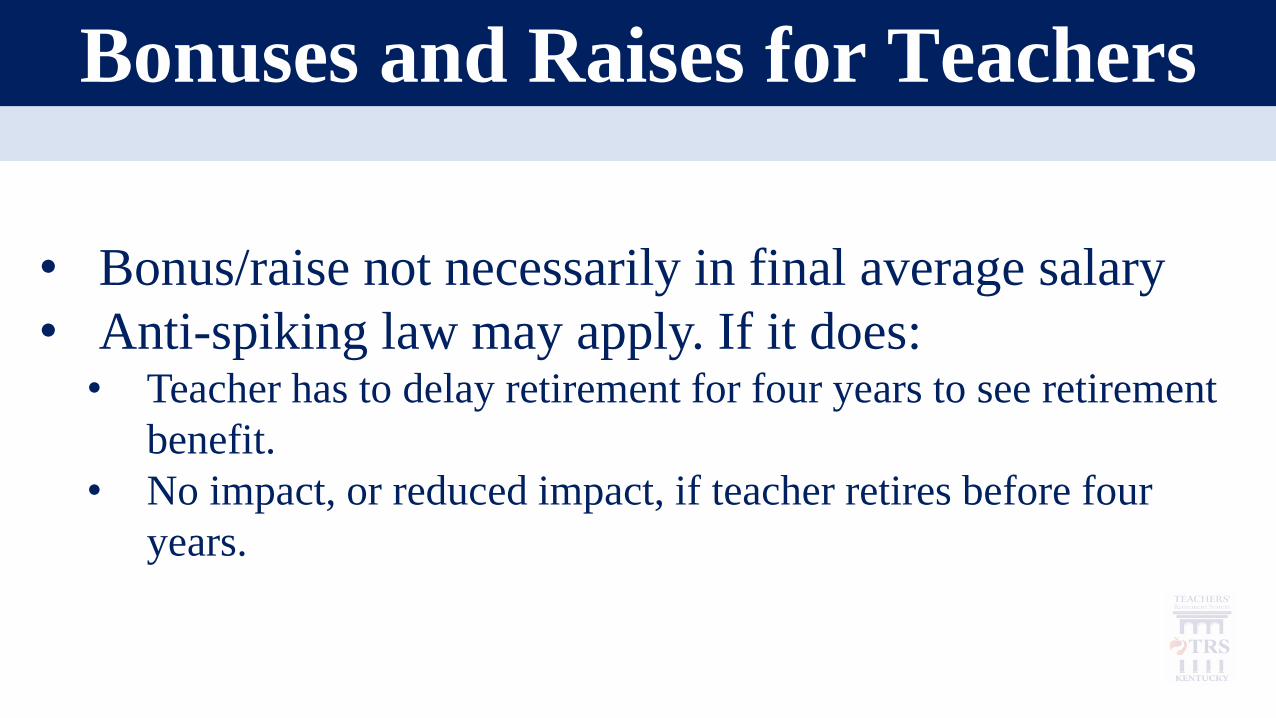
Bonuses and Raises for Teachers
• Bonus/raise not necessarily in final average salary
• Anti-spiking law may apply. If it does:• Teacher has to delay retirement for four years to see retirement
benefit.
• No impact, or reduced impact, if teacher retires before four
years.
If Anti-Spiking Law Applies
Contributions from income above limitation refunded.
Refund received by member from their employer.
What Happens to the Contributions?

Our Members
Come First!
800-618-1687
8 a.m. – 5 p.m. ET
Monday – Friday
https://trs.ky.gov
Protecting & Preserving Teachers’ Retirement Benefits