pten reduces endosomal ptdins(4,5)p2 in a phosphatase ... · lowe syndrome patient cells harboring...
TRANSCRIPT
The University of Manchester Research
PTEN reduces endosomal PtdIns(4,5)P2 in a phosphatase-independent manner via a PLC pathwayDOI:10.1083/jcb.201805155
Document VersionAccepted author manuscript
Link to publication record in Manchester Research Explorer
Citation for published version (APA):Mondin, V. E., Ben El Kadhi, K., Cauvin, C., Jackson-Crawford, A., Bélanger, E., Decelle, B., ... Carréno, S.(2019). PTEN reduces endosomal PtdIns(4,5)P2 in a phosphatase-independent manner via a PLC pathway. TheJournal of cell biology. https://doi.org/10.1083/jcb.201805155
Published in:The Journal of cell biology
Citing this paperPlease note that where the full-text provided on Manchester Research Explorer is the Author Accepted Manuscriptor Proof version this may differ from the final Published version. If citing, it is advised that you check and use thepublisher's definitive version.
General rightsCopyright and moral rights for the publications made accessible in the Research Explorer are retained by theauthors and/or other copyright owners and it is a condition of accessing publications that users recognise andabide by the legal requirements associated with these rights.
Takedown policyIf you believe that this document breaches copyright please refer to the University of Manchester’s TakedownProcedures [http://man.ac.uk/04Y6Bo] or contact [email protected] providingrelevant details, so we can investigate your claim.
Download date:19. Aug. 2019
1
A PTEN/PLC pathway reduces endosomal PI(4,5)P2 and can
compensate for loss of the OCRL phosphatase
Virginie E. Mondin1,*, Khaled Ben El Kadhi1,*, Clothilde Cauvin3,4, Anthony Jackson –
Crawford6, Emilie Bélanger1, Barbara Decelle1, Rémi Salomon5, Martin Lowe6,$, Arnaud
Echard3,# and Sébastien Carréno 1,2,&
1Institute for Research in Immunology and Cancer (IRIC), Université de Montréal, P.O. Box 6128, Station Centre-Ville, Montréal, QC H3C 3J7, Canada. 2Université de Montréal, Département de Pathologie et de Biologie Cellulaire, Montréal, Québec H3C 3J7, Canada.
3 Membrane Traffic and Cell Division Lab, Institut Pasteur, UMR3691, CNRS, 25–28 rue du Dr Roux, F-75015 Paris, France.
4 Sorbonne Université, Collège doctoral, F-75005 Paris, France.
5Institut des Maladies Génétiques Imagine, Hôpital Necker - Enfants Malades, Université Paris Descartes, 149, rue de Sèvres F-75015 Paris, France.
6Faculty of Biology, Medicine and Health, University of Manchester, Manchester, M13 9PT, UK.
* These authors contributed equally to this work.
# Corresponding author for the experiments in human cells: [email protected]
$ Corresponding author for the experiments in zebra fish: [email protected]
&Corresponding author: [email protected]
2
Abstract
The tumor suppressor PTEN dephosphorylates PtdIns(3,4,5)P3 into PtdIns(4,5)P2. Here, we
make the unexpected discovery that in Drosophila, PTEN reduces PtdIns(4,5)P2 levels on
endosomes, independently of its phosphatase activity. This new PTEN function requires the
enzymatic action of dPLCXD, an atypical Phospholipase C. Importantly, we discovered that this
novel PTEN/dPLCXD pathway can compensate for dOCRL depletion, a PtdIns(4,5)P2
phosphatase. Mutation of OCRL1, the human orthologue of dOCRL, causes Oculocerebrorenal
syndrome of Lowe, a rare multisystemic genetic disease. Both OCRL1 or dOCRL loss have been
shown to promote accumulation of PtdIns(4,5)P2 on endosomes and cytokinesis defects. Here,
we show that PTEN or dPLCXD overexpression prevents these defects. In addition, we found
that chemical activation of this pathway restores normal cytokinesis in human Lowe syndrome
cells and rescues OCRL phenotypes in a zebrafish Lowe syndrome model. Our findings identify,
a novel PTEN/dPLCXD pathway that controls PtdIns(4,5)P2 levels on endosomes. They also point
to a potential new strategy for the treatment of Lowe syndrome.
3
Introduction
Phosphoinositides (PtdIns) are lipids composed by a membrane associated diacylglycerol
backbone linked to a cytoplasmic inositol ring. Phosphoinositides regulate a number of cellular
processes including cell growth, survival, intracellular trafficking and cell morphogenesis (Balla,
2013, Cauvin and Echard, 2015). There are 7 different phosphoinositides obtained by
phosphorylation of the 3rd and/or 4th and/or 5th position of their inositol ring (Fig. 1A). More
than 100 kinases, phosphatases and phospholipases control the levels of phosphoinositides
directly on membranes (Balla, 2013, Ilmonen et al., 2005). However, how these enzymes
collaborate to control homeostasis of the different pools of phosphoinositides is poorly
understood.
Dysregulation of phosphoinositide abundance or distribution can lead to numerous pathologies
including cancer and genetic diseases (Viaud et al., 2016). For instance mutation of the inositol
polyphosphate-5-phosphatase OCRL1 is responsible for the oculocerebrorenal Lowe syndrome
and Dent-2 disease, two rare multisystemic orphan diseases (Mehta et al., 2014, De Matteis et
al., 2017, Pirruccello and De Camilli, 2012). Patients suffering from these diseases present with
neurological defects, congenital cataracts, weak muscle tone, life threatening kidney
abnormalities and have a reduced life expectancy. There is no cure for these diseases and the
therapeutic treatments available only alleviate some symptoms.
We and others have previously reported that depletion of OCRL1 or depletion of dOCRL, its
Drosophila orthologue, causes several characteristic phenotypes: Abnormal accumulation of
PtdIns(4,5)P2 on endosomes, disorganization of the endocytic compartments and cytokinetic
defects (Carim et al., 2019, Ben El Kadhi et al., 2012, Ben El Kadhi et al., 2011, Cauvin et al.,
4
2016, Choudhury et al., 2005, Dambournet et al., 2011, Erdmann et al., 2007, Ungewickell et al.,
2004, Vicinanza et al., 2011, Del Signore et al., 2017, Nandez et al., 2014, De Leo et al., 2016). In
control cells, PtdIns(4,5)P2 concentrates at the cortical equator (Emoto et al., 2005, Field et al.,
2005, Roubinet et al., 2011) and recruits the cytokinetic machinery that allows subsequent
cytokinesis (Ben El Kadhi et al., 2011, Liu et al., 2012, Cauvin and Echard, 2015). We previously
found that by dephosphorylating PtdIns(4,5)P2 into PtdIns(4)P, both OCRL1 and dOCRL play
important roles during cell division in human and Drosophila cells respectively. As observed for
OCRL1 in human cells, we previously reported that dOCRL localizes on endosomes where it
reduces the levels of PtdIns(4,5)P2 (Ben El Kadhi et al., 2011). We also showed that dOCRL
dsRNA depletion promotes accumulation of PtdIns(4,5)P2 on endosomes in interphase and
triggers the appearance of aberrant enlarged endosomal compartments. In anaphase, this
abnormal intracellular accumulation of PtdIns(4,5)P2 recruits the cytokinetic machinery at the
expense of the equatorial plasma membrane. As a result, furrowing and cytokinesis are
defective and cells present a high rate of multinucleation (Ben El Kadhi et al., 2011). Thus, the
cytokinetic defects observed upon dOCRL depletion are a secondary consequence of the
dysregulation of PtdIns(4,5)P2 levels on endosomes. In human cells depleted for OCRL1, or in
Lowe syndrome patient cells harboring a mutation of the OCRL gene, PtdIns (4,5)P2
accumulation on endosomes is less pronounced (Cauvin et al., 2016, Nandez et al., 2014,
Vicinanza et al., 2011) and multinucleation is barely observed (Dambournet et al., 2011).
Nevertheless, we showed that at the end of cytokinesis OCRL1 plays a role in removing
PtdIns(4,5)P2 at the plasma membrane of the intercellular bridge, which allows proper
abscission of the two daughter cells (Dambournet et al., 2011). In OCRL1 depleted cells and in
5
renal Lowe patient cells, we indeed found an important delay in the duration of abscission. In
addition, using a zebrafish model of Lowe syndrome, we also reported that OCRL1 inactivation
triggers endocytic defects in the pronephric tubule (Oltrabella et al., 2015). This phenotype is
reminiscent of the renal tubulopathy observed in patients with Lowe syndrome (Bockenhauer
et al., 2008).
The initial objective of the present study was to understand how PtdIns(4,5)P2 is produced on
endosomes of dOCRL-depleted cells. We previously identified two enzymes important for direct
production of PtdIns(4,5)P2 in Drosophila S2 cells: Skittles, a kinase that phosphorylates
PtdIns(4)P to produce PtdIns(4,5)P2 and PTEN, a tumor suppressor phosphatase that
dephosphorylates PtdIns(3,4,5)P3 into PtdIns(4,5)P2 (Roubinet et al., 2011). Here, we make the
unexpected discovery that PTEN also reduces levels of PtdIns(4,5)P2 on endosomes. Moreover,
overexpression of an enzymatic dead mutant of PTEN rescues phenotypic defects of dOCRL-
depleted cells. We further show that this new function of PTEN depends on the phospholipase
C, dPLCXD. In an attempt to stimulate this new PTEN/PLCXD pathway to rescue dOCRL
depletion, we used m-3M3FBS, a small molecule that directly activates PLCs (Bae et al., 2003).
Treatment of Drosophila cells with m-3M3FBS corrects the cytokinetic defects observed upon
dOCRL depletion, dependently of dPLCXD but independently of PTEN. Finally to assess if the
chemical activation of PLCs could be used as a new therapeutic strategy to treat Lowe
syndrome, we tested m-3M3FBS in two other models of Lowe syndrome. The activator of PLCs
rescues the cytokinetic defects in human cells depleted for OCRL1 and in renal cells from Lowe
syndrome patient. We finally show that m-3M3FBS rescues OCRL1 depletion in vivo, by
restoring endocytosis in the pronephric tubule of a Lowe syndrome zebrafish model.
6
RESULTS:
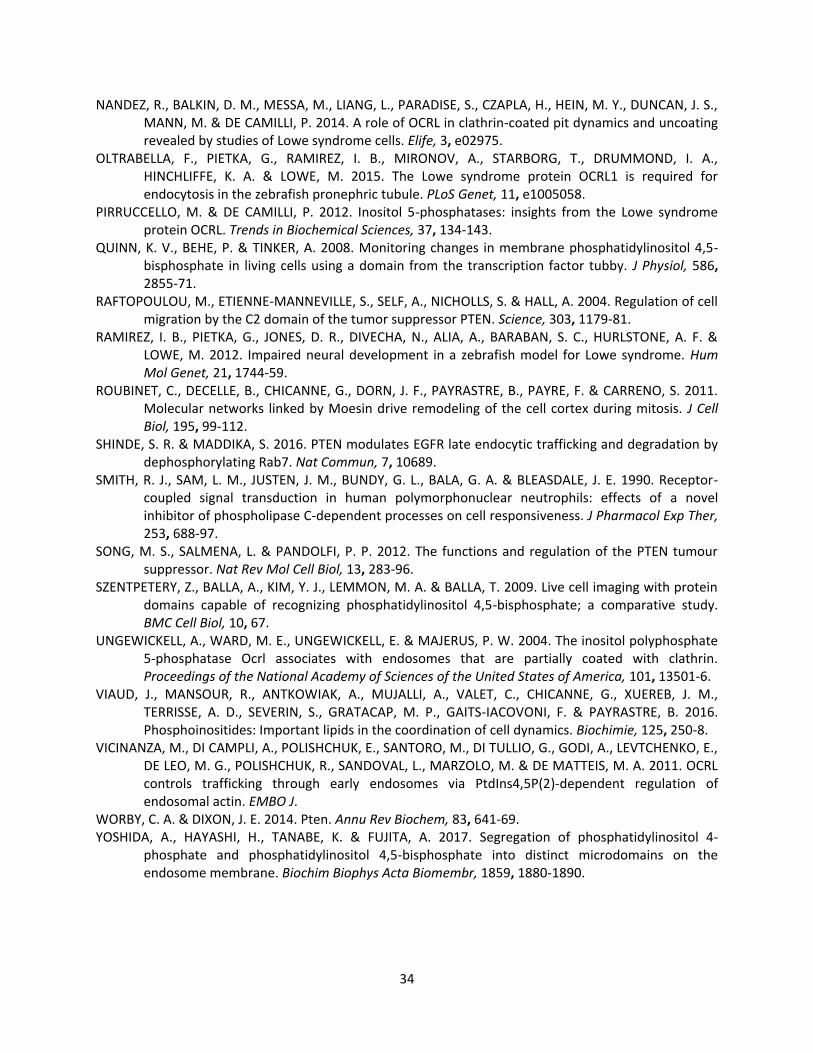
PTEN prevents the effects of dOCRL depletion independently of its phosphatase activity.
PtdIns(4,5)P2 is mainly restricted to the plasma membrane where it controls several important
functions (Kolay et al., 2016). In addition, PtdIns(4,5)P2 is also present on other compartments
such as endosomes and lysosomes (Vicinanza et al., 2011, Yoshida et al., 2017, De Leo et al.,
2016). We wanted to assess if the PtdIns4P-kinase Skittles or the PtdIns(3,4,5)P3 phosphatase
PTEN were responsible for the high PtdIns(4,5)P2 levels on the enlarged endosomes observed
upon dOCRL depletion(Ben El Kadhi et al., 2011) (Fig. 1A).
We first expressed a GFP version of Skittles (Roubinet et al., 2011) and we observed that in
addition to the plasma membrane this kinase localized on endomembranes (Fig S1A). In dOCRL-
depleted cells, Skittles also localized on the large abnormal endomembrane compartment
typically observed after dOCRL depletion (Fig. 1B). In addition overexpression of Skittles further
increased the extent of multinucleation in dOCRL-depleted cells while its overexpression alone
did not significantly alter these levels in control S2 cells (Fig. 1C and S1B). This suggests that
Skittles, by producing PtdIns(4,5)P2 on endomembranes, further increased PtdIns(4,5)P2
endosomal levels caused by dOCRL depletion. As a result, Skittles overexpression triggered a
higher rate of cytokinesis failure. According to this hypothesis, we found that depleting Skittles
together with dOCRL reduced the levels of multinucleation compared to the sole depletion of
dOCRL (Fig. S1C). This shows that a balance of Skittles and dOCRL activities regulates
PtdIns(4,5)P2 on endomembranes and cytokinesis outcome.
7
In addition to the plasma membrane, PTEN has been localized to endosomes (Naguib et al.,
2015, Shinde and Maddika, 2016). Thus we postulated that modulation of PTEN function would
give similar outcomes to the ones observed with Skittles. We found that PTEN depletion did not
affect cytokinesis efficiency (Fig. S1D). However, we unexpectedly observed a strong reduction
of multi-nucleated cells when PTEN was overexpressed in dOCRL-depleted cells (Fig. 1B & C).
We also found that this function of PTEN does not rely on its catalytic activity. Expression of a
phosphatase dead mutant of the enzyme (Maehama and Dixon, 1998), PTENC132S, also
significantly reduced the levels of multinucleation observed upon dOCRL depletion (Fig. 1B &
C). Since the cytokinetic defect of dOCRL-depleted cells is a consequence of the accumulation of
PtdIns(4,5)P2 on endomembranes, we next tested whether PTENC132S prevented
multinucleation by restoring normal PtdIns(4,5)P2 localization. We measured PtdIns(4,5)P2
changes by quantitative microscopy using a PtdIns(4,5)P2 reporter S2 cell line that we
characterized previously (Ben El Kadhi et al., 2011, Roubinet et al., 2011). This cell line stably
expresses low levels of Tubby-GFP, a specific biosensor of PtdIns(4,5)P2 (Quinn et al., 2008). We
already reported that Tubby-GFP faithfully probes alterations of PtdIns(4,5)P2 localization
between the endomembranes and the plasma membrane (Ben El Kadhi et al., 2011, Roubinet
et al., 2011). Using this model we quantified what we thereafter refer to as the PtdIns(4,5)P2
homeostasis ratio by calculating the proportion of Tubby-GFP on endomembranes over the
plasma membrane (Ben El Kadhi et al., 2011, Szentpetery et al., 2009). This ratio is lower in
control cells than in dOCRL-depleted cells reflecting the increase of PtdIns(4,5)P2 on endosomes
(Fig. 1D & E, and (Ben El Kadhi et al., 2011)). We found that in dOCRL-depleted cells,
overexpression of PTENC132S restored the PtdIns(4,5)P2 homeostasis ratio to levels comparable
8
to control cells (Fig. 1D & E). This suggests that PTEN can lower levels of PtdIns(4,5)P2 on
endosomes in dOCRL-depleted cells independently of its phosphatase activity .
The PBD and C2 domains of PTEN are necessary and sufficient to prevent the effects of dOCRL
depletion.
To better understand how PTEN overexpression rescue dOCRL loss, we performed a structure-
function analysis. PTEN comprises five conserved domains (Worby and Dixon, 2014) (Fig. 2A), a
N-terminal phosphoinositide binding domain (PBD) that binds to PtdIns(4,5)P2, a catalytic
domain, a C2 domain known to promote binding to various lipids and proteins, an auto-
inhibitory C-tail domain and a C-terminal PDZ binding motif mediating protein-protein
interaction. We individually deleted PTEN -PBD, -catalytic, -C2 and -C-tail/PDZ domains and
measured the ability of each mutant to prevent cytokinesis failure upon dOCRL depletion. We
first observed that the catalytic domain of PTEN was dispensable for rescue of cytokinesis
failure in dOCRL-depleted cells, confirming that PTEN functions in this context independently of
its phosphatase activity (Fig. 2B & S2A). All constructs were expressed at comparable levels, but
only the mutants missing the PBD or the C2 domains did not rescue the cytokinetic defects seen
upon dOCRL depletion. This demonstrates that these domains are both necessary to rescue the
phenotypes caused by dOCRL loss (Fig. 2B & Fig. S2B). We then tested if they were sufficient by
constructing a chimera between the PBD and C2 domains of PTEN (PTENPBD-C2). We found that
expression of PTENPBD-C2 prevented cytokinesis failure in dOCRL-depleted cells while expression
of the PBD or the C2 domain of PTEN alone did not (Fig. 2B & C). As observed with expression of

9
PTENC132S, the expression of PTENPBD-C2 is also sufficient to rescue a normal PtdIns(4,5)P2
homeostasis ratio in dOCRL-depleted cells (Fig. 2D). Remarkably, when expressed in a control
background, we observed that PTENPBD-C2 or PTENC132S reduces the PtdIns(4,5)P2 homeostasis
ratio suggesting that their overexpression promotes a decrease of PtdIns(4,5)P2 levels on
endomembranes independently of dOCRL status (Fig. 2E). These results suggest a broad role of
PTEN in modulating PtdIns(4,5)P2 levels on endomembranes.
PTEN controls PtdIns(4,5)P2 levels on endosomes.
In human cells, PTEN was reported to localize to endosomes and to bind to Rab7, a marker of
late endosomes (Naguib et al., 2015, Shinde and Maddika, 2016). We first aimed to assess if
PTEN localized to this compartment in Drosophila S2 cells. We probed PTEN localization using
PTENC132S or PTENPBD-C2 to minimize possible perturbation of phosphoinositide composition and
identity of the endosomal compartments by activity of PTEN, which dephosphorylates
PtdIns(3,4,5)P3. In accordance with a role for PTEN in reducing PtdIns(4,5)P2 levels on endocytic
compartments, we found that these two forms of PTEN partially co-localized with Rab7 and the
recycling endosome marker Rab 11 (Fig. 3A,B, S3A & B). In addition, PTEN constructs partially
co-localized with the LysoTracker probe that marks acidic organelles such as late endosomes
and lysosomes (Majzoub et al., 2016) (Fig. 3C & S3C).
We then depleted PTEN in control cells to test whether this protein controlled PtdIns(4,5)P2
levels on endomembranes. In contrast to PTENPBD-C2 or PTENC132S overexpression, PTEN
depletion increased the PtdIns(4,5)P2 homeostasis ratio (Fig. 3D), suggesting an increase of

10
PtdIns(4,5)P2 on endomembranes. Accordingly, we observed, upon PTEN depletion, an increase
in the number of cells with cytoplasmic vesicles marked by the PtdIns(4,5)P2 biosensor, Tubby-
GFP (Fig. 3D & E). Since we found that PTEN localizes to endosomes, we asked if these
PtdIns(4,5)P2 rich vesicles were endocytic compartments. For this, we incubated PTEN dsRNA
Tubby-GFP cells with the LysoTracker probe and we found a partial co-localization of the
PtdIns(4,5)P2 biosensor with LysoTracker (Fig. 3F & S3D). All together, these results bring to
light a new function of PTEN in controlling PtdIns(4,5)P2 levels on endosomes.
A PLC activity is required downstream of PTEN to rescue dOCRL depletion.
Since PTENC132S and PTENPBD-C2 do not have any enzymatic activity we reasoned that to control
PtdIns(4,5)P2 levels on endosomes, PTEN requires another enzyme that can directly act upon
PtdIns(4,5)P2 (Fig 1A). Some of the most efficient enzymes that hydrolyze PtdIns(4,5)P2 are
enzymes of the phospholipase C (PLC) family. PLCs hydrolyze the phosphodiester bond between
the phosphorylated inositol ring of PtdIns(4,5)P2 and the diacylglycerol backbone (Kadamur and
Ross, 2013). We thus tested whether PTEN can rescue dOCRL depletion through the enzymatic
activity of a PLC. To this aim, we expressed PTENC132S or PTENPBD-C2 while inhibiting all PLC
enzymes using U73122, a cell-permeable pan-PLC inhibitor (Smith et al., 1990). This inhibitor
did not cause cytokinetic defects by itself, but it prevented both PTEN constructs from rescuing
cytokinesis defects caused by dOCRL depletion (Fig. 4A and 4B). This demonstrates that PTEN
requires a downstream PLC activity in order to rescue dOCRL depletion.
11
dPLCXD acts downstream of PTEN to rescue dOCRL depletion.
We then aimed to identify which Drosophila PLC acted downstream of PTEN. We co-depleted 5
different PLC enzymes together with dOCRL in S2 cells and quantified multinucleation after
PTENPBD-C2 expression. The individual depletion of each PLC did not cause cytokinesis defects in
control cells (Fig. S4A). Among the 5 PLCs tested, we found that only the depletion of CG14945
prevented PTENPBD-C2 from rescuing the cytokinetic defects triggered by dOCRL depletion (Fig.
5A & S4B). We named this enzyme, dPLCXD, as it is the Drosophila ortholog of three human
PLCXD (Gellatly et al., 2012) (Fig. 5B & C). To confirm that dPLCXD can rescue dOCRL loss, we
expressed dPLCXD in dOCRL-depleted cells. We first found that, as its human orthologs PLCXD-1
and PLCXD-3 (Gellatly et al., 2012), dPLCXD localized to endomembranes and not to the plasma
membrane (Fig. 5D). Similarly to what we observed with PTEN overexpression, we found that
overexpression of dPLCXD is sufficient to rescue multinucleation in dOCRL-depleted cells (Fig.
5E). The enzymatic domain of PLCXDs contains two catalytic histidine residues critical for their
enzymatic activity that are conserved from bacteria to human (Fig 5C and (Essen et al., 1997,
Heinz et al., 1995, Gellatly et al., 2012)). To test if the phospholipase activity of dPLCXD was
necessary to prevent the consequences of dOCRL depletion, we constructed an enzymatic dead
mutant, dPLCXD(HL)2, by mutating these conserved catalytic histidines (219 and 277 in dPLCXD)
into leucines (Fig. 5C). In control cells, dPLCXD(HL)2 overexpression did not modify the rate of
multinucleation (Fig. S4C). However, while still localized on endomembranes, dPLCXD(HL)2
could not prevent multinucleation when expressed in dOCRL-depleted cells (Fig. 5D and E). This
demonstrates that dPLCXD prevents cytokinesis failure via its enzymatic activity. These results
12
reveal that, to reduce PtdIns(4,5)P2 levels on endosomes, PTEN requires the enzymatic action of
dPLCXD.
dPLCXD controls PtdIns(4,5)P2 levels on endosomes.
To further understand the role of dPLCXD in the control of PtdIns(4,5)P2 homeostasis, we first
determined the identity of the endomembranes to which dPLCXD localizes (Fig. 5D). We found
that, as observed for PTEN, dPLCXD also associated with late and recycling endosomes, as
marked by Rab7 and Rab11 respectively (Fig. 6A,B, S3E & F). To assess whether, as seen for
PTEN, dPLCXD regulated PtdIns(4,5)P2 levels on endosomes of control cells, we depleted this
phospholipase and investigated the distribution of PtdIns(4,5)P2 using the biosensor Tubby-GFP.
In accord with a new PTEN/dPLCXD pathway regulating PtdIns(4,5)P2 levels on endosomes, the
depletion of dPLCXD caused PtdIns(4,5)P2 to accumulate on endomembranes (Fig. 6D & E).
dPLCXD-depleted cells showed an increase of the PtdIns(4,5)P2 homeostasis ratio together with
a higher number of cells with cytoplasmic vesicles marked by the PtdIns(4,5)P2 biosensor,
Tubby-GFP (Fig. 6C & D). Furthermore, we found that many of the PtdIns(4,5)P2 vesicles were
positive for the marker of late endosomes and lysosomes LysoTraker (Fig. 6F & S3G). Altogether
these results identify a new function of dPLCXD in controlling PtdIns(4,5)P2 on endosomes.
PTEN acts through dPLCXD to rescue dOCRL depletion.
13
Having shown that both PTEN and dPLCXD regulate PtdIns(4,5)P2 on endosomes and can rescue
dOCRL depletion, we then aimed to better understand how they functionally interact. We first
assessed the co-localization of PTEN and dPLCXD and found that PTENPBD-C2 or PTENC132S
partially co-localize with dPLCXD on cytoplasmic vesicles of S2 cells (Fig. 7A & S3H). We then
tested whether PTEN and dPLCXD physically associate within cells. After co-expression of
PTENPBD-C2 and dPLCXD with various tags, we did not observe any interaction of these proteins
by conventional co-immunoprecipitation or by GFP-trap (data not shown). This suggests that
while they co-localize, PTEN and dPLCXD do not physically interact, or that their interaction is
too weak or transient to be detected by these methods.
We then tested whether PTEN is necessary for dPLCXD to rescue dOCRL loss. Upon PTEN
depletion, expression of dPLCXD was no longer sufficient to rescue multinucleation of dOCRL-
depleted cells (Fig. 7B). This shows that dPLCXD requires PTEN upstream in order to prevent the
consequences of dOCRL depletion. PTEN could act via dPLCXD by controlling its endosomal
recruitment, or by activating its phospholipase function. Since we observed that dPLCXD still
localizes to endomembranes when PTEN is depleted (Fig. 7C), we favor the second hypothesis.
Chemical activation of PLC prevents defects caused by dOCRL depletion
We demonstrated that dPLCXD catalytic activity was necessary to rescue the phenotypes
caused by dOCRL depletion (Fig. 5D and E). We thus hypothesized that we could compensate
for dOCRL loss by chemically activating the enzymatic function of PLCs. We decided to test this
hypothesis by comparing the action of m-3M3FBS, a chemical activator of every PLC, with that

14
of its inactive stereoisomer o-3M3FBS (Bae et al., 2003). We found that treatment of dOCRL-
depleted S2 cells with the PLC activator m-3M3FBS restored the PtdIns(4,5)P2 homeostasis ratio
to that similar to control cells (Fig. 8 A & B). In addition, we found that while m-3M3FBS did not
perturb cytokinesis in control cells, it reduced the rate of multinucleated cells in dOCRL-
depleted cells (Fig. 8 C & D). In contrast, treatment with the inactive analog, o-3M3FBS gave
only a moderate effect on the PtdIns(4,5)P2 homeostasis ratio and multinucleation in dOCRL-
depleted cells, possibly due to residual activity of this analog on Drosophila PLCs (Fig. 8A, B, C &
D).
In addition, we found that in S2 cells the chemical activator of PLCs rescues dOCRL depletion by
specifically activating dPLCXD. When dPLCXD was co-depleted together with dOCRL, m-3M3FBS
could no longer rescue the multinucleation caused by dOCRL depletion (Fig. 8E). Thus, since m-
3M3FBS directly stimulates PLC activity in vitro (Bae et al., 2003), we asked if PTEN was still
required when dPLCXD is chemically activated. In the absence of PTEN, m-3M3FBS was still able
to reduce the rate of multinucleation upon dOCRL depletion (Fig. 8F). This demonstrates that
PTEN stimulation of dPLCXD can be bypassed by the direct chemical activation of dPLCXD
phospholipase activity. In line with what we proposed in the previous paragraph, this further
suggests that PTEN activates dPLCXD phospholipase function (Fig. 9).
Chemical activation of PLC prevents defects observed in different models of Lowe syndrome.
We then tested whether activation of PLCs by m-3M3FBS could be used for correcting the
defects associated with OCRL1 inactivation in other models for Lowe syndrome. To test this

15
hypothesis we first analyzed the consequences of m-3M3FBS treatment in human Lowe
syndrome cell models. We previously reported that cytokinetic abscission is delayed both upon
depletion of OCRL1 by RNAi in HeLa cells, and in renal epithelial cells of a Lowe patient
harbouring an inactive version of OCRL1 (Dambournet et al., 2011). Importantly, the abscission
delay observed in Lowe patient cells was fully corrected by treatment with m-3M3FBS, but not
by inactive o-3M3FBS (Fig. 10A & B). However, m-3M3FBS did not change the timing of
abscission in normal cells (renal cells collected from a healthy donor). We confirmed these
results in HeLa cells treated with control and OCRL siRNAs (Fig S5 A & B). We conclude that the
abscission delay resulting from OCRL inactivation or depletion is corrected by low doses of the
PLC activator m-3M3FBS.
Finally, to test whether activation of PLCs can rescue phenotypes induced by depletion of
OCRL1 in an in vivo context we used a previously established zebrafish model for Lowe
syndrome (Ramirez et al., 2012). This model, which is deficient in OCRL1, has a renal tubular
endocytosis defect which can be attributed to excessive accumulation of PtdIns(4,5)P2
(Oltrabella et al., 2015). To determine if activation of PLCs can rescue the endocytic defect in
Lowe syndrome zebrafish, we treated either embryos with m-3M3FBS or the inactive analog o-
3M3FBS and monitored accumulation of injected endocytic tracer in the renal tubule as
assessed by fluorescence microscopy (Fig. 10C). Remarkably, m-3M3FBS treatment had no
effect on renal uptake in wild-type embryos, but efficiently rescued endocytosis in the renal
tubule of OCRL1 mutant embryos (Fig. 10D). The inactive analog had no effect in either
zebrafish strain. These results indicate that chemical activation of PLCs can rescue loss of OCRL1
16
function in an in vivo context, namely the renal tubule, one of the major tissues affected in
Lowe syndrome patients.
DISCUSSION
In this study we discovered a new signaling pathway by which PTEN controls levels of
PtdIns(4,5)P2 on endosomes, which is dependent upon the phospholipase activity of dPLCXD.
We then demonstrated that overexpression of members of this new PTEN/dPLCXD signaling
pathway can rescue dOCRL depletion in Drosophila cells. Finally, by further characterizing this
pathway, we identified a new potential therapeutic strategy that can alleviate the
consequences of OCRL1 loss: We showed that treatment with m-3M3FBS, a small molecule that
activates PLCs, rescues OCRL1 functional loss in three different in-cellulo and in-vivo models of
Lowe syndrome.
A new PTEN/dPLCXD signaling pathway controls PtdIns(4,5)P2 levels on endosomes.
The vast majority of studies on PTEN have explored its role within the PI3K pathway at
the plasma membrane, or in the nucleus. Only recently, a few studies have investigated the role
of PTEN on endomembranes. PTEN was recently shown to associate with endosomes, and to
dephosphorylate Rab 7 to modulate endosome maturation and EGFR trafficking (Shinde and
Maddika, 2016). Our findings confirm that in Drosophila, PTEN localizes on endosomes. In
addition we shed light on a novel role for PTEN in controlling PtdIns(4,5)P2 levels on
17
endosomes, as demonstrated by the increase of PtdIns(4,5)P2 on these structures when PTEN is
depleted. This finding is further supported by the decrease of PtdIns(4,5)P2 homeostasis ratio
observed when a catalytically inactive mutant of PTEN (PTENPBD-C2 or PTENC132S) is expressed in
cells.
We also found that this new function of PTEN requires the downstream phospholipase
activity of dPLCXD. While typical PLC enzymes harbor a catalytic domain composed of a
separate X- and Y-box, members of the PLCXD family contain only the X-box (Gellatly et al.,
2012). Yet, the three human PLCXD paralogs have been shown to promote hydrolysis of
phosphoinositides in cells (Gellatly et al., 2012). Our findings confirm that, as its human
orthologs PLCXD-1 and PLCXD-3 (Gellatly et al., 2012), dPLCXD also localizes to
endomembranes, which we identify here as endosomes. Importantly, since dPLCXD is not
associated with the plasma membrane, the PTEN/dPLCXD pathway must be at play only on
endosomes. Besides subcellular localization and tissue expression, there is little information on
the cellular roles of PLCXDs. Hence, we have discovered the first function for a member of this
family by establishing that dPLCXD controls PtdIns(4,5)P2 levels on endosomes.
We have established this new role for PTEN after the surprising discovery that overexpression
of this tumor suppressor restores normal PtdIns(4,5)P2 homeostasis, and downstream
cytokinesis defects, in dOCRL-depleted cells. By combining studies in wild-type and in dOCRL-
depleted cells, we have obtained a set of experimental evidence to define this novel
PTEN/dPLCXD signaling pathway. We found that (i) PTEN and dPLCXD partially co-localize on
endomembranes (Fig. 7A & S3H); (ii) PTEN or dPLCXD depletion both promote enrichment of
PtdIns(4,5)P2 on endosomes (Fig. 3D,E,F,G and 6C,D,E,F). (iii) dPLCXD acts downstream of PTEN
18
(Fig. 5A); (iv) dPLCXD catalytic activity is necessary to rescue cytokinesis defects in dOCRL-
depleted cells (Fig. 5D,E); (v) dPLCXD requires an upstream action of PTEN to rescue dOCRL
depletion (Fig. 7B); (vi) PTEN is not necessary for dPLCXD endomembrane localization (Fig. 7C)
and (vii) dPLCXD activation by m-3M3FBS bypasses the requirement for PTEN to rescue dOCRL
depletion (Fig. 8F). Altogether these results lead us to propose a model whereby PTEN regulates
dPLCXD activation to control PtdIns(4,5)P2 levels on endosomes (Fig. 9). Since m-3M3FBS also
rescues OCRL1 loss both in human cells and zebrafish embryos, it suggests that the role of
PLCXD phospholipases on endosomal PtdIns(4,5)P2 is conserved across species.
The precise molecular mechanism that allows PTEN to stimulate dPLCXD activation
remains to be identified. We did not detect any physical interaction by co-immunoprecipitation
between the proteins, suggesting that any interaction is too weak or transient to be detected
by this method, or that others proteins transmit the signal from PTEN to dPLCXD. Further
characterization of the proteins that interact with both dPLCXD and PTEN may therefore
provide information as to how PTEN and dPLCXD functionally interact. Interestingly, we showed
that a minimal chimera composed of the PBD and C2 domains of PTEN reduces PtdIns(4,5)P2
levels on endomembranes in dOCLR-depleted cells. While the tumor suppressor role of PTEN is
mainly attributed to its PtdIns(3,4,5)P3 phosphatase activity, some studies have shown that
PTEN can also function independently of its catalytic activity (Song et al., 2012). For instance,
PTEN was shown to regulate cell migration independently of its phosphatase activity
(Raftopoulou et al., 2004), through its C2 domain. Here, we show that the PBD and C2 domains
of PTEN are necessary and sufficient to restore PtdIns(4,5)P2 homeostasis in dOCRL depleted
cells. The PBD domain of PTEN is known to bind to PtdIns(4,5)P2. C2 domains are found in more
19
than 100 proteins and are known to mediate membrane binding through phospholipid
interaction (Corbalan-Garcia and Gomez-Fernandez, 2014). In addition, they have also been
shown to directly bind to phosphotyrosine motifs, as for the C2 domain of the serine/threonine
Protein Kinase C delta (Benes et al., 2005), or to mediate protein-protein interaction, as for the
C2 domain of synaptotagmins that is responsible of its interaction with syntaxins (Li et al.,
1995). Therefore, identification of proteins that specifically interact with the PBD and C2
domains of PTEN will provide valuable information to better understand how PTEN controls
dPLCXD activation.
Tight control of PtdIns(4,5)P2 homeostasis is crucial for several important functions such
as cell growth, division and migration. Here we demonstrate that in addition to
dephosphorylating PtdIns(3,4,5)P3 into PtdIns(4,5)P2, PTEN also reduces the levels of
PtdIns(4,5)P2, its own product, on endosomes. After hydrolysis of PtdIns(4,5)P2 by PLCs, two
second messengers are produced. They both activate several other signaling pathways: inositol
1,4,5-trisphosphate promotes release of calcium from the endoplasmic reticulum, and
diacylglycerol activates Protein Kinase C. Therefore, a better understanding of this novel
PTEN/dPLCXD pathway will certainly have several important repercussions on how we envision
the role of PTEN as a tumor suppressor.
PLC activation can rescue the consequences of dOCRL depletion.
We showed that overexpression of PTEN or dPLCXD is able to rescue the loss of dOCRL in
Drosophila cells. However, an important question is to understand why endogenous levels of
20
PTEN and PLCXD do not compensate for dOCRL depletion in Drosophila cells, or indeed in Lowe
syndrome or Dent-2 patients. This could be explained by a difference of abundance and/or
subcellular localisation of PTEN and PLCXD vs OCRL1. For instance, PTEN and PLCXD could be
both expressed but at an insufficient level to be able to fully rescue OCRL1 loss. However, it is
important to notice that, to rescue multinucleation of dOCRL-depleted cells, the PLC activator
requires endogenous dPLCXD (Fig. 8E). This shows that at its endogenous level, dPLCXD can
compensate for dOCRL function when it is chemically activated. Thus another possibility is that
the level of enzymatic activity of PLCXD phosphatases is tightly regulated, possibly by PTEN.
Interestingly, Dent-2 disease and Lowe syndrome are both caused by loss of OCRL1 activity.
However people suffering from Dent-2 disease present a milder phenotype than patients
affected by Lowe syndrome (Bokenkamp et al., 2009). This suggests that other differences may
affect the ability to compensate for loss of OCRL1 in individuals suffering from Dent-2 disease
or Lowe syndrome. In light of our findings, the milder phenotype in Dent-2 disease may arise
from different levels of activation of members of the PLCXD family. Therefore a clinical study
comparing the relative amounts, localization and potential mutations of PTEN and PLCXDs in
tissues affected by the Lowe syndrome vs Dent-2 disease will allow a better understanding of
these rare genetic diseases.
The Lowe syndrome and Dent-2 disease are incurable rare genetic syndromes and all medical
efforts are limited to treating their multiple clinical manifestations. We showed that in
Drosophila cells, depletion of the PtdIns4P-kinase, Skittles together with dOCRL totally rescues
the cytokinetic defects observed upon dOCRL depletion alone. As already proposed by others
(Vicinanza et al., 2011), PtdIns4P 5-kinase specific inhibitors could represent a therapeutic

21
strategy to treat Lowe syndrome and Dent-2 disease patients. We discover here that chemical
activation of PLCs can rescue depletion of OCRL1 in several disease models. The PLC chemical
activator used in our study has been already used in a mouse model without signs of toxicity
(Kim et al., 2012). Thus, chemical activation of PLCs by m-3M3FBS could also represent a new
therapeutic strategy to treat Lowe syndrome and Dent-2 disease patients.
22
MATERIALS AND METHODS
DNA Constructs
PTEN-GFP, SKTL-GFP and GFP-Rab11 were previously described in (Roubinet et al., 2011, Ben El
Kadhi et al., 2011).
PTENC132S-mCherry, PTENC132S-GFP, and PTEN domain mutants were obtained by inverse PCR
using high fidelity Phusion polymerase (New England Biolabs) with the following primers:
PTENC132S Forward 5’ TAAAGCTGGAAAGCGCAGAACCGGTACCATGATCTGCG 3’,
PTENC132S Reverse 5’ GAGTGCACGGCTACAACATTGGACGAATCTTCC 3’,
PTEN-PBD Forward 5’ TACAAAGAAAAAGGATACGATTTGG 3’,
PTEN-PBD Reverse 5’ CATGTTGCTGCAGAATTCCACCACACTGG 3’,
PTEN-phosphatase Forward 5’ TCTGTTCCATATTCGAAAGTAAGCC 3’,
PTEN-phosphatase Reverse 5’ TCTTCGTATACGTTTTTTACTCACTACATTGC 3’,
PTEN-C2 Forward 5’ TCTAATTTTAGCAATGATGTTCAAGCTGAAGCG 3’,
PTEN-C2 Reverse 5’ TCTACTTGAACAAACTAGTTTGG 3’,
PTEN-CTerm Forward 5’ TCTCCGCGGGCCCGGGATCCACCGGTCGCCACC 3’,
PTEN-CTerm Reverse 5’ TCTCTCTGCCTCAAAAACGATTGAAATC 3’.
dPLCXD cDNA (CG14945 - UniProt-Q9VKC3_DROME) was synthetized by Lifetechnologies and
cloned under an actin promotor. It was fused with the V5 tag “GKPIPNPLLGLDST” in C terminal
position with a linker “APV”.
dPLCXD (HL)2 mutant was obtained after two successive inverse PCR using high fidelity Phusion
polymerase (New England Biolab) on dPLCXD-V5 with the following primers :
dPLCXD-H219L Forward 5’ TTGACTCCGGCTCCTATCGTCCCAACTTCGATCCG 3’,
dPLCXD-H219L Reverse 5’ GGGTGCCTGGTATGAAAAGATCTCTCAGACG 3’,
dPLCXD-H277L Forward 5’ TCGGGATTACAAAACAACGTCCGCTGCAGG 3’
dPLCXD-H277L Reverse 5’ GATAGATGAAAAACGGATCGGGTGAGTTTCG 3’.
S2 Cell culture, dsRNA treatment, transfection and Drug treatment:
23
Drosophila melanogaster S2 cells were grown at 27°C in Schneider’s Drosophila medium
complemented with 20% FBS, Penicillin and Streptomycin (Invitrogen). For dsRNA knockdown,
dsRNA was produced using T7 RiboMax express large scale RNA production system (Promega).
dsRNAs were amplified from plasmid or genomic DNA using the following Primers:
PTEN-Reverse 5’ TAATACGACTCACTATAGGGAGACAAGGTTTTCAGTCTATCTGG 3’,
PTEN-Forward 5’ TAATACGACTCACTATAGGGAGATATCCAGCACCGGATAAACTA 3’,
dOCRL-Reverse 5’ TAATACGACTCACTATAGGGAGAATCGCGTAGATATCCGGCGGC 3’,
dOCRL -Forward 5’ TAATACGACTCACTATAGGGAGAAAGGACATTGTCAAGGAGCGC 3’,
CG14945-Forward 5’TAATACGACTCACTATAGGGAGGAGATTATCATATTTGGACTCAAGG 3’,
CG14945-Reverse 5’TAATACGACTCACTATAGGGAGCTCTGGGGTCAGCTCCGCCATATCGG 3’,
CG10747-Forward 5’ TAATACGACTCACTATAGGGCGCAACAGTTAAACGAACCC 3’,
CG10747-Reverse 5’ TAATACGACTCACTATAGGGTGATTATCGACAGGTCACGC 3’,
CCG3620-Forward 5’ TAATACGACTCACTATAGGGAAAAACTGAAGCCTTGGAAAAA 3’,
CG3620-Reverse 5’ TAATACGACTCACTATAGGGCGAGTATGGGAAATTCTCGG 3’,
CG4200-Forward 5’ TAATACGACTCACTATAGGGTTGTGCGTGAGATTGATTCAG 3’,
CG4200-Reverse 5’ TAATACGACTCACTATAGGGATGCCCATTAAATTGATGCC 3’,
CG4574-Forward 5’ TAATACGACTCACTATAGGGGCCTGCCGGGAGTACACTT 3’,
CG4574-Reverse 5’ TAATACGACTCACTATAGGGGCAGCTGGTGCATAACCTCT 3’.
For functional experiments, cells were cultured in 24 or 96-well plates (Greiner Bio-One) for 6
days. Cells were treated with 3.5 μg of dsRNA at day 0 and at day 3. 2 days before fixation cells
were transfected with the indicated cDNA using Fugene HD (Promega).
For PLC inhibition experiments, cells were treated with 40 μM of U-73122, 24 hours before
fixation (Calbiochem). For PLC activation experiments, cells were treated with 25 μM m-
3M3FBS (Tocris) or its inactive analog o-3M3FBS (Tocris) 24 hours before fixation.
Quantification of multinucleation and PtdIns(4,5)P2 homeostasis ratio:
For quantification of multinucleation cells were fixed using Paraformaldehyde 4% (Alfa Aesar) for 20 minutes. Coverslips were then washed using TBS. Cells were permeabilized and blocked for at least 1hour in TBS containing 0.02% Saponin and 2% BSA (TBS-Saponin-BSA). F-actin was stained using 1/100 Texas-RedTM-X Phalloidin (Invitrogen T7471) or 1/50 Alexa Fluor 647 Phalloidin (Invitrogen A22287). dPLCXD-V5 was revealed by immunostaining using a monoclonal anti-V5 antibody (1/1000, Invitrogen R960-25) and a goat Alexa-488 conjugated secondary antibody anti-mouse (1/400, Invitrogen A11017). Coverslips were mounted using
24
Vectashield with Dapi (Vector Laboratories). To assess multinucleation, at least 300 cells (n>300) were counted manually per condition per N individual experiment unless otherwise specified. PtdIns(4,5)P2 homeostasis ratio was described previously(Ben El Kadhi et al., 2011). Briefly, a
stable cell line expressing Tubby-GFP was fixed and permeabilized. A rabbit anti GFP antibody
(Invitrogen A6455) and a secondary Alexa 488 conjugated antibody (Invitrogen A11070) was
used to stain GFP. Images were acquired using a DeltaVision elite microscope (GE) with a 60x
planApo Olympus objective and a CoolSnap HQ2 camera (Photometrics) or a Nikon A1R Nikon
confocal microscope with 60x / 1.4 Plan Apo VC DIC N2 objective or 100x / 1.4 Plan Apo DIC N2
objective. For the quantification of Tubby-GFP endomembranes/plasma membrane ratio,
images were analyzed using ImageJ software (NIH). Tubby-GFP intensity were measured at the
plasma membrane and inside the cell of each individual cell and their background were
measured and subtracted. Cells positive for Tubby-GFP vesicles were determined manually.
Images were treated using SoftWorx software (GE), ImageJ software (NIH) and Photoshop (Adobe). Co-localization Immunofluorescence
Drosophila melanogaster S2 cells were plated on Concanavalin A (0.5ug/ul Sigma C2010) coated
coverslips for 3 hours. Then cells were fixed using Paraformaldehyde 4% (Alfa Aesar) for 20
minutes and washed using TBS. Cells were permeabilized and blocked for at least 1hour in TBS
containing 0.02% Saponin and 2% BSA (TBS-Saponin-BSA). Cells were incubated with primary
antibody diluted in TBS-Saponin-BSA overnight at room temperature (RT), washed three times
in TBS-Saponin-BSA, and incubated with secondary antibodies diluted in TBS-Saponin-BSA for 1
hour at RT. Cells were washed two times in TBS-Saponin-BSA and a last time in TBS, before
being mounted in Vectashield medium with DAPI (Vector Laboratories). Images were taken
using a Zeiss confocal microscope LSM880 NLO using a 63x / 1.4 Plan-Apochromat, DIC objectif.
Images were treated using ZEN lite software (ZEISS Microscopy), ImageJ software (NIH) and
Photoshop (Adobe).
Immunostaining was performed using a mouse anti-Rab7 antibody (1/200, DSHB), a monoclonal
anti-V5 (1/1000, Invitrogen R960-25) or a rabbit anti-V5 (1/500, Abcam Ab9116), a goat Alexa-
488 conjugated secondary antibody anti-mouse (1/400, Invitrogen A11017), a goat Texas Red
conjugated secondary antibody anti mouse (1/200, Invitrogen T862).
Live cell imaging with LysoTrackerTM
Drosophila melanogaster S2 Cells were plated for 3 hours in 96-well plates (Sensoplate microplate Greiner Bio-One) previously coated with Concanavalin A (0.5ug/ul Sigma C2010). Then cells were incubated for 1 hour with LysoTrackerTM Deep Red (Invitrogen L12492) or LysoTrackerTM Green DND-26 (Invitrogen L7526) at 75nM. LysoTracker was washed with fresh medium, and images were taken with a Zeiss confocal microscope LSM880 NLO using a 63x /
25
1.4 Plan-Apochromat, DIC objectif. Images were treated using ZEN lite software (ZEISS Microscopy), ImageJ software (NIH) and Photoshop (Adobe).
Abscission assays in Human cells
The Lowe patient and normal renal cell lines have been established and characterized in
reference (Dambournet et al., 2011), after informed consent was obtained from the patient and
his parents, in accordance with French law. HeLa cells were grown in DMEM medium (Gibco
BRL) supplemented with 10% fetal bovine serum, 100 U/ml penicillin/streptomycin and 2 mM
glutamine. Lowe cells and control cells were grown in DMEM/F12 (GIBCO BRL) supplemented
with 10% fetal bovine serum, ITS supplemented, 4pg/mL triiodothyronine, 36ng/ml
dexamethasone, 10ng/ml EGF, 100 U/ml penicillin/streptomycin and 2 mM glutamine at 33°C.
For silencing experiments, HeLa cells were transfected with the corresponding siRNA once using
HiPerFect (Qiagen) following the manufacturer’s instructions. siRNAs were transfected for 72h
before imaging. For time-lapse phase contrast microscopy: Transfected cells were plated on 35
mm glass dishes (Iwaki) and put in an open chamber (Life imaging) equilibrated in 5% CO2 and
maintained at 37°C. Time-lapse sequences were recorded at 10 min for 60 hr on a Nikon Eclipse
Ti Inverted Microscope with a 20x0.45NA plan fluor ELWD objective lens controlled by the
Metamorph 6.1 software (Universal Imaging). This microscope was equipped with a cooled CCD
camera (HQ2; Ropper Scientific). m-3M3FBS (Tocris) or its inactive analog o-3M3FBS (Tocris)
diluted in DMSO have been added at 25 μM during time-lapse recording.
Zebrafish strains and husbandry
Zebrafish were maintained in standard conditions (Westerfield, 2000) at the University of
Manchester Biological Services Unit according to the UK Animals Act 1986. The ocrl-/- mutant
line (ZDB-GENO-120531–1) has been described previously (Ramirez et al 2012). Wild type fish
were of AB background.
Lysine-fixable 10 kDa dextran labelled with Alexa 488 (Molecular Probes) was prepared in PBS
at 2 µg/µl final concentration. Zebrafish embryos at 72 hpf (hours post fertilisation) were
treated for 60 minutes with DMSO control (0.005% DMSO), 5 µM m-3m3fbs or 5 µM o-3m3fbs
by addition to the water. Embryos were then anaesthetised with 0.2 mg/ml MS222 (Sigma) in
chorion water, and tracer injected into the common cardinal vein using a glass micropipette PLI-
90 Pico-Injector (Harvard Apparatus). Embryos were returned to the respective drug treatments
and incubated at 29oC. Pronephric accumulation was assessed 2 hours after injection on whole
mount embryos using a fluorescent dissecting stereomicroscope (Leica MZ10F). Statistical
analysis was performed using the Pearson’s chi-squared test with Prism software (Prism
Software Corporation).
ACKNOWLEDGMENT: We thank Dr. F. Legendre for generating the patient cell lines described
in reference (Dambournet et al., 2011). This work has been supported by CIHR (MOP 133683)
and CRSNG découverte to SC laboratory; Institut Pasteur, CNRS, FRM (Equipe FRM
DEQ20120323707), ANR (AbCyStem) and the "Association du Syndrome de Lowe" to AE
26
laboratory. AJC and ML were supported by a research grant from the Lowe Syndrome Trust
(ML/MU/2012). K.B.E.K held a doctoral training scholarship from the Fonds de la Recherche du
Québec en Santé and was also partially supported by a doctoral scholarships from “La
Fondation Desjardins”, from “La Fondation du Grand Défi Pierre Lavoie” and from Montreal
University’s molecular biology program. V.E.M held a doctoral scholarship from IRIC and from
Montreal University’s molecular biology program.
AUTHOR CONTRIBUTIONS
S.C. managed the project. S.C., V.E.M, K.B.E.K., M.L. and A.E. conceptualized and designed the
experiments. V.E.M, K.B.E.K., C.C., A. J-C., E.B. and B.D. performed the experiments. S.C., V.E.M,
K.B.E.K., M.L. and A.E. analyzed the data. S.C., V.E.M, K.B.E.K., M.L. and A.E. prepared the
figures for the manuscript. S.C., V.E.M and K.B.E.K. wrote the manuscript with input from all
coauthors.
27
FIGURE LEGENDS.
Figure 1. PTEN overexpression prevents cytokinesis and PtdIns(4,5)P2 homeostasis defects in dOCRL depleted cells, independently of its enzymatic activity.
A. A Schematic depicting the PtdIns pathway. The enzymes in green are the focus of this study. B. 4 days after dOCRL dsRNA first treatment, Drosophila melanogaster S2 cells were transfected by the indicated GFP tagged constructs. After 2 more days of dOCRL dsRNA treatment and transgene expression, cells were labelled for F-actin (red) and DNA (blue). Asterisks show multinucleated cells. C. The graph represents the percentage of multinucleated S2 cells quantified following the indicated treatments; blue dots show individual independent experiments with at least 300 cells/experiment (bars represents mean and SD). P-values (One-way ANOVA) were calculated against the dOCRL dsRNA condition. ns, non-significant ; ****, P < 0.0001. D. S2 Cells stably expressing low levels of the PtdIns(4,5)P2 biosensor, Tubby-GFP, were treated or not (2 bottom rows and top row, respectively) with dOCRL dsRNA. After 4 days of dsRNA treatment, cells were transfected with PTENC132S-mCherry (red) (bottom row). After 2 more days, cells were labelled for DNA (blue) and Tubby-GFP was revealed using an anti-GFP antibody (green). E. The ratio of Tubby-GFP fluorescence associated with endomembranes to that associated with the plasma membrane was measured using image J on fixed S2 cells. P-values (Kruskal-Wallis test) were calculated against the non-treated condition. ns, non-significant ; ****, P < 0.0001. N=1, total number of cells >40. Dots represent the ratio for a single cell, bars represents mean and SD.
Figure 2. The PBD and C2 domains of PTEN are necessary and sufficient to prevent the effects of dOCRL depletion.
A. A schematic depicting the five domains of PTEN and the PTEN constructs used in this study. B. The graph represents the percentage of multinucleated S2 cells quantified following the indicated treatments; blue dots show individual independent experiment with at least 300 cells/experiment (bars represents mean and SD). Note that multinucleation levels of control and dOCRL-depleted cells was already shown in Figure 1B. P-values (One-way ANOVA) were calculated against the dOCRL dsRNA condition. ns, non-significant ;*, P <0.05; ****, P < 0.0001. C. dOCRL dsRNA depleted S2 cells were transfected after 4 days of dsRNA treatment and fixed after 2 days of expression of the indicated GFP tagged PTEN constructs. Cells were labelled for F-actin (red) and DNA (blue). Asterisks show multinucleated cells. D & E. The ratio of Tubby-GFP fluorescence associated with endomembranes to that associated with the plasma membrane was measured using image J on fixed S2 cells. P-values (Kruskal-Wallis test) were calculated against the non-treated condition. ns, non-significant ; **, P < 0.01; ****, P < 0.0001. N=1, total number of cells >40 for panel D and >30 for panel E. Dots represent the ratio for a single cell, bars represents mean and SD. Note that the ratio of control and dOCRL-depleted cells was already shown in Figure 1E.
Figure 3. PTEN reduces PtdIns(4,5)P2 levels on endosomes.
A,B,C and G. Two color merged channels is shown in the left row, two-color merged channels of the zoom is shown in the middle row and corresponding BW individual channels is shown in the right row. Note that BW individual channels are displayed in Fig. S3 A, B, C & D. A. S2 cells expressing mCh or PTENPBD-C2mCh or PTENC132SmCh (red) were immunostained for Rab7 (green). Arrows show co-localization of the indicated proteins on endosomes. Bar
10 m. B. S2 cells co-expressing mCh or PTENPBD-C2mCh or PTENC132SmCh (red) and GFP-Rab11 (green). Arrows
show co-localization of the indicated proteins on endosomes. Bar 10 m. C. S2 cells expressing mCherry (mCh) or PTENPBD-C2mCh or PTENC132SmCh (red) were incubated with LysoTracker Green (green). Arrows show acidic vesicles
where PTEN constructs and LysoTracker co-localize. Bar 10 m. D. The ratio of Tubby-GFP fluorescence associated with endomembranes to that associated with the plasma membrane was measured using image J on fixed S2 cells (dots represent the ratio for a single cell, bars represents mean and SD). Green dots represent single cell without Tubby-GFP internal vesicles; Red dots represent single cell with Tubby-GFP internal vesicles. P-values (Mann-Whitney test) were calculated against the non-treated condition for the ratio. ns, non-significant; ***, P < 0.001. N=3, total number of cells >160. E. Cells stably expressing low levels of the PtdIns(4,5)P2 biosensor, Tubby-GFP,
28
were treated (right) or not (left) with PTEN dsRNA. Bar 10 m. F. Percentage of cells with Tubby-GFP internal vesicles in control and PTEN depleted cells as depicted in D. P-values (one-way Anova) were calculated against the non-treated condition. ns, non-significant; ***, P < 0.001. N=3. total number of cells >160. G. S2 cells stably expressing low levels of the PtdIns(4,5)P2 biosensor, Tubby-GFP (green), were treated with PTEN dsRNA and were incubated with LysoTracker Deep Red (red). Arrows show acidic vesicles positive for the PtdIns(4,5)P2 biosensor,
Tubby-GFP. Bar 10 m.
Figure 4. A PLC activity is required downstream of PTEN to prevent the effects of dOCRL depletion.
A. Control cells (left row) or dOCRL dsRNA treated S2 cells (2 right rows) were transfected by the PTENC132S-GFP
(middle row) or PTENPBD-C2 (left row) after 4 days of dsRNA treatment. Cells were concomitantly treated by 40m of the PLC inhibitor U-73122. Cells were fixed after 2 days of expression of the transgenes and labelled for F-Actin (red) and DNA (blue). Asterisks show multinucleated cells. B. The graph represents the percentage of multinucleated S2 cells quantified following the indicated treatments; blue dots show individual independent experiment with at least 300 cells/experiment (bars represents mean and SD). Note that multinucleation levels of control and dOCRL-depleted cells was already shown in Figure 1B. Each P-values (one-way ANOVA) were calculated using against the dOCRL dsRNA condition *, P < 0.05, **P < 0.01, **** P < 0.0001.
Figure 5. dPLCXD acts downstream of PTEN to compensate for the effects of dOCRL depletion.
A. Cells were treated with the indicated dsRNA. After 4 days, cells were transfected or not (-) with PTENPBD-C2 to assay for dOCRL rescue. Cells were fixed after 2 days and labelled for F-Actin and DNA. The graph represents the percentage of multinucleated S2 cells quantified following the indicated treatments; blue dots show individual independent experiment with at least 300 cells/experiment (bars represents mean and SD). Each P-values (one-way ANOVA) were calculated against the dOCRL dsRNA condition. ns, non-significant; ***, P < 0.001. B. Evolutionary tree regrouping PLCXDs from Drosophila melanogaster, Bacillus cereus and Homo sapiens obtained by Multi-way Protein alignment with the scoring matrix BLOSUM 62 on Clone Manager. C. Top: domain structure of dPLCXD with the identified “Catalytic domain of phosphoinositide-specific phospholipase C-like phosphodiesterases superfamily” (PI-PLCc_GDPD_SF superfamily, light blue), the X domain (blue green) and the two catalytic histidines (orange). Middle: Conservation of the two catalytic histidines (orange) among Bacillus cereus PI-PLC, Homo sapiens PLCXD isoforms, and Drosophila melanogaster dPLCXD. The last row shows mutations of the two catalytic histidines. Alignment was done by Multi-way Protein alignment with the scoring matrix BLOSUM 62 on Clone Manager. Note that “NCBI conserved domain search” site was used to confirm the two catalytic histidine site of dPLCXD. (https://www.ncbi.nlm.nih.gov/Structure/cdd/wrpsb.cgi). D. 2 top rows: S2 cells were transfected with V5 tagged dPLCXD (left) or mutated V5 tagged dPLCXD (HL)2 (right); 2 bottom rows: Cells were treated with dOCRL dsRNA and transfected with V5 tagged dPLCXD (left) or mutated V5 tagged dPLCXD (HL)2 (right). Cells were then labelled for F-Actin (red) and DNA (blue), PLCXD constructs are shown in green. Asterisks
show multinucleated cells. Bar 10 m. E. Cells were treated with the dOCRL dsRNA. After 4 days, cells were transfected with dPLCXD or mutated dPLCXD (HL)2. The graph represents the percentage of multinucleated S2 cells quantified following the indicated treatments; blue dots show individual independent experiment with at least 300 cells/experiment (bars represents mean and SD). Each P-values (one-way ANOVA) were calculated against the dOCRL dsRNA condition. ns, non-significant; ****, P < 0.0001.
29
Figure 6. dPLCXD reduces PtdIns(4,5)P2 levels on endosomes.
A, B and F. Two color merged channels is shown in the left row, two-color merged channels of the zoom is shown in the middle row and corresponding BW individual channels is shown in the right row. Note that BW individual channels are displayed in Fig. S3 E, F & G. A. S2 cells expressing dPLCXD-V5 were immunostained for V5 (red) and
Rab7 (green). Arrows show co-localization of the indicated proteins on endosomes. Bar 10 m. B. S2 cells co-expressing dPLCXD-V5 and GFP-Rab11 (green) were immunostained for V5 (red). Arrows show co-localization of
the indicated proteins on endosomes. Bar 10 m. C. The ratio of Tubby-GFP fluorescence associated with endomembranes to that associated with the plasma membrane was measured using image J on fixed S2 cells (dots represent the ratio for a single cell, bars represents mean and SD). Green dots represent single cell without Tubby-GFP internal vesicles; Red dots represent single cells with Tubby-GFP internal vesicles. P-values (Mann-Whitney test) were calculated against the non-treated condition. ****, P < 0.0001. N=3, total number of cells >240. D. Cells stably expressing low levels of the PtdIns(4,5)P2 biosensor, Tubby-GFP, were treated (right) or not (left) with
dPLCXD dsRNA. Bar 10 m. E. Percentage of cells with Tubby-GFP internal vesicles in control and dPLCXD depleted cells as depicted in C. P-values (one-way Anova) were calculated against the non-treated condition. ns, non-significant; **, P < 0.01. N=3. F. S2 cells stably expressing low levels of the PtdIns(4,5)P2 biosensor, Tubby-GFP (green), were treated with dPLCXD dsRNA and were incubated with LysoTracker Deep Red (red). Arrows show
acidic vesicles positive for the PtdIns(4,5)P2 biosensor, Tubby-GFP. Bar 10 m.
Figure 7. PTEN acts through dPLCXD to rescue dOCRL depletion.
A. S2 cells co-expressing mCh or PTENPBD-C2mCh or PTENC132SmCh (red) and dPLCXD-V5, were immunostained for V5 (green). Arrows show vesicles where both indicated proteins localize. Two color merged channels is shown in the left row, two-color merged channels of the zoom is shown in the middle row and corresponding BW individual
channels is shown in the right row. Note that BW individual channels are displayed in Fig. S3H. Bar 10 m. B. Cells were treated or not with dOCRL and PTEN dsRNA. After 4 days, cells were transfected with dPLCXD. The graph represents the percentage of multinucleated S2 cells quantified following the indicated treatments; blue dots show individual independent experiment with at least 200 cells/experiment (bars represents mean and SD). Each P-values (one-way ANOVA) were calculated against the control condition. ns, non-significant; ****, P < 0.0001. C. Representative images used for the histogram in B. Left row: PTEN depleted S2 cells were transfected with V5 tagged dPLCXD or mutated V5 tagged dPLCXD (HL)2 (green); Right row: Cells were treated with PTEN and dOCRL dsRNA and transfected with V5 tagged dPLCXD or mutated V5 tagged dPLCXD (HL)2 (green). Cells were then
labelled for F-Actin (red) and DNA (blue). Asterisks show multinucleated cells. Bar 10 m.
Figure 8. Chemical activation of PLCs prevents dOCRL depletion in Drosophila, dependently of dPLCXD.
A. The ratio of Tubby-GFP fluorescence associated with endomembranes to that associated with the plasma
membrane was measured using image J on fixed cells (dots represent the ratio for a single cell, bars represents
mean and SD). P-values (Kruskal-Wallis test) were calculated against the non-treated condition. ns, non-significant;
****, P < 0.0001. (N=3, total number of cells >190) B. Representative images used for the histogram in A. Cells
stably expressing low levels of the PtdIns(4,5)P2 biosensor, Tubby-GFP, were treated for 24 hours with the PLC
activator m-3M3FBS or its inactive analog o-3M3FBS both at 25M. Bar 10 m. C. Control cells (upper panel) or
dOCRL dsRNA treated S2 cells (2 bottom panels) were treated for 24 hours with the PLC activator m-3M3FBS or its
inactive analog o-3M3FBS both at 25M. Cells were fixed and labelled for F-Actin (red) and DNA (blue). D, E and F
The graphs represent the percentage of multinucleated S2 cells quantified following the indicated treatments; blue
dots show individual independent experiment with at least 300 cells/experiment (bars represents mean and SD). P-
values (One-way ANOVA) were calculated against the non-treated condition. ns, non-significant; *, P < 0.05; **, P <
0.01; ****, P < 0.0001.
30
Figure 9. Model for regulation of PtdIns(4,5)P2 homeostasis on endosomes. In Drosophila, PTEN, independently of its enzymatic activity, requires PLCXD to hydrolyze PtdIns(4,5)P2. This pathway can be chemically activated by m-3M3FBS to compensate for OCRL loss independently of PTEN but dependently on dPLCXD.
Figure 10. Chemical activation of PLC rescues OCRL phenotypes in Lowe syndrome patient cells and a zebrafish Lowe syndrome model. A. Normal renal epithelial cells from a donor not mutated in OCRL and renal epithelial cells from a Lowe syndrome patient were treated with the PLC activator m-3M3FBS or its inactive analog o-3M3FBS. After treatment cell divisions were recorded by time-lapse microscopy. The curves represent the distribution of the abscission times in the indicated cell populations. B. Mean abscission times were measured on time-lapse movies in the normal and Lowe renal epithelial cells treated with the PLC activator m-3M3FBS or its inactive analog o-3M3FBS. C. Confocal images of pronephric tubules (indicated by a dashed line) in wildtype (WT) and Ocrl-/- zebrafish mutant embryos. The indicated embryos were injected with Alexa 488-10 kDa dextran (green) and treated with the PLC activator m-3M3FBS or its inactive analog o-3M3FBS. D. Pronephric accumulation in the indicated embryos was monitored by fluorescence microscopy. ns, non-significant; *, P < 0.05; **, P < 0.01; ***, P
< 0.001; ****, P < 0.0001 (Pearson’s chi-squared test). Bar 10 m.
Figure S1. A balance of Skittles and dOCRL activities regulates PtdIns(4,5)P2 on endomembranes and cytokinesis
outcome.
A. S2 cells were transiently transfected with Skittles-GFP, fixed and labelled for F-Actin (red) and DNA (blue). Note
that Skittles expression triggers endosome enlargement. Bar 10 m. B. dOCRL depleted S2 cells were transiently
transfected with Skittles-GFP, fixed and labelled for F-Actin (red) and DNA (blue). Note that Skittles expression
triggers endosome enlargement. Bar 10 m. C, D and E The graphs represent the percentage of multinucleated S2
cells quantified following the indicated treatments; blue dots show individual independent experiment with at
least 300 cells/experiment (bars represents mean and SD). P-values (One-way ANOVA) were calculated against the
non-treated condition. ns, non-significant; ****, P < 0.0001.
Figure S2. The PBD and C2 domains of PTEN are necessary to rescue dOCRL depletion. A. dOCRL dsRNA treated
cells were transfected by the indicated cDNA after 4 days of dsRNA treatment and fixed 2 days after. Cells were
labelled for F-actin (red) and DNA (blue). Asterisks show multinucleated cells. Bar 10 m. B. Western Blot on cell
extract transiently transfected by the PTEN constructs used in Figure 1 and 2. The chimera were revealed using a
-GFP antibody. Note that some chimeras are cleaved and the Western blot revealed cleaved GFP.
Figure S3. PTEN, dPLCXD and the PtdIns(4,5)P2 biosensor Tubby-GFP co-localize with endosome markers.
A. S2 cells expressing PTENPBD-C2mCh or PTENC132SmCh (red) were immunostained for Rab7 (green). Arrows show
co-localization of the indicated proteins on endosomes. Bar 10 m. B. S2 cells co-expressing PTENPBD-C2mCh or PTENC132SmCh (red) and GFP-Rab11 (green). Arrows show co-localization of the indicated proteins on endosomes.
Bar 10 m. C. S2 cells expressing PTENPBD-C2mCh or PTENC132SmCh (red) were incubated with LysoTracker Green
(green). Arrows show acidic vesicles where PTEN constructs and LysoTracker co-localize. Bar 10 m. D. S2 cells stably expressing low levels of the PtdIns(4,5)P2 biosensor, Tubby-GFP (green), were treated with PTEN dsRNA and were incubated with LysoTracker Deep Red (red). Arrows show acidic vesicles positive for the PtdIns(4,5)P2
biosensor, Tubby-GFP. Bar 10 m. E. S2 cells expressing dPLCXD-V5 were immunostained for V5 (red) and Rab7
31
(green). Arrows show co-localization of the indicated proteins on endosomes. Bar 10 m. F. S2 cells co-expressing dPLCXD-V5 and GFP-Rab11 (green) were immunostained for V5 (red). Arrows show co-localization of the indicated
proteins on endosomes. Bar 10 m. G. S2 cells stably expressing low levels of the PtdIns(4,5)P2 biosensor, Tubby-GFP (green), were treated with dPLCXD dsRNA and were incubated with LysoTracker Deep Red (red). Arrows show
acidic vesicles positive for the PtdIns(4,5)P2 biosensor, Tubby-GFP. Bar 10 m. H. S2 cells co-expressing PTENPBD-
C2mCh or PTENC132SmCh (red) and dPLCXD-V5, were immunostained for V5 (green). Arrows show vesicles where
both indicated proteins localize. Bar 10 m.
Figure S4. Depletion of other PLCs than dPLCXD does not affect PTEN rescue of dOCRL depletion.
A. The graph represents the percentage of multinucleated S2 cells quantified following the indicated treatments;
blue diamonds show the percentage of individual independent experiments with n>300 cells (bars represents
mean and SD). P-values (t-test) were calculated against the non-treated condition. ns, non-significant. B. The graph
represents the percentage of multinucleated cells quantified following the indicated treatments; blue diamonds
show the percentage of individual independents experiments, n>300 cells (bars represents mean and SD). Each P-
values (one-way ANOVA) were calculated against the dOCRL dsRNA condition. ns, non-significant; **, P < 0.01, ***,
P < 0.001. C. The graph represents the percentage of multinucleated S2 cells quantified following the indicated
treatments; blue diamonds show the percentage of individual independent experiments with n>300 cells (bars
represents mean and SD). P-values (t-test) were calculated against the non-treated condition. ns, non-significant.
Figure S5. Chemical activation of PLC rescues delayed abscission in HeLa cells treated with OCRL RNai. A. DMSO
(Vehicle), the PLC activator m-3M3FBS or its inactive analog o-3M3FBS was added to HeLa cells treated with the
indicated RNAi. Cell divisions were recorded by time-lapse microscopy. The curves represent the distribution of the
abscission times in the indicated cell populations. B. Mean abscission times were measured on time-lapse movies
quantified in A. ns, non-significant; **, P < 0.01, ***, P < 0.001.

32
REFERENCES
BAE, Y. S., LEE, T. G., PARK, J. C., HUR, J. H., KIM, Y., HEO, K., KWAK, J. Y., SUH, P. G. & RYU, S. H. 2003. Identification of a compound that directly stimulates phospholipase C activity. Mol Pharmacol, 63, 1043-50.
BALLA, T. 2013. Phosphoinositides: tiny lipids with giant impact on cell regulation. Physiol Rev, 93, 1019-137.
BEN EL KADHI, K., EMERY, G. & CARRENO, S. 2012. The unexpected role of Drosophila OCRL during cytokinesis. Commun Integr Biol, 5, 291-3.
BEN EL KADHI, K., ROUBINET, C., SOLINET, S., EMERY, G. & CARRENO, S. 2011. The Inositol 5-Phosphatase dOCRL Controls PI(4,5)P2 Homeostasis and Is Necessary for Cytokinesis. Current biology : CB, 21, 1074-9.
BENES, C. H., WU, N., ELIA, A. E., DHARIA, T., CANTLEY, L. C. & SOLTOFF, S. P. 2005. The C2 domain of PKCdelta is a phosphotyrosine binding domain. Cell, 121, 271-80.
BOCKENHAUER, D., BOKENKAMP, A., VAN'T HOFF, W., LEVTCHENKO, E., KIST-VAN HOLTHE, J. E., TASIC, V. & LUDWIG, M. 2008. Renal phenotype in Lowe Syndrome: a selective proximal tubular dysfunction. Clin J Am Soc Nephrol, 3, 1430-6.
BOKENKAMP, A., BOCKENHAUER, D., CHEONG, H. I., HOPPE, B., TASIC, V., UNWIN, R. & LUDWIG, M. 2009. Dent-2 disease: a mild variant of Lowe syndrome. J Pediatr, 155, 94-9.
CARIM, S. C., BEN EL KADHI, K., YAN, G., SWEENEY, S. T., HICKSON, G. R., CARRENO, S. & LOWE, M. 2019. IPIP27 Coordinates PtdIns(4,5)P2 Homeostasis for Successful Cytokinesis. Curr Biol, 29, 775-789 e7.
CAUVIN, C. & ECHARD, A. 2015. Phosphoinositides: Lipids with informative heads and mastermind functions in cell division. Biochim Biophys Acta, 1851, 832-43.
CAUVIN, C., ROSENDALE, M., GUPTA-ROSSI, N., ROCANCOURT, M., LARRAUFIE, P., SALOMON, R., PERRAIS, D. & ECHARD, A. 2016. Rab35 GTPase Triggers Switch-like Recruitment of the Lowe Syndrome Lipid Phosphatase OCRL on Newborn Endosomes. Curr Biol, 26, 120-8.
CHOUDHURY, R., DIAO, A., ZHANG, F., EISENBERG, E., SAINT-POL, A., WILLIAMS, C., KONSTANTAKOPOULOS, A., LUCOCQ, J., JOHANNES, L., RABOUILLE, C., GREENE, L. E. & LOWE, M. 2005. Lowe syndrome protein OCRL1 interacts with clathrin and regulates protein trafficking between endosomes and the trans-Golgi network. Molecular biology of the cell, 16, 3467-79.
CORBALAN-GARCIA, S. & GOMEZ-FERNANDEZ, J. C. 2014. Signaling through C2 domains: more than one lipid target. Biochim Biophys Acta, 1838, 1536-47.
DAMBOURNET, D., MACHICOANE, M., CHESNEAU, L., SACHSE, M., ROCANCOURT, M., EL MARJOU, A., FORMSTECHER, E., SALOMON, R., GOUD, B. & ECHARD, A. 2011. Rab35 GTPase and OCRL phosphatase remodel lipids and F-actin for successful cytokinesis. Nat Cell Biol, 13, 981-8.
DE LEO, M. G., STAIANO, L., VICINANZA, M., LUCIANI, A., CARISSIMO, A., MUTARELLI, M., DI CAMPLI, A., POLISHCHUK, E., DI TULLIO, G., MORRA, V., LEVTCHENKO, E., OLTRABELLA, F., STARBORG, T., SANTORO, M., DI BERNARDO, D., DEVUYST, O., LOWE, M., MEDINA, D. L., BALLABIO, A. & DE MATTEIS, M. A. 2016. Autophagosome-lysosome fusion triggers a lysosomal response mediated by TLR9 and controlled by OCRL. Nat Cell Biol, 18, 839-50.
33
DE MATTEIS, M. A., STAIANO, L., EMMA, F. & DEVUYST, O. 2017. The 5-phosphatase OCRL in Lowe syndrome and Dent disease 2. Nat Rev Nephrol, 13, 455-470.
DEL SIGNORE, S. J., BIBER, S. A., LEHMANN, K. S., HEIMLER, S. R., ROSENFELD, B. H., ESKIN, T. L., SWEENEY, S. T. & RODAL, A. A. 2017. dOCRL maintains immune cell quiescence by regulating endosomal traffic. PLoS Genet, 13, e1007052.
EMOTO, K., INADOME, H., KANAHO, Y., NARUMIYA, S. & UMEDA, M. 2005. Local change in phospholipid composition at the cleavage furrow is essential for completion of cytokinesis. J Biol Chem, 280, 37901-7.
ERDMANN, K. S., MAO, Y., MCCREA, H. J., ZONCU, R., LEE, S., PARADISE, S., MODREGGER, J., BIEMESDERFER, D., TOOMRE, D. & DE CAMILLI, P. 2007. A role of the Lowe syndrome protein OCRL in early steps of the endocytic pathway. Dev Cell, 13, 377-90.
ESSEN, L. O., PERISIC, O., KATAN, M., WU, Y., ROBERTS, M. F. & WILLIAMS, R. L. 1997. Structural mapping of the catalytic mechanism for a mammalian phosphoinositide-specific phospholipase C. Biochemistry, 36, 1704-18.
FIELD, S. J., MADSON, N., KERR, M. L., GALBRAITH, K. A., KENNEDY, C. E., TAHILIANI, M., WILKINS, A. & CANTLEY, L. C. 2005. PtdIns(4,5)P2 functions at the cleavage furrow during cytokinesis. Curr Biol, 15, 1407-12.
GELLATLY, S. A., KALUJNAIA, S. & CRAMB, G. 2012. Cloning, tissue distribution and sub-cellular localisation of phospholipase C X-domain containing protein (PLCXD) isoforms. Biochem Biophys Res Commun, 424, 651-6.
HEINZ, D. W., RYAN, M., BULLOCK, T. L. & GRIFFITH, O. H. 1995. Crystal structure of the phosphatidylinositol-specific phospholipase C from Bacillus cereus in complex with myo-inositol. EMBO J, 14, 3855-63.
ILMONEN, S., VAHERI, A., ASKO-SELJAVAARA, S. & CARPEN, O. 2005. Ezrin in primary cutaneous melanoma. Mod Pathol, 18, 503-10.
KADAMUR, G. & ROSS, E. M. 2013. Mammalian phospholipase C. Annu Rev Physiol, 75, 127-54. KIM, S. D., KIM, H. J., SHIM, J. W., LEE, H. Y., LEE, S. K., KWON, S., JUNG, Y. S., BAEK, S. H., PARK, J. S.,
ZABEL, B. A. & BAE, Y. S. 2012. Phospholipase C activator m-3M3FBS protects against morbidity and mortality associated with sepsis. J Immunol, 189, 2000-5.
KOLAY, S., BASU, U. & RAGHU, P. 2016. Control of diverse subcellular processes by a single multi-functional lipid phosphatidylinositol 4,5-bisphosphate [PI(4,5)P2]. Biochem J, 473, 1681-92.
LI, C., ULLRICH, B., ZHANG, J. Z., ANDERSON, R. G., BROSE, N. & SUDHOF, T. C. 1995. Ca(2+)-dependent and -independent activities of neural and non-neural synaptotagmins. Nature, 375, 594-9.
LIU, J., FAIRN, G. D., CECCARELLI, D. F., SICHERI, F. & WILDE, A. 2012. Cleavage furrow organization requires PIP(2)-mediated recruitment of anillin. Curr Biol, 22, 64-9.
MAEHAMA, T. & DIXON, J. E. 1998. The tumor suppressor, PTEN/MMAC1, dephosphorylates the lipid second messenger, phosphatidylinositol 3,4,5-trisphosphate. J Biol Chem, 273, 13375-8.
MAJZOUB, R. N., WONDER, E., EWERT, K. K., KOTAMRAJU, V. R., TEESALU, T. & SAFINYA, C. R. 2016. Rab11 and Lysotracker Markers Reveal Correlation between Endosomal Pathways and Transfection Efficiency of Surface-Functionalized Cationic Liposome-DNA Nanoparticles. J Phys Chem B, 120, 6439-53.
MEHTA, Z. B., PIETKA, G. & LOWE, M. 2014. The cellular and physiological functions of the Lowe syndrome protein OCRL1. Traffic, 15, 471-87.
NAGUIB, A., BENCZE, G., CHO, H., ZHENG, W., TOCILJ, A., ELKAYAM, E., FAEHNLE, C. R., JABER, N., PRATT, C. P., CHEN, M., ZONG, W. X., MARKS, M. S., JOSHUA-TOR, L., PAPPIN, D. J. & TROTMAN, L. C. 2015. PTEN functions by recruitment to cytoplasmic vesicles. Mol Cell, 58, 255-68.
34
NANDEZ, R., BALKIN, D. M., MESSA, M., LIANG, L., PARADISE, S., CZAPLA, H., HEIN, M. Y., DUNCAN, J. S., MANN, M. & DE CAMILLI, P. 2014. A role of OCRL in clathrin-coated pit dynamics and uncoating revealed by studies of Lowe syndrome cells. Elife, 3, e02975.
OLTRABELLA, F., PIETKA, G., RAMIREZ, I. B., MIRONOV, A., STARBORG, T., DRUMMOND, I. A., HINCHLIFFE, K. A. & LOWE, M. 2015. The Lowe syndrome protein OCRL1 is required for endocytosis in the zebrafish pronephric tubule. PLoS Genet, 11, e1005058.
PIRRUCCELLO, M. & DE CAMILLI, P. 2012. Inositol 5-phosphatases: insights from the Lowe syndrome protein OCRL. Trends in Biochemical Sciences, 37, 134-143.
QUINN, K. V., BEHE, P. & TINKER, A. 2008. Monitoring changes in membrane phosphatidylinositol 4,5-bisphosphate in living cells using a domain from the transcription factor tubby. J Physiol, 586, 2855-71.
RAFTOPOULOU, M., ETIENNE-MANNEVILLE, S., SELF, A., NICHOLLS, S. & HALL, A. 2004. Regulation of cell migration by the C2 domain of the tumor suppressor PTEN. Science, 303, 1179-81.
RAMIREZ, I. B., PIETKA, G., JONES, D. R., DIVECHA, N., ALIA, A., BARABAN, S. C., HURLSTONE, A. F. & LOWE, M. 2012. Impaired neural development in a zebrafish model for Lowe syndrome. Hum Mol Genet, 21, 1744-59.
ROUBINET, C., DECELLE, B., CHICANNE, G., DORN, J. F., PAYRASTRE, B., PAYRE, F. & CARRENO, S. 2011. Molecular networks linked by Moesin drive remodeling of the cell cortex during mitosis. J Cell Biol, 195, 99-112.
SHINDE, S. R. & MADDIKA, S. 2016. PTEN modulates EGFR late endocytic trafficking and degradation by dephosphorylating Rab7. Nat Commun, 7, 10689.
SMITH, R. J., SAM, L. M., JUSTEN, J. M., BUNDY, G. L., BALA, G. A. & BLEASDALE, J. E. 1990. Receptor-coupled signal transduction in human polymorphonuclear neutrophils: effects of a novel inhibitor of phospholipase C-dependent processes on cell responsiveness. J Pharmacol Exp Ther, 253, 688-97.
SONG, M. S., SALMENA, L. & PANDOLFI, P. P. 2012. The functions and regulation of the PTEN tumour suppressor. Nat Rev Mol Cell Biol, 13, 283-96.
SZENTPETERY, Z., BALLA, A., KIM, Y. J., LEMMON, M. A. & BALLA, T. 2009. Live cell imaging with protein domains capable of recognizing phosphatidylinositol 4,5-bisphosphate; a comparative study. BMC Cell Biol, 10, 67.
UNGEWICKELL, A., WARD, M. E., UNGEWICKELL, E. & MAJERUS, P. W. 2004. The inositol polyphosphate 5-phosphatase Ocrl associates with endosomes that are partially coated with clathrin. Proceedings of the National Academy of Sciences of the United States of America, 101, 13501-6.
VIAUD, J., MANSOUR, R., ANTKOWIAK, A., MUJALLI, A., VALET, C., CHICANNE, G., XUEREB, J. M., TERRISSE, A. D., SEVERIN, S., GRATACAP, M. P., GAITS-IACOVONI, F. & PAYRASTRE, B. 2016. Phosphoinositides: Important lipids in the coordination of cell dynamics. Biochimie, 125, 250-8.
VICINANZA, M., DI CAMPLI, A., POLISHCHUK, E., SANTORO, M., DI TULLIO, G., GODI, A., LEVTCHENKO, E., DE LEO, M. G., POLISHCHUK, R., SANDOVAL, L., MARZOLO, M. & DE MATTEIS, M. A. 2011. OCRL controls trafficking through early endosomes via PtdIns4,5P(2)-dependent regulation of endosomal actin. EMBO J.
WORBY, C. A. & DIXON, J. E. 2014. Pten. Annu Rev Biochem, 83, 641-69. YOSHIDA, A., HAYASHI, H., TANABE, K. & FUJITA, A. 2017. Segregation of phosphatidylinositol 4-
phosphate and phosphatidylinositol 4,5-bisphosphate into distinct microdomains on the endosome membrane. Biochim Biophys Acta Biomembr, 1859, 1880-1890.
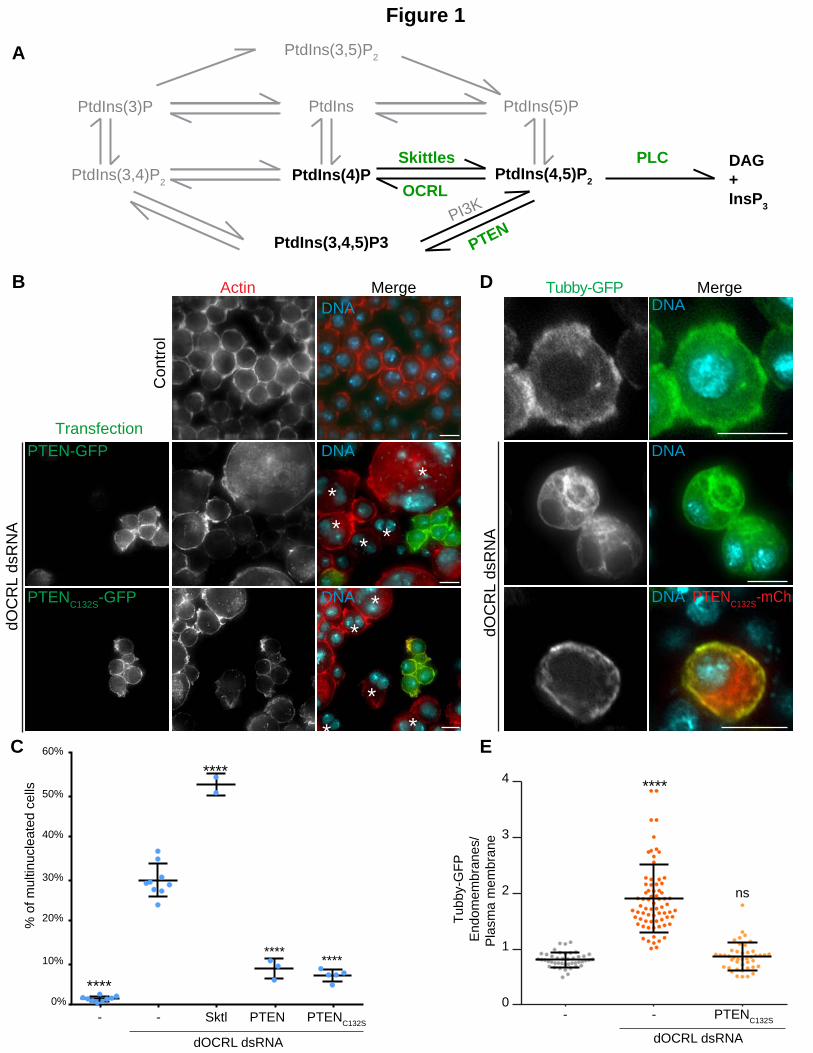
Figure 1
D Merge
dO
CR
L d
sR
NA
DNATubby-GFP
DNA
DNA PTENC132S
-mCh
****
ns
B
*
*
*
**
*
PTEN-GFP
dO
CR
L d
sR
NA
PTENC132S
-GFP
*
*
*
MergeActin
Transfection
DNA
DNA
Co
ntr
ol
DNA
E
Tubby-G
FP
Endom
em
bra
nes/
Pla
sm
a m
em
bra
ne
0
2
4
1
3
PTENC132S
dOCRL dsRNA
--
A
OCRL
PTEN
PLC
PI3K
PtdIns(3,5)P2
PtdIns
PtdIns(4)P
PtdIns(3,4,5)P3
PtdIns(4,5)P2PtdIns(3,4)P2
PtdIns(3)P PtdIns(5)P
Skittles DAG+ InsP3
C
0%
60%
40%
20%
Sktl PTEN PTENC132S
--
dOCRL dsRNA
% o
f m
ultin
ucle
ate
d c
ells
****
****
********
*
50%
30%
10%

AFigure 2
B
ns
ns
*
ns
0%
40%
30%
20%
10%
****
********
****
PTE
N-∆
PB
D--
dOCRL dsRNA
PTE
N-∆
Pta
se
PTE
N-∆
C2
PTE
N-∆
Cte
rm
PTE
N PB
D
PTE
N C2
PTE
N PB
D-C
2
% o
f m
ultin
ucle
ate
d c
ells
dOCRL dsRNA
** *
***
* **
*
*
*
*
**
**
*
*
*
*
**
**
*
**
*
* *
*
PT
EN
PB
D-G
FP
PT
EN
C2-G
FP
PT
EN
PB
D-C
2-G
FP
C
ActinDNA
MergeTransfectionPTEN-∆Ptase
PTEN-∆C2
PTEN-∆Cterm
PBD Phosphatase C2 C-tail
PTENPBD
PTENC2
PTENPBD-C2
1 23 194 337 515
PTEN
PDZ
PTEN-∆PBD
D
Tu
bby-G
FP
Endom
em
bra
nes/
Pla
sm
a m
em
bra
ne
0
2
4
1
3
PTENPBD-C2
dOCRL dsRNA
--
****
ns
E
Tu
bb
y-G
FP
En
do
me
mb
ran
es/
Pla
sm
a m
em
bra
ne
0
2
4
1
3
PTENC132S
PTENPBD-C2
-
****
**
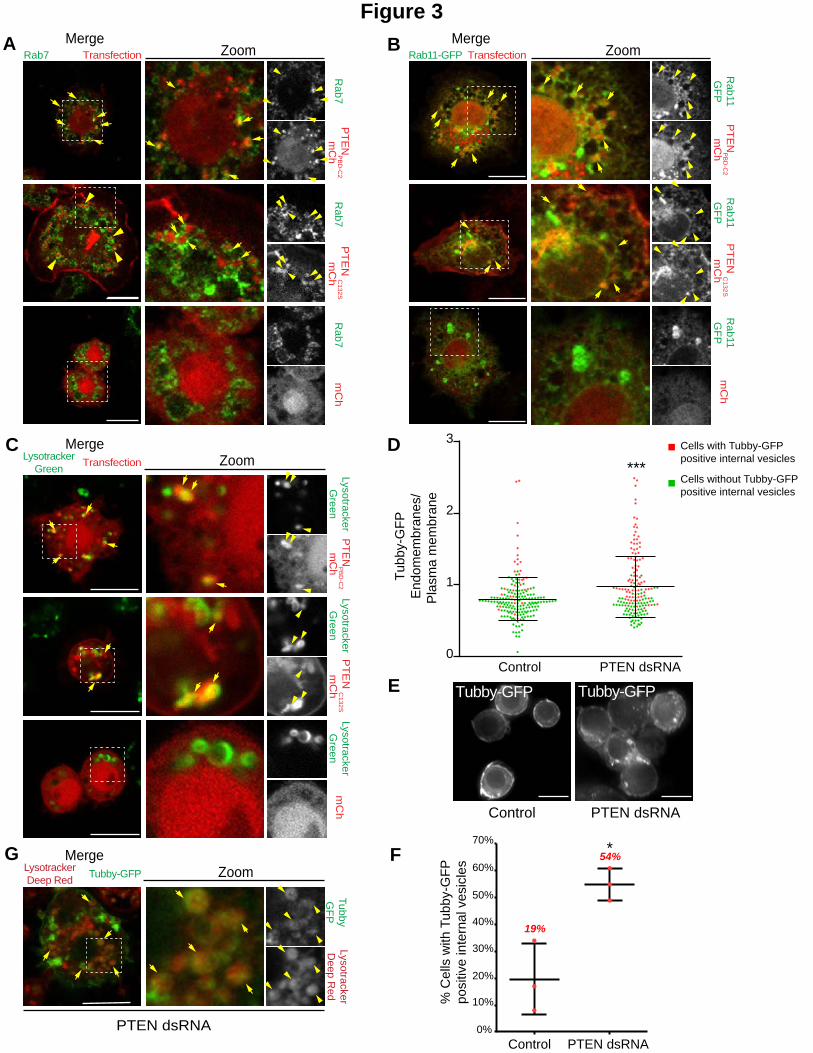
PT
EN
PB
D-C
2
mC
h
Lysotra
cker
Gre
en
PT
EN
C
132S
mC
h
Lysotra
cker
Gre
en
PT
EN
PB
D-C
2
mC
h
Rab11
GF
P
PT
EN
C
132S
mC
h
Rab11
GF
P
PT
EN
C
132S
mC
hR
ab7
Figure 3
E Tubby-GFP Tubby-GFP
Control PTEN dsRNA
F
0
2
1
3
PTEN dsRNAControl
Tubby-G
FP
Endom
em
bra
nes/
Pla
sm
a m
em
bra
ne
***
Cells with Tubby-GFP
positive internal vesicles
Cells without Tubby-GFP
positive internal vesicles
DC
A Merge
Lysotra
cker
Deep R
ed
Tubby
GF
P
G
PTEN dsRNA
B
Zoom
Zoom Zoom
Zoom
mC
hR
ab7
mC
hR
ab11
GF
P
mC
hLysotra
cker
Gre
en
TransfectionRab7
Merge
TransfectionLysotracker
Green
MergeTransfectionRab11-GFP
Merge
Tubby-GFPLysotracker
Deep Red
0%
10%
20%
50%
60%
70%
30%
40%
PTEN dsRNAControl
% C
ells
with T
ubby-G
FP
po
sitiv
e inte
rnal vesic
les
19%
54%*
PT
EN
PB
D-C
2
mC
hR
ab7
Figure 4
*
*
A
C132S-GFPPTEN
dOCRL dsRNA
PBD-C2-GFPPTEN
*
Actin
*
DNA
*
**
*
*
**
*
* *
**
*
U-73122
* *
*Merg
e
Tra
nsfe
ction
B
0%
40%
30%
20%
10%
% o
f m
ultin
ucle
ate
d c
ells
Transfection PTENPBD-C2PTEN
C132S
U-73122 40µM
-
+ +
-
-
-
- --
50%
dOCRL dsRNA
PTENC132S
PTENPBD-C2
********
****
*
****
**
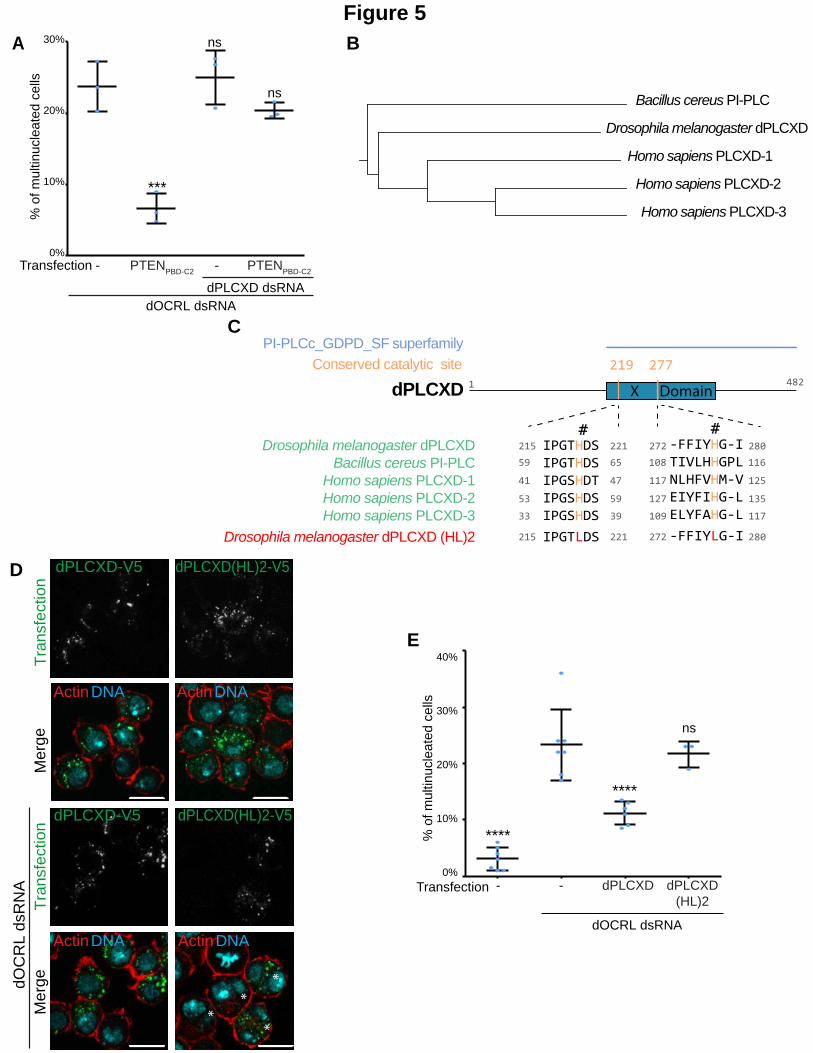
B
C
Transfection
dOCRL dsRNA
- dPLCXD dPLCXD
(HL)2
-0%
30%
40%
20%
10%
% o
f m
ultin
ucle
ate
d c
ells
****
****
ns
E
Figure 5
0%
30%
20%
10%
% o
f m
ultin
ucle
ate
d c
ells
Transfection - PTENPBD-C2
- PTENPBD-C2
dPLCXD dsRNA
dOCRL dsRNA
A
ns
ns
***
Bacillus cereus PI-PLC
Drosophila melanogaster dPLCXD
Homo sapiens PLCXD-1
Homo sapiens PLCXD-2
Homo sapiens PLCXD-3
-FFIYHG-ITIVLHHGPLNLHFVHM-VEIYFIHG-LELYFAHG-L-FFIYLG-I
IPGTHDSIPGTHDS IPGSHDT IPGSHDSIPGSHDSIPGTLDS
Drosophila melanogaster dPLCXD
Bacillus cereus PI-PLC
Homo sapiens PLCXD-1
Homo sapiens PLCXD-2
Homo sapiens PLCXD-3
Drosophila melanogaster dPLCXD (HL)2
219 277Conserved catalytic site
PI-PLCc_GDPD_SF superfamily
# #
dPLCXD
215108
1 482
116221
59272 280
65
41 117 12547
215 272 280221
33 109 11739
53 127 13559
D
dO
CR
L d
sR
NA
dPLCXD(HL)2-V5
ActinDNA
ActinDNA
*
*
**
dPLCXD-V5
ActinDNA
Merg
eT
ransfe
ction
ActinDNA
dPLCXD(HL)2-V5dPLCXD-V5
Merg
eT
ransfe
ction
X Domain
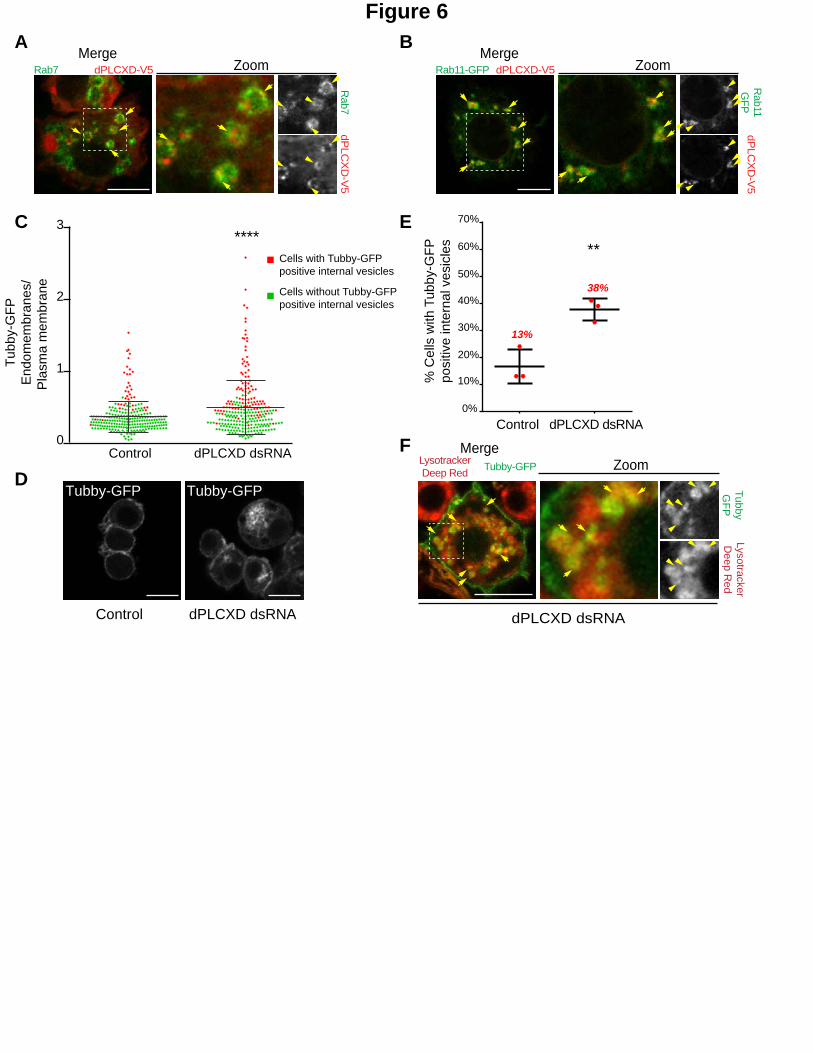
D
Figure 6
C
0
2
1
3
dPLCXD dsRNAControl
Tubby-G
FP
En
dom
em
bra
nes/
Pla
sm
a m
em
bra
ne
****
Cells with Tubby-GFP
positive internal vesicles
Cells without Tubby-GFP
positive internal vesicles
Tubby-GFPTubby-GFP
Control dPLCXD dsRNA
A BMerge
ZoomdPLCXD-V5Rab7
MergeZoomdPLCXD-V5Rab11-GFP
dP
LC
XD
-V5
Rab7
dP
LC
XD
-V5
Rab11
GF
P
F
Lysotra
cker
Deep R
ed
Tubby
GF
P
dPLCXD dsRNA
ZoomMerge
Tubby-GFPLysotracker
Deep Red
E
13%
38%
0%
10%
20%
50%
60%
70%
30%
40%
dPLCXD dsRNAControl%
Cells
with T
ubby-G
FP
po
sitiv
e inte
rnal vesic
les
**
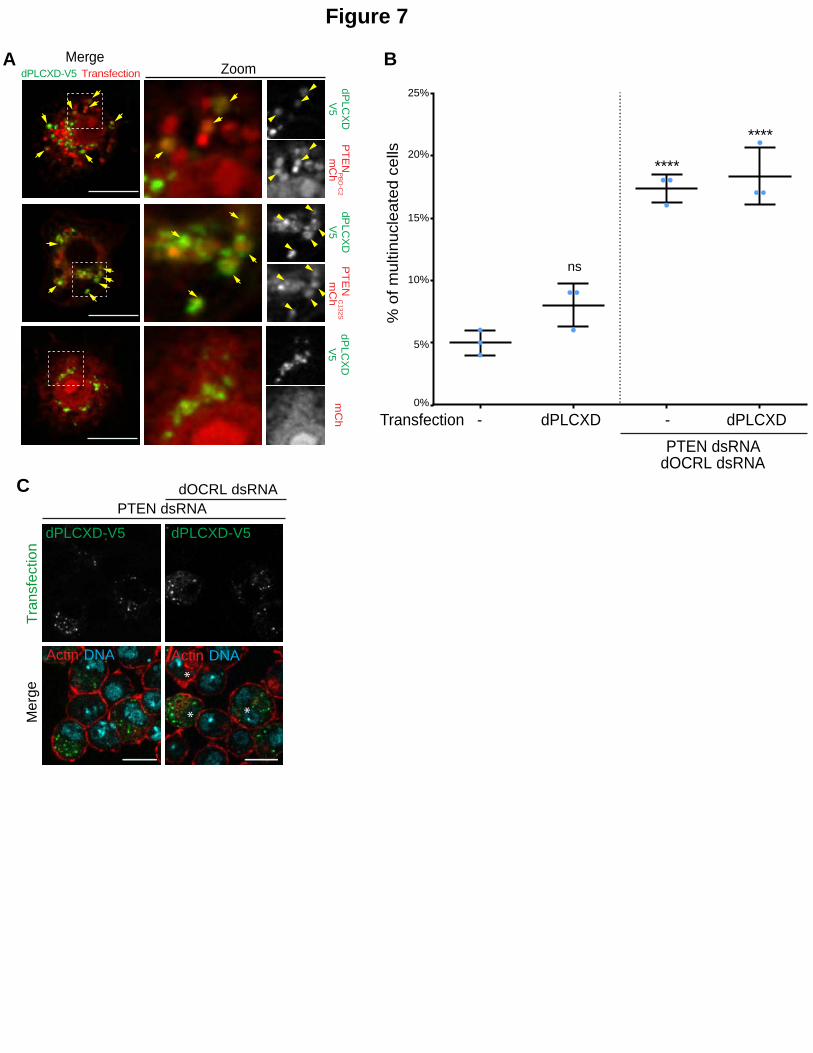
Figure 7
* *
C dOCRL dsRNA
dPLCXD-V5
Actin DNA
dPLCXD-V5
Actin DNA
Merg
eT
ransfe
ction
*
A
PTEN dsRNA
MergeZoomTransfectiondPLCXD-V5
mC
hP
TE
N C
132S
mC
h
PT
EN
PB
D-C
2
mC
hdP
LC
XD
V5
dP
LC
XD
V5
dP
LC
XD
V5
% o
f m
ultin
ucle
ate
d c
ells
Transfection -
PTEN dsRNAdOCRL dsRNA
dPLCXD-
B
0%
15%
10%
5%
25%
20%
ns
****
****
dPLCXD
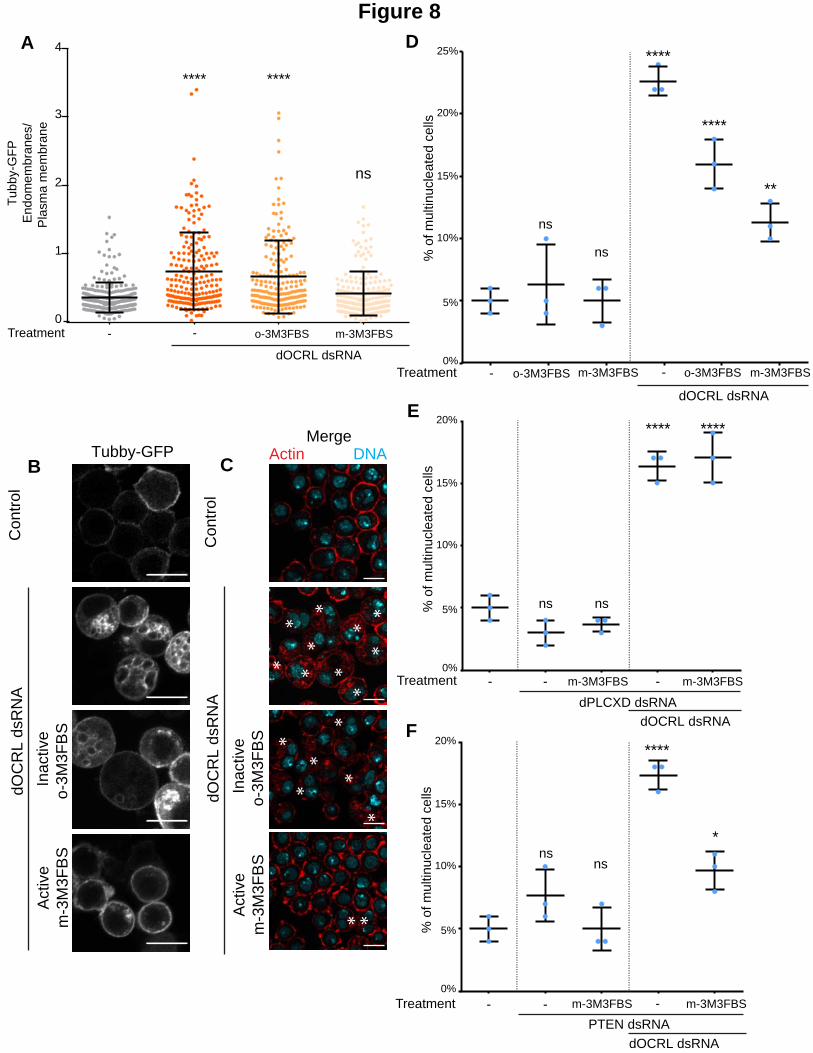
Figure 8
Treatment - - m-3M3FBS - m-3M3FBS
PTEN dsRNA
dOCRL dsRNA
0%
20%
15%
10%
% o
f m
ultin
ucle
ate
d c
ells
5%
nsns
****
*
E
F
D
20%
0%
15%
10%
Treatment - o-3M3FBS m-3M3FBS - o-3M3FBS m-3M3FBS
dOCRL dsRNA
% o
f m
ultin
ucle
ate
d c
ells
5%
25%
ns
ns
****
****
**
0%
20%
15%
10%
% o
f m
ultin
ucle
ate
d c
ells
5%
Treatment - - m-3M3FBS - m-3M3FBS
dPLCXD dsRNA
dOCRL dsRNA
nsns
**** ****
0
2
1
3
4
Tu
bb
y-G
FP
En
do
me
mb
ran
es/
Pla
sm
a m
em
bra
ne
****
Treatment - o-3M3FBS m-3M3FBS
dOCRL dsRNA
-
****
ns
A
Actin DNAMerge
B
dO
CR
L d
sR
NA
Active
m-3
M3F
BS
Inactive
o-3
M3F
BS
Contr
ol
Tubby-GFP
dO
CR
L d
sR
NA
Active
m-3
M3F
BS
Inactive
o-3
M3F
BS
Contr
ol
C
* *
*
**
**
*
* **
*
**
**
**
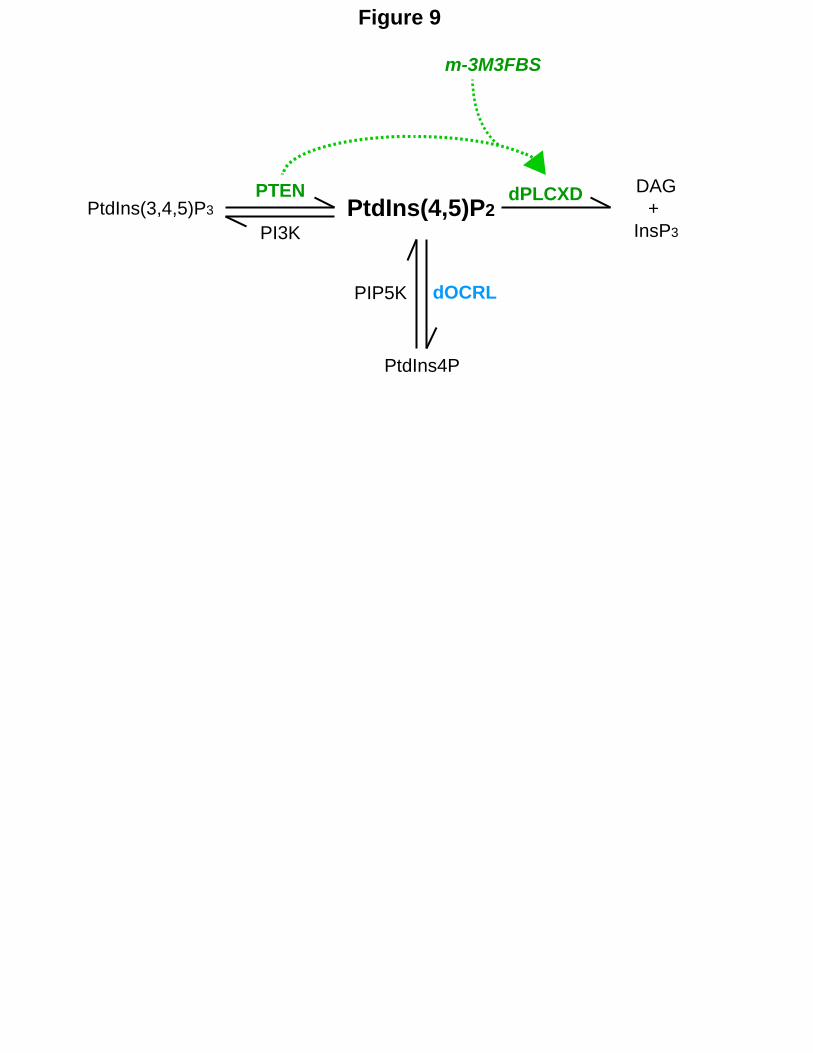
PtdIns(3,4,5)P3 PtdIns(4,5)P2
PtdIns4P
DAG
+
InsP3
dOCRL
PTEN dPLCXD
PI3K
PIP5K
m-3M3FBS
Figure 9
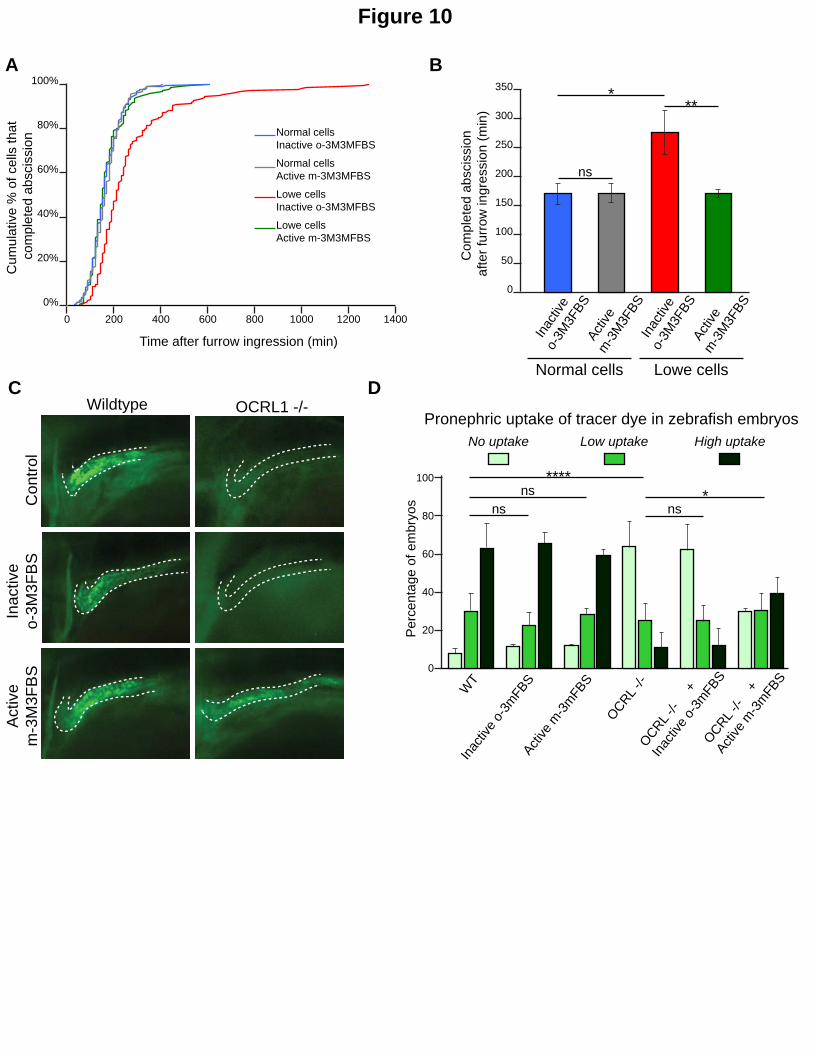
Figure 10
C DWildtype OCRL1 -/-
Contr
ol
Inactive
o-3
M3F
BS
Active
m-3
M3F
BS 0
60
40
20
80
100
Perc
enta
ge o
f em
bry
os
No uptake Low uptake High uptakePronephric uptake of tracer dye in zebrafish embryos
WT
Inac
tive
o-3m
FBS
Act
ive
m-3
mFBS
OC
RL
-/-
+
Act
ive
m-3
mFBS
OC
RL
-/-
+
Inac
tive
o-3m
FBS
OC
RL
-/-
ns
ns****
ns*
0
150
100
50
200
250
300
350
Act
ive
m-3
M3F
BS
Inac
tive
o-3M
3FBS
Act
ive
m-3
M3F
BS
Inac
tive
o-3M
3FBS
Normal cells Lowe cells
Com
ple
ted a
bscis
sio
n
after
furr
ow
ingre
ssio
n (
min
)
***
ns
A B
0%
40%
20%
60%
80%
100%
0 200 400 600 800 1000 1200 1400
Cum
ula
tive %
of cells
that
com
ple
ted
abscis
sio
n
Time after furrow ingression (min)
Normal cells
Inactive o-3M3MFBS
Lowe cells
Inactive o-3M3MFBS
Lowe cells
Active m-3M3MFBS
Normal cells
Active m-3M3MFBS