chapter 4,5
TRANSCRIPT
CHAPTER 4
DATA ANALYSIS
AND
INTERPRETATION
DATA ANALYSIS & INTTERPRETATION
The Balance Sheets which were collected from the organization for the last five
years were the main source of data. The data was classified and tabulated for the
purpose of analysis using ratio analysis and comparative analysis of balance sheet
and percentage were drawn for the purpose of information generation and
inferences were drawn.
A. LIQUIDITY RATIOS
1. Current Ratio: A liquidity ratio that measures a company's ability to pay short-
term obligations. Current Ratio = Current Asset
Current Liabilities
TABLE 4.1: CURRENT RATIOS
(RS.IN
CRORES)
YEARS CURRENT
ASSETS
CURRENT
LIABILITIES
RATIOS
2011 20098.44 223219.93 0.09
2010 15776.69 184738.06 0.08
2009 15984.93 152235.16 0.10
2008 10097.84 116725.57 0.08
2007 8426.44 97488.01 0.08
ANALYSIS:
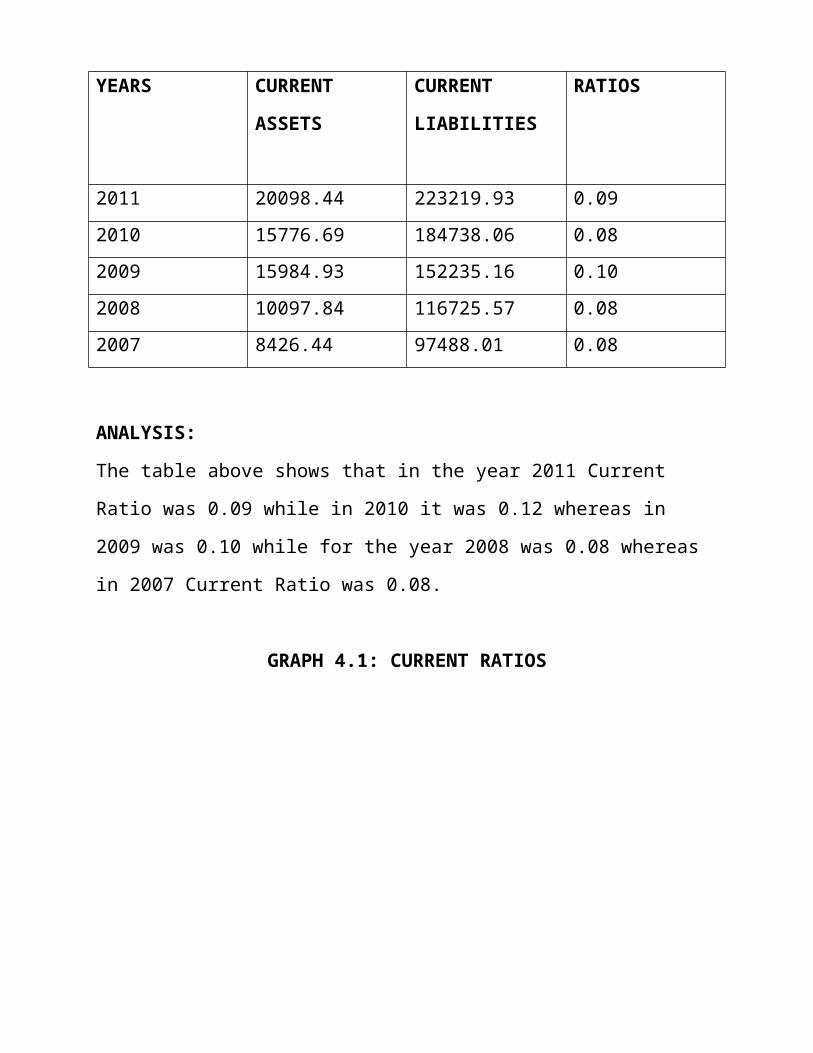
The table above shows that in the year 2011 Current Ratio was 0.09 while in 2010
it was 0.12 whereas in 2009 was 0.10 while for the year 2008 was 0.08 whereas in
2007 Current Ratio was 0.08.
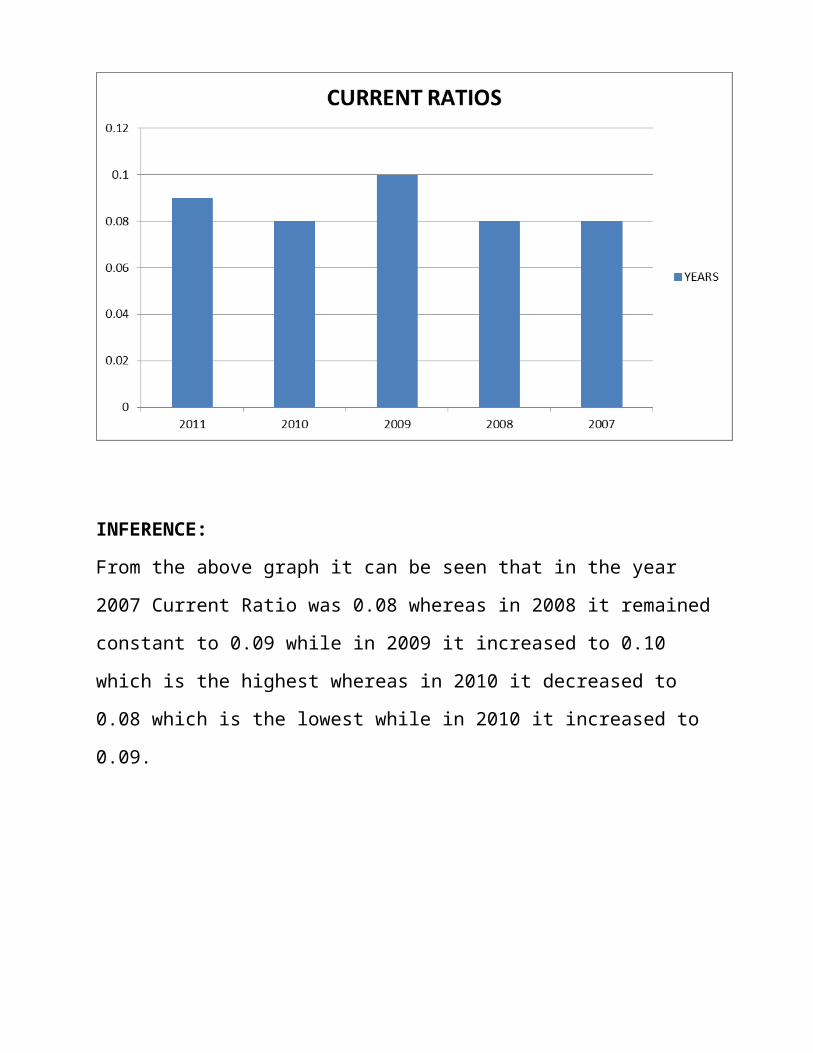
GRAPH 4.1: CURRENT RATIOS
INFERENCE:
From the above graph it can be seen that in the year 2007 Current Ratio was 0.08
whereas in 2008 it remained constant to 0.09 while in 2009 it increased to 0.10
which is the highest whereas in 2010 it decreased to 0.08 which is the lowest while
in 2010 it increased to 0.09.
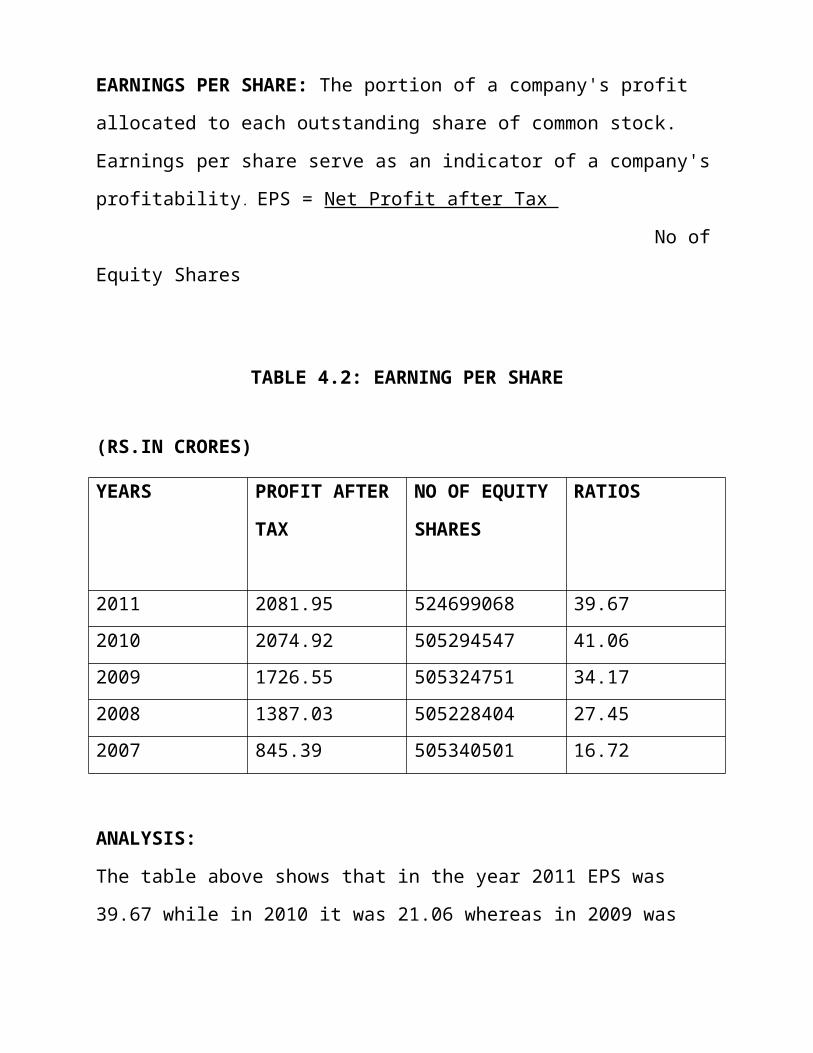
EARNINGS PER SHARE: The portion of a company's profit allocated to each
outstanding share of common stock. Earnings per share serve as an indicator of a
company's profitability. EPS = Net Profit after Tax
No of Equity Shares
TABLE 4.2: EARNING PER SHARE
(RS.IN CRORES)
YEARS PROFIT AFTER
TAX
NO OF EQUITY
SHARES
RATIOS
2011 2081.95 524699068 39.67
2010 2074.92 505294547 41.06
2009 1726.55 505324751 34.17
2008 1387.03 505228404 27.45
2007 845.39 505340501 16.72
ANALYSIS:
The table above shows that in the year 2011 EPS was 39.67 while in 2010 it was
21.06 whereas in 2009 was 34.17 while for the year 2008 was 27.45 whereas in
2007 EPS was 16.72.
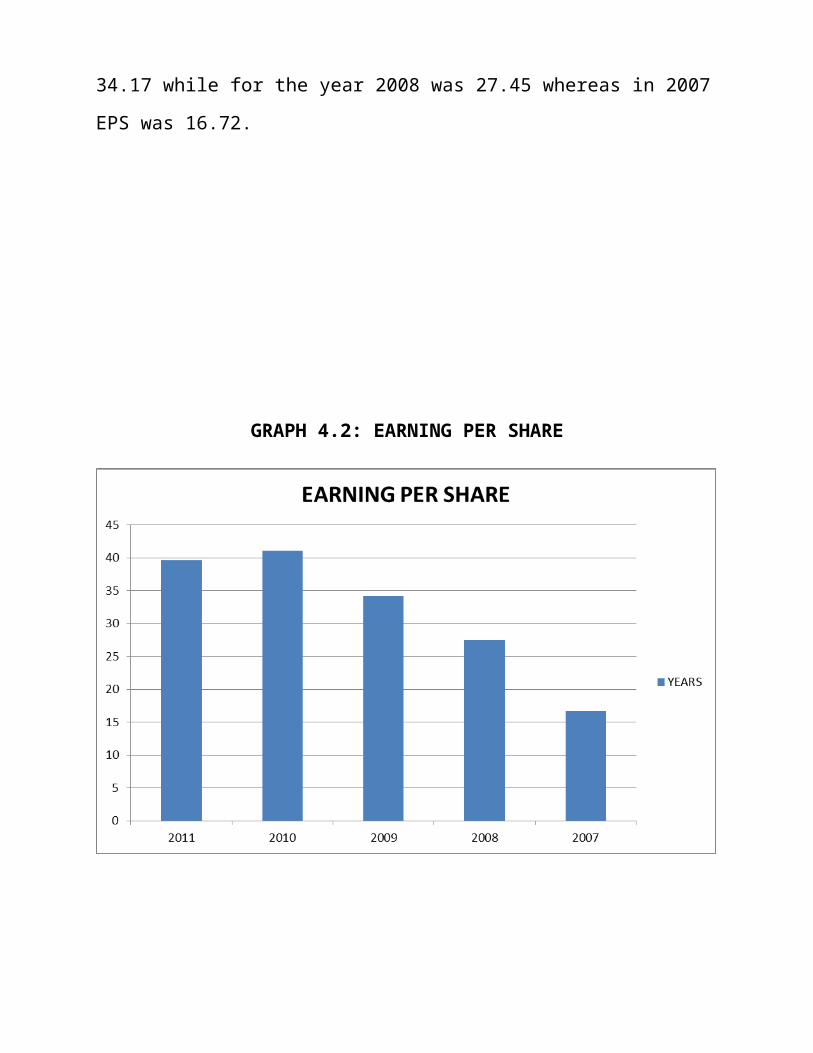
GRAPH 4.2: EARNING PER SHARE
INFERENCE:
The earnings per share ratio is seen to be increasing from the year 2007 to 2010
which shows the company‘s efficiency of paying dividends to its shareholders
while in 2011 it has again decreased. The ratio simply denotes the profit left with
the firm after tax and amount paid against each share. The higher result denotes the
higher amount paid against each share to the shareholders.The graph shows the
good condition of the EPS and is satisfactory
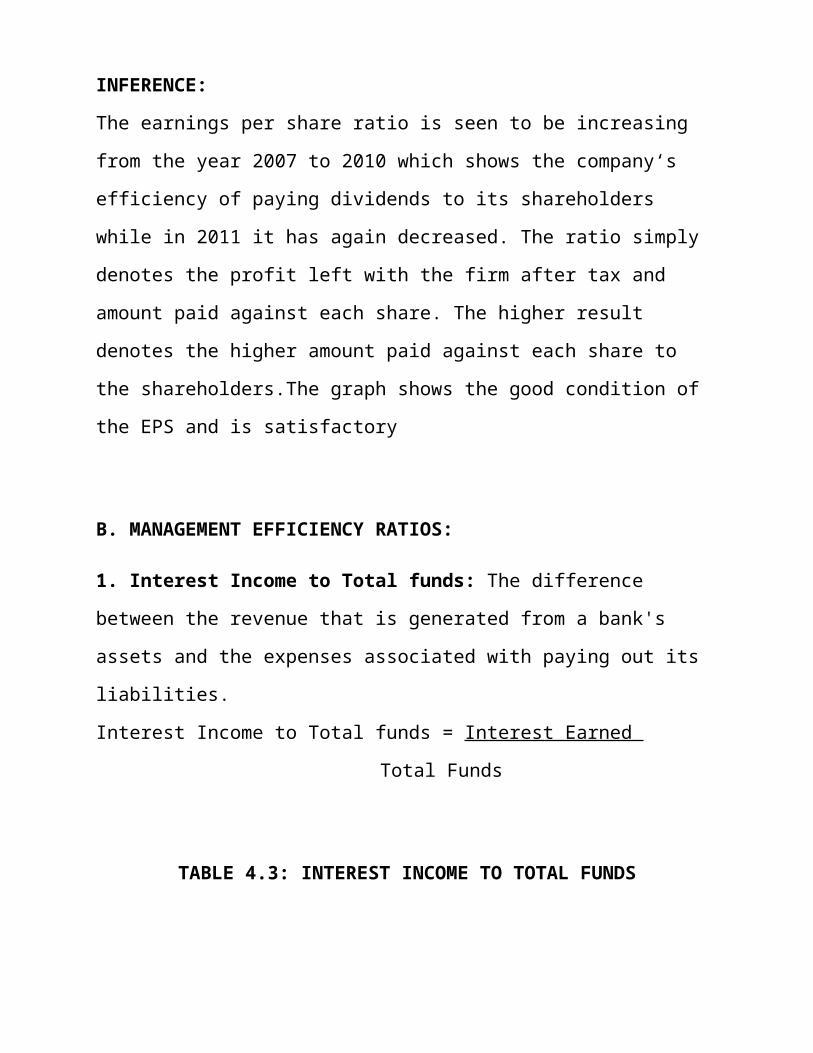
B. MANAGEMENT EFFICIENCY RATIOS:
1. Interest Income to Total funds: The difference between the revenue that is
generated from a bank's assets and the expenses associated with paying out its
liabilities.
Interest Income to Total funds = Interest Earned
Total Funds
TABLE 4.3: INTEREST INCOME TO TOTAL FUNDS
(RS.IN
CRORES)
YEARS INTEREST
EARNED
TOTAL FUNDS RATIOS (%)
2011 16452.62 235984.45 6.97
2010 13302.68 195161.84 6.82
2009 11889.38 160975.52 7.38
2008 9447.30 124073.28 7.61
2007 7382.18 102677.88 7.18
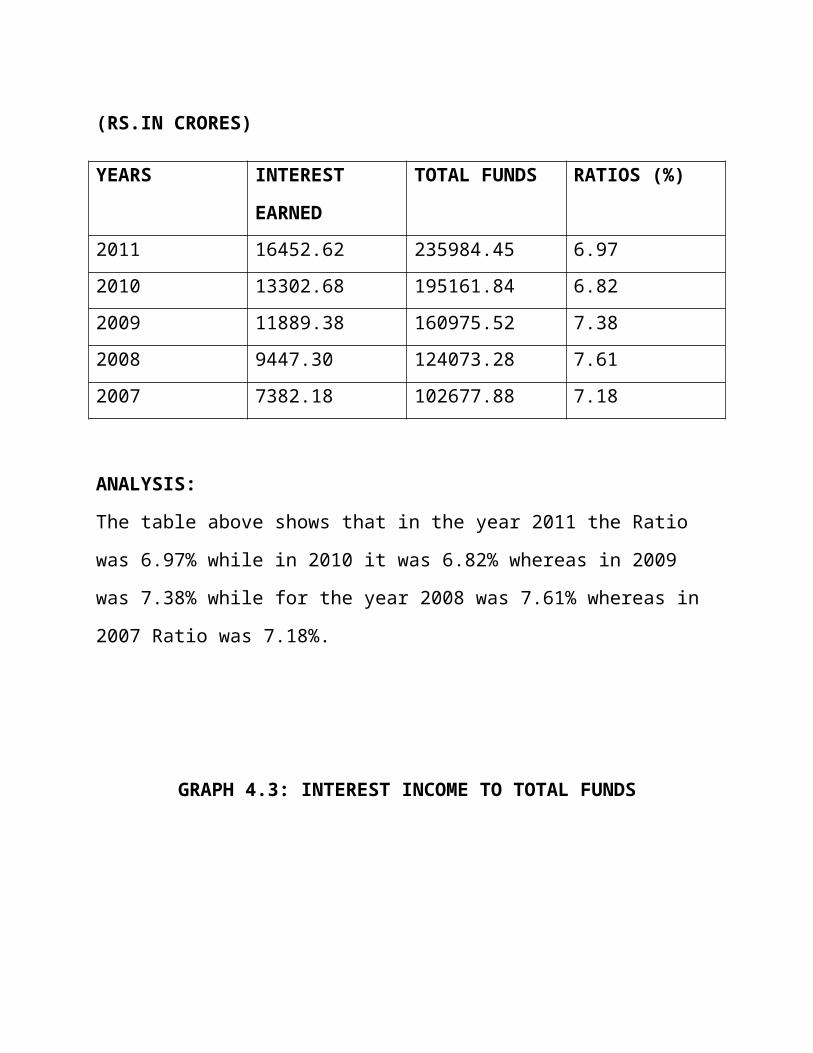
ANALYSIS:
The table above shows that in the year 2011 the Ratio was 6.97% while in 2010 it
was 6.82% whereas in 2009 was 7.38% while for the year 2008 was 7.61%
whereas in 2007 Ratio was 7.18%.
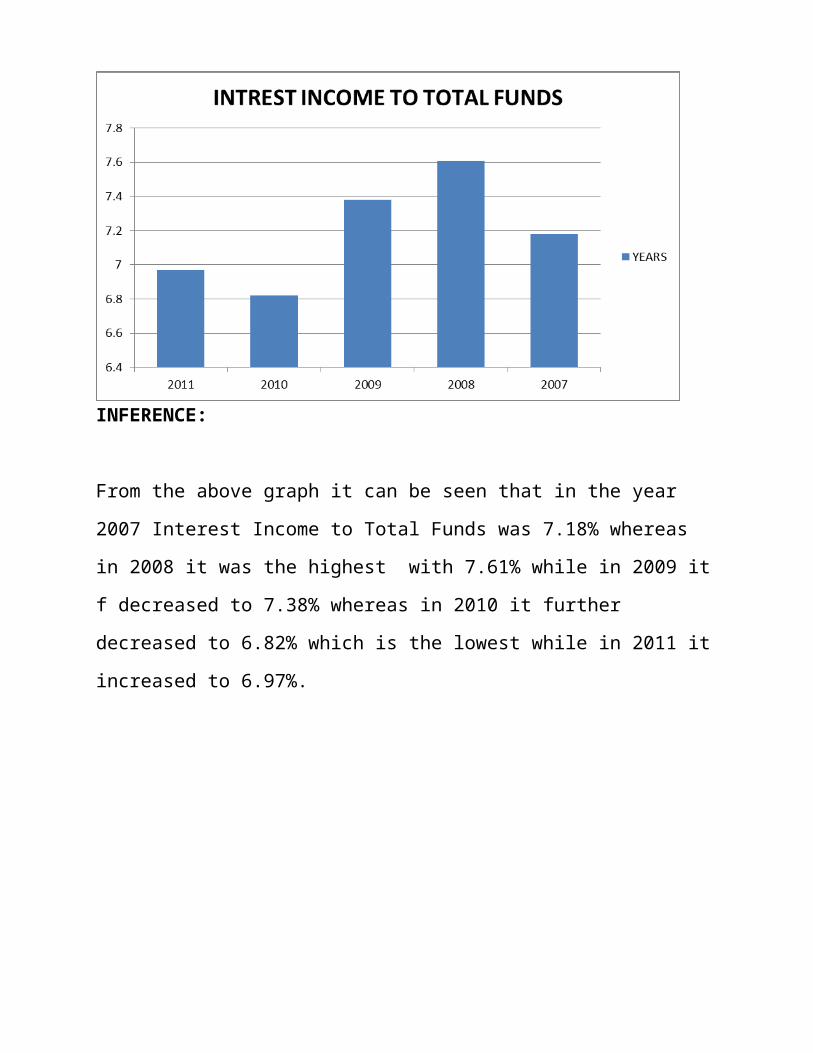
GRAPH 4.3: INTEREST INCOME TO TOTAL FUNDS
INFERENCE:
From the above graph it can be seen that in the year 2007 Interest Income to Total
Funds was 7.18% whereas in 2008 it was the highest with 7.61% while in 2009 it f
decreased to 7.38% whereas in 2010 it further decreased to 6.82% which is the
lowest while in 2011 it increased to 6.97%.
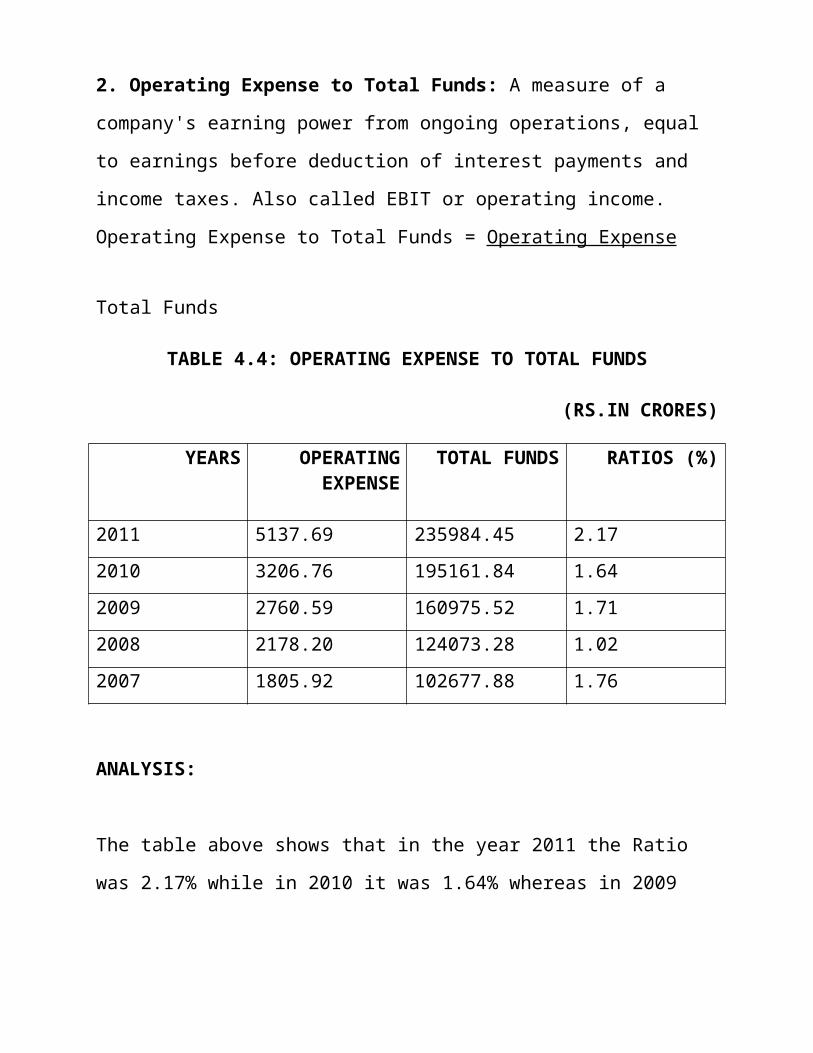
2. Operating Expense to Total Funds: A measure of a company's earning power
from ongoing operations, equal to earnings before deduction of interest payments
and income taxes. Also called EBIT or operating income.
Operating Expense to Total Funds = Operating Expense
Total Funds
TABLE 4.4: OPERATING EXPENSE TO TOTAL FUNDS
(RS.IN CRORES)
YEARS OPERATING EXPENSE
TOTAL FUNDS RATIOS (%)
2011 5137.69 235984.45 2.17
2010 3206.76 195161.84 1.64
2009 2760.59 160975.52 1.71
2008 2178.20 124073.28 1.02
2007 1805.92 102677.88 1.76
ANALYSIS:
The table above shows that in the year 2011 the Ratio was 2.17% while in 2010 it
was 1.64% whereas in 2009 was 1.71% while for the year 2008 was 1.02%
whereas in 2007 Ratio was 1.76%.
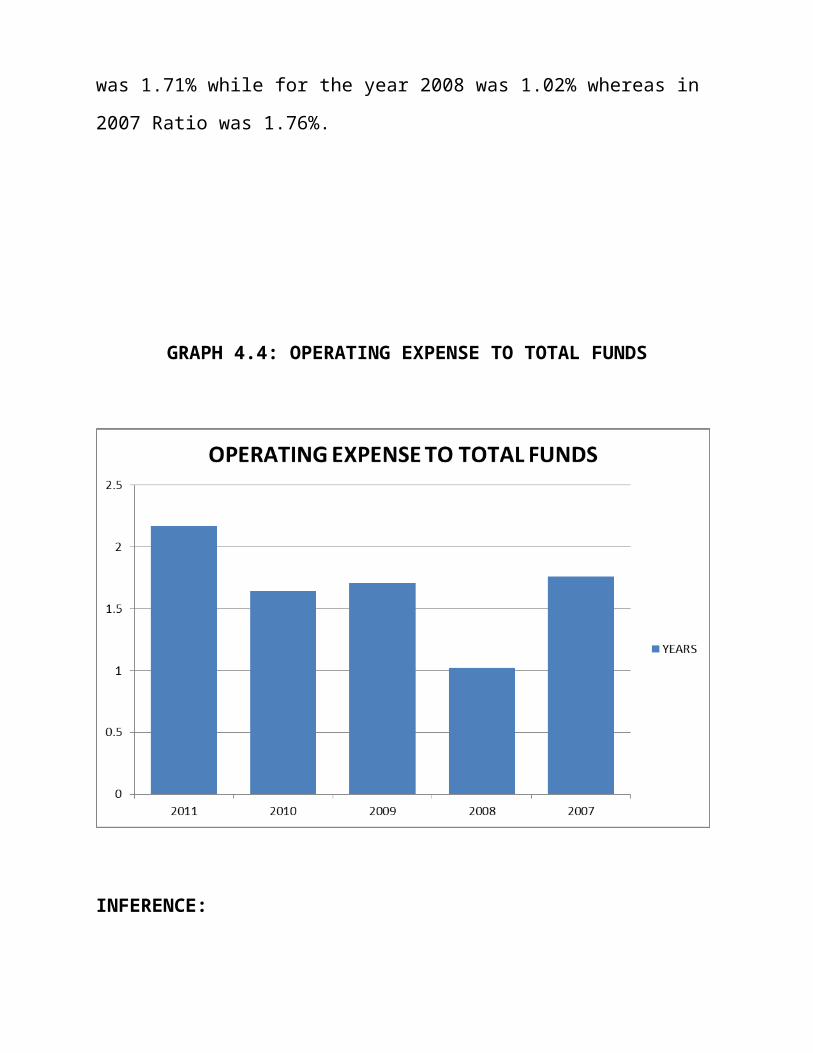
GRAPH 4.4: OPERATING EXPENSE TO TOTAL FUNDS
INFERENCE:
From the above graph it can be seen that in the year 2007 Operating Expense to
Total Funds was 1.76% whereas in 2008 it decreased to 1.02% which is the lowest
while in 2009 it increased to 1.71% whereas in 20010 it again decreased to 1.64%
while in 2011 it was the highest with 2.17%.
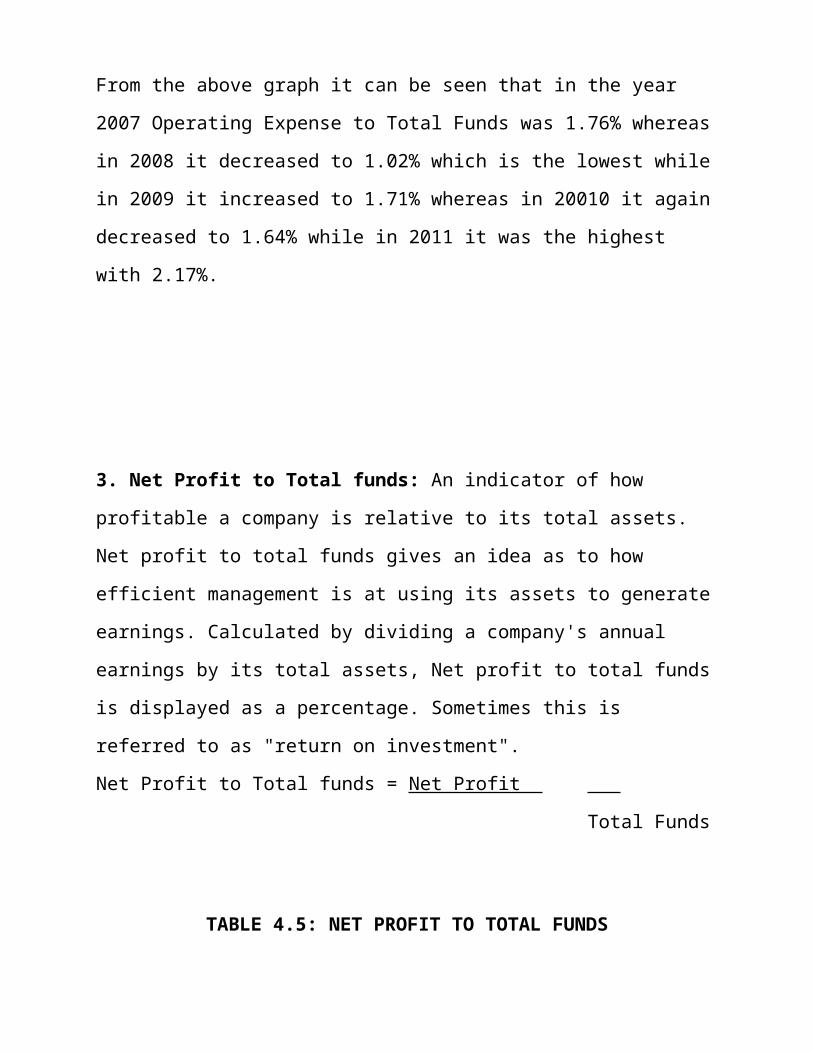
3. Net Profit to Total funds: An indicator of how profitable a company is relative
to its total assets. Net profit to total funds gives an idea as to how efficient
management is at using its assets to generate earnings. Calculated by dividing a
company's annual earnings by its total assets, Net profit to total funds is displayed
as a percentage. Sometimes this is referred to as "return on investment".
Net Profit to Total funds = Net Profit
Total Funds
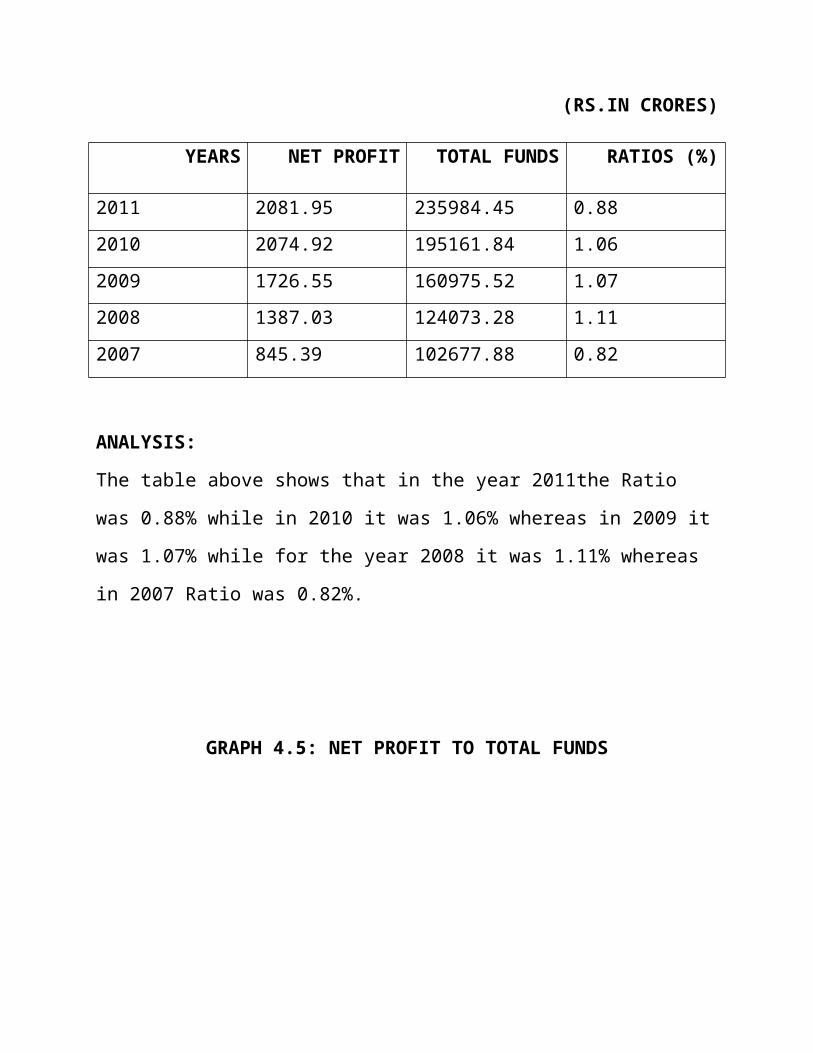
TABLE 4.5: NET PROFIT TO TOTAL FUNDS
(RS.IN CRORES)
YEARS NET PROFIT TOTAL FUNDS RATIOS (%)
2011 2081.95 235984.45 0.88
2010 2074.92 195161.84 1.06
2009 1726.55 160975.52 1.07
2008 1387.03 124073.28 1.11
2007 845.39 102677.88 0.82
ANALYSIS:
The table above shows that in the year 2011the Ratio was 0.88% while in 2010 it
was 1.06% whereas in 2009 it was 1.07% while for the year 2008 it was 1.11%
whereas in 2007 Ratio was 0.82%.
GRAPH 4.5: NET PROFIT TO TOTAL FUNDS
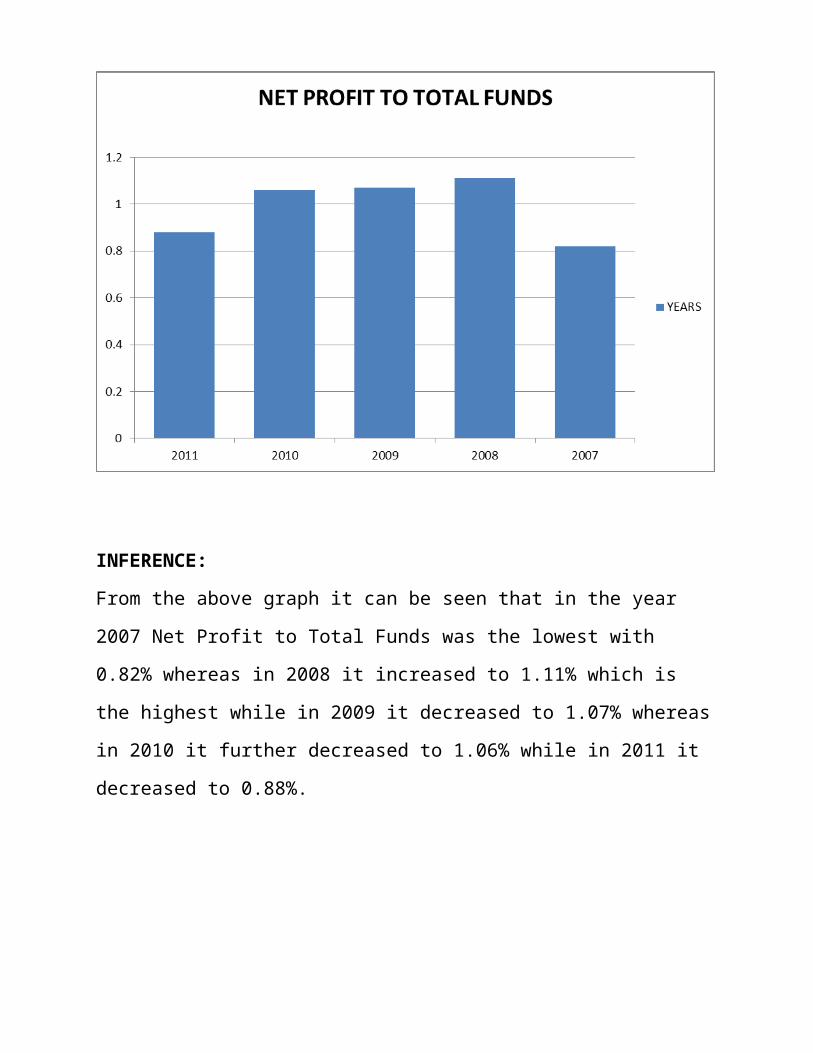
INFERENCE:
From the above graph it can be seen that in the year 2007 Net Profit to Total Funds
was the lowest with 0.82% whereas in 2008 it increased to 1.11% which is the
highest while in 2009 it decreased to 1.07% whereas in 2010 it further decreased to
1.06% while in 2011 it decreased to 0.88%.
C. PROFIT AND LOSS ACCOUNT RATIOS
1. Interest Expanded to Interest earned: Interest earned is the interest generated
but not yet credited or paid and Interest expanded is the interest provided to the
creditors.
Interest Expanded to Interest Earned = Interest Expanded
Interest Earned
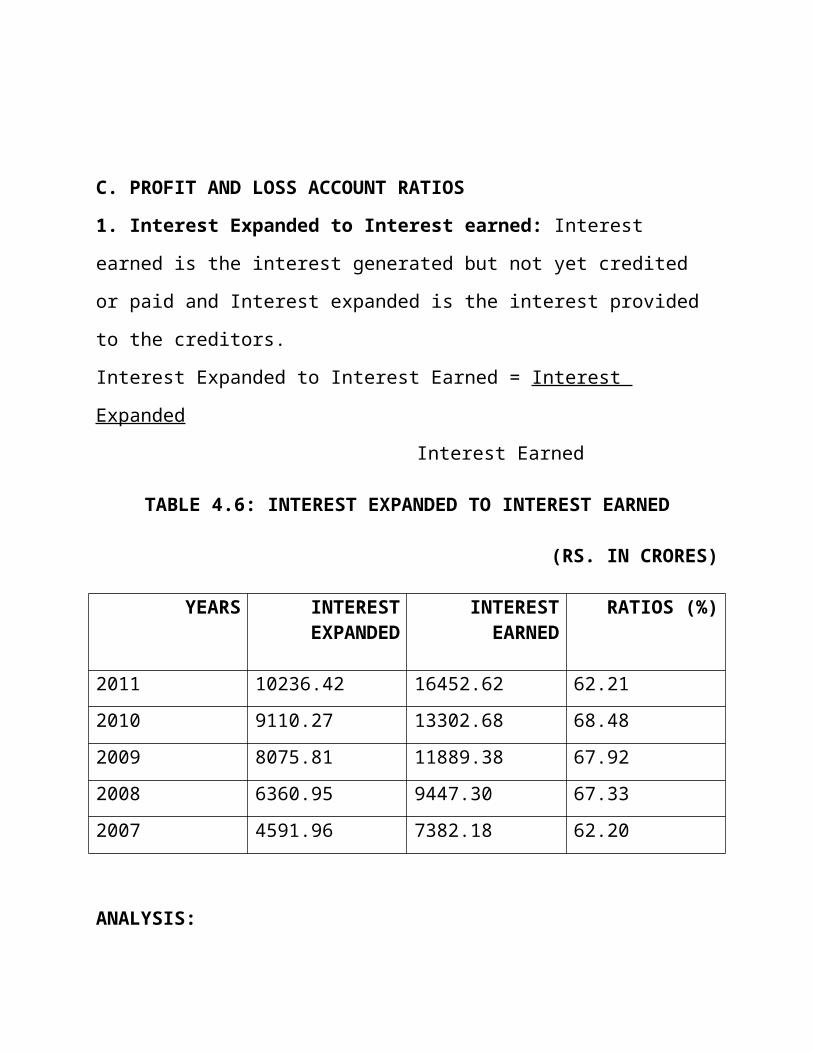
TABLE 4.6: INTEREST EXPANDED TO INTEREST EARNED
(RS. IN CRORES)
YEARS INTEREST EXPANDED
INTEREST EARNED
RATIOS (%)
2011 10236.42 16452.62 62.21
2010 9110.27 13302.68 68.48
2009 8075.81 11889.38 67.92
2008 6360.95 9447.30 67.33
2007 4591.96 7382.18 62.20
ANALYSIS:
The table above shows that in the year 2011 the Ratio was 62.21% while in 2010 it
was 68.48% whereas in 2009 it was 67.92% while for the year 2008 it was 67.33%
whereas in 2007 Ratio was 62.20%.
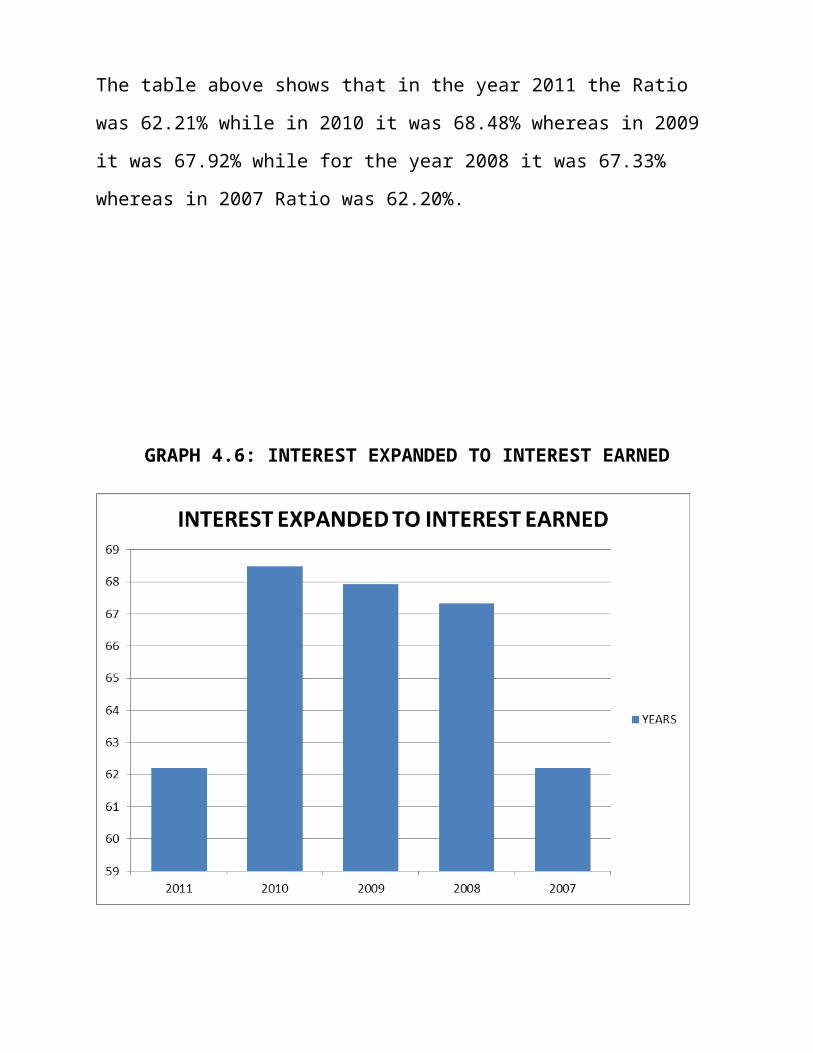
GRAPH 4.6: INTEREST EXPANDED TO INTEREST EARNED
INFERENCE:
From the above graph it can be seen that in the year 2007 the Interest expanded to
interest earned was 62.22% whereas in 2008 it increased to 67.33% while in 2009
it further increased to 67.92% whereas in 2010 it again increased to 68.48% which
is the highest while in 2011 it was the lowest with 62.21%.
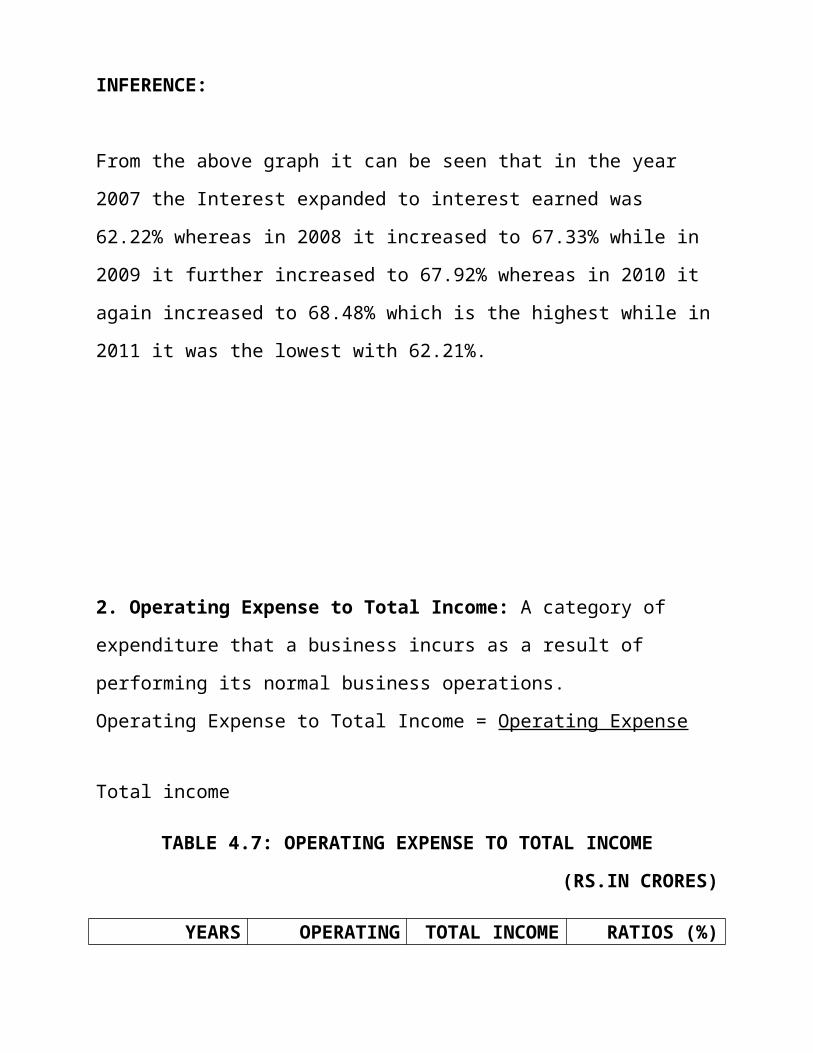
2. Operating Expense to Total Income: A category of expenditure that a business
incurs as a result of performing its normal business operations.
Operating Expense to Total Income = Operating Expense
Total income
TABLE 4.7: OPERATING EXPENSE TO TOTAL INCOME
(RS.IN CRORES)
YEARS OPERATING EXPENSE
TOTAL INCOME
RATIOS (%)
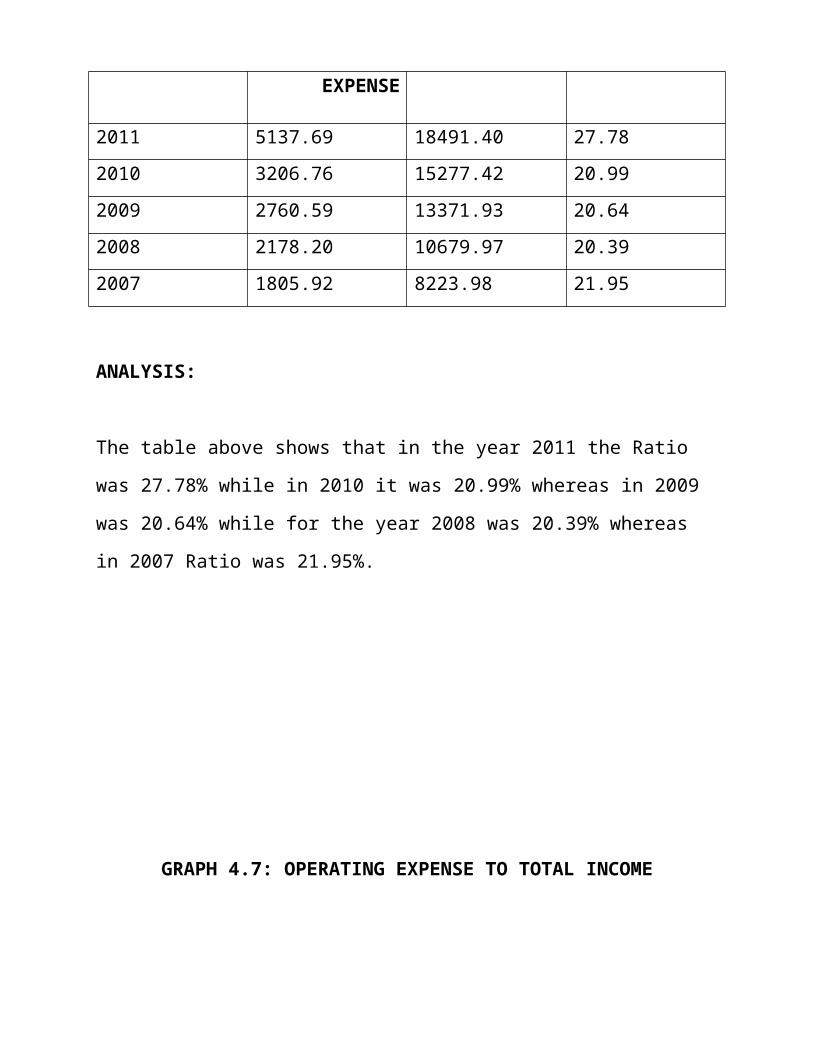
2011 5137.69 18491.40 27.78
2010 3206.76 15277.42 20.99
2009 2760.59 13371.93 20.64
2008 2178.20 10679.97 20.39
2007 1805.92 8223.98 21.95
ANALYSIS:
The table above shows that in the year 2011 the Ratio was 27.78% while in 2010 it
was 20.99% whereas in 2009 was 20.64% while for the year 2008 was 20.39%
whereas in 2007 Ratio was 21.95%.
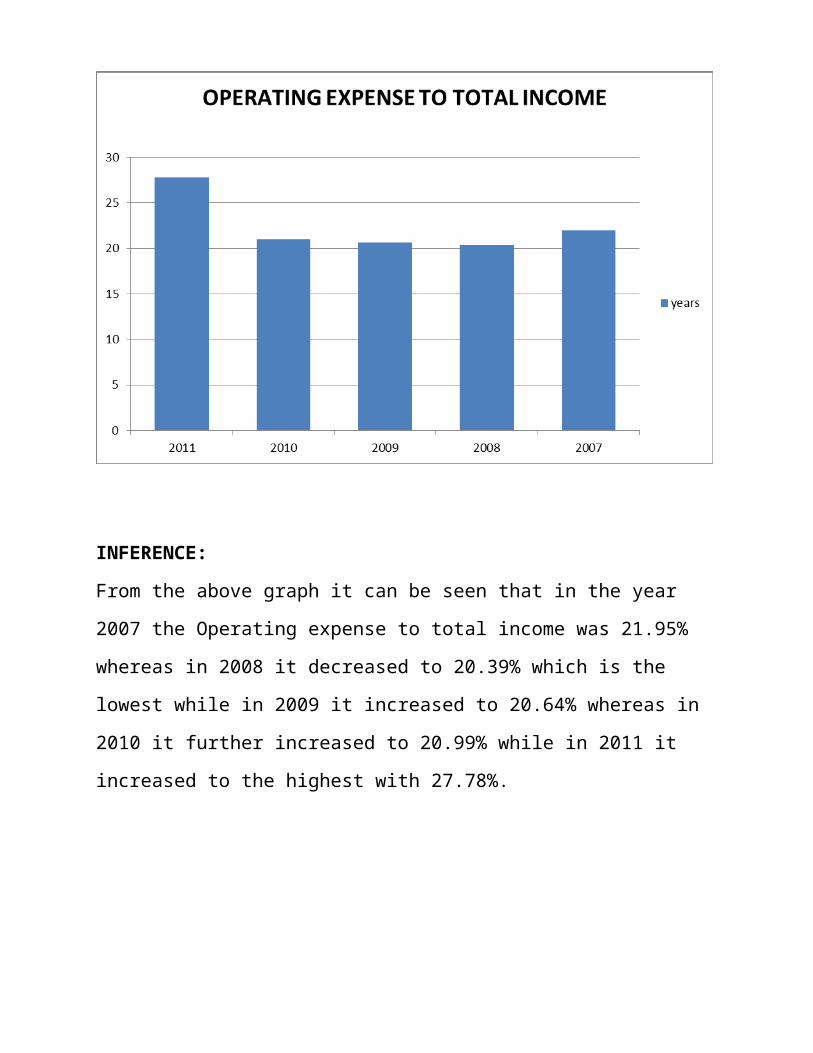
GRAPH 4.7: OPERATING EXPENSE TO TOTAL INCOME
INFERENCE:
From the above graph it can be seen that in the year 2007 the Operating expense to
total income was 21.95% whereas in 2008 it decreased to 20.39% which is the
lowest while in 2009 it increased to 20.64% whereas in 2010 it further increased to
20.99% while in 2011 it increased to the highest with 27.78%.
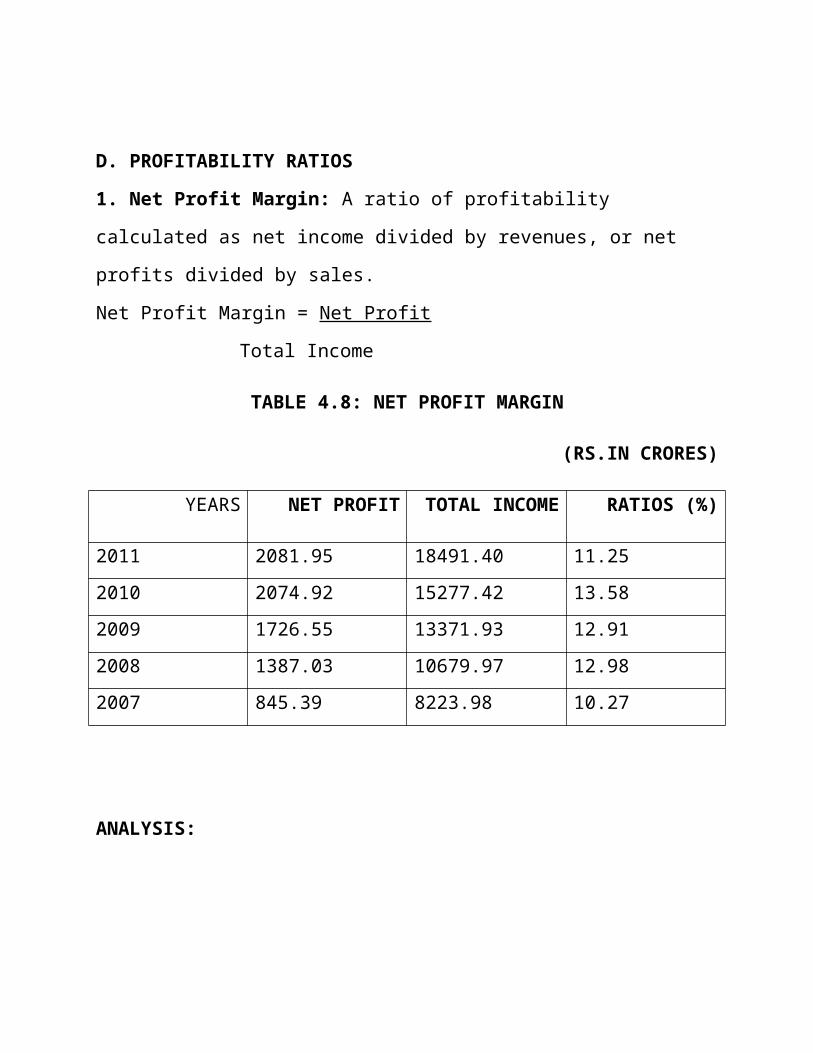
D. PROFITABILITY RATIOS
1. Net Profit Margin: A ratio of profitability calculated as net income divided by
revenues, or net profits divided by sales.
Net Profit Margin = Net Profit
Total Income
TABLE 4.8: NET PROFIT MARGIN
(RS.IN CRORES)
YEARS NET PROFIT TOTAL INCOME
RATIOS (%)
2011 2081.95 18491.40 11.25
2010 2074.92 15277.42 13.58
2009 1726.55 13371.93 12.91
2008 1387.03 10679.97 12.98
2007 845.39 8223.98 10.27
ANALYSIS:
The table above shows that in the year 2011 Net Profit Margin was 11.25% while
in 2010 it was 13.58% whereas in 2009 was 12.91% while for the year 2008 was
12.98% whereas in 2007 Net Profit Margin was 10.27%.
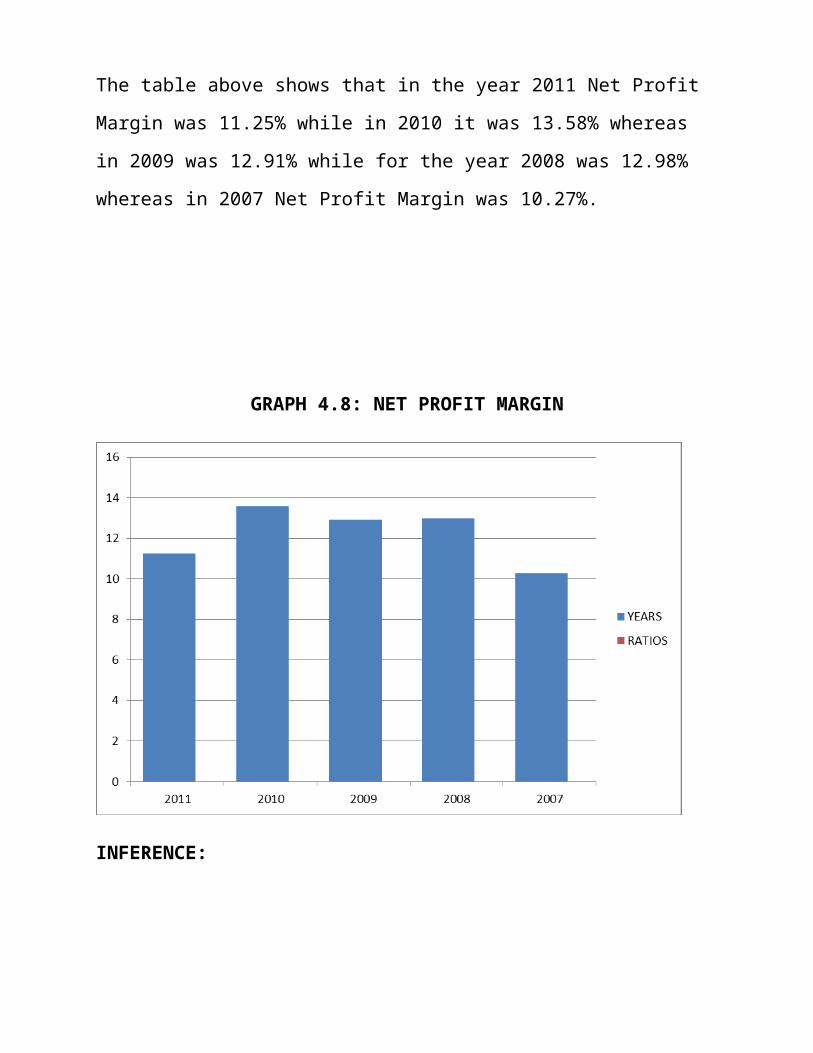
GRAPH 4.8: NET PROFIT MARGIN
INFERENCE:
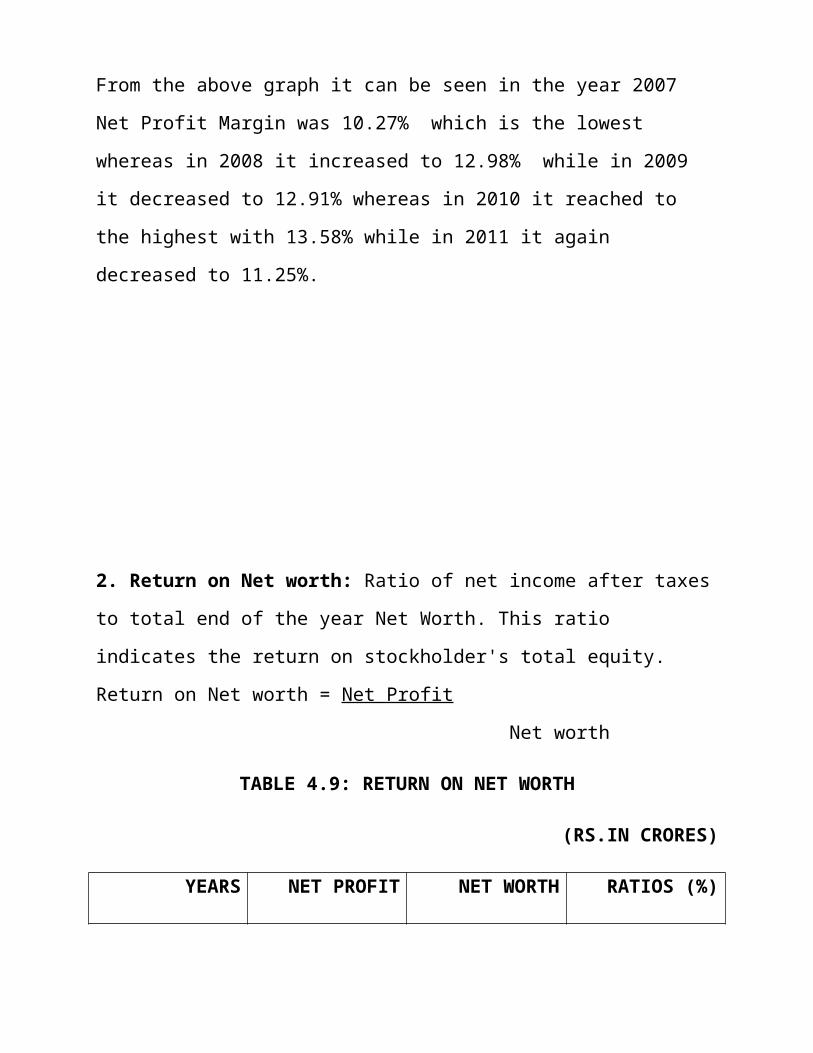
From the above graph it can be seen in the year 2007 Net Profit Margin was
10.27% which is the lowest whereas in 2008 it increased to 12.98% while in 2009
it decreased to 12.91% whereas in 2010 it reached to the highest with 13.58%
while in 2011 it again decreased to 11.25%.
2. Return on Net worth: Ratio of net income after taxes to total end of the year
Net Worth. This ratio indicates the return on stockholder's total equity.
Return on Net worth = Net Profit
Net worth
TABLE 4.9: RETURN ON NET WORTH
(RS.IN CRORES)
YEARS NET PROFIT NET WORTH RATIOS (%)
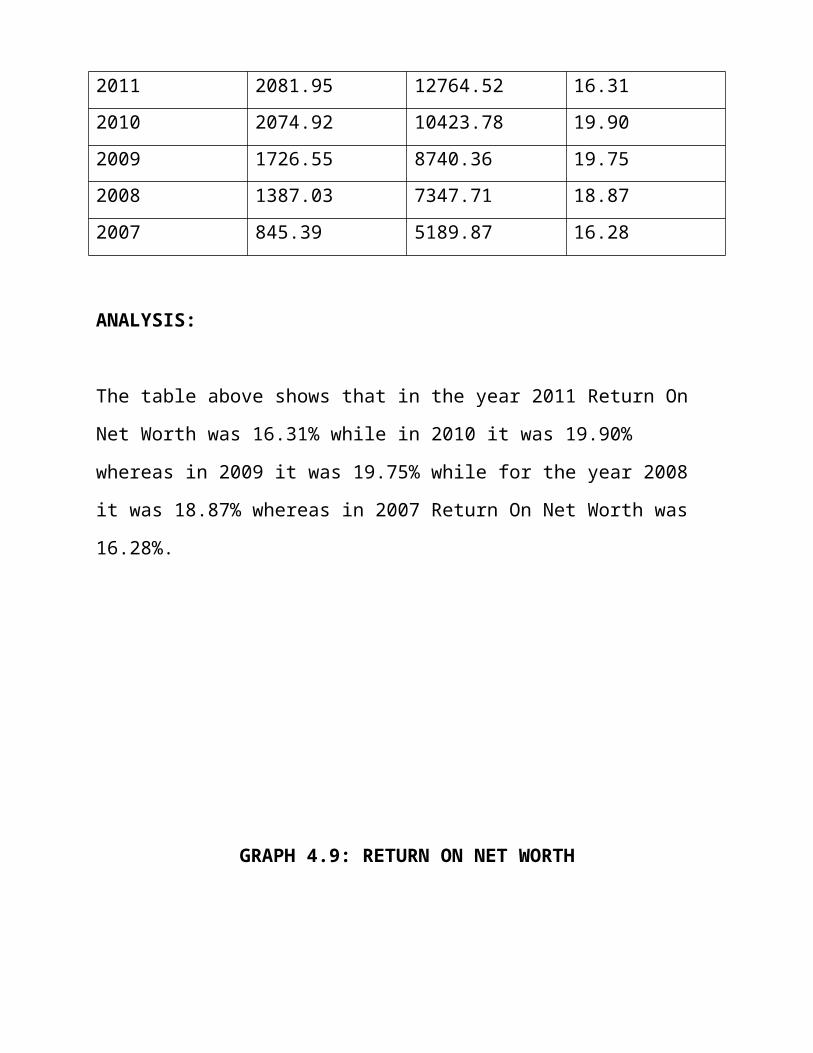
2011 2081.95 12764.52 16.31
2010 2074.92 10423.78 19.90
2009 1726.55 8740.36 19.75
2008 1387.03 7347.71 18.87
2007 845.39 5189.87 16.28
ANALYSIS:
The table above shows that in the year 2011 Return On Net Worth was 16.31%
while in 2010 it was 19.90% whereas in 2009 it was 19.75% while for the year
2008 it was 18.87% whereas in 2007 Return On Net Worth was 16.28%.
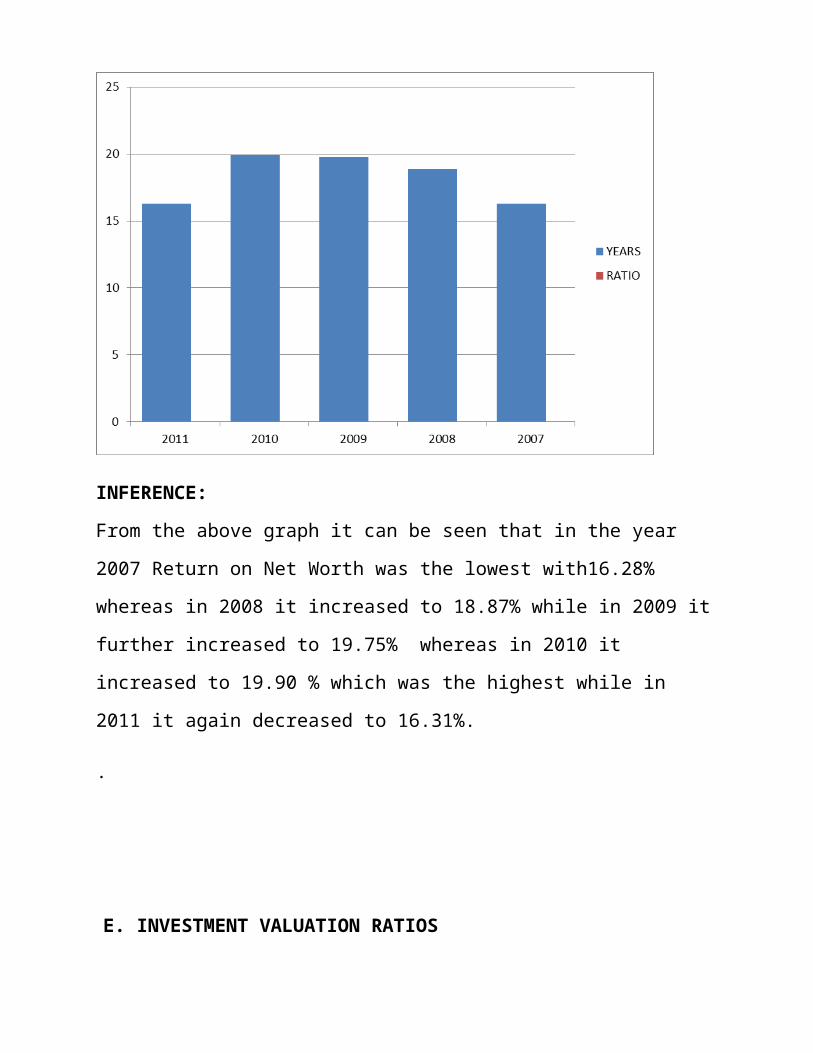
GRAPH 4.9: RETURN ON NET WORTH
INFERENCE:
From the above graph it can be seen that in the year 2007 Return on Net Worth
was the lowest with16.28% whereas in 2008 it increased to 18.87% while in 2009
it further increased to 19.75% whereas in 2010 it increased to 19.90 % which was
the highest while in 2011 it again decreased to 16.31%.
.
E. INVESTMENT VALUATION RATIOS
1. Dividend Per Share: The amount of dividend that a stockholder will receive
for each share of stock held. It can be calculated by taking the total amount of
dividends paid and dividing it by the total shares outstanding.
Dividend Per Share = Equity Dividend
No. of Share
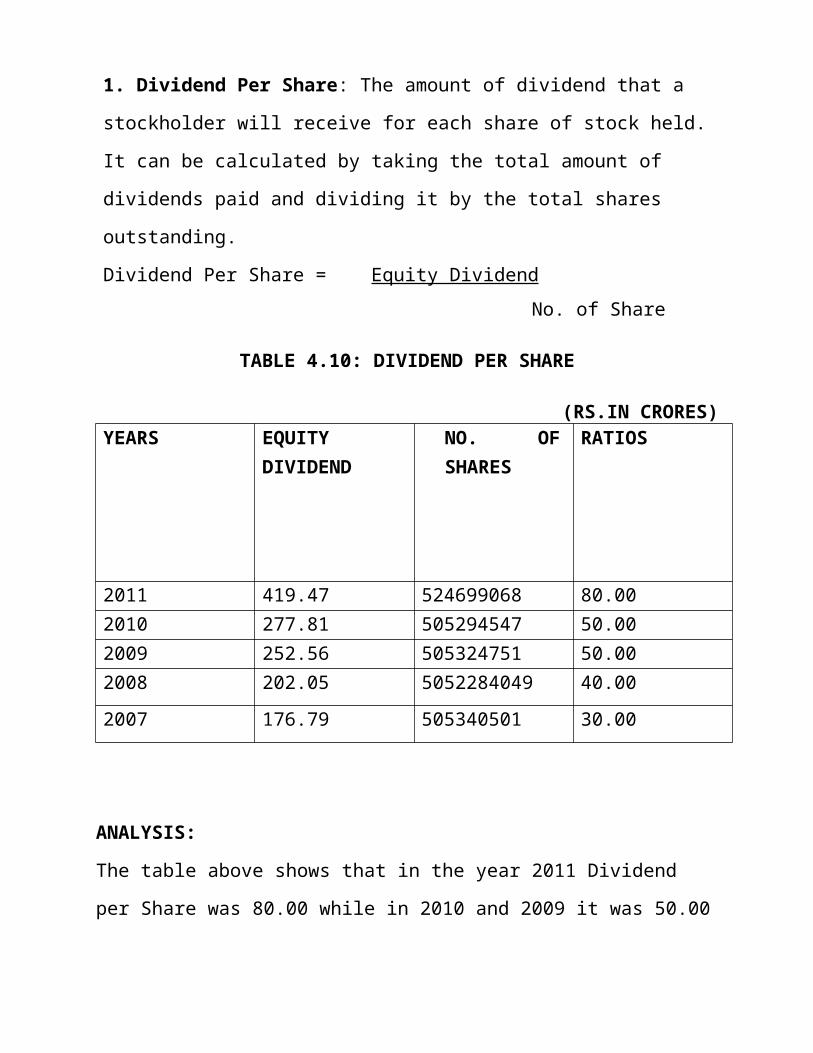
TABLE 4.10: DIVIDEND PER SHARE
(RS.IN CRORES)YEARS EQUITY
DIVIDEND NO. OF SHARES
RATIOS
2011 419.47 524699068 80.002010 277.81 505294547 50.002009 252.56 505324751 50.002008 202.05 5052284049 40.00
2007 176.79 505340501 30.00
ANALYSIS:
The table above shows that in the year 2011 Dividend per Share was 80.00 while
in 2010 and 2009 it was 50.00 whereas in 2008 was 40.00 while for the year 2007
Dividend per share was 30.00.
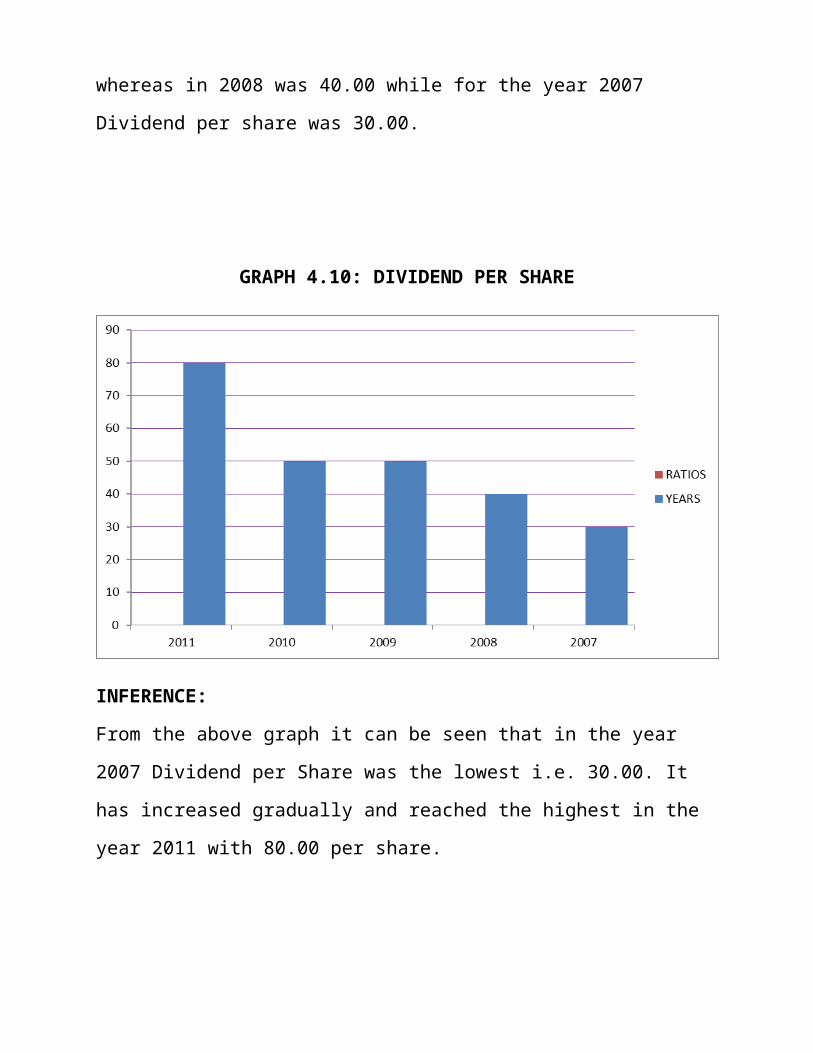
GRAPH 4.10: DIVIDEND PER SHARE
INFERENCE:
From the above graph it can be seen that in the year 2007 Dividend per Share was
the lowest i.e. 30.00. It has increased gradually and reached the highest in the year
2011 with 80.00 per share.
2. Net Operating Profit Per Share: A measure of a company's earning power
from ongoing operations, equal to earnings before deduction of interest payments
and income taxes. Also called EBIT or operating income.
Net Operating Profit per Share = Net Operating Profit
No of Shares
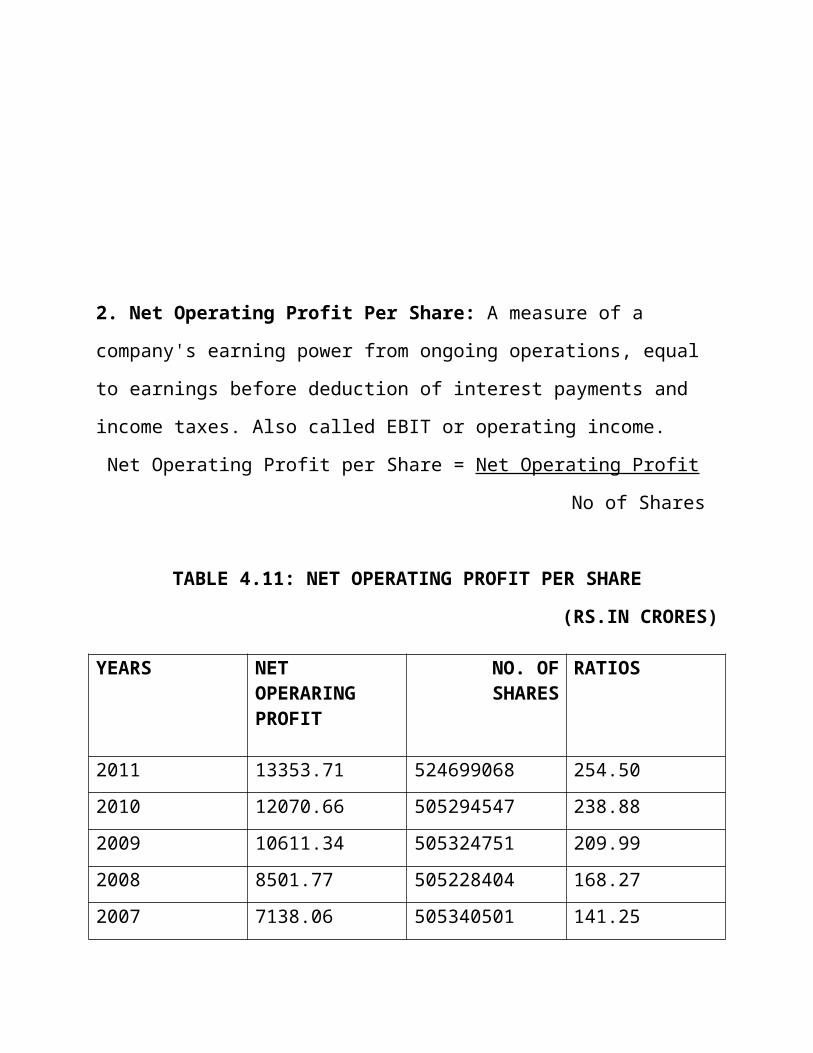
TABLE 4.11: NET OPERATING PROFIT PER SHARE
(RS.IN CRORES)
YEARS NET OPERARING PROFIT
NO. OF SHARES RATIOS
2011 13353.71 524699068 254.50
2010 12070.66 505294547 238.88
2009 10611.34 505324751 209.99
2008 8501.77 505228404 168.27
2007 7138.06 505340501 141.25
ANALYSIS:
The table above shows that in the year 2011 Net operating Profit per Share was
254.50 while in 2010 it was 238.88 whereas in 2009 it was 209.99 while for the
year 2008 it was 168.27 whereas in 2007 Net operating Profit per share was
141.25.
GRAPH 4.11: NET OPERATING PROFIT
INFERENCE
The above graph shows that the Net operating profit per share in 2007 is 141.25%
which is the lowest while in 2008 it has increased to 168.27%, whereas in 2009 it
has again increased to 209.99%, while in 2010 it has slightly increased to 238.88%
whereas in 2011 it is the highest with 254.50%.
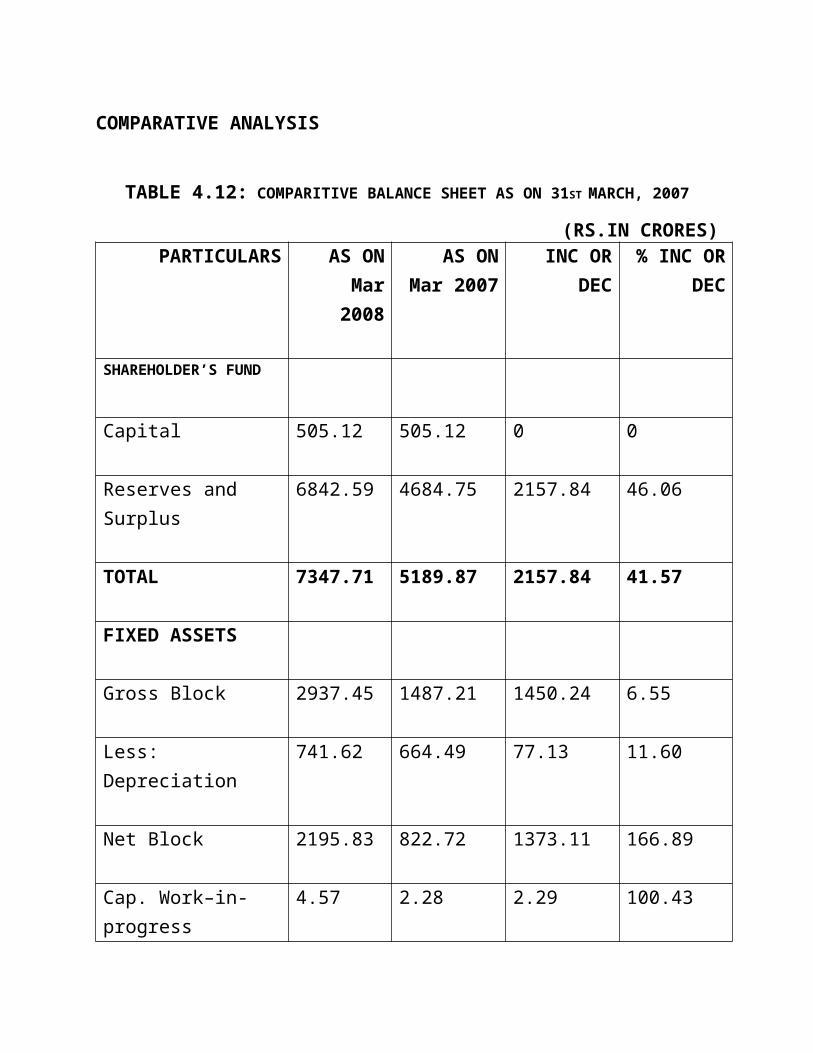
COMPARATIVE ANALYSIS
TABLE 4.12: COMPARITIVE BALANCE SHEET AS ON 31ST MARCH, 2007
(RS.IN CRORES)PARTICULARS AS ON
Mar 2008AS ON Mar
2007 INC OR
DEC % INC OR
DEC
SHAREHOLDER’S FUND
Capital 505.12 505.12 0 0
Reserves and Surplus 6842.59 4684.75 2157.84 46.06
TOTAL 7347.71 5189.87 2157.84 41.57
FIXED ASSETS
Gross Block 2937.45 1487.21 1450.24 6.55
Less: Depreciation 741.62 664.49 77.13 11.60
Net Block 2195.83 822.72 1373.11 166.89
Cap. Work–in-progress 4.57 2.28 2.29 100.43
Other Assets 3604.10 3058.24 545.86 17.85
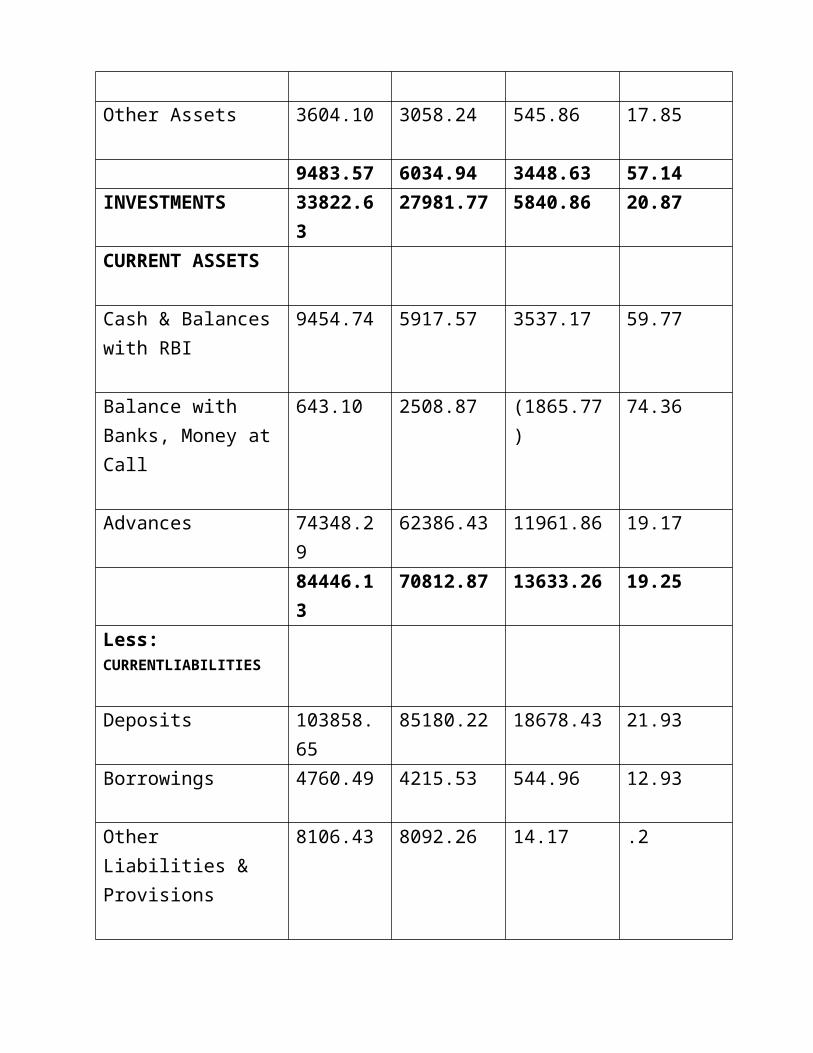
9483.57 6034.94 3448.63 57.14INVESTMENTS 33822.63 27981.77 5840.86 20.87
CURRENT ASSETS
Cash & Balances with RBI
9454.74 5917.57 3537.17 59.77
Balance with Banks, Money at Call
643.10 2508.87 (1865.77) 74.36
Advances 74348.29 62386.43 11961.86 19.17
84446.13 70812.87 13633.26 19.25Less: CURRENTLIABILITIES
Deposits 103858.65 85180.22 18678.43 21.93
Borrowings 4760.49 4215.53 544.96 12.93
Other Liabilities & Provisions
8106.43 8092.26 14.17 .2
116725.57 97488.01 19237.56 19.73Net Current Assets (32279.44) (26675.14) (5604.3) (21.00)
TOTAL 7347.71 5189.87 2157.84 41.57
INFERENCE
The Comparative balance sheet shows that during the year 2008 the Net worth has
increased by Rs.2157.84 Cr. i.e. 41.57% as there has been an increase in Reserve
and Surplus. Fixed Assets have grown by Rs.3448.63 Cr. i.e. 57.14%. Investment
has increased by 20.87%. Net Current Assets have decreased by Rs.5604.3 Cr. i.e.
21.00% resulting into a weak liquidity position of the company
TABLE 4.13: COMPARITIVE BALANCE SHEET AS ON 31ST MARCH, 2008
(RS.IN CRORES)PARTICULARS AS ON
Mar 2009AS ON Mar
2008INC OR
DEC % INC OR
DEC
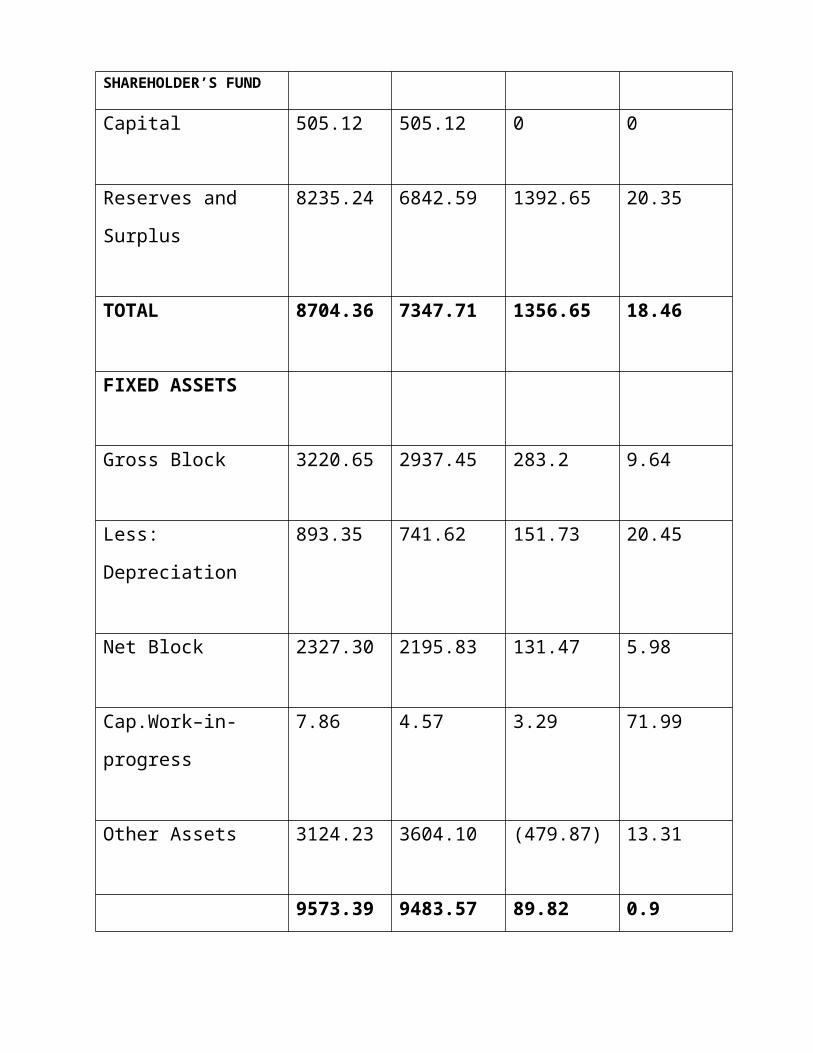
SHAREHOLDER’S FUND
Capital 505.12 505.12 0 0
Reserves and Surplus 8235.24 6842.59 1392.65 20.35
TOTAL 8704.36 7347.71 1356.65 18.46
FIXED ASSETS
Gross Block 3220.65 2937.45 283.2 9.64
Less: Depreciation 893.35 741.62 151.73 20.45
Net Block 2327.30 2195.83 131.47 5.98
Cap.Work–in-progress 7.86 4.57 3.29 71.99
Other Assets 3124.23 3604.10 (479.87) 13.31
9573.39 9483.57 89.82 0.9
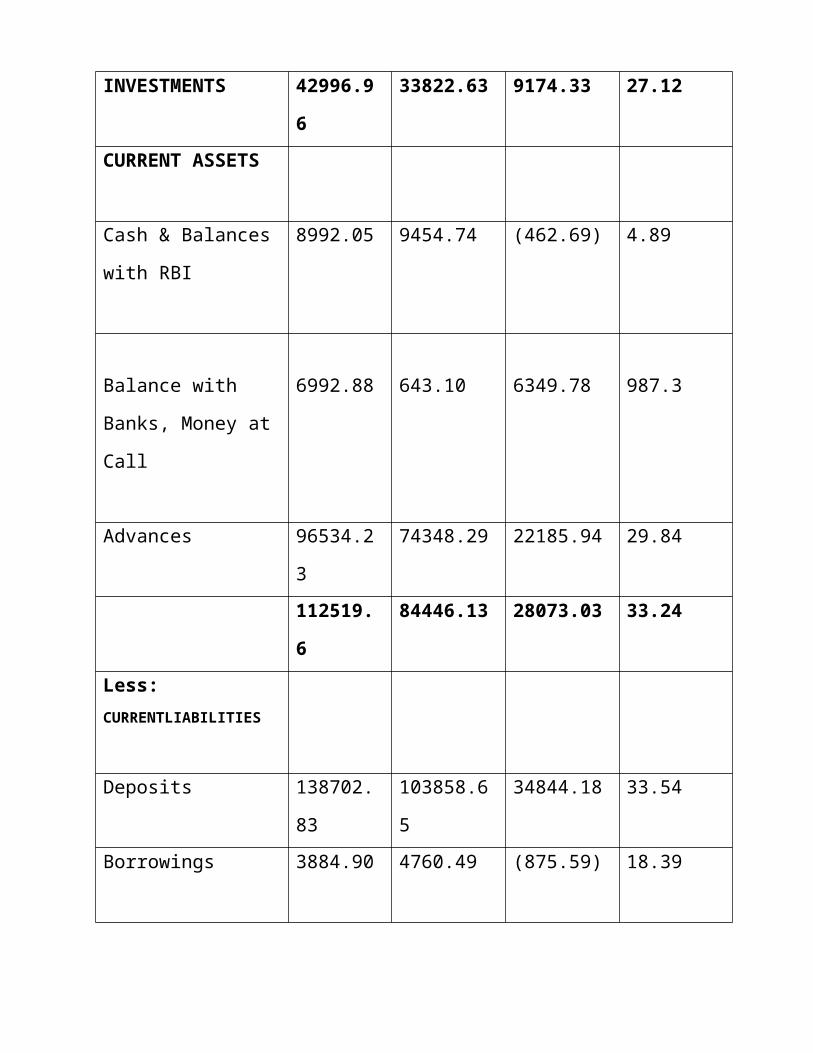
INVESTMENTS 42996.96 33822.63 9174.33 27.12
CURRENT ASSETS
Cash & Balances with
RBI
8992.05 9454.74 (462.69) 4.89
Balance with Banks,
Money at Call
6992.88 643.10 6349.78 987.3
Advances 96534.23 74348.29 22185.94 29.84
112519.6 84446.13 28073.03 33.24
Less: CURRENTLIABILITIES
Deposits 138702.83 103858.65 34844.18 33.54
Borrowings 3884.90 4760.49 (875.59) 18.39
Other Liabilities &
Provisions
9647.43 8106.43 1541 19.01
152235.16 116725.57 35509.59 30.42
Net Current Assets (39715.56) (26675.14) (13040.42) 48.88
TOTAL 8704.36 7347.71 1356.65 18.46
INFERENCE
The Comparative balance sheet shows that during the year 2008 the Net worth has
increased by Rs.1356.65 Cr. i.e. 18.46% and Reserve and Surplus, 20.35%. Fixed
Assets have grown by Rs.89.82 Cr. i.e. 0.9%Investment has increased by 27.12%.
Current Assets have increased by 33.24% and there have been an increase in
Current Liabilities by 30.42%. As a result Net Current Assets has decreased by
Rs.13040.42 i.e. 48.88% which shows a weak liquidity position of the company.
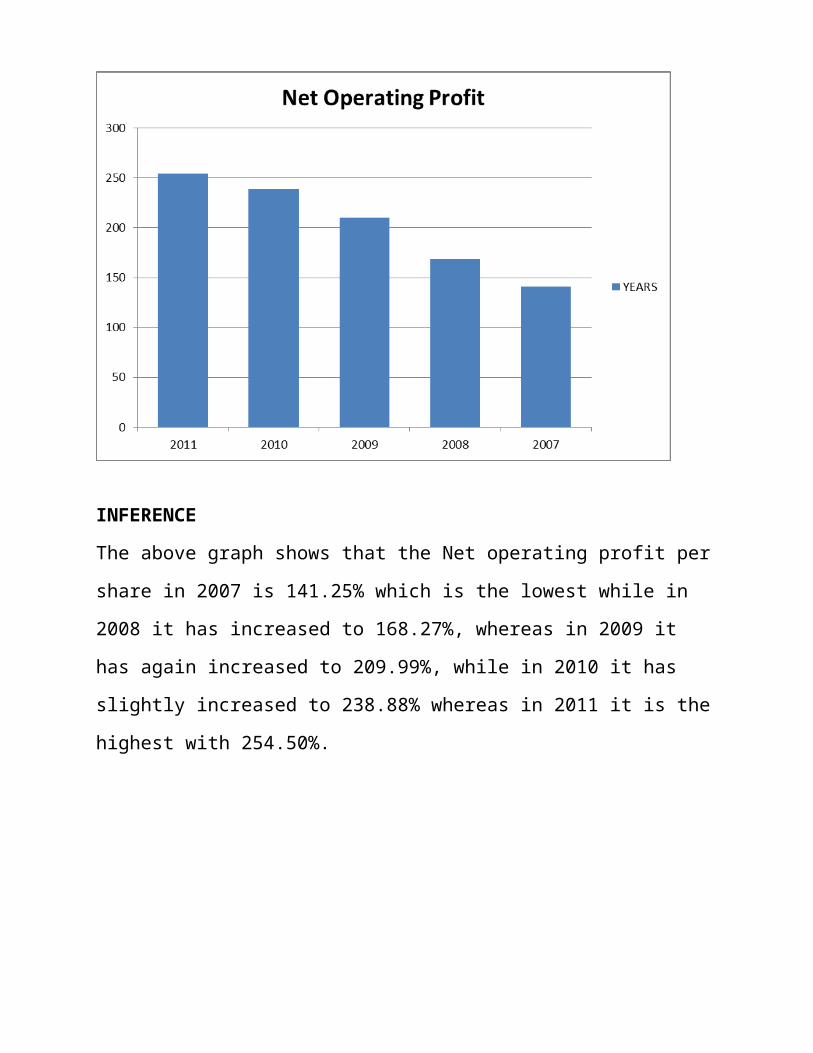
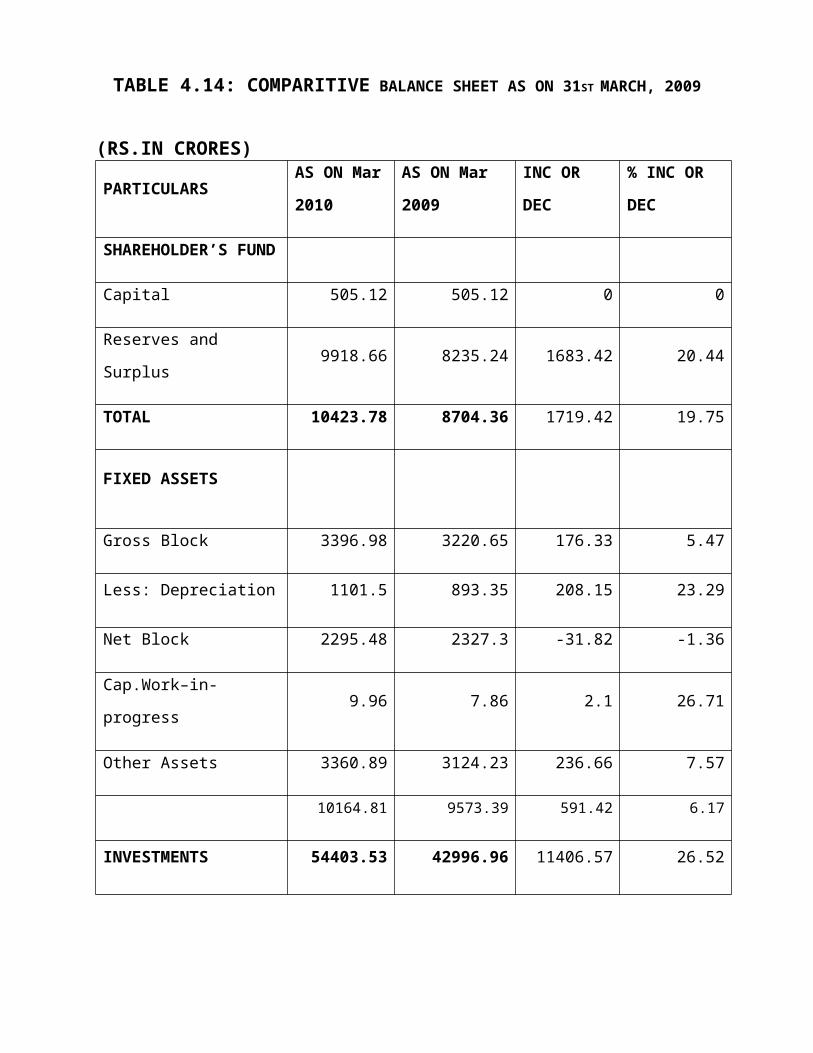
TABLE 4.14: COMPARITIVE BALANCE SHEET AS ON 31ST MARCH, 2009
(RS.IN CRORES)
PARTICULARS AS ON Mar
2010
AS ON Mar
2009
INC OR
DEC
% INC OR
DEC
SHAREHOLDER’S
FUND
Capital 505.12 505.12 0 0
Reserves and Surplus 9918.66 8235.24 1683.42 20.44
TOTAL 10423.78 8704.36 1719.42 19.75
FIXED ASSETS
Gross Block 3396.98 3220.65 176.33 5.47
Less: Depreciation 1101.5 893.35 208.15 23.29
Net Block 2295.48 2327.3 -31.82 -1.36
Cap.Work–in-progress 9.96 7.86 2.1 26.71
Other Assets 3360.89 3124.23 236.66 7.57
10164.81 9573.39 591.42 6.17
INVESTMENTS 54403.53 42996.96 11406.57 26.52
CURRENT ASSETS
Cash & Balances with RBI 12468.24 8992.05 3476.19 38.65
Balance with Banks,
Money at Call 3308.45 6992.88 -3684.43 -52.68
Advances 119315.3 96534.23 22781.07 23.59
135091.99 112519.6 22572.39 20.06
Less:
CURRENTLIABILITIES
Deposits 170039.74 138702.83 31336.91 22.59
Borrowings 9215.31 3884.9 5330.41 137.20
Other Liabilities &
Provisions 5483.01 9647.43 -4164.42 -43.16
184738.06 152235.16 32502.9 21.35
Net Current Assets -49646.07 -39715.56 -9930.51 25.00
TOTAL 10423.78 8704.36 1719.42 19.75
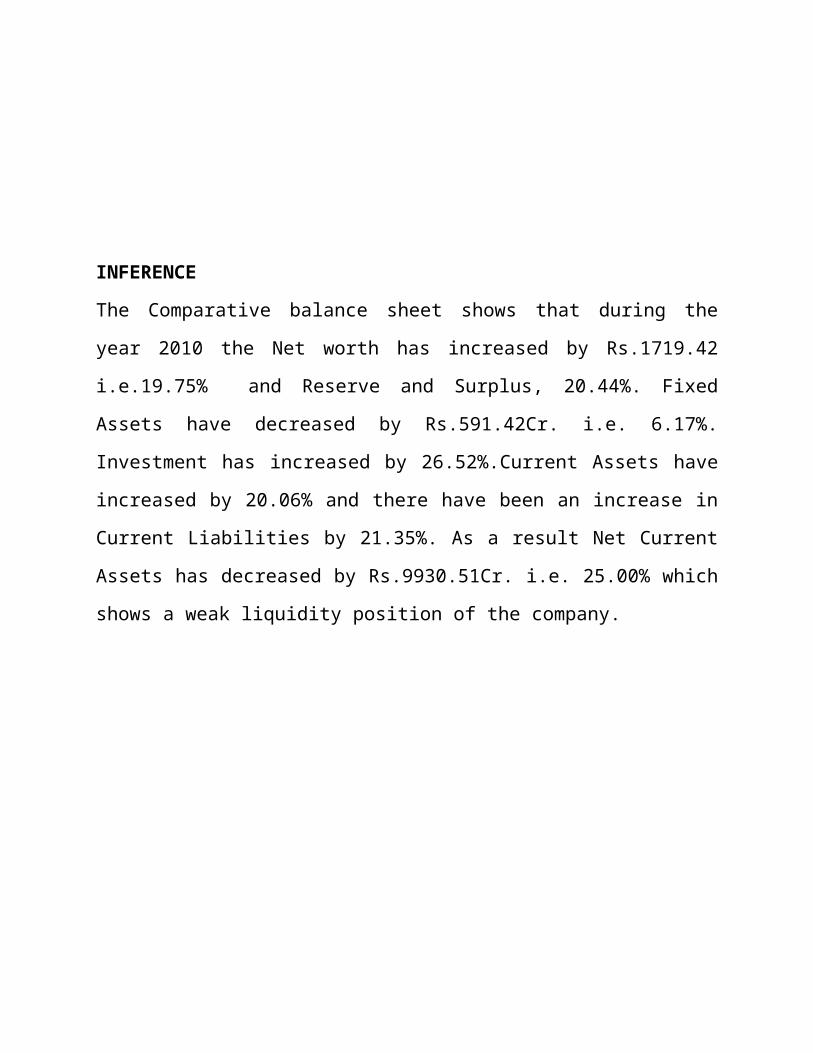
INFERENCE
The Comparative balance sheet shows that during the year 2010 the Net worth has
increased by Rs.1719.42 i.e.19.75% and Reserve and Surplus, 20.44%. Fixed
Assets have decreased by Rs.591.42Cr. i.e. 6.17%. Investment has increased by
26.52%.Current Assets have increased by 20.06% and there have been an increase
in Current Liabilities by 21.35%. As a result Net Current Assets has decreased by
Rs.9930.51Cr. i.e. 25.00% which shows a weak liquidity position of the company.
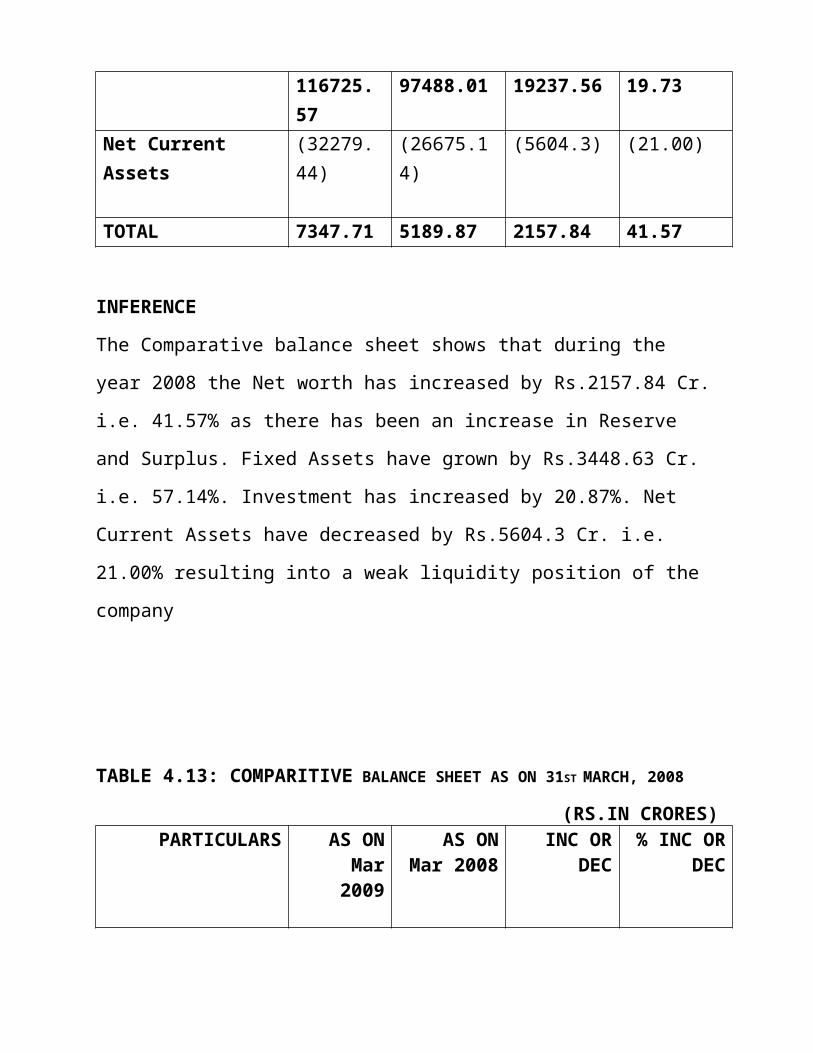
TABLE 4.15: COMPARITIVE BALANCE SHEET AS ON 31STMARCH, 2010
(RS.IN CRORES)
PARTICULARS
AS ON Mar
2011
AS ON Mar
2010
INC OR
DEC
% INC OR
DEC
SHAREHOLDER’S
FUND
Capital 635.33 505.12 130.21 25.77
Reserves and Surplus 12129.19 9918.66 2210.53 22.28
TOTAL 12764.52 10423.78 2340.74 22.45
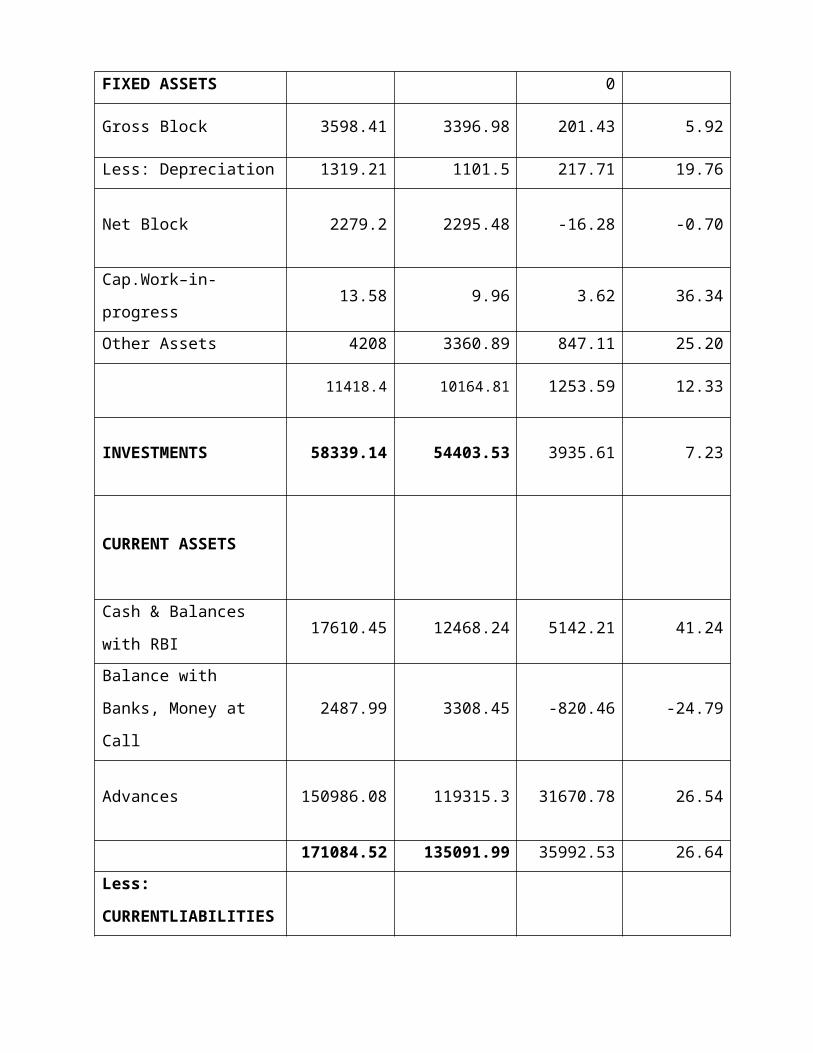
FIXED ASSETS 0
Gross Block 3598.41 3396.98 201.43 5.92
Less: Depreciation 1319.21 1101.5 217.71 19.76
Net Block 2279.2 2295.48 -16.28 -0.70
Cap.Work–in-progress 13.58 9.96 3.62 36.34
Other Assets 4208 3360.89 847.11 25.20
11418.4 10164.81 1253.59 12.33
INVESTMENTS 58339.14 54403.53 3935.61 7.23
CURRENT ASSETS
Cash & Balances with RBI 17610.45 12468.24 5142.21 41.24
Balance with Banks,
Money at Call 2487.99 3308.45 -820.46 -24.79
Advances 150986.08 119315.3 31670.78 26.54
171084.52 135091.99 35992.53 26.64
Less:
CURRENTLIABILITIES
Deposits 202461.29 170039.74 32421.55 19.06
Borrowings 13315.97 9215.31 4100.66 44.49
Other Liabilities &
Provisions 7442.67 5483.01 1959.66 35.74
223219.93 184738.06 38481.87 20.83
Net Current Assets -52135.41 -49646.07 -2489.34 5.01
TOTAL 12764.52 10423.78 2340.74 22.45
INFERENCE
The Comparative balance sheet shows that during the year 2011 the Net worth has
increased by Rs.2340.74 Cr. i.e. 24.55% as there has been an increase in Reserve
and Surplus, 22.28%. Fixed Assets have increased by Rs.1253.59Cr. i.e. 12.33%.
Investment has increased by 7.23 %.
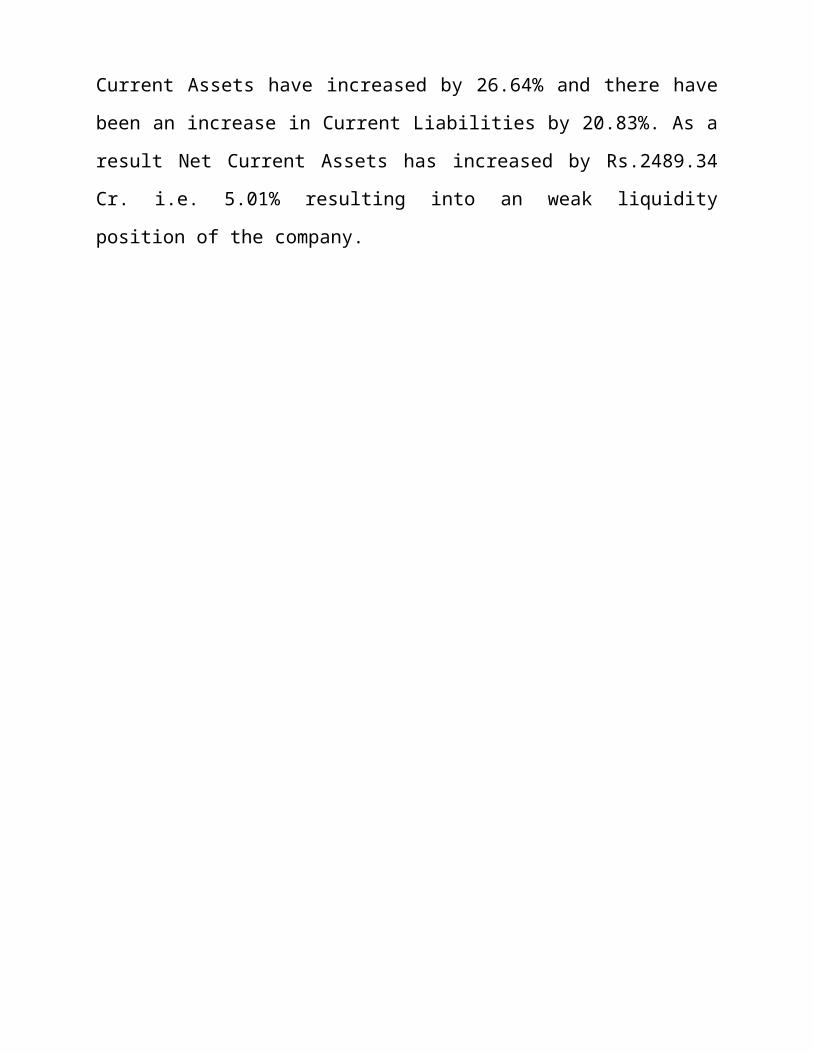
Current Assets have increased by 26.64% and there have been an increase in
Current Liabilities by 20.83%. As a result Net Current Assets has increased by
Rs.2489.34 Cr. i.e. 5.01% resulting into an weak liquidity position of the company.
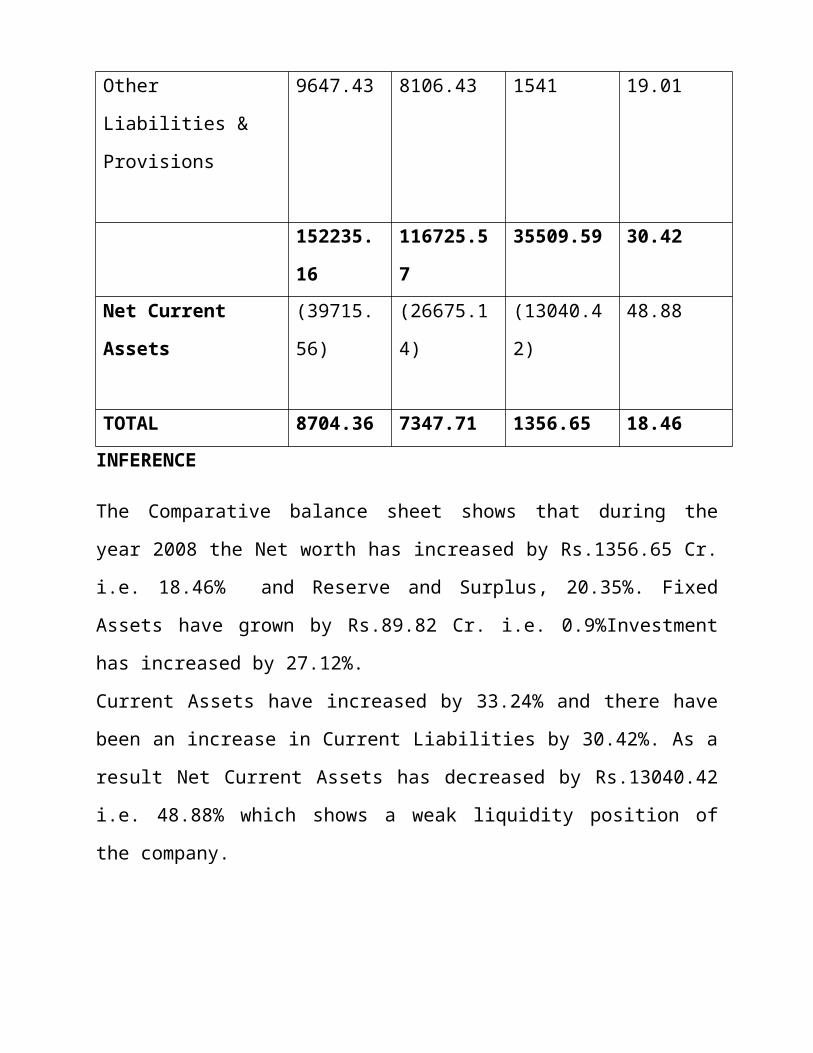
TABLE 4.16: COMPARITIVE INCOME STATEMENT AS ON MARCH, 2007
(RS.IN CRORES)PARTICULARS AS ON Mar
2008
AS ON Mar
2007
INC OR
DEC
% INC OR
DEC
INCOME
Interest Earned 9447.3 7382.18 2065.12 27.97
Other Income 1232.67 841.8 390.87 46.43
TOTAL 10679.97 8223.96 2456.01 29.86
EXPENDITURE
Interest Expanded 6360.95 4591.96 1768.99 38.52
Employee Cost 845.68 873.8 -28.12 -3.21
Selling &
Administrative
Expenses
946.34 620.16 326.18 52.59
Miscellaneous
Expenses
1038.15 1206.3 -168.15 -13.93
Operating
Expenses
2178.2 1805.92 372.28 20.61
Provisions &
Contingencies
753.79 980.71 -226.92 -23.13
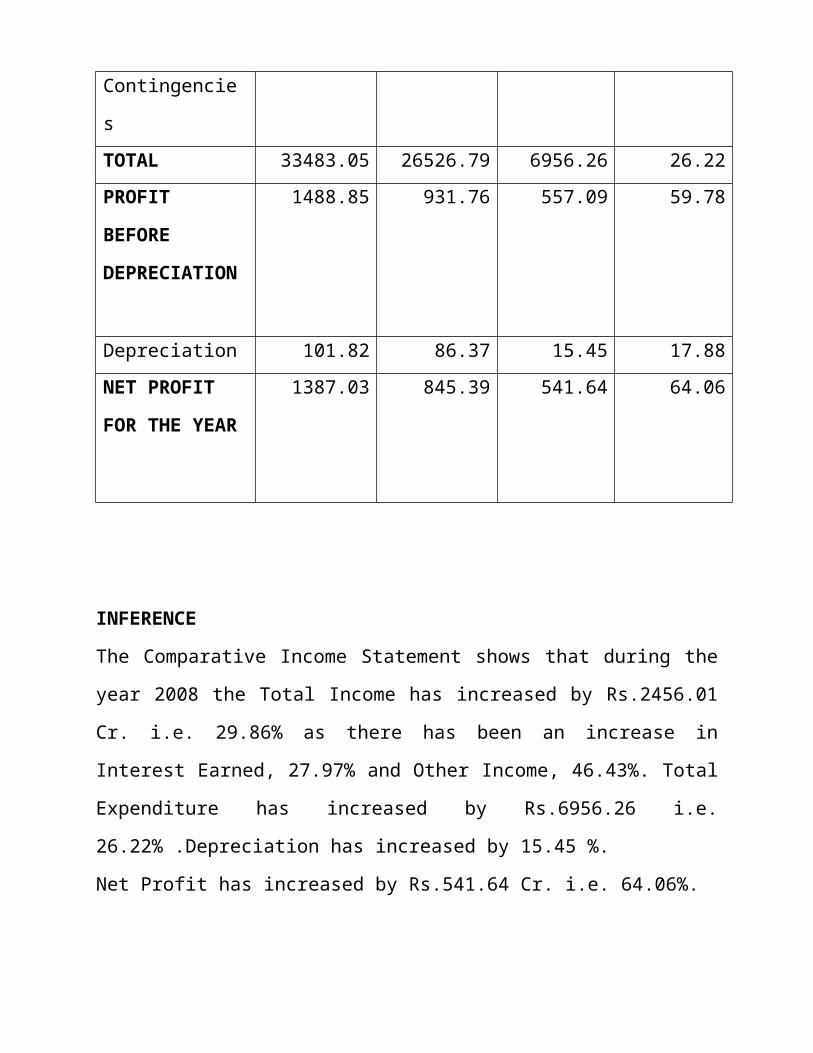
TOTAL 33483.05 26526.79 6956.26 26.22
PROFIT
BEFORE
DEPRECIATION
1488.85 931.76 557.09 59.78
Depreciation 101.82 86.37 15.45 17.88
NET PROFIT
FOR THE YEAR
1387.03 845.39 541.64 64.06
INFERENCE
The Comparative Income Statement shows that during the year 2008 the Total
Income has increased by Rs.2456.01 Cr. i.e. 29.86% as there has been an increase
in Interest Earned, 27.97% and Other Income, 46.43%. Total Expenditure has
increased by Rs.6956.26 i.e. 26.22% .Depreciation has increased by 15.45 %.
Net Profit has increased by Rs.541.64 Cr. i.e. 64.06%.
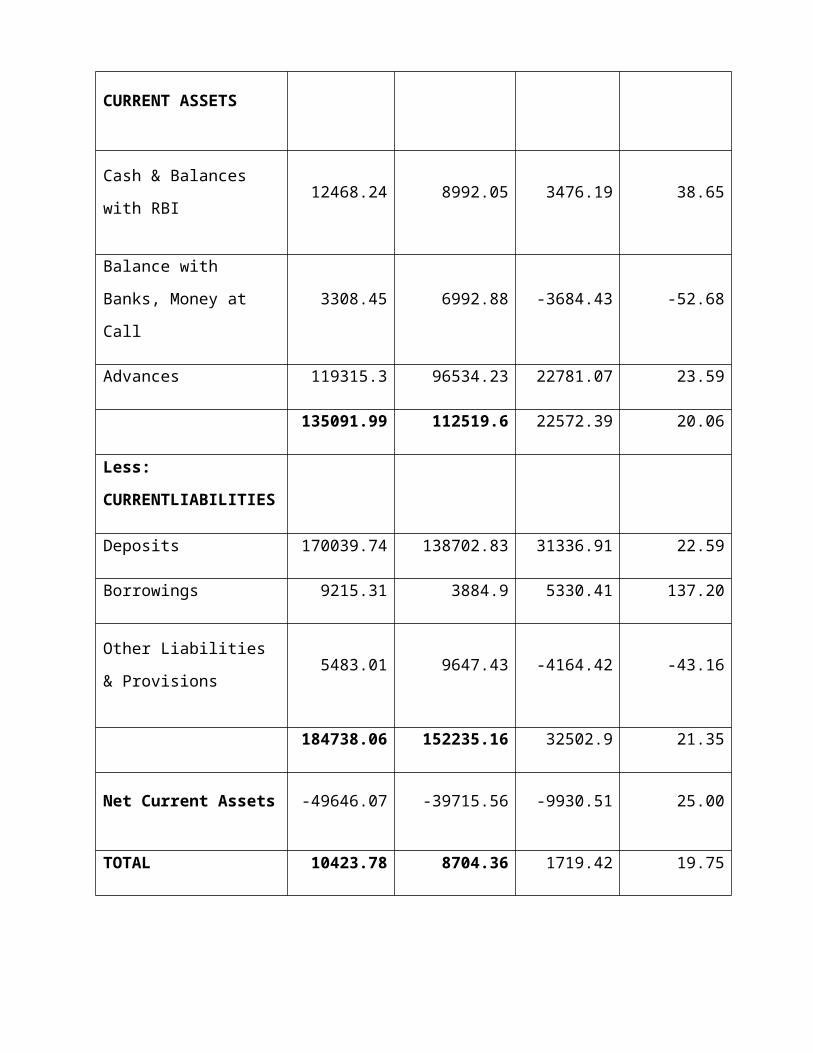
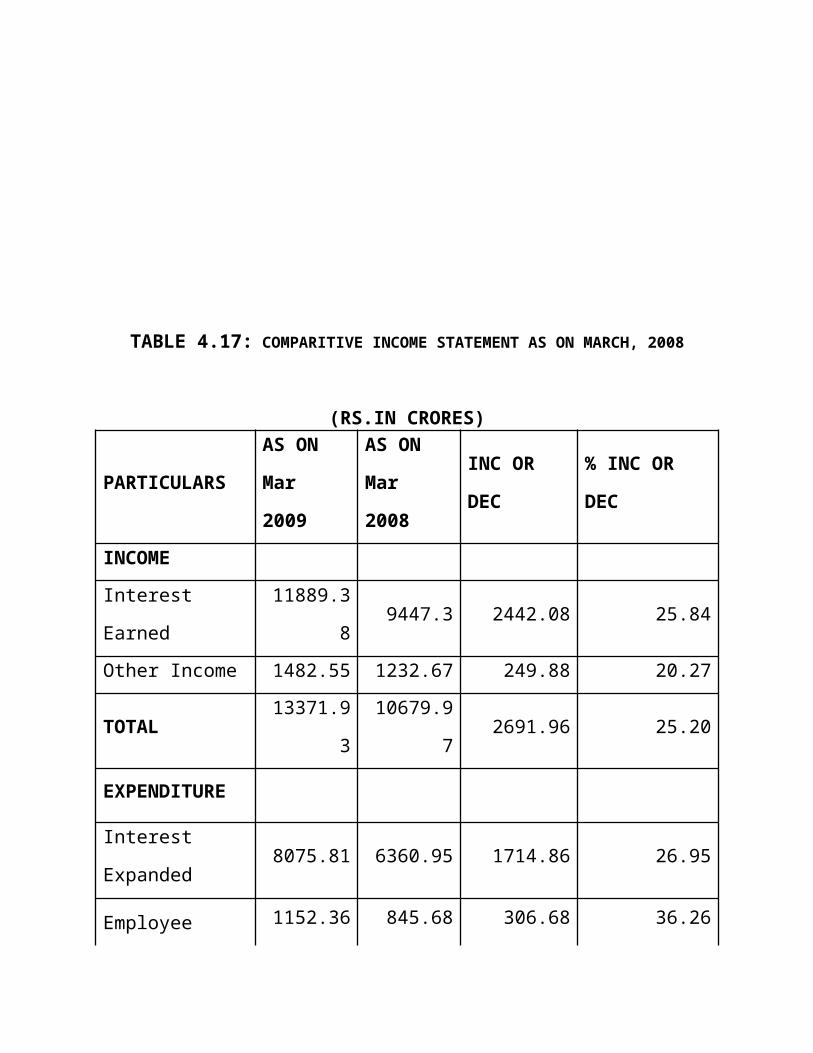
TABLE 4.17: COMPARITIVE INCOME STATEMENT AS ON MARCH, 2008
(RS.IN CRORES)
PARTICULARS AS ON
Mar 2009
AS ON
Mar 2008
INC OR
DEC
% INC OR
DEC
INCOME
Interest Earned 11889.38 9447.3 2442.08 25.84
Other Income 1482.55 1232.67 249.88 20.27
TOTAL 13371.93 10679.97 2691.96 25.20
EXPENDITURE
Interest Expanded 8075.81 6360.95 1714.86 26.95
Employee Cost 1152.36 845.68 306.68 36.26
Selling &
Administrative
Expenses
1082.54 946.34 136.2 14.39
Miscellaneous
Expenses 1198.08 1038.15 159.93 15.40
Operating
Expenses 2760.59 2178.2 582.39 26.73
Provisions &
Contingencies 808.97 753.79 55.18 7.32
TOTAL 41822.21 33483.05 8339.16 24.90
PROFIT
BEFORE
DEPRECIATION
1863.13 1488.85 374.28 25.13
Depreciation 136.58 101.82 34.76 34.13
NET PROFIT
FOR THE YEAR 1726.55 1387.03 339.52 24.47
INFERENCE
The Comparative Income Statement shows that during the year 2009 the Total
Income has increased by Rs.2691.96 Cr. i.e. 25.20% as there has been an increase
in Interest Earned, 25.84% and Other Income, 20.27%. Total Expenditure has
increased by Rs.8339.16 i.e. 24.90% Depreciation has increased by 34.13%.
Net Profit has increased by Rs.339.52 Cr. i.e. 24.47
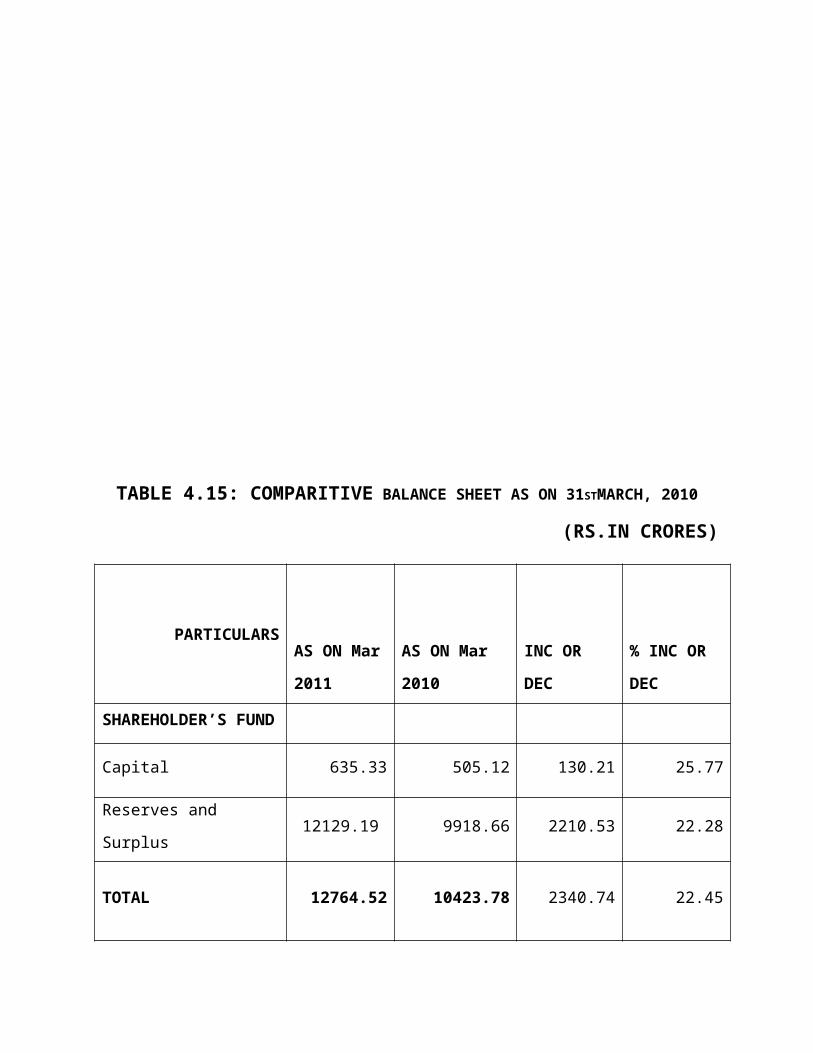
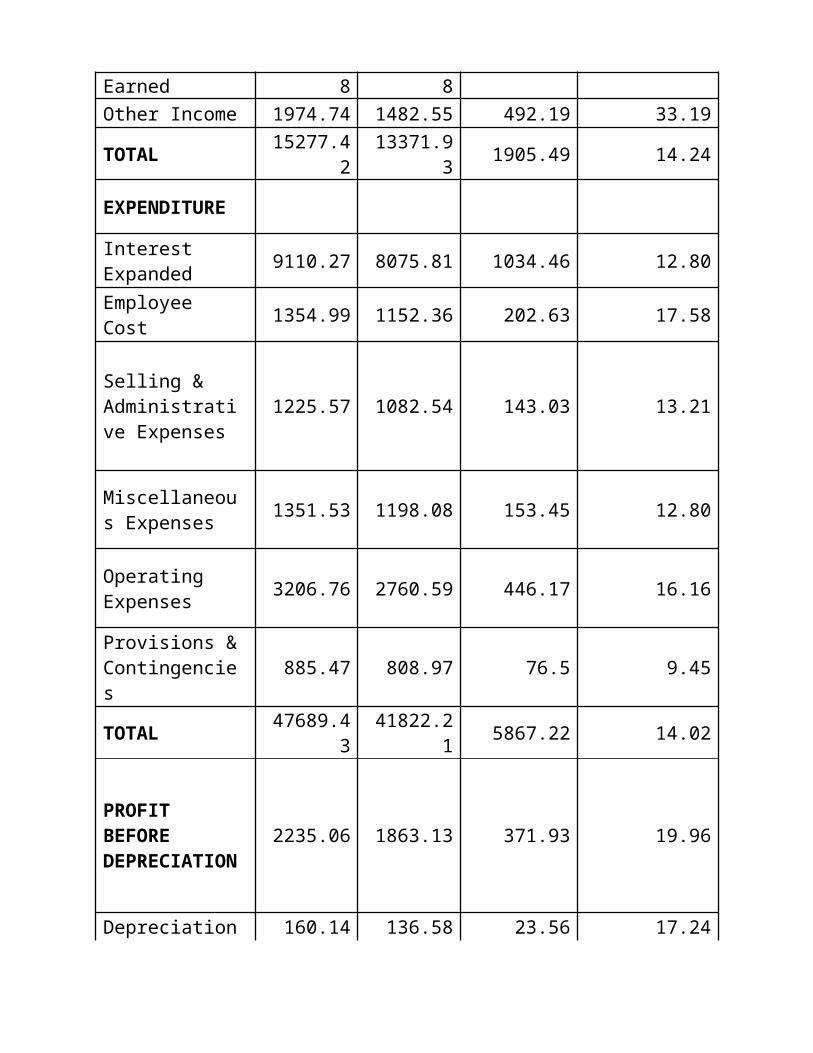
TABLE 4.18: COMPARITIVE INCOME STATEMENT AS ON MARCH, 2009
(RS.IN CRORES)
PARTICULARS AS ON Mar 2010
AS ON Mar 2009
INC OR DEC
% INC OR DEC
INCOME Interest Earned 13302.68 11889.38 1413.3 11.88Other Income 1974.74 1482.55 492.19 33.19TOTAL 15277.42 13371.93 1905.49 14.24
EXPENDITURE
Interest Expanded 9110.27 8075.81 1034.46 12.80
Employee Cost 1354.99 1152.36 202.63 17.58
Selling & Administrative Expenses
1225.57 1082.54 143.03 13.21
Miscellaneous Expenses 1351.53 1198.08 153.45 12.80
Operating Expenses 3206.76 2760.59 446.17 16.16
Provisions & Contingencies 885.47 808.97 76.5 9.45
TOTAL 47689.43 41822.21 5867.22 14.02
PROFIT BEFORE DEPRECIATION
2235.06 1863.13 371.93 19.96
Depreciation 160.14 136.58 23.56 17.24
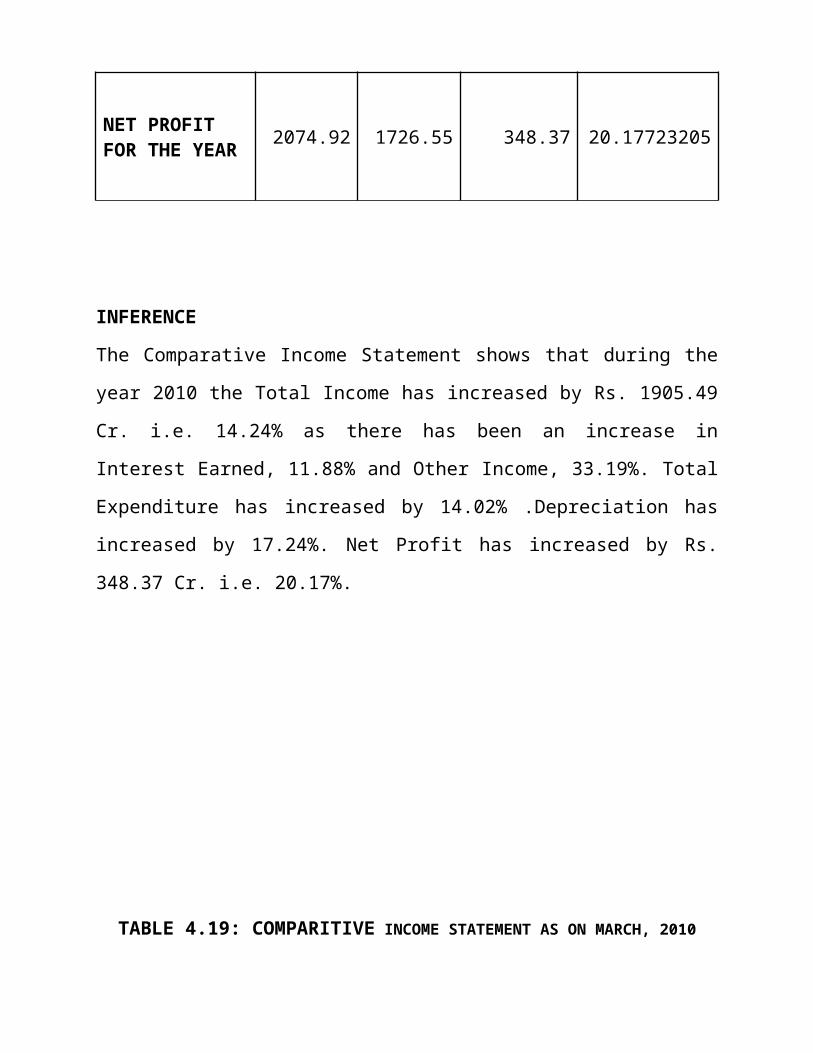
NET PROFIT FOR THE YEAR 2074.92 1726.55 348.37 20.17723205
INFERENCE
The Comparative Income Statement shows that during the year 2010 the Total
Income has increased by Rs. 1905.49 Cr. i.e. 14.24% as there has been an increase
in Interest Earned, 11.88% and Other Income, 33.19%. Total Expenditure has
increased by 14.02% .Depreciation has increased by 17.24%. Net Profit has
increased by Rs. 348.37 Cr. i.e. 20.17%.
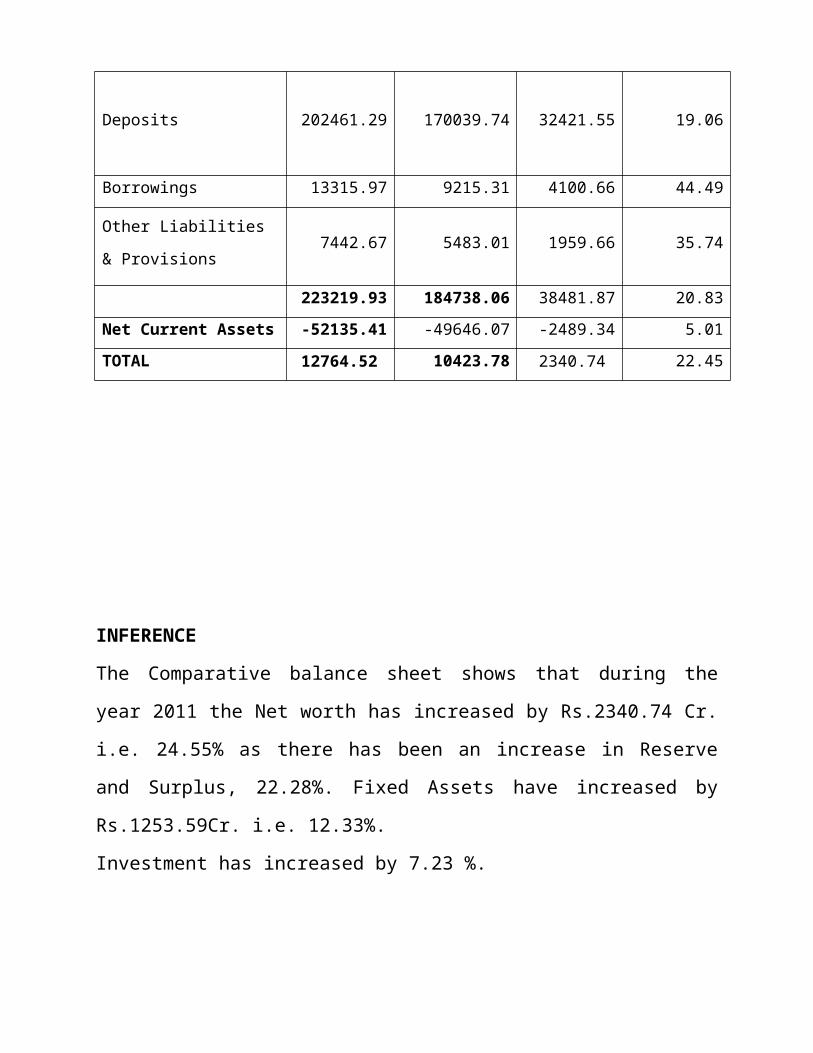
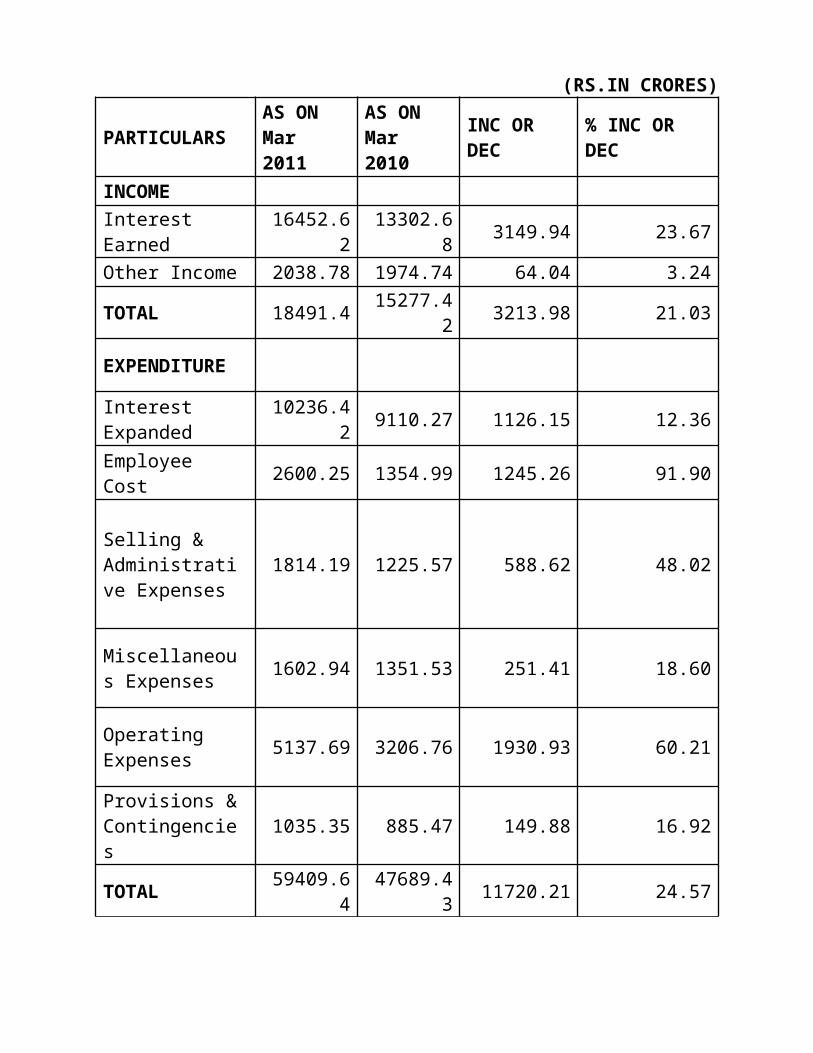
TABLE 4.19: COMPARITIVE INCOME STATEMENT AS ON MARCH, 2010
(RS.IN CRORES)
PARTICULARS AS ON Mar 2011
AS ON Mar 2010
INC OR DEC
% INC OR DEC
INCOME Interest Earned 16452.62 13302.68 3149.94 23.67Other Income 2038.78 1974.74 64.04 3.24TOTAL 18491.4 15277.42 3213.98 21.03
EXPENDITURE
Interest Expanded 10236.42 9110.27 1126.15 12.36
Employee Cost 2600.25 1354.99 1245.26 91.90
Selling & Administrative Expenses
1814.19 1225.57 588.62 48.02
Miscellaneous Expenses 1602.94 1351.53 251.41 18.60
Operating Expenses 5137.69 3206.76 1930.93 60.21
Provisions & Contingencies 1035.35 885.47 149.88 16.92
TOTAL 59409.64 47689.43 11720.21 24.57
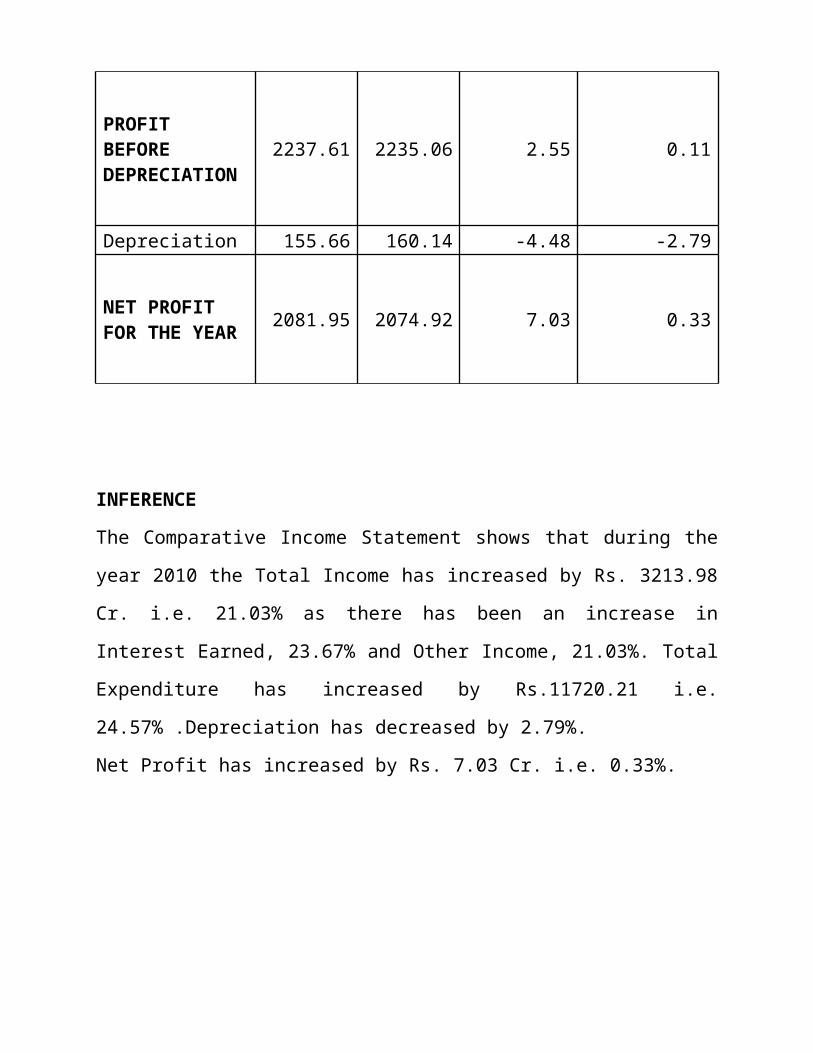
PROFIT BEFORE DEPRECIATION
2237.61 2235.06 2.55 0.11
Depreciation 155.66 160.14 -4.48 -2.79
NET PROFIT FOR THE YEAR 2081.95 2074.92 7.03 0.33
INFERENCE
The Comparative Income Statement shows that during the year 2010 the Total
Income has increased by Rs. 3213.98 Cr. i.e. 21.03% as there has been an increase
in Interest Earned, 23.67% and Other Income, 21.03%. Total Expenditure has
increased by Rs.11720.21 i.e. 24.57% .Depreciation has decreased by 2.79%.
Net Profit has increased by Rs. 7.03 Cr. i.e. 0.33%.
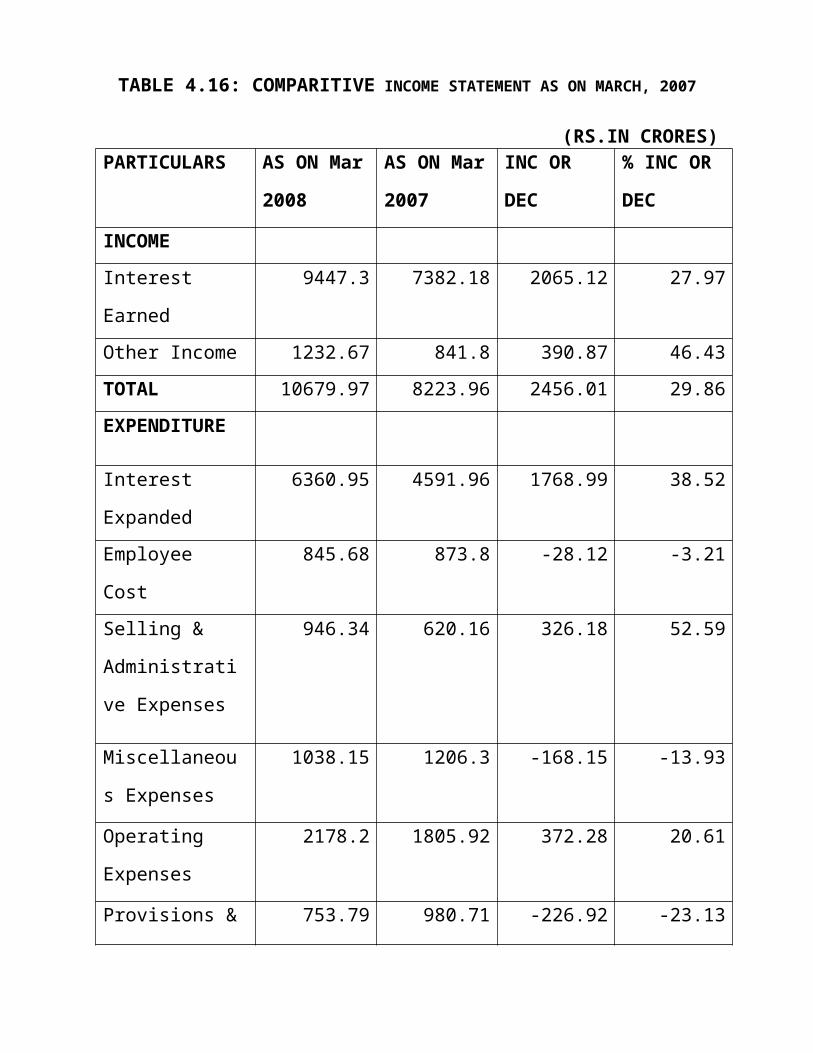
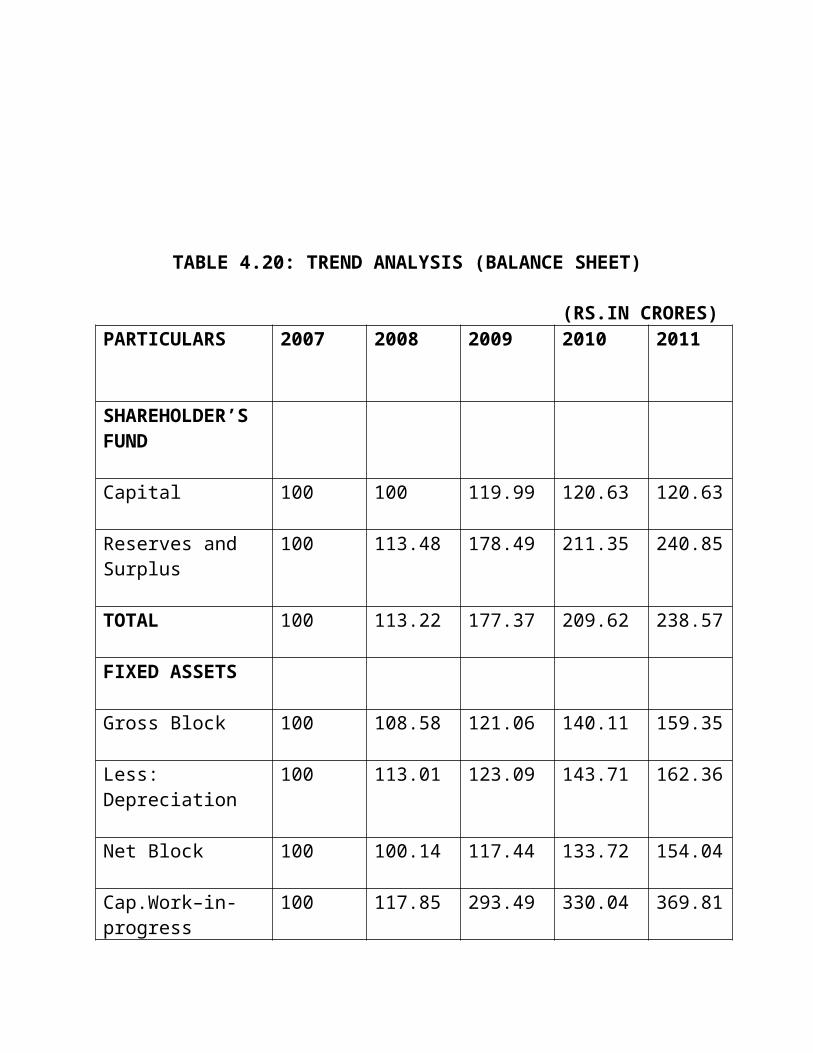
TABLE 4.20: TREND ANALYSIS (BALANCE SHEET)
(RS.IN CRORES)PARTICULARS 2007 2008 2009 2010 2011
SHAREHOLDER’S FUND
Capital 100 100 119.99 120.63 120.63
Reserves and Surplus 100 113.48 178.49 211.35 240.85
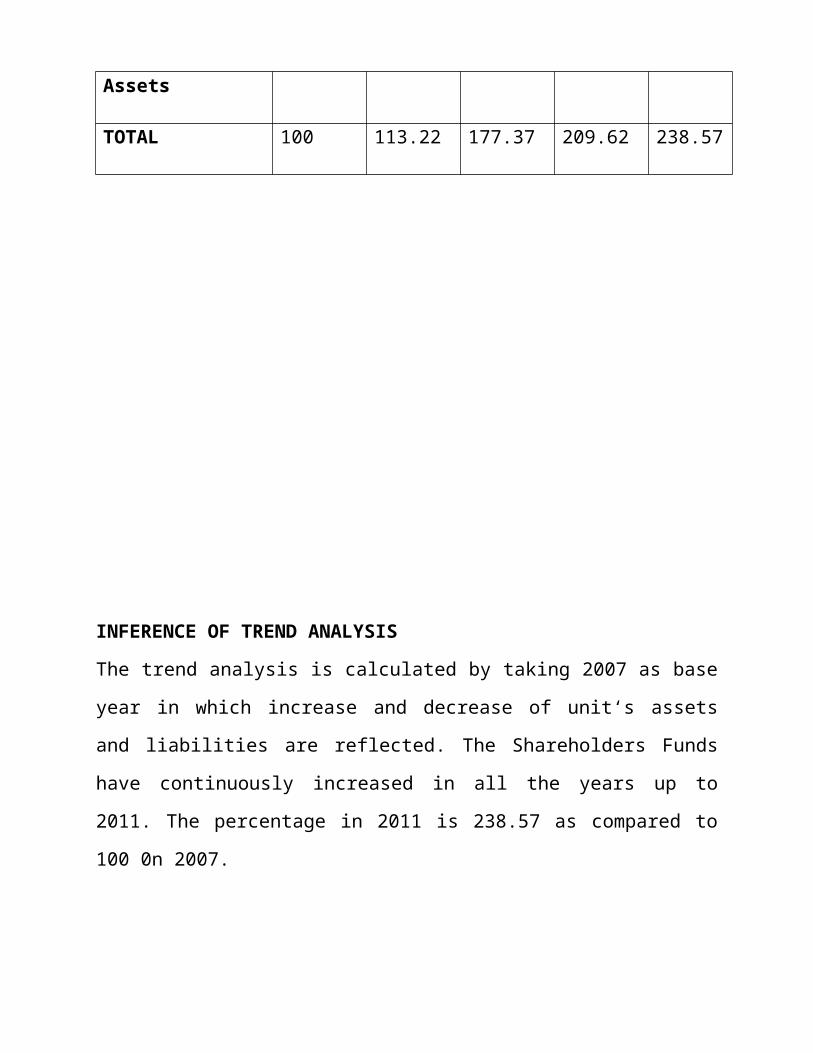
TOTAL 100 113.22 177.37 209.62 238.57
FIXED ASSETS
Gross Block 100 108.58 121.06 140.11 159.35
Less: Depreciation 100 113.01 123.09 143.71 162.36
Net Block 100 100.14 117.44 133.72 154.04
Cap.Work–in-progress
100 117.85 293.49 330.04 369.81
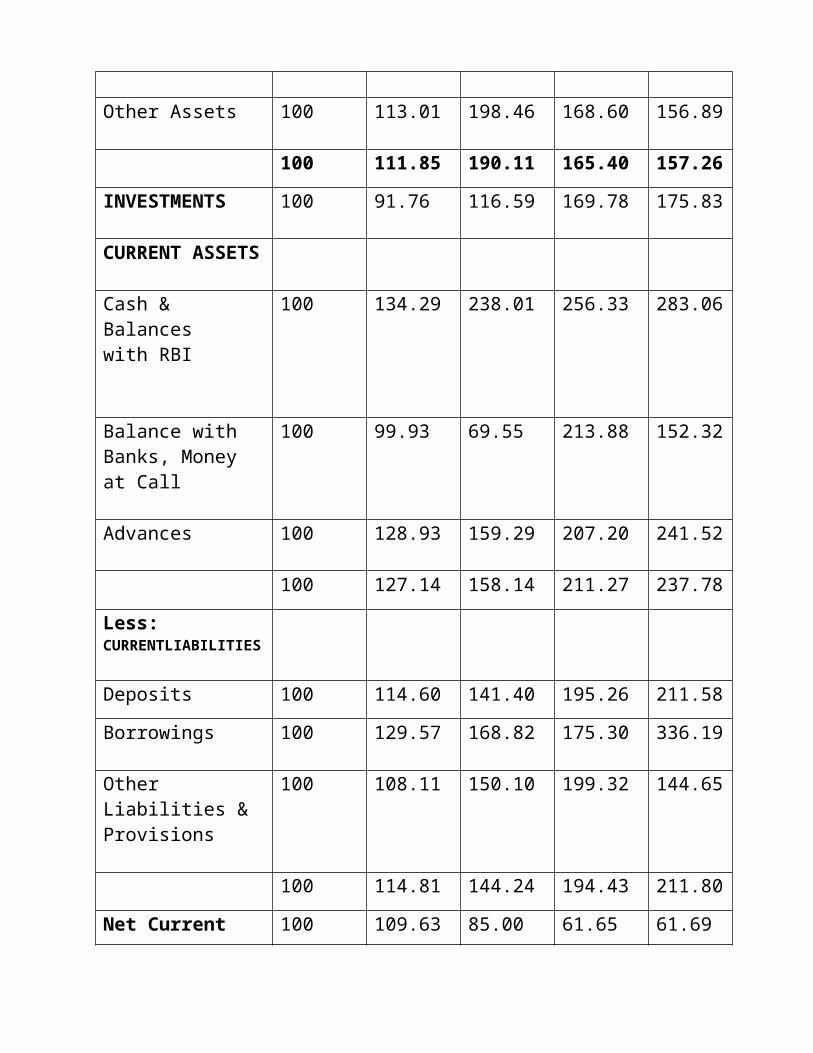
Other Assets 100 113.01 198.46 168.60 156.89
100 111.85 190.11 165.40 157.26
INVESTMENTS 100 91.76 116.59 169.78 175.83
CURRENT ASSETS
Cash & Balanceswith RBI
100 134.29 238.01 256.33 283.06
Balance with Banks, 100 99.93 69.55 213.88 152.32
Money at Call
Advances 100 128.93 159.29 207.20 241.52
100 127.14 158.14 211.27 237.78
Less: CURRENTLIABILITIES
Deposits 100 114.60 141.40 195.26 211.58
Borrowings 100 129.57 168.82 175.30 336.19
Other Liabilities & Provisions
100 108.11 150.10 199.32 144.65
100 114.81 144.24 194.43 211.80
Net Current Assets 100 109.63 85.00 61.65 61.69
TOTAL 100 113.22 177.37 209.62 238.57
INFERENCE OF TREND ANALYSIS
The trend analysis is calculated by taking 2007 as base year in which increase and
decrease of unit‘s assets and liabilities are reflected. The Shareholders Funds have
continuously increased in all the years up to 2011. The percentage in 2011 is
238.57 as compared to 100 0n 2007.
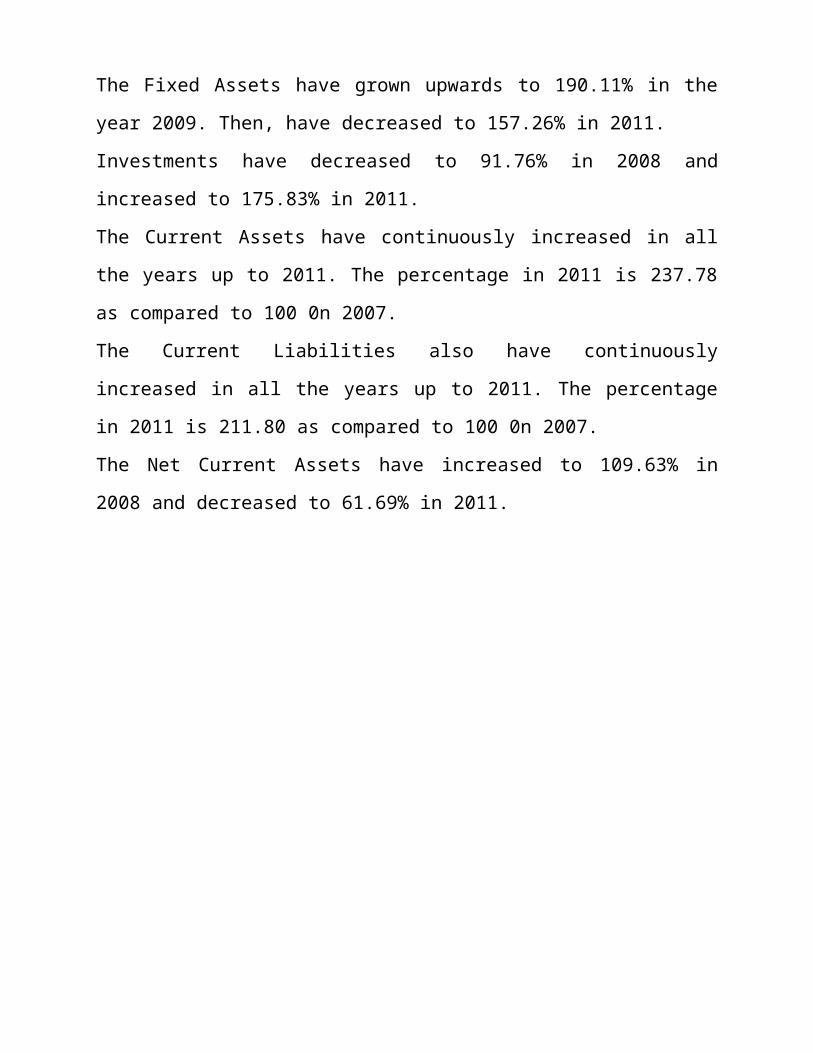
The Fixed Assets have grown upwards to 190.11% in the year 2009. Then, have
decreased to 157.26% in 2011.
Investments have decreased to 91.76% in 2008 and increased to 175.83% in 2011.
The Current Assets have continuously increased in all the years up to 2011. The
percentage in 2011 is 237.78 as compared to 100 0n 2007.
The Current Liabilities also have continuously increased in all the years up to
2011. The percentage in 2011 is 211.80 as compared to 100 0n 2007.
The Net Current Assets have increased to 109.63% in 2008 and decreased to
61.69% in 2011.
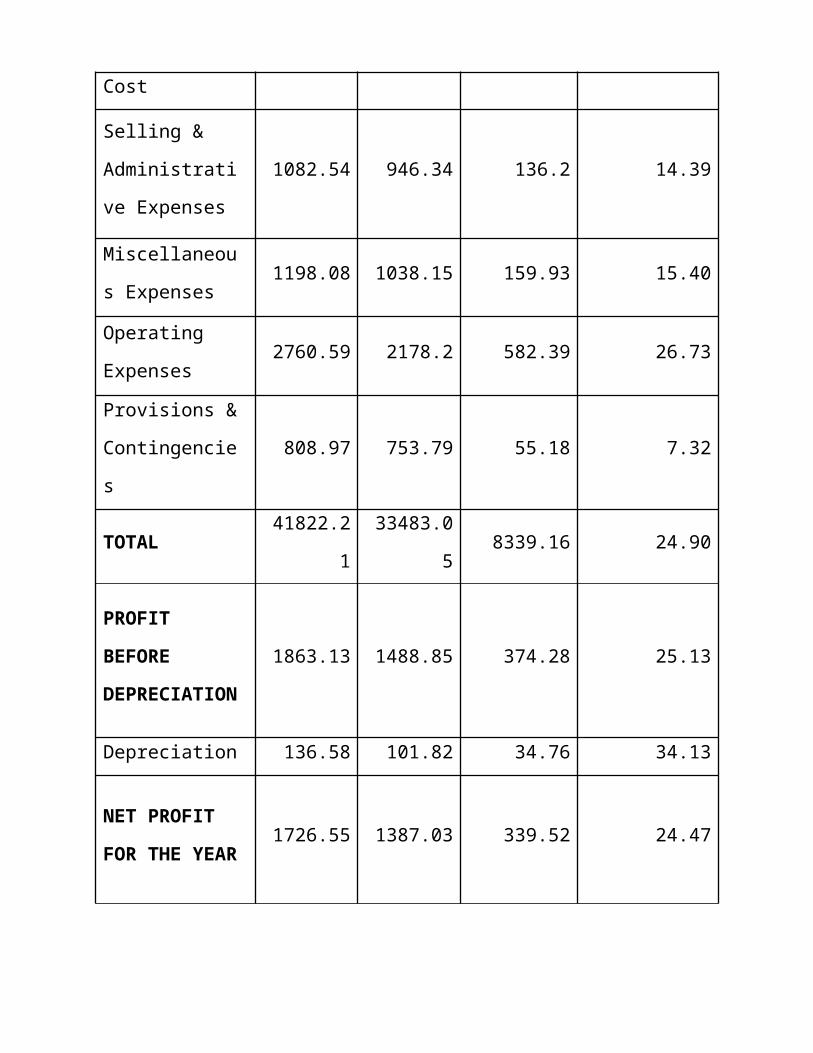
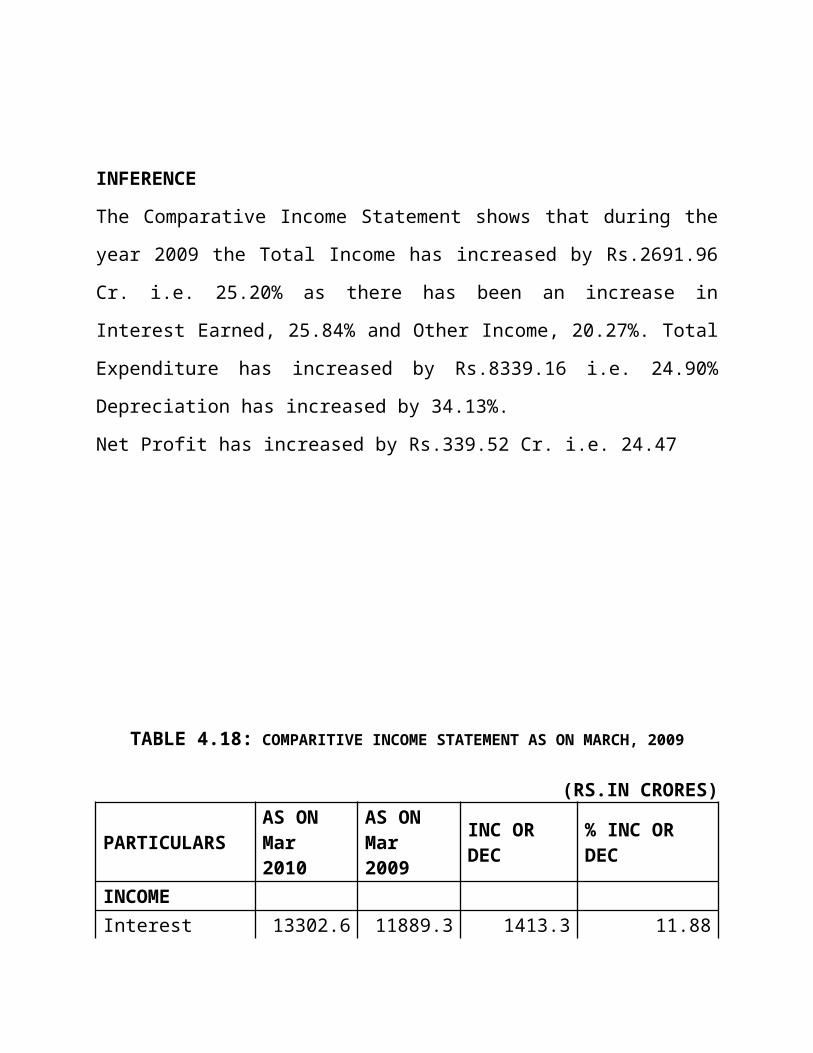
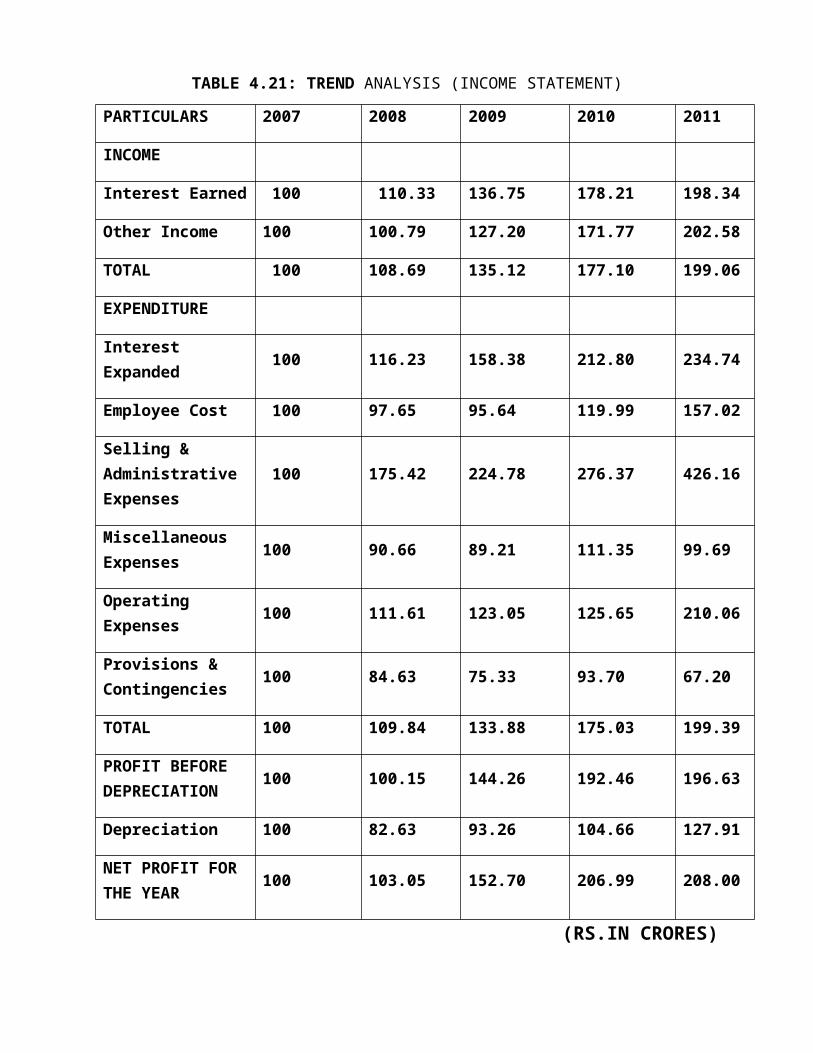
TABLE 4.21: TREND ANALYSIS (INCOME STATEMENT)
PARTICULARS 2007 2008 2009 2010 2011
INCOME
Interest Earned 100 110.33 136.75 178.21 198.34
Other Income 100 100.79 127.20 171.77 202.58
TOTAL 100 108.69 135.12 177.10 199.06
EXPENDITURE
Interest Expanded 100 116.23 158.38 212.80 234.74
Employee Cost 100 97.65 95.64 119.99 157.02
Selling & Administrative Expenses
100 175.42 224.78 276.37 426.16
Miscellaneous Expenses
100 90.66 89.21 111.35 99.69
Operating Expenses 100 111.61 123.05 125.65 210.06
Provisions & Contingencies
100 84.63 75.33 93.70 67.20
TOTAL 100 109.84 133.88 175.03 199.39
PROFIT BEFORE DEPRECIATION
100 100.15 144.26 192.46 196.63
Depreciation 100 82.63 93.26 104.66 127.91
NET PROFIT FOR THE YEAR
100 103.05 152.70 206.99 208.00
(RS.IN CRORES)
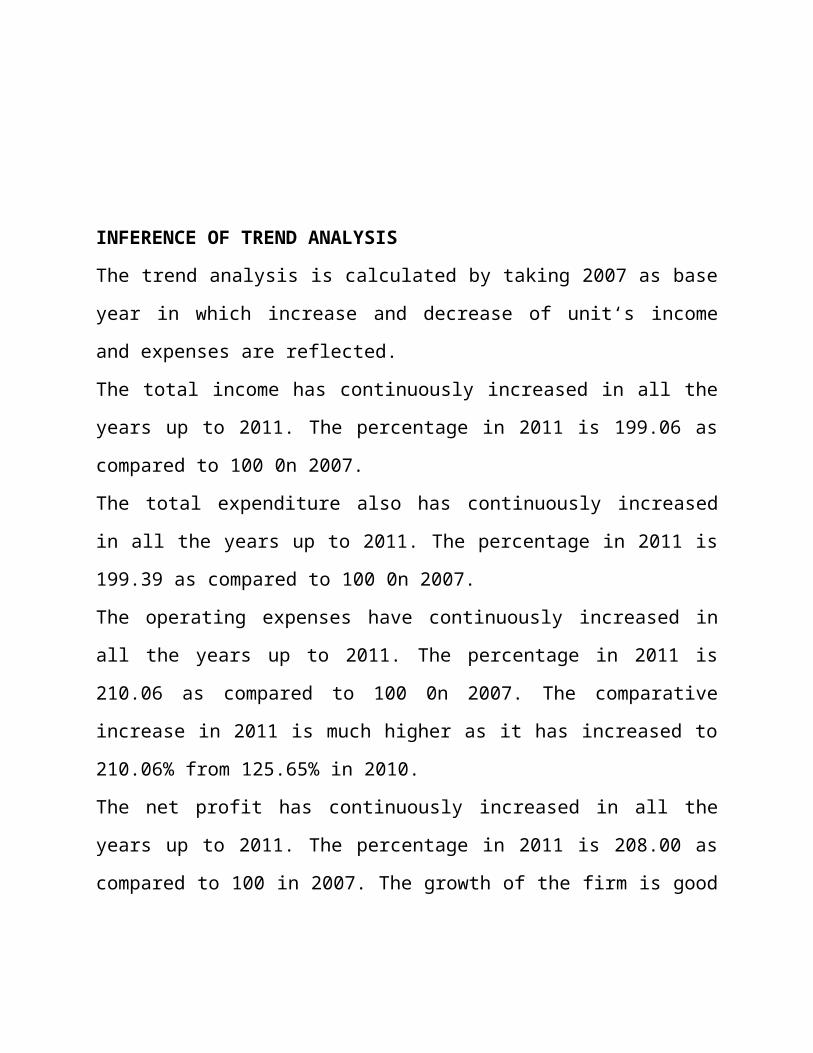
INFERENCE OF TREND ANALYSIS
The trend analysis is calculated by taking 2007 as base year in which increase and
decrease of unit‘s income and expenses are reflected.
The total income has continuously increased in all the years up to 2011. The
percentage in 2011 is 199.06 as compared to 100 0n 2007.
The total expenditure also has continuously increased in all the years up to 2011.
The percentage in 2011 is 199.39 as compared to 100 0n 2007.
The operating expenses have continuously increased in all the years up to 2011.
The percentage in 2011 is 210.06 as compared to 100 0n 2007. The comparative
increase in 2011 is much higher as it has increased to 210.06% from 125.65% in
2010.
The net profit has continuously increased in all the years up to 2011. The
percentage in 2011 is 208.00 as compared to 100 in 2007. The growth of the firm
is good and it has doubled its profits in just five years’ time.
CHAPTER 5
SUMMARY OF FINDINGS
AND
CONCLUSIONS
SUMMARY OF FINDINGS & CONCLUSION
THE SUMMARY OF FINDINGS OF THE STUDY IS INDICATED BELOW
1. The company has been maintaining a constant Current Ratio. It has
remained same at 0.08 in 2007, 2008, 2011 but it has slightly increased in
2009 and 2011.
2. The Earning per Share trend is increasing in nature as it has increased to
39.67 in 2011 from 16.72 in 2007.
3. The Interest Income to Total Funds Ratio is fluctuating and has decreased
from 7.18 percent in 2007 to 6.82 percent in 2011 and then slightly increased
in 2011.
4. The Operating Expense to Total Income is varying and has increased from
2007 in 21.95 percent to 27.78 percent in 2011. Net Profit Margin is
fluctuating. In 2007 it was 10.27 percent and has increased to 11.25 percent
in 2011
5. The Net Profit to Total Funds ratio is varying in nature and has increased
from 0.82 percent in 2007 to 0.88 percent in 2011.
6. The Interest Expanded to Interest Earned can be said increasing in nature as
it has increased from 62.20 percent in 2007 to 68.48 percent in 2011 but has
decreased to 62.21 percent in 2011.
7. The operating expenses have continuously increased in all the years up to
2011. The percentage in 2011 is 210.06 as compared to 100 0n 2007.
8. The net profit has continuously increased in all the years up to 2011. The
percentage in 2011 is 208.00 as compared to 100 in 2007. The growth of the
firm is good and it has doubled its profits in just five years’ time.
9. The Return on Net Worth is varying in nature and it has increased from
16.28 percent in 2007 to 16.31 percent in 2011.
10. The trend of Dividend per Share is increasing in nature. Dividend per Share
has increased from 30 in 2007 to 80 in 2011.
11.The Shareholder‘s Funds have increasing trend as it has increased by 238.57
percent i.e. the company has doubled its shareholder‘s funds in a period of
five years.
12. The Fixed Assets have fluctuating trend .It has increased by 157.26 percent.
13. The Investments have increased by 175.83 percent.
14. The Net Current Assets can be said decreasing in nature. It has decreased to
61.69 percent as compared to 100 in 2007.
15.The Total Income of the Company has been increasing and has reached to
199.06 percent in 2011.
CONCLUSION
The important of the financial statement analysis lies in the fact that it presents
facts on a comparative basis and enables the drawing of inferences regarding the
performance of the firms.
The comparative statement analysis is relevant in assessing the performance of a
business concern as it adds meaning to the financial data and it is also used to
effectively measure the conduct of the business activities.
And trend analysis also has its own importance as a trend analysis indicates in
which direction a business is moving i.e. upward or downwards and it gives a
better picture of the overall performance of the business and its also helps in
analyzing the financial performance over a period of time.
On other hand, with the help of ratio analysis conclusion can be drawn regarding
the liquidity position of the company. The liquidity ratios are useful in credit
analysis by banks and other suppliers of short term loans. Ratios analysis is equally
useful for assessing the long term financial viability of a firm. The long term
solvency is measured by the leverage and profitability ratios which focus on
earning power and operating efficiency.
Ratio analysis reveals the strength and weaknesses of a company in this respect.
The leverage ratios will indicate whether a firm has a reasonable proposition of
various sources of finance or whether heavily loaded with debt in which case its
solvency is exposed to serious strain. The various profitability ratios would reveals
whether or not the firm is able to offer adequate return to its owner consistent with
the risk involved.
Thus, Financial Statement Analysis has application and is of immense use today.
Financial Statement Analysis is extremely helpful in providing valuable insight
into a company‘s financial picture. It can point out whether the financial conditions
are strong, good, questionable or poor. Financial Statement Analysis provides an
easy way to compare present performance with the past.