ptc6s.pdf
DESCRIPTION
iTRANSCRIPT

Procedures for Routine
Performance Tests of Steam Turbines
A Report by Performance Test Code Committee No. 6
on Steam Turbines
COPYRIGHT American Society of Mechanical EngineersLicensed by Information Handling ServicesCOPYRIGHT American Society of Mechanical EngineersLicensed by Information Handling Services

ASME PTC*bS REPORT 8 8 S 0759670 005qb40 5 m
Procedures for Routine
Performance Tests of Steam Turbines
(Not Intended for Acceptance Testing)
O ASME PTC 6s Report-I988 [REVISION OF ASME PTC 6s REPORT-I 97Ö (R1 985)l
PERFORMI TEST CODES
9NCE
T H E A M E R I C A N S O C I E T Y OF M E C H A N I C A L E N G I N E E R S
United Engineering Center 345 East 47th Street New York, N.Y. 1001 7
COPYRIGHT American Society of Mechanical EngineersLicensed by Information Handling ServicesCOPYRIGHT American Society of Mechanical EngineersLicensed by Information Handling Services
Date of Issuance: December 15, 1989
This document will be revised when the Society approves the issuance of the next edition, scheduled for 1992. There will be no Addenda issued to PTC 6s Report-1988.
Please Note: ASME issues written replies to inquiries concerning interpretation of technical aspects of this document. PTC 6s Report-I988 is being issued with an automatic subscription service to the interpretations that will be issued to it up to the publication of the 1992 Edition.
ASME is the registered trademark of The American Society of Mechanical Engineers.
This code or standard was developed under procedures accredited as meeting the criteria for American National Standards. The Consensus Committee that approved the code or standard was balanced to assure that individuals from competent and concerned interests have had an opportunity to participate. The proposed code or standard was made available for public review and comment which provides an opportunity for additional public input from industry, academia, regulatory agencies, and the public-at-large.
ASME does not "approve," "rate," or "endorse" any item, construction, proprietary device, or activity.
ASME does not take any position with respect to the validity of any patent rights asserted in connection with any items mentioned in this document, and does not undertake to insure anyone utilizing a standard against liability for infringement of any applicable Letters Patent, nor assume any such liability. Users of a code or standard are expressly advised that determination of the validity of any such patent rights, and the risk of infringement of such rights, is entirely their own responsibility.
Participation by federal agency representative(s) or person(s) affiliated with industry is not to be interpreted as government or industry endorsement of this code or standard.
ASME accepts responsibilityfor only those interpretations issued in accordance with governing ASME procedures and policies which preclude the issuance of interpretations by individual vol- unteers.
No part of this document may be reproduced in any form, in an electronic retrieval system or otherwise,
without the prior written permission of the publisher.
Copyright O 1989 by THE AMERICAN SOCIETY OF MECHANICAL ENGINEERS
All Rights Reserved Printed in the U.S.A.
COPYRIGHT American Society of Mechanical EngineersLicensed by Information Handling ServicesCOPYRIGHT American Society of Mechanical EngineersLicensed by Information Handling Services

FOREWORD
(This Foreword is not part of ASME PTC 6s Report-1 988.)
Users of both large and small turbines have experienced an increasing need for procedures for routine turbine tests which trend performance with time. The use of full-scale ASME Per- formance Test Code procedures and instrumentation for this purpose is expensive and pro- duces information and accuracy beyond that necessary for periodic monitoring. When ASME Performance Test Code Committee No. 6 was reorganized to revise PTC 6-1 949, it was charged also with developing simplified procedures for periodic tests. Because of the routine nature of the tests, these procedures were to emphasize repeatability of results rather than absolute accuracy and thus provide a more economic means of monitoring perfor- mance trends.
This Report reflects the consensus of knowledgeable engineers and contains recom- mended procedures for collecting sufficiently accurate data to permit analyses of perfor- mance trends. Recommendations are given which include advance planning, cycle isola- tion, and suggested presentation of results. Emphasis is placed upon the use of accurate in- strumentation, approaching measurement uncertainties required by the Code, for the measurement of critical variables that are part of the heat-rate equation. Other instrumenta- tion i s specified to produce results of good accuracy and of a high degree of repeatability. With the application of automatic data-logging and on-line computer systems to the plant cy- cle, the procedures presented in this Report, when applied to this end, should satisfy the needs of users of both large and small turbines.
Procedures recommended in this Report are not intended to produce abolute levels of performance. If absolute performance level is required, the ASME Test Code for Steam Tur- bines, PTC 6, 1976, reaffirmed 1985, or the Interim Test Code for an Alternative Procedure for Testing Steam Turbines, PTC 6.1 , 1984, should be followed. For other levels of accuracy, where the test instrumentation varies from the Test Code specified procedure, the Report by PTC Committee No. 6 on "Guidance for Evaluation of Measurement Uncertainty in Perfor- mance Tests of Steam Turbines," 1985 should be consulted.
Users of this Report are requested to comment and provide to the Committee supporting data obtained with these procedures. Such comment and repeatability data covering long- term and/or extensive experience will provide guidance for subsequent revisions of this Re- port, User suggestions and data should be submitted to the Secretary, ASME Performance Test Codes Committee, 345 East 47th Street, New York, New York 1001 7..
This Report was approved by the ASME Board on Performance Test Codes and adopted as a standard practice of the Society on May 8,1988. It was approved as an American National Standard by the ANSI Board of Standards Review on September 8, 1988.
iii
ASME PTC*bS REPORT 8 8 m 0757b70 0054642 7
a COPYRIGHT American Society of Mechanical EngineersLicensed by Information Handling ServicesCOPYRIGHT American Society of Mechanical EngineersLicensed by Information Handling Services

ASME PTC*bS REPORT 8 8 m 0759b70 0054b43 O
All ASME codes are copyrighted, with all rights reserved to the Society. Reproduction of this or any other ASME code is aviolation of Federal Law. Legalities aside, the user should ap- preciate that the publishing of the high quality codes that have typified ASME documents re- quires a substantial commitment by the Society. Thousands of volunteers work diligently to develop these codes. They participate on their own or with a sponsor's assistance and pro- duce documents that meet the requirements of an ASME concensus standard. The codes are very valuable pieces of literature to industry and commerce, and the effort to improve these "living documents" and develop additional needed codes must be continued. The monies spent for research and further code development, administrative staff support and publica- tion are essential and constitute a substantial drain on ASME. The purchase price of these documents helps offset these costs. User reproduction undermines this system and repre- sents an added financial drain on ASME. When extra copies are needed, you are requested to call or write the ASME Order Department, 22 Law Drive, Box 2300, Fairfield, New jersey 07007-2300, and ASME will expedite delivery of such copies to you by return mail. Please instruct your people to buy required test codes rather than copy them. Your cooperation in this matter is greatly appreciated.
COPYRIGHT American Society of Mechanical EngineersLicensed by Information Handling ServicesCOPYRIGHT American Society of Mechanical EngineersLicensed by Information Handling Services

ASME PTCmbS REPORT 88 m 0757b70 005qbl lY 2 W
PERSONNEL OF PERFORMANCE TEST CODE COMMITTEE NO. 6 ON STEAM TURBINES
(The following is the roster of the Committee at the time of approval of this Code.)
OFFICERS
W. A, Campbell, Chairman E. J, Brailey, Jr,, Vice Chairman
J. H. Karian, Secretary
COMMITTEE PERSONNEL
J. M. Baltrus, Sargent & Lundy Engineers J. A. Booth, General Electric Co. P. G. Albert, Alternate to Booth, General Electric Co. B. Bornstein, Consultant E. J. Brailey, Jr,, New England Power Service Co. T. M. Brown, Ontario Hydro W. A, Campbell, Philadelphia Electric Co. K. C. Cotton, Consultant J, S. Davis, Ir., Duke Power Co. R, D. Smith, Alternate to Davis, Duke Power Co. N. R. Deming, Consulting Engineer P. A. DiNenno, Ir., Consultant A. V. Fajardo, Jr., Utility Power Corp. G. Gartner, Alternate to Fajardo, Utility Power Corp. J. H. Karian, The American Society of Mechanical Engineers D..L. Knighton, Black & Veatch Engineers-Architects C. H. Kostors, ElliottCo. J, S. Lamberson, Dresser Rand T. H. McCloskey, Electric Power Research Institute S. S. Sandhu, Westinghouse Electric Corp. C. B. Scharp, Consulting Engineer P. Scherba, Public Service Electric & Gas Corp. J. A. McAdam, Alternate to Scherba, Pubic Service Electric & Gas Corp. E, J. Sundstrom, Dow Chemical USA
(In addition to the above personnel, the Committee is indebted to Ms. E. Pitchford of Lower Colorado River Authority and H. S. Arnold of Public Service Electric & Gas Corp. for their efforts on the early work of this Standard.)
V
COPYRIGHT American Society of Mechanical EngineersLicensed by Information Handling ServicesCOPYRIGHT American Society of Mechanical EngineersLicensed by Information Handling Services
“II
1
A S M E PTC*bS REPORT 88 W 0759670 0054b45 4 m -
~~
BOARD ON PERFORMANCE TEST CODES
J. S. Davis, Ir., Chairman N. R. Deming, Vice Chairman
W. O. Hays, Secretary
A. F. Armor R. L. Bannister R. J. Biese J. A. Booth B. Bornstein W. A. Crandall H. G. Crim, Jr. J. S. Davis, Jr.
N. R. Deming G. J. Gerber W. O. Hays R. Jorgensen D. R. Keyser J. E. Kirkland, Jr. W. G. McLean G. H. Mittendorf, Jr. J. W. Murdock
S. P. Nuspl R. P. Perkins R. W. Perry A. L. Plumley C. B. Scharp J. W. Siegmund R. E. Sommerlad J. C. Westcott
vi
COPYRIGHT American Society of Mechanical EngineersLicensed by Information Handling ServicesCOPYRIGHT American Society of Mechanical EngineersLicensed by Information Handling Services

CONTENTS
Foreword . . . . . . . . . . . . . . . . . . . . . . . . . . . . . . . . . . . . . . . . . . . . . . . . . . . . . . . . . iii CommitteeRoster . . . . . . . . . . . . . . . . . . . . . . . . . . . . . . . . . . . . . . . . . . . . . . . . . . v
Section O 1 2 3 4 5 6 7
8
9
10
11
12 13
Figures 2.1 4. 1 (a) 4.1 (b) 4.1 (c) 4.2 4.3
4.4(a) 4.4(b) 4.5 5.1
5.2
5.3
Introduction . . . . . . . . . . . . . . . . . . . . . . . . . . . . . . . . . . . . . . . . . . . . . . 1 Object. Scope. and Intent . . . . . . . . . . . . . . . . . . . . . . . . . . . . . . . . . . . . 3
Guiding Principles . . . . . . . . . . . . . . . . . . . . . . . . . . . . . . . . . . . . . . . . . 11 Instruments and Methods of Measurement . . . . . . . . . . . . . . . . . . . . . . . 17 Preliminary Test . . . . . . . . . . . . . . . . . . . . . . . . . . . . . . . . . . . . . . . . . . . 31 Presentation and Interpretation of Test Results .................... 35 Test for Nonextraction Condensing Turbine With Superheated
Inlet Steam . . . . . . . . . . . . . . . . . . . . . . . . . . . . . . . . . . . . . . . . . . . . . 53 Test for Condensing Turbine. Regenerative Cycle. With
Superheated Inlet Steam . . . . . . . . . . . . . . . . . . . . . . . . . . . . . . . . . . . 59 Test for Condensing Turbine. Reheat Regenerative Cycle.
With Superheated Inlet Steam . . . . . . . . . . . . . . . . . . . . . . . . . . . . . . . 65 Test for Condensing Turbine. Regenerative Cycle. With
Saturated Inlet Steam . . . . . . . . . . . . . . . . . . . . . . . . . . . . . . . . . . . . . . 87 Test for Noncondensing Nonextraction Turbine. With
Superheated Exhaust . . . . . . . . . . . . . . . . . . . . . . . . . . . . . . . . . . . . . . 95 Test for Noncondensing Extraction Turbine ...................... 103 Special Procedures for Indicating Turbine-Cycle Performance
Trends . . . . . . . . . . . . . . . . . . . . . . . . . . . . . . . . . . . . . . . . . . . . . . . . . 115
Definitions and Description of Terms . . . . . . . . . . . . . . . . . . . . . . . . . . . 5
Temperature-Entropy Diagrams . . . . . . . . . . . . . . . . . . . . . . . . . . . . . . . . 8 Welded Primary Flow Measurement Section ...................... 19 Inspection Port for Feedwater Flow Nozzle ...................... 19 Flanged Primary Flow Measurement Section . . . . . . . . . . . . . . . . . . . . . . 20 Alternate Locations for Primary Flow Element . . . . . . . . . . . . . . . . . . . . . 21 Connection Between Calibrated Flow Sections and
Manometers . . . . . . . . . . . . . . . . . . . . . . . . . . . . . . . . . . . . . . . . . . . . . 24 BasketTip . . . . . . . . . . . . . . . . . . . . . . . . . . . . . . . . . . . . . . . . . . . . . . . . 27 Guideplate . . . . . . . . . . . . . . . . . . . . . . . . . . . . . . . . . . . . . . . . . . . . . . . 27 Moisture-Sampling Tube . . . . . . . . . . . . . . . . . . . . . . . . . . . . . . . . . . . . . . 29 Typical Turbine ValvePosition Test Data Based on Individual
Steam Pressure Measurements . . . . . . . . . . . . . . . . . . . . . . . . . . . . . . . 32 Typical Turbine Valve-Position Test Data Based on Individual
Valve-Lift Measurements . . . . . . . . . . . . . . . . . . . . . . . . . . . . . . . . . . . 33 Stage Group Efficiency by Enthalpy-Drop Method . . . . . . . . . . . . . . . . . 34
COPYRIGHT American Society of Mechanical EngineersLicensed by Information Handling ServicesCOPYRIGHT American Society of Mechanical EngineersLicensed by Information Handling Services

6 . 6.2.
6.3
6.4
6.5 6.6 6.7
6.8 6.9
6.1 O 6.1 1 6.12 6.1 3 6.14
6.1 5 6.1 6 7.1 7.2 8.1
9.1 9.2 9.3 9.4 9.5 9.6 9.7 9.8
10.1
11.1
12.1 13.1
Tables 4.1 8.1 9.1 9.2 9.3 9.4
10.1 11.1 11.2
Typical Blading Diagram for Single Stage . . . . . . . . . . . . . . . . . . . . . . . . 36 Typical Expansion Lines for a High-pressure Section Partial-
Arc Admission. Condensing Turbine .......................... 37 Typical Expansion Lines for a High-pressure Section Full-Arc
Admission. Condensing Turbine . . . . . . . . . . . . . . . . . . . . . . . . . . . . . 37 Condensing Turbine Last-Stage Steam Flow Versus Stage
Pressure Ratio . . . . . . . . . . . . . . . . . . . . . . . . . . . . . . . . . . . . . . . . . . . 38 Pressure-Flow Relationship . . . . . . . . . . . . . . . . . . . . . . . . . . . . . . . . . . . 38 Steam Flow Versus First-Stage Nozzle Area . . . . . . . . . . . . . . . . . . . . . . . 40 Stage Pressure Versus Stage Exit Pressure for Intermediate
Stages . . . . . . . . . . . . . . . . . . . . . . . . . . . . . . . . . . . . . . . . . . . . . . . . . 40 Pressure or Capability Curve Versus Chronological Test Dates . . . . . . . . . 41 Corrected Pressure Deviation Interpretations at Constant
Control Valve Opening . . . . . . . . . . . . . . . . . . . . . . . . . . . . . . . . . . . . 43
Single-Stage Efficiency Versus Wheel Speed . . . . . . . . . . . . . . . . . . . . . . 45 Partial-Arc Admission Unit . . . . . . . . . . . . . . . . . . . . . . . . . . . . . . . . . . . 45 Full-Arc Admission Unit . .................................... 46 Low-Pressure Turbine Section Efficiency Versus Exhaust
Steam Flow or Velocity . . . . . . . . . . . . . . . . . . . . . . . . . . . . . . . . . . . . 46 Illustration of Low-Pressure Turbine Effectiveness . . . . . . . . . . . . . . . . . . 47 Relationships of Vd r/ Ver, and Vtr ................................ 52 Instrument Locations . . . . . . . . . . . . . . . . . . . . . . . . . . . . . . . . . . . . . . . . 54 Generator Electrical Losses . . . . . . . . . . . . . . . . . . . . . . . . . . . . . . . . . . . 58 Instrumentation for Routine Performance Tests for Condensing
Turbine. Regenerative Cycle. Superheated Inlet Steam . . . . . . . . . . . . 60 Instrument Locations . . . . . . . . . . . . . . . . . . . . . . . . . . . . . . . . . . . . . . . . 67 Loss Factor Versus Crossover Pressure . . . . . . . . . . . . . . . . . . . . . . . . . . 69 Throttle Pressure Correction Factors ............................ 77 Throttle Temperature Correction Factors . . . . . . . . . . . . . . . . . . . . . . . . . 78
Reheater Pressure-Drop Correction Factors . . . . . . . . . . . . . . . . . . . . . . . 80 Exhaust Pressure Correction Factors . . . . . . . . . . . . . . . . . . . . . . . . . . . . 81 Heat Rate Versus Load . . . . . . . . . . . . . . . . . . . . . . . . . . . . . . . . . . . . . . 82 Instrumentation for Routine Performance Tests for Condensing
Turbine. Regenerative Cycle. With Saturated Inlet Steam . . . . . . . . . . . 88 Instrument Locations for Noncondensing. Nonextraction
Turbines . . . . . . . . . . . . . . . . . . . . . . . . . . . . . . . . . . . . . . . . . . . . . . . 97
Instrument Locations . . . . . . . . . . . . . . . . . . . . . . . . . . . . . . . . . . . . . . . . 117
Stage Pressure Versus Throttle Steam Flow . . . . . . . . . . . . . . . . . . . . . . . 44
Reheat Temperature Correction Factors . . . . . . . . . . . . . . . . . . . . . . . . . 79
Typical Diagram - Noncondensing Extraction Turbine . . . . . . . . . . . . . 108
Location of Primary Water Flow-Measuring Element (Fig . 4.2) . . . . . . . . . 22
Instrument Uncertainties . . . . . . . . . . . . . . . . . . . . . . . . . . . . . . . . . . . . . 83 Load-Correction-Factor Uncertainties . . . . . . . . . . . . . . . . . . . . . . . . . . . 84
Approximate Repeatability Levels for Reheat-Regenerative
Summary . . . . . . . . . . . . . . . . . . . . . . . . . . . . . . . . . . . . . . . . . . . . . . . . 93
Repeatability of Test Results . . . . . . . . . . . . . . . . . . . . . . . . . . . . . . . . . . 64
Typical Enthalpy-Drop Uncertainty Values . . . . . . . . . . . . . . . . . . . . . . . 84
Turbines, Enthalpy-Drop-Efficiency Tests . . . . . . . . . . . . . . . . . . . . . . . 85
Instrument Uncertainty . . . . . . . . . . . . . . . . . . . . . . . . . . . . . . . . . . . . . . 100 Flow Correction Factor Uncertainty ............................ 100
viii
A. .. COPYRIGHT American Society of Mechanical EngineersLicensed by Information Handling ServicesCOPYRIGHT American Society of Mechanical EngineersLicensed by Information Handling Services

~~
ASME P T C g h S R E P O R T A B m 0.757670 0054648 T m
11.3 Steam Rate Uncertainty . . . . . . . . . . . . . . . . . . . . . . . . . . . . . . . . . . . . . . 101 11.4 Combined Capability Uncertainty . . . . . . . . . . . . . . . . . . . . . . . . . . . . . . 101 12.1 Repeatability Calculations for Enthalpy-Drop Efficiency . . . . . . . . . . . . . 104 12.2 Repeatability Calculations for Capability Test . . . . . . . . . . . . . . . . . . . . . 105 12. 3 Repeatability Calculations for Steam-Rate Test - No
Extraction . . . . . . . . . . . . . . . . . . . . . . . . . . . . . . . . . . . . . . . . . . . . . . 106 12.4 Repeatability Calculations for Steam-Rate Test - With
Extraction . . . . . . . . . . . . . . . . . . . . . . . . . . . . . . . . . . . . . . . . . . . . . . 107 13.1 Power Measurement Instrument Uncertainties .................... 119 13.2 Heat Rate Correction Uncertainties . . . . . . . . . . . . . . . . . . . . . . . . . . . . . 119
Appendices A Cycle Correction Curves . . . . . . . . . . . . . . . . . . . . . . . . . . . . . . . . . . . . . 121 B References . . . . . . . . . . . . . . . . . . . . . . . . . . . . . . . . . . . . . . . . . . . . . . . 133
Figures A I A2 A3 A4 AS
A6 A7 A8 A9
A l O
A l 1 A l 2
Typical Fossil-Fuel Fired Cycle . . . . . . . . . . . . . . . . . . . . . . . . . . . . . . . . 123
Auxiliary Extraction Corrections . . . . . . . . . . . . . . . . . . . . . . . . . . . . . . . 125
Corrections for Main Steam and Reheat Steam Desuperheating Flow . . . . . . . . . . . . . . . . . . . . . . . . . . . . . . . . . . . . . . 127
Condensate Subcooling Corrections . . . . . . . . . . . . . . . . . . . . . . . . . . . . 128 Condenser Make-up Corrections . . . . . . . . . . . . . . . . . . . . . . . . . . . . . . 128
Final Feedwater Temperature Corrections (LWM
Feed Pump Turbine Extraction Correction (LWM
Final Feedwater Temperature Corrections . . . . . . . . . . . . . . . . . . . . . . . . 124
Corrections for Auxiliary Extraction from Cold Heat . . . . . . . . . . . . . . . . 126
Typical Light-Water Moderated Nuclear Cycle .................... 129
Nuclear Cycle) . . . . . . . . . . . . . . . . . . . . . . . . . . . . . . . . . . . . . . . . . . . 130
Nuclear Cycle) . . . . . . . . . . . . . . . . . . . . . . . . . . . . . . . . . . . . . . . . . . . 131
Condenser Make-up Correction (LW. M Nuclear Cycle) . . . . . . . . . . . . . . 132 Condensate Subcooling Correction (LWM Nuclear Cycle) . . . . . . . . . . . 131
Table A- 1 Equations for Use of Curves for Specified Cycle Corrections . . . . . . . . . . 122
Complete Listing of ASME Performance Test Codes ....................... 135
¡x
... COPYRIGHT American Society of Mechanical EngineersLicensed by Information Handling ServicesCOPYRIGHT American Society of Mechanical EngineersLicensed by Information Handling Services
ASME PTC*bS REPORT 8 8 U 0 7 5 7 6 7 0 00546119 I M
(.-,i
\ i
ASME PTC 6s REPORT-I 988
SECTION O - INTRODUCTION
0.1 PURPOSE OF REPORT
This Report provides turbine-test procedures for the analysis and supervision of relative performance throughout the life of the turbine. These procedures will determine trends of operating efficiency, detect trouble, and furnish test data to evaluate efficiency changes in the turbine cycle. These procedures are de- signed to minimize test instrumentation and person- nel. However, precision instrumentation at critical test locations is recommended for reliable results. A high degree of repeatability, rather than the acceptance test level of performance, is sought.
0.2 CONTENT
This Report contains test procedures for recom- mended instrumentation, planning, conduct, calcula- tion, and evaluation of the test results. Separate procedures are recommended for specific turbine types.
0.3 PURPOSE OF TEST PROGRAM
A routine turbine-performance test program will: (a) provide guidance in scheduling maintenance
outages on the basis of performance; (b) provide guidance in establishing the loading se-
quence of steam turbine-generator units according to their current relative performance;
1
(c) evaluate major modifications of the turbine or
(d) detect performance changes in specific areas of
(e) check the accuracy of station instruments by
( i l train personnel in testing techniques,
turbine cycle, and changes in operating procedure;
the turbine or the turbine cycle;
comparison with test instruments;
0.4 REFERENCES
The ASME Test Code for Steam Turbines, PTC 6- 1976, and Interim Test Code for an Alternative Proce- dure for Testing Steam Turbines, PTC 6.1-1 984, are the basic references for this Report. The term “Code” used in this Report refers to these documents. The ASME Code on Definitions and Values, PTC 2-1 980 and the. applicable supplements of PTC 19 Series, on Instru- ments and Apparatus, provide supplementary informa- tion. A separate report by Performance Test Code Committee No. 6, Guidance for Evaluation of Mea- surement Uncertainty in Performance Tests of Steam Turbines, should be used to evaluate the level of ac- curacy afforded by the instrumentation recommended for this Report‘s test procedures. Whenever PTC 19.1, Measurement Uncertainty, is referenced in this docu- ment, 95 percent confidence levels have been used in accordance with accepted practices. Appendix A to Test Code for Steam Turbines, PTC 6A-1982, and Sec- tions 7 through 13 of this Report provide numerical ex- amples of various turbine calculations which should prove useful in applying this Report’s procedures.
COPYRIGHT American Society of Mechanical EngineersLicensed by Information Handling ServicesCOPYRIGHT American Society of Mechanical EngineersLicensed by Information Handling Services

ASME PTC*bS REPORT B B m 0757b70 005Ltb50 B m
PROCEDURES FOR ROUTINE PERFORMANCE TESTS OF STEAM TURBINES ASME PTC 6s REPORT-I 988
SECTION 1 - OBJECT, SCOPE, AND INTENT
1.1 OBJECT
The test procedures of this Report are intended for periodic turbine tests and do not supplant the Code as the basic procedure for turbine acceptance tests. The Code is used for the accurate testing of steam turbines to obtain performance level with minimum uncertainty.
1.2 SCOPE
Sections 3 through 5 of this Report present general recommendations for instrumentation and test plan- ning. These recommendations are based on current in- dustry practice for the periodic determination of turbine-cycle performance. Section 6 discusses inter- pretation of test results and shows typical plots of test data for analysis of turbine performance. Sections 7 through 12 present test procedures for selected types of turbine cycles. Each of these procedures contains specific recommendations for instrumentation and method for testing a selected turbine type. Although all possible turbine types are not covered, some typical examples are presented. Combinations of the types presented may be used to cover other arrangements. For each recommended test procedure, the expected value of repeatability is estimated on the basis of cur- rent industry experience. This value of repeatability must be used to judge the significance of the indicated level of performance as compared to the chronological trend of past performance, (See para. 3.8.3 for discus- sion of repeatability.)
1.3 INTENT
This Report provides procedures to periodically monitor changes in overall turbine cycle performance. Supplementary instrumentation and data may be in- cluded in the test procedure to diagnose the causes of changed performance. This supplementary informa- tion may assist in evaluating the effect of component changes on the overall performance. Some users may prefer the simplicity of the recommended procedure and then run a second test only when a detailed analy- s i s i s required. These procedures define both primary and secondary data for a turbine-performance analysis.
For reference purposes only, Section 13 presents other test procedures for determining turbine- performance trends; however, these procedures may not provide complete data for analysis of all compo- nents in the turbine cycle. In special cases, they may provide adequate information and be advantageous due to their low cost and simplicity.
For on-line computer monitoring of steam-turbine performance, the simplified test procedures given in this Report can serve as a basis for choice of instrumen- tation and development of calculation procedures. The instrumentation is selected to achieve repeatable results consistent with the objective of monitoring the trend of turbine performance.
Diagnostic monitoring systems for vibration, oil cleanliness, rotor crack detection, and solid particle erosion and supervisory systems for differential expan- sion, bearing metal temperature, bearing wear, turbine load, and speed are not indicators of turbine perform- ance. Analytical techniques using data from these sys- tems can result in early identification of potential problems.
3
COPYRIGHT American Society of Mechanical EngineersLicensed by Information Handling ServicesCOPYRIGHT American Society of Mechanical EngineersLicensed by Information Handling Services

ASME P T C * b S R E P O R T 8 8 W 0757b70 0054653 T m
PROCEDURES FOR ROUTINE PERFORMANCE TESTS OF STEAM TURBINES ASME PTC 6s REPORT-I 988
SECTION 2 - DEFINITIONS AND DESCRIPTION OF TERMS
2.1 SYMBOLS
The following symbols are to be used unless other- wise defined in the text.
Units
Symbol Description U.S. Customary SI
A
f
g
go
h
I
M
m
N
P
P
S
t
T
V
V
W
X
Area
Force
Local value of acceleration due to gravity
Standard value of acceleration due to gravity=32.17406 ft per sec per sec (9.80665 meters per sec per sec). This is an internationally agreed upon value which is close to the mean of 45 deg. N latitude at sea level.
Specific enthalpy
Mechanical equivalent heat, 1 Btu = 778.1 693 ft-lbf =
1/3412.142 kWh
Moisture, 100 - x
Mass
Rotational speed
Power
Pressure
Specific entropy
Temperature
Temperature
Velocity
Specific volume
Rate of flow
Quality of steam, percent of dryness
in.
I bf
ft/sec2
ft/sec2
2
Btu/lbm
Btu
Oh
Ibm
rPm
kW or hp
psia
Btu/lbm"R
"F
O R
ft/sec
ft3/lbm
Ibmh
Oto
5
F".
1, . COPYRIGHT American Society of Mechanical EngineersLicensed by Information Handling ServicesCOPYRIGHT American Society of Mechanical EngineersLicensed by Information Handling Services
ASME PTC 6s
ASME PTC*bS REPORT & B II .., 0757670 . 0054652 1 I - I
REPORT-I 988
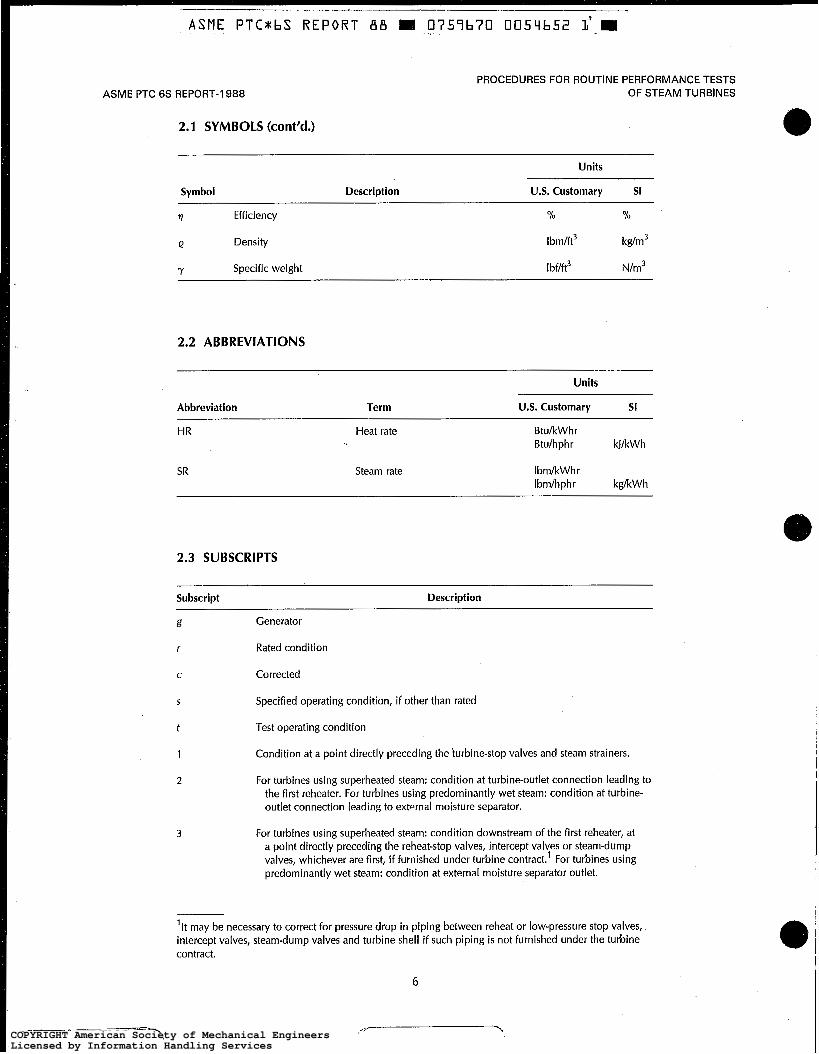
2.1 SYMBOLS (cont’d.)
PROCEDURES FOR ROUTINE PERFORMANCE TESTS OF STEAM TURBINES
Symbol Description
Units
U.S. Customary SI
7 Efficiency
e Density
Y Specific weight
% %
Ibm/ft3 k g h 3
I bflft3 N/m3
2.2 ABBREVIATIONS
Units
Abbreviation Term US. Customary SI
HR
SR
Heat rate
Steam rate
BtukWhr Btulhphr kJ1kWh
IbmIkWhr Ibmlhphr kgkWh
2.3 SUBSCRIPTS
Subscript Description
g Generator
r Rated condition
C Corrected
5 Specified operating condition, if other than rated
t Test operating condition
1 Condition at a point directly preceding the turbine-stop valves and steam strainers.
2 For turbines using superheated steam: condition at turbine-outlet connection leading to the first reheater. For turbines using predominantly wet steam: condition at turbine- outlet connection leading to external moisture separator.
3 For turbines using superheated steam: condition downstream of the first reheater, at a point directly preceding the reheat-stop valves, intercept valves or steam-dump valves, whichever are first, if furnished under turbine contract.’ For turbines using predominantly wet steam: condition at external moisture separator outlet.
’It may be necessary to correct for pressure drop in piping between reheat or low-pressure stop valves, intercept valves, steam-dump valves and turbine shell if such piping is not furnished under the turbine contract.
6
COPYRIGHT American Society of Mechanical EngineersLicensed by Information Handling ServicesCOPYRIGHT American Society of Mechanical EngineersLicensed by Information Handling Services

ASME PTC*bS REPORT B B M 0759670 0054653 3 m
PROCEDURES FOR ROUTINE PERFORMANCE TESTS OF STEAM TURBINES ASME PTC 6s REPORT-I988
2.3 SUBSCRIPTS (cont’d.)
Subscript Description
5
4 For turbines using superheafed steam: condition at turbine-outlet connection leading to the second reheater. For reheat turbines using predominantly wet steam: condition downstream of the reheater, at a point directly preceding the reheat-stop valves, intercept valves or steam-dump valves, whichever are first, if furnished under contract.’
For turbines using superheated steam and two stages of reheat: condition downstream of the second reheater, at a point directly preceding the reheat-stop valves, intercept valves or steamdump valves, whichever are first, if furnished under the turbine contract.’
6 Condition at turbineexhaust connection.
7 Condition at condenser-condensate discharge.
8 Condition at condensate-pump discharge.
9 Condition at feedwater pump or feedwater-booster-pump inlet.
10 Condition at feedwater-pump discharge.
11 Condition at the discharge of the final feedwater heater.
a l Superheater desuperheating water.
a2 First-reheater desuperheating water.
a3 Second-reheater desuperheating water.
CL Condenser circulating water leakage.
E Extraction steam.
e Make-up water admitted to the condensate system.
PL Packing leak-off (shaft or valve stems).
i,ii,..n Sequence
The temperature-entropy diagrams shown in Fig. 2.1 (a) through (c) are intended to seme as a key to the numerical subscripts employed in the foregoing.
2.4 DEFINITIONS
Unit
Term Definifion U.S. Customary SI
Steam rate Steam consumption per hour per unit output in IbmkWhr kgkWh which the turbine is charged with the steam IbmkWhr kgkWh quantity supplied.
7
COPYRIGHT American Society of Mechanical EngineersLicensed by Information Handling ServicesCOPYRIGHT American Society of Mechanical EngineersLicensed by Information Handling Services

ASME PTC 6s REPORT-I 988
I _ _ _ ~
ASME PTC*bS REPORT '88 0757b70 0 0 5 4 b 5 4 5 9
PROCEDURES FOR ROUTINE PERFORMANCE TESTS OF STEAM TURBINES
(a) Turbines Operating Predominantly in the Superheated-Steam Region
0 ,C"
/ \ \ \
Reheater generator
/ Feedwater heating
Condensate heating \ \
t 6
(b) Temperature-Entropy Diagram Without Reheat
s
(c) Temperature-Entropy Diagram With Reheat
1 3 5
(6) and (c) Turbines Operating Predominantly in the Wet-Steam Region
FIG. 2.1 TEMPERATURE-ENTROPY DIAGRAMS
COPYRIGHT American Society of Mechanical EngineersLicensed by Information Handling ServicesCOPYRIGHT American Society of Mechanical EngineersLicensed by Information Handling Services

ASME PTC*bS REPORT 68 075-9670 005Llb55 7 m
PROCEDURES FOR ROUTINE PERFORMANCE TESTS OF STEAM TURBINES ASME PTC 6s REPORT-I 988
2.4 DEFINITIONS (cont'd.)
i- "-%
Unit
Term Definition U.S. Customary SI
Heat rate
Valve-loop curve
Valve points
Mean of the valve loops
Enthalpy drop
Power
Heat consumption per hour per unit output. The turbine is charged with the aggregate enthalpy2 of the steam supplied plus any chargeable aggregate enthalpy added by the reheaters. It is credited with the aggregate enthalpy of feed- water returned from the cycle to the steam generator. Turbine-generator performance may be defined on the basis of the gross power output at the generator terminals less the power used by the minimum number of electrically- driven turbine auxiliaries and excitation equip ment, supplied as part of the turbine-generator unit, required for reliable and continuous operation.
The continuous curve of actual heat rate for all values of output over the operating range of the unit,
Those valve positions which correspond to the low points of the valveloop curve.
A smooth curve which gives the same load- weighted average performance as the valve-loop curve.
The difference in steam enthalpy between turbine inlet conditions and turbine outlet conditions. This is applicable to individual turbine sections such as: high-pressure section or infermediate- pressure section.
The useful energy, per unit of time, delivered by the turbine or turbine-generator unit.
BtukWhr kJkWh Btuhphr kJ/kWh
Btu/lbm
hP kW or kW
2.5 CONVERSIONS TO SI (METRIC) UNITS
Quantity Conversion Multiplication Factor
Heat rate BtukWhr to kJkWh 1.055056 x 10'
Steam rate IbmkWhr to kgkWh 4.535924 x 10"
Mass flow Ibmhr to kgh 4.535924 x 10"
Pressure I b f h 2 to bar 6.894757 x 1 O-'
in. Hg to mm Hg 2.54* x 10''
in. Hg abs. at 0°C to kPa 3.386386 x 10'
2Aggregate enthalpy - product of enthalpy, Btu/lbm (kJkg) and rate of flow, Ibmhr (kgh); Btu/hr (kJh).
9
~
x, COPYRIGHT American Society of Mechanical EngineersLicensed by Information Handling ServicesCOPYRIGHT American Society of Mechanical EngineersLicensed by Information Handling Services

ASME P T C * b S R E P O R T - B8 I 0759670 005'4b56 9 m .~
ASME PTC 6s REPORT-I 988
2.5 CONVERSIONS TO SI (METRIC) UNITS (cont'd.)
PROCEDURES FOR ROUTINE PERFORMANCE TESTS OF STEAM TURBINES
Quantity Conversion Multiplication Factor
Pressure (cont'd.) Ibf/in.' to kPa
(1 bar = lo5 Pa = 760.06 mm Hg)
Temperature measured "F to "C
Temp., thermodynamic "F to K
Density Ibm/ft3 to kg/rn3
Specific enthalpy Btdlbm to kJkg
Specific entropy Btu/lbmoR to kJkgK
Specific heat Btu/lbmoR to kJkgK
Length
Area
Volume
ft to m
ft' to m'
f t3 to m3
6.894757 x 10'
tc = (tF- 32Y1.8
TK = (t~+459.67)/1.8
1.601846 x lo+ '
2.326 x 10'
4.1868* x 10'
4.1 868* x 10'
3.048* x 10"
9.290304* x 1 O-'
2.831685* x lo-'
Velocity ft/sec to m/s 3.048* x 10"
*Exact relationships in terms of base units.
t
COPYRIGHT American Society of Mechanical EngineersLicensed by Information Handling ServicesCOPYRIGHT American Society of Mechanical EngineersLicensed by Information Handling Services

ASME PTC.*bS REPORT 88 H' 07576.70 0054657 O m
PROCEDURES FOR ROUTINE PERFORMANCE TESTS OF STEAM TURBINES ASME PTC 6s REPORT-I 988
SECTION 3 - GUIDING PRINCIPLES
3.1 ADVANCE PLANNING FOR TEST
3.1.1 General. A plan for instrumentation of the tur- bine and turbine heat cycle should be developed prior to installation of the turbine. This plan should include adequate provision for physical location, installation, and number of test instruments needed to achieve test results with good repeatability. To minimize costs, this plan should be incorporated into the initial turbine- cycle design. Some items to be considered are:
(a) objectives of the test (b) location and installation of a calibrated primary
flow-metering section (c) provision for the accurate measurement of
output (cf) location and installation of test connections for
primary pressure and temperature measurements (e) location and installation of duplicate instrument
connections required to insure correct measurements at critical points
( f ) method of handling leak-off flows, orificed continuous-drain flows, bypass flows, continuous blowdowns, etc. to avoid complications in testing or the introduction of errors
(g) selection of test instrumentation capable of the repeatability required for consistent test results
(h) number and location of valves or selection of other means (see para. 3.2.7) to insure positive isola- tion of the cycle during tests
( i ) location of test instruments in environmentally stable areas to reduce calibration drift
Cj) the use of electronic data acquisition equipment
(k) location of test instruments in groups to facili- tate calibration and use and to minimize the number of required observers
3.2 CYCLE ISOLATION
3.2.1 Cycle Isolation, Positive isolation of the turbine cycleduring the test run is essential for heat rate and ca- pability test repeatability. Isolation is generally not re- quired for enthalpy-drop efficiency tests. However, cycle conditions affecting turbine-section pressure ra-
tios should be consistent among tests. Positive cycle isolation includes both external and internal isolation.
3.2.2 External Isolation, External isolation concerns flows that enter or leave the turbine cycle. These flows should be isolated from the system, if possible, to elim- inate measurement errors. If the isolation ofthese flows is open to question, provisions should be made to mea- sure them.
3.2.3 Internal Isolation. Internal isolation concerns flows which do not enter or leave the turbine cycle but which may bypass their intended destination. Exam- ples of such flows are steam line drain flows to the con- denser or feedwater heater bypass flows. Internal isolation cannot be verified by the inventory summa- tion method in para. 3.2.8.
3.2.4 Flows That Should Be Isolated. The following equipment and extraneous flows that should be iso- lated from the primary turbine-feedwater cycle are:
(a) large-volume storage tanks (b) evaporators and allied equipment such as evap-
(c) bypass systems and auxiliary steam lines for
(d) bypass lines for condensate primary-flow-
(e) turbine sprays ( f ) drain lines on stop, intercept and control valves (g) interconnecting lines to other units (h) steam to air preheaters (if isolation is not possi-
ble, flows shall be measured) ( i ) demineralizing equipment (isolation of demin-
eralizing equipment does not necessarily mean remov- ing the equipment from the cycle. It does mean, however, that all interconnections with other units must be isolated and items such as recirculating lines that affect the primary-flow measurement must be iso- lated or their flows measured.)
( j ) steam generator fill lines (k) steam-generator vents (I) steam-operated soot blowers
orator condenser and evaporator preheaters
starting
measuring devices
11
COPYRIGHT American Society of Mechanical EngineersLicensed by Information Handling ServicesCOPYRIGHT American Society of Mechanical EngineersLicensed by Information Handling Services

ASME PTC 6s REPORT-I 988
(m) condensate and feedwater-flow bypassing
(n) heater-drain bypasses (o) heater-shell drains (P) heater water-box vents (9) hogging jets (r) condenser water-box priming jets (S) steam or water lines for station heating (t) steam or water lines installed for water washing
heaters
the turbine
3.2.5 Flows That Should Be Isolated or Measured. Ex- traneous flows which enter or leave the cycle in such a manner that, if ignored, will cause an error in the flows through the turbine, should be isolated or measured. Typical of such flows are:
(a) boiler-fire-door-cooling flow and boiler-slag-tap cooling-coil flow
(b) sealing and gland-cooling flow on the following (both supply and return):
( I ) condensate pumps (2) feedwater pumps (3) boiler-water or reactor-circulating pumps (4) heater-drain pumps when not self-sealed (5) turbines for turbine-drive pumps (6) reactor control-rod seals
(c) desuperheating water (d ) feedwater-pump minimum-flow lines and
(e) steam for fuel-oil atomization and heating ( f ) steam-generator blowdowns (g) turbine water-seal flow (h) desuperheating water for turbine-cooling steam ( i ) emergency blowdown valve or turbine-packing
( j ) turbine water-seal overflows (k ) steam, other than packing-leak-off steam, to the
( I ) make-up water, if necessary (m) pegging or sparging steam (such as higher-stage
extraction at light loads) for low-pressure operation of deaerator
(n) heater vents are to be closed if possible, and if not possible, shall be throttled to a minimum
(o) deaerator-overflow line (P) deaerator vents (4) water leakage into any water-sealed flanges,
(r) pump seal leakage leaving the cycle (S) automatic-extraction steam for industrial uses (t) continuous drains from wet-steam turbine cas-
balance-drum flow
leakage and sealing system
steam-seal regulating valve
such as water-sealed vacuum breakers
ings and connection lines
PROCEDURES FOR ROUTINE PERFORMANCE TESTS OF STEAM TURBINES
(u) sub-cooled water used for moisture separator (v) reactor-core spray (W) heater-blanketing steam lines
3.2.6 Unmeasurable Flows. It will be necessary to use calculated values for internal pump leakages, shaft packing, valve-stem leakages, internal turbine leak- ages, and turbine-drain flows when it is impossible to measure these flows.
3.2.7 Methods of Isolating. The following methods are suggested for isolating or verifying isolation of miscel- laneous equipment and extraneous flows from the pri- mary turbine-feedwater cycle:
(a) double valves and telltales (b) blank flanges (c) blank between two flanges (d ) removal of spool piece for visual inspection (e) visual inspection for steam blowing to atmo-
sphere from sources such as safety valves and valve- stem packings
( f ) closed valve which is known to be leak-proof and is not operated prior to or during test
(g) temperature indication (h) tracer indication of presence of leakage
3.2.8 Cycle Water Balance. For an acceptable test ac- curacy, the difference between the sums of the mea- sured storage changes and flows in-and-out of the system should not exceed k0.5 percent of the maxi- mum turbine throttle flow. However, for good repeat- ability, aconsistent level of unaccounted-for loss based on a chronological series of tests i s satisfactory, even though the unaccounted-for loss exceeds the k 0.5 per- cent of maximum throttle flow. Any change in the unaccounted-for loss exceeding 0.1 percent of the maximum throttle flow should be investigated, since it may directly affect the test result. If the cause of the change can be determined, the test result should be ad- justed to compensate for this factor. If the cause cannot be determined, the change in losses directly affects the repeatability of this test in comparison with the trend of previous tests.
3.3 PRELIMINARY TESTS
Preliminary tests may be run for the following
(a) to establish the location of t.urbine valve points; (b) to isolate the turbine cycle and make a water
balance of the cycle. This establishes the magnitude of
reasons:
COPYRIGHT American Society of Mechanical EngineersLicensed by Information Handling ServicesCOPYRIGHT American Society of Mechanical EngineersLicensed by Information Handling Services

ASME P T C * b S REPORT 88.
PROCEDURES FOR ROUTINE PERFORMANCE TESTS OF STEAM TURBINES
unaccounted-for leakage which directly affects the ac- curacy of a test result. Any significant change in unaccounted-for leakage must be investigated before an acceptable test run can be made for comparison with previous tests.
(c) to check internal cycle conditions. If variations in equipment operation that affect turbine stage flows or stage pressure occur, corrective actions should be undertaken. The following is a partial list of items that should be considered:
( 1 ) changes in feedwater heater performance (2) bypassing of feedwater heaters (3) change in positions of feedwater heater level
(4) amount of desuperheating water used for con-
(5) makeup evaporator in service (6) cycle heat requirements for building heating
(7) steam supplied to a turbine-driven feedwater
(8) feedwater pump recirculation leakage
control valves as an indication of heater leakage
trol of steam temperature
or combustion air heating
pump or fan
(cf) to check the operation of test instrumentation and to familiarize test observers with the routine of proper testing procedures. The sequential timing of readings and the coordination of simultaneous read- ings can be checked out under test conditions.
(e) to compare test-instrument readings with station operating-instrument readings and to detect differ- ences that should be investigated and corrected;
( f ) to establish a preliminary evaluation of the con- dition of the turbine; and to determine whether diag- nostic information is compatible with known laws of engineering principle.
3.4 CONDUCT OF A TEST RUN
3.4.1 Pretest Conditions. Calibration of test instru- ments should be established prior to the test run. All in- struments should be put in service and checked for performance by comparison with previous test data or cross-checked by comparison with station instru- ments. Preferably, the turbine should be tested with governing valves wide open even if a reduction in throttle pressure is necessary. If valves wide apen can- not be obtained, a previously selected valve position should be set using the same technique established on earlier test series. This setting may be made with the turbine on load-limit control to obtain steady-state op- erating conditions for the test run. During the period immediately following the setting of the turbine-valve position, the isolation procedure may be executed to
m 0 7 5 ~ 0 0'054b57 4 m
ASME PTC 6s REPORT-I 988
establish final conditions for a test run, Test conditions which are as close as possible to specified conditions should be established and maintained to minimize the magnitude of test corrections to the turbine test heat rate.
3.4.2 Test Readings. Test readings should be taken ac- cording to the established test routine. These readings should be checked for consistency during the progress of the test. The duration of the test run should be ade- quate to establish accurate averaged data and accurate integrated primary measurements. The recommended reading frequencies for test readings for a two hour test should not be less than the following:
(a) each 2 minutes: primary flow, power output based on indicating meters, turbine speed for mechani- cal power output
(b) each 10 minutes: secondary flows affecting throttle-flow calculation, primary pressures, primary temperatures
(c) each 20 minutes: secondary flows not affecting throttle-flow calculation
(cf) each 20 minutes: secondary electrical data not affecting generator output calculation, secondary pres- sures, secondary temperatures
(e) each 30 minutes: integrated flows, integrated electric-power measurements, storage level changes
3.5 DATA REDUCTION
Recorded test data should be examined for consist- ency and reliability. Inconsistent readings which are not substantiated by the trends of related data may be disregarded if at least 90 percent of the total readings are retained for averaging. PTC 19.1 - 1985 provides a procedure that may be used to examine data.
If the test is divided into specific time periods by syn- chronized readings of all integrating meters, the initial or final period may be discarded if unusual instability of a principal test variable occurred within such per- iod. Automaticdatacollection and reduction are useful and, if provided, should be programmed to conform to conditions recommended in these procedures. Thefol- lowing steps, as applicable, are suggested for data re- duction:
(a) average all test readings and obtain meter- integrated-flow differences and generator-output dif- ferences
(b) apply water leg and gage calibrations to aver- aged pressure readings and convert pressure readings to absolute pressure
13
COPYRIGHT American Society of Mechanical EngineersLicensed by Information Handling ServicesCOPYRIGHT American Society of Mechanical EngineersLicensed by Information Handling Services

ASME P T C * b S REPORT B B I 0757b70 005Llbb0 O W
ASME PTC 6s REPORT-I 988
(c) convert thermocouple outputs to temperature
(d) apply meter calibrations and working-fluid den-
(e) convert storage-level differences into flow rate ( f l correct generator output to specified power fac-
(g) calculate primary and secondary flows (h) calculate steam and water enthalpies
units and apply thermocouple calibrations
sity corrections to integrated quantities
tor and hydrogen pressure
3.6 COMPUTATION OF TEST RESULTS
Computation of test results should follow proce- dures given in the Code and in Appendix A supple- menting the Code. The required computations for specific turbine types are also outlined in later Sections of this Report. Group II test corrections that cover all significant test variables should be developed by the user in cooperation with the turbine manufacturer.
3.7 REFERENCE TABLES
The 1967 ASME Thermodynamic and Transport Properties of Steam is the recommended reference for steam properties. Other formulations may differ slightly. Caution should be used when comparing test results, to assure that the same formulation of steam properties is used in each instance. Where machine computation is employed, the computer shall be pro- grammed in accordance with the 1967 IFC Formula- tion for Industrial Use, which i s included in the Appendix to the 1967 ASME Steam Tables.
3.8 REPEATABILITY OF TEST RESULTS
3.8.1 General. Test repeatability is the test instrumen- tation system's ability to produce test results of the same outputhput relationship over extended time periods. Good long-term repeatability is essential in periodic testing to ensure that variations in perform- ance indicated by test results are true indications of the deterioration of the equipment tested. Although abso- lute accuracy is not stressed in this Report, in general, accurate instrumentation is recognized to have better repeatability over the long term than will less accurate instrumentation. Therefore, the optimum combination of instruments selected must weigh the desired level of test repeatability against the initial cost of the instru-
PROCEDURES FOR ROUTINE PERFORMANCE TESTS OF STEAM TURBINES
mentation and cost of running tests. For guidance in se- lecting alternative instrumentation of Section 4, it is recommended that the uncertainty intervals given in the Report by PTC Committee No. 6 on Guidance for Evaluation of Measurement Uncertainty in Perform- ance Tests of Steam Turbines-1 985, be consulted.
3.8.2 Instrumentation. The specific instrumentation recommended in Sections 7 through 13 was selected to provide consistent repeatability over a long time per- iod. An analysis should be made of the chronological test results to establish the level of repeatability achieved by the specific test installation. PTC 19.1, Measurement Uncertainty, may be used as the proce- dure for this analysis. Where unexplained deviations or trends are detected, it may be necessary to recali- brate or to use more accurate instrumentation to raise the level of repeatability.
3.8.3 Estimate of Repeatability. Uncertainty intervals for various instruments, such as those specified in PTC- 6 Guidance Report, are expressed typically as a single value meant to include both the random and bias un- certainty components. The relative contributions of random and bias errors are unknown for most instruments.
Caution should be used in applying statistical tech- niques such as reducing instrument errors by the use of multiple instrumentsor reducingsamplingerrors by in- creasing the number of sampling locations, without sufficient knowledge of the relative importance of the random and bias components.
Certain factors will affect uncertainty yet have no ef- fect on repeatability. Bias error components, which are known and traceable and can be eliminated by calibra- tion, will reduce the overall instrument uncertainty but not affect its repeatability. Long-term repeatability is the untraceable, long-term variation in the bias error.
Based on steam turbine industry experience, the Committee has estimated repeatability as one-half the overall instrument uncertainty. Accordingly, the val- ues for test repeatability given in Section 7 through 13 and summarized in para. 3.8.4 were determined by taking one-half of the calculated test uncertainty.
3.8.4 Repeatability of Sample Calculations. The fol- lowing tabulation shows the repeatability of the tests recommended in each Section:
14
COPYRIGHT American Society of Mechanical EngineersLicensed by Information Handling ServicesCOPYRIGHT American Society of Mechanical EngineersLicensed by Information Handling Services

ASME P T C * b S REPORT B B m 0759670 0054663 2 m
PROCEDURES FOR ROUTINE PERFORMANCE TESTS OF STEAM TURBINES ASME PTC 6s REPORT-I988
Section Turbine Type Type Test Repeatability
7 Condensing, non- Steam rate f 0.5% extraction, super- heated inlet steam
6 Condensing, regen- Maximum +0.5% erative cycle,super- capability heated inlet steam
Heat rate &0.5%
9 Condensing, reheat- Enthalpy-drop 50.3% to regenerative cycle, t0.5% superheated inlet steam
Maximum k0.370 capability
Heat rate f0.6% to +_0.970
10 Condensing, regen- . erative cycle, saturated inlet steam .
11 Noncondensing, non- extraction, super- heated exhaust
12 Noncondensing, extraction
13 Special procedures
Heaf rate f 0.7%
Enthalpy-drop &0.5%
Maximum +0.3% capability
Enthalpy-drop fO.6% to & 0.7%
Maximum It: 0.5°/0 capability
Steam rate f 1 .8% without extraction
Steam rate f 2.4% with extraction
Heat rate f0.7'10
15
COPYRIGHT American Society of Mechanical EngineersLicensed by Information Handling ServicesCOPYRIGHT American Society of Mechanical EngineersLicensed by Information Handling Services

ASME P T C * b S REPORT 88 W 0 7 5 7 6 7 0 0054662 4 W ~~
PROCEDURES FOR ROUTINE PERFORMANCE TESTS OF STEAM TURBINES ASME PTC 6s REPORT-I988
SECTION 4 - INSTRUMENTS AND METHODS OF MEASUREMENT
4.1 GENERAL RECOMMENDATIONS
This Section provides recommendations of test in- struments and methods capable of the repeatability required for consistenttest results. Specific recommen- dations for primary and secondary instrumentation are made in Sections 7 through 13 for particular types of turbine.
Primary instruments are those devices that detect the parameter to be measured. Secondary instruments are the devices between the primary instrument and the in- dicating or recording device.
For routine performance tests, computerized data ac- quisition systems provide accurate, repeatable, and high-speed recording provided the primary and sec- ondary instrumentation is calibrated. Transducers con- vert the primary signal to an electronic signal which i s used as input to an analog to digital converter for use in a computer data acquisition system. When these sys- tems are installed, their use for routine performance tests is recommended.
However, all turbines are not equipped with such systems. Therefore, this Section also describes instru- ments that require manual recording of the instrument indication.
Pertinent sections of the Code, Appendix A to the Code, and publications of the ASME Performance Test Code Committee on Instruments and Apparatus should be used for reference. Alternative methods of measurement may be used, provided their effects upon accuracy and repeatability are considered in the inter- pretation of test results. Report PTC 6R-1985 on Guid- ance for Evaluation of Measurement Uncertainty in Performance Tests of Steam Turbines, should be used to evaluate these effects. This Report provides detailed guidance on selection of instruments for each type of measurement and the accuracy uncertainty associated with the instruments.
4.2 AC GENERATOR OUTPUT MEASUREMENT
Recommended methods for measurement of AC generator kilowatt (active power) output, listed in
order of preference to achieve the best degree of re- peatability, are described in this Section.
Generator loss curves provided by the manufacturer may require either the kilovolt-ampere (kVA) output or the kilowatf output and power factor of the generator to determine the generator loss at specified hydrogen pressure.
4.2.1 Active Power Measurements. Active power (kilowatts) should be measured with calibrated high- accuracy watt or watthour transducers with compara- ble accuracy solid-state electronic digital readout meters, used with separate potential and current trans- formers in each phase. Transducers shall be either three single-phase transducers or one three-element transducer. Analog and digital outputs to computer- ized data recorders are recommended. Potential trans- formers and current transformers should be calibrated with the equivalent burden of the transducers and me- ters, with no additional burden in the metering circuit,
4.2.2 Reactive Power Measurements. Reactive power (kilovars) should be measured with calibrated high- accuracy var or varhour transducers with comparable accuracy solid-state electronic digital readout meters, used with separate potential and current transformers in each phase. Transducers shall be either three single- phase transducers or one three-element transducer. Analog and digital outputs to computerized data re- corders are recommended. The potential and current transformers can be the same ones used for active power measurement provided the transformers are cal- ibrated with the equivalent burden of all watt, watt- hour, var, or varhour transducers and meters,
4.2.3 Power Factor Measurements. Power factor (cosineof the phase angle difference between the volt- age and current) should be measured with calibrated high-accuracy power factor transducers with compara- ble accuracy solid-state electronic digital readout me- ters, Separate potential and current transformers in
17
COPYRIGHT American Society of Mechanical EngineersLicensed by Information Handling ServicesCOPYRIGHT American Society of Mechanical EngineersLicensed by Information Handling Services

ASME PTC*bS REPORT 88 m 0757b70 0054663 b m
ASME PTC 6s REPORT-I 988
each phase are recommended, Transducers shall be ei- ther three single-phase transducers or one three- element transducer. Analog and digital outputs to computerized data recorders are recommended. The potential and current transformers can be the same ones used for active power measurement provided the transformers are calibrated with the equivalent burden of all watt, watthour, or power factor transducers and meters. An alternative to measuring kilowatts and power factor is to measure the volts and amps of each phase and the power factor.
4.2.4 Calibrated Rotating Standards. Calibrated rotat- ing standards, calibrated single-phase test watthour meters, or a calibrated three-element test watthour me- ter, used with separate potential'and current transform- ers in each phase may be used. Potential transformers and current transformers should be calibrated with the equivalent meter burden with no additional burden in the metering circuit. Meter integration i s by an auxil- iary photoelectric counter, or its equivalent, to record disc revolution. Mechanical-drive counting registers should not be used.
4.2.5 Calibrated Permanently Installed Watthour Me- ters, Calibrated three-element watthour meters perma- nently installed with separate potential transformer, but with current transformer used also for other instru- ments and relays, may be used. The potential trans- formers should be calibrated with the equivalent meter burden. Meter integration should be by mechanical register with smallest register unit less than 0.5 percent of the hourly generation at rated capacity.
4.2.6 Same as para. 4.2.5, but with potential transform- ers used also for other electrical instruments and re- lays. Changes in potential transformer burden can cause significant metering errors.
4.2.7 Same as para. 4.2.6, but with either 2'/2 element or two-element watthour meter instead of three- element watthour meter.
4.2.8 Instrument Transformer Location. Instrument transformers should be located so that the total genera- tor output is measured. If any external taps exist be- tween the generator and the point of measurement, supplementary metering of equivalent accuracy must be provided to determine the total generator output.
PROCEDURES FOR ROUTINE PERFORMANCE TESTS OF STEAM TURBINES
Supplementary readings shall be taken to obtain the generator power factor and hydrogen pressure if these data are required to establish the corrected generator terminal output. When definitions of turbine heat rate require measurement of excitation power or other aux- iliary service supplied to the turbine-generator unit, Code procedures should be followed to measure those quantities which are used to adjust the generator termi- nal output to conform to the heat rate definition.
4.3 MECHANICAL-DRIVE OUTPUT MEASURE- MENT
The Code, paras. 4.04 through 4.08, gives proce- dures for measurement of mechanical output using ab- sorption dynamometers (reaction torque system) or transmission dynamometers (shaft torque meters). Measurement of thermodynamic properties and calcu- lation of feedwater pump power is described in the Code, para. 4.09. See PTC 19.7, 1980 on Measure- ment of Shaft Horsepower for measurement of me- chanical output by other means. For other types of driven equipment, refer to applicable ASME Perfor- mance Test Codes. For routine testing of prime movers, which have a connected load during the test, the trans- mission dynamometer i s recommended- Absorption dynamometers absorb the prime movers shaft output and are not suitable for measuring shaft output when the prime mover is driving a connected load.
4.4 FLOW MEASUREMENT
Figures 4.1 (a), 4.1 (b), and 4.1 (c) illustrate the alter- native designs recommended for flow measurement in Code tests.
4.4.1 Primary Flow Element. Measurement of water flow at either of the following locations is recom- mended as the basis for the accurate determination of the primary flow to the turbine.
(a) The primary flow element, with a flanged in- spection port, shall be located in the feedwater system between the steam generator feedwater inlet and the highest pressure feedwater heater outlet. The high feedwater pressure may require that the primary flow element be welded into the feedwater piping system. The flanged inspection port provides access for in- specting the nozzle before and after the test and for cleaning the nozzle, if required, prior to the test.
(6) The primary flow element located in the con- densate system between the condensate pump
COPYRIGHT American Society of Mechanical EngineersLicensed by Information Handling ServicesCOPYRIGHT American Society of Mechanical EngineersLicensed by Information Handling Services

NOTE: The orientation of the nozzle on the pipe is determined by the designer.
ASHE PTC*bS REPORT 8 8 E 0757670 0054664 8 m
PROCEDURES FOR ROUTiNE PERFORMANCE TESTS OF STEAM TURBiNES ASME PTC 6s REPORT-I988
Upstream pressure taps
Flow straightener tJ Throat taps
'* bi20 D min.
L D - T i
2 D m i n . 6 2 D m i n . L I 6 D min. - IO D min. -4 - Inspection port
NOTE: No obstruction, such as thermocouple wells, backing rings, etc.
(This figure is diagrammatic and is not intended to represent details of actual construction.)
FIG. 4.l(a) WELDED PRIMARY FLOW MEASUREMENT SECTION
1_ --
FIG. 4.2(b) INSPECTION PORT FOR FEEDWATER FLOW NOZZLE
19
COPYRIGHT American Society of Mechanical EngineersLicensed by Information Handling ServicesCOPYRIGHT American Society of Mechanical EngineersLicensed by Information Handling Services

ASME PTC*bS REPORT 88 W 0757b70 0054bb5 T m
ASME PTC 6s REPORT-1988 PROCEDURES FOR ROUTINE PERFORMANCE TESTS
OF STEAM TURBINES
Compressed gasket thickness Valved vent 7 not to exceed 1/16 in.
b 2 D rnin.'1'20 min.% L - D ~ 1 J 1 6 0 min.
2 0 0 min. 1OD min.
NOTE: No obstruction, such as thermocouple wells, backing rings, etc.
FIG. 4.l(c) FLANGED PRIMARY FLOW MEASUREMENT SECTION
discharge and the feedwater pump suction. The condensate pressure is sufficiently low that a flanged flow element is typically used to facilitate removal for inspection or recalibration. Thus, the flanged flow me- tering section may be installed for the testonly, and re- moved from service for normal continuous operation.
(c) The primary element for measuring water flow, listed in order of least uncertainty and best repeatabil- ity in the flow measurement, should be a throat-tap nozzle, pipe wall tap nozzle, orifice, or venturi tube meeting the specifications of Fluid Meters 1971, Part I I , on Flow Measurement. The primary flow element should be installed in a specially designed flow meter- ing pipe section including a flow straightener (Fluid Meters 1971, Part II) located upstream from the meter- ing element. The complete flow metering pipe section should be calibrated as a unit before installation. For high capacity flows, the calibration should be ex- tended to the maximum Reynolds number achievable in the calibration facility to minimize uncertainty due to extrapolation of the flow coefficient.
4.4.2 Flow Element location in Cycle. The physical lo- cation of the primary water flow measuring element in the cycle is critical and will affect both the accuracy and repeatability of the flow measurement. No single location can be recommended because of the wide variations in cycle designs, piping arrangements, and costs. Alternate locations are shown on Fig. 4.2 and
20
listed in Table 4.1 in order of preference from the standpoint of simplifying the test procedure and mini- mizing the readings required.
4.4.3 Flow Element Design Considerations for Least Uncertainty and Best Repeatability. The following de- sign considerations for the primary flow element must be weighed to achieve a final design which will pro- vide good repeatability of test results.
(a) The type of primary element should be selected so that a reasonably constant flow coefficient can be expected for the range of Reynolds numbers corre- sponding to the planned test load range.
(b) To minimize uncertainty due to extrapolation of the coefficient curve, the Reynolds number range for calibration should be from the lowest value expected during the test to the highest value achievable by the calibration facility, or to the maximum value expected during the test if this value is less than the calibration fa- cility's maximum capability, If the test Reynolds num- ber i s outside the range of the calibration facility, then the procedures given in the Code for extrapolation should be followed.
(c) The primary element should be sized to pro- duce a pressure differential of at least 6 in. (1 53 mm) of mercury under water at the minimum test flow,
(d ) The ratio of the flow nozzle throat diameter, or the orifice diameter, to the internal pipe diameter (Beta
COPYRIGHT American Society of Mechanical EngineersLicensed by Information Handling ServicesCOPYRIGHT American Society of Mechanical EngineersLicensed by Information Handling Services

ASME PTC*bS REPORT B8 W 0757670 0054bbb L W
PROCEDURES FOR ROUTINE PERFORMANCE TESTS OF STEAM TURBINES ASME PTC 6s REPORT-I988
Steam gene
Heat Cycle With Deaerator
I I n Steam
generator 1 I
Location 1
Location 2 Location 3
Heat Cycle Without Deaerator
FIG. 4.2 ALTERNATE LOCATIONS FOR PRIMARY FLOW ELEMENT
ratio) should be within the limits of 0.25 (minimum) to 0.5 (maximum) for pipe wall tap flow nozzles and ven- turi tubes, and 0.3 to 0.6 for orifices. The Beta ratio for throat tap flow nozzles used in Code tests i s bounded by 0.25 (minimum) to 0.5 (maximum).
(e) Limited experience with permanently installed feedwater flow nozzles, which have a flanged inspec- tion port, show that nozzle deposits 6 to 1 O mils thick can be removed through the inspection port to restore the nozzle performance to its original calibrated condi- tion. The cleaning of the flow test section can be ac- complished by the use of very high pressure water jet devices. Other cleaning methods may be used pro- vided that they do not change the flow characteristics of the nozzle. Chemical cleaning should not be used unless the nozzle material is resistant to the chemicals.
4.4.4 Comparison of Secondary Flow Data to Primary Flow Measurement. When conducting routine tests on a flow section used in regular service, secondary data should be taken to compare the calculated primary flow with other flow measurements to detect devia- tions in trends as described below.
(a) From test data, compare primary flow with con- densate and steam flows.
(b) From test data, compare calculated throttle flow with measured turbine first stage pressure. The correla- tion of first stage pressure and throttle flow established by previous test provides a useful indication of primary flow accuracy.
(c) From test data, a similar comparison using the measured pressure ahead of the reheat stop valve serves to check reheat flow.
21
COPYRIGHT American Society of Mechanical EngineersLicensed by Information Handling ServicesCOPYRIGHT American Society of Mechanical EngineersLicensed by Information Handling Services

ASME PTC 6s REPORT-1 988 PROCEDURES FOR ROUTINE PERFORMANCE TESTS
OF STEAM TURBINES
TABLE 4.1 LOCATION OF PRIMARY WATER FLOW-MEASURING ELEMENT (Fig. 4.2)
1 2
Between Final Feedwater Heater
and Feedwater At Steam Pump Where Generator Pump is located
or Downstream of Economizer Feedwater Heater
Inlet Outlet
3
with Without Deaerator Deaerator
At Feedwater Pump Suction Where
Pump is Located At Upstream of
Deaerator High-pressure Inlet Heater
4
Between Condensate
Pump and lowest
Pressure Feedwater
Heater
ADVANTAGES
Provides direct measurement of feedwater flow leaving cycle, thereby minimizing number of test measurements X
Eliminates potential flow errors due to recircula- tion of feedwater heater leakage, if present X X X
Eliminates potential flow errors due to recircula- tion of any leakage through feedwater pump recirculating valve to the deaerator X X X
Allows use of low-pressure or intermediate- pressure flow metering instrumentation X X X X
Permits use of flanged flow metering section for easy removal for inspection or recalibration X X X X
Reynolds number may be within calibration range permitting direct use of calibration curve X
Less sensitive to isolation problems such as feedwater heater drains emergency discharge to condenser X
DISADVANTAGES
Requires use of high-pressure flow metering instrumentation X
Reynolds number range for test conditions may exceed range attained on calibration necessitat- ing extrapolation of calibration curve X X X X
Location probably requires welding the flow metering section in the line, making some repairs expensive and impractical for some devices X
Necessitates separate measurements of the gland sealing water supply and leak-off flows of the feedwater pump and any other pumps at the higher pressure levels of the cycle X X X X
Requires positive verification of tight closure of pump recirculating valve during test to assure zero recirculation to deaerator through flow metering section X
COPYRIGHT American Society of Mechanical EngineersLicensed by Information Handling ServicesCOPYRIGHT American Society of Mechanical EngineersLicensed by Information Handling Services

ASME PTC*bS REPORT 8 8 m 075'7670 0054668 5 W
PROCEDURES FOR ROUTINE PERFORMANCE TESTS OF STEAM TURBINES ASME PTC 6s REPORT-I988
TABLE 4.1 LOCATION OF PRIMARY WATER FLOW-MEASURING ELEMENT (Fig. 4.2) (cont'd,)
1 2
Between Final With Feedwater Heater Deaerator
and Feedwater At Steam Pump Where
Generator Pump is Located or Downstream of At
Economizer Feedwater Heater Deaerator Inlet Outlet Inlet
3
Without Deaerator
At Feedwater Pump Suction Where
Pump is Located Upstream of
High-pressure Heater
4
Between Condensate
Pump and Lowest
Pressure Feedwater
Heater
Necessitafes accurate pressure and temperature measurements around all feedwater heaters at the higher pressure levels for calculation of final feedwater flow by heat balance method X X X
Requires positive verification of zero flow in recirculation line to condenser X X X x Possibility of feedwater heater leakage in any or all heaters increases uncertainty of final feed- water flow rate X X
Proximity to pump discharge may subject flow metering instrumentation to unacceptable instrument oscillations from pump induced pressure pulsations X
(d) From monthly performance data, compare com- puted steam generator efficiency, based on primary flow, with the level of turbine heat rate. A trend of in- creasing steam generator efficiency correlated with in- creasing (poorer) turbine heat rate indicates a drift of the primary flow measurement in the high direction.
(e) On cross-compound units where the steam leaving all turbine sections on one axis i s superheated, it is possible to compare the turbine flow based on the primary flow measurement with a calculated flow us- ing the output of the generator, related pressures and temperatures, and secondary flow measurements as described in the Code, para. 4.60. In general, this pro- cedure can be used on cross-compound units with all low-pressure sections driving one generator but not for cross-compound units with low pressure sections driv- ing two generators.
4.4.5 Steam Flow Measurement as an Alternate. An alternative method of determining the primary flow is to measure steam flow between the steam generator outlet and the turbine throttle. The absolute value of such a measurement is more uncertain than that of a water flow measurement because the primary element
i s usually uncalibrated and the discharge coefficient must be estimated from other sources. However, this approach may provide good repeatability for the spe- cific case where superheated steam flow is measured with permanently installed flow nozzles.
Analysis of the test data available to the Committee yields a repeatability for this type of flow measurement over extended periods of time of c 2 percent. It i s rec- ommended that water flow measurement be used for test purposes, and steam flow measurement be consid- ered as a secondary check for comparison of chrono- logical trends of repeated flow measurements.
4.4.6 Preferréd Method of Flow Element Differential Pressure Measuremenf. The preferred method of mea- suring the differential pressure produced by the pri- mary flow element is to use precision (0.1 percent of full accuracy) differential pressure transducers with comparable accuracy solid-state electronic digital readout meters. Analog outputs to computerized data recorders are recommended.
An alternative is to use a manometer to measure the differential pressure across the primary flow element. The manometer can provide equal accuracy to the
23
COPYRIGHT American Society of Mechanical EngineersLicensed by Information Handling ServicesCOPYRIGHT American Society of Mechanical EngineersLicensed by Information Handling Services

ASME P T C * b S R E P O R T 88
ASME PTC 6s REPORT-I 988
Downstream
Calibrated
0757670 0054bb7 7 m
PROCEDURES FOR ROUTINE PERFORMANCE TESTS OF STEAM TURBINES
6 1/2 in. extra heavy pipe nipple 1 4w& -
T c- f I ' I 1' 36 in. k k Solenoid actuated valve* 1/2 In. pipe to 1/2 in. O.D. tube fitting Clearance reoulred 1 v '1/2 in. O.D. tubing
- , - -. -. . - . "
for manometers (bundled)
Plan View
*Not required with transducers 1 in. = 25.4 mm 2" Floor line End View
FIG. 4.3 CONNECTION BETWEEN CALIBRATED FLOW SECTION AND MANOMETERS
pressure transducers but may not provide computer- ized data logging capability. Regulations restricting or prohibiting the use of mercury may necessitate the use of other devices.
The differential pressure measuring devices should be calibrated before and after the test, at the conditions expected during the test.
4.4.7 Method of Connecting Flow Element to Measur- ing Device. Figure 4.3 illustrates the preferred method of connecting a precision transducer or manometer to the primary flow element. The test instrument should be located below the source and the connecting piping should slope downward toward the instrument. Con- necting piping should be at least 3/8 in. (9 mm) ID. Both lines should be uninsulated and routed in close prox- imity to each other to minimize any temperature differ- ential. Zero displacement solenoid operated valves may be installed in series with the source valves to eliminate column movement when reading the differ- ential pressure. These valves should not be used with transducers for arresting readings but may be used for multiplexing instruments. Prior to the test, the instru- ment should be properly vented and checked at zero differential, and sufficient time must be allowed to per-
mit the lines to reach equilibrium temperature after putting the manometer in service. The manometer should be readable to "0.05 inch (1 -25 mm).
4.4.8 Secondary Flow Measurements. For secondary flow measurements required for heat balance purposes or detailed analysis of cycle performance, uncalibrated flow metering sections, meeting the specifications of Fluid Meters 1971, Part II, may be used.
For computerized data recording, differential pres- sure transducers and solid-state electronic digital read- out devices are recommended.
Secondary flows may be read directly using cali- brated indicating or recording flowmeters or calcu- lated from differentials read from manometers. For low flows and low-pressure steam packing leakage flows, suitably designed forward-reverse pitot tubes may be used.
4.5 PRESSURE MEASUREMENT
4.5.1 Primary Pressure Measurements. Primary pres- sures which significantly affect the turbine test results should be measured with precision test instruments.
COPYRIGHT American Society of Mechanical EngineersLicensed by Information Handling ServicesCOPYRIGHT American Society of Mechanical EngineersLicensed by Information Handling Services

ASME P T C * b S R E P O R T 88 m
PROCEDURES FOR ROUTINE PERFORMANCE TESTS OF STEAM TURBINES
Precision test instruments are defined as commercially available instruments having the following measure- ment uncertainty:
Instrument Measurement Uncertainty
(11 Pressure transducers 0.1 % of full scale
(21 Deadweight gages 0.1 % of measured pressure
(3) Manometers Considered a primary standard
(4) Absolute pressure gages 0.25% of full scale reading
(5) Bourdon gages 0.25% of full scale reading
(6) Barometer Considered a primary standard
The following instruments are recommended,
Instrument Pressure Range
(1) Calibrated pressure trans- O to 5000 psia (34470 kPa) ducer with suppressed range for accurate readout2
(2) Calibrated deadweight Above 35 psia (240 kPa) gage
(3) Precision manometers' O to 35 psia (240 kPa)
(4) Precision absolute pressure O to 2 psia (14 kPa) gage
(5) Laboratory type bourdon 35 to 1000 psia (240 to test gage' 6890kPa)
(61 Precision barometer3 Atmospheric pressure
NOTES: (11 See para, 4.02 in the Code for precaution on the use of mer-
cury as the manometer fluid. (2) Must be calibrated against a secondary standard immediately
before and after the test, to ensure an accurate calibration. Transducers should be temperature-compensating or located in a temperature controlled environment.
(3) See PTC 19.2 - 1987 on Pressure Measurement.
The actual choice of instrument is optional where the specified pressure ranges overlap.
Precision pressure transducers with comparable ac- curacy, solid-state electronic digital readout devices, and an output to acomputerized data recorder are rec- ommended for routine performance test.
4.5.2 Secondary Pressure Measurements. Secondary pressures, which have a minor effect on test results, may be measured using standard plant instrumenta- tion, These instruments should be maintained in good
0757b70 .O054670 3 m
ASME PTC 6s REPORT-I988
condition and recalibrated at least once every 6 months,
4.5.3 Pressure Instrument Piping. Piping connecting the pressure-measuring instruments with the pressure source should be at least 3/8 in, (9 mm) inside diameter or equivalent tubing. For details of installation of pressure-source taps and arrangement of connecting piping, refer to the Code, paras. 4.84 through 4.89. Pressure multiplexing valves may be used to select the pressure signal connected to the valve to allow se- lected pressure signal transmittal to a pressure trans- ducer. The multiplexing valve should be located as close as possible to the pressure transducer. After each pressure signal source is selected, the pressure should be allowed to stabilize before reading or recording the pressure.
4.5,4 Test-Pressure Connection Precautions. Test- pressure connections not in continuous service should be thoroughly blown down before the start of the test to ensure clear lines and to permit time for the water legs to reach equilibrium temperature. Subatmos- phericconnections should be properly vented to clear the lines of accumulated mositure and should be pro- vided with minimum-flow air bleeds to purge the lines except when readings are made. Similar purging is rec- ommended for connections slightly above atmo- spheric pressure, especially when the instrument is located above the source connection.
4.5.5 Deadweight Cages. For periodic tests, dead- weight gages of good quality do not require routinecal- ibration. The gages should be examined during the test to ensure that the pistons rotate freely. If a gage error is suspected, the calibration may be checked by the fol- lowing:
(a) checking against a deadweight tester; (b) checking the gage against a column of mercury, .
and by comparing the weights against each other on a precision balance.
Pressure transducers and Bourdon gages for primary measurements should be calibrated in-place by adead- weight tester before and after each test. Transducers and gages for secondary pressure measurements should be calibrated with a deadweight tester every 6 months.
4.5.6 Manometers. Manometers may be of the U- tube type with a scale to read the level in each leg, or
25
COPYRIGHT American Society of Mechanical EngineersLicensed by Information Handling ServicesCOPYRIGHT American Society of Mechanical EngineersLicensed by Information Handling Services

ASME PTC 6s REPORT-I 988
single-leg well-type manometer with a compensated scale indicating the correct differential height between the indicating fluid column and the closed reservoir level. If mercury is used, it should be a clean instru- ment grade mercury. Regulations restricting or prohib- iting the use of mercury may necessitate the use of other indicating fluids. Before filling a manometer, it should be flushed and thoroughly cleaned of residual deposits. Care must be exercised in filling well-type manometers with the specified quantity of indicating fluid to establish properly the zero level and to avoid entrapped air in the closed reservoir. After filling, the manometer should be exercised by application of pres- sure, and the zero level checked for a consistent read- ing. The manometer should be readable to k0.05 in. (1.25 mm).
4.5.7 Precautions When Using Mercury in Manome- ters. Mercury is the manometer fluid used for primary pressure measurement. For secondary pressure mea- surement, commercial fluids of known specific gravity may be substituted to expand the scale reading, and thus reduce the reading error. Precautions concerning the use of mercury in instrumentation are discussed in para. 4.02 of the Code.
4.5.8 Exhaust Pressure Measurement Methods. The exhaust static pressure of a condensing turbine is to be measured at, or on either side of and adjacent to, the exhaust joint. The Code recommends that no fewer than two pressure measuring devices should be used per exhaust annulus. If possible, pressure measuring points should be selected which will indicate the aver- age pressure of the entire exhaust area. If acceptance tests were run using Code procedures, the sampling points at each exhaust which produced readings clos- est to the average should be retained for periodic test- ing. The initial location of the pressure-measurement device requires judgement. Basket-tip pressure sen- sors, installed at a 45 degree angle to the flow as shown in Fig. 4.4(a), are recommended. Their location should be at the plane of the exhaust joint, downstream of the plane of the discharge annulus, and approximately on the center line of the turbine shaft. Close proximity to extraction steam piping or internal structural supports should be avoided. The exact location should be ad- justed so that the basket tip is in the center of an unob- structed steam flow path from the exhaust to the condenser. The basket tip should be rigidly supported by anchoring its connecting piping. This piping should slope continuously upward to an external valve at the turbine casing just above the turbine floor level.
PROCEDURES FOR ROUTINE PERFORMANCE TESTS OF STEAM TURBINES
Guide plates shown in Fig. W b ) should bearranged so that the steam flow is perpendicular to the pressure tap. The pressure corresponding to the average exhaust hood temperature may be used as a secondary check to verify the repeatability of the exhaust pressure mea- surement. Since these instruments may be at different locations, a pressure differential may exist.
4.5.9 Exhaust Pressure Measurement Devices. Abso- lute pressure gages, or standard mercury manometers may be used for the exhaust pressure measurement. In either case, these should be equipped with scales and verniers that permit reading to kO.01 in. (0.25 mm). Absolute pressure gages must be scrupulously clean before filling with instrument grade mercury. Before the test, the gages should be compared with each other when connected to a common vacuum source, or compared with a precision manometer and barometer.
4.5.10 Corrections to Pressure Measurements. Pres- sure, whether by deadweight gage, Bourdon gage, or mercury manometer, shall be the algebraic sum of the following:
(a) the instrument reading, using the proper con- version factors for the measuring fluid. Refer to Fluid Meters 1971, Fig. 11-1-2.
(b) the negative correction for manometer tempera- ture to 32°F (OOC)
(c) the instrument correction, including any scale correction required
(d) the gravity correction to reduce the reading to the value which would be obtained if gravity at the lo- cation of the instrument had the International Standard Value of 32.1 7406 Wsec' (9.80665 m/s2)
(e) the water column correction ( f ) the measured barometric pressure including the
correction to the elevation of the gage
4.6 TEMPERATURE MEASUREMENTS
4.6.1 Primary Temperature Measurement Instru- ments. The following instruments are recommended for primary temperature measurement (see Code paras. 4.1 O0 through 4.1 07):
4.6.1 .I Standardized Resistance Thermometer. A standardized resistance thermometer with a precision resistance bridge, digital multimeter or data acquisi- tion system, installed for test only.
4.6.1.2 Test Thermocouples With Water-Ice Bath Cold Junction. A calibrated thermocouple constructed
26
COPYRIGHT American Society of Mechanical EngineersLicensed by Information Handling ServicesCOPYRIGHT American Society of Mechanical EngineersLicensed by Information Handling Services
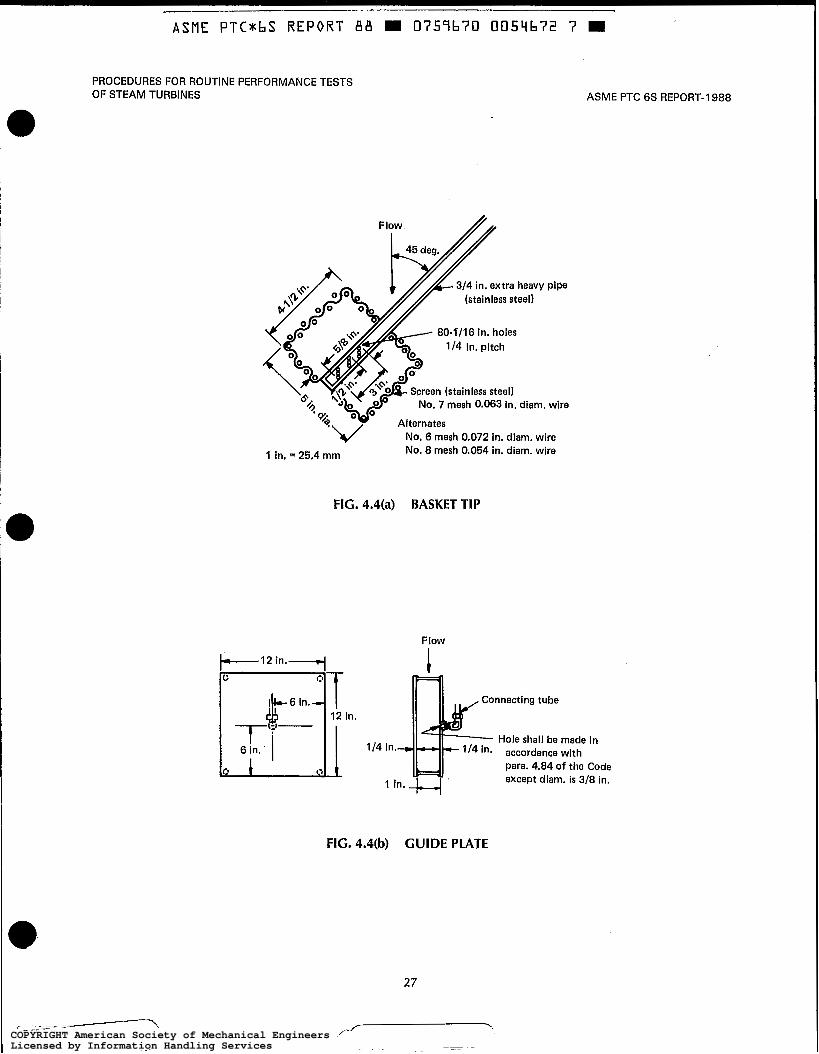
ASME PTC*bS REPORT A B m 0757b70 005Llb72 7 m
PROCEDURES FOR ROUTINE PERFORMANCE TESTS OF STEAM TURBINES ASME PTC 6 s REPORT-1988
No. 7 mesh 0.063 in. diam. wire
Alternates No. 6 mesh 0.072 in. diam. wire No. 8 mesh 0.054 in. diam. wire 1 in. = 25.4 mm
FIG. 4.4(a) BASKET TIP
F low
1 /4
Connecting tube
Hole shall be made in in. accordance with
para. 4.84 of the Code except diam. is 3/8 in.
FIG. 4.4(b) CUIDE PLATE
27
COPYRIGHT American Society of Mechanical EngineersLicensed by Information Handling ServicesCOPYRIGHT American Society of Mechanical EngineersLicensed by Information Handling Services

ASME PTC*bS REPORT €$B m
ASME PTC 6s REPORT-I 988
with continuous leads having an integral cold junction and a balanced precision potentiometer, digital volt- meter, or data acquisition system, installed for test only, with a water-ice bath to maintain the solid-state cold junction at the ice point.
The water-ice mixture should be stirred frequently to eliminate temperature gradients and the temperature verified with a mercury-in-glass thermometer.
When using digital voltmeters, proper guarding pro- cedures shall be followed to minimize stray electric signal errors. -
4.6,.1.3 Test Thermocouples With Electronic Refer- ence Junction. A calibrated thermocouple constructed with continuous leads to an electronic reference junc- tion and precision potentiometer, digital voltmeter, or data acquisition system, These thermocouples are in- stalled for test only.
4.6.1.4 Test Thermocouples With Temperature Controlled Cold Junction. A calibrated thermocouple connected to permanently installed lead wire of the same materials as the thermocouple, and a tempera- ture controlled cold junction located at a common ter- minal board for a group of test thermocouples. The cold junction temperature should be measured with a calibrated instrument, and access to the reading with- out opening the terminal board enclosure.
The millivolt output of each thermocouple should be read, using either a precision potentiometer or digital voltmeter properly compensated for the cold junction temperature, by sequentially connecting each thermo- couple through a rotary test switch or by suitable test jacks.
These special test thermocouples should not be left in continuous service but should be removed from their well and reinstalled for each test.
4.6.2 Secondary Temperature Measurements. Sec- ondary temperature measurements, having a minor ef- fect on the test result, may use station thermocouples connected to recording or indicating instruments. Be- fore testing, these instruments should be checked to ensure correct standardization. Use of mercury-in- glass thermometers is recommended only for tempera- tures of 200°F (1 00°C) or lower.
4.6.3 Measurements to Determine Steam Enthalpy. Special attention i s required in the location of test points for pressure and temperature measurements where these readings are used to determine steam en- thalpy. Pressure taps should be located as close as pos-
0757670 0054673 7 - PROCEDURES FOR ROUTINE PERFORMANCE TESTS
OF STEAM TURBINES
sible to the point of corresponding temperature measurement. Duplicate temperature measurements should be made at each point where the steam en- thalpy is a primary factor in the calculation of the test result, If more than one steam line serves a common lo- cation, duplicate measurements should be provided in each line. For acceptable accuracy, the steam should be superheated 25'F (14°C) or more at the point of measurement. Care should be taken that the tempera- ture reading is representative of the mixed flow in the pipe.
For steam exhausting from turbine sections, the tem- perature measurement should bedownstream of an el- bow or tee to provide mixing of the stratified steam leaving the turbine steam path.
For turbine extraction steam temperature measure- ment, the possibility of internal or external steam by- pass flows which could affect the main flow should be checked, and precautions taken to locate the tempera- ture measurement point accordingly.
In pipes less than 4 in. (I00 mm) internal diameter, the thermocouple well should be positioned axially by insertion in an elbow or tee.
4.6.4 Thermowells. Unless limited by design consider- ation, the temperature sensitive element should be im- mersed in the fluid at least 3 in. (75 mm), but not less than one-quarter of the pipe diameter. Thermometer wells shall be installed in conformity with the ASME Boiler and Pressure Vessel Code and Power Piping Code. Tubes and wells shall be as thin as possible con- sistent with safe stress and other ASME Code require- ments, and the inner diameters of the wells must be clean and dry and free from corrosion or oxide. The well material should resist corrosion. A clean well will permit easy removal of the thermocouple, The internal diameter of the well should be as small as possible so the thermocouple will fit closely in the well and be firmly held against the bottom. The portion of the ther- mocouple well external to the pipe should be carefully covered with heat insulation to minimize radiation losses.
4.6.5 Calibration of Temperature Measuring Devices. Primary test thermocouples or resistance thermome- ters should be recalibrated at periodic intervals. The frequency of the recalibration should be determined by experience, The Code, para. 4.106, recommends suitable calibration procedures.
Secondary temperature measurements should be checked by comparison with primary test thermocou-
28
" .- - -. COPYRIGHT American Society of Mechanical EngineersLicensed by Information Handling ServicesCOPYRIGHT American Society of Mechanical EngineersLicensed by Information Handling Services

ASME PTC*bS REPORT A B W 0757670 0054674 O
PROCEDURES FOR ROUTINE PERFORMANCE TESTS OF STEAM TURBINES
ples whenever the indicating temperature i s in doubt. This can be done in the field under steady-state condi- tions by interchanging the permanent thermocouple and a test thermocouple in the same well and compar- ing the readings.
4.7 STEAM QUALITY MEASUREMENT
Steam samples should be taken in accordance with PTC 1 9.1 1 I 1 970 on Water and Steam in the Power Cy- cle (Purity and Quality, Leak Detection and Measure- ment). The following methods may be used, as applicable, to determine steam quality.
(a) tracer - tracer technique, radioactive or non- radioactive, (for throttle steam and extraction steam). For details refer to the Code, Par. 4.109.
(b) heater drain flow and heat balance - heater drain flow measurement (extraction steam only) and heat balance
(c) throttling calorimeter - throttling calorimeter for direct determination of quality (throttle steam only)
Selection of one of the above methods for determin- ing steam quality is dependent upon many conditions and each method has limitations which govern its use. The radioactive tracer method is currently used for many nuclear fueled power plant turbines. The Code, para. 4.1 O9 through 4.1 15, provides details regarding its use.
The principal disadvantage of the calorimeter is that its accuracy is directly affected by the extent to which the steam sample represents the average condition of the steam flowing in the pipe, Figure 4.5 illustrates a moisture sampling tube which is designed so that the average velocity through the eight sampling holes is approximately equal to the average steam velocity in the pipe. In large pipes, there is evidence that the mois- ture in the steam tends to collect along the pipe wall thus escaping isokinetic sampling. Techniques for steam sampling are described in PTC 19.1 1, 1970, [&A, Part I I on Water and Steam in the Power Cycle (Purity and Quality, Leak Detection and Measure- ment).
4.8 TIME MEASUREMENT
The time of test periods and other observations may be determined by the following:
(a) for computerized data acquisition systems, an electronic clock built into the computer can provide automatic, accurate time measurements;
29
ASME PTC 6s REPORT-1988
FIG. 4.5 MOISTURE-SAMPLING TUBE
(b) signals from a master clock or timekeeper, if the tests require the starting or stopping of certain readings simultaneously;
(c) observations of synchronized watches by the in- dividual observers;
(d) radio communication of the master time signal. When signals from a master clock are used, the sig-
naling means shall be permit signal receipt within 0.5 sec of the desired time.
Reliable watches or clocks having an accuracy within one minute per day shall be employed. Watches and clocks shall by synchronized at the start of the test.
4.9 CYCLE LEAKAGES AND STORAGE CHANGES MEASUREMENTS
Water or steam leakages from the plant cycle be- tween the point of primary flow measurement and the turbine throttle must be measured to a degree of accu- racy consistent with the primary flow. Typical leakages are pump leakages, injection flows, auxiliary steam flow, steam generator blowdown, and valve stem leak- ages.
COPYRIGHT American Society of Mechanical EngineersLicensed by Information Handling ServicesCOPYRIGHT American Society of Mechanical EngineersLicensed by Information Handling Services

ASME PTC*bS REPORT B¿! ~~
ASME PTC 6s REPORT-I988
Low temperature leakages, such as pump shaft leak- age, should be collected for a timed period and weighed to establish the leakage rate.
In a similar manner, any system storage in the area of the cycle should be calibrated for changes in level and the levels recorded during the test period. Typical items are condenser hotwell storage, deaerator stor- age, and steam generator drum storage.
4.10 STATION INSTRUMENTS FOR SECONDARY READINGS
Station instruments can be used for secondary read- ings which have a minor effect on the test result pro- vided they are properly maintained and calibrated within 6 months before the test.
Detailed information on instruments is contained in PTC 19, Series on Instruments and Apparatus.
4.1 1 MANUFACTURER'S DATA FOR TEST CALCU- LATIONS
The equipment manufacturer may provide data and/ or correction curves which are pertinent to the test cal- culation. Some of these data are as follows.
(a) electrical losses correction curves - electrical losses relative to generator power factor and hydrogen pressure to adjust the generator output to rated condi- tions. Electrical losses that are determined from manu- facturer's curves may require measurement of the active power (kilowatts) and either reactive power (kil- Ovars) or power factor to determine generator kVA.
(b) turbine heat rate or steam rate corrections - tur- bine heat rate or steam rate corrections to adjust the test rate to standard conditions defined by the heathteam rate formula
(c) turbine load corrections -turbine load correc- tions to adjust the test output to standard conditions de- fined by the heathteam rate formula
(d) unmeasurable secondary flows or steam leak- age- unmeasureable minor secondary flows or steam
OF STEAM TURBINES
leakages which affect the calculation of the throttle flow
(e) pump efficiency curves - pump efficiency curves which establish the pump enthalpy rise under test condition
(f) thermal inputs to cycle - minor thermal inputs to the cycle from heat exchangers such as air ejector condensers, generator hydrogen coolers, or oil coolers which cannot be conveniently measured as part of the test
4.12 ROTATING SPEED MEASUREMENT
Shaft speed shall be measured by use of an integrat- ing counter conforming to PTC 19.1 3 - 1961 on Mea- surement of Rotary Speed, para. 4.1 18. A stroboscopic device may be substituted if a calibrated accuracy of ,
1 o/o can be demonstrated, Additional details are con- tained in the Code, para. 4.1 17.
For mechanical drives, such as feedwater pump prime movers, where power is determined by measur- ing shaft speed and torque, it is essential to measure ac- curately the shaft speed. This is required because an error in the shaft speed measurements will produce an error in calculated shaft power which is directly pro- portional to the error in the shaft speed measurement. For mechanical drives, shaft speed shall be measured by utilizing a digital or analog tachometer system. This system consists of three basic components as follows:
(a) the gear or key on the shaft, considered the ex- citer. The exciter is utilized in conjunction with an electronic-integration counter as discussed in the Code, para. 4.1 18, and shall be constructed of ferrous material.
(b) the magnetic or eddy current speed transducer which converts the rotating exciter surface depth varia- tions into an AC voltage signal with no mechanical coupling to the shaft
(c) the electronic counter or tachometer. It i s the device that receives the AC signal from the pickup, completes the computation, and conditions the signal for readout purposes, For computerized data record- ing, an output to the computer is also required.
COPYRIGHT American Society of Mechanical EngineersLicensed by Information Handling ServicesCOPYRIGHT American Society of Mechanical EngineersLicensed by Information Handling Services

ASME PTC 6s REPORT-I988
SECTION 5 - PRELIMINARY TEST
5.1 LOCATION OF TURBINE VALVE POINTS
5.1'1 General. The turbine valve points must be deter- mined in order to establish turbine performance over the load range. If any test throttle flow is obtained with a valve only partially open, flow variations from test to test may result, leading to inconsistent test results. A savings in personnel and time can be realized if the valve points are determined prior to the start of the tur- bine test series.
A valve point may be established in terms of high- pressure turbine efficiency, certain measured turbine pressures, or valve stem positions. The turbine is tested at the established point.
5.1.2 High-pressure Turbine Efficiency Method. For units with a high-pressure section operating entirely in the superheat region, a valve point may be located by finding a point of local maximum high-pressure tur- bine efficiency. To do this, the flow to the unit is changed in small increments throughout a range which includes the valve points. At each flow increment, pressure and temperature measurements are taken at both inlet and exhaust so that high-pressure turbine section efficiencycan bederived. A local maximum ef- ficiency will be evident, provided suitable instruments and test procedures have been used. During testing, a parameter which varies with flow [such as governing valve position(s), or pressure ratio across either the first stage or the complete high-pressure section] should also be recorded so the valve point can be readily set during the test series.
5.1.3 Measured Turbine Pressure Method. Valve points may be established by measuring steam pres- sures using a pressure tap provided for each steam ad- mission zone, downstream of the governing valves. While the valve remains closed, the pressure in the zone below it will be nearly the same as the first stage exit pressure. As the valve opens, the zone pressure builds up and the difference between it and the first stage pressure changes. The valve point i s defined at this point of change.
Figure 5.1 illustrates data from this type of test. On this illustration, (A) is the pressuredownstream ofthe initial control valve(s1, (B) is the admission zone steam pres- sure for a specific valve, and (C) i s the first stage pres- sure. The valve point occurs when a change in the pressure difference between first stage pressure (C) and admission zone pressure (B) is detected as the valve starts to open. Normally, with the governing valves properly set, the next succeeding valve starts to open
- when the admission zone pressure rises (B) to within a few percent of the throttle pressure.
5.1.4 Valve Stem Position Method. Valve positions on turbines may also be determined by utilizing a preci- sion depth gage to determine the individual valve stem lifts. In addition, a reference scale to indicate the travel of the servo driving the valve cam shaft should be in- stalled. The physical valve cam and roller position is helpful in locating the approximate valve positions. During the preliminary test, sufficient readings are taken to establish the throttle flow at each test point, and turbine stage pressures are read. The test is run by raising the turbine load in suitable small increments throughout the entire load range. At each point, the load is held constant by setting the turbine load limit with the speed control out of range. At each load point, the following readings are taken:
(a) position of each turbine governing valve by depth gage measurement;
(b) position of cam shaft servo drive; (c) turbine stage pressures; (d) turbine load (for reference only); (e) load limit control oil pressure. Figure 5.2 shows data from such a test indicating the
valve point loading. Turbine throttle flow is used as a parameter. In using this data for setting up periodic tur- bine tests, the servo position is used. Lines are scribed on the position scale indicating the valve opening points, and the test loads are set up at scale positions slightly below the reference marks. If maintenance dur- ing turbine inspections included work on the turbine valve control, the test just described must be repeated to reestablish the location of the turbine valve points. A
31
COPYRIGHT American Society of Mechanical EngineersLicensed by Information Handling ServicesCOPYRIGHT American Society of Mechanical EngineersLicensed by Information Handling Services

ASME PTC*bS REPORT 88 W 0757b70 005Llb77 b m
ASME PTC 6s REPORT-I 988 PROCEDURES FOR ROUTINE PERFORMANCE TESTS
2000 " 1 1 I I I I
1800 - Throttle pressure
500 600 700 800 900 1000 1100 1200
Throttle Flow, 1000 Ibm/hr
OF STEAM TURBINES
7
FIG. 5.1 TYPICAL TURBINE VALVE-POSITION TEST DATA BASED ON INDIVIDUAL STEAM PRESSURE MEASUREMENTS
check of an individual valve must include a check of the next sequential valve to ensure that it has not lifted.
5.2 TEST FOR CYCLE ISOLATION
In this test the cycle isolation procedure (para. 3.2 of this Report and paras. 3.1 1 through 3.1 7 of the Code) is followed and all flows, in and out of the cycle, are read for a period of at least 1 hr, Changes in cycle storage are carefully checked and the unaccounted leakage is de- termined. The unaccounted leakage should amount to less than 0.5 percent of the maximum throttle flow and every effort should be made to minimize it. In the cal- culation of heat rate, the unaccounted leakage is usu- ally assumed to be from the steam generator and the amount is subtracted from the measured feedwater flow to calculate throttle flow and heat input, When the assumption is true, the impact on test heat rate is small and comparisons to previous tests should be valid. If however, the leakage occurs elsewhere in the cycle, and particularly if it is located upstream of the primary-flow measurement, then the effects of unac-
counted leakage or significant changes in leakage should be investigated to validate the assumption of the source of the leaks. It is desirable that this test be made under steady load conditions simulating an ac- tual test run,
5.3 TURBINE SECTION EFFICIENCY BY THE ENTHALPY-DROP METHOD
5.3.1 Measurements. Measurement of turbine section efficiencies by the enthalpy drop method is especially useful as a guide to the cleanliness of the turbine steam path. Immediately following an inspection of the tur- bine, when the steam path is of known cleanliness, a test should be made as soon as the turbine i s loaded to valves wide open and normal operating conditions are established. However, if extended operation at re- duced pressure is required, a special test should be made when 50 percent of normal throttle pressure is obtained. At each point where superheated steam en- ters or leaves the turbine casing, pressures and temper- atures are recorded using accurate test instruments. In
COPYRIGHT American Society of Mechanical EngineersLicensed by Information Handling ServicesCOPYRIGHT American Society of Mechanical EngineersLicensed by Information Handling Services

ASME P T C * b S REPORT B A
O
PROCEDURES FOR ROUTINE PERFORMANCE TESTS OF STEAM TURBINES ASME PTC 6s REPORT-I 988
500 600 700 800 900 1000 1100 1200
Throttle Flaw, 1000 lbmlhr
FIG, 5.2 TYPICAL TURBINE VALVE-POSITION TEST DATA BASED ON INDIVIDUAL
VALVE-LIFT MEASUREMENTS
addition, readings are taken to establish turbine throt- tle flow and first-stage pressure.
For a reheat turbine, possible locations for measure- ments are as follows:
(a) turbine throttle valve inlet (b) high-pressure turbine exhaust (cold reheat) (c) intermediate-pressure turbine inlet (hot reheat) (dl low-pressure turbine inlet (after crossover)
33
From the test data, turbine section efficiencies can be calculated, as illustrated in Fig. 5.3. A one hour test run under stabilized conditions is sufficient for this type of test.
Measurements and calculations of intermediate pressure turbine efficiency on opposed flow turbines should account for the effect of high-pressure turbine taintermediate pressure turbine shaft leakage.
5.3.2 Indicators of Turbine Cleanliness, Repeating the turbine section efficiency test at periodic intervals will indicate the turbine cleanliness. Lower section effi- ciencies, and decreasing throttle flow when adjusted to standard conditions, are indications of turbine steam path deposit accumulation. Also, a significant increase in low pressure feedwater heater pressures is indicative of steam path fouling of the low pressure turbine sec- tion. The condition of the low pressure section gener- ally cannot be measured by this method due to insufficient superheat in the turbine exhaust steam.
5.3.3 low Pressure Turbine Enthalpy-Drop Tests. It may be possible to conduct low pressure turbine enthalpy-drop tests at light loads on some steam tur- bines by increasing the exhaust pressure while holding a reheat temperature to obtain a dry exhaust. Since ab- solute pressures in the order o f 4 5 to 5.0 in. of mercury are necessary for this method, both the turbine manu- facturer and the condenser manufacturer should be consulted regarding operating limitations and the feasability of conducting this test before it i s attempted, (See ASME paper 60-WA-139 for further details on this method.)
i /--- COPYRIGHT American Society of Mechanical EngineersLicensed by Information Handling ServicesCOPYRIGHT American Society of Mechanical EngineersLicensed by Information Handling Services

ASME PTC 6s REPORT-1988
1500
1450
E P
m 1400
. 3 4-
- i Cr- r5
1350
13OC
128C
H - Intermediate-Pressure-Turbine Enthalpy Drop
Press., Temp., Enthalpy Enthropy Location psia. OF Btu/lbm Btdlbm OR
(a) IP inlet 413.5 996,8 1521.1 1.758 (b) IP EXH 70.5 561.1 131 2.4 (c) . . . . . 70.5 . . I I 1290.5 1.758
Isentropic enthalpy drop = 1521.1 - 1290.5 = 230.6 Btu/lbm Actual enthalpy drop = 1521.1 -- 1312.4 =208.7 Btu/lbm Stage Group Efficiency = (208.7/230.6) 100 = 90.5% L
"
I \ I
Steam flow a t IP inlet = 939,00OIbrr/hr
.76 1.77 1.78 1.79
Entropy, Btullbm OR
FIG. 5.3 STAGE GROUP EFFICIENCY BY ENTHALPY-DROP METHOD
COPYRIGHT American Society of Mechanical EngineersLicensed by Information Handling ServicesCOPYRIGHT American Society of Mechanical EngineersLicensed by Information Handling Services

PROCEDURES FOR ROUTINE PERFORMANCE TESTS OF STEAM TURBINES ASME PTC 6s REPORT-1 988
SECTION 6 - PRESENTATION AND INTERPRETATION OF TEST RESULTS
6.1 GENERAL
One of the most important objectives involved in a turbine testing program is the proper interpretation of the test results. It permits sound judgment as to correc- tive action that need be taken when there is indication of mechanical damage which may require prompt re- moval of the unit from service, or alternatively schedul- ing a future outage for internal inspection. In either case, proper interpretation serves to determine the de- gree of outage urgency, and helps determine the spare parts needed to restore the unit to its normal efficiency level. Some test results, which indicate deficiency in load-carrying ability, increased packing leakage, orde- creased section efficiency, are relatively easy to evalu- ate, but knowledge of the turbine characteristics is necessary to understand the reason for a performance change. It is important to understand the variations in section efficiencies, stage pressures, and stage temper- atures which occur due to changes in load, throttle pressure and temperature, reheat temperature, con- denser pressure, or due to the removal of a heater from service. In this Section, numerous thermodynamic and flow equations have been used to facilitate the discus- sion of turbine test performance. Although these equa- tions can be found in engineering texts, selected equations with derivations are included in paras. 6.25(a) through 6.25(d).
6.2 PRESSURE, TEMPERATURE, AND FLOW RELA- TIONSHIPS
The general flow equation for all turbine stages can be expressed as follows:
*See para. 6.25(a) for derivation of Eq. (1).
Moststages, including all those between thefirst and last stage, operate at a nearly constant pressure ratio under changing governing valve setting, throttle flow, condenser pressure, and throttle steam conditions.
For these stages, by assuming a constant p2/p1, and by ignoring the very small changes in y and A,, Eq. (1) becomes:
w = C, x constant 6 (2)
Although C, varies slightly with Reynolds number, practically it can also be considered a constant. Thus:
" W
~ - a constant (3)
or
W = a constant
1 P R, T,
where, in the above and in Fig. 6.1: W = rate of flow, Ibm/hr C, = flow coefficient An = nozzle area, ft2 (stationary-blade flow area)
pl = stage-inlet pressure, psia pz = pressure between stationary and rotating
p3 = stage-outlet pressure, psia R1 = universal gas constant at stage inlet g =acceleration due to gravity, ft/sec2
v1 = specific volume at stage inlet, ft3/lbm T, = absolute temperature at stage inlet, "R V = velocity, Wsec
y= ratio of specific heats (cp/cv)
blade rows, psia
The relationship shown in Eqs. (3) or (4) may also ap- ply to the first stage, depending on the operation of the governing valves.
35
COPYRIGHT American Society of Mechanical EngineersLicensed by Information Handling ServicesCOPYRIGHT American Society of Mechanical EngineersLicensed by Information Handling Services

. ASME PTCmbS REPORT ~.
ASME PTC 6S REPORT-I 988
P1
Stationary Blade Row or Nozzle
P3 -b
d p3 y vw
FIG, 6.1 TYPICAL BLADING DIAGRAM FOR SINGLE STAGE
6.3 FIRST-STAGE RELATIONSHIPS
In a turbine designed for partial-arc admission, the first-stage nozzle area is divided into separate areas, each served by one or more governing valves. When the turbine is operating with all valves wide open, the flow is a maximum. When a valve is closed, the flow area to the first stage is decreased and, therefore, the to- tal flow will decrease. Flow through the second stage also decreases, and Eq. (4) shows that second-stage in- let pressure, usually referred to as first-stage pressure', decreases. The pressure ratio across the first stage de- creases because the pressure ahead of the first stage re- mains approximately equal to throttle pressure. Because the pressure ratio changes with changing valve setting, Eqs. (3) and (4) are valid for the first stage
'Note that first-stage pressure is second-stage inlet pressure and that the level of first-stage pressure depends upon second-stage perfor- mance.
PROCEDURES FOR ROUTINE PERFORMANCE TESTS OF STEAM TURBINES
only if the valve setting is constant. Typical expansion lines for the high-pressure section of a partial-arc ad- mission condensing turbine are shown in Fig. 6.2.
6.3.1 Application of Eqs. (3) and (4) to the first stage of a full-arc admission turbine is valid under changing con- ditions, When the turbine is operated at a constant throttle pressure, the governing valves are closed in unison to reduce flow from the valves-wide-open flow, Pressure drop across the valves increases with a result- ing increase in throttling loss. First-stage inlet pressure and first-stage flow decrease, and the pressure ratio across the first stage remains constant. Typical expan- sion lines for the high-pressure section of a full-arc ad- mission condensing turbine are shown in Fig. 6.3.
6.4 LAST-STACE RELATIONSHIPS
For the last stage of a condensing turbine or for any turbine with a fixed exhaust pressure, as the inlet pres- sure changes, exhaust pressure remains unchanged, Thus, the pressure ratio changes and Eq. (4) does not apply, Under these conditions, flow varies with pres- sure ratio according to Eq. (1). This is shown graph- ically in Fig. 6.4. However, the last stage of a condensing turbine is designed with nearly critical pressure ratio across i t s nozzle; therefore, small changes in pressure ratio result in no change in the pressure-flow relationship (where p2/p1 is slightly less than critical), or in very small changes (where p2/pI is slightly greater than critical). For all practical purposes, the effect of changes in last-stage pressure ratio can therefore be ignored at design exhaust pressure.
At higher-than-design exhaust pressure, the last- stage flow characteristics become progressively more sensitive to changes in pressure ratio.
6.5 PRESSURE VS. FLOW OVER THE LOAD RANGE
The pressure-flow relationships2 for constant throttle and reheat temperatures, and constant exhaust pres- sure, are plotted in Fig. 6.5. The first-stage pressure- flow relationship is not a straight line, because at reduced loads a larger proportion of the total work is accomplished in the first stage, and the temperature
2Because the pressure-flow relationship can change depending on turbine condition, first-stage pressure should not be used to calculate flow in lieu of measurement of flow. For any stage, it is important to remember that changes in stage pressure-flow relationships are rea- sons for concern.
36
COPYRIGHT American Society of Mechanical EngineersLicensed by Information Handling ServicesCOPYRIGHT American Society of Mechanical EngineersLicensed by Information Handling Services

r ASflE PTC*bS REPORT 88 W' O757b70 0054682 T m
PROCEDURES FOR ROUTiNE PERFORMANCE TESTS OF STEAM TURBINES ASME PTC 6s REPORT-1 988
'throttle
AP across throttle and governing valve
Expansion through
Expansion through remaining
Curve assumes constant throttle pressure and temperature
exhaust pressure
FIG. 6.2 TYPICAL EXPANSION LINES FOR A HIGH-PRESSURE SECTION PARTICAL-ARC ADMISSION, CONDENSING TURBINE
AP across throttle and
Expansion through
Maximum flow Expansion through remaining HP stages
Partial flow
Curve assumes constant throttle pressure and tempereture
, HP section h exhause pressure
S"------)
FIG, 6.3 TYPICAL EXPANSION LINES FOR A HIGH-PRESSURE SECTION FULL-ARC ADMISSION, CONDENSING TURBINE
37
F- P
"=" COPYRIGHT American Society of Mechanical EngineersLicensed by Information Handling ServicesCOPYRIGHT American Society of Mechanical EngineersLicensed by Information Handling Services

ASME P T C * b S REPORT 88 %A.075’7670 0054683 L
ASME PTC 6s REPORT-I 988 PROCEDURES FOR ROUTINE PERFORMANCE TESTS
OF STEAM TURBINES
This curve assumes: Constant stage-inlet pressure Constant stage-inlet temperature
Sonic region 4 Subsonic
I \ O 1 .o
Pressure-Ratio p2Ip1
Y
FIG. 6.4 CONDENSING TURBINE LAST-STAGE STEAM FLOW VS. STAGE PRESSURE RATIO
and pressure entering the second stage is lower than at full load. Because of the lower temperature, Eq. (4) shows that less pressure is required to pass this reduced flow than would have been required if the temperature remained constant. This same trend continues for all stages in the high-pressure turbine, with the 3- to 5- percent deviation from a straight line decreasing for succeeding stages in this turbine section. For a full-arc admission turbine, the pressure-flow relationship for the high-pressure section stages is closer to a straight line. For either type of turbine admission, all stages be- low the reheater discharge have straight-line pressure- flow relationships except the last stage inlet as explained in para. 6.6.
The last-stage inlet pressure at zero flow is equal to the condenser pressure. However, at no-load flow it i s lower than condenser pressure due to the pumping action of the last stage. As the last-stage inlet pressure increases, the flow increases at a greater rate, since the last-stage pressure ratio is concurrently decreasing. As the pressure ratio approaches the critical value, the flow-pressure relationship becomes proportional to the stage-inlet pressure. As the exhaust pressure is in- creased, the deviation from a straight line of the last-
*See para. 6.25(b) for the derivation of Eq. (5).
These curves assume: - Y-
Constant throttle temperature om Constant reheat temperature Constant exhaust pressure
- - - J U
Full-load pressure-, I
2 A I PeXhaust 2 in. Hg ABS
Last stage inlet oressure 3 to 5% deviation from
I
a straight line
1st stage shell pressure partial-arc-admission
Pexhaust 1 in. Hg ABS (design) I
W %Il other stages following 7 the turbine reheat inlet
p e x h a u s t 0.5 in. Hg ABS I
1 O0 Flow, Percent of Full-Load Flow
FIG. 6.5 PRESSURE-FLOW RELATIONSHIP
stage pressure-flow relationship becomes more pronounced.
6.6 VARIATIONS IN OPERATING CONDITIONS
Equations (1) through (4) may be used to study changes in flow to a stage, stage temperature, and stage, pressure when the turbine operating conditions change and governing valve position remains con- stant.
6.7 VARIATION IN THROTTLE PRESSURE
The general flow Eq. (1) can also be applied to the governing valves. At a constant valve- setting, by as- suming that pressure ratio across the valves remains constant, Eq. (4) can be used to show that an increase in throttle pressure results in a proportional increase in flow. The increased flow results in a proportional in- crease in pressure ahead of the first turbine stage. Therefore the pressure ratio across the governing valves remains constant, validating use of Eq. (4). This
38
COPYRIGHT American Society of Mechanical EngineersLicensed by Information Handling ServicesCOPYRIGHT American Society of Mechanical EngineersLicensed by Information Handling Services

r ASME PTCmbS REPORT 88 1$1 0757670 0054684 3 m
PROCEDURES FOR ROUTINE PERFORMANCE TESTS OF STEAM TURBINES
reasoning can be used to show that stage inlet pressure increases in proportion to throttle pressurefor all stages except the last stage of a condensing or other constant exhaust pressure turbine. The pressure ahead of the last stage also increases approximately proportionally to increasing throttle pressure when last stage pressure ra- tio is less than or close to critical. Otherwise an in- crease in throttle pressure does not result in an equivalent increase in pressure ahead of the last stage.
6.8 VARIATION IN THROTTLE TEMPERATURE
If throttle steam pressure and governing valve posi- tion are held constant and the throttle temperature is increased, Eq. (4) shows that the throttle flow de- creases. Flow to the following turbine stages likewise decreases by the same amount. There is essentially no change in pressure ratio across the governing valves or the first stage; consequently, there is no significant change in first-stage inlet or exit pressures for this in- crease in throttle temperature. Similarly, there is no change in first-stage inlet or exit pressures for this in- crease in throttle temperature. Similarly, there is no change in these pressures for a decrease in throttle tem- perature. With one minor exception, the same analysis holds true for the remaining stages in the high-pressure section of the turbine because the stage-inlet tempera- tures will also vary when throttle steam temperature changes,
If reheat steam temperature is held constant (assum- ing adequate reheater outlet temperature control), the decreased high-pressure turbine steam flow which oc- curs with an increase in throttle temperature will result in decreased pressure at the high-pressure turbine exit (cold reheat) and at the inlet to the reheat turbine sec- tion (hot reheat). Accordingly, the total pressure drop across the high-pressure turbine is increased, and the pressure ratios across the last few stages will vary slightly. The effects are relatively minor for thechanges in throttle temperature usually encountered.
6.9 VARIATION IN REHEAT TEMPERATURE
With throttle steam conditions and governing valve position held constant, flow will remain constant with variations in reheat temperature. Applying Eq. (4) to the first reheat stage, an increase in reheat temperature results in an increase in reheat pressure approximately proportional to the square root of the ratio of the abso- lute temperatures before and after the increase. Actu- ally, it is more accurate to use changes in the specific volume to calculate this change in pressure, Eq. (3).
39
ASME PTC 6s REPORT-I 988
This increase in pressure is reflected in all stages down- stream of the reheater discharge, and also causes a de- crease in-total pressure drop across the high-pressure turbine. Correspondingly, adecrease in reheat temper- ature has a reverse effect.
6.10 VARlAT'lON IN AREA OF THE FIRST-STAGE NOZZLE
If the first-stage nozzle area increases due to solid- particle or other erosion, throttle flow will increase for the same steam inlet conditions and governing valve opening. In the case of low loads on a partial-arcadmis- sion turbine, the pressure drop across the first-stage nozzle is greater than critical and steam flow is directly proportional to the nozzle area. However, as flow in- creases, the pressure ahead of the second stage in- creases, causing the pressure drop to become less than critical. With the governing valves wide open, a 1.0 percent change in nozzle area allows only a small frac- tion of 1 .O percentchange in flow, as illustrated in Fig. 6.6.
6,11 VARIATIONS IN STAGE-EXIT PRESSURE
Variations in stage exit pressure, such as those caused by changing reheat conditions or abnormal ex- traction flows, cause the stage pressure ratio to change, and Eqs. (3) and (4) do not apply.
Figure 6.7 shows a variation in stage-inlet pressures as related to changes in stage exit pressures for all stages between the first stage and the last stage. For these intermediate stages, the percent pressure drop across an individual stage is relatively low and permits the application of incompressible-flow theory. For in- compressible flow y is very large. Thus:
Accordingly, the flow Eq. (1) simplifies as follows:
W = 3600 Cq A, (6) *
or, using the equation of state pl v1 = N, , then:
*See para. 6.25(c) for derivation of Eqs. (6) and (7).
COPYRIGHT American Society of Mechanical EngineersLicensed by Information Handling ServicesCOPYRIGHT American Society of Mechanical EngineersLicensed by Information Handling Services

‘ A S M E P T C x b S R E P O R T 88
ASME PTC 6s REPORT-I 988 PROCEDURES FOR ROUTINE PERFORMANCE TESTS
OF STEAM TURBINES
This curve assumes: Constant throttle pressure Constant throttle temperature Partial-arc-admission
Frat ion of %
Less than critical
Greater than critical
Nozzle area, A,
FIG. 6.6 STEAM FLOW VS. FIRST-STAGE NOZZLE AREA
When stage flow remains constant as stage exit pres- sure increases, it i s important to note that the inlet pres- sure also increases, but not as rapidly as does the exit pressure.
6.1 1.1 For a pure impulse stage, its downstream pres- sure is the same as the pressure between the nozzle and rotating blade row, or p2 = p3. The change in up- stream pressure as downstream pressure changes can be calculated from Eq. (7) by assuming the flow re- mains constant as follows:
Constant wheel speed
Stage inlet pressure 7
These curves assume: Constant flow, W , and
Stage Exit Pressure
FIG 6.7 STAGE PRESSURE VS. STAGE EXIT PRESSURE FOR INTERMEDIATE STAGES
1 --=-(L&&” P3 Pí 1-1 P3 (1 2) Pl Pl
Assuming the stage pressure ratio, p3/~1, is 0.8, then
1 - 0.8 = (g) - 1.1 X 0 . 8 ~ ;
Pl
where primed figures symbolize conditions after the downstream pressure changes, Eq. (8) simplifies to:
40
or:
(g)’- 0.88 - 0.2 = O Pi
The positive root of the quadratic equation is:
pi “0.88 k 4- Pl ” -
2 = 1.067
COPYRIGHT American Society of Mechanical EngineersLicensed by Information Handling ServicesCOPYRIGHT American Society of Mechanical EngineersLicensed by Information Handling Services

O
ASME PTCmbS REPORT A B W 0 7 5 7 6 7 0 0 0 5 ~ b B b 7 W . . .
PROCEDURES FOR ROUTINE PERFORMANCE TESTS OF STEAM TURBINES
Thus for a 1 O percent change in p3, pl changes only 6.7 percent.
This change in pl, which is the exit pressure of the preceding stage, creates a similar change in the preced- ing stage inlet pressure. In this manner, the change in the exit pressure of one stage affects the pressure ratios of all upstream stages, but the effect becomes progres- sively smaller for stages further upstream.
As an example, for an eight-stage high-pressure sec- tion of an impulse turbine, the change in exit pressure of each stage fora 1 O percent increase in high-pressure- section exhaust pressure is:
Increase in Exit Stage No. Pressure, %
8 10.0 7 6.7 6 4.5 5 3.0 4 2.0 3 1.3 2 0.9 1 0.6
Thus, in this instance, the pressure after the first stage changes by only 0.6 percent, which results in a very small change in flow. This verifies the assumption of constant flow through a high-pressure turbine section as the exhaust pressure of this section increases,
A similar derivation for a typical reaction turbine shows approximately the same results.
6.12 USE OF TEMPERATURE, PRESSURE, AND
Plots of w / , / x E q . (31, versus flow to the follow- ing stage for the first stage of the machine and for all ex- traction points, as well as for the inlet to the reheat section, are very useful in evaluating the consistency and accuracy of a test. These plots are also very helpful in determining errors in individual test points and any deviation from a horizontal straight line is indicative of such errors,
For units using wet steam, the expression W/- will decrease as the moisture content increases be- cause of the drag effect of the moisture drops on the steam. Experience has shown that this phenomenon can be compensated for by dividing the expression by the square root of one minus the moisture fraction, as follows:
FLOW RELATIONSHIPS
W / &x Ji"
41
ASME PTC 6s REPORT"ï988
Test Dates
FIG. 6.8 PRESSURE OR CAPABILITY CURVE VS. CHRONOLOGICAL TEST DATES
Any change in the mechanical condition of a steam turbine which changes the flow from a given stage to subsequent stages, will change the pressure-flow rela- tionship of the given stage. For interpretation of test de- viations see paras. 6.24 through 6.24.9 which l ist typical reasons for deviations of steam turbine perfor- mance from reference, or design level.
6.13 CONSTRUCTION OF A CHRONOLOGICAL PRESSURE CURVE
Chronological plots of selected turbine stage or shell absolute pressures are also useful. These curves are based on the relationship that steam flow is propor- tional to theabsolute pressure ahead of a stage, a group of stages, or a section of the turbine, except for small changes in specific volume due to changes in absolute temperature which may occur at the corresponding lo- cation. This can be seen by reference to Eqs. (2) and (41, using the assumption that v1 and Tl do not change sig- nificantly with changes in flow. It i s important that all data to be plotted chronologically be taken at the same governing valve position, preferably with valves wide open, and with the same cycle arrangement. Cycle var- iations should be recognized as disturbing influences that could invalidate comparisons. However, small variations in feedwater heater performance have mini- mal effect on the flow-pressure relationship.
6.13.1 Figure 6.8 exemplifies achronological pressure curve. The ordinate of the curve utilizes various se- lected steam pressures, psia, representing turbine stage or shell pressures. The stage or shell pressures ob- served during a test require correction, as described below, for departures from reference steam conditions,
COPYRIGHT American Society of Mechanical EngineersLicensed by Information Handling ServicesCOPYRIGHT American Society of Mechanical EngineersLicensed by Information Handling Services

ASME PTC*bS REPORT 8B IIA
ASME PTC 6s REPORT-I 988
6.13.2 The first-stage pressure observed during a test on the high-pressure section of a reheat turbine, or the stage or shell pressure for any stage of a non-reheat tur-
..., bine, should be corrected to reference conditions by the following equation:
Pd P C = Po x pt (1 6 )
where pc = corrected pressure for plotting, psia po =test stage or shell pressure, psia p , = test throttle pressure, psia Pd = design, or reference, throttle pressure, psia
For a feedwater heating extraction from an interme- diate stage in the high-pressure turbine section, the measured stage or shell pressure should also be cor- rected by use of this same equation. Although theoreti- cally incorrect, Eq. (1 6) is a very close approximation.
6.13.3 For stage or shell test pressures at, or following, the inlet to the reheat section of a turbine, and for the exit from the last stage of the high-pressure section, ad- ditional corrections must be made for variations in throttle temperature and reheat temperature, and the correction equation becomes:
throttle pressure pc = po (and correction temperature) x (:::;:rature)
correction
or
where Vd = design or reference throttle specific volume,
v, = test throttle specific volume, ft3/lbm v,, = specific volume at test temperature and test
pressure at inlet to reheat stop valves, ft3/lbm Vd, = specific volume at design reheat temperature
and test pressure at inlet to reheat stop valves, f t 3 / l bm
ft3/1 bm
6.13.4 Typical reasons for deviations in stage pressures from reference or design level are given in Fig. 6.9 and paras. 6.24 through 6.24.9. The reasons may be any
*See para. 6.25(d) for derivation of Eq. (1 7).
0757670 00511687 7 m
PROCEDURES FOR ROUTINE PERFORMANCE TESTS OF STEAM TURBINES
one of the possibilities or a combination of them in ad- dition to a possible change in steam flow.
6.14 CONSTRUCTION OF A STAGE PRESSURE VERSUS FLOW CURVE
Figure 6.1 O is an example of a stage pressure versus flow curve. The construction is based on the following:
Ordinate: Various selected steam pressures, psia, representing turbine stage or shell pressures, such as first-stage pressure, reheat turbine bowl (or reheat in- let) pressure, and crossover pressure. Stage or shell pressures.observed during a test should be corrected as outlined in paras. 6.13.2 and 6.13.3.
Abscissa: Throttle steam flow to the turbine, cor- rected to reference, or design, conditions as follows:
= J- where
W, = corrected throttle flow, Ibm/h W, =test throttle flow, Ibmh
The other terms of this equation are defined in paras. 6.1 3.2 and 6.13.3.
6.15 TURBINE SECTION EFFICIENCIES
In this report, the term section efficiency refers to the overall efficiency of a turbine section from inlet to ex- haust, and is calculated as shown in Fig. 5-3. The sec- tion efficiency thus accounts for entrance losses and stage efficiencies.
6.16 STAGE EFFICIENCY
Understanding the performance of a single stage is an excellent basis for analyzing the entire turbine. Fig- ure 6.1 shows a single-stage steam path. The pressure upstream of the nozzle or stationary row is designated as p , , the pressure between the nozzle and the rotating row as pz, and the pressure downstream of the rotating row asp,. As the flow passes through the nozzle, its ve- locity is increased and its direction is changed. The flow passing through the rotating row is changed in di- rection. The amount of change in relative velocity with respect to the rotating row is dependent upon the de- sign of the stage. The relationship between p 2 and p3 determines the amount of stage reaction; that is, if p2 is equal to p3, the stage is an impulse design. If pz is
COPYRIGHT American Society of Mechanical EngineersLicensed by Information Handling ServicesCOPYRIGHT American Society of Mechanical EngineersLicensed by Information Handling Services

ASME P T C * b S REPORT 88 U . 0 7 5 7 6 ; 7 0 0054688 O m ~ . ~~
PROCEDURES FOR ROUTINE PERFORMANCE TESTS OF STEAM TURBINES
F"LI I s FSSP constant?
Is stage or shell yessure constant?
ï Stage or shall pressure
A Increased Decreased
Condition 1 Condition 2
ASME PTC 6s REPORT-1988
FSSP = first stage shell pressure
FSSP
Increased
1
i 3 7 Stage or shell pressura
Increased Remained Decreased the same I
Condition 2 Condition 2
same amount FSSP FSSP c Condition 3 Condition 1 Condition 2
Decreased c Stage or shell pressure
Increased Remained Decreased
Condition 1 Condition 1
t Less than Mora than APProximatelY the
FSSP same amount as FSSP +
Condition 1 Condition 2 Condition 4
Condition 1 Conditlon 2 Condition 3 Condition 4
(1) Possibilltjr of (1) Possibility of flow path restriction flow path restriction downstream of upstream of pressura location pressure location
(2) Possibility of (21 Possibility of flow path area flow path area increase upstream of Increase downstream of pressure location pressure location
(3) Possibility of (3) Possibility of decreased extractfon increased extraction steam flow a t steam flow a t or upstream of or upstream of pressure location pressura location
(1) Apparent steam flow increase
(1 1 Apparent steam flow decrease
FIG. 6.9 CORRECTED PRESSURE DEVIATION INTERPRETATJONS AT CONSTANT CONTROL VALVE OPENING (REFER TO PARAS. 6.13.4 AND 6.24 THROUGH 6.24.9)
43
COPYRIGHT American Society of Mechanical EngineersLicensed by Information Handling ServicesCOPYRIGHT American Society of Mechanical EngineersLicensed by Information Handling Services

ASME P T C * b S REPORT B B m 0757670 0054687 2 m
ASME PTC 6s REPORT-I 988
Steam Flow to Turbine
FIG. 6.10 STAGE PRESSURE VERSUS THROTTLE STEAM FLOW
higher than p3, then the stage is a reaction design. The percent reaction depends on the amount of pressure drop taken across the rotating row.
6.16.1 In Fig. 6.1 the velocity of steam discharging from the nozzle is indicated as V,. In order to deter- mine the direction and magnitude of the entering steam velocity with respect to the rotating row, it is necessary to subtract vectorially from V, a vector V,v which represents the wheel speed of the rotating row. The steam velocity entering the rotating row is indi- cated as V,. Figure 6.1 shows that the angle with re- spect to the axial direction is smaller for V, than for V,. Since the kinetic energy varies as the square of the ve- locity, the kinetic energy of the steam entering the ro- tating row is smaller than that leaving the nozzle. For an impulse design, the entering rotating-row kinetic energy is approximately one-quarter of the nozzle-exit energy. For a reaction design, the entering rotating-row kinetic energy is a larger fraction of the nozzle-exit en- ergy, which in turn is smaller than for an impulse de- sign because the pressure drop across the stage divides evenly between the stationary and rotating rows. The discharge velocity from the rotating row is represented by V,. To find the absolute velocity leaving the stage, again the wheel speed is subtracted vectorially to give V,. The design of the stage is such that V, is kept as axial as possible, in order to keep the kinetic energy in the leaving steam to a minimum, thus maximizing the ab- sorption of energy by the rotating row.
6.16.2 It is well to consider the characteristic of a single stage as the wheel speed varies. Although seemingly a peculiar approach to the operation of a constant-speed
PROCEDURES FOR ROUTINE PERFORMANCE TESTS OF STEAM TURBINES
turbine, it lends understanding to the changes in tur- bine characteristics. Similar reasoning can be applied when other parameters are changed. If the wheel speed is decreased, V, will increase and will enter the rotating row at an angle different from the design angle, causing an increase in loss as the flow passes through the rotating row. Also, when wheel speed decreases, V, increases and results in an increase in leaving loss. If the wheel speed is increased, the angle at which the flow enters the rotating row will change and will a[so increase leaving loss. The efficiency of a single stage plotted against wheel speed is shown in Fig. 6.1 1. The curve is fairly flat near the design point; that is, for a small change in speed, there is a relatively small change in efficiency.
6.17 HIGH-PRESSURE SECTION EFFICIENCY
Efficiency of a partial-arc admission high-pressure turbine section varies as a function of flow as shown in Fig. 6.12.
The efficiency between valve points (valve loops) is poorer than the efficiency of the locus of valve points primarily because of the throttling loss through one or more governing valves that restrict the flow. The valve loops get progressively larger with more impact on effi- ciency as load is reduced because a larger percentage of the remaining flow is throttled. The first stage is the only stage where the nozzle area can be varied. When the turbine is operating with valves wide open, the pressure ratio across the first stage is about 0.8 and the flow is maximum, usually referred to as the maximum expected flow. When a valve is closed, the area through which flow can pass into the first stage is de- creased and, therefore, the total flow will decrease. Since the flow is decreased, the pressure ratio across the first stage decreases, which increases the theoreti- cal steam velocity (V,) and, therefore, the ratio of wheel velocity to steam velocity decreases. This results in the flow entering the rotating row at an angle different from thedesign angle and causes an increase in leaving loss, with attendant decrease in efficiency.
6.17.1 The performance of the other stages in the high- pressure section of the turbine does not change very much as the governing valves are closed sequentially, because the inlet pressure to the second stage de- creases with the decreased flow, as does also the inlet pressure to the third stage, resulting in nearly constant pressure-ratio across the second stage. This same rea- soning applies to the other stages in the high-pressure section, and therefore, their efficiency remains sub- stantially constant.
COPYRIGHT American Society of Mechanical EngineersLicensed by Information Handling ServicesCOPYRIGHT American Society of Mechanical EngineersLicensed by Information Handling Services

ASME PTC*bS REPORT B8 E 0759670 0054670 7 W
PROCEDURES FOR ROUTINE PERFORMANCE TESTS OF STEAM TURBINES
Wheel Speed
FIG. 6.11 SINGLE-STAGE EFFICIENCY VERSUS WHEEL SPEED
6.17.2 At a constant throttle pressure, efficiency of a full-arc admission high-pressure turbine section varies as a function of flow as shown in Fig. 6.1 3. The pres- sure ratio across each stage remains constant as flow varies, and stage efficiencies remain nearly constant. As the governing valves close to reduce flow, throttling loss across the valves increases. This loss accounts for the nearly linear decrease in efficiency as flow is re- duced, Full-arc admission turbines are sometimes op- erated over the load range with valves wide open, and flow control is achieved by varying steam generator pressure. In this variable pressure mode, the throttling loss is eliminated, and high-pressure turbine section ef- ficiency remains nearly constant as does pressure ratio.
6.18 INTERMEDIATE-PRESSURE SECTION EFFI- CIENCY
The efficiency of stages in the intermediate-pressure (reheat) section does not change with changing flow since these stages also operate at a constant pressure ra- tio and thus at a constant ratio of wheel velocity to steam velocity. See paras. 5.6 and 6.24.7.
Flow,,or Pressure Ratio, or Flow Ratio
ASME PTC 6s REPORT-I988
Single-valve operation of partial-arc unit
FIG. 6.12 PARTIAL-ARC ADMISSION UNIT (HIGH-PRESSURE TURBINE SECTION EFFICIENCY
VS. FLOW OR PRESSURE PARAMETER)
or steam velocity. Variations in exhaust steam velocity and volumetric flow may be due to variations in either mass flow or condenser pressure, and this curve ap- plies to both cases. Again, variations in leaving loss and losses associated with improper rotating-row entrance angle account for the variations in efficiency.
6.19.1 For low-pressure turbines operating in nuclear cycles where extra water removal from the steam path is significant, low -pressure efficiency is not an appro- priate indicator of performance, More effective water removal leads to a lower indicated overall efficiency, which i s a contradiction. Therefore, it i s recommended that low pressure turbine performance for this case be described in terms of effectiveness3, E , where
Ah Ah + TOAS
E =
Ah = sum of actual Btu work for all of the individual
AS = sum of entropy changes for all of the Ah ex-
7, = absolute temperature, “R, of saturation at the
expansions in the low pressure steam path.
pansions used above.
low pressure turbine exhaust pressure.
6.19 LOW-PRESSURE SECTION EFFICIENCY
Figure 6.14 shows the variation of low-pressure tur- bine efficiency versus exhaust steam volumetric flow
3Theconcept of the effectiveness was reported by J. H. Keenan in “A Steam Chart for Second Law Analysis,’’ Mechanical Engineering, Vol. 54,1932, pp, 195-204, and is referred to in some textbooks on thermodynamics.
45
COPYRIGHT American Society of Mechanical EngineersLicensed by Information Handling ServicesCOPYRIGHT American Society of Mechanical EngineersLicensed by Information Handling Services

ASME PTC*bS REPORT 8 & . W 0757670 005qb7L O m '
ASME PTC 6s REPORT-I 988
Governing valve wide open
o I c - t .- al U i
PROCEDURES FOR ROUTINE PERFORMANCE TESTS OF STEAM TURBINES
throttle pressure
Exhaust Annulus Volumetric Steam Flow or Steam Velocity
Flow, or Pressure Ratio, or Flow Ratio
FIG. 6.13 FULL-ARC ADMISSION UNIT (HIGH-PRESSURE TURBINE SECTION EFFICIENCY
VS. FLOW OR PRESSURE PARAMETER)
The mechanics of the definition of effectiveness are il- lustrated in Fig. 6.15. Effectiveness should be plotted versus exhaust volumetric flow or exhaust annulus ve- locity for comparison with expected values or with other performance.
6.20 USE OF ENTHALPY-DROP EFFICIENCY CURVES
Turbine-section enthalpy-drop efficiencies based on periodic tests may be chronologically plotted. The fol- lowing suggestions are recommended in the construc- tion of such plots:
(a) For a high-pressure turbine section which in- cludes governing valves operated to regulate flow, the best pressure ratio index of high-pressure section effi- ciency is first-stage pressure over throttle pressure. Al- ternately, section efficiency may be plotted against the ratio of section exhaust pressure to throttle pressure. Tests for chronological plots must always be con- ducted at the same governing valve opening for these turbine sections to avoid the variation shown in Figs. 6.12 and 6.13.
(b) For turbine sections which do not contain gov- erning valves used to control flow, such as the
FIG. 6.14 LOW PRESSURE TURBINE SECTION EFFICIENCY VERSUS EXHAUST STEAM FLOW OR
VELOCITY
intermediate-pressure section which directly follows the reheat inlet, or a high-pressure turbine section op- erated with variable throttle pressure, turbine section efficiency is relatively constant over the load range and the requirements in (a) above do not apply.
6.20.1 Enthalpy-drop efficiencies may be plotted throughout the load range of a turbine. Such a plot, based on a series of tests, will assist in the turbine per- formance analysis. These efficiencies may be plotted as a function of pressure ratio, certain stage pressures, or flow ratio, each of which is discussed in the con- struction of the abscissa of this curve. A typical plot of partial-arc admission high-pressure-turbine section ef- ficiency is shown in Fig. 6.12 and a plot of full-arc ad- mission high-pressure turbine section efficiency at a constant throttle pressure is shown in Fig. 6.13. Con- struction is based on the following:
Ordinate: Enthalpy-drop efficiency. For calcula- tions of enthalpy-drop efficiencies, see paras. 5.3 and 6.1 5.
Abscissa: Absolute pressure is used for all compari- sons.
P first stage
(a) The pressure ratio, pthroale is a ratio of the high-pressure turbine first-stage shell pressure, to the throttle pressure. This ratio is an excellent basis for comparing tests.
46
r-- \ COPYRIGHT American Society of Mechanical EngineersLicensed by Information Handling ServicesCOPYRIGHT American Society of Mechanical EngineersLicensed by Information Handling Services

r ~
ASME PTCxbS REPORT 88 m 0759b70 005Yb72 2 m
PROCEDURES FOR ROUTINE PERFORMANCE TESTS OF STEAM TURBINES
h
S
2 X A h ;
1 = 1 ELP =
FIG. 6.15 ILLUSTRATION OF LOW PRESSURE TURBINE EFFECTIVENESS
P exif (b) The pressure ratio, PthroNle i s a ratio of the
high-pressure-turbine-section exhaust pressure .to the throttle pressure. At full load, changes in main and re- heat steam temperature do not significantly affect the high-pressure-turbine efficiency as it relates to high- pressure-ratio. At lower loads, temperature changes have a greater effect but not an appreciable one.
(c) High-pressure-turbine first-stage shell pressure, corrected to standard throttle conditions.
(d) Reheat-bowl pressure corrected to standard throttle and reheat conditions. It can serve as the ab- scissa for the curve showing efficiency of the intermediate-pressure section which follows the reheat inlet.
(e) A ratio of test flow, corrected to reference or de- sign conditions, divided by the valves-wide-open steam flow, if available. It may also serve as the ab- scissa. The test flow must be corrected for departures from reference or design conditions by the following multiplying factor:
ASME PTC 6s REPORT-I 988
Multiplying Factor = 1 /T T t x - (20)
where P d = design throttle pressure, psia pL = test throttle pressure, psia v, = test throttle specific volume, ft3/1bm
Vd = design throttle specific volume, ft3/lbm
6.20.2 Turbine section efficiencies may deviate from normal reference data due to the following.
(a) A change in the slope of the test high-pressure efficiency curve from the reference, due to a greater de- cline in turbine section efficiency at lower loads than at full load, is indicative of a decline in the performance of the governing stage in the turbine.
(b) An overall efficiency decline in the turbine sec- tion tested may result from extensive packing damage, deposits on blading, and damage to the blading.
For further interpretation refer to paras. 6.24 through 6.24.9.
6.21 TURBINE CAPABILITY TESTS
Turbine capability test results plotted chronologi- cally are of considerable assistance in detecting a de- cline in turbine performance, Often such curves are of important historical value, not only in turbine perfor- mance diagnostics, but also in correlating turbine per- formance with other plant operating experiences. Tests during initial operation of a turbine serve as a basis for future performance evaluation. Plots of tests immedi- ately before and after turbine inspection and repair are valuable indices which reflect performance changes.
6.21.1 A typical chronological plot for a series of capa- bility tests is shown by Fig. 6.8. Curve construction is based on the following:
Ordinate: Percentage change in turbine output as related to reference output. Measured output must be corrected for any deviation in initial, reheat, and ex- haust steam conditions from the reference condition, Measured output must also be corrected for any other conditions.which influence output as outlined in ap- propriate sections of this Report.
Abscissa: Usually a calendar scale using the test date as point of entry. The number of observations, as well as the time interval between tests, depends upon the judgment of personnel involved.
47
COPYRIGHT American Society of Mechanical EngineersLicensed by Information Handling ServicesCOPYRIGHT American Society of Mechanical EngineersLicensed by Information Handling Services

ASME
ASME PTC 6s REPORT-1 988
6.21.2 If, during an internal inspection, eroded first- stage nozzles are replaced or repaired such as to re- duce the nozzle area, there may be a reduction in flow capability that may lower the output below that previ- ously achieved. See para. 6.24.1 (c). For further inter- pretation of the significance of decreasing turbine capability, refer to paras. 6.24 through 6.24.9.
6.22 SEALING AND LEAK-OFF-FLOWS AND TEM- PERATURES
A chronological plot of sealing and leak-off flows and temperatures is most helpful in determining the physical condition of associated seals, packings, bal- ancing pistons, control-valve-stem bushings, and simi- lar items. In an abbreviated test, seal and leak-off flows can readily be determined only if they are external to the turbine casing and a flow element can be installed; Usually, such flows constitute a small percentage of the energy input to the turbine and must increase con- siderably before any significant decline in turbine per- formance is experienced. Where seal and leak-off flows discharge into extraction steam lines, particu- larly those conveying superheated steam, the tempera- ture of the steam downstream of such junction is a helpful index of leakage, and these leakage flows often can be determined by heat balance around the junc- tions. For the significance of changes in flow or temper- ature, refer to paras. 6.24 through 6.24.9.
6.23 PERIODIC TURBINE HEAT-RATE TESTS
Turbine heat rate tests at selected governing-valve positions may be chronologically plotted to trend tur- bine performance. The numerical value of the heat rate, in Btu per hphr or per kWhr, or its deviations from its reference value will serve equally well. Any heat rate values must be corrected for deviations from refer- ence throttle steam conditions, reheat steam condi- tions, exhaust pressure and other cycle characteristics. Appropriate sections of this Report should therefore be consulted as required.
6.23.1 Turbinesteam ratedata, in Ibmof steam per hph or per kWh, may be advantageously presented in curve form. Such data may be plotted chronologically for given governing and extraction valve positions. For varying turbine outputs, steam rate data may be plotted as a function of output, steam flow, or other selected variables. Steam rate data must be corrected to refer- ence or design conditions, using appropriate curves
PROCEDURES FOR ROUTINE PERFORMANCE TESTS OF STEAM TURBINES
furnished by the turbine manufacturer or established by acceptable tests. Construction and interpretations of steam rate curves should follow general recommenda- tions presented for such curves in this Report.
6.24 TYPICAL REASONS FOR DEVIATIONS OF STEAM TURBINE PERFORMANCE FROM REF- ERENCE OR DESIGN LEVEL
Before a turbine i s inspected for internal damage or deposits, all conditions external to the turbine should be carefully checked to assure that departures from ref- erence performance are not due to external causes, such as cycle irregularities including leaky valves or other isolation problems, inaccurate instruments, ob- servations, and/or calculations.
6.24.1 A change in mechanical conditions which changes the turbine steam-inlet areas may occur, such as:
(a) first-stage blading damage resulting in partial closing of the steam-flow area, thus reducing flow through the turbine;
(b) impairment or maladjustment of control valve(s), or governing system;
( I ) a valve may fail to operate because of a broken component;
(2) valves may not operate in proper sequence, or with correct lift, due to improper reassembly or adjust- ment of control gear after inspection. Either could result in restricted steam admission or in excessive throttling throughout the load range.
(c) erosion of first-stage nozzles, thus increasing steam admission area, steam flow, and output.
6.24.2 Thermodynamic deformation of the cycle due to changes in extraction steam demands, or due to any change in steam or water flow to, or from, the turbine cycle causes a departure in performance level that ap- pears to remain at a constant percentage difference from reference level.
6.24.3 Mechanical damage to internal seals, resulting in an increase in steam leakage, may occur suddenly during abnormal operation, or over a relatively long period of time, Stage steam pressures usually decrease due to this type of damage. Damage associated with an accident is reflected by a sudden departure of perfor- mance level from its reference value. Damage to leakage-control clearances is a more dominant factor
COPYRIGHT American Society of Mechanical EngineersLicensed by Information Handling ServicesCOPYRIGHT American Society of Mechanical EngineersLicensed by Information Handling Services

PROCEDURES FOR ROUTINE PERFORMANCE TESTS OF STEAM TURBINES
in the high-pressure section of a turbine than in the low-pressure section and thus low-pressure spindle rubs have less effect on performance than rubs in other sections of the turbine.
6.24.4 Blading deposits which reduce steam passage areas may occur and often result in an increase in shell or stage steam pressures, accompanied by a gradual performance decline. Washing techniques should be discussed with the turbine manufacturer. Data care- fully taken immediately before and after washing should reflect effectiveness of washing procedures.
The amount of deposit which can reduce turbine section efficiency from 1 to 3 percentage points ordi- narily causes an increase in stage pressures of from 0.25 percent to 0.75 percent. Care must be exercised in making these pressure measurements.
6.24.5 Increase of leak-off steam flows often results in steam with high available energy being bypassed to lower sections of the turbine. Some high-pressure-seal and leak-off flows may bypass the reheater and conse- quently fail to gain the thermodynamic advantage of reheat. This usually shows up as a decrease in turbine output at any given governing valve setting.
6.24.6 Overload valve leakage on turbines equipped with these valves, permits steam with high available energy to bypass certain turbine stages resulting in an increase in both steam rates and heat rates.
6.24.7Anychange in performance of the intermediate- pressure turbine section due to deposits or internal damage, will decrease the efficiency of this section by the same amount at light loads as at full load, and will decrease the overall capability of the turbine unit. For the overall heat-rate effect of a decrease in intermediate-pressure turbine efficiency, see Section 9, para. 9.8(c). On some units, an increase in the inter- nal leakage from the high-pressure section to the intermediate-pressure section can result in misleading improvements of intermediate-pressure turbine effi- ciencies; whereas the true efficiency of the intermediate-pressure turbine section may not have changed.
6.24.8 Damage to, or loss of, blading in the low- pressure section of the turbine usually cannot be de- tected by enthalpy-drop methods. Depending upon the extent of damage, this may appear as an offset in
ASME PTC 6s REPORT-I988
stage pressures, capability, heat rate, and overall plant performance.
6.24.9 Governing valve-stem clearances may decrease due to deposits on stems, thus reducing expected leak- off flows.
6.25 DERIVATION OF EQUATIONS (a) Derivation of Eq. (1): The general energy equation for steady flow in a noz-
zle is:
(1 a)
* , In the case of V, << V, or V, i s negligibly small,
(1 b)
(1 c)
V: = 2gI ( h l - h,)
For a frictionless nozzle,
h, - h, = - 5 , vdp = C, ( T , - TJ 2
From the equation of state of an ideal gas,
PV = RT
and for an isentropic process,
pvY = constant
Combining Eqs. (Id) and (le),
Since,
Y cp =- R Y-1
equation (1 b) becomes,
r 7-1
49
COPYRIGHT American Society of Mechanical EngineersLicensed by Information Handling ServicesCOPYRIGHT American Society of Mechanical EngineersLicensed by Information Handling Services

ASME PTC*bS .~ REPORT 8 8 W 0757b70 0054695 8 m
ASME PTC 6s REPORT-I988
0 r/
PROCEDURES FOR ROUTINE PERFORMANCE TESTS OF STEAM TURBINES
(b) -Derivation of Eq. (5): Maximum flow rate of a nozzle is:
W,,, = 3600 C, X A,, X
From equation of continuity:
VA, W = - X 3600
v2
and since,
Pl r KT1 Pl r 1
v2 = v1 (,) (1 i)
Mass flow rate is written,
1
W = 3600 A,, (”)’ v, KT1 Pl
The maximum value can be found by differentiating W with respect to and setting the derivative equal
(1 h) to zero; thus, Pl
(c) Derivations of Eqs. (6) and (7): . For an isentropic process, pvy = constant Differentiating it with respect to v,
7-1 PlVl _I
“(P V Y ) = o U
dv
dP dv
pyvY-l + VY - = o
where -- is the bulk modulus of compression dP
W = 3600 C,A,, dv - V
50
COPYRIGHT American Society of Mechanical EngineersLicensed by Information Handling ServicesCOPYRIGHT American Society of Mechanical EngineersLicensed by Information Handling Services
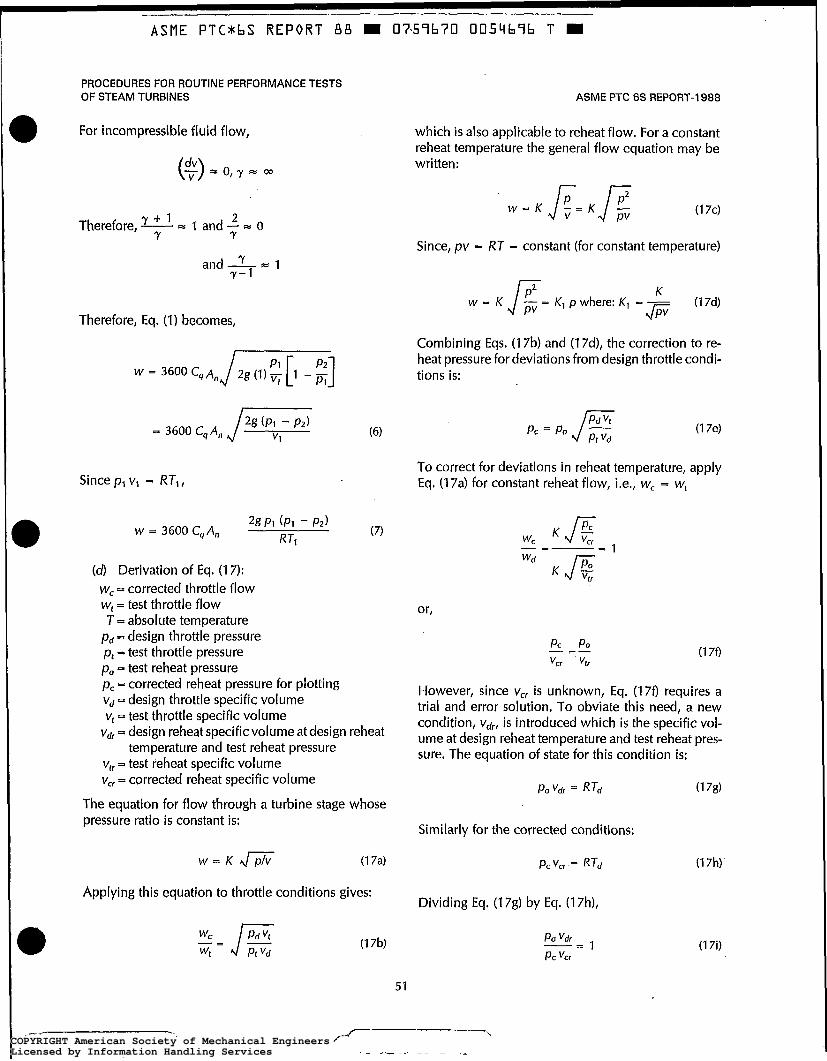
r
B
B
0
ASME PTC*bS REPORT dB m 07~54b70 005q696 T m
PROCEDURES FOR ROUTINE PERFORMANCE TESTS OF STEAM TURBINES
For incompressible fluid flow,
Therefore, - = 1 a n d - z o Y t . 1 2 Y Y
and - = Y- 1 Y 1
ASME PTC 6s REPORT-1 988
which is also applicable to reheat flow. For a constant reheat temperature the general flow equation may be written:
w = K V PV (1 7c)
Since, pv = KT = constant (for constant temperature)
Therefore, Eq. (1) becomes,
w = K J p v = PZ K1 p where: K1 = - K
f i (1 7 4
= 3600 CqAn J 2 g (Pbl- P21
Since pl v1 = RT,,
W = 3600
( 6 ) Derivation of Eq. (I 7): W, = corrected throttle flow W, = test throttle flow T = absolute temperature
P d = design throttle pressure p, =test throttle pressure po = test reheat pressure pc = corrected reheat pressure for plotting Vd = design throttle specific volume v, = test throttle specific volume
Vd, = design reheat specific volume at design reheat
v,, = test reheat specific volume vcr = corrected reheat specific volume
temperature and test reheat pressure
The equation for flow through a turbine stage whose pressure ratio is constant is:
w = K m (1 7a)
Applying this equation to throttle conditions gives:
Combining Eqs. (1 7b) and (1 7d), the correction to re- heat pressure for deviations from design throttle condi- tions is:
PC = Po J;::: - (1 7e)
To correct for deviations in reheat temperature, apply Eq. (1 7a) for constant reheat flow, ¡.e., W, = W,
(1 70
However, since v,, is unknown, Eq. (17f) requires a trial and error solution. To obviate this need, a new condition, Vdrl is introduced which is the specific vol- ume at design reheat temperature and test reheat pres- sure. The equation of state for this condition is:
Similarly for the corrected conditions:
51
COPYRIGHT American Society of Mechanical EngineersLicensed by Information Handling ServicesCOPYRIGHT American Society of Mechanical EngineersLicensed by Information Handling Services

ASME PTC*bS REPORT & B W 0759b70 005Llb97 L W
ASME PTC 6s REPORT-I 988 PROCEDURES FOR ROUTINE PERFORMANCE TESTS
OF STEAM TURBINES
~~
Enthropy, S
FIG. 6.16 RELATIONSHIPS OF Vd,, V,,, AND
Combining Eqs. (1 7f) and (1 7i)
P o = I
P o ($).r
which reduces to
(1 7j)
Substituting Eq. (1 7k) in Eq. (1 7f)
The total correction is obtained by combining Eqs. (1 7e) and (1 7f)
COPYRIGHT American Society of Mechanical EngineersLicensed by Information Handling ServicesCOPYRIGHT American Society of Mechanical EngineersLicensed by Information Handling Services

ASME P T C * b S R E P O R T 88 W 0757b70 0054678 3 U
PROCEDURES FOR ROUTINE PERFORMANCE TESTS OF STEAM TURBINES ASME PTC 6s REPORT-I 988
ASME P T C * b S R E P O R T 88 W 0757b70 0054678 3 U
PROCEDURES FOR ROUTINE PERFORMANCE TESTS OF STEAM TURBINES
O
a
SECTION 7 - TEST FOR NONEXTRACTION CONDENSING TURBINE WITH SUPERHEATED INLET STEAM
7.1, INTRODUCTION
(a) A steam rate test is recommended for routine performance monitoring of nonextraction condensing turbines.
(b) Test procedures and instrumentation are listed below for the recommended test. Results obtained with the recommended procedures and instrumenta- tion are repeatable within k0.5 percent when the driven element is an electric generator. (See para. 7.8 for derivation of this value and paras. 3.8 and 4.4.1 through 4.4.5 for additional discussion of test repeat- ability.) Repeatability of test results for mechanical drive turbines will depend on the type of driven ele- ment and the output measurements.
(c) The performance tests recommended in this Section will generally require three observers, includ- ing a test supervisor.
7.2 INSTRUMENTATION REQUIREMENTS
(a) Special test instrumentation is recommended
Initial pressure Initial temperature First-stage pressure Exhaust pressure
9 Power output, electrical or mechanical Condensate flow Condensate temperature
The recommended instruments will measure the critical variables with sufficient accuracy for test results that are repeatable to the percentage given in para, 7.1 (b), if the Section 4 recommendations are observed.
for the following critical variables:
( I ) Pressure. See para. 4.5. (2) Temperature. See para. 4.6. (3) Condensafe Flow. See paras. 4.4.1 through
4.4.3. Alternately, weighing tanks or volumetric mea- suring tanks may be used following the recommenda- tions in PTC 6-1 976, para. 4.20.
(4) Power Output (a) Electrical. See para. 4.2.
(b) Mechanical. See para. 4.3. (5) Secondary Flows. See para. 4.4.8. (6) Leakages. See para. 4.9, (7) Storage Changes. See para. 4.9. Levels mea-
sured to the closest one-eighth in. from a known refer- ence point.
(6) For the use of manufacturer’s data, see para. 4.1 1.
7.3 INSTRUMENT LOCATIONS
The location of instruments for measuring primary and secondary variables are given on Fig. 7.1, Items to be estimated from manufacturer’s data are also indi- cated on this figure.
7.4 ISOLATION PROCEDURES
See paras. 3.2.1. through 3.2.7.
7.5 CONDUCT OF THE TEST
For turbines with multiple governing valves, the test should be made at a valve point. (See para. 5.1 .) The general conduct of the test should be in accordance with para. 3.4. Turbine steam rate test should be of two hour duration.
7.6 CALCULATION OF TEST RESULTS
(a) Data Preparation and Calculations. Raw data should be examined for consistency and reliability. Paragraph 3.5 should be used as a guide for data reduc- tion and calculation techniques.
(b) Formula. Steam rate, Ibm per kWhr or Ibm per hphr, is found from the following formula with nomen- clature as given in Section 2.
Steam rate = W, / P g
53
COPYRIGHT American Society of Mechanical EngineersLicensed by Information Handling ServicesCOPYRIGHT American Society of Mechanical EngineersLicensed by Information Handling Services

ASME PTC 6s REPORT-I 988
Legend
0 - primary measurement 0 - secondary measurement A - estimated value p - pressure, psia t -temperature, OF W - flow, I b d h kW- kilowatts hp - horsepower
Throttle
1 Valve-stem I u
PROCEDURES FOR ROUTINE PERFORMANCE TESTS OF STEAM TURBINES
Generator
Driven Unit Turbine
Seal steam
\ Condenser
O M I Miscellaneous flows Change in
hotwell level
*NOTE: The flow at this point may be measured with either a nozzle (as indicated), an orifice, or weighing or volumetric measuring tanks (see para. 7.2).
FIG. 7.1 INSTRUMENT LOCATIONS
(c) Test Correction Factors. Correction factors in (cf) Data Plots andlnterpretation of Trends. For sug- the form of divisors may be determined from the manu- gested chronological plots designed to assist in the facturer's data or from previous tests to correct steam analysis of test data, refer to Section 6. Increasing cor- rate and output for deviations from specified valu-es of rected steam rates at the same valve point are indica- throttle pressure, throttle temperature, and exhaust tive of deteriorating turbine performance. See para. pressure. 6.24 for possible causes.
COPYRIGHT American Society of Mechanical EngineersLicensed by Information Handling ServicesCOPYRIGHT American Society of Mechanical EngineersLicensed by Information Handling Services

ASME PTC*bS REPORT 88 B 0753670 005q700 8 m
PROCEDURES FOR ROUTINE PERFORMANCE TESTS OF STEAM TURBINES
7.7 SAMPLE CALCULATIONS
Throttle
1 O0
635,610 Ibm/h 205.2 m i a 491.70F 1263.8 Btullbm
Ibrn/h
Turbine Generator "
I
ASME PTC 6s REPORT-I 988
54,500 kW 84% pf 5.0 psig H2
Increase in hotwell
634,600 Ibrn/h
Barometric pressure = 14.7 psia
Specified conditions:
.Initial pressure Initial temperature Exhaust pressure Hydrogen pressure Power factor
185 psig 500 "F 1.5 in. Hg abs. 0.5 psig 0.8
Reference steam rate: 11.63 IbmkWhr based on value read from valve-point locus curve at generator corrected output
Throttle flow: -
Measured condensate flow Increase in hotwell storage Hotwell pump gland leakage Valve stem leakage Gland leakage
634,600 Ibm/hr 400 Ibm/hr 31 O Ibm/hr 200 Ibm/hr 100 Ibm/hr
635,61 O Ibm/hr
COPYRIGHT American Society of Mechanical EngineersLicensed by Information Handling ServicesCOPYRIGHT American Society of Mechanical EngineersLicensed by Information Handling Services

ASME PTC*bS REPORT 88 W . 0 7 5 7 6 7 0 0054703 T m
ASME PTC 6s REPORT-I 988 PROCEDURES FOR ROUTINE PERFORMANCE TESTS
OF STEAM TURBINES
Generator output corrected to specified conditions: Measured generator output 54,500 kW Losses for 0.84 pf and 0.5 psig H2 pressure 626 kW* Additional loss for 5.0 psig H2 pressure 17 kW* Total generator losses for test conditions 643 kW
Losses with specified conditions of 0.80 pf and 0.5 psig H, pressure 657 kW*
Corrected generator output = 54,500 + 643 - 657 = 54,486 kW
Test steam rate:
Steam rate = initial throttle flow
corrected generator output
= ~ = 11.67 Ibm/kWhr 635,610 54,486
Corrections for deviations from specified conditions:
Flow correction factor = J E x ; p = pressure, psia v = specific volume, ft3/lbm
S = specified conditions t = test conditions
Subscripts:
199.7 2.624 205.2 2.729 X“ - 0.9673
Corrected throttle flow = 0.9673 x 635,610 = 614,826 Ibm/hr (278,880 kg/h)
Steam rate correction divisors: (From manufacturer’s curves)
Percent Change Correction Divisor Initial pressure Initial temperature Exhaust pressure Combined divisor
-0.1 7 0.9983 O. 78 1.0078 0.10 1 .o01 o
1 .O071
Corrected steam rate = test steam rate
combined divisor
” - 1.0071
= 11.59 Ibm/kWhr (5.257 kglkWh)
*From Fig. 7.2
56
. . COPYRIGHT American Society of Mechanical EngineersLicensed by Information Handling ServicesCOPYRIGHT American Society of Mechanical EngineersLicensed by Information Handling Services
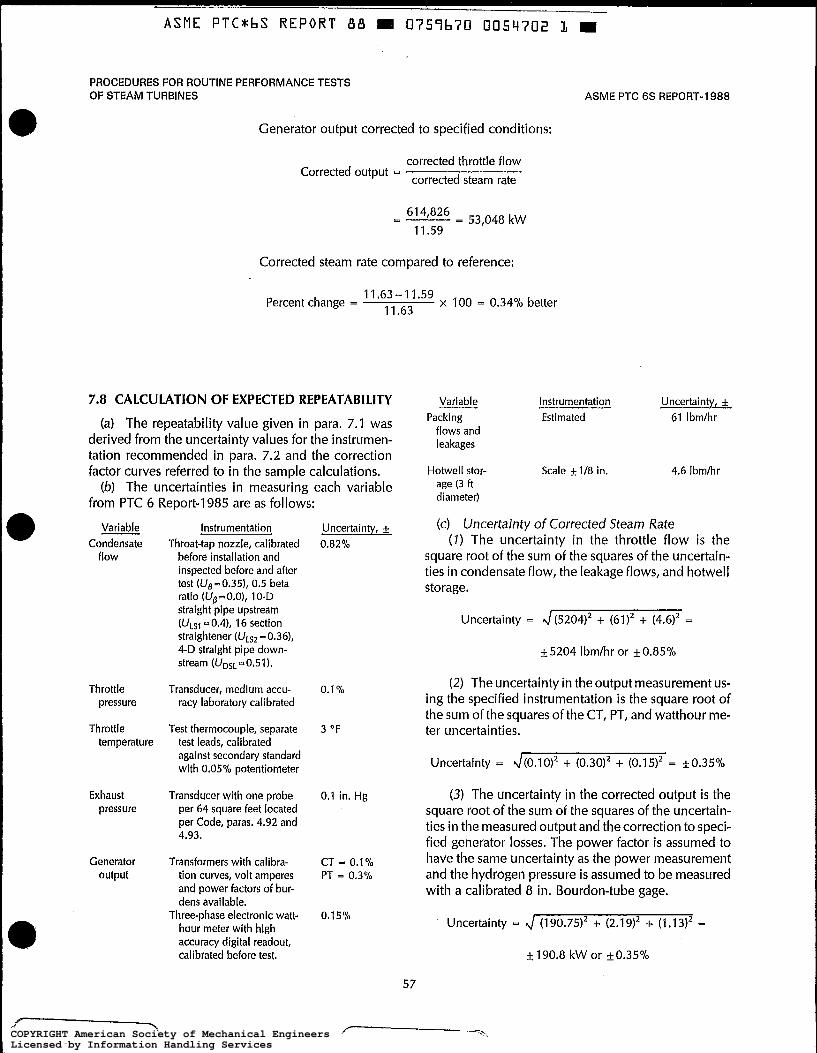
ASME P T C * b S REPORT 88 I 0757b70 005q702 L I
PROCEDURES FOR ROUTINE PERFORMANCE TESTS OF STEAM TURBINES ASME PTC 6s REPORT-I 988
Generator output corrected to specified conditions:
corrected throttle flow corrected steam rate
Corrected output =
=- 614t826 = 53,048 kW 11.59
Corrected steam rate compared to reference:
Percent change = 11 -63 - 11.59
11.63 x 100 = 0.34% better
7.8 CALCULATION OF EXPECTED REPEATABILITY Variable Instrumentation Uncertainty, f
(a) The repeatability value given in para. 7.1 was derived from the uncertainty values for the instrumen-
flows and
tation recommended in para, 7.2 and the correction leakages
factor curves referred to in the sample calculations. Hotwell stor- Scale f 1/8 in. 4.6 Ibmhr
from PTC 6 Report-1 985 are as follows:
Packing Estimated 61 Ibmhr
(b) The uncertainties in measuring each variable age (3 ft diameter)
Variable Condensate
flow
Throttle pressure
Throttle temperature
Exhaust pressure
Generator output
Instrumentation Throat-tap nozzle, calibrated
before installation and inspected before and after test ( U ~ - 0 . 3 5 ) , 0.5 beta ratio (U, -O.O), 1 O-D straight pipe upstream (ULsl 0.41, 16 section straightener (ULs2 -0.36), 4-D straight pipe down- stream (UDsL-0.51).
Transducer, medium accu- racy laboratory calibrated
Test thermocouple, separate test leads, calibrated against secondary standard with 0.05% potentiometer
Transducer with one probe per 64 square feet located per Code, paras. 4.92 and 4.93.
Transformers with calibra- tion curves, volt amperes and power factors of bur- dens available.
Three-phase electronic watt- hour meter with high accuracy digital readout, calibrated before test.
Uncertainty, f (c) Uncertainty of Corrected Steam Rate 0.82% ( I ) The uncertainty in the throttle flow is the
square root of the sum of the squares of the uncertain- ties in condensate flow, the leakage flows, and hotwell storage.
Uncertainty = d(5204I2 + (61)2 + (4.612 =
*5204 Ibmhr or +0.85%
o. 1 Yo (2) The uncertainty in the output measurement us-
ing the specified instrumentation is the square root of the sum of the squares of the CT, PT, and watthour me-
3 O F ter uncertainties.
Uncertainty = J(0.10)2 + (0.30)2 + (0.15)2 = +0.35%
0.1 in. Hg (3) The uncertainty in the corrected output is the square root of the sum of the squares of the uncertain- ties in the measured output and the correction to speci- fied generator losses. The power factor is assumed to
CT = 0.1 % have the same uncertainty as the power measurement PT = 0.3% and the hydrogen pressure is assumed to be measured
with a calibrated 8 in. Bourdon-tube gage.
0.1 5% Uncertainty = 4 (190.7512 + (2.19)’ f- (1.1312 =
& 190.8 kW or & 0.35%
57
COPYRIGHT American Society of Mechanical EngineersLicensed by Information Handling ServicesCOPYRIGHT American Society of Mechanical EngineersLicensed by Information Handling Services

ASME PTC*bS REPORT B B M 0759670 0054703 3
ASME PTC 6s REPORT-I 988 PROCEDURES FOR ROUTINE PERFORMANCE TESTS
OF STEAM TURBINES
(4) The uncertainty in the corrected steam rate is the square root of the sum of the squares of the uncer- tainties in throttle flow, corrected output, and the cor- rection factors for throttle pressure, throttle temperature, and exhaust pressure, or
Uncertainty =
J (0.8512 + (0.3512 + (0.05712 + (0.27212 + (0.412 =
The repeatability is taken as one-half the uncertainty or +0.52%.
FIG. 7.2 GENERATOR ELECTRICAL LOSSES
58
COPYRIGHT American Society of Mechanical EngineersLicensed by Information Handling ServicesCOPYRIGHT American Society of Mechanical EngineersLicensed by Information Handling Services

ASME PTC 6s REPORT-I988
SECTION 8 - TEST FOR CONDENSING TURBINE, REGENERATIVE CYCLE, WITH SUPERHEATED INLET STEAM
8.1 INTRODUCTION
(a) A maximum-capability test is the recommended frequent periodic routine test of the performance of this type of turbine. When such a test indicates a per- fqrmance change, it may be necessary to conduct a simplified heat rate test to determine the cause.
(b) A simplified turbine heat rate test is recom- mended as a periodic routine check of the perfor- mance of this type of turbine. When change of perfor- mance is indicated, additional measurements should be made to locate the source of this change. These ad- ditional measurements include readings of all availa- ble stage pressures, gland leakages and heater terminal temperature differences,
(c) Recommended test procedures, instrumenta- tion requirements, reading frequencies and test dura- tion have been chosen to measure critical variables with sufficient accuracy to produce results of the maximum-capability test that are repeatable within k0.5 percent* on aday-to-day basis. Similarly, simpli- fied heat-rate test results should be repeatable within 10.5 percent*. (See para. 3.8.3 and refer to paras. 4.4.1 through 4.4.5 for factors affecting expected re- peatability over longer periods of time.)
( 6 ) It isestimated thatthe recommended testwill re- quire a minimum number of four observers plus a test supervisor. If additional data beyond that required for heat ratedetermination isdesired, additional observers may be needed.
8.2 INSTRUMENTATION REQUIREMENTS
(a) Special test instrumentation is recommended for the following readings:
Maximum Heat Capability Rate
First stage pressure X X Generator output X X
Feedwater flow ... X
Throttle steam pressure X X
*See Table 8.1 for derivation of this value.
Maximum Heat Capability
Throttle steam temperature X X
Turbine exhaust pressure X X
Final feedwater temperature ... X
The recommended instruments have been chosen to measure critical variables with. sufficient accuracy to produce results that are repeatable as indicated in para. 8.l(c) if the recommendations of Section 4 fortheir in- stallation and use are observed.
( I ) Generator Output. See paras. 4.2.1 through 4.2.7.
(2) Feedwater flow: Primary element:' See paras. 4.4.1 through 4.4.4. Location of primary element: Upstream of deaerator or upstream of steam generator
(3) Pressure. See para. 4.5. (4) Temperature. See para. 4.6. (5) Low-Pressure-Turbine Exhaust Pressure. See
paras. 4.5.8 and 4.5.9. (6) Secondary Readings. See para. 4.1 O.
8.3 INSTRUMENT LOCATIONS
The essential instrumentation for a simplified heat rate test is indicated on Fig. 8.1. Also shown are addi- tional measurements which are of value in determin- ing the causes of performance deterioration.
8.4 ISOLATION PROCEDURE
See paras. 3.2.1 through 3.2.7.
8.5 CONDUCT OF THE TEST
8.5.1 Test Conditions (a) Isolate the turbine cycle in accordance with
paras. 3.2.1 through 3.2.7. (b) Establish test load so that the turbine operates at
a known valve point, preferably at valves wide open
59
COPYRIGHT American Society of Mechanical EngineersLicensed by Information Handling ServicesCOPYRIGHT American Society of Mechanical EngineersLicensed by Information Handling Services

Lege
nd
P -
Pres
sure
0
B Sp
ecia
l te
st in
stru
men
tatio
n T
- Te
mpe
ratu
re
:
W -
Flow
q
Seco
ndar
y in
stru
men
tatio
n ---
- Ee
cc
kW
-
Kilo
watts
PF -
Po
wer
facto
r
m
- Le
vel
n Es
timat
ed
valu
e
l -
Esse
ntia
l in
stru
men
tatio
n fo
r ro
utin
e he
at
rate
te
sts
Turb
ine
Stea
m
gene
rato
r 4 * 0”
@
0 El
0
0”
0 0
T v
1 I
Deae
rato
r 0:
.
heat
er
0 He
ater
0
Heat
er
0 .
No.
5 +
No.4
No
.3
* No
. 2
+ No
. 1
7 ,
,,,
.
lo
El
a
FIG
. 8.
1 IN
STR
UM
ENTA
TIO
N
FOR
RO
UTI
NE
PER
FOR
MAN
CE
TEST
S FO
R C
ON
DEN
SIN
G
TUR
BIN
E,
REG
ENER
ATIV
E C
YCLE
, SU
PER
HEA
TED
IN
LET
STEA
M
COPYRIGHT American Society of Mechanical EngineersLicensed by Information Handling ServicesCOPYRIGHT American Society of Mechanical EngineersLicensed by Information Handling Services

ASME P T C * b S R E P O R T 88 W 0759b70 0054706 7 W
PROCEDURES FOR ROUTINE PERFORMANCE TESTS OF STEAM TURBINES
(See para, 5.1) with operating conditions as close to specified conditions as possible and on load-limit con- trol, In the case of single-valve or throttling turbines, reference measurements should be established to in- sure that the same percentage openings of the admís- sion valves are established as for previous tests. The unit should be removed from automatic system-load- control devices and made as free of system distur- bances as possible.
(c) Allow sufficient time to assure stable operating conditions. A one-half-hour minimum stabilization time should be allowed.
8.5.2 Test Duration. Turbine heat rate tests should be of two hour duration. Capability tests and special tests to determine relative effects upon heat rate of changes to the turbine cycle, which can be performed without changing throttle flow, may be of one hour duration.
8.5.3 Frequency and Coordination of Readings (a) Readings should be coordinated by reliable
time measurement in accordance with para. 4.8. (b) Reading frequency should be established to
produce a representative average. See para. 3.4.2 for frequency of test readings.
8.6 CALCULATION AND ANALYSIS OF TEST DATA
A general outline for a typical calculation of test results is provided in para. 8.8 and should be consulted as a guide.
8.6.1 Definition of Heat Rate. Heat rate in BtukWhr is defined by the following formula with nomenclature given in Section 2 and Fig. 2.1:
Heat Rate = w,h - W l l h l l
pg
8.6.2 Test Correction Factors (a) Correction factors in the form of divisors shall be
determined from manufacturer's data or prior tests to correct heat rate and output for deviations from speci- fied values of throttle pressure and temperature and ex- haust pressure.
(b) Correction factors to correct heat rate and out- put for deviation in top feedwater heater performance, condensate subcooling in the condenser and changes in pump-sealing and gland-cooling requirements may be determined from curves presented in PTC 6,1-1984
ASME PTC 6s REPORT-1988
and Appendix A of this report. When sufficient infor- mation is available, correction factors may be devel- oped from data from prior test analysis or cycle modeling.
8.6.3 Data Plots and Test Analysis. The presentation and interpretation of test results is discussed in Section 6.
Suggested parametersfor performance monitoring of a condensing regenerative turbine supplied with su- perheated steam are:
(a) chronological plots of corrected heat rate and corrected generator output
(b) chronological plots of corrected stage pressures or W J ~
(c) when a sufficient number of test results at differ- ent valve points are available, corrected heat rate may be plotted against corrected output or corrected throt- tle flow. A comparison of these plots would show any changes in the timing (or overlap) of the governing valves.
8.6.4 Interpretation of Trend Changes. Increasing cy- cle heat rate at the same valve point, after correction to specified conditions, is indicative of reduction in per- formance of one or more components of the turbine or its cycle. The basic turbine heat rate test usually does not provide sufficient information to adequately ana- lyze all components of the cycle, and it may be neces- sary to perform supplementary tests as shown in para. 8.7. Deterioration of component performance can be caused by several factors, such as:
(a) accumulation of turbine-blade deposits, or in- ternal turbine damage. This is usually indicated by a change in stage pressures or stage pressure ratios. (See paras. 6.24 through 6.24.4).
(b) increases in leakage flows. (See paras. 6.24.3 and 6.24.5.)
(c) increased feedwater-heater terminal tempera- ture differences resulting from reduced heat transfer coefficient, internal leakage, inadequate venting or failure to control condensate level (See para. 6.24.2.)
8.7 SUPPLEMENTARY TESTS
Supplementary tests, providing additional informa- tion required for analyzing the cause of performance deterioration, may be conducted in conjunction with the simplified heat rate test, or separately. When con- ducted separately, stable operating conditions and the
61
r- /"\.
1 COPYRIGHT American Society of Mechanical EngineersLicensed by Information Handling ServicesCOPYRIGHT American Society of Mechanical EngineersLicensed by Information Handling Services

ASME P T C * b S REPORT 88
ASME PTC 6s REPORT-1 988
same governing valve position that existed during the test should be used as the basis of comparison.
(a) Stage pressures can be measured periodically, preferably with valves wide open. The minimum rec- ommended test duration is 30 minutes. See paras. 6.1 3 to 6.13.4 for corrections due to deviation of throttle pressure from specified value. A comparison of pres- sure ratios for turbine sections or for groups of stages, including the governing valves, is also of value.
(b) Terminal temperature differences (and drain- cooler temperature differences) of each feedwater heater in the heater cycle indicate changes in heater performance which affect heat rate results. Special temperature and pressure measurements should be taken at each point of steam and water entry or exit, at the specified valve openings. Test duration should be at least 30 minutes. Usually two observers are required for this test.
(c) Packing leakages can be measured with second- ary flow-measuring devices at the specified valve opening under stable conditions. Increased packing- leakage flow is indicative of deterioration of internal packing clearances, resulting in poorer heat rates. Leakage tests should be a minimum of one hour in du- ration and usually require two to three observers.
8.8 SAMPLE CALCULATIONS
Specified Conditions Throttle steam pressure, psia 1265* Throttle steam temperature, "F 950* Throttle steam enthalpy, Btu/lbm 1468.1 * Exhaust pressure, in. Hg abs. 2.00* Power factor, O10 80.0* Hydrogen pressure, psig 30.0*
Reference heat rate: 9021 Btu/kWh, with maximum valve opening and with all oper- ating conditions at the specified
W 0757b70 0054707 O m i
PROCEDURES FOR ROUTINE PERFORMANCE TESTS OF STEAM TURBINES
Feedwater flow to steam gen.,lbm/hr 609,230 Generator output, kW 69,552* Power factor, '10 91.4* Hydrogen pressure, psig 28.5"
Steam flows: Changes in stored water during 2 hr test period: Condenser hotwell storage= -3000 (level fall) Ibm Steam generator storage = + 300 (level rise) Ibm Deaerator storage = O (no change) Make-up = o
System leakage = 3000-300
= 1350 Ibm/hr (assumed 2
to be from steam generator) Steam to air ejector = 630 Ibm/h (estimated on basis of
Throttle steam flow = feedwater flow - system leak- age - increase in steam gen- erator storage - steam to air ejector
previous data)
= 609,230 - 1350 - -- 630 300 2
= 607,100 Ibmlhr
Generator Losses (From manufacturer's curves)
80% power factor, losses = 900 kW* 91.4% power factor, losses = 790 kW* Correction to 80% power factor = - 11 O kW*
output = 69,552 kW*
Additional Losses with increased Hydrogen Pressure Hydrogen pressure was 28.5 psig, instead of the specified 30 psig, decreasing losses by 5 kW*
values.
Test Results Throttle steam pressure, psia Throttle steam temperature, "F Throttle steam enthalpy, BtuAbm Exhaust pressure, in.Hg abs. Feedwater leaving No. 5 heater:
Temperature, "F Enthalpy, Btu/lbm
1280* 946 *
1465.2 * 2.09*
462.3 444.6
Generator output corrected to specified power factor and hydrogen pressure
= 69,552 - 110 - 5 = 69,437 kW*
Heat Rate
607,100 X 1465.2 - 609,230 X 444.6 Test heat rate = 69,437
*Indicates typical values used for capability tests, The entire calcula- tion shown here is required for heat rate tests. = 8910 BtuIkWhr
COPYRIGHT American Society of Mechanical EngineersLicensed by Information Handling ServicesCOPYRIGHT American Society of Mechanical EngineersLicensed by Information Handling Services

ASME PTC*bS REPORT B B E 0757b70 005q708 2 E
PROCEDURES FOR ROUTINE PERFORMANCE TESTS OF STEAM TURBINES ASME PTC 6s REPORT-I988
Correction Factors (From manufacturer's curves)
Throttle pressure Throttle temperature Exhaust pressure Product of correction factors
Heat Rate 0.9994 1 .O01 5 1 .o000 1,0009
output 1.0080* 0.9980* 1 .oooo* 1.0060*
Corrected data
Corrected heat rate = - = 8902 Btu/kWhr (9392 kJ/kwh) 891 O
1 .o009
Corrected output = - = 69,023 kW* 1 .O060
Heat rate below reference = (8902 - 9021)
902 1 X 100 = -1.32%
Corrected throttle flow = test flow x = 607,100 x - J 1265 0.6090 1280 x 0.6191
= 598,600 Ibmh (271,500 kdh)
*Indicates typical values used for capability tests. The entire calculation shown here is required for heat rafe tests.
COPYRIGHT American Society of Mechanical EngineersLicensed by Information Handling ServicesCOPYRIGHT American Society of Mechanical EngineersLicensed by Information Handling Services

‘ ASME PTC*bS REPORT B B m 0757b70 0054707 Y m
ASME PTC 6s REPORT-1988 PROCEDURES FOR ROUTINE PERFORMANCE TESTS
OF STEAM TURBINES
TABLE 8.1 REPEATABILITY OF TEST RESULTS
Effect of Uncertainty on
Variable Instrumentation of Sample Test Variable Heat Rate Capability
(A) Generator output: (1 ) Potential transformers (2) Current transformers (3) Watthour meters
Total for generator output
(B) Primary flow: (1) Flow to deaerator
(2) Feedwater flow to steam generator (alternate location)
(C) Throttle pressure
(D) Throttle temperature
(E) Final feedwater temperature
(F) Exhaust pressure Exhaust pressure
Combined uncertainty:
With recommended flow measurement:
A’ + (B,)‘ + C’ + D’ + E’ + F’
With alternate flow measurement:
J A ’ + (B’)’ + C’ + D’ + E’ + F’
Repeatabilities = 0.5 x (combined uncertainty)
With recommended flow measurement With alternate flow measurement
Meeting Code requirement f O . l % Other burdens f0.2%* Permanent; 3-phase calibration; mechanical * 0.5%
register
.I (1)’ + (2)’ + (3)’ f0.55%
Pipe-wall tap nozzle, calibrated before installa- ~ 0 . 7 8 % tion, inspected before and after test with no change in flow element, 1 O-D upstream straight pipe, 50-section straightener P-Ratio = 0.5, 5.25-D downstream straight pipe, UB = 0.60, U0 = O, U L S ~ = 0.40, U ~ s 2 = O, - 0.3
Pipe-wall tap nozzle, no calibration, inspected rt3.55 before installation, 10-D upstream straight pipe, 20-section straightener, &Ratio = 0.65, 4-D downstream straight pipe, U, = 3.2, Uß = 0.5, ULs1 x 1.0 ULS~ = 0.8, UDSL = 0.67
2000 psi transducer, deadweight fester 50.8% calibrated, 0.50% of full scale
Meeting Code requirement f 1 .O°F
Meeting Code requirement f 1 .ORF
1 probe per 64 sq ft Test manometer
“0.1 in. Hg f0.05 in. Hg
* o. 1 010 *0.2% f 0.5%
f0.55%
&0.78%
*3.55%
f 0.03 ?‘o
*0.02%
+0.10%
*0.2% f o. 1 O10
* 0.99%
f 3.6O0I0
f 0.49% f 1 .80%
*O.I O10
*0.2% f 0.5%
*0.55%
...
...
f 0.8%
f 0.05%
s..
f 0.2% * o. 1 O10
f 1.00%
*0.99%
f0.50°/o & 0.50%
*Estimated.
. COPYRIGHT American Society of Mechanical EngineersLicensed by Information Handling ServicesCOPYRIGHT American Society of Mechanical EngineersLicensed by Information Handling Services

ASME PTC*bS REPORT B B m 0757670 0054730 O W
PROCEDURES FOR ROUTINE PERFORMANCE TESTS OF STEAM TURBINES ASME PTC 6s REPORT-I 988
SECTION 9 - TEST FOR CONDENSING TURBINE, REHEAT-REGENERATIVE CYCLE, WITH
SUPERHEATED INLET STEAM
9.1 INTRODUCTION
(a) The enthalpy-drop efficiency test of turbine sec- tions operating in the superheated steam region, com- bined with monitoring of generating capabilities at a known governing valve point, are recommended as the best routine performance tests for reheat turbines. When these tests detect performance deterioration, it may be necessary to conduct efficiency tests of other cycle components or simplified heat-rate tests to pin- point the cause of the deterioration.
(6) The enthalpy-drop efficiency test consists of measuring the initial and final steam temperatures and pressures of turbine sections using superheated steam and calculating an engine efficiency from the resulting enthalpies. Although the test is simple, measurements must be precise. Instrumentation requirements and specific test procedures are presented in this section.
(c) The capability test consists of measuring electri- cal output at a particular governing valve point, prefer- ably valves wide open, and steam pressures and temperatures which are necessary to apply load correc- tion factors. Measured electrical output must be cor- rected for variation from specified values of power factor and hydrogen pressure prior to application of the load correction factors. This involves calculating the test coupling kilowatts and then subtracting the elec- trical and mechanical losses that would occur at speci- fied power factor and hydrogen pressure, Instrumenta- tion and procedures for this test are also included.
(d) The simplified heat-rate test consists of measur- ing the heat supplied to the turbine cycle and the elec- trical output at given valve points. In addition to the instrumentation of the recommended tests, this test re- quires flow measurement, cycle isolation and mea- surement of certain feedwater temperatures and pressures. Specific test procedures are presented for the simplified heat-rate test.
(e) Test procedures, instrumentation, duration and reading frequency are listed and were chosen to mea- sure critical variables with sufficient accuracy to pro-
duce results estimated to be repeatable with thefollow- ing percentages. (See para. 3.8.3):
Test Repeatability [Note (I)] Enthalpy-drop efficiency &0.3% to &0.5% depending
upon range of available energy
-
Corrected generating capability +_0.3%
Simplified heat rate [Note (211 &0,55% to +0.90% depending on location of primary water flow measuring element. See para. 4.4.2.
NOTES: (1) See para. 9.9 for derivation of these values. (2) Because of the importance of the flow measurement in this
test, these values are based on short time spans (day-today) only. For expected repeatability over longer periods of time, indicators given in paras. 4.4.1 through 4.4.5 should be considered.
( f ) The recommended enthalpy-drop and generat- ing capability tests require an estimated minimum numberofthreeobservers. Simplified heat-rate tests re- quire a minimum number of six observers plus a test supervisor. A fewer number of observers may be nec- essary when automatic data acquisition is used.
9.2 INSTRUMENTATION REQUIREMENTS
(a) Precision instrumentation is recommended for primary readings for each test as follows:
Enthalpy Generating Heat Reading Drop Capability m e
Throttle pressure and X X X
temperature
First-stage shell pressure X X X
Cold-reheat pressure and X X X temperature
65
COPYRIGHT American Society of Mechanical EngineersLicensed by Information Handling ServicesCOPYRIGHT American Society of Mechanical EngineersLicensed by Information Handling Services
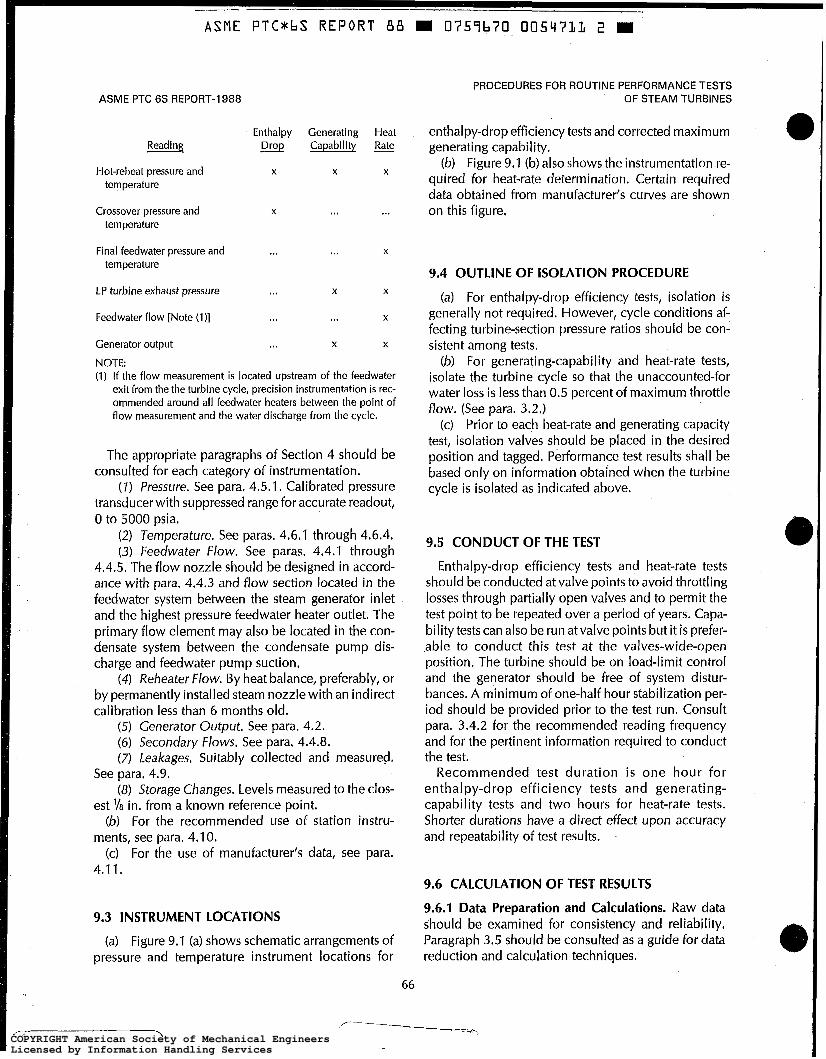
ASME PTC*bS REPORT 88
ASME PTC 6s REPORT-I 988
Enthalpy Generating Heat Read i ng - Drop Capability Rate
Hot-reheat pressure and X X X
temperature
Crossover pressure and X *.. ... temperature
Final feedwater pressure and ... ... X
temperature
LP turbine exhaust pressure ... X X
Feedwater flow [Note (1)l ... ... X
Generator output ... X X
NOTE: (1) If the flow measurement is located upstream of the feedwater
exit from the the turbine cycle, precision instrumentation is rec- ommended around all feedwater heaters between the point of flow measurement and the water discharge from the cycle.
The appropriate paragraphs of Section 4 should be consulted for each category of instrumentation.
( 1 ) Pressure. See para. 4.5.1. Calibrated pressure transducer with suppressed range for accurate readout, O to 5000 psia.
(2) Temperature. See paras. 4.6.1 through 4.6.4. (3) Feedwater Flow. See paras. 4.4.1 through
4.4.5. The flow nozzle should be designed in accord- ance with para. 4.4.3 and flow section located in the feedwater system between the steam generator inlet and the highest pressure feedwater heater outlet. The primary flow element may also be located in the con- densate system between the condensate pump dis- charge and feedwater pump suction.
(4) Reheater Flow. By heat balance, preferably, or by permanently installed steam nozzle with an indirect calibration less than 6 months old.
(5) Cenerator Output. See para. 4.2. (6) Secondary Flows. See para, 4.4.8. (7) Leakages. Suitably collected and measured.
(8) Storage Changes, Levels measured to the clos-
(b) For the recommended use of station instru-
(c) For the use of manufacturer's data, see para.
See para. 4.9.
est '/S in. from a known reference point.
ments, see para. 4.1 O.
4.1 1.
9.3 INSTRUMENT LOCATIONS
(a) Figure 9.1 (a) shows schematic arrangements of pressure and temperature instrument locations for
66
U 0757b70 005q7LL 2 W
PROCEDURES FOR ROUTINE PERFORMANCE TESTS OF STEAM TURBINES
enthalpy-drop efficiency tests and corrected maximum generating capability.
(b) Figure 9.1 (b) also shows the instrumentation re- quired for heat-rate determination. Certain required data obtained from manufacturer's curves are shown on this figure.
9.4 OUTLINE OF ISOLATION PROCEDURE
(a) For enthalpy-drop efficiency tests, isolation is generally not required. However, cyde conditions af- fecting turbine-section pressure ratios should be con- sistent among tests.
(b) For generating-capability and heat-rate tests, isolate the turbine cycle so that the unaccounted-for water loss is less than 0.5 percent of maximum throttle flow. (See para. 3.2.)
(c) Prior to each heat-rate and generating capacity test, isolation valves should be placed in the desired position and tagged. Performance test results shall be based only on information obtained when the turbine cycle is isolated as indicated above.
9.5 CONDUCT OF THE TEST
Enthalpy-drop efficiency tests and heat-rate tests should be conducted at valve points to avoid throttling losses through partially open valves and to permit the test point to be repeated over a period of years. Capa- bility tests can also be run at valve points but it is prefer- ,able to conduct this test at the valves-wide-open position. The turbine should be on load-limit control and the generator should be free of system distur- bances. A minimum of one-half hour stabilization per- iod should be provided prior to the test run. Consult para. 3.4.2 for the recommended reading frequency and for the pertinent information required to conduct the test.
Recommended test duration is one hour for enthalpy-drop efficiency tests and generating- capability tests and two hours for heat-rate tests. Shorter durations have a direct effect upon accuracy and repeatability of test results.
9.6 CALCULATION OF TEST RESULTS
9.6.1 Data Preparation and Calculations. Raw data should be examined for consistency and reliability. Paragraph 3.5 should be consulted as a guide for data reduction and calculation techniques.
COPYRIGHT American Society of Mechanical EngineersLicensed by Information Handling ServicesCOPYRIGHT American Society of Mechanical EngineersLicensed by Information Handling Services
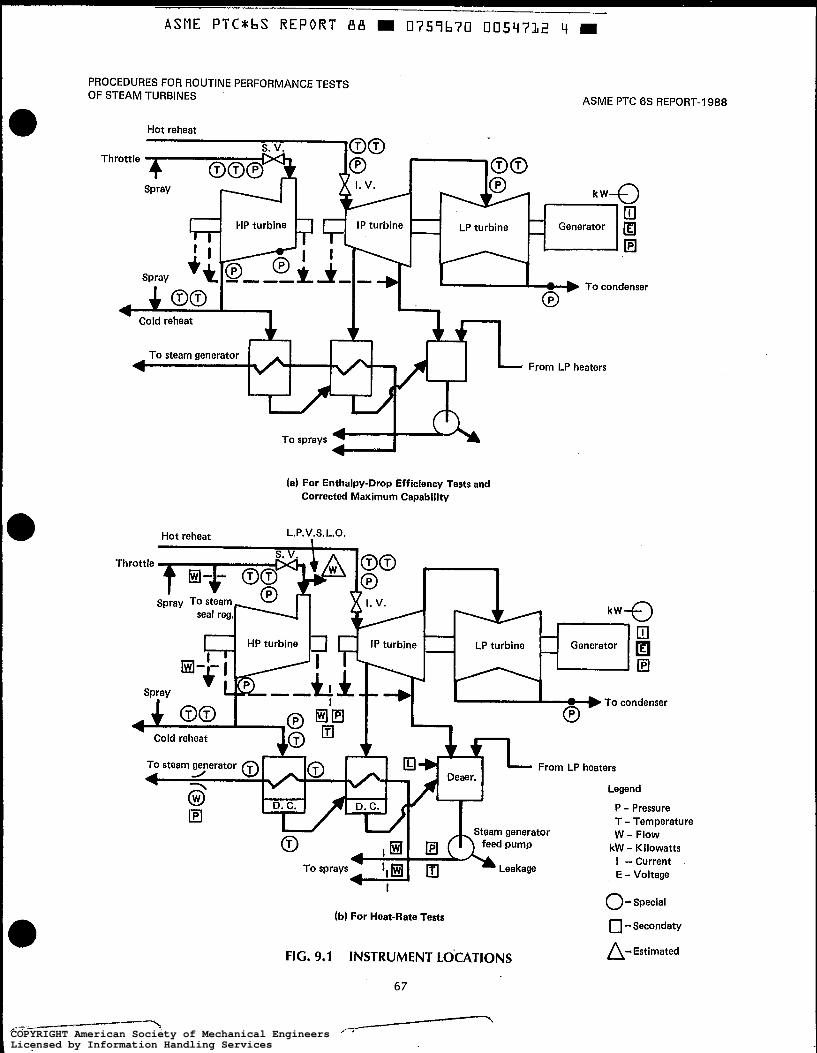
ASME P T C * b S REPORT I38 m 0757670 0054732 4 m
PROCEDURES FOR ROUTINE PERFORMANCE TESTS OF STEAM TURBINES
Hot reheat
(a) For Enthalpy-Drop Efficiency Tests and Corrected Maximum Capability
ASME PTC 6s REPORT-I 988
Hot reheat L.P.V.S.L.O.
Throttle
El Generator
I ' a-+- I
J 00 /Li> - *
U m
c3 Spray
I P "
4 I
@ To condenser
Cold reheat J@ From LP heaters
Legend
P - Pressure T - Temperature
Steam generator
m n feed pump W - Flow
kW - Kilowatts
To sprays :+v" - Leakage I -Current E - Voltage
(b) For Heat-Rate Tests
FIG. 9.1 INSTRUMENT LOCATIONS
67
O - s p e c i a l
0 - Secondaty
A-Est imated
COPYRIGHT American Society of Mechanical EngineersLicensed by Information Handling ServicesCOPYRIGHT American Society of Mechanical EngineersLicensed by Information Handling Services
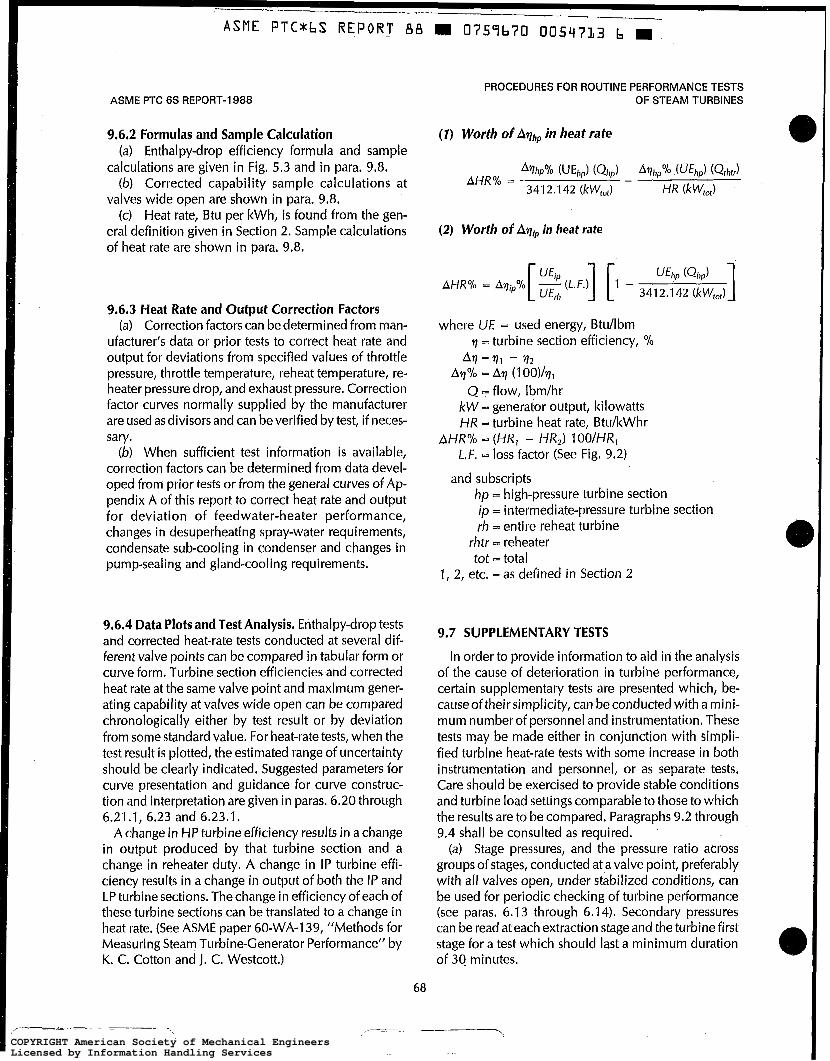
ASME P T C * b S REPORT 88 m 0757b70 O054733 b m
ASME PTC 6s REPORT-I 988
9.6.2 Formulas and Sample Calculation (a) Enthalpy-drop efficiency formula and sample
calculations are given in Fig. 5.3 and in para. 9.8. (b) Corrected capability sample calculations at
valves wide open are shown in para. 9.8. (c) Heat rate, Btu per kWh, is found from the gen-
eral definition given in Section 2. Sample calculations of heat rate are shown in para. 9.8,
9.6.3 Heat Rate and Output Correction Factors (a) Correction factors can be determined from man-
ufacturer's data or prior tests to correct heat rate and output for deviations from specified values of throttle pressure, throttle temperature, reheat temperature, re- heater pressure drop, and exhaust pressure. Correction factor curves normally supplied by the manufacturer are used as divisors and can be verified by test, if neces- sary.
(b) When sufficient test information is available, correction factors can be determined from data devel- oped from prior tests or from the general curves of Ap- pendix A of this report to correct heat rate and output for deviation of feedwater-heater performance, changes in desuperheating spray-water requirements, condensate sub-cooling in condenser and changes in pump-sealing and gland-cooling requirements.
9.6.4 Data Plots and Test Analysis. Enthalpy-drop tests and corrected heat-rate tests conducted at several dif- ferent valve points can be compared in tabular form or curve form. Turbine section efficiencies-and corrected heat rate at the same valve point and maximum gener- ating capability at valves wide open can be compared chronologically either by test result or by deviation from some standard value. For heat-rate tests, when the test result is plotted, the estimated range of uncertainty should be clearly indicated. Suggested parameters for curve presentation and guidance for curve construc- tion and interpretation are given in paras, 6.20 through 6.21.1, 6.23 and 6.23.1.
A change in HP turbine efficiency results in a change in output produced by that turbine section and a change in reheater duty. A change in IP turbine effi- ciency results in a change in output of both the IP and LP turbine sections. The change in efficiency of each of these turbine sections can be translated to a change in heat rate. (See ASME paper 60-WA-139, "Methods for Measuring Steam Turbine-Generator Performance" by K. C. Cotton and J. C. Westcott.)
68
PROCEDURES FOR ROUTINE PERFORMANCE TESTS OF STEAM TURBINES
( I ) Worth of Avhp in heat rate
(2) Worth of Avi,, in heat rate
where U€ = used energy, Btu/lbm =turbine section efficiency, '/O
Av = v1 - v 2
Q =flow, Ibm/hr Avo/o = Av (1 OO)/vl
kW = generator output, kilowatts H R =turbine heat rate, BtukWhr
1.F. = loss factor (See Fig. 9.2) AHROI0 = (HRI - HR,) 100/HR1
and subscripts hp = high-pressure turbine section ip = intermediate-pressure turbine section rh = entire reheat turbine
rhtr = reheater tot = total
1, 2, etc. = as defined in Section 2
9.7 SUPPLEMENTARY TESTS
In order to provide information to aid in the analysis of the cause of deterioration in turbine performance, certain supplementary tests are presented which, be- causeof theirsimplicity, can beconducted with a mini- mum number of personnel and instrumentation. These tests may be made either in conjunction with simpli- fied turbine heat-rate tests with some increase in both instrumentation and personnel, or as separate tests. Care should be exercised to provide stable conditions and turbine load settings comparable to those to which the results are to be compared. Paragraphs 9.2 through 9.4 shall be consulted as required.
(a) Stage pressures, and the pressure ratio across groups of stages, conducted at avalve point, preferably with al[ valves open, under stabilized conditions, can be used for periodic checking of turbine performance (see paras. 6.13 through 6.14). Secondary pressures can be read at each extraction stage and the turbine first stage for a test which should last a minimum duration of 30 minutes.
COPYRIGHT American Society of Mechanical EngineersLicensed by Information Handling ServicesCOPYRIGHT American Society of Mechanical EngineersLicensed by Information Handling Services

A S M E P T C * b S R E P O R T 88 W 0757b70 005Y7LY B
PROCEDURES FOR ROUTINE PERFORMANCE TESTS OF STEAM TURBINES ASME PTC 6s REPORT-I 988
0.70
0.60 ô .W
IL" 0.50
J õ
0.40
0.30
I " I I I I I I
1000 O F Curves are for reheat temperature indicated and
500 psia full primary reheat pressure I I I I I I I I I l
I I I I I I l I I I 40 50 60 70 80 90 100 110 120 130 140 150
crossover Pressure at Full primary, psia
FIG. 9.2 LOSS FACTOR VERSUS CROSSOVER PRESSURE
(b) Terminal temperature difference (and drain- .30 minutes. Two observers are usually required for this cooler approach difference) of each feedwater heater test. in the heat cycle can be compared periodically to indi- (c) Packing leakages can be measured with second- cate changes in heater performance which affect heat ary flow-measuring devices in accordance with para. rate. Special temperature and pressure measurements 4.4.8 atvalves-wide-open under stable conditions (see should be read at each point of steam and water entry para. 6.22). Leakage tests should last a minimum of or exit, at valves wide open. The test should last at least one hour. They usually require two or three observers.
COPYRIGHT American Society of Mechanical EngineersLicensed by Information Handling ServicesCOPYRIGHT American Society of Mechanical EngineersLicensed by Information Handling Services

ASME PTC*hS REPORT B B m 0757b70 0054715 T m -__
ASME PTC 6s REPORT-I988 . PROCEDURES FOR ROUTINE PERFORMANCE TESTS
OF STEAM TURBINES
a U
70
COPYRIGHT American Society of Mechanical EngineersLicensed by Information Handling ServicesCOPYRIGHT American Society of Mechanical EngineersLicensed by Information Handling Services
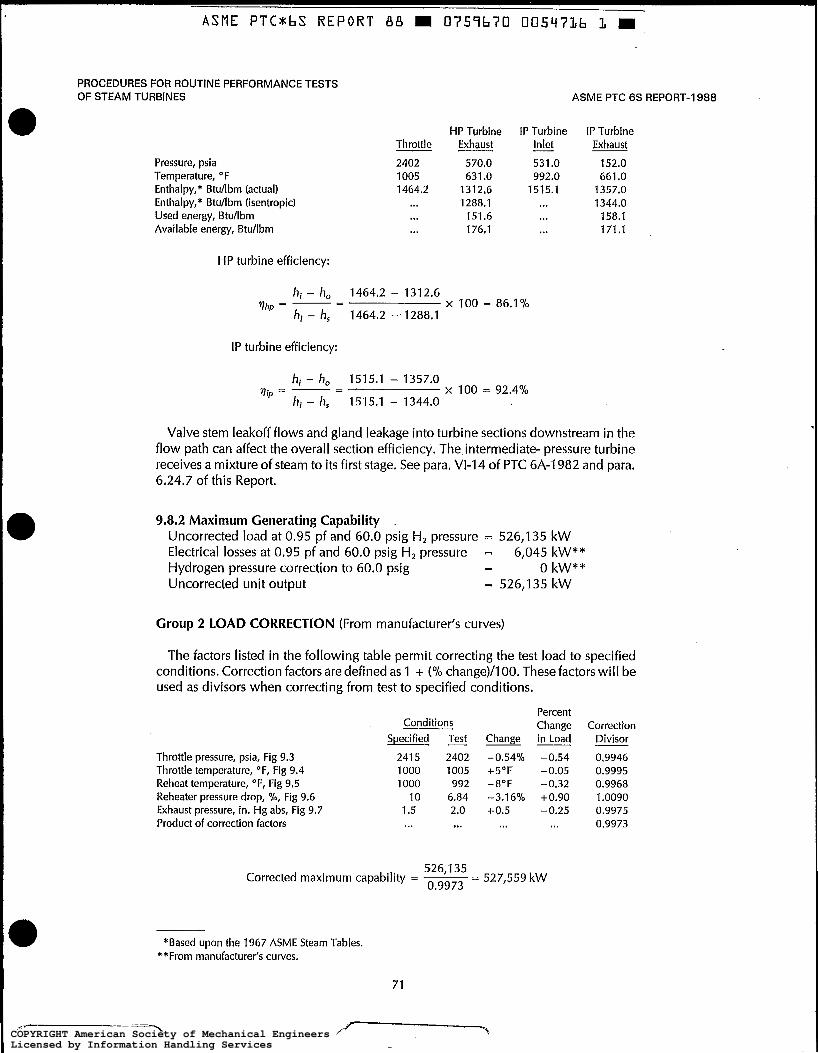
ASME PTC*bS REPORT B8 W 0759b70 0054716 L m
PROCEDURES FOR ROUTINE PERFORMANCE TESTS OF STEAM TURBINES ASME PTC 6s REPORT-1 988
HP Turbine IP Turbine IP Turbine Throttle Exhaust Inlet - Exhaust
Pressure, psia 2402 570.0 531.0 152.0 Temperature, "F 1005 631 .O 992.0 661 .O Enthalpy,* Btu/lbm (actual) 1464.2 1312.5 T515.1 1357.0 Enthalpy,* Btu/lbm (isentropic) I . . 1288.1 ... 1344.0 Used energy, Btdlbm ... 151.6 ... 158.1 Available energy, Btu/lbm ... 176.1 ... 171,l
HP turbine efficiency:
hi - h, 1464.2 - 1312.6
h; - h, 1464.2 -. 1288.1 l lhp = - - - x 100 = 86.1%
IP turbine efficiency:
hi - h, 1515.1 - 1357.0
hi - h, 1515.1 - 1344.0 = - - - X 100 = 92.4%
Valve stem leakoff flows and gland leakage into turbine sections downstream in the flow path can affect the overall section efficiency. The intermediate- pressure turbine receives a mixture of steam to its first stage. See para. VI-1 4 of PTC 6A-1982 and para. 6.24.7 of this Report.
9.8.2 Maximum Generating Capability Uncorrected load at 0.95 pf and 60.0 psig H, pressure = 526,135 kW Electrical losses at 0.95 pf and 60.0 psig H, pressure = 6,045 kW** Hydrogen pressure correction to 60.0 psig - - O kW** Uncorrected unit output = 526,135 kW
Group 2 LOAD CORRECTION (From manufacturer's curves)
The factors listed in the following table permit correcting the test load to specified conditions. Correction factors are defined as 1 + (% change)/l OO. These factors will be used as divisors when correcting from test to specified conditions.
Conditions Specified
Throttle pressure, psia, Fig 9.3 2415 2402 Throttle temperature, "F, Fig 9.4 1000 1005 Reheat temperature, "F, Fig 9.5 1 O00 992 Reheater pressure drop, O h , Fig 9.6 10 6.84 Exhaust pressure, in. Hg abs, Fig 9.7 1.5 2.0 Product of correction factors ... B . .
Percent Change
Change in Load "
-0.54% -0.54 +5OF -0.05 -8°F -0.32 -3.16% +0.90 +0.5 -0.25
... ...
Corrected maximum capability = ~ - - 527,559 kW 526,135 0.9973
*Based upon the 1967 ASME Steam Tables. **From manufacturer's curves.
Correction Divisor
0.9946 0.9995 0.9968 1 .o090 0.9975 0.9973
7
71 - COPYRIGHT American Society of Mechanical EngineersLicensed by Information Handling ServicesCOPYRIGHT American Society of Mechanical EngineersLicensed by Information Handling Services
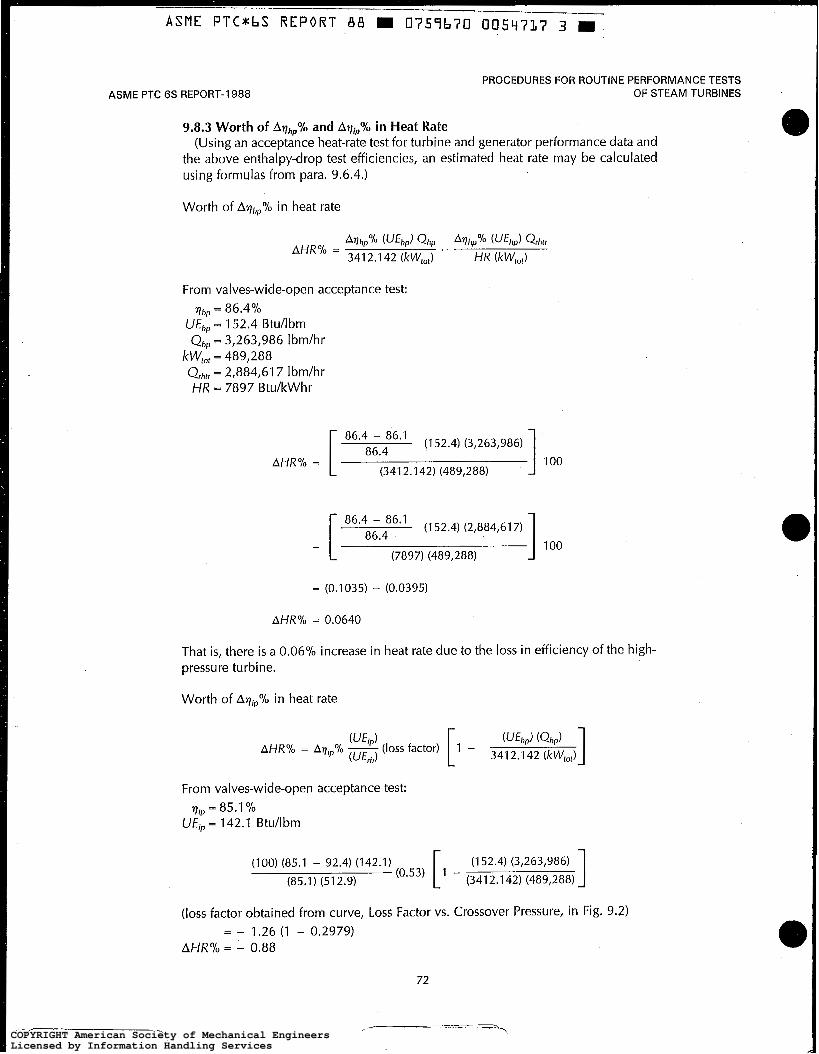
~ -~
ASME P T C * b S R E P O R T dB 0759670 0054737 3 m
ASME PTC 6s REPORT-I 988 PROCEDURES FOR ROUTINE PERFORMANCE TESTS
OF STEAM TURBINES
9.8.3 Worth of Aq,% and AqjP% in Heat Rate (Using an acceptance heat-rate test for turbine and generator performance data and
the above enthalpy-drop test efficiencies, an estimated heat rate may be calculated using formulas from para. 9.6.4.)
Worth of Aqhpolo in heat rate
From valves-wide-open acceptance test: qhp = 86.4%
Ufh, = 152.4 Btu/lbm Qhp = 3,263,986 Ibm/hr
Qrhtr = 2,884,617 Ibm/hr kW,,, = 489,288
UR = 7897 Btu/kWhr
[ 86.48;.486.1 (1 52.4) (3,263,986) AHR% = ] 100
(341 2.142) (489,288)
[ (7897) (489,288) 86.4
86'4 - 86*1 (1 52.4) (2,884,617)
- ] 100
= (0.1035) - (0.0395)
AHR% = 0.0640
That is, there is a 0.06% increase in heat rate due to the loss in efficiency of the high- pressure turbine.
Worth of Aqipolo in heat rate
From valves-wide-open acceptance test:
U€, = 142.1 Btu/lbm r ] , = 85.1 'lo
(100) (85.1 - 92.4) (142.1) [ (1 52.4) (3,263,986) (0.53) 1 -
(85.1) (512.9) (3412.142) (489,288) 1 (loss factor obtained from curve, Loss Factor vs. Crossover Pressure, in Fig. 9.2)
= - 1.26 (1 - 0.2979) AHR% - 0.88
72
COPYRIGHT American Society of Mechanical EngineersLicensed by Information Handling ServicesCOPYRIGHT American Society of Mechanical EngineersLicensed by Information Handling Services

ASNE P T C * b S REPORT 88 0757670 0054738 5
PROCEDURES FOR ROUTINE PERFORMANCE TESTS OF STEAM TURBINES ASME PTC 6s REPORT-I 988
Similarly, there j s a - 0.88% change in heat rate due to the increase in efficiency of the intermediate-pressure turbine. AHR,,,% = C changes due to Avhp and Avjp
=0.06 + (- 0.88) = - 0.82
COPYRIGHT American Society of Mechanical EngineersLicensed by Information Handling ServicesCOPYRIGHT American Society of Mechanical EngineersLicensed by Information Handling Services

ASME P T C * b S R E P O R T 8 8 m 0757670 0054717 7 W
ASME PTC 6s REPORT-1988 PROCEDURES FOR ROUTINE PERFORMANCE TESTS
OF STEAM TURBINES
I
8 t r
E e U
,""" "
f f
COPYRIGHT American Society of Mechanical EngineersLicensed by Information Handling ServicesCOPYRIGHT American Society of Mechanical EngineersLicensed by Information Handling Services
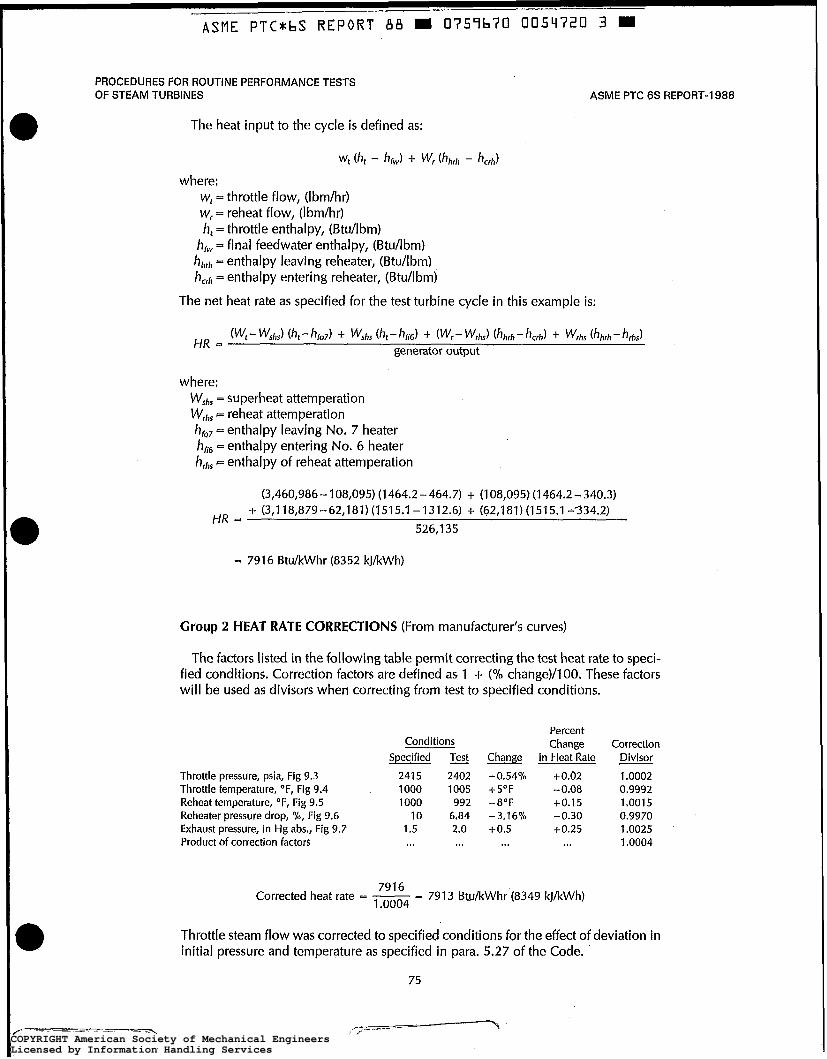
__
ASME PTC*bS REPORT 88 I 0757670 005Ll720 3 m
PROCEDURES FOR ROUTINE PERFORMANCE TESTS OF STEAM TURBINES ASME PTC 6s REPORT-1 988
The heat input to the cycle i s defined as:
where: W, = throttle flow, (Ibm/hr) W, = reheat f[ow, (Ibm/hr) h, = throttle enthalpy, (BtuAbm)
hf,v= final feedwater enthalpy, (Btu/lbm) hhrh = enthalpy leaving reheater, (BtuAbm) hcrh = enthalpy entering reheater, (BtuAbm)
The net heat rate as specified for the test turbine cycle in this example is:
where: WshS = superheat attemperation Wrhs reheat attemperation hl,, = enthalpy leaving No. 7 heater hfi6 enthalpy entering No. 6 heater hm, -enthalpy of reheat attemperation
(3,460,986-108,095) (1464.2-464.7) + (108,095)(1464.2-340.3) + (3,118,879-62,181)(1515.1-1312.6) + (62,181)(1515.1 -334.2)
HR = 526,135
= 7916 B t u k W h r (8352 kJkWh)
Group 2 HEAT RATE CORRECTIONS (From manufacturer's curves)
The factors listed in the foIlowing table permit correcting the test heat rate to speci- fied conditions. Correction factors are defined as 1 -t ( O h change)/lOO. These factors will be used as divisors when correcting from test to specified conditions.
Conditions Specified Test
Throttle pressure, psia, Fig 9.3 2415 2402 Throttle femperature, "F, Fig 9.4 1000 1005 Reheat temperature, "F, Fig 9.5 1000 992 Reheater pressure drop, OJO, Fig 9.6 10 6.84 Exhaust pressure, in Hg abs., Fig 9.7 1.5 2.0 Product of correction factors ..I ...
~-
Percent Change
Change in Heat Rate
-0.54% +O.OZ + 5°F - 0.08 -8°F +0.15 -3.16% -0.30 +0.5 +0.25
... a..
Correction Divisor
1 .o002 0.9992 1,001 5 0.9970 1.0025 1 .O004
Correcfed heat rate = - = 7913 BtukWhr (8349 kJkWh) 791 6
1 .O004
Throttle steam flow was corrected to specified conditions for the effect of deviation in initial pressure and temperature as specified in para. 5.27 of the Code. .
75
COPYRIGHT American Society of Mechanical EngineersLicensed by Information Handling ServicesCOPYRIGHT American Society of Mechanical EngineersLicensed by Information Handling Services
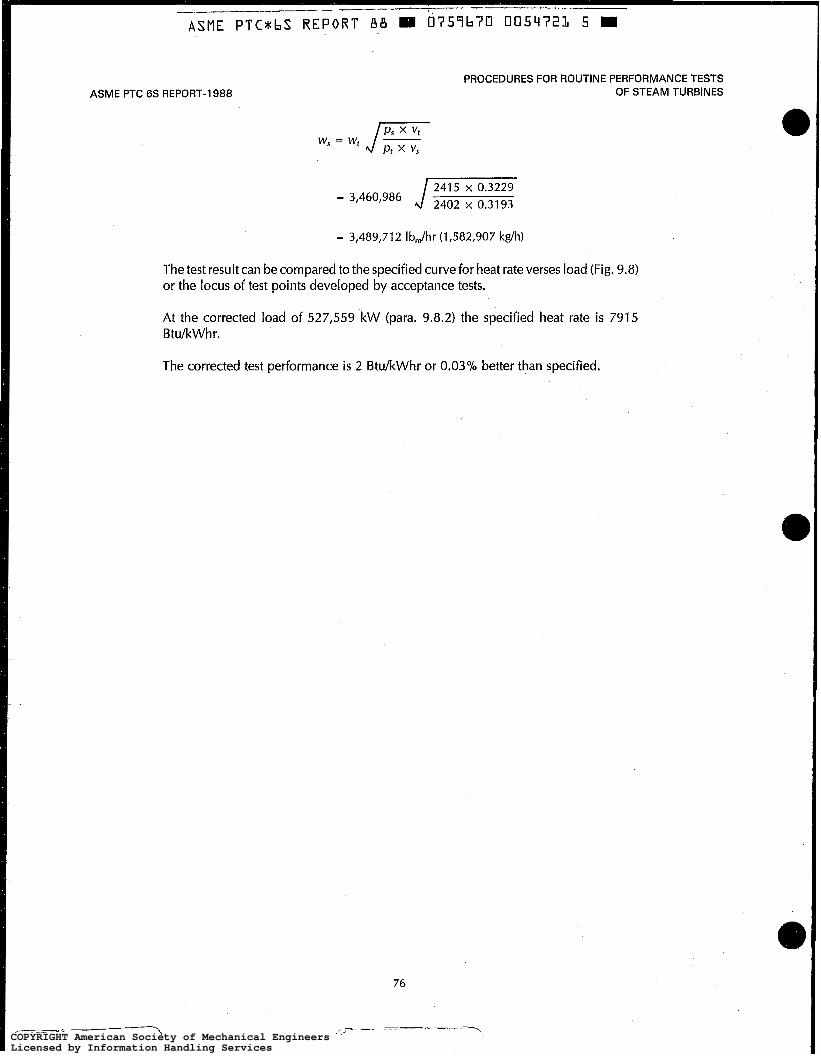
ASNE PTCmbS REPORT A B II 6757670 0054723 5 m -~
ASME PTC 6s REPORT-I 988 PROCEDURES FOR ROUTINE PERFORMANCE TESTS
OF STEAM TURBINES
= 3,460,986 c = 3,489,712 IbJhr (1,582,907 kdh)
The test result can be compared to the specified curve for heat rate verses load (Fig. 9.8) or the locus of test points developed by acceptance tests.
At the corrected load of 527,559 kW (para. 9.8.2) the specified heat rate is 7915 BtuIkWhr.
The corrected test performance is 2 BtukWhr or 0.03'/0 better than specified.
76
COPYRIGHT American Society of Mechanical EngineersLicensed by Information Handling ServicesCOPYRIGHT American Society of Mechanical EngineersLicensed by Information Handling Services

ASME PTC*bS REPORT B8 Ell 0757670 0054722 7
PROCEDURES FOR ROUTINE PERFORMANCE TESTS OF STEAM TURBINES ASME PTC 6s REPORT-1988
I 1 I I I , 2 I I I I I
Rated Load
112 Load
114 Load
FIG. 9.3 THROTTLE PRESSURE CORRECTION FACTORS
77
COPYRIGHT American Society of Mechanical EngineersLicensed by Information Handling ServicesCOPYRIGHT American Society of Mechanical EngineersLicensed by Information Handling Services
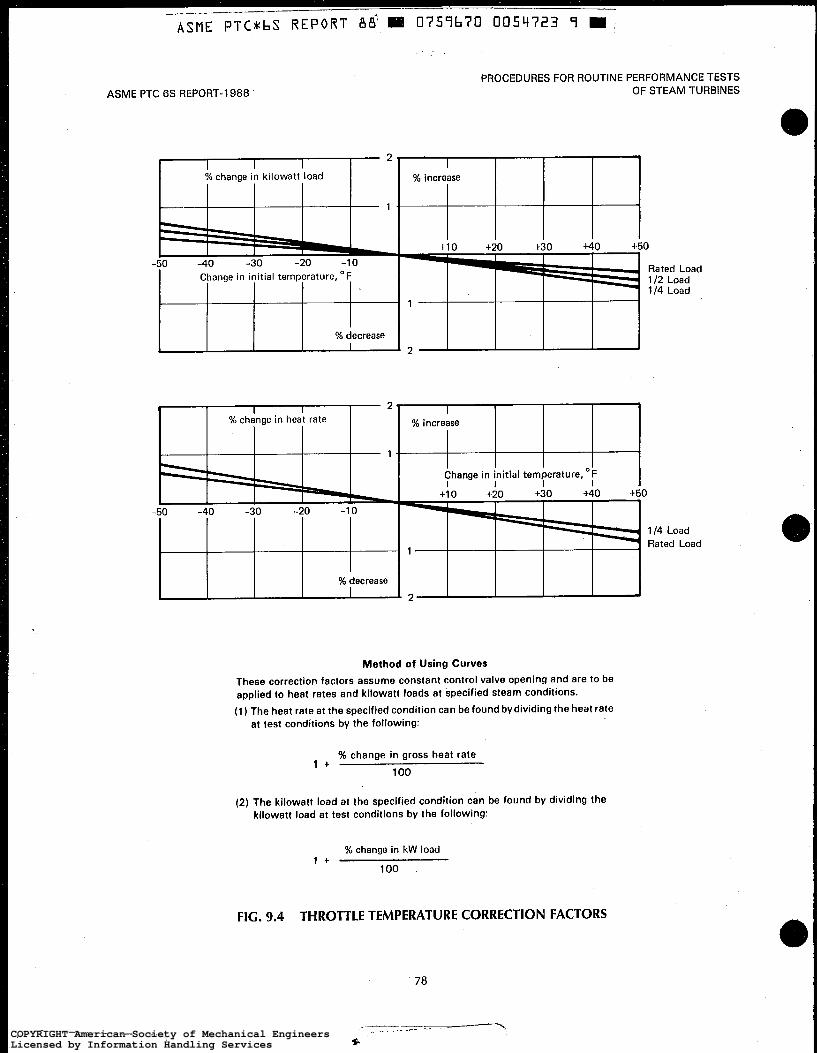
ASME PTC 6s REPORT-1988 PROCEDURES FOR ROUTINE PERFORMANCE TESTS
OF STEAM TURBINES
O
Rated Load 1 I2 Load 114 Load
I % decrease
I
I I I I %change in kilowatt load % increase
+10 t20 +30 +40 +E -20 -10
Change in initial temperature, "F
3:: % decrease
ed Load Load Load
r 1 I I I 2 I % increase I S11
%change in heat rate
Change in initial temperature, 'F I I I I I
+lo +20 +30 +40 +SO -50 -40 -30 -20 -10
I 114 Load
1 Rated Load
% decrease I
I I l I I ' 2 I I 1 I
Method of Using Curves
These correction factors assume constant control valve opening and are to be applied to heat rates and kilowatt loads at specified steam conditions. (1) The heat rate at the specified condition can be found bydividing the heat rate
at test conditions by the following:
1 + % change in gross heat rate
1 O0
(2) The kilowatt load at the specified condition can be found by dividing the kilowatt load at test conditions by the following:
1 + % change in kW load
1 O0
FIG. 9.4 THROTTLE TEMPERATURE CORRECTION FACTORS
78
COPYRIGHT American Society of Mechanical EngineersLicensed by Information Handling ServicesCOPYRIGHT American Society of Mechanical EngineersLicensed by Information Handling Services

ASME PTC*:bS REPORT 88 1%1.0757670 005472Y O M
PROCEDURES FOR ROUTINE PERFORMANCE TESTS OF STEAM TURBINES ASME PTC 6s REPORT-1988
II4 Load I l2 Load 3ated Load
O
112 Load Rated Load
114 Load I
I % decrease
2
Method of Using Curves
These correction factors assume constant control valve opening and are to be applied to heat rates and kilowatt loads at specified steam conditions. (1) The heat rate at the specified condition can be found bydividing the heat rate
at test conditions by the following:
1 + 96 change in gross heat rate
1 O0
(2) The kilowatt load at the specified condition can be found by dividing the kilowatt load at test conditions by the following:
I + % change in kW load
1 O0
FIG. 9.5 REHEAT TEMPERATURE CORRECTION FACTORS
79
COPYRIGHT American Society of Mechanical EngineersLicensed by Information Handling ServicesCOPYRIGHT American Society of Mechanical EngineersLicensed by Information Handling Services

_ _ ~
ASME P T C * h S REPORT B B m 0757h70 0054725 2 m
ASME PTC 6s REPORT-I 988 . PROCEDURES.FOR ROUTINE PERFORMANCE TESTS .. OF STEAM TURBINES
% decrease I
Method of Using Curves These correction factors assume constant control valve opening and are to be applied to heat rates and kilowatt loads at specified steam conditions. (1 )The heat rate at the specified condition can be found by dividing the heat rate
at test conditions by the following:
1 + % change in gross heat rate
1 O0
(2) The kilowatt load at the specified condition can be found by dividing the kilowatt load at test conditions by the following:
1 + % change in kW load
1 O0
FIG. 9.6 REHEATER PRESSURE DROP CORRECTION FACTORS
Load
1 I % increase
COPYRIGHT American Society of Mechanical EngineersLicensed by Information Handling ServicesCOPYRIGHT American Society of Mechanical EngineersLicensed by Information Handling Services

ASME P T C * h S REPORT 88 -W 0 7 5 9 6 7 0 ' 0 0 5 4 7 2 6 4
PROCEDURES FOR ROUTINE PERFORMANCE TESTS . OF STEAM TURBINES ASME PTC 6s REPORT-1988
Exhaust Pressure, in. Hg abs.
Method of Using Curves
Flows near curves are throttle flows at 2400 PSlG 1000°F. These correction factors assume constant control valve opening. Apply corrections to heat rates and kW loads at 1.5 in. Hg abs., 0% MU.
(1) The heat rate at the specified condition can be found by dividing the heat rate at test conditions by the following:
1 + % change in gross heat rate
1 O0
(2) The kilowatt load at the specified condition can be found by dividing the load at test conditions by the following:
% change in gross heat rate 1 -
1 O0
FIG. 9.7 EXHAUST PRESSURE CORRECTION FACTOR
COPYRIGHT American Society of Mechanical EngineersLicensed by Information Handling ServicesCOPYRIGHT American Society of Mechanical EngineersLicensed by Information Handling Services

ASME P T C * b S REPO.RT 88 5l d757b70 005Ll727 b m ’
ASME PTC 6s REPORT-I 988 PROCEDURÈS FOR ROUTINE PERFORMANCE TESTS
OF STEAM TURBINES
8000
c
5 . .c 3 i- m a;
5 7900 t
1 $ c
i-
I I”
a C
7800 300 400
Generator Output, MW
500
FIG. 9.8 HEAT RATE VERSUS LOAD
9.9 CALCULATION OF EXPECTED REPEATABILITY (See para. 3.8.3)
(a) The repeatability values given in para. 9.1 (e) were derived from uncertainty values for the selected instrumentation of para. 9.2. The derivations of these values are presented here to acquaint the user with the factors that were considered.
(b) Instrument uncertainties are given in Table 9.1 based upon the Report on “Guidance for Evaluation of Measurement Uncertainty in Performance Tests of Steam Turbines,” PTC 6 Report-1 985.
9.9.1 Capability Tests (a) Power measurement by one 2’h-element poly-
phase meter and current and potential transformers of 0.3% metering accuracy class is assumed.
Overall power uncertainty is the square root of the sum of the squares of the individual uncertainties ob- tained from tables in PTC 6 Report-1 985.
( 1 ) Metering method uncertainty - from Table 4.1 (c) = 0.5 percent.
(2) Disc revolution uncertainty- assuming 50 disc revolutions were counted and timed. A miscount is possible, but this should be apparent by comparison
82
with successive timings of the same run. Therefore, O percent certainty.
(3) Meter constant uncertainty - from Table 4.3 (c), k0.25 percent.
(4) Potential transformer uncertainty - from Table 4.4 (b) = -10.30 percent. The number of potential transformers required, 2, is from Table 4.1 (c). There- fore, the uncertainty is k0.30/ f i
(5) Current transformer uncertainty from Table 4.5 (b) = -1 0.1 O percent. The number of current trans- formers required from Table 4.1 (c) is 3. Therefore, the uncertainty is -1 0.1 O/ JT
(6) Timing uncertainty.- assuming a time interval of 8 min for 50 revolutions and an increment on the clock of 1 second, the uncertainty is 1 x 100 =
-1 0.21 percent. 8x60
Overall uncertainty =
+ 0.21’
= ~ 0 . 6 4 %
COPYRIGHT American Society of Mechanical EngineersLicensed by Information Handling ServicesCOPYRIGHT American Society of Mechanical EngineersLicensed by Information Handling Services

A S I E PTC*bS R E P O R T 8 8 m 0'757b70 0054728 B W
PROCEDURES FOR ROUTINE PERFORMANCE TESTS OF STEAM TURBINES
TABLE 9.1 INSTRUMENT UNCERTAINTIES
(From PTC 6 Report-1985)
ASME PTC 6s REPORT-I 988
Instrument Description Uncertainty [Note (1)1
Transducer
Manometer (Table 4.1 3)
Exhaust probes (Table 4.1 7)
Potentiometers (para. 4.29)
Thermocouples (Table 4.1 8 )
Potential transformers (Table 4.4)
Current transformers (Table 4.5)
Watthour meters (Table 4.3)
Nozzle (alternate location)
Nozzle (recommended location)
Deadweight tester calibrated
Test, precision-bored, compensated scale, without reading aid
Located at points of demonstrated accuracy, two only
Precision, portable type
Test, continuous leads, calibrated beforeand aftertest in accordance with para. 4.1 06 of the Code and used with +0.03% potentiometer
Type calibration available, VA and pf of burden available, used near unity pf
Type calibration available, VA and pf of burden available
Three-phase portable meter, temperature-controlled enclosure, without mechanical register, calibrated before test, three-phase calibration
Pipe-wall taps, Calibrated before permanent installation, no inspection Base uncertainty, U, = 1.25 @-ratio = 0.6, Up = 0.20 10-D upstream length, UL5, = 0.80 30 section flow straightener, ULs2 = 0.38 4-D downstream length, UD$L = 0.67
Pipe-wall taps, calibrated before installation, inspected before and after test with no change in flow element Base uncertainty, U, = 0.60 @-ratio = 0.50, Up = 0.0 10-D upstream length, U,$, = 0.40 50 section flow straightener, ULs2 = 0.0 4-D downstream length, UDsL = 0.52
+0.25%
20.05 in.
"0.10 in.
f 0.03%
f l ° F
rt: 0.2%
*0.1%
+0.25%
f 1.68%
"0.89%
NOTE (1) See Report on "Guidance for Evaluation of Measurement Uncertainty in Performance Tests of Steam Turbines," PTC 6 Report-1985.
(b) The effect of instrument uncertainty upon the load correction factors varies from turbine to turbine. Table 9.2 gives typical values for the reheat- regenerative turbine of the sample calculations.
(c) Uncertainty in corrected power i s the square root of the sum of the squares of the correction-factor uncertainties and the measured-power uncertainty, or
&0.6412 + (0.03412+ (0.007)2 + (0.033)2 t (0.22)'+ (0.1 2)2
= *0.69%
(4 The repeatability by para. 3.8.3 is one-half of the uncertainty or kO.35 percent.
9.9.2 Enthalpy-Drop Tests (a) Following the procedures outlined in the Guid-
ance Report, PTC 6 Report-1 985, an error analysis for enthalpy-drop tests shows that the overall uncertainty is dependent upon the uncertainty of the instrumenta- tion, the slopes of the enthalpy-pressure and enthalpy- temperature curves, and the magnitude of the enthalpy drop in the turbine section.
(b) Table 9.3 gives typical values of uncertainty for both high-pressure and intermediate-pressure tur- bines. These values were used to vary input data to a computer program and the output information was evaluated to determine their effect upon turbine- section efficiencies. The change in efficiency in the ex- ample for each measurement uncertainty is shown in
83
COPYRIGHT American Society of Mechanical EngineersLicensed by Information Handling ServicesCOPYRIGHT American Society of Mechanical EngineersLicensed by Information Handling Services

ASME PTC 6s REPORT-I 988 PROCEDURES FOR ROUTINE PERFORMANCE TESTS
OF STEAM TURBINES
TABLE 9.2 LOAD-CORRECTION-FACTOR UNCERTAINTIES
~~
Instrument Instrument Effect of Correction-Factor Measurement Variable Uncertainty Range Load-Correction Curve Uncertainty, %
Pressure 5 0.25% 3000 psi 0.0045%/psi f 0.034
Temperature [Note ( l) ] f l.O°F ... 0.01 %/"F 50.007
Hot reheat Temperature [Note (l)] -1 1 .O"F a . . 0.047°/o/0F *0.033
Pressure f 0.25 yo 1 O00 psi 0.25%/% k0.220
Pressure Drop Pressure 50.25'/0 1 O00 psi 0.25%/% k0.220
Throttle
Reheater
Pressure +0.05 in.
Probes +0.10 in. ..* Exhaust
... 1.1 %/in. -10.120
NOTE: (1) Two thermocouples specified for each location. Since insturment uncertainty i s primarily random uncertainty, the uncertainty in these mea-
surements is inversely proportional to the square root of the number of measurements, or l "F/&! = 0.7"F.
TABLE 9.3 TYPICAL ENTHALPY-DROP UNCERTAINTY VALUES
Instrument Instrument Measurement Change In Enthalpy-Drop Measurement Variable Sensors Uncertainty Range Uncertainty Efficiency Uncertainty
Pressure 1 -Trans +0.25% 3000 psi 7.5 psi 0.23% f0.2770
Temperature 2-TC & 1.0"F ... 0.7OF 0.19% *0.22% Throttle
[Note (1 )I
Pressure 1-Trans 56.25% 1 O00 psi 2.5 psi 0.29% +_0.34%
Temperature 2-TC -1 1 .O°F ... 0.7"F 0.22% f 0.26% Cold reheat
[Note (1 )I
Pressure 1 -Trans 50.25% 1 O00 psi 2.5 psi O. 14% +0.15%
Temperature 2-TC 5 1 .O"F ... 0.7"F 0.08% ~ 0 . 0 9 % Hot reheat
[Note (1 )I
Pressure 1-Trans +0.25% 500 psi 1.25 psi 0.80% +0.87%
Temperature 2-TC 5 1 .O"F . . I 0.7"F 0.1 1010 5 0.1 2% Crossover
[Note (1 )I
NOTE: (1) For multiple sensors used for the same measurement, the measurement uncertainty i s the individual sensor uncertainty divided by the square
root of the number of sensors used to obtain the measurement. For example, if throttle temperature is measured with two identical calibrated thermocouples with uncertainties of 1 "F each, the measurement uncertainty would be 1 O F / n or 0.7"F.
COPYRIGHT American Society of Mechanical EngineersLicensed by Information Handling ServicesCOPYRIGHT American Society of Mechanical EngineersLicensed by Information Handling Services

ASME PTC*bS REPORT f l € ! ' f E l 0757b70 I . 005.L1730 b
PROCEDURES FOR ROUTINE PERFORMANCE TESTS OF STEAM TURBINES
Table 9.3. To determine the individual uncertainties, as shown in the final column, it is necessary to divide each change in efficiency by the base efficiency.
(c) Uncertainty in turbine section efficiency is the square root of the sum of the squares of the individual uncertainties, or, for the high-pressure turbine,
./(0.27)2 + (0.22)2 + (0.34)' + (0.26)2 = f0.55%
and, for the intermediate-pressure turbine
h/(0.15)' + (O.09l2 + (0.87)' + (0.12') = &0.90%
(d) Repeatabifity by para. 3.8.3 is one-half of the uncertainty, or +0.27% for the high-pressure-turbine efficiency and * 0.45% for the intermediate-pressure- turbine efficiency.
(e) Since uncertainty is dependent upon the range of available energy and the pressure and temperature levels at the end points, Table 9.4 is presented to give guidanceon the approximate repeatability levels using the recommended instrumentation for the turbine con- ditions shown.
9.9.3 Heat-Rate Tests (a) The report on "Guidance for Evaluatiorr of Mea-
surement Uncertainty in Performance Tests of Steam Turbines" presents a table of probable values of the ef- fects of individual measurements on corrected heat rate for reheat-regenerative turbines in the approxi- mate rangeof the example. Using the information from Table 9.1 of this Report and Table 5.2 from the Guid- ance Report, the following individual uncertainties were found:
Variable
Throttle temperature Throttle pressure Cold reheat
temperature Cold reheat pressure Hot reheat
Hot reheat pressure Final feed temperature
temperature
Uncertainty
20.7"F
k0.7"F f0.25%
5 0.25% kO.7"F
kO,25% kO.7OF
Power k0.64% Primary Flow f 1.68% [Note U )]
NOTE: (1) See Table 9.1 for descriptive information.
*0.89%
ASME PTC 6s REPORT-1 988
TABLE 9.4 APPROXIMATE REPEATABILITY LEVELS FOR
REHEAT-REGENERATIVE TURBINES, ENTHALPY-DROP-EFFICIENCY TESTS
Approximate Repeatability
level For Approximate Intermediate- Repeatability Pressure
Level For High- Turbine- Reheat-Regenerative Turbine Pressure-Turbine Section
Steam Conditions Section Efficiency Efficiency
0.7-0.75% NHP) 0.6-0.7% 3500 psidl 000/1 OOOll OOOOF
0.5-0.6% (HP) ... 3500 psidl OOO/lOOO°F O.4-0.5% 0.4-0.5%
2400 psidl OOO/lOOO°F 0.35-0.45% 0.2-0.5%
1800 psid l OOO/lOOO°F O.4-0.45% O.2-0.5%
(b) Overall uncertainty in corrected heat rate i s the square root of the sum of the squares of the individual uncertainties, or * 1 . lo% for the condensate feed- water flow location and * 1.80% for the final feed- water location.
(c) Repeatability for thecondensate flow location is +0.55% and for the final feedwater flow location * 0.90%.
Resulting Uncertainty in Correcteed Heat Rate, %
f 0.05 k0.008 f0.03
k0.016 k0.035
50.02 50.084 for final feedwater flow measurement location kO.025 for condensate flow measurement location 20.64% [See para. 9.9.1 (a)] 2 1.68% for final feedwater flow measurement location 50.89% for condensate flow measurement location
85
COPYRIGHT American Society of Mechanical EngineersLicensed by Information Handling ServicesCOPYRIGHT American Society of Mechanical EngineersLicensed by Information Handling Services
ASME P T C * b S R E P O R T BEI R@"'0759b70 0054731 B m
PROCEDURES FOR ROUTINE PERFORMANCE TESTS OF STEAM TURBINES ASME PTC 6s REPORT-1988
SECTION 10 - TEST FOR CONDENSING TURBINE, REGENERATIVE CYCLE, WITH
SATURATED INLET STEAM
10.1 INTRODUCTION
(a) A simplified turbine heat-rate test is recom- mended as the best routine check of the performance of this type of turbine. When deterioration of perfor- mance is indicated, additional measurements should be made to locate the source of this deterioration. These additional measurements include readings of all available stage pressures, gland leakages, and heater terminal temperature differences.
(b) Recommended test procedures, instrumenta- tion requirements, reading frequencies, and test dura- tion have been chosen to measure critical variables with sufficient accuracy to produce results that should be repeatable within f 0.7 percent' on aday-to-day ba- sis, (See para. 3.8.3. Refer to paras. 4.4.1 through 4.4.5 for factors affecting expected repeatability over longer periods of time.)
(c) The example presented in para. 10.8 is based on a nonreheat turbine; however, the same procedure ap- plies equally to turbines utilizing live-steam reheating, and the results are also repeatable within p0.7 percent without the use of additional instrumentation.
(d) The recommended test will require an esti- mated minimum of four observers plus a test supervi- sor, If additional data beyond the minimum required for heat rate determination is desired, additional ob- servers may be needed,
10.2 INSTRUMENTATION REQUIREMENTS
(a) Special test instrumentation is recommended
Generator output Feedwater flow Throttle steam pressure Low-pressure turbine exhaust pressure
for the following critical variables:
'See para. 10.9 for derivation of this value.
Final feedwater temperature Throttle steam quality First stage pressure
The recommended instruments will measure critical variables with sufficient accuracy for test results that are repeatable to the percentage given in para. 10.1 (b) if the recommendations of Section 4 for their installation and use are observed,
4.2.7.
Primary element: See paras. 4.4.1 through 4.4.4. Location of primary element: See Location 1 of Table 4.1. Measurementof differential pressure: See paras. 4.4.6 and 4.4.7.
( 1 ) Generator Output. See paras. 4.2.1 through
(2) Feedwater Flow:
(3) Pressure. See para. 4.5 (4) Temperature. See paras. 4.6.1 through 4.6.4. (5) Low-Pressure Turbine Exhaust Pressure. See
paras. 4.5.8 through 4.5.10. (6) Throttle Steam Quality. See para. 4.7. If the
turbine is supplied through multiple leads, duplicate measurements should be made in each lead.
(b) Where live-steam reheating i s employed, it is desirable to obtain also test measurements of hot- reheat steam pressures and temperatures. These mea- surements provide supplemental information for analyzing the cause of performance deterioration as typically described in para. 10.7. However, these mea- surements are not essential to performing the sirnpli- fied turbine heat rate test herein described.
(c) Secondary Readings. See para. 4.1 O.
10.3 INSTRUMENT LOCATIONS
The required instrumentation for a simplified heat rate test is indicated on Fig. 10.1. Also shown are addi- tional measurements which can be used to determine the causes of deterioration in performance.
87
/?""" ~- -%
COPYRIGHT American Society of Mechanical EngineersLicensed by Information Handling ServicesCOPYRIGHT American Society of Mechanical EngineersLicensed by Information Handling Services

Stea
m
to
thro
ttle
r M
oist
ure
sepa
rato
r -
P -
pres
sure
T
- te
mpe
ratu
re
A I
1,
P I\
0 X
- st
eam
qu
ality
Stea
m
0 PI
W
- flo
w
/l A
m
kW
- kii
lowa
tts
,W
k PF
-
powe
rfacto
r
I o-
sp
ecia
l te
st in
stru
men
tatio
n [
v;
kcs\
1
1 Ge
nera
tor
1 *E
l
+ I
I
I I
I I
I l(p
)
-*clp
l u
- se
cond
ary
inst
rum
enta
tion
n -
estim
ated
va
lue
*indi
cate
s es
sent
ial
inst
rum
enta
tion
for
roun
tine
heat
ra
te
test.
Stea
m
gene
rato
r
Cool
er
4
c G
land
Ej
ecto
r
SE3
\ \
c\r-
/ /
cond
. Co
nd.
I I
FIG
. 10
.1
INST
RU
MEN
TATI
ON
FO
R R
OU
TIN
E PE
RFO
RM
ANC
E TE
STS
FOR
CO
ND
ENSI
NG
TU
RBI
NE,
R
EGEN
ERAT
IVE
CYC
LE,
WIT
H
SATU
RAT
ED
INLE
T ST
EAM
COPYRIGHT American Society of Mechanical EngineersLicensed by Information Handling ServicesCOPYRIGHT American Society of Mechanical EngineersLicensed by Information Handling Services
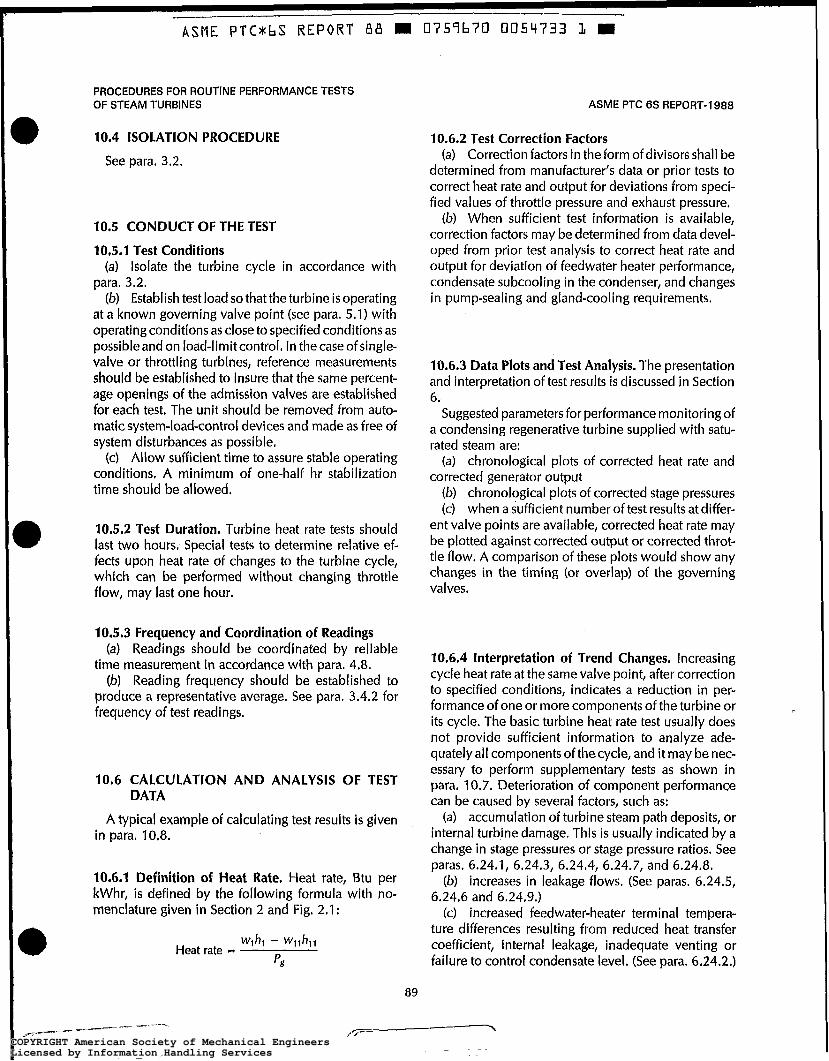
ASME P T C * b S REPORT 8 8 W
PROCEDURES FOR ROUTINE PERFORMANCE TESTS OF STEAM TURBINES
10.4 lSOLATlON PROCEDURE
See para. 3,2.
10.5 CONDUCT OF THE TEST
10.5.1 Test Conditions (a) Isolate the turbine cycle in accordance with
para. 3.2. (b) Establish test load so that the turbine is operating
at a known governing valve point (see para. 5.1) with operating conditions as close to specified conditions as possible and on load-limit control. In the case of single- valve or throttling turbines, reference measurements should be established to insure that the same percent- age openings of the admission valves are established for each test. The unit should be removed from auto- matic system-load-control devices and made as free of system disturbances as possible.
(c) Allow sufficient time to assure stable operating conditions. A minimum of one-half hr stabilization time should be allowed.
10.5.2 Test Duration. Turbine heat rate tests should last two hours. Special tests to determine relative ef- fects upon heat rate of changes to the turbine cycle, which can be performed without changing throttle flow, may last one hour.
10.5.3 Frequency and Coordination of Readings (a) Readings should be coordinated by reliable
time measurement in accordance with para. 4.8. (b) Reading frequency should be established to
produce a representative average. See para. 3.4.2 for frequency of test readings.
10.6 CALCULATION AND ANALYSIS OF TEST DATA
A typical example of calculating test results is given in para. 10.8.
10.6.1 Definition of Heat Rate, Heat rate, Btu per kWhr, i s defined by the following formula with no- menclature given in Section 2 and Fig. 2.1 :
Heat rate W l h l - W l l h , l
P€!
ASME PTC 6s REPORT-1 988
10.6.2 Test Correction Factors (a) Correction factors in the form of divisors shall be
determined from manufacturer’s data or prior tests to correct heat rate and output for deviations from speci- fied values of throttle pressure and exhaust pressure.
(b) When sufficient test information i s available, correction factors may be determined from data devel- oped from prior test analysis to correct heat rate and output for deviation of feedwater heater performance, condensate subcooling in the condenser, and changes in pump-sealing and gland-cooling requirements.
10.6.3 Data Plots and Test Analysis. The presentation and interpretation of test results is discussed in Section 6,
Suggested parameters for performance monitoring of a condensing regenerative turbine supplied with satu- rated steam are:
(a) chronological plots of corrected heat rate and corrected generator output
(b) chronological plots of corrected stage pressures (c) when a sufficient number oftest resultsatdiffer-
ent valve points are available, corrected heat rate may be plotted against corrected output or corrected throt- tle flow. A comparison of these plots would show any changes in the timing (or overlap) of the governing valves.
10.6.4 Interpretation of Trend Changes. Increasing cycle heat rate at the same valve point, after correction to specified conditions, indicates a reduction in per- formance of one or more components of the turbine or its cycle. The basic turbine heat rate test usually does not provide sufficient information to analyze ade- quately all components of the cycle, and it may be nec- essary to perform supplementary tests as shown in para. 10.7. Deterioration of component performance can be caused by several factors, such as:
(a) accumulation of turbine steam path deposits, or internal turbine damage. This is usually indicated by a change in stage pressures or stage pressure ratios. See paras. 6.24.1, 6.24.3, 6.24,4, 6.24.7, and 6.24.8.
(b) increases in leakage flows. (See paras. 6.24.5, 6.24.6 and 6.24.9.)
(c) increased feedwater-heater terminal tempera- ture differences resulting from reduced heat transfer coefficient, internal leakage, inadequate venting or failure to control condensate level. (See para. 6.24.2.)
89
COPYRIGHT American Society of Mechanical EngineersLicensed by Information Handling ServicesCOPYRIGHT American Society of Mechanical EngineersLicensed by Information Handling Services

_ _ _ _ ~
ASME P T C * b S %EPORT B B m 0757b70 0 0 5 4 7 3 4 3 m
ASME PTC 6s REPORT-1 988
10.7 SUPPLEMENTARY TESTS
Supplementary tests may be required to analyze the cause of performance deterioration. These may be con- ducted separately or in conjunction with the simplified heat ratetest. When conducted separately, stable oper- ating conditions and the same governing valve posi- tion that existed during the test should be used as the basis of comparison.
(a) Stage pressures may be measured periodically, preferably at valves wide open. The minimum recom- mended test duration is 30 minutes. If steam quality differs appreciably from the specified value, additional corrections for moisture content should be made on the basis of data supplied by the manufacturer. See paras. 6.1 2 to 6.1 3.4 for corrections due to deviation of throttle pressure from specified value. A comparison of pressure ratios (inlet pressure divided by outlet pres- sure) for turbine sections or for groups of stages, includ- ing the governing valves, is also of value.
(b) Terminal temperature differences (and drain- cooler-approach temperature differences) of each feedwater heater in the heater cycle indicate changes in heater performance which affect heat rate results. Temperature and pressure measurements should be taken at each point of steam and water entry or exit, at the specified valve openings. Test duration should be at least 30 minutes. Usually two observers are required for this test.
(c). Packing leakages can be measured with secondary-flow measuring devices at the specified valve opening under stable conditions. Increased packing-leakage flow indicates deterioration of inter- nal packing clearances, resulting in poorer heat rates. Leakage tests should last at least one hour. They usu- ally require two to three observers.
(d) Phased isolation tests can be used to determine the source of steam bypassing the turbine. Two tests are conducted at constant cycle heat input, one with the cycle operating normally and the other with the cy- cle isolated, per para. 3.2. The isolation is accom- plished in several phases and the gain in power output due to each phase is determined with accurate power measuring instrumentation.
Incremental gains in generation aid in the identifica- tion of wasted thermal energy. Steam conditions are measured and thevalues are used to determine correc- tion factors from manufacturer's data or from prior tests to correct for deviation from specified values.
The instruments required follow the recommenda- tions in para. 10.2 (a).
Each system, such as feedwater heater vents, con- densate pump recirculation, etc., is isolated and the
PROCEDURES FOR ROUTINE PERFORMANCE TESTS OF STEAM TURBINES
unit is allowed to stabilize for at least 30 minutes. Cen- eration is measured to detect any increase due to that isolation phase. After full isolation has been com- pleted, the unit is allowed to stabilize for one hour be- fore a two hour maximum capability test is run.
The thermal output of a nuclear steam supply system must remain constant during the entire phased isola- tion test in order that the measured power changes are meaningful.
10.8 SAMPLE CALCULATIONS
Specified Conditions Throttle steam pressure, psia 464.7 Quality of throttle steam, '/O 99.75 Exhaust pressure, in. Hg abs. 1 .o Power factor, '10 80.0 Hydrogen pressure, psig D 15.0
Reference Heat Rate- 1 1,050 Btu/kWhr, with maxi- mum valve opening, and with all operating conditions at the specified values.
Test Results Throttle steam pressure, psia 467.7 Quality of throttle steam, '/O 99.8 Enthalpy of throttle steam, Btu/lbm 1203.3 Exhaust pressure, in. Hg abs. 1.26 Feedwater leaving No. 3 heater:
temperature, "F 335.7 enthalpy, Btu/lbm 306.7
Feedwater flow to steam generator, Ibmlhr 1,848,000
Generator Output, kW Power factor, '/O
Hydrogen pressure, psig
146,760 88.0 18.0
Changes in stored water during 2 hr test period Condenser hptwell storage = - 7200 (level fall) Ibm Steam generator storage = + 700 (level rise) Ibm Make-up = o
System leakage = 7200 - 700
2 = 3250 Ibm/hr
(assumed to be from the steam generator)
Steam to ejector = 750 Ibm/hr (estimated on basis of previous test data)
COPYRIGHT American Society of Mechanical EngineersLicensed by Information Handling ServicesCOPYRIGHT American Society of Mechanical EngineersLicensed by Information Handling Services

ASME PTC*bS REPORT B B m 0759b70 005L1735 5 m
PROCEDURES FOR ROUTINE PERFORMANCE TESTS OF STEAM TURBINES
Throttle steam flow = Feedwater flow - system leak- age - increase in steam genera- tor storage - steam to ejector
= 1,848,000 - 3250 - - - 750 700 2
= 1,843,650 Ibm/hr
Electrical Losses (From manufacturer’s curves)
80% power factor, losses = -1767 kW 88% power factor, losses = +1572 kW Load corrected to 80% power factor = 146,565 kW
Additional Losses With Increased Hydrogen Pressure Hydrogen pressure was 18 psig, instead of the speci-
fied 15 psig, increasing losses by 29 kW.
Generator output corrected to
Oufput = 146,760 kW
specified power factor and = 146,565 + 29 hydrogen pressure = 146,594 kW
1,843,650 X 1203.3 - 1,848,000 X 306.7 Test heat rate = 146,594
= 11,267 BtukWh
GROUP 2 CORRECTION FACTORS (From manufac- turer’s curves)
Heat Rate Output
Throttle pressure 0.9990 1 .O065 Exhaust pressure 1 .O1 1 O 0.9891 Product of correction factors 1 .O1 O0 0.9955
Corrected heat rate = - = 11,155 BtukWh 11 267 1 .o1 O0
146 594 0.9955
Corrected output =A = 147,257 kW
Heat rate above reference = (11,155 - 11,050)
11,050 x 100
= 0.95%
Corrected throttle steam flow = test flow x j-
= 1,843,650 X - - J 464.7 x 0.9905 467.7 0.9965
ASME PTC 6s REPORT-I 988
= 1,832,190 Ibm/h
10.9 CALCULATION OF EXPECTED REPEATABIL- ITY
10.9.1 Feedwater Flow Nozzle. Calibrated pipe-wall- tap nozzle in flow section meeting Code requirements. Because of location following the final feedwater heater and feedwater pump there was no inspection.
Base uncertainty ( J B = +_ 1.25% 18-D upstream straight pipe ULS, = &- 0.0% 50-section flow straightener UL52 = f 0.0% &ratio = 0.5 up = * 0.0% 8-D downstream straight pipe c0.09%
Uncertainty =
J ( 1 . W 2 + + + (0.0)’ + (0.09)2 = -t. 1.25%
10.9.2 Flow Differential. Test manome€er, precision bored, compensated scale, without reading aid.
Uncertainty = f0.05 in. Hg Test differential = 30.0 in. Hg
Uncertainty = - x 100 = *0,17% 0.05 30.0
+o 17 2
Flow uncertainty = L = ~ 0 . 0 9 %
10.9.3 Throttle Steam Pressure. Transducer, medium accuracy, laboratory-calibrated, 0-1000 psi range.
Uncertainty = *0.10% of full scale
Uncertainty = - *0.10 1 O0
x 1000 = k1.0 psi
Heat rate correction = 0.033°/~/1 .O psi Heat rate uncertainty = 0.033 x 1.0 = +0.03%
The error in steam enthalpy for a 1 .O psi uncertainty in pressure is negligible.
91
COPYRIGHT American Society of Mechanical EngineersLicensed by Information Handling ServicesCOPYRIGHT American Society of Mechanical EngineersLicensed by Information Handling Services

ASME PTC 6s REPORT-I 988
10.9.4 Throttle Steam Quality. Uncertainty in deter- mination of steam quality results primarily from the dif- ficulty in obtaining a representative sample. Data to predict the possible error is not available. Design mois- ture contents for throttle steam are low, however, and a sizeable percentage error in moisture content results in a relatively small error in turbine heat rate. Assuming a 100% error in moisture content:
Uncertainty in moisture content - ~ 0 . 2 % Uncertainty in steam enthalpy = f 1.5 Btu/lbm hl, - hl l - 1203.3 - 306.7 = 896.6 Btu/lbm
Uncertainty in heat rate = - 896.6 x 100
= f 0.1 7%
10.9.5 Final Feedwater Temperature. Calibrated test thermocouple with continuous leads used with f 0.05% potentiometer.
Uncertainty in reading = k2.0 "F Uncertainty in enthalpy = f2.1 Btullbm hl, - hll - 1203.3 - 306.7 = 896.6 Btu/lbm
Uncertainty in heat rate = - 2.1 896.6 x loo k0.23'10
10.9.6 Exhaust Pressure. One probe located in each exhaust end at points of demonstrated accuracy.
PROCEDURES-FOR ROUTINE PERFORMANCE TESTS OF STEAM TURBINES
Uncertainty in measurement = f0.2 in. Hg Transducer, medium accuracy, laboratory calibrated. Uncertainty in measurement = &0.05 in. Hg
Overall uncertainty in measurement =
J (0.212 + (0.0512 = f0.21 in. Hg
Heat rate correction = 0.28%/0.1 in. Hg
Uncertainty in heat rate = 0.28 x - 0.21 0.1 o
= f 0.59%
10.9.7 Output. The type calibration curves, volt am- peres and power factors of burdens were available for both potential and current transformers. A three-phase electronic watthour meter with high accuracy digital readout, calibrated before test, was used.
Uncertainties Potential transformer 0.20% Current transformer -I 0.1 0% Watthour meter +0.15%
Overall uncertainty = 4 (0.20)2 + (0.10)' + (0.15)2 = &0.27%
92
_"__ '2" - - - - ~- Y~
COPYRIGHT American Society of Mechanical EngineersLicensed by Information Handling ServicesCOPYRIGHT American Society of Mechanical EngineersLicensed by Information Handling Services

PROCEDURES FOR ROUTINE PERFORMANCE TESTS OF STEAM TURBINES
Measurement
TABLE 10.1 SUMMARY
ASME PTC 6s REPORT-1988
Square of Instrument Heat Rate Heat Rate Uncertainty Uncertainty, Yo Uncertainty
Flow nozzle f 1.25% f 1.25
Flow differential f.0.05 in. Hg fO.09
Throttle steam pressure f 1.0 psi f0.03
Throttle steam quality f 0.2% f0.17
Final feed temperature f: 2.O0F f0 .23
Exhaust pressure f0.21 in. Hg f0.59
output k0.27% k0,27
Sum of Squares =
1 .S625
0.0081
0.0009
0.0289
0.0529
0.3481
0.0729
2.0743
Overall heat rate uncertainty = d s u m of squares = f 1.44%
uncertainty f 1.44 Repearability = -- 2 2
- = f0.72'10
93
COPYRIGHT American Society of Mechanical EngineersLicensed by Information Handling ServicesCOPYRIGHT American Society of Mechanical EngineersLicensed by Information Handling Services

ASME P T C * h S REPORT 8.d 0 7 5 7 6 7 0 0 0 5 4 7 3 8 0 m >. . .
PROCEDURES FOR ROUTINE PERFORMANCE TESTS OF STEAM TURBINES ASME PTC 6s REPORT-I 988
SECTION 11 - TEST FOR NONCONDENSING NONEXTRACTION TURBINE, WITH
SUPERHEATED EXHAUST
11.1 INTRODUCTION.
Noncondensing, nonextraction turbines (topping units) usually drive power auxiliaries and some pro- cess plant equipment. Tests described in this Section are intended to reveal changes in turbine performance which result from deterioration in blade performance, increased clearance of interstage seals and increased packing clearance. These tests are the internal effi- ciency enthalpy- drop and the maximum capability test. Packing leak-off flow should be monitored from station instrumentation to provide information on seals and packing clearances. (See also para. 1 1.7.)
(a) Internal Efficiency Enthalpy-Drop. This is the simplest and most accurate routine test. The funda- mental requirements are:
( I ) superheated steam conditions at both the throttle and exhaust end of the turbine;
(2) steam conditions (pressure and temperature) as close to design as possible;
(3) a load coordinate such as governing valve point, first-stage shell pressure, or steam flow;
(4) constant or a specific rpm. (b) Maximum Capability. The capability test con-
sists of measuring electrical or mechanical output at a particular governing valve point, preferably valves wide open, and steam pressures and temperatures nec- essary to apply load correction factors.
Measured electrical output must be corrected for var- iation from specified values of power factor and hydro- gen pressure prior to application of the load correction factors. This involves calculating the test coupling kilo- watts and then subtracting the electrical and mechani- cal losses that would occur at specified power factor and hydrogen pressure.
(c) Test Procedures, Instrumentation, Duration, and Reading Frequency.
These are listed below and were chosen to measure critical variables with sufficient accuracy to produce
95
results that are estimated to be repeatable within the following percentages (see para. 3.8.3):
Test Repeatability
Enthalpydrop efficiency &0.50% [Note (111 Maximum capability +0.31% [Note (l)]
NOTE: (1) See para. 1 1.9 for derivation of these values.
These tests require an estimated number of three ob- servers, depending on the test set up.
11.2 INSTRUMENT REQUIREMENTS
(a) Precision instrumentation is recommended for primary readings for each test as follows:
Reading Throttle pressure and temperature Nozzle bowl pressure First-stage pressure Exhaust pressure and temperature Turbine shaft power Generator output Turbine shaft speed
Enthalpy Drop
X
X
X X
...
... X
Maximum Capability
X X
X
X X
X
X
( I ) Pressure. See para. 4.5. (2) Temperature, See paras. 4.6.1.2, 4.6.3, and
(3) Generator Output. See para. 4.2. (4) Measurements of Driven Equipment. Preci-
sion instrumentation i s necessary to measure the per- formance of driven equipment and should conform to para. 4.3, and to applicable sections in the Perform- ance Test Codes for the specificequipment. For exam- ple, water-flow measurement is a primary precision requirement for a pump, and gas-flow measurement is a primary precision requirement for a compressor.
4.6.4.
(5 ) Shaft Speed. See para. 4.1 2.
COPYRIGHT American Society of Mechanical EngineersLicensed by Information Handling ServicesCOPYRIGHT American Society of Mechanical EngineersLicensed by Information Handling Services

ASME PTC 6s REPORT-1 988
(b) Station Instruments. For secondary readings,
(c) Manufacturer’s Data. See para. 4.1 l. see para. 4.1 O.
11.3 INSTRUMENT LOCATIONS
Figure 11.1 shows schematic arrangements of pri- mary and secondary instrumentation locations for the noncondensing, nonextracting turbine. The physical configuration of the turbine exhaust piping and steam leak-off lines should be considered before locating the instrumentation to determine the exhaust steam condi- tions.
11.4 OUTLINE OF ISOLATION PROCEDURE
(a) For enthalpy-drop efficiency tests, isolation is not normally required. However, cycle conditions af- fecting turbine section pressure ratios should be con- sistent between tests.
(b) For maximum capability tests, isolate the tur- bine cycle as described in para. 3.2.
(c) Prior to each capability test, isolation valves should be placed in the desired position and tagged. Performance test results shall be based only on infor- mation obtained when the turbine cycle is isolated as set forth in (a) and (b) above.
11.5 CONDUCT OF THE TEST
It is generally advantageous to conduct enthalpy- drop efficiency tests at governing valve points. These particular governing valve positions can easily be re- peated over a period of years, permitting periodic tests withoutexcessive throttling loss through partially open governing valves. Corrected maximum capability tests must be run with governing valves at their maximum travel.
11.5.1 Establishing Test Load. For enthalpy-drop effi- ciency tests, set the turbine load at the desired valve position (see para. 5.11, and for maximum capability tests, set the governing valves at their maximum travel. Manufacturer’s data or previous data must be con- sulted to select load points where the exhaust of the turbine is in the superheated steam region. Turbine steam conditions should be as close to specified as pos- sible and the permissible fluctuation in reading should . be within the limits of the Code. The turbine should be on load limit control and the generator or other driven equipment should be removed from automaticsystern-
0759b70 0054739 2 W
PROCEDURES FOR ROUTINE PERFORMANCE TESTS OF STEAM TURBINES
load control devices to be made free from system dis- turbances. For maximum capability, the turbine heat cycle shall be isolated in accordance with para. 3.2. Allow a minimum of one-half hr stabilization time,
11.5.2 Test Duration. Tests described in this Section should be of one hour duration. Less time is needed if the test conditions are stable and within permissible fluctuation limits of the Code.
Monitoring, by the test supervisor, of the kilowatt counter reading, and temperature data, will provide quick indication on test progress and whether or not the test needs to be extended.
11.5.3 Frequency and Coordination of Readings. Readings should be coordinated by reliable time mea- surement in accordance with para. 4.8.
Reading frequency should be established to produce a representative average. (See para. 3.4.2.)
11.6 CALCULATION OF TEST RESULTS
11.6.1 Data Preparation and Calculations. Raw data should be examined for consistency and reliability. Paragraph 3.5 should be consulted as a guide for data reduction and calculation techniques.
11.6.2 Formulas and Sample Calculations. Enthalpy- drop efficiency formulas and sample calculations are given on Fig. 5.3 and in para. 11.8.
Corrected capability sample calculations at valves wide open are given in para. 11.8.
11.6.3 Test Correction Factors. Correction factors can be determined from manufacturer’s data or prior tests to correct steam rate and output for deviations from specified values of throttle pressure, throttle tempera- ture, and exhaust pressure.
Correction factor curves supplied by the manufac- turer can be verified by test, if necessary.
1 1.6.4 Data Plots and Test Analyses. Corrected steam rate and power output can be compared on a chrono- logical basis by determining the deviation from accep tance test or guarantees.
Test turbine efficiencies, stage pressures, ratios of pressures across groups of stages and packing-leakage flows can be compared in a similar manner to steam rates.
COPYRIGHT American Society of Mechanical EngineersLicensed by Information Handling ServicesCOPYRIGHT American Society of Mechanical EngineersLicensed by Information Handling Services

ASME P T C * b S R E P O R T & B E J 0759670 0054740 9 . .
PROCEDURES FOR ROUTINE PERFORMANCE TESTS OF STEAM TURBINES
@ stop
Legend
0 Special
Secondary Enthalpydrop test P - Pressure
T - Temperature W - Flow
kW - Kilowatts I - Current
E - Voltage
N - Rotational speed
ASME PTC 6s REPORT-I988
@ stop
+ m Capacity test
FIG. 11.1 INSTRUMENT LOCATIONS FOR NONCONDENSINC, NONEXTRACTION TURBINES
11.7 SUPPLEMENTARY TESTS
Packing leakages can be measured with secondary flow measuringdevices in accordancewith para. 4.4.8 at valves wide open under stable conditions. The test should last a minimum of one hour and usually re- quires two or three observers,
Increased packing-leakage flow is indicative of dete- rioration of internal packing clearances resulting in poorer performance.
11.8 SAMPLE CALCULATIONS
11.8.1 Enthalpy-Drop Efficiency Test Measurements Initial steam pressure 1247 psia Initial steam temperature 859.4"F Initial steam enthalpy 1414.5 Btu/lbm Exhaust steam pressure 422.5 psia Exhaust steam temperature 61 5.1 "F Exhaust steam enthalpy 131 4.4 Btu/lbm Isentropic enthalpy 1286.8 Btu/lbm
Enthalpy-drop efficiency = - x 100 hi - h, hi - h,
1414,5 - 1314.4 1414.5 - 1286.8
= x 100
= 78.39%
11.8.2 Maximum Capability. Correct the measured generator output to the value which would have been obtained had specified values of power factor, voltage, and gas pressure been maintained during the test.
Uncorrected generator output at 0.87 pf and 14.0 psig hydrogen pressure. 18,000 kW
From manufacturer's curves . LOSS with 0.87 pf 265 kW
Loss with 0.80 pf 290 kW Loss with 15.0 psig hydrogen pressure 40 kW Loss with 14.0 psig hydrogen pressure 36 kW
Test conditions: 265 kW + 36 kW = 301 kW Specified conditions: 290 kW + 40 kW = 330 kW
Generator output corrected to specified generator op erating conditions:
18,000 + 301 - 330 = 17,971 kW
Gland seal data from secondary measurements: No. 1 gland leak-off 650 Ibm/h, 20 psia
71 3"F, 1389.9 Btu/lbm
No. 2 gland leak-off 8,000 Ibm/h, 20 psia 700"F, 1383.5 Btu/lbm
Turbine mechanical 150 kW (From manufac- losses turer's data)
97
COPYRIGHT American Society of Mechanical EngineersLicensed by Information Handling ServicesCOPYRIGHT American Society of Mechanical EngineersLicensed by Information Handling Services

ASME P T C * b S REPORT A8 UB;Ò759b70 005q74L O W
ASME PTC 6s REPORT-1 988 PROCEDURES FOR ROUTINE PERFORMANCE TESTS
OF STEAM TURBINES
Throttle flow from heat balance around turbine
Heat In Throttle steam heat = 1414.5~ Btu/hr, where y = throttle steam flow, Ibm/hr
Heat Out No. 1 gland leak-off = 650 Ibm/hr x 1389.9 Etu/lbm = 903,435 Btu/hr No. 2 gland leak-off = 8,000 Ibm/hr x 1383.5 Btu/lbm = 11,068,000 Btu/hr Heat equivalent of generator output = 18,000 kW x 3412.142 Btu/kWhr =
Heat equivalent of generator losses = 301 kW x 3412.142 Btu/kWhr =
Heat equivalent of turbine mechanical losses = 150 kW x 3412.142 BtukWhr =
61,418,556 Btu/hr
1,027,055 Btuhr
51 1,821 Btu/hr
Turbine exhaust steam heat = 1314.4 (y - 8650) Btu/hr Total heat leaving system = 1314.4 (y - 8650) Btu/hr + 74,928,867 Btu/hr
Heat in = Heat out; 1414.5~ = 1314.4(y - 8650) + 74,928,867 Test throttle steam flow = y = 634,958 Ibm/hr
Test steam rate = test throttle steam flow/generator output corrected to specified gener- ator operating conditions
Test steam rate = = 35.33 Ibm/kWhr 634'958 17,971
The flow correction factor was determined as follows:
1265 0.5750 - 0.9941
Corrected throttle flow = 634,958 x 0.9941 = 631,212 Ibm/hr (286,313 kg/h)
The steam rate correction was determined as follows: (From manufacturer's curve)
Specified Operating Conditions Percent Change Correction Divisor
Initial pressure 1265 psia - 1.42 0.986 Initiai temperature 900OF i- 2.4 1 .O24 Exhaust pressure 440 psia +0.5 1 .O05 Product of correction factors 1.0147
Steam rate corrected to specified operating conditions
Test steam rate 35.33 Correction divisor 1 .O147
- - - = 34.82 Ibm/kWhr (15.79 kg/kWh)
Generator output corrected to specified turbine generator operating conditions
631,212 34.82
= 18,128 kW
98
4
COPYRIGHT American Society of Mechanical EngineersLicensed by Information Handling ServicesCOPYRIGHT American Society of Mechanical EngineersLicensed by Information Handling Services

ASME P T C * b S REPORT A B 8- 0757b70 0054742 2 a
PROCEDURES FOR ROUTINE PERFORMANCE TESTS OF STEAM TURBINES
11.9 CALCULATION OF EXPECTED
:-d.
REPEATABILITY (See para. 3.8.3)
(a) The repeatability values given in para, 11.1 were derived from uncertainty values for the selected instrumentation of para. 11.2. The derivation of these values is presented in this paragraph in order to ac- quaint the user with the factors under consideration.
(b) Instrument uncertainties are based on the report “Guidance for Evaluation of Measurement Uncer- tainty in Performance Tests of Steam Turbines,” PTC 6 Report-1 985 (See Table 1 1.4).
11.9.1 Enthalpy-Drop Efficiency Tests, The efficiency uncertainty was determined by varying each test mea- surement uncertainty and determining the change in efficiency, as follows:
Square of Change Enthalpy- Enthalpy-
Test in Drop Drop Measurement Uncertainty Efficiency Uncertainty Uncertainty Initial 0.12 k0.153 0.023 pressure kO.1 O h of
reading
Initial 51°F 0.51 f 0.652 0.425 temperature
Exhaust 50.1% of 0.11 *CL141 0.020 pressure reading
Exhaust * l 0 F 0.38 f0.741 0.549 temperature 1 .O1 7
Overall combined uncertainty in efficiency = f i = * 1.008%. Repeatability = f 1.008/2 = *0.50%
11.9.2 Capability Tests (a) Output. The type calibration curves, volt am-
peres, and power factors of burdens were available for
-
ASME PTC 6s REPORT-I988
both potential and current transformers. A three-phase switchboard watthour meter calibrated before test was used. A photoelectric counter was used to minimize the timing uncertainty.
(b) Flow Correction Factor, The flow correction factor is:
The uncertainty in this factor is due to instrument un- certainty in the measurement ofp, and t,. The magnitude of this uncertainty is shown in Table 11 . l .
(c) Steam Correction Factor. The steam correction factor is used to correct the steam rate for deviations of test initial pressure and temperature and exhaust pres- sure. It is obtained from appropriate correction curves as a function of the uncertainty in the measurements and the slopes of the curves involved. Table 11.2 gives val- ues for the example.
(d) Corrected Generator Output. The generator out- put corrected to specified turbine-generator operating condition is:
Corrected throttle steam flow Corrected steam rate
which reduces to:
Corrected Flow Steam rate generator x correction x correction
output factor factor
Table 11.3 shows the uncertainty and repeatability determinations for the example.
COPYRIGHT American Society of Mechanical EngineersLicensed by Information Handling ServicesCOPYRIGHT American Society of Mechanical EngineersLicensed by Information Handling Services
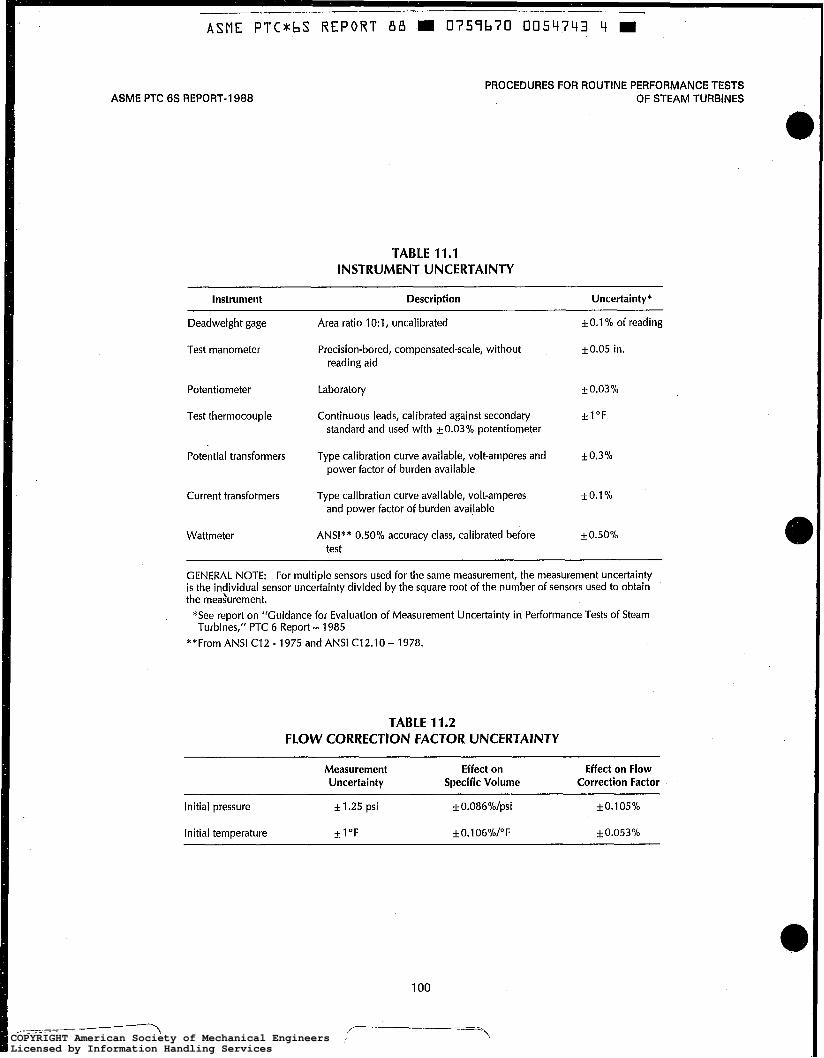
~
ASME PTCmbS REPORT 8 8 W 0757b70 005L1743 4 m
ASME PTC 6s REPORT-I 988 PROCEDURES FOR ROUTINE PERFORMANCE TESTS
OF STEAM TURBINES
TABLE 11.1 INSTRUMENT UNCERTAINTY
Instrument Description Uncertainty*
Deadweight gage Area ratio 10:1, uncalibrated *0.1% of reading
Test manometer Precision-bored, compensated-scale, without f0.05 in. reading aid
Potentiometer Laboratory f 0.03 '/o
Test thermocouple Continuous leads, calibrated against secondary f1"F standard and used with f0.03% potentiometer
Potential transformers Type calibration curve available, volt-amperes and f0.3°/o power factor of burden available
Current transformers Type calibration curve available, volt-amperes f o. 1 Yo
and power factor of burden available
Wattmeter ANSI** 0.50% accuracy class, calibrated before +0.50°/o test
GENERAL NOTE: For multiple sensors used for the same measurement, the measurement uncertainty is the individual sensor uncertainty divided by the square root of the number of sensors used to obtain the meahrement.
*See report on "Guidance for Evaluation of Measurement Uncertainty in Performance Tests of Steam Turbines," PTC 6 Report - 1985
**From ANSI C12 - 1975 and ANSI C12.10 - 1978.
TABLE 11.2 FLOW CORRECTION FACTOR UNCERTAINTY
Measurement Effect on Effect on Flow Uncertainty Specific Volume Correction Factor
Initial pressure f 1.25 psi fO.O86%/p~i *0.105%
Initial temperature + l 0 F +0.106%/"F f 0.053%
COPYRIGHT American Society of Mechanical EngineersLicensed by Information Handling ServicesCOPYRIGHT American Society of Mechanical EngineersLicensed by Information Handling Services

ASME P T C * b S R E P O R T 88 PS 0757b70 0054744 b W
PROCEDURES FOR ROUTINE PERFORMANCE TESTS OF STEAM TURBINES
TABLE 11.3 STEAM RATE UNCERTAINTY
ASME PTC 6s REPORT-1 988
Measurement Effect on Steam Steam Rate Uncertainty Rate Uncertainty Uncertainty
Initial pressure f 1.26 psi fO.O607%/p~i f 0.076%
Initial temperature + l 0 F fO0.0985%/OF f 0.099%
Exhaust pressure f 0.44 psi f 0.1 9OO%/psi *0.085%
TABLE 11.4 COMBINED CAPABILITY UNCERTAINTY
Flow Correction Steam Rate Capability Square of Factor Uncertainty Uncertainty Capability
Test Measurement Uncertainty % % Uncertainty
Potential transformer 50.30 k0.30 0.090
~~
Current transformer fO.10 -10.10 0.01 o
Watthour meter f0.50 f 0.50 0.250
Initial pressure *0.105% f0.076 f0.181 0.033
Initial temperature f0.053% *0.099 0.046 0.002
Exhaust pressure f 0.085 f. 0.085 0.007 0.392 -
Overall combined uncertainty in corrected capability = J== f0.626%
Repeatability = &0.626/2 = fO.31%
101
COPYRIGHT American Society of Mechanical EngineersLicensed by Information Handling ServicesCOPYRIGHT American Society of Mechanical EngineersLicensed by Information Handling Services

I ASME PTC*hS REPORT 8 8 S 0 7 5 7 6 7 0 0 0 5 4 7 4 5 8
PROCEDURES FOR ROUTINE PERFORMANCE TESTS OF STEAM TURBINES ASME PTC SS REPORT-1988
SECTION 12 - TEST FOR NONCONDENSING EXTRACTION TURBINE
12.1 INTRODUCTION
The enthalpy-drop efficiency of turbine sections, capability, and steam-rate tests are recommended as the best routine performance tests for these turbines. When these tests detect performance deterioration, it may be necessary to conduct a complete heat-balance test to pinpoint the cause of the deterioration.
The conduct of capability and steam-rate tests pre- supposes the measurement of shaft output by methods giving good repeatability. Although turbines of this type are used on many applications, the majority of such machines are used for electrical generation. Therefore, this Section will cover the measurement of electrical generation as the means of determining turbine-shaft output. See applicable Performance Test Code for driven equipment for guides to determining shaff output of turbine drivers for mechanical equip- ment (fans, pumps, etc,), PTC 19.7 - 1980 for energy- absorbing devices, and PTC 19.13 - 1961 for rotating speed.
The conduct of capability and steam-rate tests re- quires running the tests without any extraction flows or with accurately repeatable measurements of extraction flows. Where turbine conditions permit, it is desirable to run one test with no extraction and one or more tests with partial or full-extraction flows to determine tur- bine performance over the full operating range.
(a) The enthalpy-drop efficiency test consists of measuring the initial and final steam temperatures and pressures and calculating an internal efficiency from the resulting enthalpies. Although the test is straight- forward, measurements must be precise. Instrumenta- tion requirements and specific test procedures are pre- sented in this Section.
(b) A capability testconsists of measuring electrical output at specified governing valve points, preferably valves wide open, and extraction flows along with steam pressures and temperatures necessary to deter- mine load-correction factors. Measured electrical out- put must be corrected for variation from specified values of power factor and hydrogen pressure prior to
application of the load-correction factors. This in- volves calculating the test coupling kilowatts and then subtracting the electrical and mechanical losses that would occur at specified power factor and hydrogen pressure.
(c) A steam-rate test consists of accurate measure- ment of throttle steam flow and generator output at given valve points and extraction steam-flow rates, along with steam pressures and temperatures neces- sary to determine load-correction factors.
(d) A heat-balance test consists of a complete tur- bine heat balance. This test requires precision mea- surement of all steam flows, all temperatures and pressures, and electrical output.
(e) Test procedures, instrumentation, and duration are listed below and were chosen to measure critical variables with sufficient accuracy to produce results that are estimated to be repeatable within the following percentages (see para.3.8.3):
Type Test Repeatability'
Enthalpy-drop efficiency +_0.6 to rt0.7'10 depending on enthalpy ranges
Capability +0.5%
Steam rate No extraction flow nozzle' for 5 1.8% throttle steam flow
Extraction flow nozzle' for &2.4% throttle steam flow (orifice for extraction flow)
NOTES:
(1) Because of the importance of thè flow measurement in this test, this value is based on short-time repeafability (day-to-day) only. For expected repeatability over longer periods of time, information given in paras. 4.4.1 through 4.4.5 should be considered. See also report on "Guidance for Evaluation of Measurement Uncertainty in Performa.nce Tests of Steam Turbines," PTC 6 Report-1985.
(2) See Tables 12.1, 12.2, 12.3, and 12.4 for calculation of re- peatability.
103
COPYRIGHT American Society of Mechanical EngineersLicensed by Information Handling ServicesCOPYRIGHT American Society of Mechanical EngineersLicensed by Information Handling Services

ASME P T C * b S R E P O R T 88 m 0754b70 005474b T m
PROCEDURES FOR ROUTINE PERFORMANCE TESTS ASME PTC 6s REPORT-1988 OF STEAM TURBINES
TABLE 12.1 REPEATABILITY CALCULATIONS FOR ENTHALPY-DROP EFFICIENCY
- ~~
Guidance Reference [Note (111 Uncertainty Change In Enthalpy-Drop
Measurement Table Line [Note (111 Efficiency Uncertainty, %
Throttle pressure -temperature
Extraction For HP section pressure
-temperature
For LP section pressure -temperature
Exhaust pressure -temperature
Uncertainty in HP section
U -
4.1 4 4.1 8
4.14 4.1 8
4.14 4.18
4.14 4.18
22.5 psi & I .4 "F [Note (2)]
~t: 1.25 psi 2 1.4 "F [Note (211
f 1.25 psi - + 1.4 'F [Note (211
f 0.25 psi f 1.4 " F [Note (211
20.30 f 0.62
k0.36 50.69
kO.19 k0.41
t0.16 2 0.45
k0.39 0.82
k0.47 fO.91
f0 .33 k0.70
t0.24 k0.77
J(0.39)2 + (0.82)2 + (0.47)2 + (0.91)2 = 21.37% Repeatability = _+0.69%
Uncertainty in LP section
U - J(0.33)2 + (0.70)2 + (0.24)2 + (0.77)2 = t l . l l % Repeatability = f0.56%
NOTES: (1) See "Guidance For Evaluation of Measurement Uncertainty in Performance Tests of Steam Turbines," PTC 6 Report-1 985. (2) Use WO thermocouples to reduce error. For multiple sensors the uncertainty is the individual sensor uncertaintydivided by the square
root of the number of sensors. Thus 2"W 3 - 1.4OF.
( f l The recommended tests require an estimated number of three observers. Heat-balance tests require a minimum of five observers, plus a test supervisor. Supplementary data and personnel training are two reasons for the higher number of personnel require- ments.
12.2 INSTRUMENTATION REQUIREMENTS
(a) Precision instrumentation is recommended for each test as follows:
Reading Throttle pressure Throttle temperature First-stage pressure Throttle flow Extraction pressure Extraction temperature Exhaust pressure Exhaust temperature Extraction flow and/or
exhaust flow Generator output
Enthalpy- Prop
X X X
... X X
X X
...
...
Capability X
X
X X
X
...
..I
.I.
X
X
Steam Rate -
X X
X
X
X
...
...
... X
X
( 1 ) Pressure. See para. 4.5. Instrumentation varies with repeatability require- ments. Deadweight gage,. 1OO:l area ratio, uncalibrated. Transducer, deadweight tester calibrated.
For pressure differential across flow device, use sta- tion manometer without reading aid.
Instrumentation varies with repeatability require- ments.
Test thermocouple made with continuous leads, cal- ibrated against secondary standard, and used with _+ 0.03 percent potentiometer. Use two thermocouples at each primary measurement point.
Station recording thermocouple of standard wire, uncalibrated; and used with k0.30 percent recording potentiometer.
(3) Flow
(2) Temperature. See para. 4.6.
(a) Primary-Flow Measurement. For installa- tions having a steam generator and turbine operating essentially isolated from other units, feedwater flow provides the most satisfactory measurement of throttle flow, since a calibrated primary element can be used.
1 04
COPYRIGHT American Society of Mechanical EngineersLicensed by Information Handling ServicesCOPYRIGHT American Society of Mechanical EngineersLicensed by Information Handling Services
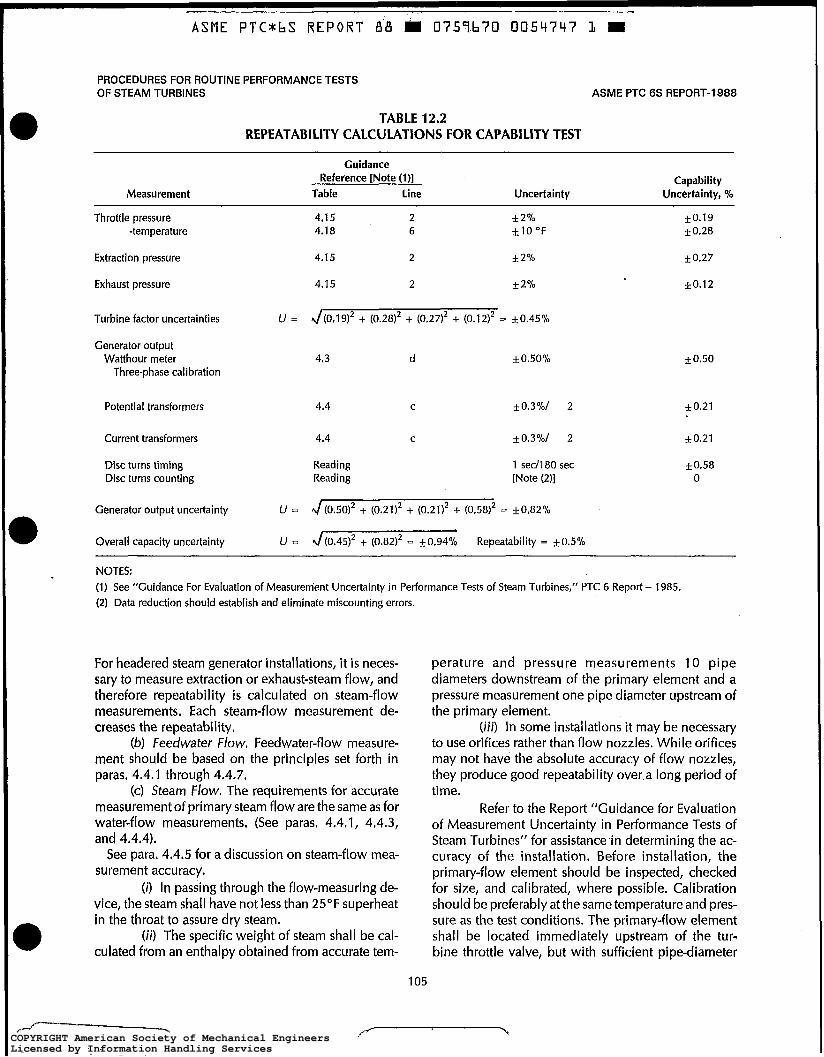
B
D
O
ASME P T C * b S R E P O R T 8'8 0757b70 005q747 L
PROCEDURES FOR ROUTINE PERFORMANCE TESTS OF STEAM TURBINES ASME PTC 6s REPORT-1988
TABLE 12.2 REPEATABILITY CALCULATIONS FOR CAPABILITY TEST
~ ~~
Measurement
Guidance Reference [Note (l)]
Table Line Uncertainty
~
Capability Uncertainty, %
Throttle pressure -temperature
4.1 5 2 f 2 010 4.1 8 6 -110 "F
Extraction pressure 4.1 5 2 f 2 "Io
Exhaust pressure 4.1 5 2 f 2 oto
Turbine factor uncertainties U = J(0.19)2 + (0.28)2 + (0.2712 + (0.T2)2 - fO.45%
Generator output Watthour meter
Three-phase calibration 4.3 d f 0.50%
Potential transformers 4.4 C +0.3%/ 2
Current transformers 4.4 C f0.3'/0/ 2
Disc turns timing Disc turns counting
Reading Reading
1 sed180 sec [Note (2)l
Cenerator output uncertainty U = J(0.50)' + (0.21)2 + (0.2112 + (0.5812 = -10.82%
Overall capacity uncertainty U = J(0.45)' + (0.82)2 = +_0.94% Repeatability = f0.5%
fO.19 * 0.28
f 0.27
f0.12
f0.50
f0.21
f0.21
f0.58 O
NOTES: (1) See "Guidance For Evaluation of Measurement Uncertainty in Performance Tests of Steam Turbines," PTC 6 Report - 1985. (2) Data reduction should establish and eliminate miscounting errors.
For headered steam generator installations, it is neces- sary to measure extraction or exhaust-steam flow, and therefore repeatability is calculated on steam-flow measurements, Each steam-flow measurement de- creases the repeatability.
(b) feedwater flow. Feedwater-flow measure- ment should be based on the principles set forth in paras, 4.4.1 through 4.4.7.
(c) Steam Flow. The requirements for accurate measurement of primary steam flow are the same as for water-flow measurements. (See paras. 4.4.1, 4.4.3, and 4.4.4).
See para. 4.4.5 for a discussion on steam-flow mea- surement accuracy.
(i) In passing through the flow-measuring de- vice, thesteam shall have not less than 25°F superheat in the throat to assure dry steam.
(i) The specific weight of steam shall be cal- culated from an enthalpy obtained from accurate tem-
perature and pressure measurements 10 pipe diameters downstream of the primary element and a pressure measurement one pipe diameter upstream of the primary element.
(iii) In some installations i t may be necessary to use orifices rather than flow nozzles. While orifices may not have the absolute accuracy of flow nozzles, they produce good repeatability over a long period of time.
Refer to the Report "Guidance for Evaluation of Measurement Uncertainty in Performance Tests of Steam Turbines" for assistancein determining the ac- curacy of the installation. Before installation, the primary-flow element should be inspected, checked for size, and calibrated, where possible, Calibration should be preferably at the same temperature and pres- sure as the test conditions. The primary-flow element shall be located immediately upstream of the tur- bine throttle valve, but with sufficient pipe-diameter
105
COPYRIGHT American Society of Mechanical EngineersLicensed by Information Handling ServicesCOPYRIGHT American Society of Mechanical EngineersLicensed by Information Handling Services

ASME PTCvbS REPORT 88 m 0757b70 0054748 3 m
ASME PTC 6s REPORT-1988 PROCEDURES FOR ROUTINE PERFORMANCE TESTS
OF STEAM TURBINES
TABLE 12.3 REPEATABILITY CALCULATIONS FOR STEAM-RATE TEST - NO EXTRACTION
Measurement
Guidance Reference [Note (111
Table Line Uncertainty [Note (111
Steam-Rate Uncertainty, 70
Throttle conditions Pressure Temperature Flow differential
4.1 5 2 4.1 9 3 4.1 3 3
f 2 010 f10 "F -10.1 in.
kO.19 f0.28 f0.23
Nozzle factors u, Uß ULSl ULS2 uDSl
No Extraction 4.10 Item G [Note (211
Fig. 4.6 @I ß = 0.6569 uncalibrated curve Fig. 4.7 @I 10 and ß = 0.6569 = Fig. 4.8 @I 30 and ß = 0.6569 =
Fig. 4.9 Ratio = 3 =
f 3.0 k 0.5 fO.9 f 0.5 f 0.0
Throttle flow uncertainty U = J(0.19)2 + (O.2fJ2 + (0.23)2 + (3.012 + (0.512 + (0.9)2 + (0.5)2 + (O)2 = G = +3,24
Generator output Watthour meter
Single-phase calibration
Potential transformers
Current transformers Disc turns timing Disc turns counting
4.3 d f 1 .O% fl.O
4.4 d
4.5 C
Reading Reading
&1.5%/ 6 f0.3%/ &- 1 sed1 80 sec [Note (311
f 1 .O6
k0.21 f0.58
O
Generator output uncertainty U = J (1.0l2 + (1.06)2 + (0.2112 + (0.5812 + (O)2 = 6 = f 1.58°1~
Overall steam rate uncertainty - No Extraction
U = 1/ (3.24)2 + (1.5tV2 = J== f3.60% Repeatability = *3.60/2 = f 1.80%
NOTES: (1) See "Guidance For Evaluation of Measurement Uncertainty in Performance Tests of Steam Turbines," PTC 6 Report - 1985. (2) Line G, used as nozzle, had been inspected during normal overhauls. Guidance figures are for absolute accuracy, while their use in this
Report is for repeatability. Major variations in accuracy would have been discovered and means developed to correct actual readings to desired accuracy. These calculations should be applied to actual readings for desired accuracy.
(3) Data reduction should establish and eliminate miscounting errors.
spacing and flow straighteners to obtain the desired accuracy. For these tests, good repeatability is of greater importance than absolute accuracy.
In determining repeatability figures, it was as- sumed throttle steam flow was measured with a flow nozzle and extraction steam flow with an orifice. As indicated by the repeatability differences, the use of extraction during tests decreases both accuracy and repeatability.
(4) Generator Output. See paras. 4.2.2 and 4.2.8. Three-phase switchboard meter, calibrated before test,
is satisfactory. Repeatability based on three-phase cal- ibration for capability test and single-phase calibration for steam-rate test.
(5) Secondary Flows. See para. 4.4.8. (6) Leakage and Storage Changes. See para. 4.9.
(b) Station instruments can be used for secondary readings which have a minor effect upon results pro- vided they are properly maintained and calibrated at regular intervals. Refer to para. 4.10.
(c) For use of previous test and manufacturer's data, refer to para. 4.1 1,
106
COPYRIGHT American Society of Mechanical EngineersLicensed by Information Handling ServicesCOPYRIGHT American Society of Mechanical EngineersLicensed by Information Handling Services
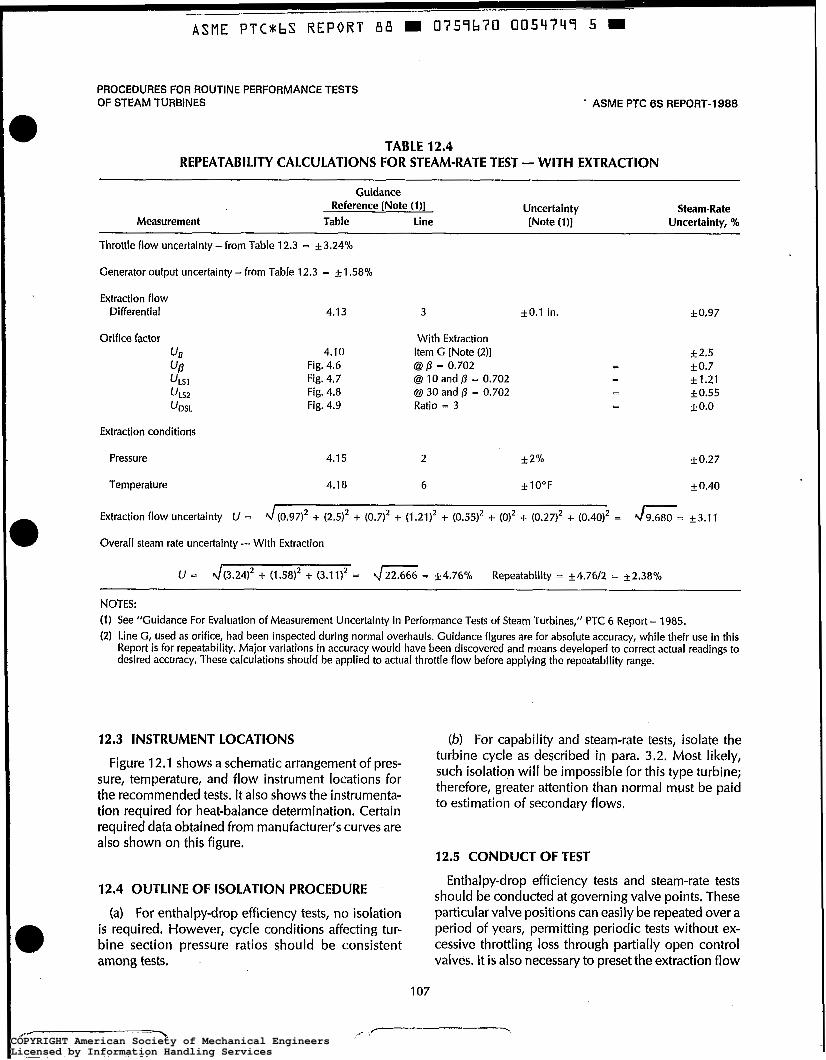
ASME PTC*bS REPORT 8 8 W 0757b70 0054747 5 W
PROCEDURES FOR ROUTINE PERFORMANCE TESTS OF STEAM TURBINES ASME PTC 6s REPORT-1 988
TABLE 12.4 REPEATABILITY CALCULATIONS FOR STEAM-RATE TEST - WITH EXTRACTION
Guidance ~~ ~
Reference [Note (I)] Uncertainty Steam-Rate Measurement Table Line [Note (I)] Uncertainty, %
~
Throttle flow uncertainty - from Table 12.3 = &3.24%
Generator output uncertainly - from Table 12.3 = & 1.58%
~~
Extraction flow Differential 4.1 3 3 f O . 1 in. f 0.97
Orifice factor Uß Uß “LSl ULS’ UDSL
Extraction conditions
With Extraction 4.10 Item G [Note (211
Fig. 4.6 @ß = 0.702 Fig. 4.7 @ 10 and 0 = 0.702 Fig. 4.8 @ 30 and ß = 0.702 Fig. 4.9 Ratio = 3
f2.5 = f 0.7
k1.21 - +0.55
= f 0.0
Pressure 4.1 5 2 f 2 Yo f0 .27
Temperature 4.1 8 6 f 10°F f 0.40
Extraction flow uncertainty U = 1/(0.97)’ + (2.512 + (0.7)’ + (1.21)’ + (0.55)’ + (O)’ + (0.27)’ + (0.40)2 = G= f3.11
Overall steam rafe uncertainty - With Extraction
U = d(3.24)’ + (1.5812 + (3.11)’ = J= = 24.76% Repeatability = *4.76/2 = *2.38%
NOTES: (1) See “Guidance For Evaluation of Measurement Uncertainty in Performance Tests of Steam Turbines,’’ PTC 6 Report - 1985. (2) Line G, used as orifice, had been inspected during normal overhauls. Guidance figures are for absolute accuracy, while their use in this
Report is for repeatability. Major variations in accuracy would have been discovered and means developed to correct actual readings to desired accuracy. These calculations should be applied to actual throttle flow before applying the repeatability range.
12.3 INSTRUMENT LOCATIONS (b) For capabilitv and steam-rate tests. isolate the
Figure 12.1 shows a schematic arrangement of pres- sure, temperature, and flow instrument locations for the recommended tests. It also shows the instrumenta- to of flows, tion required for heat-balance determination. Certain
turbine cycle’ as described in para. 3.2. Most likely, such isolation will be impossible for this type turbine; therefore, greater attention than normal must be paid
required data obtained from manufacturer‘s curves are also shown on this figure.
12.5 CONDUCT OF TEST
12.4 OUTLINE OF ISOLATION PROCEDURE Enthalpy-drop efficiency tests and steam-rate tests
should be conducted at governing valve points. These (a) For enthalpy-drop efficiency tests, no isolation particular valve positions can easily be repeated over a
is required, However, cycle conditions affecting tut“ period of years, permitting periodic tests without ex- bine section pressure ratios should be consistent cessive throttling loss through partially open control among tests, valves. It i s also necessary to preset the extraction flow
107
COPYRIGHT American Society of Mechanical EngineersLicensed by Information Handling ServicesCOPYRIGHT American Society of Mechanical EngineersLicensed by Information Handling Services

ASME PTC*bS R E P O R T 88 H 0759b70 0054750 I m '
ASME PTC 6s REPORT-I 988 PROCEDURES FOR ROUTINE PERFORMANCE TESTS
OF STEAM TURBINES
Legend "t
0 instrumentation
Secondaty
Precision
measurement
Estimated
P - Pressure T - Temperature 1
W - Flow I - Current
E - Voltaae
o W+ u n
Valve-steam
"n leakoff
m > E l
c Generator - -@ - K W f l $ .
A @+ @+ @ W
n
o M+ J W b
-"i-
kW - Kilowatts + - Enthalpy-drop t e s t only
FIG. 12.1 TYPICAL DIAGRAM - NONCONDENSINC EXTRACTION TURBINE
to a repeatable value.' Capability tests should be run with governing valves at their maximum travel and with zero or a preset extraction flow.
12.5.1 Establish Test load. Set the turbine load at the desired valve point (See para, 5.1) and set the extrac- tion flow at the desired value.
Throttle steam conditions should be as close to spec- ified as possible and the readings should be consistent. The turbine should be on load-limit control or its equivalent, and the generator should be removed from automatic system-load-control devices and be free of system disturbances.
Since the enthalpy-drop test is mainly concerned with pressures and temperatures, extraction flow is considered a secondary flow. For capability and steam- rate test, however, extraction flow is a primary flow.
Allow a minimum of one-half hour stabilization time to provide stable conditions.
12.5,2 Test Duration. Enthalpy-drop efficiency tests shall last one hour. Capability and steam-rate tests shall last two hours. Shorter time intervals than those speci-
'Better repeatability can be achieved if extraction valve points can be set rather than using manometer differential across a flow device. The best repeatability can be achieved without extraction flow.
108
fied have a direct effect upon the accuracy and repeat- ability of the results.
12.5.3 Frequency and Coordination of Readings. Readings should be coordinated by reliable time mea- surement in accordance with para. 4.8,
Establish reading frequency to produce a representa- tive average. See para. 3.4.2.
12.6 CALCULATION OF TEST RESULTS
12.6.1 Data Preparation and Calculations. Raw data should be examined for consistency and reliability. Paragraph 3.5 should be consulted as a guide for data- reduction and calculation technique.
12.6.2 Formulas and Sample Calculation (a) Enthalpy-drop efficiency formula and sample
calculations are given in Fig. 5.3 and in paras. 6.1 5 and 12.8(a).
(b) Capability-test sample calculations are shown in para. 12.8(b). For curve construction see para. 6.21 . l .
(c) Sample calculations of steam rate are shown in para. 12.8(c). They are based on the formula SR = wlP and can be compared only with the results from other
,"--. _ - -. COPYRIGHT American Society of Mechanical EngineersLicensed by Information Handling ServicesCOPYRIGHT American Society of Mechanical EngineersLicensed by Information Handling Services
ASME PTC*bS REPORT 8 8 II 0757670 0054753 3 m
PROCEDURES FOR ROUTINE PERFORMANCE TESTS OF STEAM TURBINES
tests at the same valve point and extraction flow. See para. 6.23.1.
12.6.3 Test Correction Factors. Correction factors can be determined from manufacturer's data or prior tests to correct steam rate and generator output for devia- tions from specified values of throttle pressure, throttle temperature, extraction pressure, and exhaust pres- sure.
12.6.4 Data Plots and Test Analyses. (See Section 6.) Suggested parameters for curve presentation are given in Section 6 and below.
(a) Enthalpy-Drop Efficiency Tests. Turbine-section efficiency vs. throttle flow or ratio of
exhaust pressure to first-stage pressure. (b) Capability Tests. Corrected generator outputor percentage change vs.
(c) Steam-Rate Tests. Corrected steam rate vs. corrected generator output,
corrected throttle flow, or pressure dropacross turbine.
12.6.5 Interpretation of Trend Changes. See Sec- tion 6.
time.
ASME PTC 6s REPORT-1988
12.7 SUPPLEMENTARY TESTS
To aid in the analysis of turbine performance deterio- ration, certain supplementary tests are presented which, because of their simplicity, can be conducted with a minimum number of personnel and minimum instrumentation. These tests may be made in conjunc- tion with the steam-rate tests or as separate tests. Stable conditions and turbine load settings comparable to those to which the results are compared should be pro- vided. Paragraphs 12.2 through 12.4 shall be con- sulted as required.
Stage pressures, and fhe pressure ratio across groups of stages, conducted at valve points under stabilized conditions, can be used for periodic checking of tur- bine performance. Secondary pressures can be read at each extraction stage and the turbine first stage for a test which should have a minimum duration of 30 min- utes.
In accordance with para. 12.2 (b), packing leakage can be measured with secondary flow-measuring de- vices at valve points under stable conditions. Increased packing-leakage flow is indicative of deterioration of internal-packing clearances, resulting in increased steam rates. The tests should last a minimum of one hour and usually requires two or three observers.
COPYRIGHT American Society of Mechanical EngineersLicensed by Information Handling ServicesCOPYRIGHT American Society of Mechanical EngineersLicensed by Information Handling Services
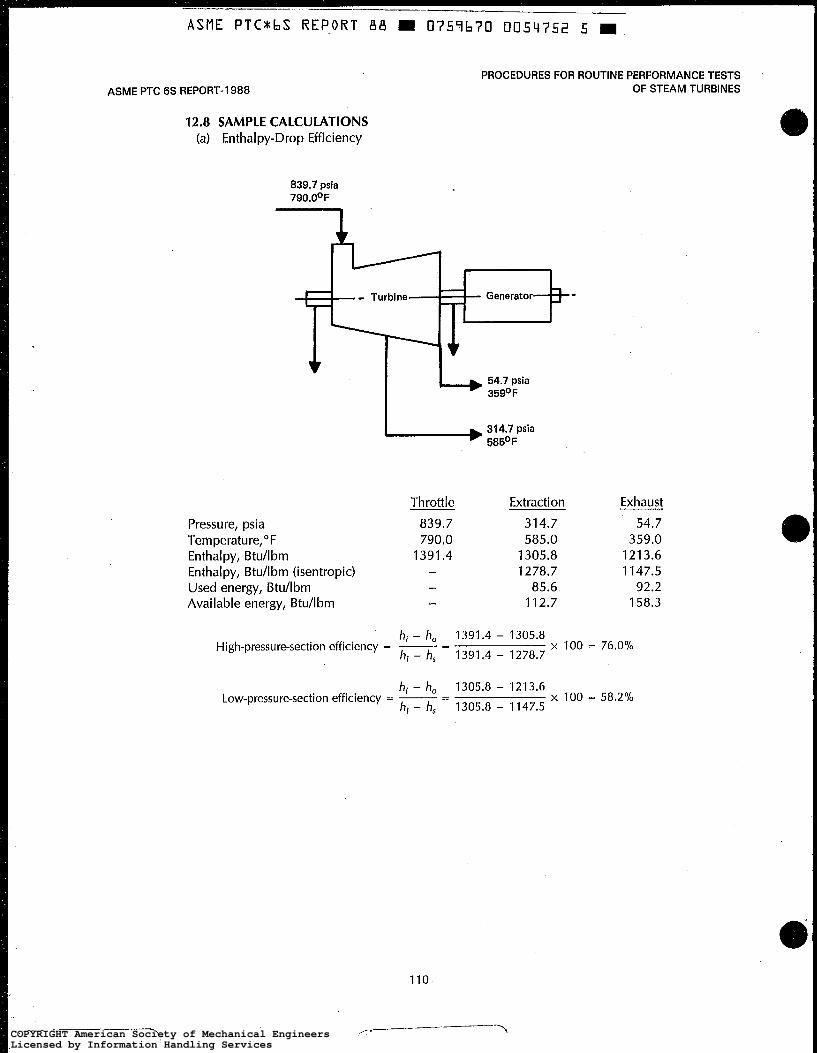
ASHE P T C * h S REPORT 88 9 0757670 0054752 5 9
ASME PTC 6s REPORT-1988
12.8 SAMPLE CALCULATIONS (a) Enthalpy-Drop Efficiency
839.7 psia 79O.O0F
PROCEDURES FOR ROUTINE PERFORMANCE TESTS OF STEAM TURBINES
I - & - Turbine-
Throttle Extraction Exhaust
Pressure, psia 839.7 314.7 54.7 Temperature,OF 790.0 585.0 359.0 Enthalpy, Btu/lbm 1391.4 1305.8 121 3.6 Enthalpy, Btu/lbm (isentropic) - 1278.7 1147.5 Used energy, Btu/lbm - 85.6 92.2 Available energy, Btu/lbm - 112.7 158.3
h; - ho 1391.4 - 1305.8 h; - h, 1391.4 - 1278.7
High-pressure-section efficiency = - - - X 100 = 76.0%
h; - h, 1305.8 - 1213.6 h; - h, 1305.8 - 1147.5
Low-pressure-section efficiency = - = X 100 = 58.2%
COPYRIGHT American Society of Mechanical EngineersLicensed by Information Handling ServicesCOPYRIGHT American Society of Mechanical EngineersLicensed by Information Handling Services

ASME PTC*bS REPORT B& W 0 7 5 4 6 7 0 0 0 5 4 7 5 3 7 W
PROCEDURES FOR ROUTINE PERFORMANCE TESTS OF STEAM TURBINES ASME PTC 6s REPORT-1 988
(b) Maximum Capability
171,450 Ibrn/hr 839.7 psia 79O.O0F
44-i - Turbine -Generator 3 5060 0.80 pf kW
Estimate Air
59.5OF out
‘I 500 Ibm/hr 4 0 . 0 0 ~ in
Estimate H c.l, 54.7 psia 750 Ibm/hr 359OF
Specified conditions: 850 psig, 800°F, 42 psig exhaust Automatic extraction at 31 O psig Three-phase, 60 cycle, 12,500 volts, 0.80 pfi 5,000 kW
Electrical output: Output with meter corrections Power factor (0.80) Air cooling Corrected electrical output
Group 2 Load Corrections (From correction curves)
Throttle pressure Throttle temperature Extraction pressure Exhaust pressure
Percent Change
-0.58 - 0.44 + 0.52 t-0.15
Product of correction factors = 0.9965
Corrected maximum capability = 51060 kW
= 5,078 kW 0.9965
1-b 123,200 Ibm/hr 314.7 psia 585.OoF
Atmospheric pressure = 14.7 psia
5,060 kW O O
5,060 kW -
Correction Divisor
0.9942 0.9956 1.0052 1 .o01 5
COPYRIGHT American Society of Mechanical EngineersLicensed by Information Handling ServicesCOPYRIGHT American Society of Mechanical EngineersLicensed by Information Handling Services

PROCEDURES FOR ROUTINE PERFORMANCE TESTS OF STEAM TURBINES
\, I
ASME PTC 6s REPORT-1 988
(c) Steam rate
PROCEDURES FOR ROUTINE PERFORMANCE TESTS OF STEAM TURBINES
171,450 ibm/hr
7 - Turbine -Generator 3 - - 0.80 pf 5060 kW
J
Estimate Air
59.5OF out
v 500 Ibm/hr 4 0 . 0 0 ~ in
Estimate 54.7 psia 750 Ibm/hr 359OF
I-, 123,200 Ibm/hr 314.7 psia 585.OoF
Atmospheric pressure = 14.7 psia
Specified conditions: 850 psig, 800"F, 42 psig exhaust Automatic extraction at 310 psig Three-phase 0.80 pf, 60 cycle, 12,500 volts, 5,000 kW
Throttle nozzle: 850 psig, 800°F Extraction orifice: 31 O psig, 500°F
Steam flow corrections to design conditions (from manufacturer's correction curves based on flow and output rather than valve position):
Throtde flow (corrected for nozzle conditions): 171,450 Ibm/hr Initial-pressure correction - 1,000 Ibm/hr Initial-temperature correction ' - 750 Ibm/hr Extraction-pressure correction + 900 Ibm/hr Exhaust-pressure correction + 250 Ibm/hr
Throttle flow (corrected to design conditions) = 170,850 Ibm/hr (7749.3 Wh)
Electrical output: Output with meter corrections Power factor (0.80) Air cooling
Corrected electrical output
170,850 Ibm/hr
5,060 kW Steam rate =
= 33.8 Ibm/kWhr at 123,200 Ibm/hr extraction flow (1 5.3 kg/kWh at 55,880 kg/h extraction flow)
112
5,060 kW O kW O kW
= 5,060 kW
COPYRIGHT American Society of Mechanical EngineersLicensed by Information Handling ServicesCOPYRIGHT American Society of Mechanical EngineersLicensed by Information Handling Services

ASME PTC*bS REPORT 88 m 0759670 OOSL(755 O m
PROCEDURES FOR ROUTINE PERFORMANCE TESTS OF STEAM TURBINES
Conversion to turbine-shaft horsepower delivered: Corrected electrical output Generator (12R) losses Mechanical losses
Corrected shaft output
170,850 Ibm/hr Steam rate = hn
5,288 kWh x 3,412.142 Btu/kWhr x 2,544 Btu "r
= 24.1 Ibm/hphr at 123,000 Ibm/h extraction flow (14.7 kgkWh at 55,880 kg/h extraction flow)
ASME PTC 6s REPORT-I988
5,060 kW 191 kW 37 kW
= 5,288 kW
COPYRIGHT American Society of Mechanical EngineersLicensed by Information Handling ServicesCOPYRIGHT American Society of Mechanical EngineersLicensed by Information Handling Services

ASME P T C * b S R E P O R T 88 m 0759670 005q756 2 m
PROCEDURES FOR ROUTINE PERFORMANCE TESTS OF STEAM TURBINES ASME PTC 6s REPORT-I 988
_-
SECTION 13 - SPECIAL PROCEDURES FOR INDICATING TURBINE-CYCLE PERFORMANCE TRENDS
_ .
13.1 INTRODUCTION
(a) As an alternative or supplement to the proce- dures recommended in Sections 7 through 12, an indi- rect method of measuring turbine performance is frequently employed. Because the procedure requires an accurate measurement of heat supplied to the steam generator and a simplified but relatively accurate de- termination of steam generator losses, it is recom- mended only for installations burning fuel oil or, preferably, natural gas. The repeatability specified be- low is based on the use of natural gas fuel. To obtain equal repeatability when burning other fuels, the heat input measurement system must have an uncertainty not exceeding f 1 .O percent.
(b) For the purposes of this test, heat supplied to the turbine cycle is defined as the heat added to steam and water in the steam generator. This heat quantity i s de- termined from a measurement of the total heat sup- plied to the steam generator and of steam generator efficiency by the heat loss method. Thus,
Total heat to steam generator - generator heat loss from steam generator
Total heat to steam generator efficiency
Heat supplied to steam and Turbine cycle water in the steam generator heat rafe =
Generator electrical output
Total heat to steam generator - heat loss from steam generator
Generator electrical output - -
Total heat to steam generator x steam generator efficiency Generator electrical output
=
Depending upon the arrangement of the turbine cycle, the power needed to operate the feedwater pump can be provided by one of the following meth- ods:
(1) driven by electric motor (2) driven by main steam turbine (3) auxiliary steam turbine drive supplied from
outside sources (4) auxiliary steam turbine drive supplied from
the main turbine cycle For those turbine cycle arrangements using methods
(2) or (4) above, the calculated turbine cycle heat rate should reflect the energy within the thermal cycle if used for the feedwater pump operation. Note that the heat supplied to the cycle ignores heat additions and removals in equipment, such as steam generator feed pumps or jet air ejectors. However, the emphasis here is on repeatable indications of trends showing devia- tions from established performance. If such a trend is detected, additional individual component tests may be required to isolate the cause.
(c) PTC 4.1-1 964, "Steam Generating Units," lists the losses and credits that may be significant in deter- mining steam generator efficiency by the heat loss method (para. 7.3). When burning natural gas or fuel oil, many of these losses and credits do not apply or can be effectively eliminated by proper operation. Thus the only losses considered by this procedure are:
Losses ( 1 ) dry flue gas (2) moisture from burning of hydrogen (3) moisture in air (4) surface radiation and convection
(5) heat supplied in fuel Credits
(d) The primary advantages _ . of this test procedure are:
( I ) Units burning natural gas or fuel oil are nor- mally required to run periodic heat input-electric power output tests to establish the unit characteristic for proper economic load allocation. This procedure
115
COPYRIGHT American Society of Mechanical EngineersLicensed by Information Handling ServicesCOPYRIGHT American Society of Mechanical EngineersLicensed by Information Handling Services
ASME P T C * b S REPORT 88 W 0757b70 0054757 4 H
ASME PTC 6s REPORT-1 988
requires only the additional measurement of steam generator losses and a few turbine temperatures and pressures for the determination of turbine cycle heat rate as well as steam generator efficiency.
(2) Theproceduresubstitutes afuel flow measure- ment for the steam-or-water-flow measurement re- quired by conventional heat rate tests. Gas or oil flow-measuring devices are usually easier to remove from service for inspection, calibration, or replace- ment.
(e) Recommended test procedures and instrumen- tation have been chosen to produce results repeatable within rt0.65 percent.
( f ) The recommended test will require an esti- mated number of two observers when utilizing a data acquisition system or four observers when collecting the data by a manual means; and a test supervisor in ei- ther case. If additional data are desired to detect possi- ble sources of overall cycle deterioration, an additional number of observers will be required.
13.2 INSTRUMENTATION REQUIREMENTS
The test instrumentation requirement wil l vary slightly with the cycle being tested. These variations result from the measurements required for the determi- nation of Group 2 corrections, For a single reheat con- densing turbine, the required measurements are:
Throttle steam temperature and pressure Hot reheat steam temperature LP turbine exhaust pressure Generator electrical output Fuel flow Fuel analysis Flue gas temperature Flue gas analysis Ambient wet and dry bulb temperature
The recommendations of Section 4 should be fol- lowed for each category of turbine-generator instru- mentation. All measurements have a significant effect on turbine cycle heat rate and should be made using precision instrumentation.
(a) Pressure. See para. 4.5. (b) Temperature. See para. 4.6. (c) Generator Output. See para. 4.2. The recommendations of PTC 4.1-1964, "Steam
Generating Units," should be followed for instrumen- tation required for determination of fuel flow and boiler losses.
(d) Fuel Flow. See paras. 4.06 and 4.09 (PTC 4.1 - 1964). For fuel oil, displacement meters are the only instruments consistent with the aims and personnel re-
PROCEDURES FOR ROUTINE PERFORMANCE TESTS OF STEAM TURBINES
quirements of this procedure. For natural gas, the method and procedure of MFC-3M - 1985 are recom- mended.
(e) Fuel Analysis. See paras. 4.07, 4.08, 4.10, and
( f ) Flue Gas Temperature. See para. 5.08
(g) Flue Cas Analysis. See paras. 5.04 through 5.07
(h) Ambient Temperatures. See para. 5.20
4.1 1 (PTC 4.1-1964).
(PTC 4.1-1964).
(PTC 4.1-1964).
(PTC 4.1-1964).
NOTE: In order to minimize the number of observers and time re- quired for this test procedure, it is necessary to simplify the flue gas analysisand temperature measurements to the extent possible. Anal- ysis of a number of flue gas passage traverses may indicate that a re- duced number of sampling points will result in a consistent and accurate analysis and temperatureor that velocity effects may be dis- regarded. The use of a composite sampling apparatus, as suggested in para. 5.04 (PTC 4.1 - 19641, is recommended. Care must be exer- cised to assure equal sampling from the points making up the corn- posite sample.
13.3 INSTRUMENT LOCATION
The location of the essential instrumentation for this procedure is indicated on Fig. 13.1.
13.4 ISOLATION PROCEDURE
See paras. 3.2.1 through 3.2.7.
13.5 CONDUCT OF THE TEST
(a) Test Conditions ( 1 ) Make the necessary arrangements to assure a
consistent supply of fuel. For fuel oil firing, supply the unit from a thoroughly mixed tank. For natural gas, re- quest the supplier not to change source or ratio of sources throughout the test period.
(2) Check steam generator operation to assure elimination of all losses associated with incomplete combustion. Oil burners should be cleaned shortly be- fore the start of the test and checked for proper atomi- zation. Orsat analyses of flue gases should verify the presence of O2 and the absence of CO.
(3) Check system isolation. See paras. 3.2.1 through 3.2.7.
(4) Establish test load so that the turbine is operat- ing at a known governing valve point (See para. 5.1.) with operating conditions as close to specified condi- tions as possible and on load limit control. The unit should be removed from automatic load control de- vices and as free of system disturbances as possible.
116
COPYRIGHT American Society of Mechanical EngineersLicensed by Information Handling ServicesCOPYRIGHT American Society of Mechanical EngineersLicensed by Information Handling Services

ASME PTC*bS REPORT 8 8 m 0757b70 005q758 b m
PROCEDURES FOR ROUTINE PERFORMANCE TESTS OF STEAM TURBINES ASME PTC 6s REPORT-I 988
Fluegas
turbine _I turbine - Generator Bpf Fuel
@ To condenser Legend
p - pressure t - temoerature
0 - special
W - flow 0 - secondary
- estimated p f - power factor
kW - kilowatts a - chemical analysis
FIG. 13.1 INSTRUMENT LOCATIONS
(5) Allow sufficient time to assure stable operating conditions. A minimum of one-half hour stabilization time should be allowed.
(b) Test Duration This test should last a minimum of two hours. (c) Frequency and Coordination of Readings
( 1 ) Readings should be coordinated by reliable time measurement in accordance with para. 4.8.
(2) Reading frequency should be established to produce a representative average. The recommenda- tions of para. 3.4.2 should be followed for all measure- ments directly associated with the turbine and generator. For fuel flow and steam generator loss mea- surements, the following are recommended:
Reading Frequency Gas fuel differential pressure 2 min. Oil flow (totalizing meter) 10 min. Fuel pressure and temperature 2 min. Flue gas analysis (all points) 10 min. Flue gas temperature (all points) 10 min. Ambient temperatures 1 O min.
13.6 CALCULATION OF TEST RESULTS
(a) Data Preparation and Calculations Raw data should be examined for consistency and
reliability. Paragraph 3.5 should be consulted as a
guide for data reduction and calculation techniques. (b) Formulas and Sample Calculations Heat rate, BtukWhr, is determined from the defini-
tion developed in para. 13.1 (b). A sample calculation is shown in para. 13.8.
(c) Heat Rate and Output Correction Factors Correction factors for correcting the as-tested heat
rate and output for deviations from specified throttle pressure and temperature, hot reheat temperature and exhaust pressure can be determined from curves sup- plied by the manufacturer. If necessary, these curves can be verified by test.
(ci) Data Plots and Test Analysis The presentation and interpretation of results ob-
tained by this method should be identical to that rec- ommended in Section 7 through 12. Refer to appropriate recommendations in the section that a p plies to the turbine being tested.
13.7 SUPPLEMENTARY TESTS
To provide information required for the analysis of any heat rate trends indicated by this test, it may be necessary to conduct supplementary tests to identify the source of the change. These tests may be con- ducted in conjunction with this procedure with some
117
COPYRIGHT American Society of Mechanical EngineersLicensed by Information Handling ServicesCOPYRIGHT American Society of Mechanical EngineersLicensed by Information Handling Services
ASME PTC*bS REPORT 8 8
ASME PTC 6s REPORT-1988
increase in instrumentation and number of personnel or as separate tests. These supplementary tests are the tests described in Sections 7 through 12. Refer to the appropriate section for the turbine being tested.
13.8 SAMPLE CALCULATIONS
Test Resu Its Steam Generator Efficiency: The calculation proce-
durefordeterminingsteam generator efficiency is illus- trated in PTC 4.1 - 1964. Refer to the abbreviated test report form in para. 1.1 1 of that publication. For the purposes of this sample calculation, assume steam gen- erator efficiency is 86.5%, and fuel flow is 2,628,300 ft3/h.
Fuel heating value (HHV) 1096 Btu/ft3 Generator output 327,862 kW Generator pf 0.98 Generator H, pressure 45 psig Throttle steam pressure 2392 psig Throttle steam temperature 1 002" F Hot reheat steam temperature 989°F LP turbine exhaust pressure 2.13 in. Hg abs.
Specified conditions 2400 psig, 1000/10OO"F, 1.5 in. Hg exhaust, 0.85 pf, 59 psig H, pressure.
.
2,628,300 x 1096 x 0.865 327,862
Uncorrected heat rate =
= 7600 Btu/kWhr
Electrical losses (from manufacturer's curves) At test kW and test pf = +3220 kW At test kW and specified pf - - -4160 kW
59 psig H2 pressure loss (relative to 45 psig loss) - - - 244 kW
Uncorrected unit output = 327,862 + 3220 - 4160 - 244 = 326,678 kW
Group 2 Correction Factors (From manufacturer's curves)
Heat Rate Correction Load Correction
- ' ln Divisor "/. Divisor
Throttle pressure +0.02 1.0002 -0.30 0.9970 Throttle temperature -0.02 0.9998 -0.04 0.9996
PROCEDURES FOR ROUTINE PERFORMANCE TESTS OF STEAM TURBINES
Heat Rate Correction Load Correction
- 'fa Divisor "/. Divisor
Reheat temperature +0.56 1.0056 -0.12 0.9988 Exhaust pressure +0.72 1.0072 -0.71 0.9929
Product - 1 .O128 - 0.9883
7600 x 327,862 326,678 x 1,0128
Corrected heat rate =
= 7531 Btu/kWhr
326,678 Corrected load = ~
0.9883 = 330,545 kW
13.9 CALCULATION OF EXPECTED REPEATABIL- ITY (See para. 3.8.3)
(a) The test repeatability specified in para. 13.1 was derived from the uncertainty of the instrumentation recommended in para. 13.2. The derivation of this re- peatability is presented in this paragraph in order to ac- quaint the user with the factors considered.
(b) Test Repeatability (7) Steam Generator Efficiency. Paragraph 3.03.5
of PTC 4.1 - 1964 lists appropriate values of measure- ment errors and their effect on steam generator effi- ciency as determined by the indirect method or the heat loss method. Analysis of the values given indi- cates that the uncertainty of the steam generator effi- ciency testing procedure specified above i s approximately +0.5%.
(2) Fuel Flow. A value of 5 1 .O% has been used in evaluatingoverall test repeatability, based primarilyon long-time experience with the method.
(3) Fuel Heating Value. Paragraph 3.03.5 of PTC 4.1 - 1964 estimates the error rangesfor this measure- ment to be +0.35%.
(4) Electric Power Measurement. Table 13.1 indi- cates the power measurement instrumentation recom- mended for this procedure and the associated uncertainties. Assuming that power is measured by counting 1 O0 disc revolutions in a 2 hr period:
Measured power uncertainty =
J (0.50)2 + F (,.lO>.C(0.20>.t( r 7200 1 0 O y
= +o.52°/o
a
* COPYRIGHT American Society of Mechanical EngineersLicensed by Information Handling ServicesCOPYRIGHT American Society of Mechanical EngineersLicensed by Information Handling Services

ASME PTC*bS REPORT B B W 0757b70 O054760 4 m .
PROCEDURES FOR ROUTINE PERFORMANCE TESTS OF STEAM TURBINES
(5) Heat Rate Correction Factors. The effect of in- strument uncertainties on heat rate correction faetors varies from turbine to turbine. Table 13.2 lists uncer- tainties for the turbine instrumentation recommended in para. 13.2. These uncertainties are based upon the "Guidance for Evaluation of Measurement Uncer- tainty in PerformanceTests of Steam Turbines," PTC 6 Report-1985. Table 13.2 also lists the effect of these uncertainties on heat rate as determined from the man- ufacturer's correction curves provided with the reheat regenerative turbine of the sample calculation.
ASME PTC 6s REPORT-1 988
(6) The uncertainty in corrected heat rate is the square root of the sum of the squares of the individual uncertainties, or
4 (O.50l2 + (1.00)2 + (0.35)2 + (0.52)' + (0.1446)2
= ~ 1 . 2 9 %
(7) The repeatabilitydefined in para. 3.8.3 is one- half of the uncertainties or & 0.65 percent.
TABLE 13.1 POWER MEASUREMENT INSTRUMENT UNCERTAINTIES
Instrument Description Uncertainty
Watthour meters Three-phase switchboard meter with mechanical register, *0.50°/o with three-phase calibration before test
Potential transformers Typecalibration curve available, volt amperes and power *0.2% factor of burden available, at unity power factor
Current transformers Type calibration curve available, volt amperes and power * 0.1 0% factor of burden available
TABLE 13.2 HEAT RATE CORRECTION UNCERTAINTIES
Effect of Correction
Instrument Uncertainty Correction Uncertainty, Measurement Uncertainty Range Curve % (Uncertainty?
Assumed Heat Rate Factor
Throttle 0.25% 3000 psi 0.084%/% f0.026 0.0007 pressure
Throttle 1.4"F [Note (111 ... 0.012°i0/0F k0.017 0.0003 temperature
Hot reheat 1.4"F [Note (r)] ... 0.01 3%/"F f 0.01 8 0.0003 temperature
Exhaust 0.05 in. Hg ... 1.25%/in. Hg ~k0.140 0.01 96 pressure
Exhaust 0.10 in. Hg. ... NA NA NA probes
4Sum of (uncertainty12 = &öG = * 0.1446% NOTE: (1) Assumes two thermocouples per location.
119
COPYRIGHT American Society of Mechanical EngineersLicensed by Information Handling ServicesCOPYRIGHT American Society of Mechanical EngineersLicensed by Information Handling Services

ASME P T C * b S R E P O R T A B
PROCEDURES FOR ROUTINE PERFORMANCE TESTS OF STEAM TURBINES
APPENDIX A CYCLE CORRECTION CURVES
ASME PTC 6s REPORT-1 988
A I Fossil Cycle. The test heat rate is corrected to speci- fied conditions by using individual correction curves for both the specified cycle and steam conditions cor- rections. The curves in Figs. A2 through A7 were de- rived from actual heat balances of a 320 M W unit operating in a seven heater cycle (Fig. A l ) with steam conditions of 2400 psig, 1000"F/lOOO°F and 2% in. Hg absolute exhaust pressure. These correction curves are typical for single reheat turbines, and have been found to be applicable for a range of sizes up to 600 MW. However, it is recommended that, where possi- ble, curves specific to the test cycle being tested should be used for the corrections and the same curves used from test to test.
A2 Nuclear Cycle. The curves in Figs. A9 through A l 2 were derived for a 1000 MWe boiling water reactor (BWR) unit (Fig. A8), with six feedwater heaters and two stages of steam reheat. The turbine throttle steam conditions are 965 psig and 1191.5 Btu/lbm and the final feedwater temperature is 420°F. These curves are generally applicable to reheat BWR cycles. The curves in Figs. A9 through A12 are plotted for the locus of valve points. Similar curves could be developed for a pressurized water reactor (PWR) cycle.
A3 Final Feedwater Temperature Correction. Figures A2 and A9 represent the change in net heat rate and kilowatts for changes in final feedwater temperature. These curves should be used only to correct for differ- ences between test specified cycle topheater terminal differences and differences in the pressure drop from the turbine to the top heater. The effect of throttle pres- sure on the correction is very small so that Fig. A2 can also be used for 1800 psig and 3500 psig units.
A4 Auxiliary Extraction Correction. The effect of dif- ferences in the test and specified cycle auxiliary extrac- tion flows, such as air preheating flows, can be calculated for extractions downstream of the reheater using Figs. A3 and A l O. The net heat rate and kilowatt corrections are expressed in terms of percent per 1 per- cent variation in auxiliary flow, where the auxiliary flow is expressed in percent of throttle flow, and plot- ted versus the extraction pressure to generalize its a p plication. If the auxiliary extraction flow is taken from the cold reheat, the correction in Fig. A4 should be used.
A5 Desuperheating Flow Correction, Main and reheat desuperheating flow corrections are shown in Fig. A5. The percent correction is expressed in terms of the dif- ference in desuperheating flow as a percent of throttle flow. This correction is plotted versus percent valves- wide-open (VWO) throttle flow.
A6 Condensate Subcooling Correction. The correc- tion for condensate subcooling is shown in Figs. A6 and A l l. This correction i s based on the measurement of condensate temperature leaving the hotwell. Heat added to or rejected from the condensate between the hotwell and the bottom heater has an insignificant ef- fect on heat rate and is not taken into account.
A7 Condenser Make-up Correction. The test should be conducted with zero make-up, However, since many specified cycles include a significant amount of make-up, a correction is required to compare test with design, This correction is shown in Figs. A7 and A12.
A8 Correction Equations. Table A-1 gives the equa- tions for the use of the curves for the specified cycle corrections.
121
COPYRIGHT American Society of Mechanical EngineersLicensed by Information Handling ServicesCOPYRIGHT American Society of Mechanical EngineersLicensed by Information Handling Services

ASME P T C * h S R E P O R T 8 8 m 0757670 0054762 8 m
ASME PTC 6s REPORT-I 988 PROCEDURES FOR ROUTINE PERFORMANCE TESTS
OF STEAM TURBINES
TABLE A-1 EQUATIONS FOR USE OF CURVES FOR SPECIFIED CYCLE CORRECTIONS
TERMINAL DIFFERENCE CORRECTION - See Figs. A2 and A9 Corrected HR = Test HWA Corrected Load = Test Load/A
[ 'fol: x (TDtet - TDdeign whereA = 1 + - 5°F
PRESSURE-DROP CORRECTION - See Figs. A2 and A9 Corrected HR = Test HWB Corrected Load = Test Load/B
AUXILIARY EXTRACTION CORRECTION - See Figs. A3, A4, and ,410 Corrected HR = Test HW(1 + C) Corrected Load = Test Load/(l - C)
where C = - x (%Aux. Extr.test - Ofo Aux. Extrudesign) Ofo Corr.
1 O0
DESUPERHEATING FLOW CORRECTION - See Fig. A5 Corrected HR = Test HWD Corrected Load = Test Load/D
where D = 1 + - x Of0 Desuperheating ( 100
Ofo Corr.
CONDENSATE SUBCOOLING CORRECTION - See Figs. A6 and A l l Corrected HR = Test HW(1 + O Corrected Load = Test Load/(l - E)
where E = - Ofo Corr. O F Subcooling
1 O0 5°F X
CONDENSER MAKEUP CORRECTION - See Figs. A7 and A12 Corrected HR = Test HW(1 + F) Corrected Load = Test Load/(l - F )
where F = - x (X Makeup,,, - '/O MakeUpd,ign) Ofo Corr.
1 O0
where
= saturation temperature, "F ptb test = extraction pressure at turbine during test, psia
Aptest = test pressure drop in extraction pipe, psi Apdesign = design heat balance pressure drop in extraction pipe, psi
122
COPYRIGHT American Society of Mechanical EngineersLicensed by Information Handling ServicesCOPYRIGHT American Society of Mechanical EngineersLicensed by Information Handling Services
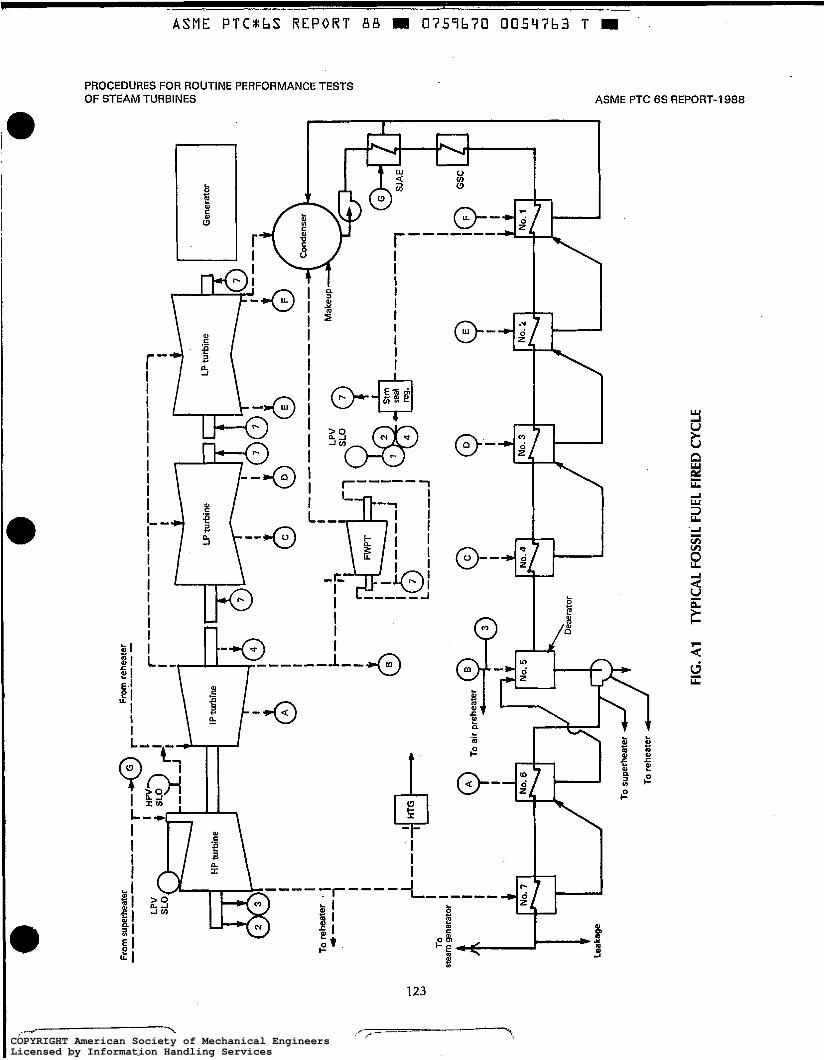
‘: ,o
l
a
I Fr
om
supe
rhea
ter
----v-
--m-
LPV
SLC
,/
From
re
heat
er
r----‘
---
r-----
----
-,----
------
--1
E
& 2 3
To
rehe
ater
d-
e-
To
stea
m
gene
rato
r
rL
I I
HPtu
rbin
e 1
-- LP
turb
ine
LP tu
r
.++.
I l--
----
----
--
----
Co
nden
ser
b
-----
p&&q
&i&
Mak
eup
.-----
- 4
reg.
L ---
m-m-
-- J
i
. No
. 7
No.
6 No
. 5
No.
4 No
. 3
No.
i No
. 1
To r
ehea
ter
/
FIG
. A
l TY
PIC
AL
FOS
Sli
FUEL
FIR
ED C
YCLE
COPYRIGHT American Society of Mechanical EngineersLicensed by Information Handling ServicesCOPYRIGHT American Society of Mechanical EngineersLicensed by Information Handling Services

ASME PTC*bS REPORT 8 8 8 . 0 7 5 7 b 7 0 00547b4 L m
ASME PTC 6s REPORT-I 988 PROCEDURES FOR ROUTINE PERFORMANCE TESTS
OF STEAM TURBINES
TEST VVJO THROTTLE FLOW, Só
FIG. A2 FINAL FEEDWATER TEMPERATURE CORRECTIONS
COPYRIGHT American Society of Mechanical EngineersLicensed by Information Handling ServicesCOPYRIGHT American Society of Mechanical EngineersLicensed by Information Handling Services

- ASME P T C * b S R E P O R T 88.m 0757b70 00547b5 3
PROCEDURES FOR ROUTINE PERFORMANCE TESTS OF STEAM TURBINES ASME PTC 6s REPORT-1 988
O B
FIG. A3 AUXILIARY EXTRACTION CORRECTIONS (Extraction After Reheater)
Auxiliary extraction returns to condenser. % auxiliary extraction is % of throtile flow. The correction applies to both load and heat rate. Refer to Table A-1 for correction calculation,
COPYRIGHT American Society of Mechanical EngineersLicensed by Information Handling ServicesCOPYRIGHT American Society of Mechanical EngineersLicensed by Information Handling Services

ASME PTC 6s REPORT-I 988
ir d
ASME PTCmbS REP0R.T B B - . E ! l 0757670 0054766 5 m
PROCEDURES FOR ROUTINE PERFORMANCE TESTS P OF STEAM TURBINES
e
\
TEST VWO THROTTLE FLOW, %
FIG. A4 CORRECTIONS FOR AUXILIARY EXTRACTION FROM COLD HEAT
Auxiliary extraction returns to condenser. % auxiliary extraction is % of throttle flow.
Refer to Table A-1 for correction calculation.
126
T””, COPYRIGHT American Society of Mechanical EngineersLicensed by Information Handling ServicesCOPYRIGHT American Society of Mechanical EngineersLicensed by Information Handling Services
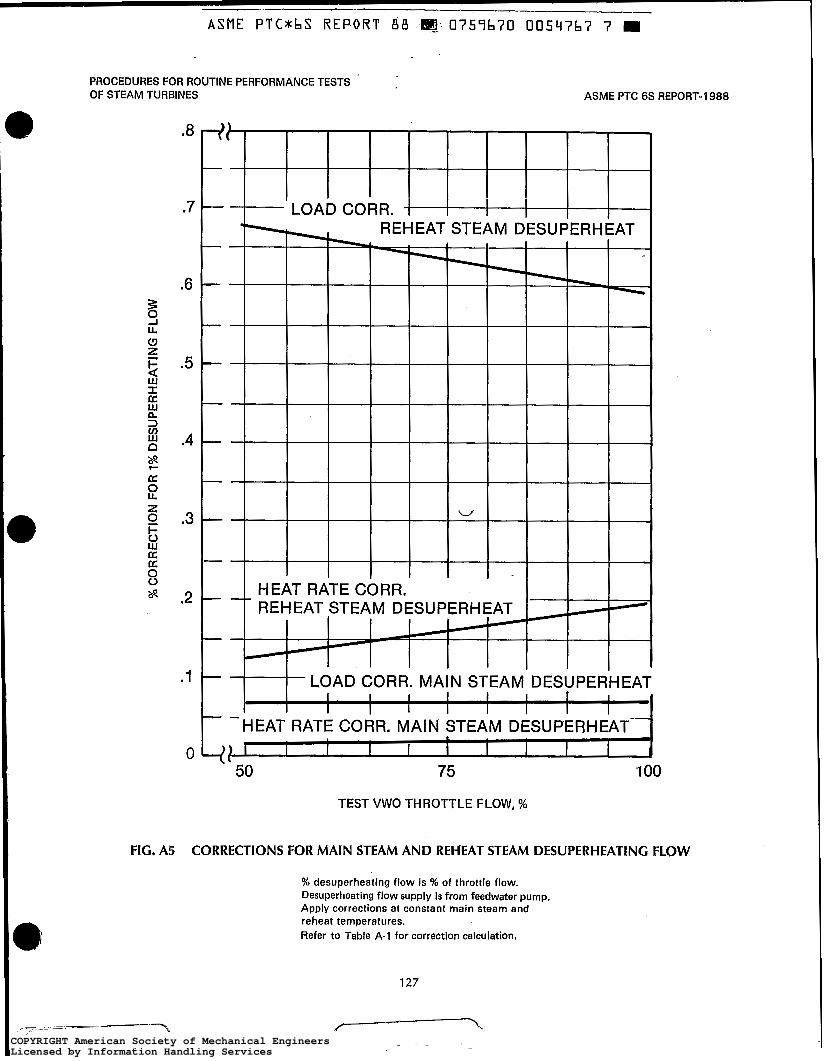
ASME P T C * h S REP.ORT 0757b70 0054767 7 m
PROCEDURES FOR ROUTINE PERFORMANCE TESTS OF STEAM TURBINES ASME PTC 6s REPORT-1 988
.8
.7
.6
.5
.4
.3
.2
.I
O
+t -
LOAD CORR.
"i- HEAT RATE CORR. REHEAT STEAM DES1 JPERHEAT -"
"
TEST VWO THROTTLE FLOW, %
FIG. A5 CORRECTIONS FOR MAIN STEAM AND REHEAT STEAM DESUPERHEATINC FLOW
% desuperheating flow is % of throttle flow. Desuperheating flow supply is from feedwater pump. Apply corrections at constant main steam and reheat temperatures. Refer to Table A-I for correction calculation.
127
COPYRIGHT American Society of Mechanical EngineersLicensed by Information Handling ServicesCOPYRIGHT American Society of Mechanical EngineersLicensed by Information Handling Services

ASME PTC*bS REPORT A A m . .. 0759670 0054768 7 m
PROCEDURES FOR ROUTINE PERFORMANCE TESTS OF STEAM TURBINES ASME PTC 6s REPORT-I 988
75 1 O0 TEST VWO THROTTLE F LOW, %
FIG. A6 CONDENSATE SUBCOOLING CORRECTIONS
Refer to Table A- I for correction calculation.
O
ASME PTC*bS REPORT A A m . .. 0759670 0054768 q m
PROCEDURES FOR ROUTINE PERFORMANCE TESTS OF STEAM TURBINES
50 75 1 O0
TEST VWO THROTTLE FLOW, %
FIG. A7 CONDENSER MAKE-UP CORRECTIONS
Leakage is from main part of steam generator. % makeup is % ofrihrottle flow. Refer to Table A-1 for correction CakUlatiOn.
128
COPYRIGHT American Society of Mechanical EngineersLicensed by Information Handling ServicesCOPYRIGHT American Society of Mechanical EngineersLicensed by Information Handling Services

From
To
NESS
Moi
stur
e St
eam
sepa
rato
r re
heat
er
Stea
m
rehe
ater
Au
x.
turb
ine
Rehe
ater
drain
s
L I
I
I b
To
COI.,,
..,,.
To
high-
pres
sure
he
ater
Six
flow
LP t
urbi
ne
Cond
ense
r
Feed
wate
r
heat
er
(typic
al)
No.
4 No
. 5
Gla
nd
stea
m
FIG
. A8
TY
PIC
AL
LIG
HT-
WAT
ER
MO
DER
ATED
N
UC
LEAR
C
YCLE
COPYRIGHT American Society of Mechanical EngineersLicensed by Information Handling ServicesCOPYRIGHT American Society of Mechanical EngineersLicensed by Information Handling Services

ASME
ASME PTC 6s REPORT-I 988
.7
P T C a b S R E P O R T 8 8 m 0757b70 0054770 7 m
PROCEDURES FOR ROUTINE PERFORMANCE TESTS OF STEAM TURBINES
TEST VWO THROTTLE FLOW, %
FIG. A9 FINAL FEEDWATER TEMPERATURE CORRECTIONS (LWM NUCLEAR CYCLE)
Due to top heater terminal difference or extraction pipe pressure drop (different from specified heat balance). Apply curves at constant control valve opening. For constant thermal power, use values from heat rate cÙrves to obtain load corrections.
Refer to Table A-1 for correction calculation.
COPYRIGHT American Society of Mechanical EngineersLicensed by Information Handling ServicesCOPYRIGHT American Society of Mechanical EngineersLicensed by Information Handling Services
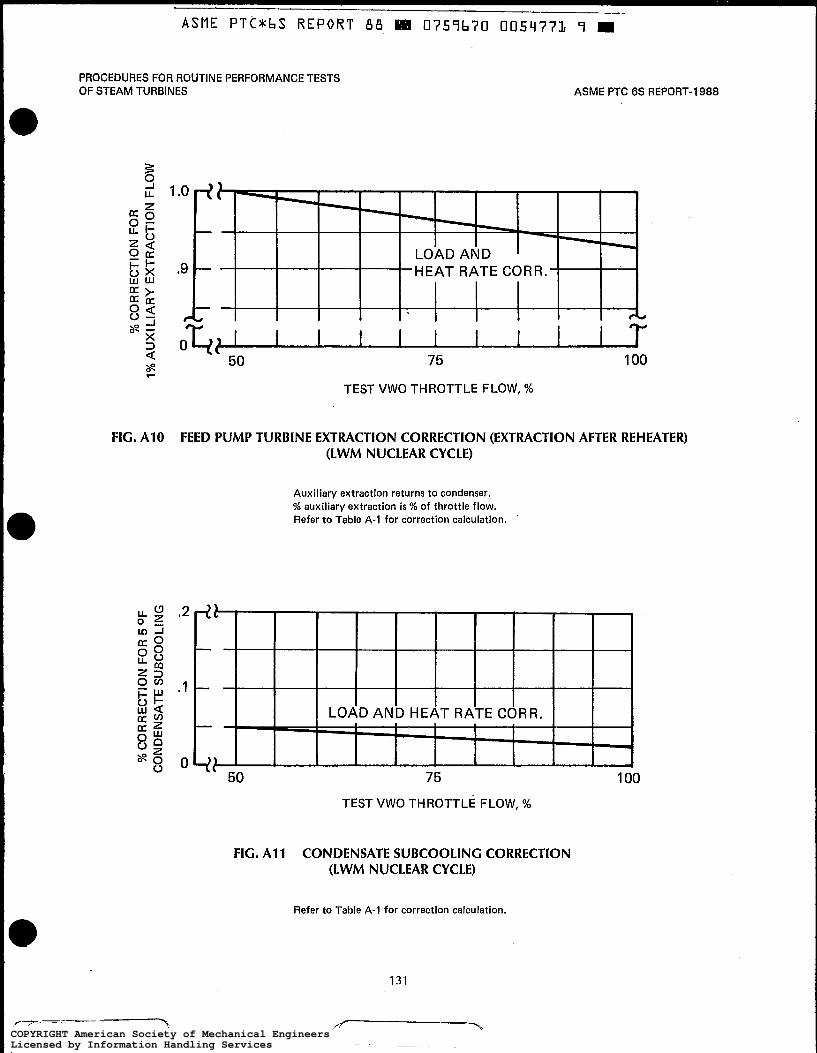
ASME P T C * b S R E P O R T 8 8 H 0759b70 005q773 7 M
PROCEDURES FOR ROUTINE PERFORMANCE TESTS OF STEAM TURBINES ASME PTC 6s REPORT-1 988
TEST VWO THROTTLE FLOW, %
FIG. A10 FEED PUMP TURBINE EXTRACTION CORRECTION (EXTRACTION AFTER REHEATER) (LWM NUCLEAR CYCLE)
Auxiliary extraction returns to condenser. % auxiliary extraction is % of throttle flow. Refer to Table A - I for correction calculation. .
'' 50 75 1 O0
TEST vwo THROTTLE FLOW, %
FIG. Al 1 CONDENSATE SUBCOOLING CORRECTION (LWM NUCLEAR CYCLE)
Refer to Table A- I for correction calculation.
131
COPYRIGHT American Society of Mechanical EngineersLicensed by Information Handling ServicesCOPYRIGHT American Society of Mechanical EngineersLicensed by Information Handling Services
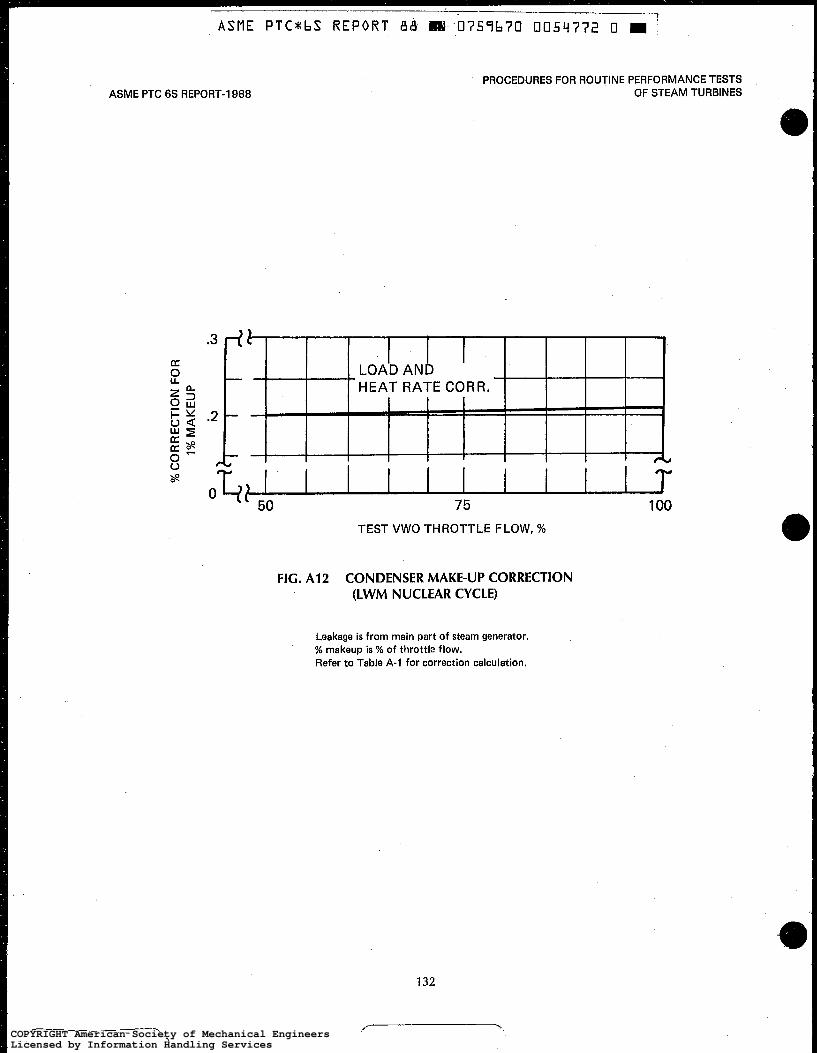
__ I
ASME P T C * b S REPORT d & - E N 0757670 005q772 O m '
PROCEDURES FOR ROUTINE PERFORMANCE TESTS ASME PTC 6s REPORT-I 988 OF STEAM TURBINES
a
," "" r
'F .2
O r-1
I I I I I I I LOA'D AN^ I
HEAT RATE CORR. "- P u ' 50 75 1 O0
TEST VWO THROTTLE FLOW, %
FIG. A12 CONDENSER MAKE-UP CORRECTION (LWM NUCLEAR CYCLE)
Leakage is from main part of steam generator. % makeup is % of throttle flow. Refer to Table A-1 for correction calculation.
132
COPYRIGHT American Society of Mechanical EngineersLicensed by Information Handling ServicesCOPYRIGHT American Society of Mechanical EngineersLicensed by Information Handling Services

ASME PTC*bS REPORT. !BB m 0759670 005q773 2 m
PROCEDURES FOR ROUTINE PERFORMANCE TESTS OF STEAM TURBINES ASME PTC 6s REPORT-1 988
APPENDIX B REFERENCES
ASME Performance Test Code - Steam Turbines, PTC 6-1 976 (R1 985).
ASME Performance Test Code - Interim Test Code For an Alternative Procedure For Testing Steam Turbines, PTC 6.1-1984.
ASME Performance Test Code - Appendix to Code for Steam Turbines, PTC 6A-1982 (R1 988).
ASME Performance Test Code - Code on Definitions and Values, PTC 2-1 980 (RI 985).
ASME Performance Test Code - Steam Generating Units, PTC 4.1-1 964 (RI 985).
ASME Performance Test Code Supplement - Measurement of Shaft Horsepower, PTC 19.7-1 980.
ASME Performance Test Code Supplement - Fluid Meters, Part II.
ASME Performance Test Code Supplement - Pressure Measurement, PTC 19.2-1 987.
ASME Performance Test Code Supplement - Quality and Purity of Steam, PTC 19.1 1-1970 (R1983).
ASME Performance Test Code Supplement - Measurement of Rotary Speed, PTC 19.1 3-1 961.
ASME Performance Test Code Supplement - Electrical Measurement in Power Circuits, PTC 19.6-1955.
ASME Performance Test Code Supplement - Temperature Measurement, PTC 19.3-1 974 (R1 985).
ASME Performance Test Code Report - Guidance For Evaluation of Measurement Uncertainty in Performance Tests of Steam Turbines, PTC 6 Report-I 985.
ASME Steam Tables - Thermodynamics and Transport Properties of Steam, ASME-I 967.
ASME Standard - Measurement of Fluid Flow in Pipes Using Orifice, Nozzle, and Venturi, MFC-3M-1985.
Bornstein, B., Cotton, OCT. 1982.
Cotton, K.C., Wescott, 1960.
, K, C., “Guidance For Steam Turbine Generator Acceptance Tests,” 82-JPGC-PTC 3,
J. C., “Methods For Measuring Steam Turbine Generator Performance,” 60-WA-139, NOV.
COPYRIGHT American Society of Mechanical EngineersLicensed by Information Handling ServicesCOPYRIGHT American Society of Mechanical EngineersLicensed by Information Handling Services

ASME PTC*hS REPORT 88 m 0757670 0054774 4
COMPLETE LISTING OF ASME PERFORMANCE TEST CODES
PTC 1 PTC 2
PTC 3.1
PTC 3.2
PTC 3,3
PTC 4.1
PTC 4.1 a
PTC 4.1 b
PTC 4.2
PTC 4,3
PTC 4.4
PTC 5 PTC 6
PTC 6A
PTC 6
PTC 6s
PTC 6.1
Report
Report
PTC 7
PTC 7.1
PTC 8.2
- General Instructions . . . . . . . , . . *.. . . . . . . . . . . . . . . ,, . . . . . . . . . , . , . . . . . . , ,1986 - Definitions and Values .. .. ... .. . . .. .. .. .. .. ..... .... . .. .. . .. . ... . .. ,1980
(RI 985) - Diesel and Burner Fuels . . . . . . . . . . . . . . . . . , . . . . . , . . , . . . , . . . . . . . . . . . . . ,1958
(RI 985) - Solid Fuels . ....... .... I . I ................. ..: ......... ....... ..... . .... 1954
(R1 984) - Gaseous Fuels . . . . . . . . . . . . . . . . . . . . . . . . . . . . . . . . . . . . . . . . . . . . . . . . . . ,1969
(R1 985) - Steam-Generating Units (With 1968 and
1969 Addenda) , . . . , . . . . , . . . . . . . . . . . . . . . . . . . , . . . . . . . . . . . . . . . . . . . . . .I964 (R1 985)
Diagram for Testing of a Steam Generator,
Heat Balance of a Steam Generator, Fig. 1 (Pad of 100)
Fig. 2 (Pad of 100) - ASME .Test Form for Abbreviated Efficiency Test -
Summary Sheet (Pad of 100) . . . . . . . . . . . , . . . . . . . . . . . . . . . . . . . . . . . . . . . .I964 - ASME Test for Abbreviated Efficiency Test -
Calculation Sheet (Pad of 100) . . . . . . . . . . . . . . . , , , '. . . , . . . . . . . . . . , . . . ,1964 - Coal Pulverizers . . . , . . . . . . . . . , . , . . . . . . . . , , . . . . . . . . . . . . . . . . . . . . . . , . . . . ,1969
(RI 985) - Air Heaters . . . . . . . . . . . . . . . , . . . . . . . , , . . . . , . . . . . . . . . . . . . . , . . . . . . . . , . . . . . . ,1968
(R1 985) - Gas Turbine Heat Recovery Steam Generators . .. . .. , ., .. .. . . . . . . .. . . ,1981
(R1 987) - Reciprocating Steam Engines . . . . . . . . . . . . . . '. . . . , . . . . . . . , . . . . . . . . . , . . .I949 - Steam Turbines . . . . . . . . . . . . . . . . . . . . . . . . . . , . . . . . . . , . . ., . . . . . . . . . . . . . . .I976
(R1 982) .- Appendix A to Test Code for Steam Turbines
(with 1958 Addenda) . . . . . . . . . . . , . . . . . . . , . . . . . . . , . . . . . , . . . . , . . . .I982 - Guidance for Evaluation of Measurement Uncertainty
in Performance Tests of Steam Turbines , . . . . . . . , . . . . . . . . . . . . . . . . . .I985 - Procedures for Routine Performance Tests
of Steam Turbines . . . . . . . . . . . . . . . . , . . . . . . . . . . . . . . . . . . . . . . . . . . . . , , . . . ,1988 - Interim Test Code for an Alternative Procedure
for Testing Steam Turbines . . . . . . . . . . . . . . . . . . . . . . . . , . . . . , . . . . . . . . , .I984 - Reciprocating Steam-Driven Displacement Pumps . . . , . . . . . . . , . . . . . . . .I949
(R1 969) - Displacement Pumps . . . . . . . . . . . . . . . . . . . , . . . . . . . . . . . . . . . . . . . . . , . . . . . . . . .I962 (R1 969)
- Centrifugal Pumps (Including 1973 Addendum) . . . . . . . . . . . . . . . . . . . . ,1965
PTC 6 on Steam Turbines- Interpretations 1977-1983
135
COPYRIGHT American Society of Mechanical EngineersLicensed by Information Handling ServicesCOPYRIGHT American Society of Mechanical EngineersLicensed by Information Handling Services

PTC 9
PTC 10
PTC 11 PTC 12.1
PTC 12.2 PTC 12.3
PTC 14
PTC 16
PTC 17
PTC 18 PTC 18.1
PTC PTC PTC
PTC
19.1 19.2 19.3
19.5
PTC 19.5.1 PTC 19.6 PTC 19.7 PTC 19 8
PTC 19.1 O PTC 19.1 1
PTC 1 9.1 2 PTC 19.1 3 PTC 19.1 4 PTC 19.1 6 PTC 19.1 7 PTC 19.22 PTC 19.23
PTC 20.1
PTC 20.2
PTC 20.3
- Displacement Compressors, Vacuum Pumps and Blowers (With 1972 Errata) , , . . . . , , . , . , . . , . , . . , , , . , . . . . , . . , . . . , , , . ,1970
(R1 985) - Compressors and Exhausters , , . . , . , . , , , . , ,. . . , . , . , , . . . . . . , . . , , . . , , . . .I965
(R1 986) - Fans ..................................................................... 1984 - Closed Feedwater Heaters . , . , . . , . , . , . . , , . , . , . . . . , . . . , . . , . . . . . . , . . . . . . .1978
(R1 987) - Steam-Condensing Apparatus . . . . . . . . . . . . , . . . . . . . , , . . . , . , , . , . . . . . . , . ,1983 - Deaerators . . . . . . . . . . . . . , . . . . . . . . . . . . , , . , . , . , . . . , , , . , . . . . , . , . . . . . . . . . . . . ,1977
(R1 984) - Evaporating Apparatus . . . . . . . . . . . , . , . . . , , . . . . . . . . . . . . . . . . . . . . . . . . . , . . . .I970
(R1 985) - Gas Producers and Continuous Gas Generators . . . , , . . . . , . . , . . . . . ,1958
(R1 985) - Reciprocating Internal-combustion Engines . . . . . . . , . , . . . . . . . . . . . . . . .I973
(RI 985) - Hydraulic Prime Movers . . . . . . . . , . . . . , . . , . , . . . . . . . . . , . . . . , . , . , , . , . , , . * 1949 - Pumping Mode of Pumpflurbines . , . , . , , , , , , , .. ,, ,. , , . , . . . , , , , . , . . , , , ,1978
(R1 984) - Measurement Uncertainty . . . , . . . . . , , , . , , , , , , . , , . . . . , . . . . . . . . . . , . . . , , ,1985 - Pressure Measurement , , . , . . . . . . . . , , , , , , . , . , . , , . , , . , . , , . . . . . , , . , . . , , . ,1987 - Temperature Measurement . . , . . . . , . , , , , , , . , . , . . . . , . . , . , , . . . , . . , . . . . . ,1974
(RI 986) - Application, Part II of Fluid Meters: Interim Supplement
on Instruments and Apparatus , , . , . . . . , . , , . , . , , . , . , . . , , . , . , . , . . , . . . ,1972 - Weighing Scales ................... ...... . .... .................... ...... 4964 - Electrical Measurements in Power Circuits . , . , . . , . , . . , . . . . . . , . . . . . . . . .I955 - Measurement of Shaft Power , .. , . . .. , . , . . .. . , . .. . .. .. . ... .. .. , .. .. . . , . .I980 - Measurement of Indicated Horsepower . , . , . . , , , , , , . , . , . , , , . . . . . . , . . . ,1970
(R1 985) - Flue and Exhaust Gas Analyses . , . , . , , . . , , , , . , , . . , , . , . . . . . . . , . . . , . . . , . .1981 - Water and Steam in the Power Cycle (Purity and Quality,
Lead Detection and Measurement) , , . . . , , . , . . , . , , . , , . , . , . . , , . ,1970 - Measurement of Time . . . . . . . . . . . . . . , . . . . , . , , , , . . . , , . , , . . . , . . , , . , . . . . . ,1958 - Measurement of Rotary Speed . , ,. . , , . , . , , . , , , . , , . , . , , . , . . . , . , . . , , . , . ,1961 - Linear Measurements . , . ,. . . . , . . . . . . , . , . . , . . , . . . . . . . . . , . , . . . . . . . . . . . . . ,1958 - Density Determinations of Solids and Liquids , . , . , , , , , . ,. . . . . . . . . . . , ,1965 - Determination of the Viscosity of Liquids , . , , . . . . . . . . . . . . . . . . . . . . :. .1965 - Digital Systems Techniques . . . . . . . . , . , , , , . , , . , , . . , . . . . , . . . . . . , . . , . . . . ,1986 - Guidance Manual for Model Testing . , ... . , , , . , . . . . . . , , , , , . , , , , , . , , . . . ,1980
(R1 985) - Speed and Load Governing Systems for Steam
Turbine-Generator Units . . .. #. . . , . . , , . , . , . , , , . . , . . . . , . . . . . . . . . . . . . . ,1977 (R1 988)
Units ........................................ ..... ,............ .... ... 1965 (R1 986)
Turbine-Generator Units , . , , , , . . . , . , , , , , , , , , , , , , . , . . , . , , . , , . , . . . . , . ,1970 (R1 979)
- Overspeed Trip Systems for Steam Turbine-Generator
- Pressure Control Systems Used on Steam
136
COPYRIGHT American Society of Mechanical EngineersLicensed by Information Handling ServicesCOPYRIGHT American Society of Mechanical EngineersLicensed by Information Handling Services
ASME
PTC 21 PTC 22 PTC 23 PTC 23. PTC 24
1
PTC 25.3 PTC 26
PTC 28
PTC 29
PTC 31
PTC 32,1
PTC 32.2
PTC 33
PTC 33a
PTC 36 PTC 38
PTC 39.1
PTC 42
PTC*bS REPORT B8 W 0759b70 0054776 B
- Dust Separating Apparatus . . , . , . , , . . . . . . . . . . . . . . . . . , , . . . . . . . . , , , . . .I941 - Gas Turbine Power Plants . . . , . , . , , . . . . . +. . . . . . . . . . . . . . . . . , . , . . , , . , . . , .I985 - Atmospheric Water Cooling Equipment . . , , . . . . . . . , . . . . . . . . . . , . . ,.. ,1986 - Spray Cooling Systems . . . . . . . . , . , . . . , . . . . . . . . . . , . . . , . . . . . . . . . . , . . . , ,1983 - Ejectors ........ ...... . .... ............... ..... . ..... ............ ........ 1976
(R1 982) - Safety and Relief Valves , . . . . . , . . , . . . . . , . . . . . . . . . . . . . . . . . . . . . , . . ,. , ,1988 - Speed-Governing Systems for Internal Combustion
Engine-Generator Units . . . . . , . . . . . . . . . . . . . , . . . . . . . . , . , ,. . . . . . . . . . , . ,1962 - Determining the Properties of Fine Particulate Matter . . . , . . . . . , . , . . . ,1965
(RI 985) - Speed Governing Systems for Hydraulic
Turbine-Generator Units . . . . . , , . , . . . , . . . . . . . . . . . . . . . . . . . . . . . , . ,. , , ,1965 (RI 985)
- Ion Exchange Equipment , . . . . . . . . . . . . . , . . . , . . . . . . . . . . . . . . , . . . . . . . , . . . ,1973 (R1 985)
- Nuclear Steam Supply Systems . . . . . . . . . . . . . . . . . . . . . . . . . . . . . . . . , . . . .I969 (R1 985)
- Methods of Measuring the Performance of Nuclear Reactor Fuel in Light Water Reactors . . . . . . . . .. . . . . .. . . . , . .. . . . .. .. ,1979
(R1 986) - Large Incinerators . . . . . , , . . , . . . , . . , , . . . . . , . . . . . . . . . . . . . . . . , . . . , . , . . , . , ,1978
(R1 985) - Appendix to PTC 33-1978 - ASME Form for
Abbreviated Incinerator Efficiency Test (Form PTC 33a-1980) .,........ ....ll...l.,,,..l.l....,...l ....,.. ..I980
(R1987) - Measurement of Industrial Sound . . . . . . . . . , . . . . . . . . . . . . . . . . . . . , . . . . . . .I985 - Determining the Concentration of Particulate
Matter in a Gas Stream .. . . . , . . . . , . . . . . . . . . ,. . . . . . . . . . . . . . . . . . . . . . . . ,1980 (RI 985)
- Condensate Removal Devices for Steam Systems . . , . . . . . . . . . . . . . . . , .I980 (R1 985)
- Wind Turbines .,,,..,,,.,,,. .,.,.. ...................................... 1988
The Philosophy of Power Test Codes and Their Development
137
COPYRIGHT American Society of Mechanical EngineersLicensed by Information Handling ServicesCOPYRIGHT American Society of Mechanical EngineersLicensed by Information Handling Services
..” . .
REPORT 8 8 0757670 0054777 T m, .
A complete list of all Performance Test Codes appears at the end of this book.
COPYRIGHT American Society of Mechanical EngineersLicensed by Information Handling ServicesCOPYRIGHT American Society of Mechanical EngineersLicensed by Information Handling Services