pt park and ride strategy
TRANSCRIPT

Public Transport Park and Ride Strategy Andrew Macbeth Page i
Transportation Group 2019 Conference, Te Papa, 3-6 March 2019
Public Transport Park and Ride Strategy Author: Andrew G. Macbeth
• BE Civil – University of Canterbury
• MEng Transportation Planning and Traffic Engineering – University of Toronto
• Fellow – Engineering New Zealand
• Senior Policy Advisor, Greater Wellington regional Council
• [email protected] Presenter: Andrew Macbeth Abstract
The Wellington region has park and ride facilities at 33 of its 48 rail stations, containing nearly 6000 mostly off-street car parking spaces. Most of the facilities are over capacity at peak periods. Greater Wellington Regional Council (GWRC) is under pressure to provide more car parking spaces to meet growing demand, but these facilities are expensive to build and maintain.
GWRC is currently developing a park and ride strategy to identify management practices to optimise this investment, helping to match supply and demand, identifying where additional capacity should be provided, and evaluating value for money.
Should GWRC spend more money on expanding park and ride capacity, or would that money be better spent reducing fares or improving feeder bus services? Should users pay for park and ride? Should people who don’t use the rail network be discouraged from parking here – and if so, how? Are there better uses for this land to support public transport?
These questions are largely rhetorical, but when developing a park and ride strategy, decision-makers and members of the public responding to public consultation on the strategy will need to form opinions on these matters. The technical work undertaken for this project helps inform such debate.
The strategy also needs to consider the role of park and ride relative to the role of walking, cycling and the bus network to provide access to rail stations, and alternative or future uses of park and ride land (such as transit-oriented development, or mobility hubs).
The effects of this strategy will be far-reaching over the next 30 years and beyond, helping to determine Wellington’s approach to park and ride, influencing land use near stations and thus affecting travel patterns for commuters.
This paper discusses the methodology, principles and recommendations of the work so far in developing the strategy.
This paper represents the views of the author and does not represent the views of Greater Wellington Regional Council or any other parties involved in the preparation of the strategy.

Public Transport Park and Ride Strategy Andrew G. Macbeth Page 1
Transportation Group 2019 Conference, Te Papa, 3-6 March 2019
1. BACKGROUND
Public transport is more important for Wellington than other cities in New Zealand. Some 40% of people entering Wellington’s CBD in the morning peak use public transport (PT), 23% on rail and 17% on buses, as determined in the 2018 cordon count and shown in Table 1.
Mode Daily no. of people entering CBD in AM peak
Mode share
Rail 16,981 22.6%
Bus 12,767 17.0%
Ferry and cable car 314 0.4%
Walk and cycle 11,386 15.2%
Car 33,651 44.8%
Total 75,100 100.0%
Table 1: Mode share entering Wellington CBD in morning peak
The Wellington region has park and ride facilities at 33 of its 48 rail stations, containing nearly 6000 mostly off-street car parking spaces. There is no charge to use these facilities, and historically, no restrictions on whether users actually use PT1. Most of the current facilities are over capacity at peak periods. The Greater Wellington Regional Council (GWRC) is increasingly under pressure to provide more car parking spaces to meet growing demand, but these facilities are expensive to build and maintain.
Park and ride capacity has increased rapidly over the last 15 years, as shown in Table 2.
Year 2002 2006 2013 2017
Number of park and ride spaces 2000 4000 4570 5850
Table 2: Growth in park and ride capacity
A typical park and ride facility (at Petone Station) is shown in Figure 1.
Figure 1: Petone Station’s park and ride accommodates about 450 cars, giving access to the rail network for Hutt Valley commuters who choose to drive to the station.
1 A recent development has been the introduction of signs outlining terms and conditions of use of park and ride at all stations, including requiring users to be PT users, and enforcement of these conditions for cars parked improperly or illegally.
Public Transport Park and Ride Strategy Andrew G. Macbeth Page 2
Transportation Group 2019 Conference, Te Papa, 3-6 March 2019
A park and ride capacity strategy was developed in 2009 but had become outdated. GWRC decided in mid-2017 to develop a new park and ride strategy, which should identify suitable management practices, determine whether and where additional supply should be provided, and consider value for money. Amongst other things, the new strategy would also need to consider the role of park and ride relative to the roles of walking, cycling and the bus network to provide access to rail stations, and alternative or future uses of park and ride land (such as transit-oriented development, or mobility hubs). The effects of this strategy will be far-reaching, helping to determine Wellington’s approach to managing and investing in park and ride for the next 30 years.
GWRC commissioned consultants to assist with the preparation of a park and ride strategy in late 2017. Part of the reason for undertaking this work was to determine whether more money should be spent on park and ride facilities, or alternatively on other means of increasing PT patronage. Strategically, should GWRC look for better ways of managing demand for park and ride, including pricing? Research, data collection and technical analysis were undertaken in the first half of 2018.
At time of writing this paper, the draft strategy is being considered by GWRC’s council after initial consultation with officers of key affected parties including NZTA, local councils, KiwiRail and the rail operator. Findings of the strategy development process are being incorporated into the regional public transport plan.
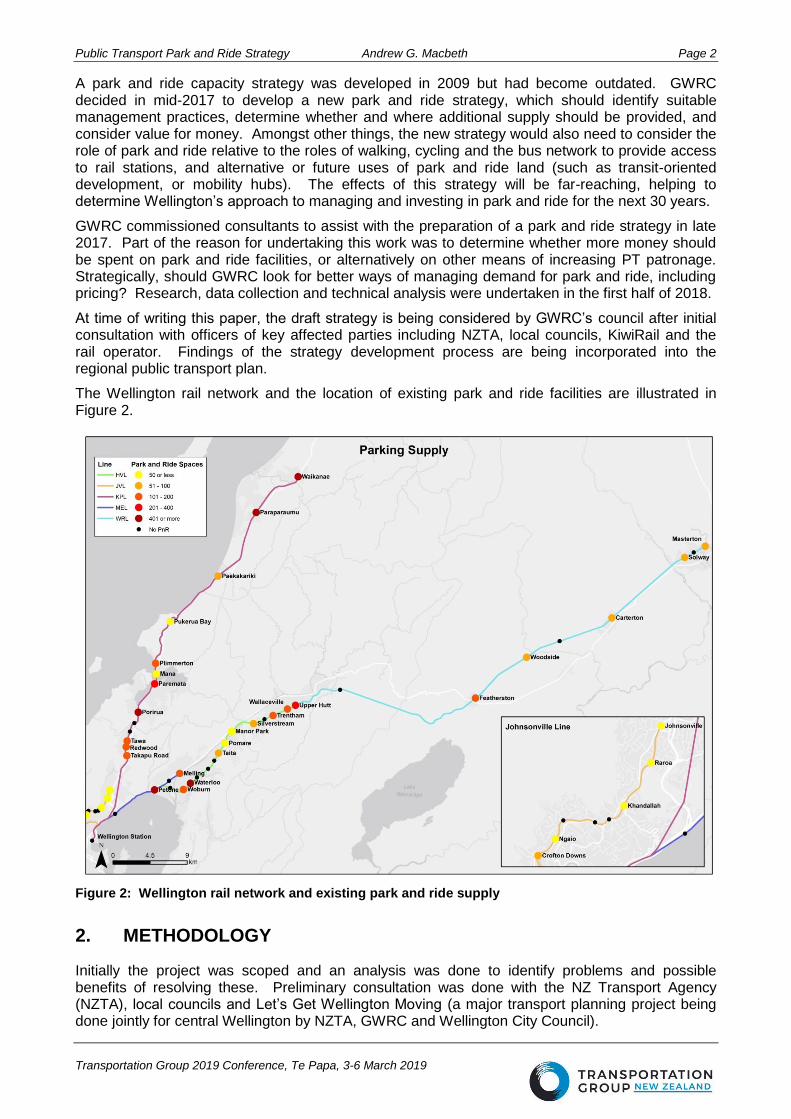
The Wellington rail network and the location of existing park and ride facilities are illustrated in Figure 2.
Figure 2: Wellington rail network and existing park and ride supply
2. METHODOLOGY
Initially the project was scoped and an analysis was done to identify problems and possible benefits of resolving these. Preliminary consultation was done with the NZ Transport Agency (NZTA), local councils and Let’s Get Wellington Moving (a major transport planning project being done jointly for central Wellington by NZTA, GWRC and Wellington City Council).
Public Transport Park and Ride Strategy Andrew G. Macbeth Page 3
Transportation Group 2019 Conference, Te Papa, 3-6 March 2019
A project brief was prepared and consultants engaged through competitive tender. Rather than asking consultants to write the strategy, a partnership was sought, whereby the consultant would bring park and ride international best practice experience to the table, while GWRC would add local context and data, and write the strategy in-house.
The consultants prepared four technical notes discussing:
• Why GWRC should invest in park and ride;
• When park and ride would be an appropriate intervention; and
• Where park and ride should be located to maximise benefits.
• How GWRC should manage and design new and existing park and ride facilities to maximise benefits.
Working in parallel, GWRC:
• Planned and executed a survey of occupancy at existing park and rides using closed circuit TV (CCTV);
• Used GIS and aerial maps to record park and ride inventory for each station, establishing a baseline for the existing numbers of parking spaces;
• Analysed a June 2017 rail customer survey to better understand park and ride use and user behaviour;
• Used new automatic passenger counting technology on trains to count passengers boarding at each station, to provide current patronage data; and
• Did a demographic and GIS analysis of Census data to understand catchments for stations and spatial distances of people’s homes to stations, to understand the potential for walking, cycling and feeder buses, as well as likely audiences for park and ride.
3. DATA COLLECTION AND ANALYSIS
Quantifying the capacity of and demand for GWRC’s park and ride facilities was an early focus of the project. Aerial photography and site inspections recorded the numbers of spaces at each station.
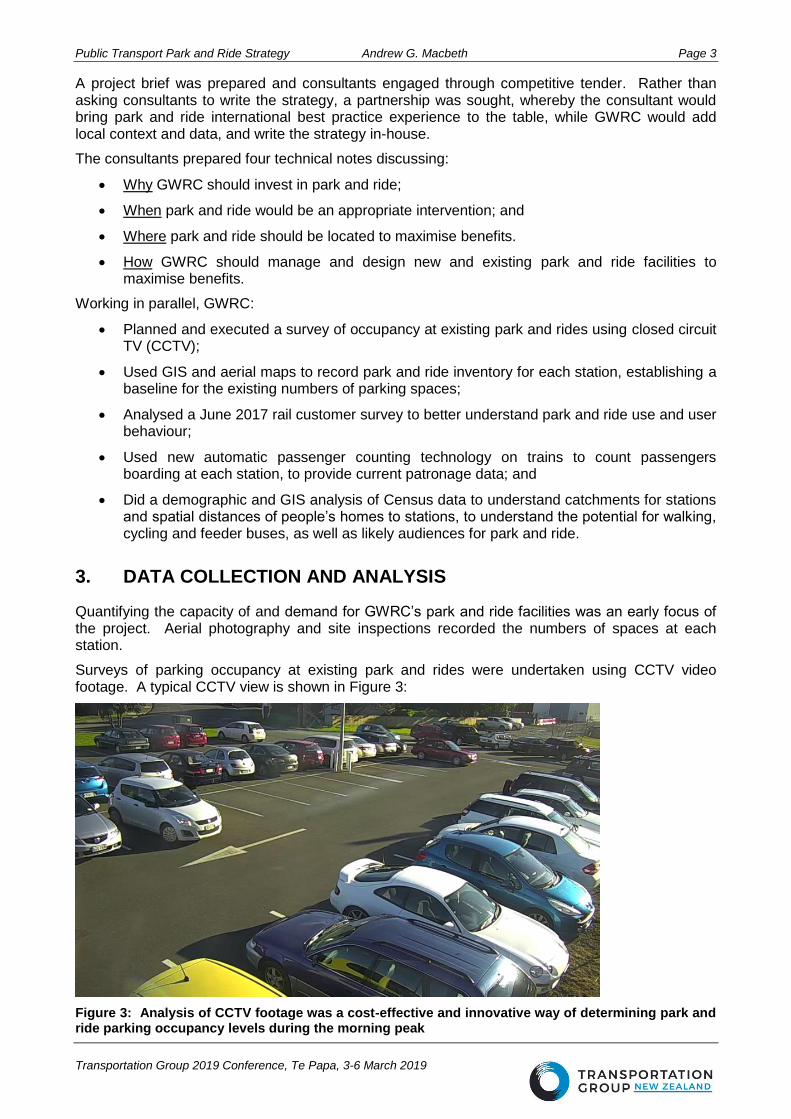
Surveys of parking occupancy at existing park and rides were undertaken using CCTV video footage. A typical CCTV view is shown in Figure 3:
Figure 3: Analysis of CCTV footage was a cost-effective and innovative way of determining park and ride parking occupancy levels during the morning peak

Public Transport Park and Ride Strategy Andrew G. Macbeth Page 4
Transportation Group 2019 Conference, Te Papa, 3-6 March 2019
CCTV has been installed at GWRC’s park and ride facilities for personal and property security, but it provided a much more efficient method of recording occupancy changes over time than sending surveyors out in the field to count cars manually. This survey technique allowed staff to estimate the time at which park and ride facilities became practically full, by observing occupancy via all cameras at a particular station through the morning peak.
When monitoring car parking in high-demand on-street locations such as retail areas or city centres, often an occupancy of 85% is considered practically full, triggering consideration of the introduction of parking meters, higher pricing or more supply. This 85% level was used to assess park and ride occupancy, but in retrospect, a figure of 95% might have been more appropriate for a facility like park and ride, where turnover is low, and capital costs are high.
Johnsonville Station reaches “critical occupancy” (to the 85% level) at 6:40 am. The critical occupancy time if measured at the 95% level would be a little later, but all stations have been assessed using the 85% level, so the relative occupancy levels (or critical occupancy times) are comparable relative to each other.
Fifteen park and ride stations fill up by 7:30 am, and another seven by 8 am. Customers, after parking their cars, then need to walk to the platform and board a train, before travelling to Wellington.
But comparing demand for park and ride at different stations is not as simple as comparing the times at which different stations fill up. Some stations are close to Wellington and others are distant, so the analysis also calculated the likely arrival time at Wellington Station, taking into consideration the critical occupancy time plus travel time and the actual train schedule.
The earlier a customer has to arrive in Wellington if using park and ride can provide a better measure of relative demand for park and ride at each station, than simply the time at which a station fills up. If a customer has to travel over an hour and a half from the Wairarapa to Wellington, they would expect to have to arrive earlier to park their car than if they were travelling from Petone, only ten minutes’ train ride to Wellington.
Put another way, a customer would have to get to the park and ride at Porirua (17 minutes from Wellington Station) at 7:45 am to be able to park their car, and they would then arrive in Wellington at 8:10 am, but they would need to get to the park and ride at Masterton (1 hour 41 minutes from Wellington) at 6:18 am to arrive in Wellington at about the same time. So these two stations are equally over-subscribed, even though one fills up an hour and a half earlier. And Johnsonville is arguably much more over-subscribed, as customers wanting to use the small park and ride there would arrive in Wellington a full hour earlier. These factors are illustrated for a selection of stations in Figure 4:
Figure 4: Critical occupancy time, Wellington Station arrival time, park and ride capacity and other key data for selected stations
Station Rail lineFare
zone
Tota
l Pn
R S
pac
es
Mar
ch 2
01
8
Tim
e o
f cr
itic
al
occ
up
ancy
(8
5%
)
Arr
ival
tim
e W
gtn
Stat
ion
(am
pe
ak)
Am
pe
ak r
ail t
rave
l
tim
e t
o W
gtn
(m
ins)
Avg
we
ekd
ay
bo
ard
ings
Se
p 2
01
7
Petone Hutt 4 448 8:15 8:32 10 1,534
Waterloo Hutt 4 628 7:30 7:54 16 2,572
Upper Hutt Hutt 7 349 7:05 7:54 32 1,182
Crofton Downs Johnsonville 3 54 7:40 7:53 8 474
Johnsonville Johnsonville 3 35 6:40 7:08 23 749
Porirua Kapiti 5 811 7:45 8:10 17 2,775
Paraparaumu Kapiti 9 527 6:55 7:57 49 1,711
Waikanae Kapiti 10 377 7:15 8:14 56 1,286
Featherston Wairarapa 11 147 7:09 8:08 65 385
Masterton Wairarapa 14 87 6:18 8:08 101 397

Public Transport Park and Ride Strategy Andrew G. Macbeth Page 5
Transportation Group 2019 Conference, Te Papa, 3-6 March 2019
A rail customer survey was undertaken in June 2017 to better understand customers’ use of different pass products, especially the widely-used and heavily-discounted monthly pass. Monthly tickets allow unlimited travel between valid stations. Typically, a commuter would use such a pass on 20 or 22 work days per month, thus using the pass 40 or 44 times. But if they also travelled in the evenings or weekends, they might use the pass 60 times or more. With this level of uncertainty, GWRC does not know how much customers pay per trip for their rail travel.
Because the rail ticketing system is not electronic, GWRC does not have reliable records of patronage by ticket type, so periodic customer surveys have been undertaken to assist with planning and revenue protection, for example.
The opportunity was taken to use the June 2017 survey to collect data on customers’ use of park and ride, other modes of travel to access trains and travel distances to the station. About 2300 responses were received from customers, with about 740 responses in the weekday morning peak (7 am to 9 am). Figure 5 shows that 46% of rail customers in the morning peak walk to the station – but the same percentage gets to the station by car, and many of these use park and ride.
Figure 5: Rail station access mode for weekday morning peak
Further analysis of the survey data shows that of those who travel by car to access trains, 23% travelled less than 1 km from their homes, well within walking distance for most people, while 43% travelled between 1 and 3 km, within range for many people by cycling2. Thus two thirds of rail customers accessing train stations by car are within relatively easy walking or cycling distance of their stations.
Travel distances were measured “as the crow flies”. A direct distance of 700 m was used to represent an actual travel distance of 1 km (as people have to follow roads or paths rather than straight from A to B) and similar approximations were used for travel distances of 3 km and 5 km (2.1 km and 3.5 km “crow flies” distances respectively). Travel distances are shown in Table 3.
Distance from home to station Total Percent
Less than 1 km 169 23%
1 to 3 km 315 43%
3 to 5 km 163 22%
More than 5 km 94 13%
Total 741
Table 3: Distance between home and station for those who travel by car
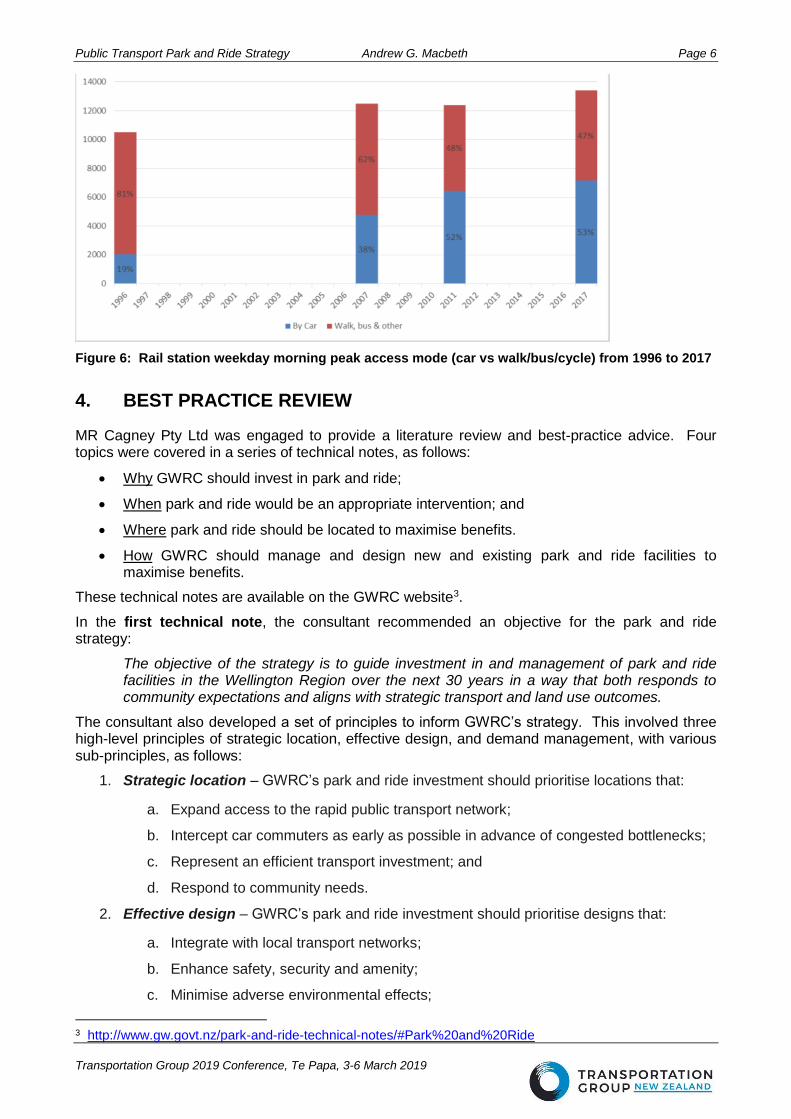
Over the last 20 years, the proportion of rail customers arriving at stations (excluding Wellington Station) in the weekday morning peak by car has increased from 19% to 53%, while those walking, cycling and using feeder buses have declined from 81% to 47%, as shown in Figure 6.
2 The geography around many Wellington suburban rail stations is hilly and thus challenging for cycling, but electric cycles (or e-cycles) and electric scooters are becoming increasingly affordable and common.
0%
10%
20%
30%
40%
50%
Bike Bus Motor Vehicle Walk
Mode Share
Mode Share
Public Transport Park and Ride Strategy Andrew G. Macbeth Page 6
Transportation Group 2019 Conference, Te Papa, 3-6 March 2019
Figure 6: Rail station weekday morning peak access mode (car vs walk/bus/cycle) from 1996 to 2017
4. BEST PRACTICE REVIEW
MR Cagney Pty Ltd was engaged to provide a literature review and best-practice advice. Four topics were covered in a series of technical notes, as follows:
• Why GWRC should invest in park and ride;
• When park and ride would be an appropriate intervention; and
• Where park and ride should be located to maximise benefits.
• How GWRC should manage and design new and existing park and ride facilities to maximise benefits.
These technical notes are available on the GWRC website3.
In the first technical note, the consultant recommended an objective for the park and ride strategy:
The objective of the strategy is to guide investment in and management of park and ride facilities in the Wellington Region over the next 30 years in a way that both responds to community expectations and aligns with strategic transport and land use outcomes.
The consultant also developed a set of principles to inform GWRC’s strategy. This involved three high-level principles of strategic location, effective design, and demand management, with various sub-principles, as follows:
1. Strategic location – GWRC’s park and ride investment should prioritise locations that:
a. Expand access to the rapid public transport network;
b. Intercept car commuters as early as possible in advance of congested bottlenecks;
c. Represent an efficient transport investment; and
d. Respond to community needs.
2. Effective design – GWRC’s park and ride investment should prioritise designs that:
a. Integrate with local transport networks;
b. Enhance safety, security and amenity;
c. Minimise adverse environmental effects;
3 http://www.gw.govt.nz/park-and-ride-technical-notes/#Park%20and%20Ride

Public Transport Park and Ride Strategy Andrew G. Macbeth Page 7
Transportation Group 2019 Conference, Te Papa, 3-6 March 2019
d. Accommodate active modes and emerging transport technologies, such as ride-
share; and
e. Support future land use development (both on the site and in the wider vicinity).
3. Demand management – GWRC’s park and ride investment should be managed such that:
a. Available park and ride capacity is well-used to support public transport;
b. Park and ride is prioritised for people with a genuine need to drive to rapid public
transport;
c. Users make an appropriate contribution to the costs of park and ride; and
d. Overspill parking is appropriately mitigated and managed.
The second technical note explored the ways in which park and ride is provided in similar peer cities around the world, and assessed how park and ride provision in these cities compared to overall patronage outcomes in terms of the entire PT network and by mode. The park and ride performance observed in the peer cities provided a useful benchmark against the Wellington Region’s performance, to see where the region sits among its peers.
The Wellington region’s park and ride performance was found to be more broadly aligned with the PT systems in Auckland and South East Queensland (greater Brisbane) than with the other systems studied in Calgary, Ottawa and Perth. Auckland and Brisbane, like Wellington, provide extensive quantities of unpriced park and ride for commuters, and with similar land use patterns surrounding stations with park and ride. Conversely, park and ride in the Wellington Region contributes to a much greater percentage of average weekly patronage than the other peer cities. This difference may be explained by a greater propensity to use other station access modes in those cities, as well as the adoption of park and ride pricing in those cities, which reduces parking demand and prioritises spaces for those with a willingness to pay.
Wellington was found to have 45 park and ride spaces per 100 boardings at stations with park and ride. The comparable figure for Auckland was 13 spaces per 100 boardings, and for greater Brisbane, 24 spaces.
The capital cost of providing park and ride was quantified at between $5000 and $10,000 per space for Wellington.
In light of the differences in park and ride and patronage outcomes from the best practice peer review, the range of station access modes available to cities such as greater Wellington, including park and ride, was analysed and the relative costs and benefits assessed. The report noted that providing park and ride may adversely affect other station access modes such as feeder buses, walking and cycling, and other land uses, such as transit-oriented development.
Based on the learnings taken from the peer cities and greater Wellington, the recognition of the relationships between the different station access modes, as well as the proposed strategy objective and principles, an Investment Prioritisation Framework was developed.
In the context of limited funds that are available to GWRC to invest in park and ride or other station access modes, the framework also provides a mechanism to prioritise or rank qualifying proposals over one another.
The third technical note applies the Investment Prioritisation Framework to rank alternative sites for park and ride provision. This ranking is not intended to provide an absolute measure of the value of park and ride provision – instead, it provides a relative indication of which areas are likely to deliver higher value for money.
Higher-ranked sites tend to:
• Be located in places with few opportunities for walking, cycling, or PT access, yet with high
numbers of potential customers;
• Be further away from the Wellington CBD; and

Public Transport Park and Ride Strategy Andrew G. Macbeth Page 8
Transportation Group 2019 Conference, Te Papa, 3-6 March 2019
• Have less potential for intensive land use, as reflected in low land values and low-density
zoning.
However, outcomes at individual locations may vary. A number of other policy considerations need to be taken into account before investing in expanding park and ride provision or modifying existing park and ride facilities. For example, deploying increasing enforcement or introducing pricing (as outlined in technical note 4) may shift demand for park and ride between stations. Likewise, implementation of new bus services, integrated ticketing, increased urban development around stations, or desired community outcomes may influence the potential role, feasibility or desirability of park and ride. The IPF is discussed at greater length in the next section of this paper.
The fourth technical note explores how park and ride facilities should be designed and managed to maximise the benefits they deliver for the transport system.
First, it outlines a recommended set of enforcement and management policies that GWRC can adopt to ensure that the region’s park and ride facilities:
• Support the public transport system;
• Give priority to users with a genuine need to drive to the station;
• Generate revenue to cover costs; and
• Reduce the impacts associated with spillover parking.
The key recommendation is that GWRC should adopt a graduated enforcement and management approach. The issues that might arise were identified as follows:
1. Park and ride facilities are full, and people are engaging in unsafe or unsavoury parking practices
2. Unpriced park and ride facilities are full, and commuters cannot find a parking space
3. Priced park and ride facilities are full, and commuters cannot find a parking space
4. Streets near a park and ride experience parking demand pressures
5. Streets near a park and ride experience parking demand pressures, despite time restrictions and coupon schemes.
Graduated levels of response were recommended for each issue. For example, if park and ride is fully subscribed (or over-subscribed, with people parking cars on landscaped areas or blocking the internal roadways), then GWRC should post terms and conditions, then issue warnings to infringing users as needed, then issue parking fines and ultimately tow infringing vehicles. This approach is consistent with the draft strategy’s demand management principles. GWRC has accordingly introduced terms and conditions and subsequent enforcement, significantly improving parking behaviour.
A second recommended action for managing park and ride is to investigate payment system options for implementing pricing. Payment systems should be relatively cheap to implement and accessible to users while allowing integration with a future integrated fare and ticketing system.
A third management recommendation is to develop a monitoring and enforcement strategy to ensure that park and ride facilities are being used appropriately and that pricing is achieving desired outcomes.
A fourth management recommendation is that GWRC consider designating a limited number of car parks for short-stay and carpool users to encourage sharing between users.
Finally, this technical note outlines a checklist of design considerations that should be incorporated into new and existing park and ride facilities. By using these approaches to design, Wellington’s park and ride facilities should be able to deliver high amenity, improve safety and comfort, and mitigate negative environmental effects.

Public Transport Park and Ride Strategy Andrew G. Macbeth Page 9
Transportation Group 2019 Conference, Te Papa, 3-6 March 2019
5. MULTI-CRITERIA ANALYSIS OF POTENTIAL SITES
From the initial research done by the consultant, it was decided to develop a multi-criteria analysis tool to assist with ranking stations for the feasibility and desirability of providing park and ride. This Investment Prioritisation Framework (IPF) would help planners and decision-makers decide where to invest next in park and ride, which stations were most at capacity limits and what the appropriate strategy should be in the short, medium and long term for each station. The IPF has four main criteria (to match the strategic location principle):
1. Expand access to the rapid PT network (with a weight of 40%) – the variables mostly are based on numbers of residents living at different distances from a station. Those living less than 1 km are considered candidates for walking; from 1 to 3 km cycling, and over 5 km are considered candidates for park and ride (and therefore weighted most heavily). Between 3 and 5 km, residents might be equally likely to bus or drive, so these residents were not included in the IPF (zero weight). The analysis also relied on GIS to ensure that residents were only allocated to their nearest station and weren’t double-counted in adjacent stations.
2. Intercept car commuters as early as possible in advance of congested bottlenecks (weighted 30%) – quantified using road distance to Wellington (greater distances increased feasibility and desirability of providing park and ride) and traffic congestion (more congested road travel resulted in higher scores in the IPF).
3. Represent an efficient transport investment (weighted 20%) – estimated cost of land, with lower land values representing increased feasibility for park and ride.
4. Respond to community needs (weighted 10%) – as measured by the level of requests for park and ride or for more park and ride supply.
These weights and criteria were developed incrementally, and additional variables were added as needed. Initially, the small, remote station of Maymorn was found to be the most appropriate for park and ride investment. However, this station has only 19 customers boarding per weekday and is located at some distance from where people live, at the northern end of Upper Hutt just before the rail line enters a long tunnel to the Wairarapa. Most residents living near this station would find it easier and more logical to travel south (towards Wellington) to board a train, rather than travelling north to the station to then travel south.
Maymorn has only three trains per hour in the morning peak, so the level of service is not high, and thus customers choose other stations with more frequent service, such as the adjacent Upper Hutt Station, with eight trains in the morning peak. This station has about 1200 boarding per weekday, and is in Zone 7 (while Maymorn is Zone 8), so the train fare is cheaper. This example resulted in a new variable being included – the number of train services in the peak hour.
In addition, the station catchments for walking, cycling, bus and driving/park and ride had previously been overlapping, so that many residents living in Upper Hutt (less than 7 km to the south) appeared to be living close enough to Maymorn to choose that station. Subsequent iterations of the IPF removed this potential for double-counting.
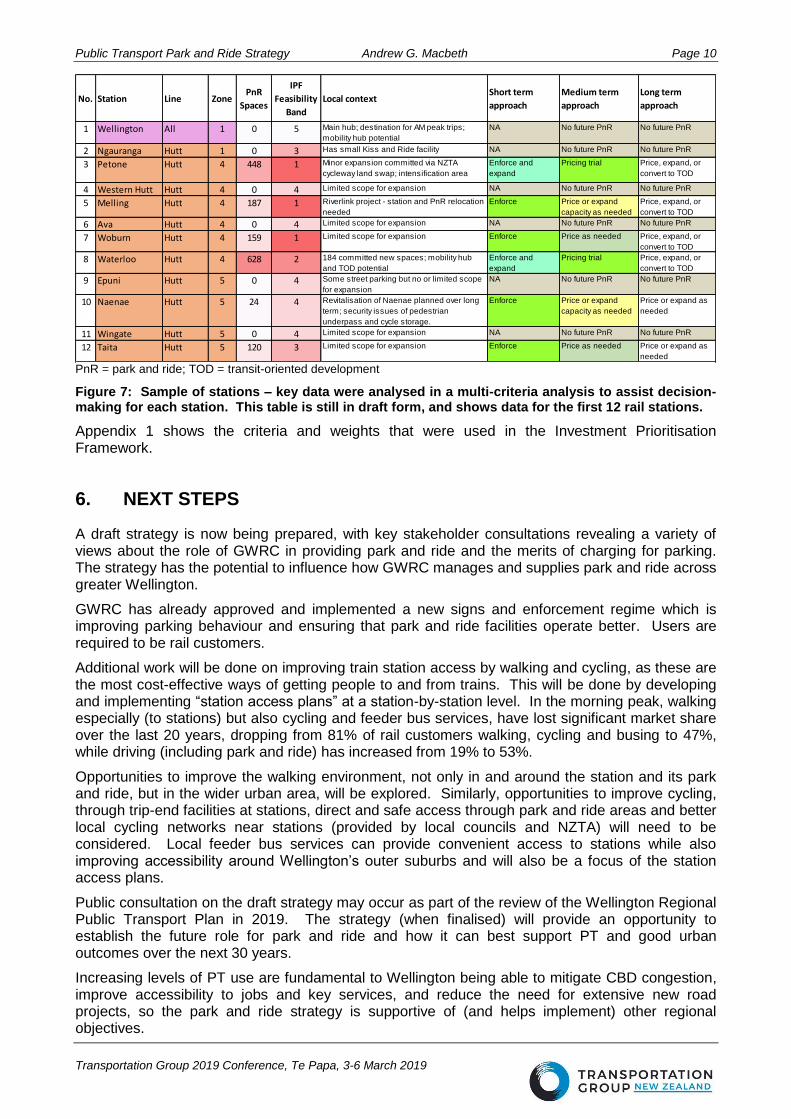
Similarly, other variables were added after the initial analysis to better quantify the feasibility and value for money of providing park and ride, and the weights were adjusted so that the results were more logical and consistent. Finally, the IPF scores were not presented on a continuous scale, but were grouped into five feasibility bands (with Wellington Station in a group of its own, as not feasible for park and ride). The results of the IPF were then complemented by some discussion of the local context for each station, and short-term, medium-term and long-term strategies were proposed. This information (still in draft form) for the first 12 stations is shown in Figure 7.
Public Transport Park and Ride Strategy Andrew G. Macbeth Page 10
Transportation Group 2019 Conference, Te Papa, 3-6 March 2019
PnR = park and ride; TOD = transit-oriented development
Figure 7: Sample of stations – key data were analysed in a multi-criteria analysis to assist decision-making for each station. This table is still in draft form, and shows data for the first 12 rail stations.
Appendix 1 shows the criteria and weights that were used in the Investment Prioritisation Framework.
6. NEXT STEPS
A draft strategy is now being prepared, with key stakeholder consultations revealing a variety of views about the role of GWRC in providing park and ride and the merits of charging for parking. The strategy has the potential to influence how GWRC manages and supplies park and ride across greater Wellington.
GWRC has already approved and implemented a new signs and enforcement regime which is improving parking behaviour and ensuring that park and ride facilities operate better. Users are required to be rail customers.
Additional work will be done on improving train station access by walking and cycling, as these are the most cost-effective ways of getting people to and from trains. This will be done by developing and implementing “station access plans” at a station-by-station level. In the morning peak, walking especially (to stations) but also cycling and feeder bus services, have lost significant market share over the last 20 years, dropping from 81% of rail customers walking, cycling and busing to 47%, while driving (including park and ride) has increased from 19% to 53%.
Opportunities to improve the walking environment, not only in and around the station and its park and ride, but in the wider urban area, will be explored. Similarly, opportunities to improve cycling, through trip-end facilities at stations, direct and safe access through park and ride areas and better local cycling networks near stations (provided by local councils and NZTA) will need to be considered. Local feeder bus services can provide convenient access to stations while also improving accessibility around Wellington’s outer suburbs and will also be a focus of the station access plans.
Public consultation on the draft strategy may occur as part of the review of the Wellington Regional Public Transport Plan in 2019. The strategy (when finalised) will provide an opportunity to establish the future role for park and ride and how it can best support PT and good urban outcomes over the next 30 years.
Increasing levels of PT use are fundamental to Wellington being able to mitigate CBD congestion, improve accessibility to jobs and key services, and reduce the need for extensive new road projects, so the park and ride strategy is supportive of (and helps implement) other regional objectives.
No. Station Line ZonePnR
Spaces
IPF
Feasibility
Band
Local contextShort term
approach
Medium term
approach
Long term
approach
1 Wellington All 1 0 5 Main hub; destination for AM peak trips;
mobility hub potential
NA No future PnR No future PnR
2 Ngauranga Hutt 1 0 3 Has small Kiss and Ride facility NA No future PnR No future PnR
3 Petone Hutt 4 448 1 Minor expansion committed via NZTA
cycleway land swap; intensification area
Enforce and
expand
Pricing trial Price, expand, or
convert to TOD
4 Western Hutt Hutt 4 0 4 Limited scope for expansion NA No future PnR No future PnR
5 Melling Hutt 4 187 1 Riverlink project - station and PnR relocation
needed
Enforce Price or expand
capacity as needed
Price, expand, or
convert to TOD
6 Ava Hutt 4 0 4 Limited scope for expansion NA No future PnR No future PnR
7 Woburn Hutt 4 159 1 Limited scope for expansion Enforce Price as needed Price, expand, or
convert to TOD
8 Waterloo Hutt 4 628 2 184 committed new spaces; mobility hub
and TOD potential
Enforce and
expand
Pricing trial Price, expand, or
convert to TOD
9 Epuni Hutt 5 0 4 Some street parking but no or limited scope
for expansion
NA No future PnR No future PnR
10 Naenae Hutt 5 24 4 Revitalisation of Naenae planned over long
term; security issues of pedestrian
underpass and cycle storage.
Enforce Price or expand
capacity as needed
Price or expand as
needed
11 Wingate Hutt 5 0 4 Limited scope for expansion NA No future PnR No future PnR
12 Taita Hutt 5 120 3 Limited scope for expansion Enforce Price as needed Price or expand as
needed

Public Transport Park and Ride Strategy Andrew G. Macbeth Page 11
Transportation Group 2019 Conference, Te Papa, 3-6 March 2019
7. DISCUSSION AND POLICY IMPLICATIONS
GWRC under its defacto policy currently provides free park and ride and is expanding the inventory to accommodate both growing rail patronage, and a growing proportion of rail commuters who park all day for free. With more people now driving to stations in the morning peak than ever before, the cost of accommodating this is being considered more strategically. There has been a significant investment in park and ride facilities over recent years, and while rail patronage has grown, it is not clear whether this has been the best use of money to support PT patronage growth. Some have argued that bus passengers cross-subsidise rail passengers4. Money spent on park and ride facilities could be used to reduce fares, or improve feeder bus services to stations (thus encouraging some customers to leave the car at home). Feeder bus services also improve local access options for residents within suburbs.
The roughly 1300 spaces added in the four years prior to 2017 have cost about $6M, or $1.5M per year (and over $4500 per space). Given that farebox revenue is about $100M per year, and assuming that similar levels of expenditure will continue, the money spent on providing additional park and ride could be used to reduce fares by 1.5% each year, or to fund other PT improvements. As over 80% of GWRC’s customers do not use park and ride, they could be expected to oppose additional park and ride expenditure. Conversely, as more and more rail customers use park and ride, these customers may come to expect this level of service.
The question of whether those using park and ride should pay for the privilege has yet to be determined. Conventional surface parking facilities in central city areas, airports and some overseas park and rides have used gates and various fee collection methods to charge for parking. Revenue collected from park and rides can be used to offset the costs of building and operating the facilities.
But technology is evolving rapidly. Mobile phone apps can be used to identify vacant parking spaces and to pay for them in real time. In addition, GWRC is planning on implementing integrated fares and ticketing via electronic means in 2021. Combining charging for park and ride with electronic ticketing for PT would simplify the process of collecting parking fees and minimise costs, while reducing or eliminating the subsidisation of driving. Integrated fares and ticketing is also likely to reduce demand for park and ride by making PT easier and cheaper, especially once rail and bus travel is better integrated in Wellington’s CBD.
Having fewer cars approaching rail stations (as a result of integrated fares and ticketing, combined with electronic pricing for park and ride) has the potential to make accessing trains by walking, cycling or bus easier and safer.
Proposed station access plans that look holistically at how people get to train stations and encourage the most sustainable and cost-effective modes (walking and cycling) should also reduce demand for, and expenditure on, park and ride.
Reducing demand for park and ride may provide an opportunity over the longer term for converting land near stations to transit-oriented developments, putting more customers in easy reach of rail services.
The strategy has not been finalised, but work to date has provided a sound basis for understanding the issues, and considering options for alternative uses for the funding of park and ride, and in the longer term, options for the land currently used for park and ride. GWRC will need to consider its policy options carefully and consult widely before introducing changes, as any changes to the status quo will result in financial winners and losers and will affect urban outcomes near stations for decades to come.
4 GWRC has periodically reviewed the equity between bus and rail fares, and will continue to do so. Results of such analyses have the potential to affect the zonal structure (currently 14 zones), fare boundaries, and fare pricing associated with the zone structure.

Public Transport Park and Ride Strategy Andrew G. Macbeth Page 12
Transportation Group 2019 Conference, Te Papa, 3-6 March 2019
APPENDIX 1: CRITERIA AND WEIGHTS IN INVESTMENT PRIORITISATION FRAMEWORK (IPF)
Strategic Location Sub-Principles
Measurable Indicator Principle Weighting
Indicator Weighting
Interpretation
1a) Expand access to the rapid public transport network
Population within 1 km of station
40%
10% Lower values indicate fewer people are likely to have walking, cycling, or bus options to access the station Population within 1-3 km of station 10%
Population within 3-5 km of station 0%
Because there is some ambiguity regarding the preferred station access mode within this population range, a weight of zero has been applied.
Population beyond 5 km of station 50%
Higher values indicate more people that could use park and ride facility but who are outside walk, cycle, and feeder bus catchments. This is the primary market for park and ride users.
Number of inbound services arriving at Wellington Station during the AM peak (7am-9am)
30% Higher values indicate station is more desirable for users
1b) Intercept car commuters as early as possible in advance of congested bottlenecks
Road network distance from station to the CBD
30%
40%
Higher values indicate the distance people would have to travel to reach the CBD. This represents an opportunity to increase PT-passenger km & reduce emissions.
Percent increase in travel time due to congestion from station to CBD
20%
Higher values indicate people would experience greater levels of congestion as they travel from the station to the CBD on the road network. Park and ride could intercept trips before reaching congested areas of the network.
Qualitative indicator of the accessibility and visibility of this station via car (via GWRC)
40% Higher values indicate that the station is more visible / accessible
1c) Represent an efficient transport investment
Estimated cost per park and ride space provided ($)
20%
60% Lower values indicate more cost-effective locations
Amount of land zoned for medium to high density residential or commercial use within 500m of station
40% Lower values represent locations where land may not have a better use.
1d) Respond to community needs
Qualitative assessment based on requests from the local councils, public submissions, media and social media (via GWRC)
10% 100% Higher values indicate more community interest in the site