psychometric properties of anxiety sensitivity …etd.lib.metu.edu.tr/upload/12607321/index.pdf ·...
TRANSCRIPT
PSYCHOMETRIC PROPERTIES OF ANXIETY SENSITIVITY INDEX-REVISED AND THE RELATIONSHIP WITH DRINKING MOTIVES AND ALCOHOL USE
IN TURKISH UNIVERSITY STUDENTS AND PATIENTS
A THESIS SUBMITTED TO THE GRADUATE SCHOOL OF SOCIAL SCIENCES
OF MIDDLE EAST TECHNICAL UNIVERSITY
BY
S. ŞAFAK ÇAKMAK
IN PARTIAL FULFILLMENT OF THE REQUIREMENTS FOR
THE DEGREE OF MASTER OF SCIENCE IN
PSYCHOLOGY
JUNE 2006

Approval of the Graduate School of Social Sciences
Prof. Dr. Sencer Ayata Director
I certify that this thesis satisfies all the requirements as a thesis for the degree of Master of Science Prof. Dr. Nebi Sümer Head of Department This is to certify that we have read this thesis and that in our opinion it is fully adequate, in scope and quality, as a thesis for the degree of Master of Science. Assoc. Prof. Belgin Ayvaşık Supervisor Prof. Dr. Nuray Karancı (METU, PSY)
Assoc. Prof. Belgin Ayvaşık (METU, PSY)
Dr. Hatice Demirbaş (Ankara Univ.)

iii
I hereby declare that all information in this document has been obtained and presented in accordance with academic rules and ethical conduct. I also declare that, as required by these rules and conduct, I have fully cited and referenced all material and results that are not original to this work.
Name, Last name: S. Şafak Çakmak
Signature :
iv
ABSTRACT
PSYCHOMETRIC PROPERTIES OF ANXIETY SENSITIVITY INDEX-REVISED AND THE RELATIONSHIP WITH DRINKING MOTIVES AND ALCOHOL USE
IN TURKISH UNIVERSITY STUDENTS AND PATIENTS
Çakmak, S. Şafak
M.S., Department of Psychology
Supervisor: Assoc. Prof. Belgin Ayvaşık
June 2006, 163 pages Anxiety Sensitivity (AS) consists of beliefs that the experience of anxiety symptoms
leads to illness or additional anxiety. The aim of the present study was to examine
the factor structure of the Turkish version of Anxiety Sensitivity Index–Revised
(ASI-R), and to investigate associations among AS, alcohol use and drinking motives
in university students and alcohol dependent inpatients. The participants were 411
university students (225 females and 186 males) and 55 (3 females and 52 males)
alcohol dependent inpatients. All participants were administered ASI-R, State-Trait
Anxiety Inventory-Trait Form, Beck Depression Inventory, Drinking Motives
Questionnaire-Revised, and Demographic Information Form. Exploratory factor
analyses revealed four lower order factors of the ASI-R: (1) fear of respiratory
symptoms; (2) fear of cardiovascular symptoms; (3) fear of cognitive dyscontrol; and
(4) fear of publicly observable anxiety symptoms. ANOVA revealed that the

v
frequency and amount of alcohol use were significantly higher in male students than
females. Males reported more alcohol use for Coping and Conformity Motives than
did females. Regression analyses revealed that only “fear of cognitive dyscontrol”
significantly predicted hazardous alcohol use of students. Coping Motives
significantly predicted alcohol use after controlling the effects of demographics,
depression and ASI-R lower order factors in students using alcohol. “Fear of publicly
observable anxiety symptoms” significantly predicted frequency of alcohol use in
students using alcohol. Students reported using alcohol mostly for Enhancement,
Social, Coping, and Conformity Motives, respectively. Students with high AS
reported more alcohol use for Coping, Social and Conformity Motives than those
with moderate and low AS. “Fear of cognitive dyscontrol” and “fear of publicly
observable anxiety symptoms” explained a significant variance of drinking motives
in students. In alcohol dependent inpatients, only “fear of respiratory symptoms” had
a significant correlation with Coping Motives. Patients reported having used alcohol
mostly for Coping, Enhancement, Social, and Conformity Motives, respectively.
Coping and Enhancement Motives were significantly correlated with alcohol use.
Results were discussed within the findings in the literature.
Keywords: Anxiety Sensitivity, Anxiety Sensitivity Index-Revised, Alcohol Use,
Drinking Motives.

vi
ÖZ
KAYGI DUYARLILIĞI ÖLÇEĞİ–DÜZELTİLMİŞ FORMU’NUN PSİKOMETRİK ÖZELLİKLERİ VE TÜRK ÜNİVERSİTE ÖĞRENCİLERİ VE
HASTA GRUBUNDA İÇME NEDENLERİ VE ALKOL KULLANIMI İLE İLİŞKİSİ
Çakmak, S. Şafak
Master, Psikoloji Bölümü
Tez Yöneticisi: Doç. Dr. Belgin Ayvaşık
Haziran 2006, 163 sayfa
Kaygı duyarlılığı (KD) kişinin yaşayacağı kaygı belirtilerinin hastalanmaya ya da
daha fazla kaygıya neden olacağı inancını içerir. Bu çalışmanın amacı Kaygı
Duyarlılığı İndeksi-Düzeltilmiş’in (KDİ-D) Türkçe Formu’nun faktör yapısını
belirlemek ve üniversite öğrencileri ve alkol bağımlısı yatan hastalarda KD, alkol
kullanımı ve içme nedenleri arasındaki ilişkileri incelemektir. Araştırmaya 411
üniversite öğrencisi (225 kadın ve 186 erkek) ile 55 alkol bağımlısı yatan hasta (3
kadın ve 52 erkek) katılmıştır. Katılımcılara KDİ-D Formu, Sürekli Kaygı Envanteri,
Beck Depresyon Envanteri, Alkol Kullanım Bozuklukları Tanıma Testi, İçme
Nedenleri Anketi-Düzeltilmiş Formu ve Demografik Bilgi Formu uygulanmıştır.
Açıklayıcı faktör analizi sonucunda KDİ-D’nin dört alt faktörü olduğu bulunmuştur:
(1) solunum ile ilgili belirtilerden korkma; (2) kalp-damar hastalıkları ile ilgili
belirtilerden korkma; (3) bilişsel kontrolü kaybetmekten korkma; (4) sosyal
ortamlarda fark edilebilen kaygı belirtilerinden korkma. ANOVA sonucunda, erkek
vii
öğrencilerin alkol kullanma sıklığının ve miktarının kız öğrencilere göre daha fazla
olduğu ve erkek öğrencilerin kız öğrencilere göre daha fazla başa çıkma ve uyum
sağlama nedeniyle alkol kullandıkları bulunmuştur. Regresyon analizleri, “bilişsel
kontrolü kaybetmekten korkma” faktörünün öğrencilerin tehlikeli alkol kullanımını
anlamlı olarak yordadığını göstermiştir. Demografik değişkenler, depresyon ve KD’
nin etkileri çıkarıldıktan sonra, başa çıkma içme nedeninin öğrencilerin alkol
kullanmını anlamlı şekilde yordadığı bulunmuştur, “sosyal ortamlarda fark edilebilen
kaygı belirtilerinden korkma” faktörünün ise öğrencilerin alkol kullanma sıklığını
anlamlı şekilde yordadığı bulunmuştur. Alkol kullanan tüm öğrencilerin sırasıyla
eğlenme, sosyalleşme, başa çıkma ve uyum sağlama nedeniyle alkol kullandıkları
gösterilmiştir. Yüksek KD olan öğrencilerin orta ve düşük KD olanlara göre başa
çıkma, uyum sağlama ve sosyalleşme içme nedenleri açısından daha yüksek puan
aldığı gözlenmiştir. “Bilişsel kontrolü kaybetmekten korkma” ve “sosyal ortamlarda
fark edilebilen kaygı belirtilerinden korkma” faktörlerinin öğrencilerin içme
nedenlerini anlamlı şekilde yordadığı bulunmuştur. Alkol bağımlılığı olan hastalarda
sadece “solunum ile ilgili belirtilerden korkma” ile başa çıkma içme nedeni arasında
anlamlı bir korelasyon olduğu bulunmuştur. Hastaların sırasıyla başa çıkma,
eğlenme, sosyalleşme ve uyum sağlama nedeniyle alkol kullandıkları bulunmuştur.
Başa çıkma ve eğlenme içme nedenleri alkol kullanımı ile anlamlı korelasyon
göstermiştir. Çalışmanın sonuçları literatürdeki bulgular bağlamında tartışılmıştır.
Anahtar Kelimeler: Kaygı Duyarlılığı, Kaygı Duyarlılığı İndeksi-Düzeltilmiş Formu,
Alkol Kullanımı, İçme Nedenleri.

viii
To my father, mother and sister

ix
ACKNOWLEDGEMENTS
This thesis is by far the first significant scientific accomplishment in my life
and it would be impossible without people who supported me and believed in me.
First and foremost I am very grateful to my thesis advisor Assoc. Prof. Belgin
Ayvaşık for her endless advice and support all throughout this study. It was really
pleasure to work with her and to have been exposed to her deep knowledge in
research. I am also thankful for her understanding and sensitive approach towards me
personally.
I would like to thank Prof. Dr. A. Nuray Karancı for her support, and valuable
ideas and suggestions which have always impressed me much.
My best regards I want to give to Dr. Hatice Demirbaş for her suggestions
and encouragement. I am also grateful to her for her support and help during my data
collection period at Ankara University Hospital. I would also like to acknowledge
Dr. Cüneyt Evren for his kind and understanding support at collecting data at
Bakırköy Mental and Neurological Diseases Hospital AMATEM clinic, as well as
the clinic staff there.
I would like to thank all the alcohol dependent patients and volunteer Middle
East Technical University students for their participation, trust and sincerity.
I owe many thanks to my friend H. Ulaş Özcan for answering my questions
about statistics on the phone with patience.
I am forever indepted to my dearest father, mother and sister for their endless
love, understanding and encouragement when it was most required.

x
Lastly, I would like to thank Umut, for his love, understanding and support
everytime he showered on me. I am sure that I could never express the depth of my
love to him.

xi
TABLE OF CONTENTS
PLAGIARISM ............................................................................................................. iii
ABSTRACT................................................................................................................. iv
ÖZ ................................................................................................................................ vi
DEDICATION ...........................................................................................................viii
ACKNOWLEDGEMENTS ......................................................................................... ix
TABLE OF CONTENTS............................................................................................. xi
LIST OF TABLES ...................................................................................................... xv
CHAPTER
1. INTRODUCTION..................................................................................................... 1
1.1 What is Anxiety Sensitivity?......................................................................... 1
1.2 Anxiety Sensitivity and Trait Anxiety .......................................................... 3
1.3 Factors Affecting Anxiety Sensitivity........................................................... 7
1.3.1.Genetic Factors ............................................................................................ 7
1.3.2.Contribution of Learning Experiences ....................................................... 10
1.3.3.Anxiety Sensitivity and Gender ................................................................. 14
1.4. Measurement of Anxiety Sensitivity............................................................... 15
1.5. Anxiety Sensitivity and Psychological Disorders ........................................... 21
1.5.1.Anxiety Sensitivity and Anxiety Disorders ............................................... 21
1.5.2.Anxiety Sensitivity and Depression........................................................... 25

xii
1.6. Anxiety Sensitivity and Substance and Alcohol Use...................................... 27
1.6.1.Anxiety Sensitivity, Substance Use and Smoking ..................................... 27
1.6.2.Anxiety Sensitivity and Alcohol Use......................................................... 29
1.6.2.1. Four Factor Motivational Model of Alcohol Use and Drinking
Motives........................................................................................ 34
1.6.2.2. Anxiety Sensitivity and Drinking Motives ................................. 40
1.7. Purpose of the Present Study ......................................................................... 45
1.8. Hypotheses of the Study ................................................................................ 46
2. METHOD............................................................................................................... 49
2.1. Participants.................................................................................................. 49
2.1.1.University Students .................................................................................... 49
2.1.2.Alcohol Dependent Inpatients.................................................................... 49
2.2. Materials...................................................................................................... 50
2.2.1.Anxiety Sensitivity Index-Revised (ASI-R) .............................................. 50
2.2.2.State-Trait Anxiety Inventory-Trait Form (STAI-T) ................................. 52
2.2.3.Beck Depression Inventory (BDI) ............................................................. 52
2.2.4.Alcohol Use Disorders Identification Test (AUDIT) ................................ 53
2.2.5.Drinking Motives Questionnaire-Revised (DMQ-R)................................. 54
2.3. Procedure .................................................................................................... 56
2.3.1.University Students .................................................................................... 56
2.3.2.Alcohol Dependent Inpatients.................................................................... 56
2.4. Data Analysis .............................................................................................. 57
3.RESULTS ................................................................................................................ 59

xiii
3.1. Factor Structure, Validity and Reliability of the ASI-R .................................. 59
3.1.1.Factor Structure of the ASI-R .................................................................... 59
3.1.2.Convergent and Divergent Validity of the ASI-R...................................... 63
3.1.3.Reliability of the ASIR .............................................................................. 65
3.2. Relationship among Alcohol Use, Anxiety Sensitivity and Drinking
Motives in University Students Using Alcohol ...................................................... 65
3.2.1.Descriptive Statistics of Self-Reported Measures by Gender .................... 66
3.2.2.Anxiety Sensitivity and Alcohol Use......................................................... 68
3.2.3.Anxiety Sensitivity as a Predictor of Alcohol Use .................................... 69
3.2.4.Anxiety Sensitivity and Coping Motives as Predictors of Alcohol Use .... 76
3.2.5.Alcohol Use, Anxiety Sensitivity and Drinking Motives .......................... 83
3.2.6.Anxiety Sensitivity as a Predictor of Drinking Motives ............................ 87
3.3. Relationship among Alcohol Use, Anxiety Sensitivity and Drinking
Motives in Alcohol Dependent Inpatients .............................................................. 94
3.3.1.Anxiety Sensitivity, Alcohol Use and Drinking Motives .......................... 95
3.3.2.Drinking Motives ....................................................................................... 98
4.DISCUSSION ........................................................................................................ 100
4.1. Factor Structure, Validity and Reliability of the ASI-R ................................ 100
4.2. Relationship among Alcohol Use, Anxiety Sensitivity and Drinking Motives
in University Students Using Alcohol .................................................................. 105
4.2.1.Gender Differences on Self Reported Measures...................................... 105
4.2.2. Anxiety Sensitivity and Alcohol Use...................................................... 109
4.2.3. Anxiety Sensitivity and Coping Motives as Predictors of Alcohol Use . 113
xiv
4.2.4. Alcohol Use, Anxiety Sensitivity and Drinking Motives ....................... 115
4.3. Relationship among Alcohol Use, Anxiety Sensitivity and Drinking
Motives in Alcohol Dependent Inpatients ............................................................ 122
4.3.1.Anxiety Sensitivity, Alcohol Use and Drinking Motives ........................ 122
4.3.2.Drinking Motives ..................................................................................... 124
4.4.General Discussion and Conclusions .............................................................. 128
4.5.Limitations of the Present Study..................................................................... 130
4.6.Clinical Implications ....................................................................................... 133
4.7.Directions for Future Research ....................................................................... 134
REFERENCES.......................................................................................................... 136
APPENDICES .......................................................................................................... 151
APPENDIX A: Anxiety Sensitivity Index-Revised.................................................. 152
APPENDIX B: State-Trait Anxiety Inventory-Trait Form....................................... 155
APPENDIX C: Beck Depression Inventory ............................................................. 157
APPENDIX D: Alcohol Use Disorders Identification Test...................................... 160
APPENDIX E: Drinking Motives Questionnaire-Revised ....................................... 162

xv
LIST OF TABLES
Table 1 Factor Loadings and Communalities (h²) for the Four Factor Solution of the
PCA and PAF after Oblique Rotation.......................................................... 61
Table 2 Pearson Correlation Coefficients among ASI-R, ASI-R factors, STAI-T and
BDI in University Students ................................................................................. 64
Table 3 Descriptive Statistics of Self-reported Measures by Gender in University
Students ............................................................................................................... 67
Table 4 Drinking Behavior Scores as a function of AS group.................................... 69
Table 5 Variables in each step for Hierarchical Multiple Regressions using
demographics and ASI-R lower order factors to predict aspects of Drinking
Behavior .............................................................................................................. 70
Table 6 Zero-order Correlations among Predictor (demographics and ASI-R lower
order factors) and Criterion (drinking behavior measures) Variables ................ 71
Table 7 Summary of Hierarchical Multiple Regressions using demographics and
ASI-R lower order factors to predict aspects of Drinking Behavior................... 74
Table 8 Variables in each step for Hierarchical Multiple Regressions using
demographics, BDI, ASI-R lower order factors AND Coping Motives to predict
aspects of Drinking Behavior.............................................................................. 76
Table 9 Zero-order Correlations among Predictor (demographics, BDI, ASI-R lower
order factors and Coping Motives) and Criterion (drinking behavior measures)
Variables ............................................................................................................. 79
xvi
Table 10 Summary of Hierarchical Multiple Regressions using demographics, BDI,
ASI-R lower order factors and Coping Motives to predict aspects of Drinking
Behavior .............................................................................................................. 81
Table 11 Descriptive Statistics of Drinking Motives Scores of University Students
Using Alcohol ..................................................................................................... 84
Table 12 Comparison of Drinking Motives Scores as a function of AS group .......... 86
Table 13 Variables in each step for Hierarchical Multiple Regressions using
demographics, AUDIT’s two subscales and ASI-R lower order factors to predict
Drinking Motives ................................................................................................ 87
Table 14 Zero-order Correlations among Predictor (demographics, AUDIT’s two
subscales and ASI-R lower order factors) and Criterion (drinking motives)
Variables ............................................................................................................. 88
Table 15 Summary of Hierarchical Multiple Regressions using demographics,
AUDIT’s two subscale scores, and ASI-R lower order factors to predict
Drinking Motives ................................................................................................ 92
Table 16 Descriptive Statistics of Self-reported Measures in Alcohol Dependent
Inpatients ............................................................................................................. 94
Table 17 Zero-order Correlations among demographics, ASI-R lower order factors,
Drinking Behavior Measures and Drinking Motives in Alcohol Dependent Inpatients
..................................................................................................................................... 97
Table 18 Descriptive Statistics of Drinking Motives scores of Alcohol Dependent
Inpatients ............................................................................................................. 99

1
CHAPTER I
INTRODUCTION
1. 1. What is Anxiety Sensitivity?
Anxiety sensitivity (AS) is defined as “a cognitive individual difference
variable consisting of beliefs that the experience of anxiety / fear causes illness,
embarrassment or additional anxiety” (Reiss, Peterson, Gursky, & McNally, 1986,
pp. 1-2). Reiss (1991) described AS as a “fear of fear” or “fear of anxiety”. People
with high AS are more likely to believe that anxiety-related symptoms (e.g., fainting,
trembling) have harmful somatic, social or psychological consequences as compared
to people with low AS. Therefore, people with high AS usually avoid situations
which lead to anxiety-related sensations. On the other hand, people with low AS
think that anxiety symptoms are unpleasant but harmless (Reiss, 1991).
In 1940’s, AS and related concepts have been considered in theoretical
perspectives. However, theoretical and clinical significance of AS was recognized
after the development of cognitive theories of panic attack, anxiety and anxiety-
related disorders (Taylor, 1995). In 1985, Reiss and McNally proposed an
expectancy model of fear. They developed this theory to explain how and why AS
could cause fear, anxiety, panic, and avoidance behavior. Hence, the expectancy
theory provided an important theoretical context for AS.
According to the expectancy theory, “expectations” (what one thinks will
happen when the feared object is encountered, e.g., “I expect to have a panic attack

2
during flight”) and “sensitivities” (why one is afraid of the anticipated event, e.g.,
“Panic attacks cause heart attacks”) theoretically provide the basis of human fears
(Reiss, 1991). Additionally, the expectancy theory made the distinction between
common (ordinary) fears and fundamental fears. Common fears are, for instance,
fears of harmless animals, fears of heights. However, fundamental fears are fears of
stimuli that are inherently aversive for most people (Reiss, 1991). Indeed, according
to Reiss (1991) fundamental fears give rise to fearing a broad range of stimuli, while
common fears do not. He posited that fear acquisition is a function of three
fundamental fears (sensitivities): (1) injury / illness sensitivity; (2) fear of negative
evaluation; and (3) anxiety sensitivity. He proposed that fundamental fears might
exacerbate many common fears. For example, a person might be afraid of snakes
(common fear) if the person is frightened about feeling anxious (AS).
Taylor (1998) proposed that AS is a stable personality trait which exists in all
persons, varying among individuals by degree. Individual differences in AS arise
from a variety of sources including social learning experiences, history of panic
attacks, need to avoid social embarrassment or illness and physiological
overreactivity (Reiss et al., 1986). AS has been shown to be associated with anxiety
disorders, (Reiss, 1991; Zinbarg, Barlow, & Brown, 1997; Taylor, Koch, & McNally,
1992) particularly panic attacks (Schmidt, Lerew, & Jackson, 1997; Norton et al.,
1997), and alcohol / drug use (Stewart, Samoluk, & McDonald, 1999; Karp, 1993).
Little is known concerning AS’s relation to the broader personality domain.
Yet, some psychometric research has shown that AS is a subcomponent of a higher
order factor commonly referred to as neuroticism or negative affectivity (e.g., Rapee
& Medoro, 1994). Studies (i.e., Arrindell, 1993; Zinbarg & Barlow, 1996; Cox,

3
Borger, Taylor, Fuentes, & Ross, 1999), that have examined the relation of AS
measures to dimensions of Big Three and Big Five, have usually found that measures
of AS were significantly correlated with the higher order dimension of Negative
Emotionality (or in Eysenck’s scheme, Neuroticism), which reflects a tendency to
experience aversive emotional states of all kinds. Similarly, Lilienfeld (1997), too,
demonstrated that AS is positively associated with a higher order psychological
factor of negative emotionality but is unrelated to either positive emotionality or
constraint.
The Anxiety Sensitivity Index (ASI) (Reiss et al., 1986) is the most
frequently used scale to assess AS. Taylor (1996) suggested that the ASI has a
multifactorial structure consisting of at least three lower order factors. The items of
ASI assess broadly three domains: fear of somatic sensations (physical concern), fear
of cognitive sensations (psychological concern), and fear of publicly observable
sensations (social concern).
1. 2. Anxiety Sensitivity and Trait Anxiety
In AS literature, there is a debate about whether AS and trait anxiety are
identical or different concepts. When the construct of AS was first put forward, Reiss
et al. (1986) explained the distinction between AS and trait anxiety (frequency and
intensity of past anxiety experiences) by stating “it may be more important to know
what the person thinks will happen as a result of becoming anxious than how often
the person actually experiences anxiety” (p. 1). McNally (1989) illustrated the
difference between AS and trait anxiety by defining trait anxiety as a general
tendency to respond fearfully to stressors, while AS as a specific tendency to respond

4
fearfully to one’s own anxiety symptoms. It is suggested that trait anxiety cannot
explain why some people react with anxiety to their own anxiety or anxiety related
sensations (Donnell & McNally, 1990). In addition, McNally (1996) suggested that a
person could be theoretically high in trait anxiety but low in AS, and vice versa.
Indeed, Cox, Endler and Swinson (1991) obtained empirical evidence that some
individuals possess high AS but low trait anxiety, and vice-versa.
Some studies found empirical evidence that AS frequently is not independent
of other forms of anxiety such as trait anxiety (i.e., Cox, Endler, Norton, & Swinson,
1991; Lilienfeld, 1996). However, much more evidence indicated that AS and trait
anxiety are different personality traits (i.e., McNally, 1989; Reiss et al., 1986; Taylor,
1996). Taylor, Koch and Crockett (1991) found the Anxiety Sensitivity Index (ASI)
to be factorially distinct from State Trait Anxiety Inventory-Trait Form (STAI-T).
Moreover, the ASI and STAI-T are only moderately correlated. Hence, they
concluded that the ASI and STAI-T are measures of different constructs. Rapee and
Medoro (1994) again found that there was a significant but modest (r = 0.31)
correlation between the ASI and STAI-T. Furthermore, Reiss (1991) and McNally
(1990) pointed out that correlations between the ASI and trait anxiety have been
consistently lower than the correlations between trait and state anxiety. Taylor and
Cox (1998a) found a modest correlation (r = 0.26) between trait version of STAI and
60 item-Anxiety Sensitivity Profile which is a revised form of the ASI, and
concluded that AS and trait anxiety are correlated but distinct factors.
Similarly, Sandin, Chorot and McNally (2001) have investigated the
association between the ASI and STAI-T by subjecting the items of both scales to
factor analysis. Results yielded two different factors with the first factor that can be

5
described as a trait anxiety factor, and the second as an anxiety sensitivity factor.
Thus, their results supported the hypothesis that the ASI and STAI-T are measuring
different constructs.
Another line of research has demonstrated that the ASI has incremental
validity above and beyond trait anxiety measures in the prediction of fear and panic
i.e., Taylor, 1995a; Taylor, 1995b). For example, Muris, Schmidt, Merckelbach and
Schouten (2001) found that in a sample of adolescents, AS accounted for significant
proportion of variance in anxiety disorder symptoms, even when trait anxiety levels
were controlled. These findings supported AS’s construct validity and they indicated
that AS and trait anxiety are different constructs.
The construct of AS has been criticized by Lilienfeld et al. (1989, 1993,
1996) who have reported various versions of criticisms on this issue. The main point
made by Lilienfeld, Jacob and Turner (1989) is that AS is simply trait anxiety. They
argued that neither the AS nor the ASI has been adequately distinguished from trait
anxiety and STAI-T. They even suggested that AS should be eliminated from the
field of research.
Lilienfeld, Turner and Jacob (1993) later argued that AS effects can be
accounted for by trait anxiety in numerous studies using the ASI. Lilienfeld et al.
(1993) noted the evidence that patients with panic disorder and other anxiety
disorders have also elevated trait anxiety. From this point, they criticized studies
which found high levels of AS in patients with panic disorder and other anxiety
disorders and argued that high AS in these patients can be an effect of trait anxiety.
Therefore, they suggested that research on AS should definitely explore the ASI’s

6
incremental validity relative to trait anxiety measures in examining AS’s association
with panic disorder and other anxiety disorders.
Lilienfeld et al. (1993) further noted that trait anxiety influences the extent to
which ambiguous stimuli are interpreted as threatening. Thus, they asserted that trait
anxiety, rather than AS, does explain why some individuals perceive their own
anxiety experiences to be more threatening than others. They also argued that the
findings of AS studies using anxiety-provoking procedures (e.g., inhalation of CO2,
hyperventilation) (i.e., Donnell & McNally, 1989) could also be explained by trait
anxiety. They claimed that people might manifest high state anxiety to challenge
procedures as a result of high trait anxiety. Thus, they criticized AS studies using
challenge procedures for proposing AS as the sole explanation leading to high state
anxiety following challenge.
Yet, in their final discussion of AS-trait anxiety debate, considering
substantial amount of empirical support for AS, Lilienfeld et al. (1996) have
conceded AS’s construct validity and acknowledged that AS research cannot be
explained entirely by trait anxiety. However, they proposed a hierarchical factor
model of AS and trait anxiety in which AS is a facet of trait anxiety. They claimed
that AS is a lower-order factor of a higher order dimension of trait anxiety which is a
lower order factor of another higher order dimension of neuroticism (negative
affectivity). They also suggested that several lower-order factors within the AS
construct also exist.
In response to criticisms of Lilienfeld et al. (1989, 1993, 1996), Reiss (1997)
explained theoretical and conceptual differences between the AS and trait anxiety
and put forward that AS and trait anxiety are different in the sense that they use
7
different indicators to predict future anxiety or fear. Reiss (1997) noted that while
trait anxiety predicts future anxiety based on anxiety experiences in the past, AS
predicts future anxiety based on the beliefs assessed by the ASI, regardless of the
frequency of anxiety experiences in the past. Furthermore, Reiss (1991) has
evaluated the correlation between AS and trait anxiety in 11 different studies. He
reported that the overlapping variance (r²) between AS and trait anxiety ranges
between 0 and 36%. Reiss (1997) concluded that AS is related to but distinct from
trait anxiety.
In response to AS-trait anxiety debate, hierarchical theories have emerged
which explained both the shared variance and the unique contribution of AS in
anxious responding (Zinbarg & Barlow, 1996; Zinbarg et al., 1997). The existent
research has both supported the distinction between the AS and trait anxiety and
argued against such a distinction. The current and widely accepted conceptualization
of hierarchical model integrates both of the perspectives and viewed AS as being
both a distinct construct and a lower-order factor of trait anxiety. McNally (1996) has
concluded that AS is an individual difference variable that is empirically and
conceptually distinct from trait anxiety. From the research findings thus far a
consensus emerged that AS and trait anxiety are different constructs.
1. 3. Factors Affecting Anxiety Sensitivity
1. 3. 1. Genetic Factors
In fact, the literature on AS is profoundly lacking studies of the origins of AS.
The expectancy theory posits AS to be acquired through learning and / or influenced
by genetic factors (Reiss & McNally, 1985). With respect to genetic influences,

8
Reiss and McNally (1985) proposed that people who are highly autonomically
reactive might develop greater concerns about becoming anxious than less reactive
people.
Stein, Jang and Livesley (1999) examined the heritability of AS by carrying
out a twin study. They examined ASI scores of monozygotic and dizygotic twin pairs
to find out whether AS might be inherited. They found that AS had a strong heritable
component. Their results revealed that approximately 45% that is nearly half of the
variance in AS could be accounted for by genetic factors. Since over half of the
variance (additional 55%) in AS levels was attributable to environmental influences,
Stein et al.’s (1999) study also indicated the importance of the parental role of
childhood learning experiences in the development of elevated AS. Additive genetic
effects and unique environmental events influence the development of AS. Thus,
Stein et al.’s (1999) study supported both the genetic and environmental (learning)
experiences on the acquisition of high levels of AS.
Studies have proposed that if AS has a hereditary component and is linked to
the vulnerability to panic disorder, first degree relatives of panic disorder patients
might have higher AS levels than normals. In such a study Van Beek and Griez
(2003) examined whether healthy first-degree relatives of panic disorder patients are
more anxiety sensitive than healthy controls (normals). Their results revealed that
first-degree relatives scored higher on AS than controls, but lower than panic
disorder patients. Thus, this study indicated that AS runs in families. Conversely, in a
recent study Van Beek, Perna, Schruers, Muris and Griez (2005) investigated AS
levels in children of parents with panic disorder and they found that children of
parents with panic disorder do not have higher levels of AS than children of healthy

9
parents. Moreover, they found no relationship between AS levels of parents with
panic disorder and their children. They concluded that since children of panic
disorder do not display higher levels of AS compared to those of healthy parents, AS
may manifest itself towards late adolescence or early adulthood. Manuzza et al.
(2002) carried out a similar study and they again found that there were no differences
in AS levels of children of parents with panic disorder, other anxiety disorders and
no disorders.
Although Van Beek and Griez (2003) stated that it might be tempting to make
an association between carbon-dioxide (CO2) vulnerability and high AS, some
authors proposed that increased AS may explain high vulnerability to biological
challenges (i.e., Forsyth, Palav, & Duff, 1999). In a study including panic disorder
patients and nonclinical controls, Shipherd, Beck and Ohtake (2001) examined the
relationship between the ASI and responses to administration of CO2. They found
that AS levels predict responses to a CO2 challenge in panic disorder patients and
control participants. Specifically, high levels of AS are associated with more anxiety,
respiratory changes and more intense symptom reports following CO2 challenge.
Other studies using nonclinical samples also showed that individuals with high levels
of AS reported greater subjective distress in response to inhalation of low doses of
CO2 than subjects with low levels of AS (McNally & Eke, 1996; Forsyth et al.,
1999). In this aspect, there is some preliminary evidence supporting an association
between AS and CO2 vulnerability.
To conclude, it is assumed that at least a sizeable proportion of the variance in
AS is likely to be genetically determined. However, little is known about how the
genetic factors operate.

10
1. 3. 2. Contribution of Learning Experiences
Taylor and Cox (1998a) proposed that childhood learning experiences may
affect the development of high AS. They argued that for example how much
someone learns about the dangerousness of cardiac symptoms might influence one’s
fear of those sensations. Furthermore, Taylor (2000) hypothesized that specific types
of learning experiences influence beliefs associated with specific dimensions of AS;
for example fear of somatic sensations could be influenced by being exposed to
parental instruction about the dangerousness of these sensations or by witnessing
how the parents react when they themselves experience somatic sensations.
Likewise, fear of cognitive dyscontrol could be influenced by observing parental
cognitive dyscontrol or receiving parental instruction that feeling ‘spaced out’
(depersonalization) or derealization is a sign of insanity. Fear of publicly observable
anxiety reactions could arise from experiences of being ridiculed for blushing or
trembling. Taylor (2000) added that recurrent, intense arousal-related sensations may
increase the person’s beliefs about the dangerousness of the sensations, particularly if
the person is not given an adequate explanation of the real causes of the sensations.
Specific learning experiences during childhood may affect AS in adolescence. For
instance, an intense panic attack experience in childhood may be cognitively
misinterpreted as harmful or dangerous and contribute to high levels of AS (Stewart
et al., 2001).
Research that has examined the role of learning experiences in the
development of AS has focused on three primary learning mechanisms: (1) classical
conditioning, (2) instrumental conditioning, and (3) vicarious conditioning. With
respect to classical conditioning, it has been speculated that if bodily arousal

11
sensations, such as heart palpitations (CS), are paired with a frightening event, such
as an unexpected panic attack, (UCS), then a person might make the association
between CS and UCS and learn to fear (CR) the bodily arousal sensations in the
future (Forsyth, Eifert, & Thombson, 1996). However, Donnell and McNally (1990),
in a study of 425 college students, examined whether high AS occurs in the absence
of a history of unpredictable panic attacks and their results contradicted with this
classical conditioning position. They found that two-thirds of the high AS students
had never experienced a panic attack. Hence, they argued that the fear of anxiety,
that is AS, can be acquired in ways other than through direct experience with panic
(e.g., verbal transmission of misinformation).
According to instrumental conditioning model, if a child’s anxiety symptoms
are rewarded in some way, such as being allowed to miss school (negative
reinforcement) or being paid special attention (positive reinforcement), it might
contribute to the development of high AS. On the other hand, if a parent discourages
his / her child’s fear of anxiety symptoms (i.e., punishment), the child would
probably suppress the symptoms in the future, which might contribute to lower AS
levels (Watt, Stewart, & Cox, 1998).
Vicarious conditioning could contribute the development of high AS if a child
modeled his or her parents by observing their fear reactions to their own anxiety
symptoms and / or if the parents verbally transmit their beliefs about the harmfulness
of these symptoms to the child (Watt et al., 1998). In line with this assumption,
Donnell and McNally (1990) found that a family history of panic was associated with
high AS levels among their student sample, indicating that high AS may develop as a
12
result of children being exposed to parental models who have exhibited fear
responses to their own anxiety experiences.
Watt et al. (1998) studied the relationship between early learning experiences
and the development of AS in a nonclinical university student sample. They found
that parental reinforcement of sick role behavior in response to both childhood
anxiety symptoms and childhood cold symptoms, observation of parents’
uncontrolled behavior, and observation of parental sick role behavior in response to
parents’ own anxiety symptoms predicted overall AS. Results also revealed that high
AS individuals retrospectively reported more childhood instrumental and vicarious
conditioning experiences involving somatic symptoms compared to those with lower
AS. They also found that exposure to uncontrolled parental behaviors due to
drunkenness and anger was related to the development of high AS. It is also
indicated that the learning experiences of high AS individuals were not to be specific
to anxiety symptoms, but involved somatic symptoms in general.
Stewart et al. (2001) examined the relations between childhood learning
experiences (instrumental and vicarious) and AS in young adults using retrospective
self-reports and structural equation modeling. The reported learning experiences
were found to have a direct effect on participants’ AS levels. Not only childhood
learning experiences for arousal–reactive sensations (e.g., dizziness, rapid heart beat)
but also arousal non-reactive sensations (e.g., colds, pains) directly influenced AS.
MacPherson, Stewart and McWilliams (2001), in a sample of university students,
investigated whether high levels of AS and its lower order components were
associated with childhood exposure to parental alcohol problems. Results revealed
that exposure to parental problem drinking was significantly associated with AS

13
psychological and physical concerns, but not social concerns. Furthermore, AS
psychological concerns has been found to be a mediator of the relationship between
parental problem drinking and both general anxiety and panic-related anxiety
symptoms in the offspring.
More recently, Watt and Stewart (2003) carried out a retrospective study and
examined the relationship between childhood exposure to parental dyscontrol as a
learning experience and levels of AS components and anxiety symptoms in early
adulthood. They found that exposure to parental dyscontrol (i.e., loss of control
behaviors due to drunkenness, anger or other negative emotional states) was
significantly and positively correlated with all three AS dimensions (psychological,
social and physical concerns). However, exposure to parental dyscontrol related to
drinking was significantly positively correlated with only psychological concerns
dimension of AS. Hence, researchers of this study concluded that frequent exposure
to uncontrolled behavior due to parental drinking might lead to fears of loss of
control in the offspring. Results also showed that AS psychological concerns plays a
significant mediating role between parental dyscontrol related to anger and drinking
and both general and panic-related anxiety symptoms in the adult offspring.
Scher and Stein (2003) proposed that other than the traditional learning theory
perspectives, Bowlby’s (1969/1982; cited in Scher & Stein, 2003) attachment theory
may also be a framework for explaining the development of AS. They asserted that
Bowlby’s ideas about specific caregiver behaviors which leads to anxiety and
depression may also contribute to the development of AS. Thus, parallel to Bowlby’s
ideas, they hypothesized that mother-child attachment relationships influence the
development of AS. Scher and Stein (2003) examined the role of parental
14
threatening, hostile, and rejecting behavior in the development of AS based on their
conceptualization of AS. They found that exposure to parental threatening, hostile
and rejecting behaviors predicted overall AS, but parental threatening behaviors have
the strongest relationship to AS. Specifically, parental threatening behaviors
predicted fear of publicly observable anxiety symptoms, whereas parental hostile and
rejecting behaviors predicted fear of losing control.
From the research carried out so far, there appears to be substantial support
that parents may pass AS to their children either via genetic pathway or via
observational learning and hence both genetic influences and learning experiences do
contribute to the development of AS.
1. 3. 3. Anxiety Sensitivity and Gender
Little research has investigated the relationship between AS and gender.
Moreover, findings have been inconsistent regarding sex differences in ASI scores.
Reiss et al. (1986), Peterson and Heilbronner (1987), Peterson and Plehn (1999) and
Stewart, Karp, Pihl and Peterson (1997) found that female university students have
significantly higher average levels of AS than male university students. However,
Cox et al. (1991) found that females and males do not significantly differ from each
other on the ASI scores, but they noted that females were significantly more likely to
report panic attacks. Messenger and Shean (1998) again found no gender differences
on the ASI.
There are also studies which found significant gender differences in the
dimensions of AS. For instance, in a study by Stewart, Taylor and Baker (1997),
females scored higher than males only on the physical concerns factor, females

15
scored higher on the physical concerns factor relative to their scores on the social and
psychological concerns factor. Results also revealed that males score higher on the
social and psychological concerns factors relative to their scores on the physical
concerns factor. Finally, on the total ASI scores, females scored higher than males.
Stewart et al. (1997) explained the differences between males and females on various
AS dimensions in ways consistent with sex role socialization practices. For instance,
they explained males’ relatively greater level of concern with social and
psychological consequences of anxiety symptoms by the socialization that they learn
at an early age that it is not acceptable for them to lose control or to display anxiety
in public. Thus, males tend to have higher scores in these two subscales rather than
their scores in physical concerns factor. Furthermore, many studies have shown that
females report greater fears of anxiety experiences, overall, on the ASI than males
(Peterson & Reiss, 1992).
1. 4. Measurement of Anxiety Sensitivity
One of the most widely used measures of AS is the Anxiety Sensitivity Index
(ASI) developed by Reiss et al. (1986). It is a 16-item self-report measure and
participants rate the degree of agreement with each of the statements on a 5-point
Likert-type scale (Taylor, 1995). The ASI is widely used in clinical area to assess
anxiety disorders and has been translated and normed in a variety of cultures. The
norms are stable across cultures for both clinical and nonclinical groups (Reiss,
1991). Studies with college students and clinical populations have shown that the
ASI has sound psychometric properties including evidence of its high internal
consistency, high test-retest reliability, criterion-related validity in distinguishing
16
patients with anxiety disorders from controls, and construct validity as a measure of
fear of fear as distinct from trait anxiety (Taylor, 1995).
However, there has been considerable debate on the factor structure of the
ASI, whether it has a multifactorial or a single factor solution. Studies found quite
inconsistent results; some supported a single factor solution (Reiss et al., 1986;
Taylor et al., 1991; Taylor, Koch, McNally, & Crockett, 1992; Sandin, Chorot, &
McNally, 1996), whereas some reported a multidimensional solution (Cox, Parker, &
Swinson, 1996; Telch, Shermis, & Lucas, 1989a). Expectancy theory conceptualized
AS as a unifactorial construct (Reiss et al., 1986). Peterson and Heilbronner (1987)
obtained a four-factor solution for the ASI with factors: (a) fear of cognitive
symptoms associated with anxiety; (b) perceived importance of controlling the public
display of symptoms associated with anxiety; (c) fear of cardiopulmonary and
gastrointestinal sensations; (d) fear of trembling and fainting. However, they
cautioned that the ASI is best represented by a single factor because there were few
salient loadings for each factor which makes their solution unreliable. Hence, they
concluded that the ASI is unifactorial.
Telch et al. (1989a) and Wardle, Ahmad and Hayward (1990) again found a
four-factor solution for the ASI. Similarly, Ayvaşık (2000) found a four-factor
solution for the Turkish version of the ASI. However, she concluded that a single-
factor solution better fitted the data. Although there are some similarities among the
four-factor solutions, there are also notable differences. Telch et al.’s (1989a) study
found a different four-factor solution than that of Peterson and Heilbronner (1987)
and Wardle et al. (1990). Additionally, Wardle et al. (1990) found markedly different
four-factor solutions for agoraphobic and normal samples. Thus, it seems that the

17
four-factor solutions of the studies revealed inconsistent factor structures. Taylor
(1995) posited that inconsistencies regarding factor analytic studies of the ASI might
indicate that the ASI’s factor structure may inherently be unstable or varies across
populations such as university students and patients with different types of anxiety
disorders.
Taylor et al. (1992) investigated the factor structure of the ASI with
confirmatory factor analysis method by which they evaluate different models. They
compared the single-factor solutions with four-factor solutions. Their results
indicated that the ASI is unifactorial, rather than composed of multiple anxiety
sensitivities. They concluded that the acceptance of a four-factor solution is neither
empirically nor theoretically necessary. Afterwards in 1996, Taylor suggested that
the ASI has a hierarchical multifactorial structure, consisting of at least three
different lower-order factors, which are: (1) fear of somatic symptoms (physical
concerns), (2) fear of cognitive dyscontrol (psychological concerns), (3) fear of
publicly observable symptoms (social concerns). Some other studies including
clinical and nonclinical samples have also demonstrated that the ASI is composed of
at least three distinct, inter-correlated factors and one higher order factor (e.g., Cox,
1996; Zinbarg et al., 1997; Zinbarg, Mohlman, & Hong, 1999; Mohlman & Zinbarg,
2000). Essentially, the most replicable factor solutions for the ASI are three-factor
solutions, with the lower-order AS components, physical, psychological and social
concerns (e.g., McWilliams, Stewart, & McPherson, 2000; Stewart et al., 1997). On
the other hand, there are also more recent studies which demonstrated that ASI has a
two factor solution (Blais et al., 2001; Schmidt & Joiner, 2002; Cintron. et al., 2004).
It seems that studies on the factor structure of the ASI yielded different results; some

18
studies confirming the unifactorial structure for the ASI and some studies supporting
a multifactorial structure for the ASI. However, the most replicable factor solution
seems to be three lower-order factors loading on one higher order factor.
Another controversy concerning the ASI is whether it measures a transitory
state or a more stable personality trait. Reiss et al. (1986) found that ASI scores tend
to be stable over a 2-week period. A longitudinal study by Maller and Reiss (1992)
found evidence for the hypothesis of AS as a stable trait. This study found a 0.71
correlation between ASI scores in 1984 and ASI scores in 1987. This finding
demonstrated that the stability of the ASI scores over a long period of time is in the
0.60 to 0.80 range, as reported for many other personality factors. Thus, research
findings suggested that ASI is a highly stable measure of AS and this is consistent
with the view that AS is a stable individual characteristic.
Although there is a debate in the literature on the factor structure of the ASI,
high degree of internal reliability for the ASI constitutes important support for the
psychometric soundness of the measure. Measured by Cronbach’s alpha coefficient,
Peterson and Heilbronner (1987) found the internal reliability at 0.88 and Telch et al.
(1989a) found it as 0.80. These findings showed that various items on the ASI do
belong together. Reiss et al. (1986), who developed the ASI, also examined the
psychometric properties of the ASI. They found that test-retest reliability of the ASI
over a two-week period range from 0.75 - 0.85.
Lilienfeld et al. (1993) criticized that AS literature is based on only a single
measure of AS, namely the ASI. They suggested that AS, as a complex construct,
consisting of several lower order factors, should not be assessed by a single measure.
Taylor (1996) has stressed that ASI has only one item to assess fear of respiratory
19
symptoms which is insufficient to reliably define a factor. Afterwards, Taylor and
Cox (1998b) posited that the ASI may not reliably assess all the important domains
of AS, (e.g., fear of depersonalization). Therefore, Taylor and Cox (1998b)
developed the Anxiety Sensitivity Index-Revised (ASI-R) which is based on an
expanded measure of AS and consists of multiple dimensions. The ASI-R consists of
36 items with 6 subscales assessing each of the major domains of the AS. Taylor and
Cox (1998b) examined the factor structure of the ASI-R in a sample of adult
psychiatric outpatients. Results indicated a hierarchical structure with four lower-
order factors loading on one higher order factor. The lower-order factors were (1)
fear of respiratory symptoms, (2) fear of publicly observable anxiety reactions, (3)
fear of cardiovascular symptoms, and (4) fear of cognitive dyscontrol. More recently,
Deacon, Abramowitz, Woods and Tolin (2003) again found that the ASI-R has four
lower-order factors which load on a single higher order factor. The lower-order
factors were (1) beliefs about the harmful consequences of somatic sensations, (2)
fear of publicly observable anxiety reactions, (3) fear of cognitive dyscontrol, (4)
fear of somatic sensations without explicit consequences. On the other hand,
Zvolensky and colleagues (2003) found that a two-factorial solution for the ASI-R
was the most replicable across six different countries. The two factors were fear of
somatic sensations and fear of social-cognitive concerns.
Another measure of AS is a 60-item Anxiety Sensitivity Profile (ASP) which
was developed by Taylor and Cox (1998a). It contains six different dimensions and
each dimension consists of 10 items. The subscales of the ASP were determined on
the basis of the results of previous studies with the ASI (Taylor, 1996). Taylor and
Cox (1998a) showed that the ASP has four lower order factors loaded on a single
20
higher order factor. The lower order factors were: (1) fear of respiratory symptoms,
(2) fear of cognitive dyscontrol, (3) fear of gastrointestinal symptoms, and (4) fear of
cardiac symptoms. These factors were similar to those obtained for the original ASI
(Peterson & Reiss, 1992), and to factors obtained for the ASI-R (Taylor & Cox,
1998b). Ayvaşık and Tutarel-Kışlak (2004) provided evidence that the Turkish
version of ASP has also four lower-order factors loaded on a higher order factor, and
the lower-order factors were the same as found in Taylor and Cox’s (1998a) study.
An index measuring AS in children and adolescents was also developed.
Silverman, Fleisig, Rabian and Peterson (1991) developed the Childhood Anxiety
Sensitivity Index (CASI) consisting of 18 items. Children respond to each item using
a 3-point Likert-type scale (1 = ‘none’, 2 = ‘some’, or 3 = ‘a lot’). Total scores range
between 18 and 54. Silverman et al. (1991) reported coefficient αs of 0.87 for both a
nonclinical and clinical sample and test-retest reliability estimates of 0.76 and 0.79
for the nonclinical and clinical samples, respectively. Silverman, Ginsburg and
Goedhart (1999) found that CASI has a hierarchical structure with three lower-order
factors (“fear of physical symptoms”, “fear of mental incapacitation” and”fear of
social evaluation”). The CASI was found to exhibit good convergent and
discriminant properties in relation to clinician-rated panic and generalized anxiety
severity, respectively (Chorpita & Daleiden, 2000).
There are other measures of AS as well. Kenardy, Evans and Oei (1992)
developed the Anxiety Symptoms and Beliefs Scale, which consists of a total of 21
items; 16 items assessing the intensity of anxiety-related sensations, including those
that appear as DSM-III-R criteria for panic attacks, (“lightheadedness”,
“palpitations”) and 5 items assessing feared consequences of panic or extreme

21
anxiety (“feelings of unreality”, “fears of losing control”). However, this scale is not
used widely as the ASI, since it has too few items assessing fears of anxiety and
dimensions of AS (Taylor, 1995).
Even though the dimensionality of AS has been still a controversial issue in
the literature, there is substantial evidence that AS consists of at least three lower-
order factors which load on a single higher order factor in child and adult samples,
and in nonclinical and clinical samples (i.e., Muris et al., 2001; Zinbarg et al., 1997;
Taylor & Cox, 1998a). The lower-order dimensions of AS are as follows: (1) somatic
concerns (e.g., illness), (2) psychological concerns (e.g., insanity), and (3) social
concerns (e.g., ridicule) (Taylor, 1995). Still, it appears that the measures of AS (i.e.,
ASI-R, ASP) need further factor analytic studies with normative and clinical
populations for a better understanding of AS’s dimensions.
1. 5. Anxiety Sensitivity and Psychological Disorders
1. 5. 1. Anxiety Sensitivity and Anxiety Disorders
Reiss (1991) proposed that AS is a predisposing personality factor in the
development of anxiety disorders. Consistent with this claim, research in adult,
adolescent and child populations has obtained evidence for the notion that AS plays a
significant role in the etiology and maintenance of anxiety disorders (e.g., Stewart,
Knize, & Pihl, 1992; Taylor et al., 1992; Rabian, Peterson, Richters, & Jensen,
1993). Prior to the expectancy theory, many researchers viewed AS a secondary
consequence of panic attacks (i.e., Goldstein & Chambless, 1978). However,
expectancy theory holds that AS is not necessarily a consequence of panic attacks,

22
can precede panic attacks and may be a risk factor for anxiety disorders and panic
attacks (Reiss, 1991).
There is empirical evidence that AS might serve as a vulnerability factor for
the development of panic attacks and anxiety disorders (Maller & Reiss, 1992;
Schmidt et al., 1997). Pollack et al. (1990) found that patients who reported a history
of childhood anxiety disorders had significantly higher scores on the ASI in contrast
to patients without such a history. In a small longitudinal study by Maller and Reiss
(1992), high AS individuals drawn from the nonclinical population were found to
develop anxiety disorders at higher rates (five times more likely) over a 3-year
follow-up interval than low AS controls. AS levels of university students predicted
the number, frequency and intensity of their panic attacks. Furthermore, in another
study, AS was found to predict initial panic attacks in individuals with no prior
history of panic (Ehlers, 1995). Schmidt et al. (1997) examined a large nonclinical
sample of young adults over a 5–week basic military training. They found that high
AS air force cadets were more likely to experience onset of panic attacks during a
stressful period of basic training, compared to low AS cadets. It was further found
that AS predicted the occurrence of unexpected panic attacks, even after controlling
for trait anxiety and history of panic attacks. This finding indicated that AS predicts
vulnerability to have panic attacks even in people who have never before had a panic
attack. Dorward (1990) has reported higher ASI scores among college students with
a history of panic attacks than those without a history of panic attacks.
Telch, Lucas and Nelson (1989b) administered the ASI and a measure of
panic attack to a large sample of college students. Their results revealed that
panickers had higher ASI scores than infrequent panickers and nonpanickers. In

23
another study, Asmundson and Norton (1993) administered the ASI to a sample of
college students. Fifty-seven percent (57%) of high AS subjects reported a history of
panic attacks (cued or unexpected), compared with 30% and 29% in the medium or
low AS groups, respectively. In another study, Donnell and McNally (1990) found
that 32.4% of 68 nonclinical subjects with high AS reported at least one spontaneous
panic attack in the past year and low AS subjects rarely reported unpredictable panic.
Cox and colleagues (1991) in their study included college students who experienced
cued panic attacks as well as spontaneous panic attacks. They found that 50% of
subjects with high AS reported panic attacks (expected or unexpected) in the past
year, compared to 20% and 11% in the medium and low AS groups, respectively.
However, Stewart, Knize, and Pihl (1992) found that the ASI failed to distinguish
significantly between college students with a prior history of self-reported panic
attacks versus students without a prior history of self-reported panic attacks. With
this study, Stewart et al. (1992) posed some difficulties for the claim of the
proponents of the expectancy theory that AS is a risk factor for the development of
panic attacks.
The claim that high AS predicts vulnerability to have panic attacks has also
been investigated in biological or psychological challenge studies. For instance,
individuals with high ASI scores reported more intense panic symptoms following
voluntary hyperventilation when compared with low ASI participants (Asmundson,
Norton, Wilson, & Sandler, 1994). Rapee, Brown, Anthony and Barlow (1992)
reported that in a combined sample of anxiety disorder patients and nonclinical
control subjects the ASI was the best predictor of the degree of panic or fear in
response to hyperventilation and carbon-dioxide (CO2) inhalation. In another study,

24
Messenger and Shean (1998) found that the ASI predicts response to mental (a
mental arithmetic task) and physical (a balloon inflation task) stressors in nonclinical
subjects. Subjects with high AS reported significantly more body sensations, anxious
thoughts and subjective anxiety during the physical stressor task than subjects with
low AS. Panic history and elevated ASI scores were found to be related, and two
thirds of the panic subjects scored one standard deviation above the mean on the ASI.
Additionally, subject with the highest ASI score reported the greatest number of
physical symptoms experienced during a panic attack.
Several studies of clinical samples have shown that patients with panic
disorder have higher ASI scores than healthy individuals and in general than patients
with other anxiety disorders (e.g., Stewart et al., 1992; Taylor et al., 1992). For
instance, Reiss et al. (1986) assessed AS on over 300 patients and over 1000 general
population controls and found that the highest levels of AS tended to occur in people
with panic disorder. Studies also have shown that panic disordered patients have
higher AS levels than patients with obsessive-compulsive disorder (Zeitlin &
McNally, 1993) and mixed samples of other anxiety disorders (Reiss et al., 1986;
Taylor et al., 1991). There are also studies which found that reductions in panic
disorder are accompanied by reductions in scores on the ASI (i.e., Shear et al., 1994).
Telch et al. (1993) found that AS levels decrease with remission of panic
psychopathology through cognitive behavioral therapy. Similarly, McNally and
Lorenz (1987) found that the ASI scores of patients with panic disorder with
agoraphobia decreased following cognitive behavioral treatment.
The claim that AS is more important than trait anxiety in characterizing panic
disorder has been supported in a study by Taylor et al. (1991). They found that panic-

25
disordered patients were differentiated from patients with other anxiety disorders by
the ASI total score, whereas the STAI-T scores were unable to differentiate panic
disorder from other anxiety disorders. Furthermore, they found that the ASI items
related to the fear of bodily sensations (physical concerns) are more characteristics of
panic disorder patients compared with other anxiety disorders. On the other hand,
Lilienfeld et al. (1993) argued that since many of the items on the ASI are relevant to
panic symptoms, ASI’s relation to panic disorder and related criteria may be due to
this shared content rather than the AS construct. Moreover, they claimed that since
there is evidence that individuals become hypersensitive to a wide range of physical
sensations following panic attacks (Turner et al., 1988; cited in Lilienfeld et al.,
1993), such individuals’ high ASI scores might be due to this postpanic
hypersensitivity.
Besides panic attacks, a small number of research demonstrated elevated AS
levels in other anxiety disorders, such as generalized anxiety disorder (e.g., Sandin et
al., 1996), obsessive-compulsive disorder (e.g., Sandin et al., 1996), and social
phobia (Asmundson & Stein, 1994).
In sum, AS may serve as a risk factor for the development and maintenance
of anxiety symptoms and anxiety disorders, especially panic attacks.
1. 5. 2. Anxiety Sensitivity and Depression
Although the relationship between AS and anxiety disorders has been well
documented, relatively little is known about the connection between AS and
depression. A number of studies in adult populations (i.e., Otto, Pollack, Fava,
Uccello, & Rosenbaum, 1995; Taylor, Koch, Woody, & McLean, 1996) have shown

26
that depressed patients have lower AS scores than patients with panic disorder,
comparable scores to patients with other anxiety disorders, but clearly higher scores
than healthy controls. Catanzaro (1993) found that an interaction between the ASI
and a measure of negative mood regulation expectancy was a significant predictor of
BDI scores, in addition to the main effects of each variable.
Otto et al. (1995) examined ASI scores in patients with major depression and
found elevated ASI scores in the depressed patients, even in subjects without a
comorbid anxiety disorder. They also found that ASI scores decreased following
antidepressant treatment (fluoxetine) to levels comparable to control norms.
Moreover, depressed patients with a comorbid anxiety disorder have been found to
have even higher ASI scores. Asmundson, Norton and Veleso (1999) found that
chronic pain patients with high AS reported greater depression than did patients with
medium or low AS.
Furthermore, longitudinal research showed that ASI was predictive of greater
depressive symptoms in nonclinical subjects (Schmidt, Lerew, Jackson, 1997, 1999).
In a study examining children, Weems, Hammond-Laurence, Silverman and
Ferguson (1997) found that there is a positive relationship between AS and
depression in children. The authors concluded that the correlation between AS and
depression remained significant even when levels of manifest (general) anxiety (i.e.,
worry, concentration, and physiological anxiety) partialled out. Muris (2002) again
found a significant correlation between AS and childhood depression, even levels of
trait anxiety were controlled.
Taylor et al. (1996) have proposed that the relationship between AS and
depression is due to one specific dimension of AS, “fear of loss of cognitive control”.

27
Supporting this argument, Taylor and Cox (1998a) found that the lower-order factor
“fear of cognitive dyscontrol” of the ASI-R is highly correlated with depression.
Muris and colleagues (2001) examined the AS construct in a large sample of
normal adolescents and found a significant correlation between AS and depression.
However, when level of trait anxiety was controlled, this correlation clearly
weakened and no longer reached statistical significance.
In reviewing the relationship between AS and depression, it seems that there
is some evidence that proved a link between AS and depression. However, more
research is needed to adequately disclose this relationship.
1. 6. Anxiety Sensitivity and Substance and Alcohol Use
1. 6. 1. Anxiety Sensitivity, Substance Use and Smoking
Although there is a substantial amount of evidence demonstrating the
relationship between AS and alcohol use / abuse, far less is known about the
relationship between AS and use of other substances.
In a study by Telch et al. (1989b) college students with high AS reported
higher levels of use of medication for decreasing stress (including benzodiazepines)
than the students with low AS. Asmundson and Norton (1995) demonstrated that AS
levels have been found to be significantly positively associated with the regular use
of analgesic medications among chronic pain patients. A positive association
between elevated AS and benzodiazepine use was also reported in a study by Bruce
(1996).
McNally (1996) proposed that high levels of AS, other than use and abuse of
alcohol, should also be positively correlated with the use and abuse of anxiolytics

28
(e.g., benzodiazepines) or analgesics (e.g., heroine) and negatively correlated with
the use and abuse anxiogenics or psychostimulants (e.g., cocaine, caffeine). Little
research has addressed McNally’s (1996) hypothesis.
Consistent with McNally’s (1996) position regarding the association of AS
and drug of choice, Norton et al. (1997) found that high AS substance abusers were
more likely to indicate depressant drugs (i.e., benzodiazepines) as their drug of
choice (52%) as compared with low AS substance abusers (32%). Substance abusers
who had low AS levels were more likely to prefer marijuana.
Stewart et al. (1997) examined relations between AS and use of a variety of
drugs among undergraduate students, and they found that users of marijuana or
hashish scored significantly lower on the ASI than non-users. Thus, their finding
supported a negative relation between AS and use of cannabis. Furthermore, they
found that AS levels were positively correlated with the use of nicotine to cope with
negative affect among female students. It was also found that self-reported smokers
did not differ from nonsmokers in terms of overall ASI scores. Regarding the relation
between AS and nicotine, Novak, Burgess, Clark, Zvolensky and Brown (2003)
again found that ASI scores were not significantly related to rates of cigarette use
among young adults. Yet, a number of research indicated that AS is positively
correlated with nicotine use to reduce negative affect (Brown, Kahler, Zvolensky,
Lejuez, & Ramsey, 2001; Novak et al., 2003; Stewart et al., 1997). Since nicotine
does have both stimulant and depressant effects depending on the smoking situation
(Pomerlau, Turk, & Fertig, 1984; cited in Stewart et al., 1999), the relationship
between AS and nicotine seems to be ambiguous and difficult to test. In a study, in
contrast to McNally’s (1996) positions regarding relations between AS and drug of
29
choice, Forsyth, Parker and Finlay (2003) found no relationship between AS and
drug of choice in a sample of substance abusers. McWilliams and Asmundson (2001)
again did not find a significant negative association between AS and arousal-
increasing substances- stimulants (nicotine and caffeine) in a sample of university
students.
In summary, there is empirical evidence, though in a small number,
demonstrating an association between AS and substance use / abuse, particularly use
/ abuse of central nervous system depressants (antianxiety drugs).
1. 6. 2. Anxiety Sensitivity and Alcohol Use
The relationship between AS and heavier alcohol use has been well-
documented in studies including both clinical and nonclinical samples. Early
research demonstrated that people diagnosed with alcohol abuse and dependence
have higher AS than nonclinical people (Peterson & Reiss, 1992). In a study using a
clinical sample, Karp (1993) found that people diagnosed with DSM-III-R alcohol
abuse or dependence (APA, 1987), whether or not with a comorbid anxiety disorder,
are characterized by significantly high levels of AS when compared with nonclinical
ASI norms. McNally (1996) also demonstrated that unusually high levels of AS is
associated with the clinical diagnosis of alcohol dependence.
There is also research indicating an association between AS and alcohol use /
abuse among nonclinical individuals. In such a study, Stewart (1995) examined the
relationship between AS and alcohol use / abuse in nonclinical young adult women.
She found that AS is an important predictor of self-reported rates of alcohol
consumption in university women. Also, relatively high levels of AS have been
30
found among college students who report excessive drinking (Conrod, Stewart, &
Pihl, 1997).
In a study including a nonclinical sample, Stewart, Peterson and Pihl (1995)
examined the relationship between AS levels and self-reported rates of alcohol
consumption and excessive drinking in a sample of nonalcoholic university women.
Their results revealed that high AS women reported consuming significantly more
alcoholic beverages on a weekly basis. Research also suggests that, even at a very
young age, individuals with high AS are at elevated risk for problems with alcohol.
For example, Conrod, Pihl and Vassileva (1998) examined self-reported drinking
problems of nonclinical young males and obtained empirical evidence that those with
high AS reported more drinking-related problems (i.e., social, physical, or
occupational problem) than do those with low AS. In a recent study, Koven, Heller
and Miller (2005) examined associations between AS dimensions and self-reports of
problematic drinking. They found that only one AS dimension, fear of cognitive
dyscontrol, was associated with self-reports of problematic drinking behaviors and
attitudes. They also demonstrated that this association persists even after other
variables’ (e.g., trait anxiety and depression) effects were removed. Koven et al.
(2005) also investigated possible role of depression in this relationship. However,
depression did not contribute significant variance beyond the effects of fear of
cognitive dyscontrol and other anxiety variables in predicting problematic drinking.
Some studies indicated high rates of comorbidity between alcohol abuse /
dependence and the panic-related anxiety disorders (e.g., Cox, Norton, Swinson, &
Endler, 1990). Essentially, panic disorder is an anxiety disorder that is frequently
associated with alcohol abuse (e.g., Maier, Minges, & Lichtermann, 1993). In this

31
aspect, AS was proposed to be a potential factor which underlies the high overlap
between alcoholism and the panic-related disorders (Stewart et al., 1995). Parallel to
this position, Cox, Swinson, Shulman, Kuch and Reichman (1993) found that self-
reported weekly alcohol consumption rates may be significantly and positively
correlated with the ASI scores in panic disorder patients.
One useful explanation for the association between AS and alcohol use /
abuse is based on the tension reduction theory of alcohol use, that is individuals with
high AS drink to relieve anxiety symptoms. McNally (1996) has suggested that
people with high AS might be more likely to use depressants substances (e.g.,
alcohol) to reduce feelings of tension and anxiety, but not substances that increase
arousal (e.g., cocaine). Consistent with McNally’s (1996) hypothesis and tension
reduction theory, Karp (1993) and Stewart et al. (1995) showed that high AS
individuals use and abuse alcohol to decrease unwanted feelings of arousal. Also,
Norton and his colleagues (1997) found that men, but not women, who were seeking
treatment for substance abuse problems, and who have used alcohol as their
substance of choice, have higher ASI scores than do those who preferred other
chemicals such as marijuana. Additionally, laboratory-based studies provided
support for the tension-reduction explanation for alcohol use / abuse and AS
association. Stewart and Pihl (1994) and MacDonald, Baker, Stewart and Skinner
(2000) in lab-based studies showed that high AS individuals reported greater levels
of decrement in stress-response than low AS individuals, following alcohol
administration.
DeHaas, Clamari, Bair and Martin (2001) examined the relationship between
AS and alcohol or drug use in individuals with anxiety and substance use disorders.
32
They found that ASI scores were significantly correlated with substance use (i.e.,
alcohol) in negative situations (situations involving negative emotions) but not in
positive situations (to enhance positive emotions or to increase satisfaction from
interpersonal interactions). They also demonstrated that there were no differences in
the relationship between AS and drinking in negative situations for participants with
a dual diagnosis of substance abuse / dependence and an anxiety disorder and those
with a diagnosis of only substance abuse / dependence. Hence, their finding refuted
the position that the relationship between AS and substance abuse is simply the
relationship between AS and anxiety disorders. They suggested that the relationship
between AS and negative situations substance use is not simply secondary to having
a comorbid anxiety disorder. Indeed empirical research indicates that high AS levels
may be related to alcohol use disorders by means of their association with greater
drinking levels and / or risky reasons for drinking (see Stewart et al., 1999). Other
findings by DeHaas et al. (2001) showed that the relationship between AS and
substance use is not secondary to relations of AS to trait anxiety or depression. They
found that AS contributed additional variance to drinking in negative situations even
after controlling for trait anxiety and depression. Essentially, McNally (1996)
formerly proposed that the relationship between anxiety disorders and substance use
disorders may be related to AS rather than trait anxiety.
Yet, there are also studies which did not find a significant relationship
between AS and drinking behavior. In one of these studies, McWilliams and
Asmundson (1999) examined the relationship between AS and drinking behavior in a
sample of university students. They also investigated the interaction between AS and
trait anxiety on alcohol consumption. They found that neither AS nor trait anxiety

33
accounted for significant variance in any of the drinking measures (average number
of drinking occasions per week, average number of drinks consumed during a
drinking occasion, average number of alcoholic drinks consumed per week and
average frequency of intoxication per month). Merill (2000) again found no
relationship between the ASI scores and self-reported alcohol consumption in a
sample of university students. Novak et al. (2003) showed that in a sample of
nonclinical university students level of alcohol consumption was not related to AS
but directly related to coping-related motives. Indeed Forsyth et al. (2003) concluded
that, in AS literature findings about the relation between high AS scores and
frequency of alcohol consumption to cope with negative affect (e.g., Stewart et al.,
1995) are more robust than those of relation between AS and alcohol consumption.
In sum, research provided substantial amount of evidence on the positive
relationship between AS and alcohol abuse / dependence, and that this relationship is
independent of the trait anxiety and is not secondary to having a comorbid anxiety
disorder. There is also preliminary evidence indicating a positive relationship
between AS levels and both weekly alcohol consumption (Cox et al., 1993; Stewart
et al., 1995) and yearly excessive drinking (Stewart et al., 1995) among nonclinical
individuals. However, since there are also studies which failed to find such a
relationship (Merill, 2000; McWilliams & Asmundson, 1999; Novak et al., 2003),
the relationship between AS and alcohol consumption should be replicated by other
independent researchers.

34
1. 6. 2. 1. Four Factor Motivational Model of Alcohol Use and Drinking Motives
Cox and Klinger (1988) developed a motivational model of alcohol use
suggesting that a person’s decision to drink or not drink is based on whether he or
she expects the positive consequences of drinking to be greater than those associated
with not drinking. This model acknowledges that factors such as a person’s
personality characteristics, biochemical reactivity to alcohol and sociocultural
environment influence a person’s past experiences with alcohol and the expectancies
related to alcohol. According to the model, all these influences affect the individual’s
current motivation regarding alcohol drinking. This motivational model of alcohol
use suggests that the decision to drink is a conscious and goal-directed process in
which individuals choose to drink based on their expectation that drinking will have
desired outcomes. Cox and Klinger (1988) described motivations for alcohol use
along two dimensions: valence and source. The first dimension valence (positive vs.
negative) states that people might consume alcohol because they desire to obtain a
positive outcome (positive reinforcement) or because they want to avoid a negative
outcome (negative reinforcement). The second dimension source (internal vs.
external) points out that people might drink because they wish to obtain an internal
reward (the manipulation of their own affective state), or because they hope to
achieve an external reward like a social approval. Cooper (1994) crossed these two
dimensions, 2x2 (Source x Valence), and proposed a categorical model of drinking
motives, and four categories of drinking motives emerged: (1) internal positive
reinforcement motives (drinking to enhance positive mood or well-being); (2)
external positive reinforcement motives (drinking to obtain positive social rewards);
(3) internal negative reinforcement motives (drinking to reduce or regulate negative

35
emotion); and (4) external negative reinforcement motives (drinking to avoid
rejection).
Consistent with the drinking motives model, findings have shown that people
differ in their reasons for drinking alcohol (Cooper, Russell, Skinner, & Windle,
1992; Stewart, Zeitlin, & Samoluk, 1996). Some drink to reduce or manage
difficulties, some to enhance positive emotional experience, some to avoid rejection,
and some to get social reward. Cooper et al. (1992) first described three drinking
motives referred to as Social, Coping and Enhancement Motives. These three
drinking motives have been found to be associated with different drinking patterns,
drinking situations, and severities of alcohol-related problems. Afterwards, Cooper,
Russell, Frone, and Mudar (1995) constructed four categories of drinking motives
which they referred to as Social, Coping, Enhancement and Conformity Motives.
Social Motives involve the use of alcohol to meet social norms in a given situation
(e.g., drinking because it is customary on special occasions). Social Motives are
found unrelated to heavy drinking, drinking-related problems and worries about
controlling drinking (Cooper et al., 1992; Stewart & Divine, 2000). Coping Motive
involves the use of alcohol to avoid or reduce negative affective states (e.g., drinking
to relax or to forget one’s worries). Coping-related drinking is more likely related to
the tension-reduction and self-medication theories of alcohol use / abuse (Cappell &
Greeley, 1987; cited in DeHaas et al., 2002). Furthermore, drinking primarily for
Coping Motive has been shown to be associated with drinking alone, heavier alcohol
consumption, preoccupation with drinking, worries about controlling drinking and
more severe alcohol-related problems (i.e. abusive drinking) (Cooper et al., 1992).
Enhancement Motive involves the use of alcohol to facilitate positive emotional

36
states and is strongly related drinking in response to urges and temptations (e.g.,
drinking because it is exciting) (Carrigan, Samoluk, & Stewart, 1998). Moreover,
people who drink primarily to enhance positive affect are more likely to drink in
social settings, particularly with same-sex friends (Cooper et al., 1992). High
sensation seekers are likely to drink to enhance levels of stimulation (Cooper et al.,
1995). Conformity Motive is associated with drinking in situations where pressures
to conform may be particularly strong (e.g., peer pressure in parties).
The relationship between drinking motives and alcohol use tendency or
pattern of people has been shown in several studies. Cooper (1994) suggested that
Coping and Conformity Motives (negative reinforcement motives) directly predict
drinking problems even after controlling for usual alcohol consumption. Stewart and
Divine (2000) argued that Enhancement Motives are strongly related to heavy
drinking situations, while Coping Motives have been found to predict the experience
of drinking problems, even after controlling for level of alcohol consumption
(Cooper, Russell, & George, 1988). Additionally, Cooper et al. (1992) found that
only Coping Motives significantly predicted both social and occupational
dysfunction, tolerance and withdrawal symptoms after controlling for usual alcohol
consumption. Carpenter and Hasin (1999) also found an association between coping
related drinking and alcohol use problems. DSM-IV diagnosed alcohol dependent
drinkers demonstrated a greater level of drinking to cope with negative affect than
non-diagnosed drinkers.
Studies indicate that drinking behavior in students was found to be most
commonly associated with Social Motives (e.g., Thombs, Beck and Pleace, 1993b).
These findings suggest that the use of alcohol to socialize or affiliate is much more

37
frequent among young adult university students than the use of alcohol to cope with
negative emotional states. On the other hand, some other research suggests that
coping with stress may be involved in alcohol use and alcohol use problems of at
least some students (Sadava & Pak, 1993).
Brennan, Walfish and Aubuchon (1986a) reviewed eight studies on drinking
motives and alcohol consumption among college students. Results showed that two
types of drinking motives had great importance: drinking for social reasons and
drinking for emotional relief. Carey and Correia (1997) examined the relationship
between drinking motives and alcohol-related problems in undergraduate students.
They found that drinking motives did contribute significantly to the prediction of
drinking problems. Their results revealed no gender differences in drinking motives
and no significant contribution of gender in the prediction of alcohol-related
problems. They found that students who both drink heavily and experience problems
as a result of doing so are more controlled by negative reinforcement than positive
reinforcement motives for drinking. Carrigan et al. (1998) and Cooper et al. (1995) in
their study showed that university students reported drinking more frequently in
negatively reinforcing situations than in positively reinforcing or temptations
situations.
Park and Levenson (2002) examined drinking to cope among a sample of 275
undergraduates in a cross-sectional sample. Their results showed that drinking to
cope is very common among undergraduate students and is related to much higher
levels of both negative and positive alcohol-related consequences. Their results also
suggested that men rely on alcohol to cope more than women do. On the other hand,
some research indicated that drinking to cope might be a more prevalent motive for
38
women than for men (Stewart et al., 2001; Thombs, Beck, & Mahoney, 1993a).
Likewise, O’Haare and Sherrer (1999) found a stronger relationship between stress
and problematic alcohol use in undergraduate women than in undergraduate men.
Kairouz, Gliksman, Demers and Adlaf (2002) assessed reasons for drinking
and situational alcohol use. They surveyed a sample of 8864 students in 18
universities. Their results showed that generally students drink for aesthetic reasons
such as to enjoy the taste or to enhance meal (24.9%), and for social reasons as to
celebrate (21.3%), to be sociable or polite (16.9%) and to a lesser extent to comply
with others (6.0%). Authors of the study noted that social reasons are the main
reasons for drinking for undergraduates, since in 63% of the situations, a social
reason was given as the primary motivation for drinking in that situation.
Compensatory reasons for drinking such as to relax (7.5%), to forget worries (2.1%)
and to feel less shy (2.1%) are less common. They also found that men drink more
than women for social reasons. Although studies (Stewart & Divine, 2000) indicated
that Social Motives are unrelated to heavy drinking, some research (i.e., Carrigan et
al., 1988) suggested that heavy drinking among university students is most likely to
occur in positive social contexts. There are some studies which found gender
differences on drinking motives. Lo (1995) found that men were more susceptible to
peer influence in drinking behavior than were women. However, other studies
reached the opposite conclusion that females are influenced more than males by
drinking styles of peers because of the higher levels of sensitivity to environmental
factors (Berkowitz & Perkins, 1986). Cooper et al. (1995) showed that in cross-
gender comparison Coping Motives were more strongly related to drinking problems
among men than women.

39
There is also research carried out in Turkey on the reasons of drinking of
students, although most of them did not rely on a well-validated measure of drinking
motives. Mangır, Aral and Boran (1992) studied the alcohol use among university
students. Results revealed that 41.67% of female and 46.29% of male students used
alcohol. Almost fifty seven percent of the students stated that they started to drink
because it gives them a pleasant feeling. Furthermore, 30.53% of the students noted
more peer influence on their drinking behavior than their family.
Delikaya (1999) surveyed students in five different schools in the center of
Ankara to determine student attitudes regarding alcohol use. Among alcohol users,
68.4% of the students stated that they drink because it gives pleasure. Others (14.9%)
stated that they use alcohol to forget their problems, and some others (12.1%) noted
they use it out of curiosity. Tot et al. (2002) examined the prevalence of alcohol use
among students of Mersin University. Of the total sample, 43% (females 15%, males
28%) reported alcohol use. Among users, 35% reported that they drink alcohol to
forget their problems, 34% for the pleasant feelings it gives, 30% to pass time, 25%
to fit in with peers, 19% to reduce tension, 17% out of curiosity, and 8.8% to sleep.
In another study, including a clinical sample, Yıldız (1984) examined the effect of
social factors in alcohol use. He examined 50 patients who were under alcohol
treatment at Cerrahpaşa Medical Faculty, Psychiatry Clinic, and found that 50% of
the alcoholic people started to use alcohol by modeling effects, 33% of them with
peer pressure, and 7% of them to forget their worries. Özer, Eradamlar,
Karamustafalıoğlu, Alpkan and Beyazyürek (1990) examined psychosocial
characteristics of inpatients who were under alcohol treatment at AMATEM
(Alcohol and Drug Treatment, Education and Research Center) at Bakırköy Neuro-

40
Psychiatric Hospital. A high rate of patients (44%) stated that they drink to be like
others, to celebrate an occasion (16%), to conform to others (15%) and out of
curiosity (14%).
Topuz’s (2004) study assessed motives that underlie alcohol use among 1585
Turkish university undergraduate students by using a standardized measure of
drinking motives, Drinking Motives Questionnaire- Revised (DMQ-R). She found
that roundly 62% of the students used alcohol. Males drink more than females both
in frequency and in amount. Furthermore, results indicated that for both gender,
Enhancement was the first common motive, which was followed by Social, Coping
and Conformity Motives. Hence, this study showed that university students drink
generally for positive reinforcement reasons (Enhancement and Social Motives) than
negative reinforcement reasons (Coping and Conformity Motives). Enhancement
Motive was moderately related to the amount of drinking while relations with Social
and Coping Motives were lower. She also found that drinking motives changed by
level of academic progress, parental education, participation in social activities and
perceived harm of alcohol. Drinking motives were significantly and positively
related to the amount of alcohol consumed except for Conformity Motive for both
gender. Males reported more alcohol consumption for Social, Coping, and
Conformity Motives.
1. 6. 2. 2. Anxiety Sensitivity and Drinking Motives
Research indicates that there may be important relationships between AS and
certain drinking motives. Indeed, the role of high AS in leading to the development

41
of alcohol use problems has been explained by coping-related drinking motives
(Cooper, 1994).
In literature, one explanation regarding the relationship between AS and
alcohol use was based on the tension reduction theory of alcohol use. McNally
(1996) suggested that people drinking alcohol to reduce tension have not only
frequent anxiety symptoms, but also fear of those symptoms (those with high AS).
From this aspect, it can be argued that people with high AS, may be more likely to
drink for coping reasons than do those with low AS. Consistent with tension
reduction explanation about AS and alcohol use relationship, Stewart (1995) found
that high AS university students are both more likely to report drinking alcohol
primarily to cope with negative affective states, and less likely to report drinking
alcohol primarily for social-affiliative motives, than are low AS university students.
In a study by Stewart et al. (1997), university students were asked to indicate which
of a list of items (all of which relate to Coping Motive) applied to their own
motivations for alcohol use. Results revealed that scores on the Coping Motive
questionnaire were found to be significantly positively correlated with levels of AS,
and this effect was stronger in females than in males.
In another study, Stewart and Zeitlin (1995) examined the relationship
between AS and alcohol use motives in a large sample of nonclinical university
students. They found a significant positive association between ASI scores and
Coping Motives subscale of the Drinking Motives Questionnaire (DMQ),
particularly in the female subjects. However, ASI scores were not significantly
associated with the Enhancement and Social Motives subscales of the DMQ. Results
also showed that ASI and STAI-T scores each contribute to the prediction of

42
frequency of coping-related drinking and the effect was stronger in females than
males. Furthermore, a weighted linear combination of scores on the ASI and STAI-T
significantly predicted scores on the Coping Motive subscale of the DMQ. This
prediction is more likely attributable to differences in AS, as opposed to trait anxiety.
This finding suggested that the combination of high trait anxiety and high AS put
individuals (particularly women) at increased risk for alcohol-related problems. With
regard to primary motives, people with high AS were found to report more drinking
to cope with negative affect than do those with low AS, while people with low AS
report more social-affiliative motives for drinking than do those with high AS.
Results of this study also showed that high AS subjects reported a higher overall
frequency of drinking (independent of the type of drinking motive) than low AS
subjects.
Stewart et al. (1997) found that high AS students were more likely to report
drinking primarily for Coping Motives, and less likely to report drinking primarily
for Social Motives (i.e., to affiliate with others) compared with low AS students. On
the other hand, in a more recent study Forsyth et al. (2003) found no support that
people with high AS use alcohol to relieve unwanted feelings of arousal.
In a study Samoluk and Stewart (1998) examined the typical drinking
situations of high AS individuals in a large sample of university student drinkers. It
has been found that there is a significant positive correlation between AS and
drinking in negative affect situations (i.e., unpleasant emotions, conflict with others,
physical discomfort) but not in positive affect situations (i.e., pleasant times with
others, pleasant emotions). Similar to this study, Lawyer, Karg, Murphy and
McGlynn (2002) examined the relationship between AS and situational antecedents

43
to heavy drinking among college students. The results showed that although AS is
related to negatively reinforced drinking, positively reinforced drinking and
temptation–motivated drinking, it is most strongly associated with only negatively
reinforced drinking. They also found that the relation between AS and negatively
reinforced drinking is stronger among men than among women. Thus, these findings
supported that AS is uniquely associated with drinking in negatively reinforced
situations and hence confirmed the notion that AS-alcohol consumption relationship
is based on the tension reduction theory.
Kushner, Thuras, Abrams, Brekke and Stritar (2001) examined a mediator
model in which anxiety symptoms mediate the association between AS and alcohol
use in alcohol-dependent individuals. They hypothesized that AS promotes anxiety
symptoms, which, in turn, promote alcohol use to cope with anxiety and other
negative affective states. Their results revealed that AS influences coping-related
drinking motives indirectly through its direct effect on anxiety symptoms. They
found that syndrome-related anxiety symptoms and trait anxiety, but not state anxiety
or withdrawal symptoms, mediated the significant association between AS and self-
reported tendency to drink alcohol to control anxiety symptoms.
In another study, Stewart et al. (2001) examined whether drinking motives
mediate the previously established relation between high AS and increased drinking
behavior in college student drinkers. High AS students (especially high AS men)
reported a higher yearly excessive drinking frequency than low AS students. Only
the negative reinforcement motives of Coping and Conformity independently
mediated the relations between AS and increased drinking behavior in the total
sample. Lastly, as they expected, gender differences were found. High AS women’s

44
greater drinking behavior was largely explained by their elevated Coping Motives,
while high AS men’s greater drinking behavior was largely explained by their
elevated Conformity Motives.
Comeau, Stewart and Loba (2001) investigated effects of trait anxiety and AS
on motivations for alcohol use among a sample of adolescents. They found that low
AS predicted Enhancement Motives for alcohol use, whereas high AS predicted
Conformity Motives for alcohol use. They argued that since alcohol has both
negatively reinforcing anxiolytic effects and positively reinforcing stimulant effects,
alcohol use for different motives may be due to different levels of AS. They also
found that high trait anxiety predicted Coping Motives for alcohol use, replicating
Stewart and Zeitlin’s (1995) finding. Furthermore, they found that high AS
moderated the relationship between trait anxiety and Coping Motives for alcohol use,
that is the trait anxiety-Coping Motive relation was stronger for high than for low AS
individuals. Hence, their findings supported the importance of AS in coping-
motivated alcohol use through an interactive relation with trait anxiety. Novak and
colleagues (2003) investigated the relationship among AS, alcohol use, and drinking
motives in a nonclinical university population. They found that AS is directly related
to coping-related drinking motives.
Lab-based alcohol administration studies (i.e., Samoluk, Stewart, Sweet, &
MacDonald, 1999), in which subjects are administered alcohol in experimental
settings, have indicated that high AS people drink for coping related motives rather
than social affiliative motives. Hence, results of these studies were consistent with
results from self-report questionnaire studies.

45
To conclude, research thus far has indicated a positive association between
AS and drinking primarily for coping-related motives in both clinical and nonclinical
samples and a positive correlation between AS and negatively reinforced heavy
drinking. These implications are consistent with the etiological view that alcohol use
is usually motivated by tension reduction. Further, studies supporting a relationship
between AS and drinking motives (particularly coping-related drinking motives)
seem more consistent than those supporting a relationship between AS and elevated
levels of alcohol consumption.
1. 7. Purpose of the Present Study
The importance of AS in the etiology and maintenance of anxiety disorders
has been well-documented (i.e., Zinbarg et al., 1997). In literature, there is a growing
consensus that AS is a hierarchically organized structure consisting of multiple
lower-order factors which load on a single higher order factor. Yet, the number and
nature of lower-order factors is a still controversial issue. The first purpose of the
present study was to determine the factorial structure of the Turkish version of ASI-R
in a sample of university students. For this purpose, the first step in the present study
was to conduct an exploratory factor analysis to determine the number of lower order
factors of the ASI-R. After the exploratory factor analysis, the reliability of the items
and lower order factors were also examined to determine internal consistency of the
scale.
A growing number of research has demonstrated a relationship between AS
and alcohol and substance use / abuse (Stewart et al., 1997; Stewart et al., 1999).

46
Some studies found evidence that AS levels directly associated with frequency /
quantity of alcohol use (e.g., Stewart et al., 1995) whereas some found that AS was
not related to levels of alcohol consumption but only related to drinking motives
(e.g., Novak et al., 2003). In an attempt to understand the overlap between AS and
drinking behavior in both nonclinical and clinical samples, the present study
examined the relationship between AS and drinking motives, as well as the
relationship between AS and alcohol use (i.e. amount of alcohol use).
In university students using alcohol, gender differences were examined in
terms of AS, drinking behavior and drinking motives. In addition, it was examined
whether drinking behavior and drinking motives were different in terms of low,
moderate and high AS levels in student drinkers. Predictors of drinking behavior and
drinking motives were also investigated in university student sample. Relationship
among AS, drinking behavior and drinking motives were explored in alcohol
dependent patient sample.
1. 8. Hypotheses of the study
Based on previous findings, several hypotheses regarding the expected results
of the current study were established.
University Student Sample
1. It was predicted that females would score significantly higher than males on the
ASI-R and its lower order factor scores.

47
2. It was hypothesized that students would show significant differences on drinking
behavior measures in terms of their AS levels. Specifically, students with high AS
would report significantly more alcohol consumption and would score significantly
higher on AUDIT’s subscale scores of hazardous alcohol use and symptoms of
alcohol dependence than those of with moderate and low AS.
3. Consistent with previous research, it was hypothesized that the frequency and
amount of alcohol use, hazardous alcohol use and symptoms of alcohol dependence
will be predicted by the ASI-R lower order factors, particularly by the ASI-R lower-
order factor of “fear of cognitive dyscontrol”.
4. It was hypothesized that the frequency and amount of alcohol use, hazardous
alcohol use and symptoms of alcohol dependence will be predicted by the Coping
Motive and ASI-R lower order factors after controlling age, gender, and depression
level of the students using alcohol.
5. Consistent with previous research, it was predicted that university student drinkers
would report alcohol use mostly for positive reinforcement drinking motives
(Enhancement and Social Motives) than negative reinforcement drinking motives
(Coping and Conformity Motives).
6. It was predicted that students with high AS would report significantly more
negative reinforcement drinking motives (Coping and Conformity Motives) than
those with moderate and low AS.

48
7. It was expected that drinking motives will be predicted by the lower order factors
of the ASI-R, particularly by the “fear of cognitive dyscontrol” lower order factor.
Alcohol Dependent Inpatient Sample
1. It was hypothesized that the frequency and amount of alcohol use, hazardous
alcohol use, symptoms of alcohol dependence and harmful alcohol use will be
significantly and positively correlated with the ASI-R lower order factors.
2. Consistent with previous research, it was predicted that alcohol dependent patients
would report alcohol use mostly for negative reinforcement drinking motives
(Coping and Conformity Motives) than positive reinforcement drinking motives
(Enhancement and Social Motives).
3. It was expected that ASI-R lower order factors will be significantly and positively
correlated with Coping Motives.

49
CHAPTER II
METHOD
2. 1. Participants
2. 1. 1. University Students
Participants were 411 volunteer university students including 225 (54.7%)
females and 186 (45.3%) males. The mean age for the students was 21.46 (SD =
1.93, range = 17-31). Of the students, 28 were preparatory class students (6.8%), 54
first year (13.1%), 83 second year (20.2%), 112 third year (27.3%), 115 fourth year
(28%), 13 master (3.2%) and 6 were doctoral students (1.5%). Of the total sample,
313 (76.3%), of which 177 (56.5%) were female and 136 (43.5%) were male,
reported using alcohol. The mean age of the students who reported using alcohol was
21.46 (SD = 1.98, range = 17-31). The mean age for the female students who
reported using alcohol was 20.87 (SD = 1.74, range = 17-31) and it was 22.22 for the
male students (SD = 2.01, range = 17-31).
2. 1. 2. The Alcohol Dependent Inpatients
A total of 55 alcohol dependent inpatients were included as participants. Of
the participants, 33 were hospitalized in Ankara University Medical School Hospital,
Psychiatry Clinic, Alcohol and Substance Dependence Treatment Unit, and 22 were
hospitalized in Bakırköy State Hospital for Psychiatric and Neurological Diseases,
Alcohol and Drug Treatment, Education and Research Center (AMATEM) in

50
İstanbul. Among the participants, 52 were male (94.5%) and 3 (5.5%) were female.
The mean age of the sample was 42.80 (SD = 11.71, range = 26-75). The mean age
for the female patients was 29 (SD = 2.64, range = 26-31), and it was 43.59 for the
male patients (SD = 11.53, range = 26-75). Among the patients, 8 (14.5%) had
primary school education, 6 (10.09%) secondary school education, 26 (47.3%) high
school education, and 14 (25.5%) university education. All of the patients were under
medication as part of the alcohol dependence treatment program. They were also
receiving psychological treatment as part of this treatment program.
2. 2. Materials
Both university students and alcohol dependent patients were administered a
battery of self-report measures including Anxiety Sensitivity Index-Revised (ASI-R),
State-Trait Anxiety Inventory-Trait Form (STAI-T), Beck Depression Inventory
(BDI), Alcohol Use Disorders Identification Test (AUDIT) and Drinking Motives
Questionnaire-Revised (DMQ-R), and a basic demographic information form asking
about age, gender, class, department and educational level of participants.
2. 2. 1. Anxiety Sensitivity Index-Revised (ASI-R)
ASI-R was developed by Taylor and Cox (1998b). It is based on an expanded
measure of AS, and thought to be a better measure to assess various aspects of AS as
compared to the original 16-item ASI (Reiss et al., 1986). It has 36 items including
10 items from the original 16-item ASI and participants indicate each item on a 5-
point Likert-type scale (0 = very little to 4 = very much). Total score ranges between
0 and 144. ASI-R was originally designed to measure 6 factors (scales) derived from

51
the results of previous factor analytic studies of the ASI (see Taylor, 1996). Taylor
and Cox (1998b) demonstrated that all six scales had good levels of internal
consistency: fear of cardiovascular symptoms (α= 0.88), fear of respiratory
symptoms (α= 0.91), fear of gastrointestinal symptoms (α= 0.80), fear of publicly
observable anxiety reactions (α= 0.86), fear of dissociative and neurological
symptoms (α= 0.83) and fear of cognitive dyscontrol (α= 0.89).
Factor analytic studies usually indicated that ASI-R has a multidimensional
structure with four lower-order factors loading on one higher order factor. Taylor and
Cox (1998b) and Deacon et al. (2003) found that the ASI-R has four lower-order
factors which load on a single higher order factor. Additionally, Taylor and Cox
(1998b) indicated that the ASI-R has demonstrated adequate convergent and
discriminant validity with validated measures of psychiatric symptoms. Deacon et al.
(2003) found that the ASI-R has excellent internal consistency (α= 0.94).
The ASI-R was adapted to Turkish by Durmuş-Sandler (2001). The internal
consistency of the Turkish version of the ASI-R was 0.94. Other than the fear of
gastrointestinal symptoms subscale (GI), which has a moderate reliability (α= 0.66),
all subscales are obtained as highly reliable in the Turkish version of the ASI-R.
Namely, Cronbach’s alpha has been found 0.75 for fear of publicly observable
anxiety reactions subscale (SOC), 0.87 for fear of respiratory symptoms subscale
(RESP), 0.79 for fear of cognitive dyscontrol subscale (COG), 0.78 for fear of
dissociative and neurological symptoms subscale (NEUR), and 0.82 for fear of
cardiovascular symptoms subscale (HRT). For the total ASI-R, test-retest reliability
was 0.75; for SOC 0.70, for GI 0.70, for RESP 0.67, for COG 0.67, for NEUR 0.65
and for HRT 0.65. Durmuş-Sandler (2001) has also demonstrated the criterion

52
validity of the ASI-R by indicating that the ASI-R is well able to discriminate
clinically anxious people from non-anxious (nonclinical) people. Factor structure and
reliability of the Turkish version of ASI-R in the present study were presented in the
results section. A copy of the ASI-R is presented in Appendix A.
2. 2. 2. State-Trait Anxiety Inventory-Trait Form (STAI-T)
STAI-T, developed by Spielberger et al. (1983; cited in Öner & Le Compte,
1985), is a 20-item questionnaire that asks the individual to rate a number of anxiety-
related symptoms with reference to how they feel in general. Items are rated from 1
(almost never) to 4 (almost always) on a 4-point Likert-type scale. Total score in the
scale ranges from 20 to 80. Psychometric evaluation has shown that STAI-T to be a
reliable and valid measure of trait anxiety (Spielberger et al., 1983; cited in Öner &
Le Compte, 1985). The Turkish standardization of the scale was conducted by Öner
and Le Compte (1985). Test-retest reliability of the Turkish form of STAI-T was
found to vary between 0.71 and 0.86. The criterion and construct validity was
demonstrated to be satisfactory (Öner & LeCompte, 1985). In the present study,
STAI-T has been found to possess high internal consistency in university student
sample as measured by Cronbach’s alpha coefficient (α = 0.85). A copy of the STAI-
T is presented in Appendix B.
2. 2. 3. Beck Depression Inventory (BDI)
BDI was first developed by Beck, Ward, Mendelson, Mock and Erbaugh in
1961, afterwards in 1978, Beck, Rush, Shaw and Emery developed its second form
(Savaşır & Şahin, 1997). It was developed to measure the level of depression and
53
consists of 21 sets of 4 statements representing varying levels of depressive
symptoms. Participants choose the statement in each set that is most true for them
during the past week. Each item is scored between 0 and 3, and total score ranges
between 0 and 63. Psychometric evaluation has shown that BDI has high levels of
reliability and validity. Turkish adaptation of BDI was developed by Hisli (1988).
The split-half reliability of the Turkish version BDI has been found 0.74 and test-
retest reliability coefficient was between 0.74 and 0.86. In terms of validity, it has
correlations of 0.55 with STAI-T, 0.74 with Automatic Thoughts Scale and 0.63 with
MMPI-D. In the present study, BDI has been found to possess high internal
consistency in university student sample (α = 0.86). A copy of the BDI is presented
in Appendix C.
2. 2. 4. Alcohol Use Disorders Identification Test (AUDIT, 1989)
AUDIT is a widely used structured 10-item self-report measure of hazardous
and harmful alcohol use. It was first developed in a World Health Organization
(WHO) collaborative project across six countries by Babor, De La Fuente, Saunders
and Grant (1989). Babor, Higgins-Biddle, Saunders and Monteri (2001) have
developed its last version. AUDIT assesses frequency and quantity of alcohol
consumption, including episodes of binge drinking, alcohol-related problems and
dependence symptoms. It was developed to identify persons at risk of developing
alcohol use disorders rather than to identify persons who meet criteria for alcohol
dependence. The 10-items AUDIT uses ICD-10 criteria to detect patients with
symptoms of alcohol dependence (3 items), harmful alcohol consumption (4 items),
and hazardous alcohol consumption (3 items) (Volk, Steinbauer, Cantor, & Holzer,

54
1997). AUDIT is scored by summing the scores of each item. The maximum score is
40 and a cut-off of 8 or 9 is recommended as a sign of hazardous and harmful alcohol
consumption. AUDIT has good internal consistency (α ranging from 0.80 to 0.94)
and test-retest reliability ( r = 0.88 over a 6-week period).
AUDIT was adapted to Turkish by Saatçioğlu, Evren and Çakmak (2002).
Saatçioğlu et al. (2002) demonstrated that Turkish version of AUDIT is a reliable
and valid instrument. The internal consistency coefficient was 0.59 and 0.65 for each
interviewer in the study. For each of the items, the corrected item-total correlation
values in the instrument were higher than 0.30. The two interviewers showed a high
interrater correlation (r = 0.81, p< .001), and kappa values for the items were found
to range between 0.21 and 0.61. Test-retest reliability of the scale was found to be
significantly high (r = 0.90, p<.001). In evaluation of the concurrent validity, they
found a significant correlation between the Turkish form of AUDIT and Michigan
Alcohol Screening Test (MAST) (r = 0.32, p< .05). In the present study, internal
consistency of the AUDIT in the university student sample has been found 0.70. In
the university student sample, internal consistency of the AUDIT’s subscales of
hazardous alcohol use, symptoms of alcohol dependence and harmful alcohol use as
measured by Cronbach’s alpha coefficient has been found 0.71, 0.46, and 0.42,
respectively. Since AUDIT subscale score of harmful alcohol use had a positively
skewed distribution in the university student sample violating normality assumption
required for ANOVA and regression analysis, this subscale score was not taken into
the analyses. In the present study, AUDIT Item 1 was used as a measure assessing
frequency of alcohol use and AUDIT Item 2 was used as a measure assessing amount
of alcohol use. A copy of the AUDIT is presented in Appendix D.
55
2. 2. 5. Drinking Motives Questionnaire-Revised (DMQ-R, 1994)
DMQ-R derived from the motivational model of alcohol use and developed
by Cooper (1994). It is a 20-item self-report measure of the degree to which
individuals use alcohol for four conceptually and empirically distinct reasons:
Coping Motives (e.g., “to forget about your problems”), Conformity Motives (e.g.,
“to fit in with a group you like”), Enhancement Motives (e.g., “because it is fun”),
and Social Motives (e.g., “to celebrate a special occasion with friends”) (Cooper,
1994). Respondents indicate their relative frequency of alcohol use for each of the
indicated reasons on a 5-point Likert-type scale from 1 (never) to 5 (always).
Subscale scores were computed by adding the ratings for each of the 5 items on each
subscale (possible range of 5-25). Thus, high scores on a particular drinking motives
subscale refer to individuals who usually attribute their drinking to that motive,
independent of how often they drink. Alpha reliability coefficients of the
Enhancement, Conformity, Coping, and Social motives were 0.88, 0.85, 0.84 and
0.85, respectively. MacLean and Lecci (2000) have also shown that each of the
subscale of the DMQ-R has adequate internal reliability (range = 0.81- 0.92).
DMQ-R was adapted to Turkish by Topuz (2004). The exploratory factor
analysis indicated 4 factors just like in the original form. Item distribution to factors
was also similar to the original DMQ-R. Alpha reliabilities of the subscales of the
Turkish version of the DMQ-R were as follows: 0.88 for Coping, 0.88 for
Enhancement, 0.86 for Social and 0.79 for Conformity motives.
In the present study, lower-order factor scores of the DMQ-R were calculated
using item subsets taken from the factor analyses reported by Topuz (2004). In the
present study, DMQ-R possessed high internal consistency (α = 0.87) and the lower-
56
order factors have also been found to be highly reliable, with a Coronbach alpha of
0.89 for Coping, 0.84 for Enhancement, 0.84 for Social and 0.78 for Conformity
motive. A copy of the DMQ-R is presented in Appendix E.
2. 3. Procedure
2. 3. 1. University Students
First, the researcher contacted the instructors of four courses from
departments of sociology, philosophy, mechanical engineering, and economics held
at Middle East Technical University (METU, Ankara) and asked for permission to
administer the scale battery in the regular course hour. After the permission of the
instructor, the scales were administered in the regular class hours. Additionally,
students staying at dormitories on the campus of METU and students in the different
canteens of the campus were asked to participate voluntarily in the study. If they
accept to fill out the questionnaires, the researcher administered the battery in the
canteen or at the study room of the dormitory. Students were from various
departments including engineering, educational, social and administrative sciences.
Before filling out the questionnaires, all students were asked to read and sign the
informed consent form. Then, students voluntarily completed the questionnaires
approximately in 20 minutes. Only those who reported alcohol use completed the
DMQ-R. After they filled out the questionnaires, they were debriefed and thanked
for their participation.

57
2. 3. 2. The Alcohol Dependent Inpatients
The volunteer inpatients, who are hospitalized and who are under the
treatment of alcohol dependence were asked to participate in the study. Then, they
were asked to read and sign the informed consent form before starting to fill out the
questionnaires. The questionnaires were filled individually or in the ward of the
psychiatry unit of the hospital as a group. The researcher was available for help if
there is a question regarding filling out of the questionnaires. Participants completed
the questionnaires approximately in 25 minutes. After participants filled out the
questionnaires, they were debriefed and thanked for their participation.
2. 4. Data Analysis
Data analysis and all statistical analyses for this study were carried out by
SPSS for Windows (Statistical Package for Social Sciences for Windows Release
13.0). Demographic information was analyzed through descriptive statistics.
In order to examine the factor structure of the ASI-R, factor analysis was
performed by using Principle Component Analysis and Principal Axis Factoring.
In order to determine consistency between PCA and PAF solutions (Congruency
Analysis) simple correlations between the corresponding factors of the PCA and PAF
solutions were performed. Cronbach’s Alpha coefficients were used for self-report
measures scale reliability analysis. In order to determine convergent and divergent
validity of the ASI-R, simple correlations among the ASI-R, ASI-R factor scales,
STAI-T and BDI were performed.
To examine possible gender differences in terms of ASI-R and its four lower
order factors, separate independent samples t- tests were conducted. A series of one-

58
way analysis of variance (ANOVA) were performed in order to evaluate whether
alcohol use tendency of the students vary as a function of the AS levels. To evaluate
whether the lower-order components of AS predict drinking behavior and drinking
motives of students, a series of hierarchical multiple regression analyses were
conducted. In order to determine whether the lower-order components of AS and
Coping Motives together predict drinking behavior of students a series of
hierarchical multiple regression analyses were also conducted.
In order to determine whether university students using alcohol and alcohol
dependent inpatients are different in terms of drinking motives, two separate one-
way within subjects ANOVA’s were performed using drinking motives scores as
within-subjects variables. To determine whether the mean scores of four drinking
motives were significantly different from each other, follow-up post-hoc tests
(Tukey’s HSD Test) were conducted. In order to investigate whether drinking
motives varied as a function of AS group, separate one-way between-subjects
ANOVA were conducted. To determine which AS groups are significantly different
from each other on each drinking motive, follow-up post-hoc tests (LSD Test) were
conducted.
Finally, to examine the relationship between AS, alcohol use and drinking
motives among alcohol dependent inpatients, simple correlation analyses were
performed.

59
CHAPTER III
RESULTS
3. 1. Factor Structure, Validity and Reliability of the ASI-R
To determine factor structure and reliability of the lower order factors of the
ASI-R, factor analysis and reliability analysis were conducted using student sample.
First, data were examined for missing values, and univariate and multivariate outliers
and 18 cases were deleted. The further analyses were conducted by 393 cases.
3. 1. 1. Factor Structure of the ASI-R
As a preliminary step, the Keiser-Meyer-Olkin (KMO) index of sampling
adequacy was calculated. This is a measure of the factorability of the correlation
matrices on which the factor analyses were based. The index ranges from 0
(inadequate) to 1 (excellent) (Tabachnick & Fidell, 2001). In the present study, the
KMO value was 0.91, which indicates that the sample was suitable for factor
analysis. The initial principal component analysis (PCA) extracted eight factors with
eigenvalues greater than 1. The eigenvalues of these eight factors were as follows:
11.452, 2.403, 1.771, 1.521, 1.473, 1.275, 1.186, and 1.079. This initial solution
accounted for 61.55% of the total variance. In order to determine the correct number
of factors to retain, parallel analysis was conducted with an oblique rotation. Parallel
analysis using the mean eigenvalues indicated a four-factor solution. Then, a PCA
with an oblique rotation was conducted for the four factor solution. The results of
PCA with the oblique rotation are presented in Table 1, indicating the factor loadings

60
of pattern matrix, communalities, the eigenvalues of the factors and the percentage of
explained variance for the four factors. The four factor solution accounted for
47.63% of the total variance. The first factor accounted for 31.81%, the second
6.67%, the third 4.91% and the fourth factor accounted 4.22% of the variance. As
can be seen in Table 1, since there are small number of items which have salient
loadings ( ≥ 0.30) on more than one factor (complex items) and only one item failing
to have a salient loading on any factor (hyperplane items) (item no: 28), it can be
concluded that the solution have a roughly simple structure. According to the pattern
of salient loadings in Table1, the four factors were labeled as follows: fear of
respiratory symptoms (Factor 1), fear of cardiovascular symptoms (Factor 2), fear of
cognitive dyscontrol (Factor 3), fear of publicly observable anxiety symptoms
(Factor 4). Each of the four lower-order factors had a substantial number of items
with salient factor loadings. The first factor included 10 (item no’s; 3, 4, 5, 8, 13, 15,
16, 17, 18, and 27), second factor 10 (item no’s; 6, 7, 9, 11, 14, 19, 25, 26, 29, and
33), third factor 7 (item no’s; 2, 10, 23, 31, 32, 34, and 36) and the fourth factor 8
(item no’s; 1, 12, 20, 21, 22, 24, 30, and 35) items.

Table 1. Factor Loadings and Communalities (h²) for the Four Factor Solution of the PCA and PAF after Oblique Rotation
ASIR items Factor I Factor II Factor III Factor IV h²
Smothering sensations scare me 0.92 (0.90) 0.18 -(0.20) 0.02 (0.00) -0.06 -(0.02) 0.34 (0.23)
It scares me when I become short of breath 0.91
(0.87) -0.08 -(0.05) -0.12 -(0.14) -0.03 -(0.01) 0.27 (0.17)
When my chest feels tight. I get scared that I won’t be able to breathe properly 0.81 (0.82) -0.06 -(0.11) 0.09 (0.10) -0.08 -(0.05) 0.35 (0.29)
When my breathing becomes irregular. I fear that something bad will happen 0.81 (0.83) -0.05 -(0.09) 0.05 (0.03) 0.02 (0.05) 0.48 (0.40)
When I feel like I’m not getting enough air I get scared that I might suffocate 0.69 (0.68) -0.05 -(0.10) 0.12 (0.11) -0.03 (0.01) 0.49 (0.46)
When I notice my heart skipping a beat. I worry that there is something seriously
wrong with me 0.61 (0.55) 0.26 (0.27) -0.08 -(0.06) 0.04 -(0.04) 0.45 (0.38)
It scares me when I feel faint 0.59 (0.45) 0.06 (0.18) -0.22 -(0.21) 0.28 (0.25) 0.43 (0.38)
It scares me when my heart beats rapidly 0.53 (0.42) 0.22 (0.31) -0.10 -(0.11) 0.13 (0.11) 0.64 (0.59)
It scares me when I feel “shaky” trembling 0.46 (0.33) -0.13 (0.01) 0.11 (0.05) 0.26 (0.25) 0.49 (0.42)
It frightens me when my surroundings seem strange or unreal 0.39 (0.32) -0.08 -(0.03) 0.23 (0.20) 0.19 (0.19) 0.38 (0.26)
When I feel a strong pain in my stomach. I worry it could be cancer -0.34 -(0.30) 0.88
(0.77) 0.07 (0.11) 0.08 (0.03) 0.38 (0.33)
When my stomach is upset. I worry that I might be seriously ill -0.05 -(0.07) 0.73 (0.72) -0.07 -(0.05) 0.07 (0.01) 0.51 (0.47)
It scares me when I am nauseous 0.09 (0.06) 0.63 (0.60) -0.15 -(0.11) 0.11 (0.05) 0.51 (0.47)
When my head is pounding I worry I could have a stroke -0.01 (0.00) 0.52 (0.47) 0.17 (0.15) 0.01 (0.01) 0.32 (0.26)
When I get diarrhea. I worry that I might have something wrong with me 0.02 (0.05) 0.51 (0.41) 0.01 (0.05) 0.09 (0.06) 0.64 (0.61)
When my heart is beating rapidly. I worry that I might have a heart attack 0.35 (0.30) 0.44 (0.43) 0.01 (0.04) -0.19 -(0.19) 0.66 (0.65)
When I feel pain in my chest. I worry that I’m going to have a heart attack 0.42 (0.39) 0.42
(0.40) 0.10 (0.14) -0.23 -(0.23) 0.36 (0.32)
When my face feels numb. I worry that I might be having a stroke 0.17 (0.16) 0.39 (0.35) 0.25 (0.25) -0.02 -(0.02) 0.64 (0.59)
When I have trouble swallowing, I worry that I could choke 0.22 (0.25) 0.35 (0.24) 0.29 (0.29) -0.14 -(0.11) 0.56 (0.51)
When I feel dizzy, I worry there is something wrong with my brain 0.31 (0.26) 0.32 (0.32) 0.07 (0.08) 0.09 (0.08) 0.36 (0.21)
61
61

Table 1 (continue).
ASIR items Factor I Factor II Factor III Factor IV h²
It scares me when I feel tingling or prickling sensations in my hands 0.25 (0.22) 0.27 (0.24) 0.14 (0.14) 0.03 (0.03) 0.49 (0.45)
When my thoughts seem to speed up, I worry that I might be going crazy -0.05 -(0.04) 0.04 -(0.04) 0.79 (0.77) 0.00 (0.03) 0.56 (0.52)
When I have trouble thinking clearly, I worry there is something wrong with me -0.10 -(0.11) 0.08 (0.04) 0.76 (0.73) 0.07 (0.10) 0.49 (0.43)
When I feel “spacey” or spaced out I worry that I may be mentally ill 0.06 (0.07) 0.10 (0.05) 0.65 (0.61) -0.09 -(0.05) 0.44 (0.38)
When my mind goes blank I worry there is something terribly wrong with me 0.00 (0.03) 0.07 (0.02) 0.63 (0.56) 0.03 (0.06) 0.6 (0.45)
When I cannot keep my mind on a task, I worry that I might be going crazy 0.04 -(0.02) -0.13 (0.03) 0.46 (0.29) 0.17 (0.18) 0.434 (0.39)
It scares me when I am unable to keep my mind on a task 0.10 (0.05) -0.22 -(0.09) 0.46 (0.31) 0.32 (0.31) 0.55 (0.51)
When my throat feels tight, I worry that I could choke to death 0.11 (0.17) 0.34 (0.20) 0.41 (0.40) -0.12 -(0.09) 0.32 (0.30)
When I begin to sweat in a social situation, I fear people will think negatively of me -0.08 -(0.06) 0.03 -(0.02) 0.18 (0.12) 0.69 (0.70) 0.43 (0.40)
I worry that other people will notice my anxiety
0.04 (0.05) -0.07 -(0.10) 0.19 (0.11) 0.67 (0.68) 0.57 (0.53)
I think it would be horrible for me to faint in public -0.06 -(0.06) 0.26 (0.23) -0.15 -(0.11) 0.59 (0.48) 0.62 (0.55)
It is important for me not to appear nervous -0.01 -(0.01) -0.24 -(0.19) 0.14 (0.07) 0.59 (0.52) 0.45 (0.39)
When I tremble in the presence of others I fear what people might think of me 0.04 (0.06) 0.12 (0.07) 0.11 (0.08) 0.58 (0.57) 0.45 (0.42)
I believe it would be awful to vomit in public 0.08 (0.04) 0.16 (0.17) -0.31 -(0.22) 0.56 (0.43) 0.6 (0.55)
It scares me when I blush in front of people -0.14 -(0.08) 0.15 (0.07) 0.23 (0.18) 0.53 (0.51) 0.41 (0.30)
It scares me when my body feels strange or different in some way 0.28 (0.19) 0.27 (0.33) -0.11 -(0.11) 0.39 (0.35) 0.46 (0.38)
Eigenvalues 11.45 (11.45) (1.77)2.41 (2.41) 1.77 1.52 (1.52)
% of explained variance 31.81 (30.26) 6.68 (5.16) 4.91 (3.35) 4.22 (2.66)
Note. Salient loadings ≥ .30. Loadings and h² values in parantheses represent the results of PAF solution. Bold numbers represent the highest salient loadings and
underlined numbers specify the second highest loadings.
Factor labels: Factor I, fear of respiratory symptoms; Factor II, fear of cardiovascular symptoms; Factor III, fear of cognitive dyscontrol; Factor IV, fear of publicly
observable anxiety symptoms.
62
62

63
Principal axis factor (PAF) analysis was also conducted for the four-factor
solutions with oblique rotation. According to the PAF solution, the items loaded on
the factors were almost the same as in the PCA and factor loadings changed slightly.
Only item 10 loaded on to different factors across PCA and PAF. It loaded on to
Factor 3 in PCA, whereas on to Factor 4 in PAF. Additionally, as different from
PCA, items 2 and 26 failed to have a salient loading on any factor in PAF. In order to
determine consistency between PCA and PAF solutions, congruency analysis was
conducted. Congruency coefficient represents the correlations between the
corresponding factors of the PCA and PAF solutions. Congruency coefficients for
the corresponding factor scores of the Factor I, Factor II, Factor III, and Factor IV
according to the PCA and PAF analysis were 0.99, 0.97, 0.98, and 0.98, respectively.
PAF results are displayed in Table 1.
In order to identify whether the lower order factors of the ASI-R were loaded
on a higher order factor, a second order factor analysis was conducted using PCA
with oblique rotation. The factor scores were calculated for each factor by adding
items in a factor. PCA results yielded only one factor with an eigenvalue greater than
1. The higher order factor accounted for 68.16% of the total variance. The factor
loadings of these four lower order factors were 0.86, 0.86, 0.80, and 0.76.
3. 1. 2. Convergent and Divergent Validity of the ASI-R
The correlations among the ASI-R, ASI-R factor scales, STAI-T and BDI are
shown in Table 2. In order to evaluate the convergent and divergent validity of the
ASI-R, simple correlational analyses among ASI-R, ASI-R factor scales, STAI-T,
and BDI were conducted in university student sample. The four lower-order factors

64
were moderately and significantly (p < 0.01) intercorrelated, with rs ranging from
0.50 to 0.73. The two somatic ASI-R factors (fear of respiratory and fear of
cardiovascular symptoms) were highly correlated (r = 0.73), while other correlations
between ASI-R factors were moderate. Additionally, the ASI-R lower-order factors
had significant and large correlations with the total ASI-R (range = 0.76 - 0.89).
These results were indicators of convergent validity of the ASI-R.
Table 2. Pearson Correlation Coefficients among ASI-R, ASI-R factors, STAI-T and BDI in University Students Measures
1
2
3
4
5
6
7
1. ASI-R - 2. Fear of respiratory symptoms
0.89* -
3. Fear of cardiovascular symptoms
0.87* 0.73* -
4. Fear of cognitive dyscontrol
0.76* 0.56* 0.59* -
5. Fear of publicly observable anxiety symptoms
0.76* 0.52* 0.52* 0.50* -
6. STAI-T 0.44* 0.35* 0.33* 0.44* 0.33* - 7. BDI 0.32* 0.26* 0.24* 0.40* 0.26* 0.61* - * p < .01

65
The ASI-R has moderately correlated with the STAI-T (r = 0.44, p < 0.01)
and the BDI (r = 0.32, p < 0.01) in university student sample. In the alcohol
dependent inpatient sample, the ASI-R had also moderate correlations with the
STAI-T ( r = 0.62, p < 0.01) and the BDI ( r = 0.44, p < 0.01). Furthermore, the ASI-
R factor scales, too, had modest but significant correlations with the STAI-T (rs 0.33
– 0.44; for the alcohol dependent sample rs 0.50 – 0.59), which pointed out that the
AS and trait anxiety are correlated but different constructs. These results indicated
that the ASI-R has divergent validity as measuring the AS construct.
3. 1. 3. Reliability of the ASI-R
The ASI-R demonstrated an excellent internal consistency (α = 0.93).
According to Aiken’s (1994) consideration of the criterion of 0.20 as an acceptable
corrected item-total correlation, all ASI-R items performed adequately. Item-total
correlations ranged from 0.25 to 0.68. Each subscale of the ASI-R also showed
adequate internal consistency (α s for Factors I-IV = 0.88, 0.82, 0.79, and 0.80,
respectively).
3. 2. Relationship among Alcohol Use, Anxiety Sensitivity and Drinking Motives
in University Students Using Alcohol
Among the total of 411 university students, 313 (76.1%) [177 (56.5%)
females, 136 (43.5%) males) reported using alcohol. After data were examined for
missing values, univariate and multivariate outliers, 15 cases were deleted. The
further analyses to examine the relationship among alcohol use, AS and drinking
motives were conducted by 298 cases.
66
3. 2. 1. Descriptive Statistics of Self Reported Measures by Gender
Table 3 displays descriptive statistics of self-reported measures by gender. A
series of independent sample t- tests were conducted to compare female and male
students in terms of self-reported measures. Mean ASI-R total score for female
university students (M = 41.38, SD = 21.98) was higher than that of male university
students (M = 40.72, SD = 18.86); however, this difference was not significant, t
(296) = 0.28, p > 0.05. Male and female students did not differ significantly from
each other in terms of ASI-R lower order factors. Frequency [ t (296) = -2.13, p <
0.05] and amount of alcohol [ t (213.06) = -4.16, p < 0.001] use in male students
were significantly higher than female students. Male students scored significantly
higher on AUDIT’s subscale score of hazardous alcohol use than female students, t
(296) = 4.29, p <0.01. In addition, it has been found that males were using alcohol
for more Coping [ t (296) = -2.03, p < 0.05] and Conformity [ t (296) = -2.34, p <
0.05] Motives than females (see Table 3).

Table 3.
Descriptive Statistics of Self-reported Measures by Gender in University Students
_______________________________________________________________________
Measures Female Male Total t
(N=169) (N=129) (N = 298)
M SD M SD M SD
ASI-R 41.38 21.98 40.72 18.86 41.10 20.66 0.28
Fear of respiratory symptoms Fear of cardiovascular symptoms Fear of cognitive dyscontrol Fear of publicly observable anxiety symptoms
1.52
0.83
0.83
1.38
0.84
0.64
0.70
0.73
1.39
0.82
0.82
1.51
0.74
0.59
0.61
0.65
1.47
0.83
0.82
1.43
0.80
0.62
0.66
0.70
1.38
0.08
0.18
-1.64
DMQ-R
Coping Motive 10.44 4.72 11.61 5.21 10.95 4.97 -2.03*
Social Motive 4.36 4.39 15.03 4.06 14.65 4.26 -1.35
Enhancement Motive 6.23 4.72 16.05 4.16 16.15 4.48 0.33
Conformity Motive 6.55 2.50 7.30 2.93 6.88 2.71 -2.34*
Frequency of alcohol use 1.63 0.64 1.81 0.81 1.70 0.72 -2.13*
Amount of alcohol use 0.37 0.55 0.72 0.82 0.52 0.70 -4.16**
Hazardous alcohol use 2.41 1.53 3.29 1.93 2.79 1.76 4.29**
Symptoms of alcohol
dependence
0.68 0.89 0.71 1.11 0.69 0.99 -0.22
* p < .05; ** p < .01
67
68
3. 2. 2. Anxiety Sensitivity and Alcohol Use
Participants who reported to use alcohol were divided into low, moderate, and
high AS groups based on a comparison of their ASI-R scores with the sample mean.
This arrangement was used to evaluate whether drinking behavior tendency of the
university students vary as a function of the levels of the AS. The low AS group
comprised 52 (17.4%) participants whose scores were approximately one standard
deviation below the mean. The high AS group consisted of 52 (17.4%) participants
whose scores were approximately one standard deviation above the mean. A group of
about equivalent sample size was created for the moderate group, whose scores
approximated the sample ASI-R mean. The moderate AS group consisted of 64
participants (21.5%) whose scores fell between 36 and 45.
A series of one-way analysis of variance (ANOVA) were conducted in order
to evaluate whether the self-reported alcohol use tendency of the students vary as a
function of the AS group (low, moderate, high). Scores on different drinking
behavior measures (frequency of alcohol use, amount of alcohol use, and AUDIT
subscale scores of hazardous alcohol use and symptoms of alcohol dependence) were
submitted to separate one-way analyses of variance (ANOVA). A significant AS
group effect was not observed for frequency of alcohol use, amount of alcohol use,
and AUDIT’s subscales of hazardous alcohol use and symptoms of alcohol
dependence. Means and standard deviations of drinking behavior scores as a function
of AS levels are displayed in Table 4.
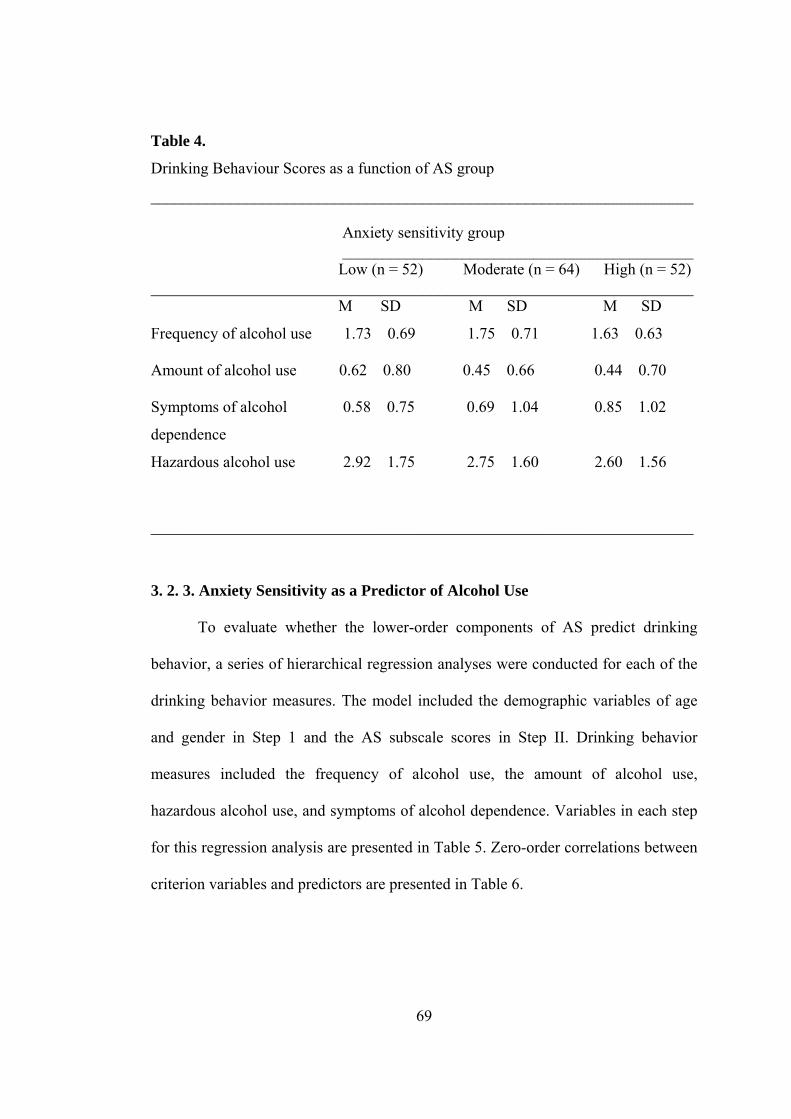
69
Table 4.
Drinking Behaviour Scores as a function of AS group
____________________________________________________________________ Anxiety sensitivity group ____________________________________________ Low (n = 52) Moderate (n = 64) High (n = 52) ____________________________________________________________________ M SD M SD M SD
Frequency of alcohol use 1.73 0.69 1.75 0.71 1.63 0.63
Amount of alcohol use 0.62 0.80 0.45 0.66 0.44 0.70
Symptoms of alcohol 0.58 0.75 0.69 1.04 0.85 1.02
dependence
Hazardous alcohol use 2.92 1.75 2.75 1.60 2.60 1.56
____________________________________________________________________
3. 2. 3. Anxiety Sensitivity as a Predictor of Alcohol Use
To evaluate whether the lower-order components of AS predict drinking
behavior, a series of hierarchical regression analyses were conducted for each of the
drinking behavior measures. The model included the demographic variables of age
and gender in Step 1 and the AS subscale scores in Step II. Drinking behavior
measures included the frequency of alcohol use, the amount of alcohol use,
hazardous alcohol use, and symptoms of alcohol dependence. Variables in each step
for this regression analysis are presented in Table 5. Zero-order correlations between
criterion variables and predictors are presented in Table 6.
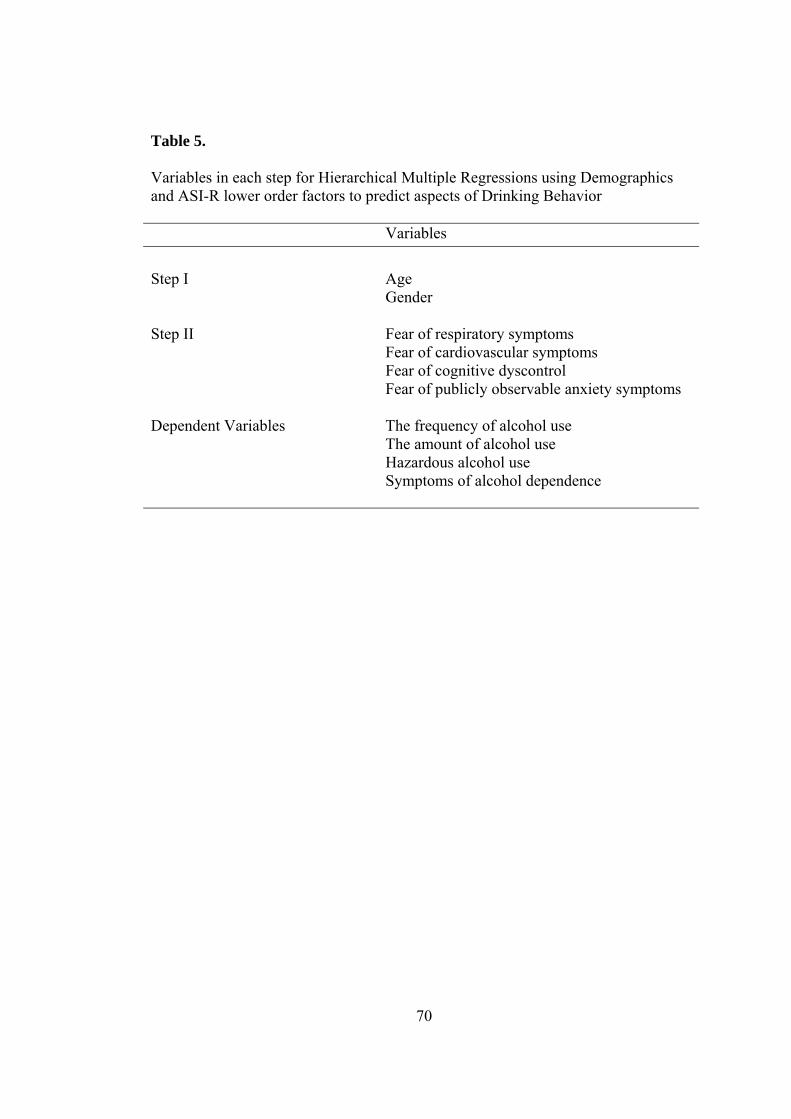
70
Table 5. Variables in each step for Hierarchical Multiple Regressions using Demographics and ASI-R lower order factors to predict aspects of Drinking Behavior Variables Step I Age Gender Step II Fear of respiratory symptoms Fear of cardiovascular symptoms Fear of cognitive dyscontrol Fear of publicly observable anxiety symptoms Dependent Variables The frequency of alcohol use The amount of alcohol use Hazardous alcohol use Symptoms of alcohol dependence

Table 6. Zero-order Correlations among Predictor (demographics and ASI-R lower order factors) and Criterion (drinking behavior measures) Variables
Variables 1 2 3 4 5 6 7 8 9 10
1.Gender - 0.34** -0.08 -0.01 -0.01 0.10 0.12* 0.25** 0.25** 0.01
2. Age - -0.01 -0.01 -0.10 0.02 -0.05 0.03 0.04 -0.04
3. Fear of respiratory symptoms - 0.70** 0.56** 0.54** -0.04 -0.11 -0.07 0.08
4. Fear of cardiovascular symptoms - 0.57** 0.46** 0.01 -0.10 -0.07 0.10
5. Fear of cognitive dyscontrol - 0.47** 0.06 0.02 0.06 0.12*
6. Fear of publicly observable anxiety symptoms
- -0.06 0.03 0.01 0.01
7. Frequency of alcohol use - 0.25** 0.73** 0.40**
8. Amount of alcohol use - 0.76** 0.23**
9. Hazardous alcohol use - 0.42**
10. Symptoms of alcohol dependence
-
* p < .05; ** p < .01
71
71

The results of hierarchical multiple regression analyses for each drinking
behavior measure are presented in Table 7, including multiple R (R), R square (R2),
adjusted R2 (∆R2), the standardized regression coefficients-Beta (β), semipartial
correlations (sp²) and t values for each drinking behavior measure of the last step of
the analysis.
In the first step, frequency of alcohol use was significantly predicted by age
and gender, F (2, 295) = 3.70, p < 0.05. Addition of the subscale scores of ASI-R to
the equation after step two did not result in a significant F change. After step two,
only gender (β = 0.16, p < 0.05) had significant contribution to the variance in the
frequency of alcohol use.
Amount of alcohol use was significantly predicted by age and gender in Step
1 of the analysis, F (2, 295) = 9.99, p < 0.001. Addition of the subscale scores of
ASI-R to the equation after step two did not result in a significant F change. After
step two, with all the IV’s in the equation, overall F was significant [ F (6, 291) =
4.60, p < 0.01] and only gender (β = 0.25, p < 0.001) predicted a significant variance
on the amount of alcohol use.
Hazardous alcohol use was significantly predicted by age and gender, F (2,
295) = 10.13, p < 0.001. However, addition of the subscale scores of ASI-R to the
equation after step two did not result in a significant F change. After step two, age,
gender and subscales of the ASI-R together significantly predicted hazardous alcohol
use, F (6, 291) = 4.34, p < 0.001. Gender (β = 0.26, p < 0.001) and the ASI-R
subscale score of fear of cognitive dyscontrol (β = 0.15, p < 0.05) predicted a
significant variance on hazardous alcohol use.
72

73
Symptoms of alcohol dependence was not significantly predicted by both
demographic variables (age, gender) and ASI-R lower order factors in each step of
the analysis.

74
Table 7. Summary of Hierarchical Multiple Regressions using demographics and
ASI-R lower order factors to predict aspects of Drinking Behavior
R R² ∆R² β sp² T
Frequency of alcohol use Age -0.09 -0.09 -1.49
Gender 0.16 0.15 2.59* Fear of respiratory symptoms
-0.06 -0.04 -0.64
Fear of cardiovascular symptoms
0.04 0.01 0.43
Fear of cognitive dyscontrol
0.12 0.02 1.58
Fear of publicly observable anxiety symptoms
-0.11 -0.09 -1.60
Step 1 0.16 0.02 0.02
Step 2 0.20 0.04 0.02
Overall F and df for model 2.06† (6, 291)
Amount of alcohol use
Age -0.04 -0.04 -0.71
Gender 0.25 0.23 4.06** Fear of respiratory symptoms
-0.09 -0.06 -1.09
Fear of cardiovascular symptoms
-0.13 -0.09 -1.56
Fear of cognitive dyscontrol
0.11 0.08 1.46
Fear of publicly observable anxiety symptoms
0.07 0.06 1.02
Step 1 0.25 0.06 0.06
Step 2 0.29 0.09 0.07
Overall F and df for model 4.60** (6, 291)
† p < .10; * p < .05; ** p < .01

75
Table 7 (continue). R R² ∆R² β sp² t
Hazardous alcohol use
Age -0.05 -0.03 -0.82
Gender 0.27 0.24 4.44**
Fear of respiratory symptoms
-0.04 -0.03 -0.46
Fear of cardiovascular symptoms
-0.12 -0.08 -1.43
Fear of cognitive dyscontrol
0.15 0.12 2.04*
Fear of publicly observable anxiety symptoms
-0.01 -0.01 -0.13
Step 1 0.25 0.06 0.06
Step 2 0.29 0.08 0.06
Overall F and df for model 4.34** (6, 291)
Symptoms of alcohol dependence
Age -0.05 -0.04 -0.73 Gender 0.04 0.04 0.62 Fear of respiratory symptoms
0.03 0.02 0.37
Fear of cardiovascular symptoms
0.06 0.04 0.69
Fear of cognitive dyscontrol
0.10 0.07 1.27
Fear of publicly observable anxiety symptoms
-0.08 -0.06 -1.10
Step 1 0.05 0.003 -0.004 Step 2 0.15 0.02 0.001 Overall F and df for model 1.04 (6, 291)
† p < .10; * p < .05; ** p < .01. Note. β, sp² and t values are representing the values of the last step of the regression analysis.

76
3. 2. 4. Anxiety Sensitivity and Coping Motives as a Predictors of Alcohol Use
To evaluate whether Coping Motive predicts drinking behavior via the effects
of the lower-order components of AS, a series of hierarchical regression analyses
were conducted for each of the drinking behavior measures. The model included the
demographic variables of age and gender, and BDI total score in Step 1, the AS
subscale scores in Step II and Coping Motive score in Step 3. Drinking behavior
measures included the frequency of alcohol use, the amount of alcohol use,
hazardous alcohol use, and symptoms of alcohol dependence. Variables in each step
for this regression analysis are presented in Table 8. Zero-order correlations between
criterion variables and predictors are presented in Table 9.
Table 8.
Variables in each step for Hierarchical Multiple Regressions using Demographics,
BDI, ASI-R lower order factors and Coping Motives to predict aspects of Drinking
Behavior
Variables Step I Age Gender BDI Step II Fear of respiratory symptoms Fear of cardiovascular symptoms Fear of cognitive dyscontrol Fear of publicly observable anxiety symptoms Step III Coping Motives Dependent Variables The frequency of alcohol use The amount of alcohol use Hazardous alcohol use Symptoms of alcohol dependence

Table 9. Zero-order Correlations among Predictor (demographics, BDI, ASI-R lower order factors, and Coping Motives) and Criterion (drinking behavior measures) Variables
Variables 1 2 3 4 5 6 7 8 9 10 11 12 1. Age - 0.34** -0.04 -0.01 -0.01 -0.10 0.02 0.03 -0.05 0.03 0.04 -0.04 2. Gender - 0.01 -0.08 -0.01 -0.01 0.10 0.12* 0.12* 0.25** 0.25** 0.01
3. BDI - 0.29** 0.23** 0.40** 0.26** 0.39** 0.11 -0.02 0.12* 0.26*
4. Fear of respiratory symptoms - 0.70** 0.56** 0.54** 0.09 -0.04 -0.11 -0.07 0.08
5. Fear of cardiovascular symptoms - 0.57** 0.46** 0.12* 0.01 -0.10 -0.07 0.10
6. Fear of cognitive dyscontrol - 0.47** 0.19** 0.06 0.02 0.06 0.12*
7. Fear of publicly observable anxiety symptoms - 0.17** -0.06 0.03 0.01 0.01
8. Coping Motives - 0.25** 0.21** 0.28** 0.32**
9. Frequency of alcohol use - 0.25** 0.73** 0.40**
10. Amount of alcohol use - 0.76** 0.23**
11. Hazardous alcohol use - 0.42** 12. Symptoms of alcohol dependence -
77
* p < .05; ** p < .01
77

The results of hierarchical multiple regression analyses for each drinking
behavior measure are presented in Table 10, including multiple R (R), R square (R2),
adjusted R2 (∆R2), the standardized regression coefficients-Beta (β), semipartial
correlations (sp²) and t values for each drinking behavior measure of the last step of
the analysis.
In the first step, frequency of alcohol use was significantly predicted by age,
gender and BDI, F (3, 294) = 3.66, p < 0.05. Addition of the subscale scores of ASI-
R to the equation after step two did not result in a significant F change. After Step 2,
age, gender, BDI and lower order factors of the ASI-R together significantly
predicted frequency of alcohol use, F (7, 290) = 2. 28, p < 0.05. Addition of the
Coping Motives to the equation after step three did result in a significant F change.
Age, gender, BDI, lower order factors of the ASI-R and Coping Motives together
explained 9.6% of the variance in frequency of alcohol use, F (8, 289) = 3.83, p <
0.001. Examination of the individual variables after step three with all the IV’s in the
equation revealed that gender (β = 0.14, p < 0.05), ASI-R subscale of fear of publicly
observable anxiety symptoms (β = -0.14, p < 0.05) and Coping Motives ((β = 0.23, p
< 0.001) had a significant contribution to the prediction of frequency of alcohol use.
Amount of alcohol use was significantly predicted by age, gender and BDI in
Step 1 of the analysis, F (3, 294) = 6.72, p < 0.001. Addition of the lower order
factors of the ASI-R to the equation after step two did not result in a significant F
change. After Step 2, age, gender, BDI and lower order factors of the ASI-R together
significantly predicted amount of alcohol use, F (7, 290) = 3.98, p < 0.001. Addition
of the Coping Motive to the equation after step three did result in a significant F
change. After step three, with all the IV’s in the equation, overall F was significant [
78

79
F (8, 289) = 5.25, p < 0.01], and gender (β = 0.23, p < 0.001) and Coping Motives (β
= 0.22, p < 0.001) had a significant contribution to the prediction of amount of
alcohol use. BDI (β = -0.12, p < 0.10) and ASI-R subscales of fear of cardiovascular
symptoms (β = -0.14, p < 0.10) had a marginally significant contribution to the
prediction of amount of alcohol use. Almost thirty six percent of the variance in
amount of alcohol use can be explained by age, gender, BDI, ASI-R lower order
factors and Coping Motives.
In the first step, hazardous alcohol use was significantly predicted by age,
gender and BDI, F (3, 294) = 8.27, p < 0.001. Addition of the lower order factors of
ASI-R to the equation after step two did not result in a significant F change. After
Step 2, age, gender, BDI and lower order factors of the ASI-R together significantly
predicted hazardous alcohol use, F (7, 290) = 4.30, p < 0.001. Addition of the Coping
Motives to the equation after step three did result in a significant F change. Age,
gender, BDI, lower order factors of the ASI-R and Coping Motives together
explained 38.1% of the variance in hazardous alcohol use, F (8, 289) = 6.12, p <
0.001. Examination of the individual variables after step three with all the IV’s in the
equation revealed that gender (β = 0.23, p < 0.001) and Coping Motives (β = 0.25, p
< 0.05) had a significant contribution to the prediction of hazardous alcohol use.
In the first step, symptoms of alcohol dependence was significantly predicted
by age, gender and BDI, F (3, 294) = 7.49, p < 0.001. Addition of the lower order
factors of ASI-R to the equation after step two did not result in a significant F
change. After Step 2, age, gender, BDI and lower order factors of the ASI-R together
significantly predicted symptoms of alcohol dependence, F (7, 290) = 3.57, p <
0.001. Addition of the Coping Motives to the equation after step three did result in a
80
significant F change. Age, gender, BDI, lower order factors of the ASI-R and Coping
Motives together explained 37% of the variance in symptoms of alcohol dependence,
F (8, 289) = 5.73, p < 0.001. Examination of the individual variables after step three
with all the IV’s in the equation revealed that BDI (β = 0.17, p < 0.01) and Coping
Motives (β = 0.26, p < 0.001) had a significant contribution to the prediction of
symptoms of alcohol dependence. ASI-R subscales of fear of publicly observable
anxiety symptoms (β = -0.12, p < 0.10) had a marginally significant contribution to
the prediction of symptoms of alcohol dependence.
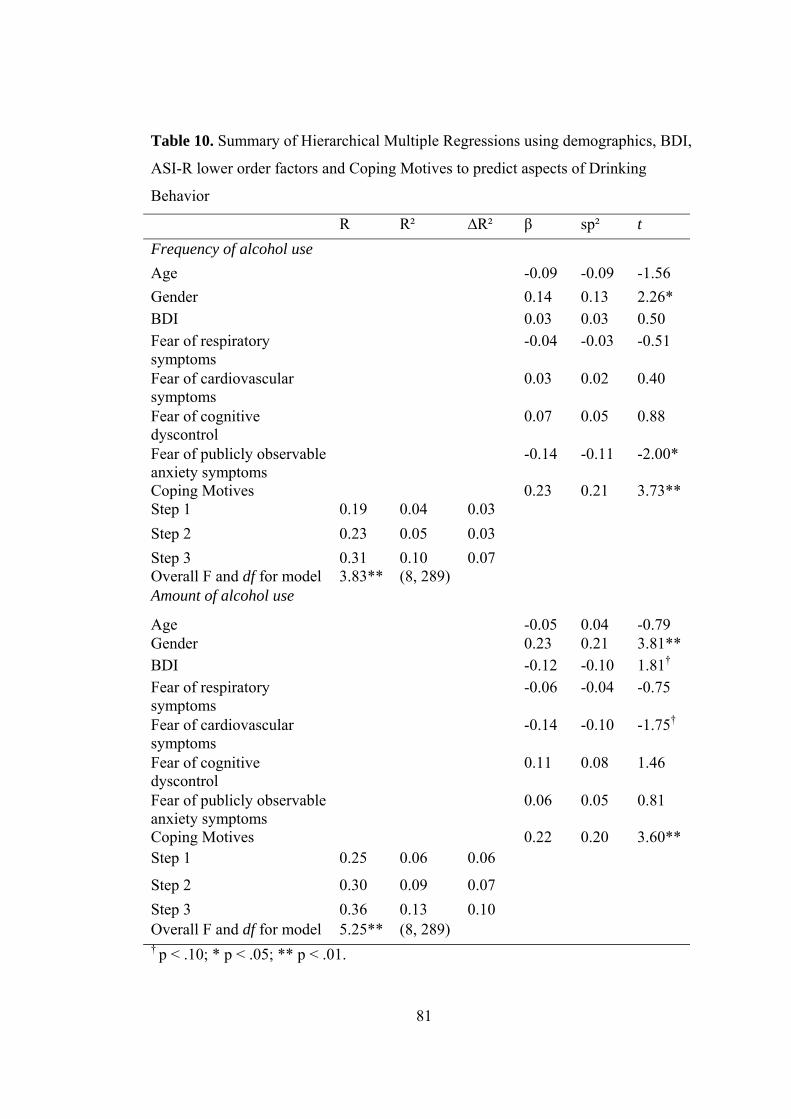
81
Table 10. Summary of Hierarchical Multiple Regressions using demographics, BDI,
ASI-R lower order factors and Coping Motives to predict aspects of Drinking
Behavior
R R² ∆R² β sp² t Frequency of alcohol use Age -0.09 -0.09 -1.56 Gender 0.14 0.13 2.26* BDI 0.03 0.03 0.50 Fear of respiratory symptoms
-0.04 -0.03 -0.51
Fear of cardiovascular symptoms
0.03 0.02 0.40
Fear of cognitive dyscontrol
0.07 0.05 0.88
Fear of publicly observable anxiety symptoms
-0.14 -0.11 -2.00*
Coping Motives 0.23 0.21 3.73** Step 1 0.19 0.04 0.03 Step 2 0.23 0.05 0.03 Step 3 0.31 0.10 0.07 Overall F and df for model 3.83** (8, 289) Amount of alcohol use
Age -0.05 0.04 -0.79 Gender 0.23 0.21 3.81** BDI -0.12 -0.10 1.81†
Fear of respiratory symptoms
-0.06 -0.04 -0.75
Fear of cardiovascular symptoms
-0.14 -0.10 -1.75†
Fear of cognitive dyscontrol
0.11 0.08 1.46
Fear of publicly observable anxiety symptoms
0.06 0.05 0.81
Coping Motives 0.22 0.20 3.60** Step 1 0.25 0.06 0.06
Step 2 0.30 0.09 0.07 Step 3 0.36 0.13 0.10 Overall F and df for model 5.25** (8, 289) † p < .10; * p < .05; ** p < .01.

82
Table 10. (continue)
R R² ∆R² β sp² t Hazardous alcohol use Age -0.04 -0.03 -0.61 Gender 0.23 0.22 3.95** BDI 0.03 0.02 0.43 Fear of respiratory symptoms
-0.03 -0.02 -0.30
Fear of cardiovascular symptoms
-0.12 -0.08 -1.53
Fear of cognitive dyscontrol
0.10 0.07 1.31
Fear of publicly observable anxiety symptoms
-0.04 -0.03 -0.54
Coping Motives 0.25 0.23 4.15** Step 1 0.28 0.08 0.07 Step 2 0.31 0.09 0.07 Step 3 0.38 0.15 0.12 Overall F and df for model 6.12** (8, 289) Symptoms of alcohol dependence
Age -0.05 -0.04 -0.79 Gender 0.01 0.01 0.15 BDI 0.17 0.14 2.62** Fear of respiratory symptoms
0.03 0.02 0.39
Fear of cardiovascular symptoms
0.06 0.04 0.80
Fear of cognitive dyscontrol
0.01 -0.01 -0.11
Fear of publicly observable anxiety symptoms
0.12 -0.09 -1.72†
Coping Motives 0.26 0.24 4.39** Step 1 0.27 0.07 0.06
Step 2 0.28 0.08 0.06 Step 3 0.37 0.14 0.11 Overall F and df for model 5.73** (8, 289) † p < .10; * p < .05; ** p < .01. Note. β, sp² and t values are representing the values of the last step of the regression analysis.

83
3. 2. 4. Alcohol Use, Anxiety Sensitivity and Drinking Motives
In order to determine whether university students using alcohol are different
in terms of drinking motives, a one-way within subjects ANOVA was conducted,
using four different factors of DMQ-R as within-subjects variables. The results for
the ANOVA indicated a significant drinking motive effect, F (3,891) = 410.72, p <
0.001. The means and standard deviations of drinking motives for the sample of
university students using alcohol are presented in Table 11.
As can be seen from Table 11, university students reported using alcohol
mostly for Enhancement, Social, Coping, and Conformity Motives, respectively. In
order to determine whether the mean scores of four drinking motives were
significantly different from each other, follow-up post-hoc tests were conducted.
Tukey’s HSD test revealed that mean Enhancement Motive score of university
students was significantly higher than that of Social Motive [ q (4, 891) = 7.32, p <
.01 ], Coping Motive [ q (4, 891) = 25.38, p < .01 ], and Conformity Motive [ q (4,
891) = 45.16, p < .01 ] scores. Mean Social Motive score of university students was
significantly higher than that of Coping Motive [ q (4, 891) = 18.06, p < .01 ] and
Conformity Motive [ q (4, 891) = 37.84, p < .01] score of the students. In addition,
mean Coping Motive score was significantly higher than that of Conformity Motive
score, [ q (4, 891) = 19.77, p < .01 ].
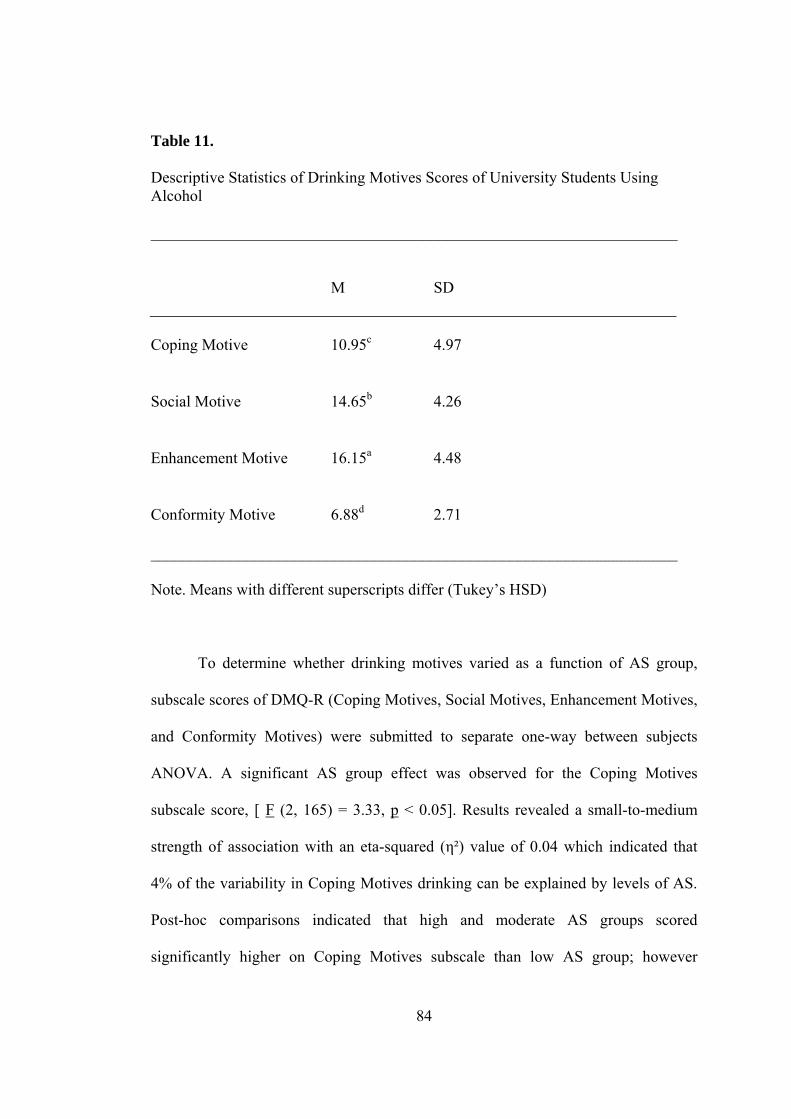
84
Table 11. Descriptive Statistics of Drinking Motives Scores of University Students Using Alcohol __________________________________________________________________
M SD
Coping Motive
10.95c
4.97
Social Motive
14.65b
4.26
Enhancement Motive
16.15a
4.48
Conformity Motive
6.88d
2.71
__________________________________________________________________
Note. Means with different superscripts differ (Tukey’s HSD)
To determine whether drinking motives varied as a function of AS group,
subscale scores of DMQ-R (Coping Motives, Social Motives, Enhancement Motives,
and Conformity Motives) were submitted to separate one-way between subjects
ANOVA. A significant AS group effect was observed for the Coping Motives
subscale score, [ F (2, 165) = 3.33, p < 0.05]. Results revealed a small-to-medium
strength of association with an eta-squared (η²) value of 0.04 which indicated that
4% of the variability in Coping Motives drinking can be explained by levels of AS.
Post-hoc comparisons indicated that high and moderate AS groups scored
significantly higher on Coping Motives subscale than low AS group; however

85
moderate and high AS group did not differ significantly from each other in terms of
Coping Motives scores (LSD, p < 0.05).
A significant AS group effect was observed for the Social Motives subscale
score, [ F (2, 165) = 5.60, p < 0.005]. Results revealed a medium strength of
association with an eta-squared (η²) value of 0.064 which indicated that 6.4% of the
variability in Social Motives drinking can be explained by levels of AS. Post-hoc
comparisons indicated that the mean Social Motives subscale score of the high AS
group was significantly higher than that of moderate AS group and low AS group,
however moderate and low AS group did not differ significantly from each other in
terms of Social Motives scores (LSD, p < 0.05).
A significant AS group effect was also observed for the Conformity Motives
subscale score, [ F (2, 165) = 16.21, p < 0.001]. Results revealed a large strength of
association with an eta-squared (η²) value of 0.164 which indicated that 16.4% of the
variability in Conformity Motives drinking can be explained by levels of AS. Post-
hoc comparisons indicated that the mean Conformity Motives subscale score of the
high AS group was significantly higher than that of moderate AS group and low AS
group, however moderate and low AS group did not differ significantly from each
other in terms of Conformity Motives scores (LSD, p < 0.05).
However, a significant AS group effect was not observed for the
Enhancement Motives subscale score, [ F (2, 165) = 0.24, p > 0.05]. Consistently,
results revealed a very small strength of association with an eta-squared (η²) value of
0.003 which indicated that only 0.3% of the variability in Enhancement Motives
drinking can be explained by levels of AS. One-way ANOVA results for the four
drinking motives as a function of the AS group are displayed in Table 12.

Table 12. Comparison of Drinking Motives Scores as a function of AS group _____________________________________________________________________________________________________________ Anxiety sensitivity group _____________________________________________________________________________________ Low Moderate High (n = 52) (n = 64) (n = 52) _____________________________________________________________________________________________________________ M SD M SD M SD Source SS df MS F DMQ-R Subscales Coping Motive 9.73a 5.06 11.92b 4.87 11.95b 5.47 Between 174.39 2 87.19 3.33* Error 4325.87 165 26.22 Total 4500.26 167 Social Motive 14.25a 3.76 13.84a 4.71 16.33 b 3.88 Between 195.48 2 97.74 5.59** Error 2882.74 165 17.47 86 Total 3078.22 167 Enhancement Motive 15.87 4.23 16.23 4.33 16.47 4.87 Between 9.77 2 4.89 0.24(ns) Error 3302.66 165 20.02 Total 3312.43 167 Conformity Motive 5.83a 1.72 6.57a 2.18 8.66b 3.71 Between 226.49 2 113.24 16.20*** Error 1152.95 165 6.99 Total 1379.44 167 _____________________________________________________________________________________________________________ * p<0.05; ** p<0.01; *** p<0.001; ns: not significant. Note. Means with different superscripts differ (LSD)
86

87
3. 2. 5. Anxiety Sensitivity as a Predictor of Drinking Motives
Separate hierarchical multiple regressions tested demographics (age, gender),
drinking behavior measures (hazardous alcohol use and symptoms of alcohol
dependence), and lower-order AS components as predictors for four drinking
motives. In each regression demographic variables (gender, age) were entered as a
block in Step I, AUDIT subscale scores of hazardous alcohol use, symptoms of
alcohol dependence, were entered as a block in Step II, and ASI-R subscale scores
were entered as a block in Step III. Drinking motives measures as criterion variables
included subscale scores of DMQ-R of Coping, Social, Enhancement and
Conformity Motives. Variables in each step for this regression analysis are presented
in Table 13. Zero-order correlations between criterion variables and predictors are
presented in Table 14.
Table 13. Variables in each step for Hierarchical Multiple Regressions using Demographics, AUDIT’s two subscales and ASI-R lower order factors to predict Drinking Motives Variables Step I Age Gender Step II Hazardous alcohol use Symptoms of alcohol dependence Step II Fear of respiratory symptoms Fear of cardiovascular symptoms Fear of cognitive dyscontrol Fear of publicly observable anxiety symptoms Dependent Variables Coping Motive Social Motive Enhancement Motive Conformity Motive

Table 14. Zero-order Correlations among Predictor (demographics, AUDIT’s two subscales and ASI-R lower order factors) and Criterion (drinking motives) Variables
Variables 1 2 3 4 5 6 7 8 9 10 11 121. Gender - 0.34** 0.25** 0.01 -0.08 -0.01 -0.01 0.10 0.12* 0.08 -0.02 0.14**2. Age - 0.04 -0.04 -0.01 -0.01 -0.10 0.02 0.03 0.12* -0.10 0.13*3. Hazardous alcohol use - 0.42** -0.07 -0.07 0.06 0.01 0.28** 0.21** 0.37** -0.04
4. Symptoms of alcohol dependence - 0.08 0.10 0.12* 0.01 0.32** 0.13* 0.30** 0.06
5. Fear of respiratory symptoms - 0.70** 0.56** 0.54** 0.09 0.14* 0.07 0.28**
6. Fear of cardiovascular symptoms - 0.57** 0.46** 0.12* 0.08 0.07 0.25**
7. Fear of cognitive dyscontrol - 0.47** 0.20** 0.08 -0.02 0.29**
8. Fear of publicly observable anxiety symptoms
- 0.17** 0.18** 0.05 0.30**
9. Coping Motive - 0.28** 0.40** 0.20**
10. Social Motive - 0.48** 0.31**
11. Enhancement Motive - 0.03
12. Conformity Motive -
88
* p < .05; ** p < .01
89
The results of hierarchical multiple regression analyses for each drinking
motive are presented in Table 15, including multiple R (R), R square (R2), adjusted
R2 (∆R2), the standardized regression coefficients-Beta (β), semipartial correlations
(sp²) and t values for each drinking motive of the last step of the analysis.
After step one, with demographic variables in the equation, age and gender
together did not significantly predict Coping Motives, F (2, 295) = 2.06, p > 0.05.
After Step 2, age, gender and two subscales of the AUDIT together significantly
predicted Coping Motives, F (4, 293) = 11.22, p < 0.001. Addition of the subscale
scores of AUDIT to the equation after step two did result in a significant F change.
Addition of the subscale scores of ASI-R to the equation after step three did result in
a significant F change. Age, gender, two subscales of the AUDIT and subscales of
the ASI-R together explained 16.9% of the variance in Coping Motives, F (8, 289) =
7.33, p < 0.001. Examination of the individual variables after step three with all the
IV’s in the equation revealed that only AUDIT subscales of hazardous alcohol use (β
= 0.16, p < 0.05) and symptoms of alcohol dependence (β = 0.24, p < 0.001) had a
significant contribution to the prediction of Coping Motives drinking. ASI-R
subscales of fear of cognitive dyscontrol (β = 013, p < 0.07) and fear of publicly
observable anxiety symptoms (β = 0.12, p < 0.06) had a marginally significant
contribution to the prediction of Coping Motives.
Social Motives was not significantly predicted by age and gender in Step 1, F
(2, 295) = 2.22, p > 0.05. After Step 2, age, gender and two subscales of the AUDIT
together significantly predicted Social Motives, F (4, 293) = 4.49, p < 0.01. Addition
of the subscale scores of AUDIT to the equation after step two did result in a
significant F change. Addition of the subscale scores of ASI-R to the equation after
90
step three did result in a significant F change. Age, gender, two subscales of the
AUDIT and subscales of the ASI-R together explained 9.7% of the variance in Social
Motives, F (8, 289) = 3.86, p < 0.001. After Step 3, with all the IV’s in the equation,
only AUDIT subscale of hazardous alcohol use (β = 0.19, p < 0.01) and the ASI-R
subscale of fear of publicly observable anxiety symptoms (β = 0.15, p < 0.05)
significantly predicted Social Motives. Age had a marginally significant contribution
to the prediction of Social Motives (β = 0.11, p < 0.10).
In terms of Enhancement Motives, age and gender together did not have
significant contribution to the variance in Step 1, F (2, 295) = 1.24, p > 0.05. After
Step 2, age, gender and subscales of the AUDIT together significantly predicted
Enhancement Motives, F (4, 293) = 15.73, p < 0.001. Addition of the subscale scores
of AUDIT to the equation after step two did result in a significant F change. After
Step 3, with all the IV’s in the equation, age, gender, subscales of the AUDIT and
subscales of the ASI-R together explained 20.5% of the variance in Enhancement
Motives, F (8, 289) = 9.33, p < 0.001. Addition of the subscale scores of ASI-R to
the equation after step three did result in a significant F change. After step three,
AUDIT subscales of hazardous alcohol use (β = 0.35, p < 0.001) and symptoms of
alcohol dependence (β = 0.16, p < 0.01) and ASI-R subscale score of fear of
cognitive dyscontrol (β = -0.19, p < 0.01) significantly predicted Enhancement
Motives.
After step one, with demographic variables in the equation, age and gender
together significantly predicted Conformity Motives, F (2, 295) = 3.98, p < 0.05.
After step two, age, gender and subscales of the AUDIT together significantly
predicted Conformity Motives, F (4, 293) = 3.15, p < 0.05. However, addition of the
91
subscale scores of AUDIT to the equation after step two did not result in a significant
F change. After Step 3, age, gender, subscales of the AUDIT and subscales of the
ASI-R together explained 16.1% of the variance in Conformity Motives, F (8,289) =
6.91, p < 0.001. Addition of the subscale scores of the ASI-R to the equation after
step three did result in a significant F change. After step three, with all the IV’s in the
equation, gender (β = 0.12, p < 0.05), and ASI-R subscale scores of fear of cognitive
dyscontrol (β = 0.17, p < 0.05) and fear of publicly observable anxiety symptoms (β
= 0.15, p < 0.05) significantly predicted Conformity Motives. Age (β = 0.11, p <
0.10), and AUDIT subscale of hazardous drinking (β= -0.11, p < 0.10) had a
marginally significant contribution to the prediction of Conformity Motives.

92
Table 15. Summary of Hierarchical Multiple Regressions using demographics, AUDIT’s two subscale scores, and ASI-R lower order factors to predict Drinking Motives R R² ∆R² β sp² t
Coping Motive Age 0.03 0.02 0.45
Gender 0.05 0.04 0.83
Hazardous alcohol use 0.16 0.13 2.49*
Symptoms of alcohol dependence
0.24 0.21 3.99**
Fear of respiratory symptoms
-0.08 -0.05 -0.92
Fear of cardiovascular symptoms
0.03 0.02 0.35
Fear of cognitive dyscontrol
0.13 0.10 1.83†
Fear of publicly observable anxiety symptoms
0.12 0.10 1.86†
Step 1 0.12 0.01 0.01
Step 2 0.36 0.13 0.12
Step 3 0.41 0.17 0.15
Overall F and df for model 7.33** (8, 289) Social Motive Age 0.11 0.10 1.79†
Gender -0.01 -0.01 -0.18
Hazardous alcohol use 0.19 0.17 2.94**
Symptoms of alcohol dependence
0.05 0.05 0.83
Fear of respiratory symptoms
0.13 0.08 1.49
Fear of cardiovascular symptoms
-0.05 -0.03 -0.57
Fear of cognitive dyscontrol
-0.04 -0.03 -0.54
Fear of publicly observable anxiety symptoms
0.15 0.12 2.15*
Step 1 0.12 0.02 0.01
Step 2 0.24 0.06 0.05 Step 3 0.31 0.10 0.07 Overall F and df for model 3.86* (8, 289) † p < .10; * p < .05; ** p < .01

93
Table 15 (continue). R R² ∆R² β sp² t
Enhancement Motive
Age -0.09 -0.08 -1.58
Gender -0.08 -0.07 -1.34 Hazardous alcohol use 0.35 0.30 5.70**
Symptoms of alcohol dependence
0.16 0.14 2.71**
Fear of respiratory symptoms
0.06 0.04 0.80
Fear of cardiovascular symptoms
0.12 0.08 1.48
Fear of cognitive dyscontrol
-0.19 -0.15 -2.81**
Fear of publicly observable anxiety symptoms
0.06 0.05 0.94
Step 1 0.09 0.01 0.002
Step 2 0.42 0.18 0.17
Step 3 0.45 0.21 0.18
Overall F and df for model 9.33** (8, 289)
Conformity Motive
Age 0.11 0.10 1.88†
Gender 0.12 0.11 2.02* Hazardous alcohol use -0.11 -0.09 -1.75†
Symptoms of alcohol dependence
0.08 0.07 1.26
Fear of respiratory symptoms
0.10 0.06 1.14
Fear of cardiovascular symptoms
0.01 0.004 0.08
Fear of cognitive dyscontrol
0.17 0.13 2.46*
Fear of publicly observable anxiety symptoms
0.15 0.12 2.20*
Step 1 0.16 0.03 0.02
Step 2 0.20 0.04 0.03
Step 3 0.40 0.16 0.14
Overall F and df for model 6.91** (8, 289) † p < .10; * p < .05; ** p < .01. Note. β, sp² and t values are representing the values of the last step of the regression analysis.

94
3. 3. Relationship among Alcohol Use, Anxiety Sensitivity and Drinking Motives
in Alcohol-Dependent Inpatients
First, data were examined for missing values, and univariate and multivariate
outliers, and one case was deleted. Further analyses were conducted by 54 cases.
Descriptives for self-reported measures are presented in Table 16.
Table 16.
Descriptive Statistics of Self-reported Measures in Alcohol Dependent Inpatients
Measures M SD
ASI-R 69.25 29.36
Fear of respiratory symptoms 2.14 0.97
Fear of cardiovascular symptoms 1.57 0.82
Fear of cognitive dyscontrol 1.72 0.98
Fear of publicly observable anxiety symptoms 2.25 0.92
DMQ-R
Coping Motive 18.24 4.88
Social Motive 14.41 4.70
Enhancement Motive 15.28 4.98
Conformity Motive 8.16 3.00
Frequency of alcohol use 3.70 0.74
Amount of alcohol use 2.22 1.51
Hazardous alcohol use 9.26 2.84
Symptoms of alcohol dependence 7.83 3.77
Harmful alcohol use 9.28 3.74

95
3. 3. 1. Anxiety Sensitivity, Alcohol Use and Drinking Motives
To examine the relationship between AS and alcohol use, and AS and
drinking motives among alcohol dependent inpatients, series of multiple regression
analyses could not be performed since there is a problem of multicollinearity. The
four lower order factors of the ASI-R were highly correlated in the alcohol dependent
inpatient sample (rs ranging 0.65 – 0.82), which resulted in tolerance values around
.30. In addition, sample size is small (N = 54). Thus, simple correlations among the
lower order factors of the ASI-R, drinking behavior measures and drinking motives
were performed. Demographic variables (age and education level) were also included
to the analyses to see whether they are related to drinking behavior measures and
drinking motives. Pearson correlation coefficients among demographics, the lower
order factors of the ASI-R, drinking behavior measures and drinking motives were
presented in Table 17.
Pearson correlation coefficients revealed that age was significantly and
negatively correlated with frequency of alcohol use ( r = -0.31, p < 0.05) and
symptoms of alcohol dependence ( r = -0.36, p < 0.01). In addition, education level
was significantly and negatively correlated with amount of alcohol use ( r = -0.31, p
< 0.05) and symptoms of alcohol dependence ( r = -0.32, p < 0.01). As can be seen
from Table 17, there was not a significant correlation among ASI-R lower order
factors and drinking behavior measures (frequency of alcohol use, amount of alcohol
use, hazardous alcohol use, symptoms of alcohol dependence and harmful alcohol
use). In addition, correlations were weak with rs ranging from -0.03 to 0.20.
In terms of the relationship between the drinking motives and the ASI-R
lower order factors, only the correlation between fear of respiratory symptoms and

96
Coping Motives was significant ( r = 0.35, p < 0.05). However, as can be seen from
Table 17, other correlations between the drinking motives and the ASI-R lower order
factors were not significant.
Results revealed that all of the drinking behavior measures, namely frequency
[ r = 0.43, p < 0.01] and amount of alcohol use [ r = 0.38, p < 0.01], hazardous
alcohol use [ r = 0.50, p < 0.01], symptoms of alcohol dependence (r = 0.54, p <
0.01), and harmful alcohol use (r = 0.45, p < 0.01) were significantly and positively
correlated with Coping Motives. In addition, frequency of alcohol use [ r = 0.28, p <
0.05] and symptoms of alcohol dependence [ r = 0.35, p < 0.05] were significantly
and positively correlated with Enhancement Motives. Results revealed that age was significantly and negatively correlated with
Enhancement Motives (r = -0.34, p < 0.05).

Table 17. Zero-order Correlations among demographics, ASI-R lower order factors, Drinking Behavior Measures and Drinking Motives in Alcohol Dependent Inpatients. Variables 1. 2. 3. 4. 5. 6. 7. 8. 9. 10. 11. 12. 13. 14. 15.
1. Age - 0.11 0.16 0.26 0.21 -0.01 -0.31* -0.10 -0.21 -0.36** -0.26 -0.26 -0.10 -0.34* 0.072. Education level - -0.24 -0.28 -0.40* -0.27 -0.13 -0.31* -0.21 -0.32* -0.20 -0.19 0.16 0.08 -0.03 3. Fear of respiratory symptoms
- 0.75* 0.82* 0.68** -0.03 0.14 0.12 0.12 0.17 0.35* 0.20 0.10 0.02
4. Fear of cardiovascular symptoms
- 0.69* 0.65** -0.27 -0.06 -0.12 0.07 -0.09 0.14 0.09 0.002 0.05
5. Fear of cognitive dyscontrol
- 0.68** -0.20 0.20 0.04 0.12 0.09 0.13 0.13 0.003 0.03
6. Fear of publicly observable anxiety symptoms
- -0.05 0.19 0.18 0.07 0.14 0.26 0.08 0.01 -0.06
7. Frequency of alcohol use
- 0.28* 0.72** 0.52** 0.55** 0.43** 0.04 0.28* -0.05
8. Amount of alcohol use - 0.77** 0.38** 0.52** 0.38* 0.03 0.07 0.08 9. Hazardous alcohol use - 0.58** 0.63** 0.50** 0.003 0.19 -0.03
10. Symptoms of alcohol dependence
- 0.66** 0.54** 0.05 0.35* 0.08
11. Harmful alcohol use - 0.45** 0.05 0.19 0.09
12. Coping Motives - 0.33* 0.60** 0.23 13. Social Motives - 0.47**
0.55**
14. Enhancement Motives
- 0.30
15. Conformity Motives -
97
* p < .05; ** p < .01. 97

98
3. 3. 2. Drinking Motives
In order to determine whether alcohol dependent patients are different in
terms of drinking motives, a one-way within subjects ANOVA was conducted, using
four different factors of DMQ-R as within-subjects variables. The results for the
ANOVA indicated a significant drinking motive effect, F (3, 159) = 79.85, p < 0.001.
The means and standard deviations of drinking motives for the sample of alcohol
dependent patients are presented in Table 18. As can be seen from Table 18, alcohol
dependent patients reported using alcohol mostly for Coping, Enhancement, Social,
and Conformity Motives, respectively. In order to determine whether the mean
scores of four drinking motives were significantly different from each other, follow-
up post-hoc tests were conducted. Tukey’s HSD test revealed that mean Coping
Motive score of alcohol dependent inpatients was significantly higher than that of
Social Motive [ q (4, 159) = 8.08, p < .01 ], Enhancement [ q (4, 159) = 6.19, p < .01
] and Conformity Motive [ q (4, 159) = 21.20, p < .01 ] score. Mean Social Motive
score was significantly higher than that of Conformity Motive score [ q (4, 159) =
13.12, p < .01 ]. Mean Enhancement Motive score was significantly higher than that
of Conformity Motive score [q (4, 159) = 15.01, p < .01 ]. However, mean Social
Motive score and Enhancement Motive scores of alcohol dependent patients were not
significantly different from each other [ q (4, 159) = 1.88, p > .05 ].
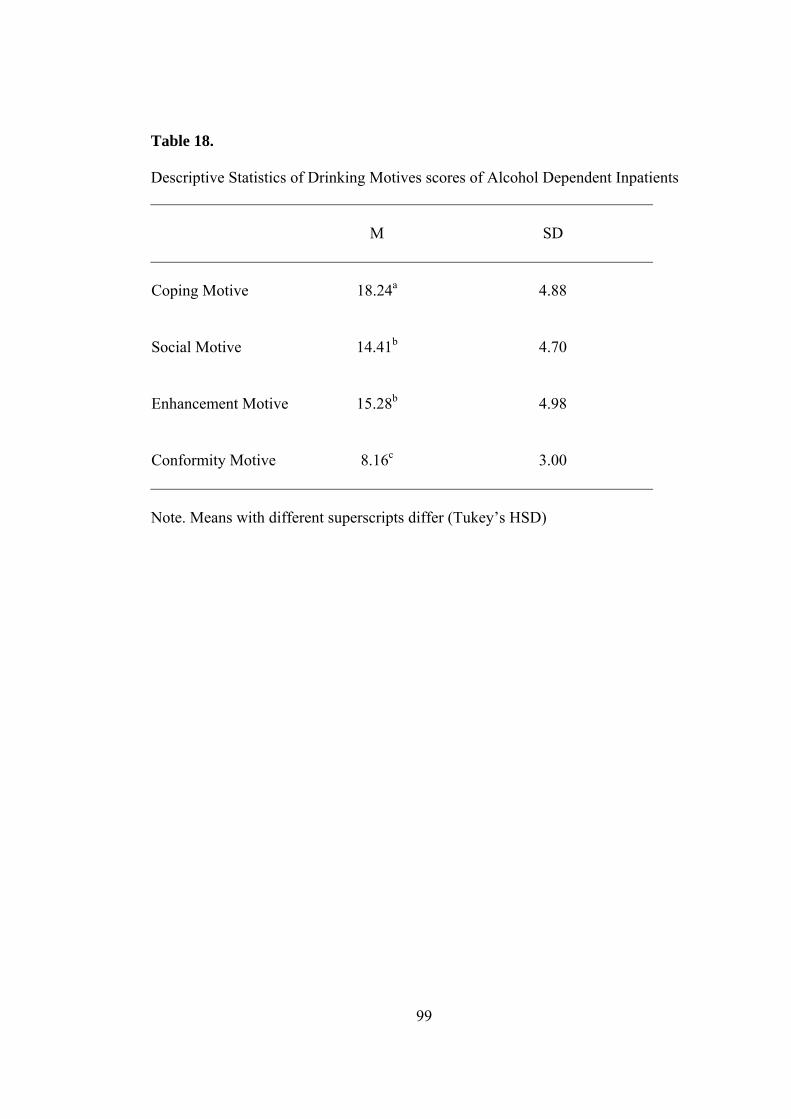
Table 18. Descriptive Statistics of Drinking Motives scores of Alcohol Dependent Inpatients
M
SD
Coping Motive
18.24a
4.88
Social Motive
14.41b
4.70
Enhancement Motive
15.28b
4.98
Conformity Motive
8.16c
3.00
Note. Means with different superscripts differ (Tukey’s HSD)
99

100
CHAPTER IV
DISCUSSION
4. 1. Factor Structure, Validity and Reliability of the ASI-R
The first purpose of the present study was to examine the factor structure of
the Turkish version of ASI-R in a large sample of nonclinical university students.
The factor structure of the ASI-R was first examined by Taylor and Cox
(1998b) in a sample of psychiatric patients. They found that the ASI-R has a
multidimensional and hierarchical structure with the four lower order factors loaded
on a single higher order factor. Deacon et al. (2003), in two large nonclinical
samples, again found that the ASI-R consists of four lower order factors which load
on a single higher order factor, though they had different factor labels than those of
Taylor and Cox (1998b). Overall, the ASI-R factor solution obtained in the present
study generally resembled the results of Taylor and Cox (1998b) and Deacon et al.
(2003).
In accordance with previous research (Taylor & Cox, 1998b; Deacon et al.,
2003), results of the present study yielded four factors. The factors were labeled as:
(1) fear of respiratory symptoms; (2) fear of cardiovascular symptoms; (3) fear of
cognitive dyscontrol; and (4) fear of publicly observable anxiety symptoms.
Hierarchical analysis revealed that these four factors loaded on a single higher order
factor. These findings suggested that the Turkish version of the ASI-R has a
hierarchically organized multifactorial structure. This hierarchically organized

101
structure of the ASI-R was consistent with results of previous Turkish studies using
other measures of AS. The Turkish versions of ASI and ASP have also been found to
have a hierarchical structure (Ayvaşık, 2000; Ayvaşık & Tutarel-Kışlak, 2004). All
these findings indicated that AS, as a construct, has a hierarchically organized
multifactorial structure.
Results of the factor analysis of the present study were quite similar to those
of Taylor and Cox’s (1998b) study. First, four lower order factors were found in both
of the studies. These four factors were also assigned the same labels across two
studies. However, item-factor loadings in the present study were slightly different
from their study. Items loaded on factors of ‘fear of cognitive dyscontrol’ and ‘fear
of publicly observable anxiety symptoms’ were quite equivalent across two studies;
however items that loaded on factors of ‘fear of respiratory symptoms’ and ‘fear of
cardiovascular symptoms’ were not so. For example, in the present study 10 items
loaded on Factor I (fear of respiratory symptoms). However, this factor had salient
loadings of 12 items in Taylor and Cox’s (1998b) study. In the present study 10
items loaded on Factor II (fear of cardiovascular symptoms); however corresponding
factor in Taylor and Cox’s (1998b) study had salient loadings of 11 items.
Deacon et al. (2003) also attempted to replicate the ASI-R factor structure
obtained by Taylor and Cox (1998b). Coefficients of congruence indicated that the
ASI-R ‘fear of cognitive dyscontrol’ and ‘fear of publicly observable anxiety
symptoms’ factors were highly replicable across their study and Taylor and Cox’s
(1998b). However, they found a less convergence between the other two factors
(factors pertaining to somatic symptoms) in their study and those reported by Taylor
and Cox (1998b) as similar to the present study.
102
PCA with oblique (promax) rotation showed that in the present study item-
factor loadings of 5 items (item no’s 21, 26, 27, 28, and 32) were different from
those in Taylor and Cox’s (1998b) study. For example, in the present study, Item 21
(“It scares me when my body feels strange or different in some way”) loaded on the
fear of publicly observable anxiety symptoms factor, while it loaded on fear of
respiratory symptoms factor in Taylor and Cox’s (1998b) study. It might be that, in
Turkish culture, feeling of change in one’s own body is understood as social
embarrassment. Item 7 (“When my heart beats rapidly, I worry that I might have a
heart attack”) and Item 19 (“When I feel pain in my chest, I worry that I am going to
have a heart attack”), in the present study, had salient loadings on both fear of
respiratory symptoms and fear of cardiovascular symptoms factors. However, the
same items loaded only on fear of cardiovascular symptoms factor in Taylor and
Cox’s (1998b) study. Indeed, Ayvaşık and Tutarel-Kışlak (2004) in examining factor
structure of ASP in a Turkish sample, found out that some items are cross-loaded on
both factors of “fear of respiratory symptoms” and “fear of cardiovascular
symptoms”. It is possible that in Turkish culture “rapid heart beat” and “pain in
chest” may be associated with shortening of breath and hence understood as a
respiratory symptom as well. In addition, 4 items are loaded on both fear of
respiratory symptoms and fear of cardiovascular symptoms factors. This finding
suggests that fear of respiratory and fear of cardiovascular symptoms might not be
understood as distinct symptoms in Turkish culture. Indeed, high correlation between
these two lower order factors (r = 0.73) relative to the correlations among other
factors might explain why most of the complex items would load on these factors.

103
Determining the factor structure of AS may have important implications both
for the nature of AS and its role in psychopathology. Different AS dimensions may
emerge as a result of distinct learning experiences. Further, different AS dimensions
may lead to different types of psychopathology. For instance, factor of ‘fear of
cognitive dyscontrol’ was found to be associated with depression (Taylor et al.,
1996), whereas factors assessing somatic symptoms (‘fear of respiratory symptoms’
and ‘fear of cardiovascular symptoms’) were found to be associated with panic
disorder or anxiety disorders in general (Zinbarg et al., 1997). As similar to the
previous studies, it has been found that fear of cognitive dyscontrol factor had the
highest correlation with the BDI scores in both university student ( r = 0.40) and
alcohol dependent inpatient ( r = 0.51) sample (see Table 2).
In summary, in accordance with previous research, the findings of the present
study confirmed that the Turkish version of ASI-R has a hierarchically organized
multifactorial structure. It appeared that the ASI-R measures four lower order factors
assessing fears of respiratory, cardiovascular, cognitive dyscontrol and publicly
observable anxiety symptoms. In addition, congruency analysis showed that PCA
and PAF solutions were consistent.
The present results revealed that the correlation between the ASI-R and
STAI-T was moderate. In addition, the lower order factors of the ASI-R moderately
correlated with the STAI-T (rs in university student sample 0.33-0.44; rs in alcohol
dependent inpatient sample 0.50-0.59). These two findings, in accordance with the
literature, indicated that AS and trait anxiety are related but distinct personality traits
and provided support for the divergent validity of the ASI-R.

104
Results also showed that lower order factors of the ASI-R were moderately
correlated with each other. Furthermore, lower order factors of the ASI-R had large
correlations with the total ASI-R scale. These two findings indicated that the ASI-R
has convergent validity.
The internal consistency analysis indicated that the ASI-R has sound
psychometric properties. The internal consistency of the whole scale was high (α =
0.93), suggesting that all items on the ASI-R correlate sufficiently with the total
scale. Cronbach’s α coefficients of the four lower order factors of the ASI-R were
above 0.79, which indicated that each subscale of the ASI-R also showed high degree
of internal consistency. Moreover, item-total analysis yielded that consistency of
each ASI-R items with the rest of the scale was satisfactory. Thus, item-total
correlations of each item provided further support for the reliability of the scale.
Taken together, these findings indicate that the ASI-R, as well as its four subscales,
is a reliable instrument in terms of internal consistency.
A potential limitation of the present study regarding the factor analysis was
the use of a university student sample which has a relatively homogeneous
demographic composition. Thus, restricted range of scores exhibited by university
students might have influenced correlations between variables and thereby results of
the present study. Further research is needed to examine the factor structure of the
Turkish version of ASI-R in a sample which is more representative of the general
population and in clinical samples. Future research should find out whether the factor
structure of the Turkish version of ASI-R is the same with diverse samples of
students, community adults, and patients with various anxiety disorders.

105
Future research should also determine whether these four factors differ in
their associations with different types of psychopathology. For instance, individuals
with a diagnosis of social phobia would be more likely to have a higher score on
factor of “fear of publicly observable anxiety symptoms” than on other factors. Also,
individuals with a diagnosis of panic disorder are more likely to have higher scores
on factors assessing fears of somatic harm, namely “fear of cardiovascular
symptoms” and “fear of respiratory symptoms” than on other factors has been
demonstrated previously (Zinbarg et al., 1997). Individuals with panic disorder may
also have high scores on “fear of cognitive dyscontrol” factor, since fear of going
crazy (insanity) and fear of losing control are among the symptoms of panic disorder
(APA, 1994). Thus, calculating subscale scores in addition to ASI-R total score may
be helpful in clinical assessment.
4. 2. Relationship among Alcohol Use, Anxiety Sensitivity and Drinking Motives
in University Students Using Alcohol
4. 2. 1. Gender Differences on Self Reported Measures
At the beginning of the present study it was predicted that female students
would score significantly higher than male students on the ASI-R and its lower order
factor scores. Results indicated that although the mean ASI-R total score of female
university students is slightly higher than that of male university students, they did
not differ significantly from each other. In addition, male and female students did not
differ significantly from each other on ASI-R four lower order factor scores.
Although having failed to reach statistical significance, females scored higher than
males on the ASI-R lower order factor scores of “fear of respiratory symptoms”,

106
“fear of cardiovascular symptoms” and “fear of cognitive dyscontrol”. On the other
hand, males scored higher than females on “fear of publicly observable anxiety
symptoms”. Relatively high levels of AS “social concerns” among men as compared
to women have been found in other studies as well (e.g., Stewart, Conrod, Gignac, &
Pihl, 1998; Stewart et al., 1997). Consistent with the present results, Durmuş-Sandler
(2001) also failed to find a significant difference between university men and women
on the Turkish version of the ASI-R. She also examined possible gender differences
on the six subscales of the ASI-R that the scale originally designed to measure. The
only significant difference they found was on fear of dissociative and neurological
symptoms. Women scored significantly higher than men on this subscale. The
present finding of no gender differences on AS levels measured by the ASI-R
between females and males is consistent with the findings of previous studies using
the ASI (Peterson & Reiss, 1992). Cox et al. (1991), Stewart et al. (1997), Messenger
and Shean (1998), Ayvaşık (2000) and Novak et al. (2003) obtained evidence that
females and males did not differ on their ASI scores. On the other hand,
contradicting to the present results, there are studies which found gender differences
on the ASI-R. Deacon et al. (2003) found that ASI-R total scores for university
women were significantly higher than those for men.
Results showed that mean frequency and amount of alcohol use, and
hazardous alcohol use score of male students were significantly higher than those of
female students. However, no significant gender differences were found on
symptoms of alcohol dependence score. The finding that mean frequency and
amount of alcohol use scores of male students were significantly higher than those of
female students is consistent with previous research. Volk et al. (1997) demonstrated

107
that among non-problem drinkers males drink more alcohol both in frequency and in
amount. Similarly, Topuz (2004) found that in a large sample of Turkish university
students, males drink more than females both in frequency and quantity. A number of
studies including university students showed that male students drink more than
female students (i.e., Uslanmaz, 1993; Çakıroğlu, 1998; Cox et al., 2002). AUDIT’s
subscale of hazardous alcohol use assesses rate of alcohol consumption which, if
persists, resulted in harm
(http://www.prodigy.nhs.uk/ProdigyKnowledge/PatientInformation/Content/pils/plau
dit.htm). Thus, the obtained gender difference on hazardous alcohol use implied that
male students drink higher levels of alcohol that may result in harm as compared to
female students. Hence, this indicated that male students in the present study,
although their drinking might not necessarily resulted in harm, are at greater risk for
hazardous alcohol use or harm caused by alcohol use than female students.
Moreover, this subscale is used to measure alcohol consumption (i.e., Zvolensky,
Kotov, Antipava, Leen-Feldner, & Schmidt, 2005) and hence the gender difference
on this subscale constituted another support for the finding that males use alcohol
more than females in amount. This is also consistent with previous research finding
that alcohol consumption rates are higher among men as compared to women (Farrell
et al., 2001).
Results of the present study showed that female and male students did not
differ on their scores of symptoms of alcohol dependence. AUDIT’s subscale of
‘symptoms of alcohol dependence’ is about alcohol dependence and high scores on
this subscale indicate the presence of alcohol dependence
108
(http://www.prodigy.nhs.uk/ProdigyKnowledge/PatientInformation/Content/pils/plau
dit.htm). So, this subscale assesses a more severe pattern of alcohol use than do the
other two subscales of AUDIT. Examination of the research data revealed that a
substantial percent of the students had a score of zero from this subscale (173 out of
298 (58.1%) students). Alcohol dependence which emerges after a prolonged and
heavy alcohol use might not be related with university students. Thus, failure to find
a gender difference on this subscale was not surprising.
Male students scored significantly higher than female students on negative
reinforcement drinking motives of Coping and Conformity. Similarly, Klein (1992)
found that males scored significantly higher on negative reinforcement drinking
motives than females in a college student sample. Since Coping Motives involve the
use of alcohol to avoid or reduce negative affective states (Cooper et al., 1992), the
present finding indicated that males are more likely to drink alcohol to forget their
worries or other negative affective states, whereas females less likely to drink for
Coping Motives. The finding of gender difference on Coping Motives is consistent
with previous research findings. Cooper et al. (1992) found that men reported more
frequent drinking for Coping Motives than did women. Park and Levenson (2002)
examined drinking to cope among a large sample of university students and they, too,
found that men rely on alcohol to cope more than women do. Among students (23
years in mean age) men scored higher on Coping Motives than women (Gire, 2002).
Topuz (2004) who examined drinking motives among university students found that
men drink alcohol for Coping Motives more than women do. Furthermore,
considering the finding that Coping Motive is associated with alcohol-related
problems (i.e., alcohol abuse / dependence) and lifetime prevalence rate of alcohol

109
dependence and alcohol-related problems is more than twice as high in men than
women (WHO, 2005), it is conceivable that Coping Motive is a more prevalent
drinking motive for men than women. On the other hand, there is some research
which indicated that drinking to cope might be a more prevalent motive for women
(Stewart et al., 2001; Thombs et al., 1993a).
The present finding of male students drink alcohol for Conformity Motives
more than females do is also consistent with previous research. Topuz (2004) found
that male university students reported drinking for Conformity Motives more than
female students do. Likewise, in an earlier study, Lo (1995) found significant gender
differences on Conformity Motives, showing that men were more susceptible to peer
influence in drinking behavior than were women. Cooper (1994) found that among
adolescents males reported drinking for Conformity Motives more than females.
The findings that male students reported more amounts of alcohol use and
more negative reinforcement drinking motives seemed to also be consistent with
each other. In an earlier study, Farber, Khavari, and Douglass (1980) demonstrated
that people scored high on negative reinforcement drinking motives drink more
amounts of alcohol than those scored low on negative reinforcement motives.
4. 2. 2. Anxiety Sensitivity and Alcohol Use
It was expected that students with high AS would score significantly higher
on alcohol use measures than those with moderate and low AS. Contrary to the
prediction, AS group effect was not observed for frequency of alcohol use, amount of
alcohol use, and AUDIT’s subscales of hazardous alcohol use and symptoms of
alcohol dependence. This suggests that, in the present sample of university students,

110
levels of AS could not differentiate (or predict) self-reported rates of alcohol use.
These findings are consistent with a study carried out by Merill (2000). She found
that in a sample of university students there were no differences between the high
and low AS groups on self-reported quantity or frequency of alcohol consumption.
She further found that AS scores were not even related to any of the consumption
variables. On the other hand, the present findings contradicted the findings of
Stewart et al.’s (1995) who found that female college students with high AS drank
more than females with low AS. The present findings are also in conflict with
Stewart et al. (2001) study that reported that high AS students reported a higher
typical weekly drinking frequency than did the moderate and low AS students, and
high AS students reported a higher yearly excessive drinking frequency than did the
low AS students. However, similar to the present results, they found that levels of AS
did not significantly affect students’ drinking quantity.
The present finding of no significant effect of AS levels on alcohol use may
be explained in two ways. First, in literature the direct relationship between AS and
alcohol use is not that robust. Rather, research findings indicated relatively more
robust relationship between AS and drinking motives (see Forysth et al., 2003).
Moreover, Samoluk et al. (1999) found that high AS nonclinical young adults
consumed more alcohol only in a solitary context (when they are alone) than those
with low AS. Therefore, the present failure of effects of AS levels on alcohol use
might stem from the unique drinking motives (enhancement and social) university
students do prefer. These two drinking motives of students might have acted
protective even though among students who have moderate or high levels of AS.

111
In addition, hierarchical regression analyses revealed that after controlling for
demographic variables, lower order factors of AS measured by the ASI-R did not
significantly predict frequency of alcohol use, amount of alcohol use and symptoms
of alcohol dependence. Only hazardous alcohol use was significantly predicted by
the combination of demographic variables and ASI-R lower order factors. Even the
contribution of all four lower order factors of the ASI-R was not significant, fear of
cognitive dyscontrol predicted a significant variance on hazardous alcohol use. The
present findings are consistent with Novak et al.’s (2003) finding which
demonstrated that AS did not significantly predict level of alcohol consumption in
university student drinkers. Also, Stewart et al. (2001) found that ASI lower order
factors did not significantly predict alcohol quantity of university students. In a
recent study by Zvolensky et al. (2005) AS was not found to predict alcohol
consumption and alcohol-related problems assessed by the AUDIT. In contrast to the
present findings, some research found evidence that AS is associated with drinking
behavior (Stewart et al., 1995; Stewart et al., 2001). For instance, Stewart (1993)
found that AS is an important predictor of self-reported rates of alcohol consumption
in university women. Moreover, Stewart et al. (1995) demonstrated that AS accounts
for about 18.7% of the variance in weekly alcohol consumption.
Only a few studies examined the relationship between drinking behavior and
various lower order components of AS (i.e., McWilliams & Asmundson, 1999;
Stewart et al., 2001; Koven et al., 2005). Consistent with the present results,
McWilliams and Asmundson (1999) in a sample of university students found that AS
did not account for significant variance in any of the drinking measures (average
number of drinking occasions per week, average number of drinks consumed during

112
a drinking occasion, average number of alcoholic drinks consumed per week and
average frequency of intoxication per month). Moreover, they found that fear of
publicly observable anxiety symptoms, but not fear of cognitive dyscontrol or fear of
physical symptoms, had a significant but weak correlation with amount of alcohol
use and monthly intoxication. Similar to McWilliams and Asmundson’s (1999)
study, the present study showed that most of the correlations between AS
components and drinking behavior measures were not significant. Only one AS
dimension, fear of cognitive dyscontrol had a significant but weak correlation with
symptoms of alcohol dependence. Stewart et al. (2001) also demonstrated that the
AS lower order components and alcohol quantity were not significantly correlated.
The findings that fear of cognitive dyscontrol predicted a significant variance
on hazardous alcohol use was parallel to previous research. Koven et al. (2005) again
found that only one AS dimension, fear of cognitive dyscontrol, was associated with
self-reports of symptoms of alcohol dependence and problematic drinking behaviors.
On the other hand, Stewart et al. (2001) found that only the fear of publicly
observable anxiety symptoms predicted a significant variance on increased drinking
behavior.
The present finding that only fear of cognitive dyscontrol explained a
significant variance of drinking behavior (hazardous alcohol use) may have some
implications. AS might function as an anxiolytic which let people who have fears
about getting out of control, to feel more in control and thus feel better. Hence, such
people might use alcohol for a perception of self-control. In addition, the relationship
between fear of cognitive dyscontrol and depression should be taken into account in
113
further studies. Depression might be a mediator in the relationship between alcohol
use and fear of cognitive dyscontrol.
The present results failed to support the relationship between AS and alcohol
use. The present failure of AS to predict drinking behavior likely be resulted from
nonclinical university student sample properties. It might be that the AS is a more
salient predictor of alcohol consumption in clinically anxious groups, particularly in
panic-disordered patients which was reported by Cox et al. (1993).
4. 2. 3. Anxiety Sensitivity and Coping Motives as a Predictors of Alcohol Use
Coping Motives is the motive that best fits to the tension reduction theory of
alcohol use. Indeed it has been suggested that coping-related drinking is more likely
related to the tension-reduction and self-medication theories of alcohol use / abuse
(Cappell & Greeley, 1987; cited in DeHaas et al., 2002). AS, as fear of anxiety
symptoms, may lead to negative affect. In order to reduce negative affect, people
might use alcohol with Coping Motives. In order to examine this, it was
hypothesized that lower order factors of the ASI-R and Coping Motives together
predicted drinking behavior measures.
Results revealed that demographic variables, BDI, ASI-R lower order factors
and Coping Motives together significantly predicted frequency of alcohol use,
amount of alcohol use, hazardous alcohol use and symptoms of alcohol dependence
of students. For each of the regression analysis for each drinking behavior measure,
addition of the subscale scores of the ASI-R to the equation after Step 2 did not result
in a significant F change. As discussed in the pervious section of 4. 2. 2., this is
consistent with the present study’s failure to demonstrate that AS significantly

114
predicts alcohol use. However, after controlling for demographics, BDI and ASI-R
lower order factors, Coping Motives explained a significant variance in each alcohol
use measure, namely frequency of alcohol use, amount of alcohol use, hazardous
alcohol use and symptoms of alcohol dependence of students. This significant
contribution of Coping Motives to alcohol use is consistent with previous findings
that Coping Motive is associated with heavier alcohol consumption, preoccupation
with drinking, worries about controlling drinking and more severe alcohol-related
problems (i.e. abusive drinking) (Cooper et al., 1992). This finding, also, constitutes
another support for the evidence that drinking motives in general contribute to
alcohol consumption, frequency of alcohol use and problems in university students
(i.e., Read et al., 2003; Carey & Correia, 1997; Stewart & Zeitlin, 1995).
Examination of the individual variables in the last step of each regression
analysis revealed that only ASI-R subscale of fear of publicly observable anxiety
symptoms significantly predicted frequency of alcohol use. Stewart et al. (2001) also
found that, of the AS lower order components, only fear of publicly observable
anxiety symptoms predicted a significant variance in increased drinking behavior.
The present finding that fear of publicly observable anxiety symptoms predicted a
significant variance in frequency of alcohol use, even when the Coping Motives is in
the equation is important. More studies are needed to clarify this issue. Yet, these
findings in general supported the conclusion that the association between AS and
coping-motivated drinking is more robust than that of between AS and alcohol use.
Since in each regression analyses Coping Motives significantly predicted alcohol use
measures whereas ASI-R lower order factors generally did not have significant
contributions to alcohol use.

115
4. 2. 4. Alcohol Use, Anxiety Sensitivity and Drinking Motives
Consistent with the hypothesis, results of the present study revealed that for
university students, Enhancement was the first common motive, which was followed
by Social, Coping, and Conformity Motives. This sequence is consistent with the
four categories of drinking motives proposed by Cooper et al. (1995) that starts from
internal and external positive reinforcement (drinking to enhance positive mood and
drinking to obtain a positive social reward) and continue to internal and external
negative reinforcement motives (drinking to reduce negative affect and drinking to
avoid social rejection). Parallel to the present results, a number of researchers (e.g.,
Cooper, 1995; Carrigan et al., 1998) showed that university students drink more in
positively reinforcing situations than in negatively reinforcing situations. Klein
(1992) evaluated reasons for drinking and found that college students gave the
strongest endorsements to liking the taste of alcohol and drinking to celebrate special
occasions. In a Canadian study, most college students drank to enjoy the taste
(24.9%), to celebrate (21.3%) or to be sociable (16.9%), whereas only 2.1% drank to
forget worries or to feel less shy (Kairouz et al., 2002).
The finding that Social Motives were the second common drinking motive
among university students is consistent with literature. Research indicated that social
factors play a central role in university students’ drinking (Stewart et al., 1996;
Simons, Correaia, & Carey, 2000). University students are likely to engage in shared
social occasions and activities which may facilitate social-motivated drinking.
Therefore, it is not surprising that Social Motives are particularly salient for
university students in the present study. Furthermore, the students’ age ranged
between 17 and 31, which represents a young population. Indeed, a number of

116
studies showed that most young people drink for Social Motives (e.g., Cooper, 1994;
Kairouz et al., 2002; Windle, 1996).
The present finding on university students’ drinking motives is also consistent
with previous Turkish literature. Delikaya (1999) studied high school students and
Dur (1994) studied university students and both found that majority of students drink
for enhancement reasons like for fun or pleasant feeling and the less were drinking
for negative reinforcement motives (coping-conformity) like to forget their problems
or to fit in to a group. In accordance with the present finding, Topuz (2004)
examined drinking motives in a sample of 1585 university students and she found
that students reported using alcohol mostly for Enhancement, Social, Coping, and
Conformity Motives, respectively.
The present finding that Conformity was the least reported drinking motive
among university students is consistent with previous research. Kairouz et al. (2002)
assessed reasons for drinking in 8864 university students and their results revealed
that to comply with others was the least reported reason (6.0 %) as the primary
motivation for drinking. In a recent study, Mohr et al. (2005) showed that
Conformity Motives were the least strongly endorsed drinking motives, which
counterstands the common assumption that students drink in response to social
norms (i.e., Perkins, 2002). Furthermore, university students in the present study
might have specific personality characteristics of self-directiveness and self-
consciousness who might not conform to others easily. Hence, although the social
life and social occasions are important for them, alcohol might not be as a tool for
them to conform to others.
At the beginning of the study it was predicted that students with high AS

117
would report more negative reinforcement drinking motives (Coping and
Conformity) than those with moderate and low AS. The results supported the
hypotheses that AS levels significantly affected negative reinforcement drinking
motives. Consistent with the present results, previous research showed that high AS
individuals display “risky” drinking motives (Coping and Conformity Motives) as
measured by the three-factor DMQ (Cooper et al., 1992) or its revised four-factor
version of DMQ-R (Cooper, 1994).
As expected, one-way ANOVA results revealed that students’ AS levels
significantly affected their coping-motivated drinking. Students with high AS
reported alcohol use for Coping Motives more than those with moderate and low AS.
Empirical research pointed out that high AS may be related to alcohol use via its
association with “risky” drinking motives (see Stewart et al., 1999). Coping Motive
was defined as a risky drinking motive by Cooper (1994). Hence, Coping Motive as
a risky drinking motive might be a more prevalent drinking motive of high AS
individuals as compared to moderate and low AS individuals. In literature, the
association between AS and alcohol use is sometimes explained by tension-reduction
theory of alcohol use (e.g., Stewart et al., 1997). Coping Motive, then, fits best to this
explanation. Indeed, coping-related drinking is more likely related to the tension-
reduction and self-medication theories of alcohol use / abuse (Cappell & Greley,
1987; cited in DeHaas et al., 2002). Coping Motive is associated with using alcohol
to reduce negative affective states (e.g., to forget one’s worries) (Cooper et al.,
1995). People with high AS have fears about their anxiety symptoms and this
preoccupation of their anxiety symptoms might lead to negative feelings. Thus,
people with high levels of AS may experience negative affect and use alcohol for
118
reducing such negative feelings (via negative reinforcement) that is to cope with such
feelings. Parallel to the present findings, Stewart (1993) showed that high AS
university students are more likely to report drinking alcohol primarily to cope than
are low AS university students. Samoluk et al. (1999) also have found that in a
sample of nonclinical adults high AS individuals are more likely than low AS
individuals to report coping-motivated alcohol use.
As expected, results revealed that students with high AS reported alcohol use
for Conformity Motives more than those with moderate and low AS. Conformity
Motives involves drinking to avoid aversive external consequences such as social
embarrassment (Cooper, 1994). ASI-R lower order factor of “fear of publicly
observable anxiety symptoms” is associated with fears of social embarrassment,
ridicule, etc. A person high on this dimension might fear that other people notice
their anxiety or what other people think about them when they experience anxiety
symptoms. Hence, the sources of their fears are based on external factors. Thus, a
person high on this dimension might be likely to drink for Conformity Motives,
which is an external negative reinforcement motive. Indeed, the correlation between
Conformity Motives and “fear of publicly observable anxiety symptoms” is higher
than that of the correlation between Conformity Motives and the other three ASI-R
lower order factors (see Table 14). Moreover, given the associations between AS and
social anxiety (Ball et al., 1995), the high AS individuals may feel anxious in the
presence of others. In order to avoid social rejection or to fit into a group, they are
likely to use alcohol for Conformity Motives.
Results showed that students’ AS levels significantly affected their social-
motivated drinking. Students with high AS reported alcohol use for Social Motives
119
more than those with moderate and low AS. Although Social Motive is not a
negatively reinforced drinking motive and not defined as a risky drinking motive, AS
levels significantly affected students’ scores on this motive. Indeed, a study showed
that ASI-R total score was related to positively reinforced drinking assessed by the
higher order factor of the Inventory of Drinking Situations (Lawyer et al., 2002). The
social context of the university environment has been found to be related with heavy
alcohol use, such that social-motivated alcohol use is a relatively normative (i.e.,
Perkins, 2002). Drinking to obtain a positive social reward (Social Motives) might be
important for students who have fears of social concerns. However, in contrast to the
present findings, some studies found that students with low AS drink primarily for
Social Motives (Comeau et al., 2001; Stewart et al., 1997; Stewart et al., 1995).
Results showed that students’ AS levels did not significantly affect their
enhancement-motivated drinking. According to Cooper et al. (1995) Enhancement
Motive is a positive reinforcement drinking motive and involves drinking to increase
positive mood or to have fun. Moreover, Enhancement Motives Subscale does not
contain items that refer to bodily sensations of feelings of excitement. Indeed,
Stewart and Zeitlin (1995) found that ASI scores were not to be related in a linear
fashion to scores on the Enhancement Motives in university students. Therefore, it is
not surprising that in the present study AS levels did not affect students’
enhancement-motivated drinking.
At the beginning of the study, it was expected that drinking motives will be
predicted by the lower order factors of the ASI-R. In general, consistent with the
prediction, after controlling for demographic variables and drinking behavior
variables (hazardous alcohol use and symptoms of alcohol dependence), lower order

120
factors of the ASI-R significantly predicted all four drinking motives. Specifically,
fear of cognitive dyscontrol and fear of publicly observable anxiety symptoms had
marginally significant contributions to the prediction of Coping Motives. Several
other studies (i.e., Novak et al., 2003) have shown that AS predicts Coping Motives
for alcohol use in university students (see review by Stewart et al., 1999). The
present results determined which aspects of AS, though marginally, contributed to
Coping Motives. It appears that other than fear of cognitive dyscontrol, fear of
publicly observable anxiety symptoms was important in coping-motivated drinking.
This is important since this component has been found to largely explain the
association between AS and increased drinking behavior in university students
(Stewart et al., 2001).
Conformity Motives were significantly predicted by fear of cognitive
dyscontrol and fear of publicly observable anxiety symptoms. AS lower order factor,
fear of cognitive dyscontrol has already shown to be important in the drinking
behavior of university students (i.e., Koven et al., 2005). Significant contribution of
fear of publicly observable anxiety symptoms is also not surprising. Conformity
Motives involves drinking alcohol to avoid aversive external consequences such as
social embarrassment (Cooper, 1994). ASI-R lower order factor of fear of publicly
observable anxiety symptoms involves fears of anxiety symptoms that lead to
negative social consequences (i.e., embarrassment). So, considering this overlap, it is
conceivable that this component of AS significantly predict Conformity Motives. A
study showed that high AS predicted Conformity Motives for alcohol use among
adolescents (Comeau et al., 2001). Also, Stewart et al. (2001) demonstrated that AS
significantly predict conformity-motivated drinking of college student drinkers. The

121
present study adds further knowledge to this established AS-Conformity Motives
relationship by showing which component of AS predicts Conformity Motives.
Social Motives were significantly predicted by fear of publicly observable
anxiety symptoms. This is conceivable since this factor regards fears of social
concerns. Drinking for Social Motives involves drinking in social situations with
other people (Cooper, 1994). Hence, it is not surprising that fear of publicly
observable anxiety symptoms which is closely related with social concerns explained
a significant variance of Social Motives.
Enhancement Motives were significantly predicted by fear of cognitive
dyscontrol. Comeau et al. (2001) found that low AS predicted Enhancement Motives
for alcohol use among nonclinical individuals. Moreover, considering that this lower
order factor found to predict drinking behavior of university students (Koven et al.,
2005) and that it also predicted Coping and Conformity Motives in the present study,
a significant contribution of this factor to Enhancement Motives is not surprising.
In general it appears that ASI-R lower order factors predict all four drinking
motives in university students. Previous research has already shown that AS is a
predictor of Coping and Conformity Motives (Conrod et al., 1998; Stewart et al.,
1997). The present study demonstrated that, among university students, ASI-R lower
order factors were predictive of positive reinforcement drinking motives (Social and
Enhancement) as well.

122
4. 3. Relationship among Alcohol Use, Anxiety Sensitivity and Drinking Motives
in Alcohol Dependent Inpatients
4. 3. 1. Anxiety Sensitivity, Alcohol Use and Drinking Motives
Contrary to expectations, lower order factors of the ASI-R did not
significantly correlated with alcohol use behavior (frequency of alcohol use, amount
of alcohol use, hazardous alcohol use, symptoms of alcohol dependence and harmful
alcohol use) among alcohol dependent patients. Various factors may have
contributed to the failure to find a significant relationship, including small sample
size and medication treatment of alcohol dependent sample. Medication treatment
could have lessened AS profiles of alcohol dependent inpatients. Some of these
issues were discussed in the limitations of the study section.
Kushner et al. (2001) found support for a significant relationship between AS
and alcohol use in panic disordered patients who use alcohol. Thus, AS-alcohol use
relationship may be more salient in clinical groups of comorbid alcohol use disorders
and anxiety disorders.
Results revealed that fear of respiratory symptoms significantly and positively
correlated with Coping Motives among alcohol dependent inpatients. This might be
explained by the tension-reduction theory of alcohol use. People with alcohol
dependence may use alcohol for its anxiolytic properties to reduce their symptoms
related to physiological tension (i.e., fear of respiratory sensations). Moreover,
exhibiting withdrawal symptoms to alcohol is amongst the symptoms of alcohol
dependence and these include tremors, nausea, sweating and autonomic hyperactivity
(i.e., heart beat of over 100) (DSM-IV, 1994) which exhibit themselves by somatic
sensations. Hence, it is conceivable that fear of respiratory symptoms, which is

123
associated with somatic sensations, was positively related with coping-motivated
drinking among alcohol dependent inpatients. Indeed, Kushner et al. (2001) found
that AS and withdrawal symptoms were significantly positively correlated in an
alcohol dependent sample. Moreover, since fear of respiratory symptoms was found
to be associated with anxiety disorders (Zinbarg et al., 1997), possible syndrome-
related anxiety experiences alcohol dependent patients have, might have contributed
to this association of fear of respiratory symptoms and Coping Motives. Consistent to
the present results, DeHaas et al. (2001) found a significant relation between AS and
alcohol use in negative situations (to cope) in a sample of clinical alcohol abusers.
Contrary to the expectations, other three lower order factors of the ASI-R
(fear of cardiovascular symptoms, fear of cognitive dyscontrol and fear of publicly
observable anxiety symptoms) did not significantly correlate with Coping Motives.
Forsyth et al. (2003) in a sample of substance abuse disordered inpatients failed to
find a significant relationship between high AS and alcohol use to dampen aversive
arousal sensations (to cope). Forsyth et al. (2003) further found that in addition to
AS, emotional avoidance and perceived uncontrollability are common characteristics
of patients seeking residential substance abuse treatment. Thus, it might be that in the
present study, other than the AS, these factors might have contributions to coping-
motivated drinking of alcohol dependent patients. Kushner et al. (2001) showed that
the relationship between AS and Coping Motives reduced substantially when the
relationship between AS and anxiety symptoms and anxiety symptoms and Coping
Motives were controlled among alcohol dependent patients. They concluded that
effects of AS on coping-motivated drinking might be indirect. In the present study
anxiety symptoms might have intervened in the association between AS and Coping

124
Motives as well. In addition, medication treatment of alcohol dependent patients
could have possibly lessened anxiety levels of patients, hence this might have
affected the relationship between AS and Coping Motives.
Results revealed that lower order factors of the ASI-R were not significantly
correlated with Social, Enhancement and Conformity Motives. AS was not found to
be related to positive situation of substance use, such as elevating positive mood or
increasing satisfaction from interpersonal relationships (DeHaas et al., 2001). From
this aspect, it is not surprising that in the present study, Enhancement and Social
Motives were not significantly correlated with the ASI-R lower order factors among
alcohol dependent patients. Conformity Motives was not found to be a common
drinking motive of alcohol dependent inpatients in the present study. Hence, it is not
surprising that lower order factors of the ASI-R did not have significant correlations
with this motive.
4. 3. 2. Drinking Motives
Results showed that alcohol dependent patients drink more for Coping
Motives which was followed by Enhancement, Social and Conformity Motives. This
suggests that they drink for internal (either the positive or negative reinforcement)
drinking motives more likely than do for external drinking motives. Hence, whatever
the aim is either to increase positive mood or to decrease negative affect, the subject
of their expectations is internal. According to the motivational model of alcohol use,
the decision to drink is made on the basis of the change that the person expects to
achieve by drinking compared with not drinking (Cox & Klinger, 1988). Hence, it
can be said that alcohol use serves a specific function of affective change, rather than
125
to gain a social reward or to avoid social rejection among alcohol dependent patients.
Also, it seems that this affective change among alcohol dependent patients (tension
reduction or mood enhancement) is related to the direct effects of alcohol, rather than
indirect effects (i.e., peer acceptance) (Kuntsche, Knibbe, Gmel, & Engels, 2005).
Indeed, it has also been found that internally generated motives (Enhancement and
Coping) that strongly related with personality traits (Enhancement with extraversion,
Coping with neuroticism) are more consistently related to alcohol use than externally
generated motives (Cooper, 1994; Kairouz et al., 2002).
Coping Motives were the most common drinking motives among alcohol
dependent patients in the present study. Indeed, all of the drinking behavior measures
were significantly and positively correlated with Coping Motives in alcohol
dependent sample (see Table 17). In an earlier study Selzer et al. (1977) found that
men with a diagnosed alcohol use disorder were more likely to drink when
depressed, nervous or tense than comparison groups. The present results are
consistent with previous research that DSM-IV diagnosed alcohol-dependent
drinkers were found to demonstrate a high level of drinking to cope (Carpenter &
Hasin, 1998b; Carpenter & Hasin, 1999). Moreover, Carpenter and Hasin (1998a) in
a prospective study of non-alcohol disordered drinkers showed that drinking to cope
with negative affect predicted a DSM-IV alcohol dependence diagnosis at a 1-year
follow-up. Coping Motives have also been found to differentiate those who have an
alcohol abuse treatment history from those who do not (Carey & Carey, 1995).
Enhancement Motive was the second common drinking motive among
alcohol dependent patients. Infact, Enhancement Motive was significantly and
positively correlated with drinking behavior measures in alcohol dependent sample.

126
As can be seen from Table 17, frequency of alcohol use and symptoms of alcohol
dependence were significantly and positively correlated with Enhancement Motives.
Indeed, Kairouz et al. (2002) demonstrated that Enhancement Motives in the sense of
feeling the effects of alcohol appear to be highly endorsed by heavy drinkers. Some
studies found that, in addition to Coping Motives, Enhancement Motives were a
second predictor for alcohol problems (Cooper, 1994; Cooper, Agocha, & Sheldon,
2000), whereas some failed (Read, Wood, Kahler, Maddock, & Palfa, 2003). So, the
findings on Enhancement Motives’ relation to alcohol-related problems seem to be
inconsistent. Enhancement Motives were the most common and second common
drinking motive among university students and alcohol dependent patients,
respectively in the present study. This may be explained by different items on the
scale. Enhancement Motive scale contains items that are related to drinking for
enjoyment or to make a party more enjoyable, which might likely to be amongst the
drinking reasons of students. On the other hand, the scale also contains items related
to drinking to get drunk or feel high which are likely to be associated with heavy
drinking, and hence might likely to be amongst the drinking reasons of alcohol
dependent patients. Infact, Mohr et al. (2005) have found that positive mood predicts
more drinking at home as time with friends decreases. Therefore, Mohr et al. (2005)
suggested that although the Enhancement Motives were thought to be social, there
may be nonsocial aspects to enhancement drinking. From this point, it can be said
that people may drink alcohol with Enhancement Motives when they are alone (i.e.,
at home) as well. Thus, this kind of enhancement-motivated drinking may be
prominent among alcohol dependent patients in the present study.
Results showed that alcohol dependent patients in the present study reported

127
drinking mostly for Coping and Enhancement Motives. However, the primary and
most common drinking motive of alcohol dependent patients was Coping Motive.
Indeed, some studies found a strong association between Enhancement Motives and
alcohol problems on the bivariate level that did not remain significant when adjusting
for Coping Motives in multiple analyses (Carey & Correia, 1997). Cooper et al.
(1995) again found that when Coping Motives are controlled, the direct association
between Enhancement Motives and alcohol problems is likely to lessen or vanish. On
the other hand, Galen, Henderson and Coovert (2001) found that Enhancement
Motives have direct effects on problematic drinking as well as indirect (via alcohol
consumption) effects. Stewart (1999) found that in an alcohol treatment sample,
those who have high Enhancement Motives will be more likely to develop Coping
Motives as their drinking progresses and causes problems. Thus, the present finding
that alcohol dependent patients reported mostly Coping Motives which was followed
by Enhancement Motives is consistent with Stewart’s (1999) finding. This pattern of
drinking might be characteristic of alcohol dependent patients for whom initial
drinking may be motivated by the desire to enhance positive states (Enhancement
Motives), but will result in negative outcomes in the long run which may be
motivated to reduce negative affect (Coping Motives) afterwards and become as
primary.
Among four drinking motives, Social Motive is the only drinking motive that
is associated with non-problematic drinking and was found unrelated to heavy
drinking (Cooper, 1994). Similarly, Kassel et al. (2000) reported that Social Motives
were not a significant predictor of drinking problems. Thus, it is not surprising that
patients in the present study who have become alcohol dependent after a heavy and

128
prolonged period of drinking reported Social Motives as the second least likely
drinking motive.
Farber et al. (1980) in an alcoholic sample found that individuals had high
scores on negative reinforcement drinking motives. However, in the present study,
Conformity Motives were the least likely reported drinking motives in alcohol
dependent patients as in university students. Cooper’s (1994) research has shown that
although Conformity Motive is a risky drinking motive and associated with negative
affect, it has an inverse association with quantity and frequency of alcohol
consumption. Thus, it is conceivable that this drinking motive is the least likely
reported drinking motive among alcohol dependent patients, who have had already
high quantity and frequency of alcohol consumption. Moreover, this motive involves
fitting to a group or conforming to others, which might not appear as desirable for
the alcohol dependent patients, as like most of the people.
4. 4. General Discussion and Conclusions
The current study examined the relationship among AS, alcohol use and
drinking motives in university student drinkers and alcohol dependent inpatients. In
general, the results from the present study do not support the hypothesis that AS is a
useful concept in the understanding of alcohol use in university students and alcohol
dependent patients. The present results indicated that lower order factors of the AS
do not significantly predict drinking behavior in university students. In addition,
lower order factors of the AS did not significantly relate to alcohol use measures
among alcohol dependent inpatients.

129
On the other hand, results from the present study demonstrated that levels of
AS plays an important role in the drinking motives (Coping, Conformity and Social)
of university students. Particularly the present finding that levels of AS affected
coping-motivated drinking in university students has important implications. A
handful of previous studies have suggested that high AS may be related to greater
tension-reducing effects from alcohol use (i.e., Stewart et al., 1996). The finding that
those with high AS drink to cope more often than do those with moderate and low
AS might stand as a support of tension-reduction theory of alcohol use. The results of
the present study, particularly in the student sample, indicated that the relationship
between AS and drinking motives is more robust than the relationship between AS
and alcohol use. Indeed, this is consistent with Novak et al.’s (2003) finding that AS
was not related to levels of alcohol use but was related to drinking motives. AS,
which consists of beliefs about harmful consequences of anxiety symptoms might
directly influence self-perceived drinking motives (i.e., Coping Motive), which are
also based on cognitive interpretations (expectations and beliefs about consequences
of drinking or not drinking). Alcohol use, as a last step (behavior) in this sequence
might be directed by these drinking motives. Similarly, the present study failed to
find a significant relationship between AS and alcohol use among alcohol dependent
inpatients. However, it was found that one AS lower order factor (fear of respiratory
symptoms) was significantly and positively correlated with coping-motivated
drinking in these individuals. It might be that, as in university students, in alcohol
dependent inpatients, the association of AS and coping-motivated drinking may be
more robust than that of AS and alcohol use. Future studies should explore this issue.
The results of the present study also revealed that lower order factors of the AS did

130
not significantly relate to the Social, Enhancement and Conformity drinking motives
of alcohol dependent patients. Further research is needed to explore whether the AS-
drinking motives association expands to motives other than Coping and which AS
factors are particularly important in the drinking motives of alcohol dependent
patients.
The present study showed that among the ASI-R lower order factors fear of
cognitive dyscontrol is particularly important in the drinking behavior and drinking
motives of university students. This factor is more highly correlated with drinking
behavior scores than were corresponding correlations between the other ASI-R
factors. Previous research has also found such a trend (i.e., Lawyer et al., 2002). In
addition to the fear of cognitive dyscontrol factor, fear of publicly observable anxiety
symptoms appeared important in the drinking motives of university students.
4. 5. Limitations of the Present Study
For both university student sample and alcohol dependent sample, all data
were based on self-reported measures, and therefore relationships between variables
might be strengthened. Thus, results of the present study could be due to only
method variance.
For the university student sample, all data were collected during class hours
and this might have restricted the validity of findings. Furthermore, since the battery
was administered to students during class hours, the sample represented students who
were attending classes. This may have excluded students having drinking problems
or using high amounts of alcohol who may not even attend classes.
131
The university students of the present study represented nonclinical
individuals. Thus, they should have been asked whether they were in treatment for
any psychological disorder, if so they should have been excluded from the study.
To examine the association between AS and alcohol use among nonclinical
samples, individuals from bars, night clubs etc. rather than university students might
have been sampled. Among these individuals, whose drinking level and frequency
might be higher as compared to students, AS-alcohol use association might be more
prominent.
One of the important shortcomings of the current study regarding the alcohol
dependent patient sample was including a low number of alcohol dependent patients.
This situation inevitably reduces the validity of the generalization that one can make
about the AS profiles of alcohol dependent patients, and hence the relationship
among AS, alcohol use and drinking motives in these individuals. Therefore, the
results of the current study regarding alcohol dependent sample should be interpreted
with some caution.
Another limitation regarding the alcohol dependent patient sample was that a
much lower number of female [3 (5.5%)] as compared to male [52 (94.5%] alcohol
dependent patients participated to the present study. Hence, alcohol dependent
sample, predominantly consisted of male individuals, was not a representative
sample with regards to gender. The present study should have rather included a
mixed-gender sample of alcohol-dependent patients, which has comparable number
of individuals in both gender.
Another potential problem is related to alcohol dependent patients’
medication. All of the patients were under medication when they were administered

132
the battery. The impact of medication (e.g., anti-anxiety medication) could reduce the
(state) anxiety levels of patients. As a result, this might have affected their ratings of
their feelings of anxiety and / or fear of anxiety symptoms (AS) on various items of
the battery. It has been found that elevated AS scores decreased when patients were
treated with antidepressants (Otto et al., 1995). Hence, in the present study, alcohol
dependent patients’ AS levels might have been restricted due to medication, which
might underestimate the association between AS and alcohol use in these individuals.
In sum, medication treatment among alcohol dependent patients might have altered
the results of the present study. It could have been better to study the first time
alcohol dependent patients who were not under medication. However, as this
condition was rare, the patients under medication were conveniently included to the
study.
Lastly, for the alcohol dependent patient sample, comorbidity might be
another important issue. It has been well documented that alcohol dependence
comorbid to nearly all of the anxiety disorders (Himle & Hill, 1991; Kushner, Sher,
& Beitman, 1990). People with alcohol dependence may also display psychological
problems such as depression and abuse of other drugs (Avis, 1999). High
correlations among ASI-R, STAI-T and BDI in the alcohol dependent inpatient
sample ( rs ranging from 0.44 to 0.67) might be taken as indicators of comorbidity
among these individuals. Although all the patients in the present study have been
diagnosed as having alcohol dependence according to the DSM-IV diagnostic criteria
(APA, 1994) by the expert psychiatrists at the hospitals, the researcher should have
investigated prior to the administration of the battery whether the patients have a
comorbid disorder or not. It may be that individuals with a co-morbid mental

133
disorder (e.g., anxiety disorder) represent a different group than individuals who are
only alcohol dependent. Therefore, comorbid disorders, if they existed, might have
affected the scores on self-reported measures.
4. 6. Clinical Implications
The present study identified self-reported drinking motives of university
students and alcohol dependent patients. Determining drinking motives of university
students is important, since drinking motives contribute to alcohol use and problems
in university students (i.e., Read et al., 2003; Carey & Correia, 1997; Stewart &
Zeitlin, 1995). By identifying drinking motives of university students and alcohol
dependent patients, their drinking pattern, situations in which they drink and quantity
of their drinking can be determined. Understanding what has brought one person to
drink heavily will facilitate development of interventions that target to reduce alcohol
consumption.
Present results showed that high AS students more likely to use alcohol for
Coping Motives than those with moderate and low AS levels. It has been well
documented that Coping Motive is associated with heavier alcohol use and alcohol
related problems (Cooper, 1994). Thus, identifying high AS university student
drinkers and helping them to develop alternative behaviors to drinking in negatively
reinforcing situations might be a useful early prevention of alcohol-related problems
among these individuals. Moreover, since Coping Motives are related to alcohol
problems independent of alcohol use (Cooper et al., 1988), identifying individuals
who reported drinking to cope, as independent of how much or frequent they drink,
seems to be crucial.

134
If by future studies AS will be demonstrated a robust risk factor for alcohol
use disorders, interventions designed to decrease AS could be an important
supplement to alcohol abuse / dependence treatment. Likewise, interventions which
teach high AS nonclinical individuals (e.g., university students) adaptive coping
skills might prevent the development of harmful drinking. Such treatments could
help to decrease the probability of someone with high AS to use alcohol to cope with
his / her fear of anxiety symptoms and thus prevent the development of alcohol use
disorders.
4. 7. Directions for Future Research
In the present study it has been found that in the university student sample,
the correlation between ASI-R factors of fear of respiratory symptoms and fear of
cardiovascular symptoms is high (α = 0.73). This suggests that there might be
redundant items in the ASI-R. Thus, the factor structure of the ASI-R should be
examined in future studies using nonclinical and clinical samples.
The results of the present study in general did not support the relationship
between AS and alcohol use in university students and alcohol dependent patients.
Additional studies are needed to clarify the nature of this relationship. Future
research should examine the relationship between the components of AS measured
by the ASI-R and alcohol use. Moreover, only few studies have examined AS levels
in individuals with alcohol-related problems. Thus, more and more studies should
investigate the relationship between AS and alcohol use in individuals with larger
samples of patients with clinical levels of alcohol abuse / dependence.

135
Stewart et al. (1999) noted that the issue of whether high levels of AS
contributes to alcohol use or whether alcohol use contributes to high levels of AS has
not yet been determined. Therefore, further research is needed to resolve this issue.
Longitudinal research observing people with elevated AS and non-elevated AS for a
long period of time might resolve this issue.
Another issue future research should examine is the relationship between AS
and alcohol use in individuals with panic disorder. Panic disorder has already shown
to be related with high levels of AS, but future research can examine whether the AS
levels of panic-disordered individuals who frequently drink and those who do not
drink differ. It might be also interesting to study associations between AS, alcohol
use and drinking motives in patients with comorbid anxiety disorders and alcohol use
disorders, since AS may be a more prominent trait for these patients.
136
REFERENCES
Aiken, L. R. (1994). Psychological testing and assessment (8th ed.). Boston: Allyn and Bacon.
American Psychiatric Association. (1987). Diagnostic and statistical manual of mental disorders (3rd ed., revised). Washington, DC: Author. American Psychiatric Association. (1994). Diagnostic and statistical manual of mental disorders (4th ed.). Washington, DC: Author. Arrindell, W. A. (1993). The fear of fear concept: Evidence in favor of multidimensionality. Behaviour Research and Therapy, 31, 507-518. Asmundson, G. J. G. & Norton, G. R. (1993). Anxiety sensitivity and its relationship to spontaneous and cued panic attacks in college students. Behaviour Research and Therapy, 31,199-201.
Asmundson, G. J. G. & Norton, G. R. (1995). Anxiety sensitivity in patients with
physically unexplained chronic back pain: A preliminary report. Behaviour Research and Therapy, 33, 771-777.
Asmundson, G. J. G., Norton, P. J., & Veleso, F. (1999). Anxiety sensitivity and fear of pain in patients with recurring headaches. Behaviour Research and Therapy, 37, 703- 713.
Asmundson, G. J., Norton, G. R., Wilson, K. G., & Sandler, L. S. (1994). Subjective symptoms and cardiac reactivity to brief hyperventilation in individuals with high anxiety sensitivity. Behaviour Research and Therapy, 32, 237-241.
Asmundson, G. J. G. & Stein, M. B. (1994). Selective processing of social threat in patients with generalized social phobia: Evaluation using a dot-probe paradigm. Journal of Anxiety Disorders, 8, 107-117.
Avis, H. (1999). Drugs and life (4th ed.). Boston: McGraw-Hill Companies, Inc. Ayvaşık. B. H. (2000). Kaygı Duyarlılığı İndeksi: Geçerlik ve güvenilirlik çalışması. Türk Psikoloji Degisi, 15 (46), 43-57. Ayvaşık, B. H. & Tutarel-Kışlak (2004). Factor sructure and reliability of the Anxiety Sensitivity Profile in a Turkish sample. European Journal of Psychological Assessment, 20, 358-367.

137
Babor, T. F., De la Fuente, J. R., Saunders, J. B., Grant, M. (1989). AUDIT- The alcohol use disorders identification test: Guidelines for use in primary health care. Geneva: World Health Organization, Division of Mental Health.
Babor, T. F., Higgins- Biddle, J. C., Saunders, J. B., & Monterio, M. G. (2001). AUDIT The Alcohol Use Disorders IdentificationTest: Guidelines for Use in Primary Care (2nded.). WHO/MSD/MSB/01 Ga, Geneva: World Health Organization.
Ball, S. G., Otto, M. W., Pollack, M. H., Uccello, R., & Rosenbaum, J. F. (1995).
Differentiating socail phpbia and panic disorder: A test of core beliefs. Cognitive Therapy and Research, 19, 473-482.
Berkowitz, A. D. & Perkins, H. W. (1986). Recent research on gender differences in collegiate alcohol use. Journal of American College Health, 36, 123-129.
Blais, M. A., Otto, M. W., Zucker, B. G., McNally, R. J., Schmidt, N. B., Fava, M., & Pollack, M. H. (2001). The Anxiety Sensitivity Index: Item analysis and suggestions for refinement. Journal of Personality Assessment, 77, 272-294.
Brennan, A.F., Walfish, S., & AuBuchon, P. (1986a). Alcohol use and abuse in college students. I. A review of the individual and personality correlates. The International Journal of the Addictions, 21, 449-474.
Brown, R.A., Kahler, C.W., Zvolensky, M. J., Lejuez, C.W., & Ramsey, S. E. (2001). Anxiety sensitivity: relationship to negative affect smoking and smoking cessation in smokers with past major depressive disorder. Addictive Behaviours, 26, 887-899.
Bruce, T. J. (1996). Predictors of aprazolam discontinuation with and without cognitive
behaviour therapy in panic disorder: Reply to Fava (1996). American Journal of Psychiatry, 153, 1109-1110.
Carey, K. B. & Carey, M. P. (1995). Reasons for drinking among psychiatric
outpatients: Relationship to drinking patterns. Psychology of Addictive Behaviors, 9(4), 251-257.
Carey, K. B. & Correia, C. J. (1997). Drinking motives predict alcohol related problems in college students. Journal of Studies on Alcohol, 58, 100-105. Carpenter, K. M. & Hasin, D. (1998a). A prospective evaluation of the relationship
between reasons for drinking and DSM-IV alcohol-use disorders. Addictive Behaviors, 23(1), 41-46.
Carpenter, K. M. & Hasin, D. (1998b). Reasons for drinking alcohol: Relationships
with DSM-IV alcohol diagnoses and alcohol consumption in a Community Sample. Psychology of Addictive Behaviors, 12(3), 168-184.

138
Carpenter, K. M. & Hasin, D. (1999). Drinking to cope with negative affect and DSM-IV alcohol use disorders: A test of three alternative explanations. Journal of Studies on Alcohol, 60, 694-704.
Carrigan, G., Samoluk, S. B., & Stewart, S. H. (1998). Examination of the short form of
the Inventory of Drinking Situations (IDS-42) in a young adult university student sample. Behaviour Research and Therapy, 36, 789-807.
Catanzaro, S. J. (1993). Mood regulation expectancies, anxiety sensitivity and emotional disorders. Journal of Abnormal Psychology, 102, 327-330.
Chorpita, B. F. & Daleiden, E. L. (2000). Properties of the Childhood Anxiety Sensitivity Index in children with anxiety disorders: Autonomic and nonautonomic factors. Behavior Therapy, 31, 327-349.
Cintron, J. A., Carter, M. M., Suchday, S., Sbrocco, T., & Gray, J. (2005). Factor
structure and construct validity of the Anxiety Sensitivity Index among island Puerto Ricans. Journal of Anxiety Disorders, 19 (1), 51-68.
Comeau, N., Stewart, S. H., & Loba, P. (2001). The relations of trait anxiety, anxiety sensitivity, and sensation seeking to adolescents’ motivations for alcohol, cigarette, and marijuana use. Addictive Behaviours, 26, 803-825.
Conrod, P., Stewart, S. H., & Pihl, R. O. (1997). Validation of a measure of excessive
drinking frequency. Substance Use and Misuse, 32, 587-607. Conrod, P. J., Pihl, R. O., & Vassileva, J. (1998). Differential sensitivity to alcohol reinforcement in groups of men at risk for distinct alcoholic syndromes. Alcoholism: Clinical and Experimental Research, 22 (3), 585-597. Cooper, M. L. (1994). Motivations for alcohol use among adolescents: Development
and validation of a four factor model. Psychological Assessment, 6, 117-128. Cooper, M. L., Agocha, V. B., & Sheldon, M. S. (2000). A motivational perspective on
risky behaviors: The role of personality and affect regulatory processes. Journal of Personality, 68(6), 1058-1088.
Cooper, M. L., Russell, M., Frone, M.R., & Mudar, P. (1995). Drinking to regulate
positive and negative emotions: A motivational model of alcohol use. Journal of Personality and Social Psychology, 69, 990-1005.
Cooper, M. L., Russell, M., & George, W. H. (1988). Coping, expectancies, and alcohol
abuse: A test of social learning formulations. Journal of Abnormal Psychology, 97, 218-230.

139
Cooper, M.L., Russell, M., Skinner, J. B., & Windle, M. (1992). Development and validation of a three-dimensional measure of drinking motives. Psychological Assessment, 4, 123-132.
Cox, B. J. (1996). The nature and assessment of catastrophic thoughts in panic disorder.
Behaviour Research and Therapy, 34, 363-374. Cox, B. J., Borger, S. C. , Taylor, S., Fuentes, K., Ross, L. M. (1999). Anxiety
sensitivity and the five-factor model of personality. Behaviour Research and Therapy, 37, 633-641.
Cox, B. J., Endler, N. S., Norton, G. R., & Swinson, R. P. (1991). Anxiety sensitivity
and nonclinical panic attacks. Behaviour Research and Therapy, 29, 367-369. Cox, B. J., Endler, N. S. & Swinson, R. P. (1991). Clinical and nonclinical panic
attacks: An empirical test of a panic anxiety continuum. Journal of Anxiety Disorders, 5, 21-34.
Cox, W. M. & Klinger, E. (1988). A motivational model of alcohol use. Journal of
Abnormal Psychology, 97, 168-180. Cox, B. J., Norton, G. R., Swinson, R. P., & Endler, N. S. (1990). Substance abuse and
panic-related anxiety: A critical review. Behaviour Research and Therapy, 28, 385-393.
Cox, B. J., Parker, J. A., & Swinson, R. P. (1996). Anxiety sensitivity: Confirmatory
evidence for a multidimensional construct. Behaviour Research and Therapy, 34, 591-598.
Cox, W. M., Schippers, G. M., & Klinger, E. (2002). Motivational structure and alcohol
use of university syudents across four nations. Journal of Studies on Alcohol, 63, 280-285.
Cox, B. J., Swinson, R. P., Shulman, I. D., Kuch, K., & Reichman, J. T. (1993). Gender
effects and alcohol use in panic disorder with agoraphobia. Behaviour Research and Therapy, 31, 413-416.
Çakıroğlu, T. M. (1998). Balıkesir Üniversitesi’ne devam eden öğrencilerin alkol ve
sigara kullanım durumları ve bunu etkileyen faktörlerin incelenmesi. Unpublished master’s thesis, Ankara University, Ankara, Turkey.
Deacon, B. J., Abramowitz, J. S., Woods, C. M., & Tolin, D. F. (2003). The Anxiety
Sensitivity Index-Revised: Psychometric properties and factor structure in two nonclinical samples. Behviour Research and Therapy, 41, 1427-1449.
140
DeHaas, R. A., Clamari, J. E., Bair, J. P., & Martin, E. D. (2001). Anxiety sensitivity and drug or alcohol use in individuals with anxiety and substance use disorders. Addictive Behaviours, 26, 787-801.
DeHaas, R. A., Clamari, J. E., & Bair, J. P. (2002). Anxiety sensitivity and the
situational antecedents to drug and alcohol use: An evaluation of anxiety patients with substance use disorders. Cognitive Therapy and Research, 26(3), 335-353.
Delikaya, H. (1999). Ankara şehir merkezinde bulunan beş lise öğrencilerinin sigara ve
alkollü içki kullanma durumları. Unpublihed Master Thesis, Gazi University, Sağlık Bilimleri Enstitüsü Kazaların Demografisi ve Epidemiolojisi Anabilim Dalı, Ankara, Turkey.
Donnell, C. D. & McNally, R. J. (1989). Anxiety sensitivity and history of panic as
predictors of response to hyperventilation. Behaviour Research and Therapy, 27, 325-332.
Donnell, C. D. & McNally, R. J. (1990). Anxiety sensitivity and panic attacks in a
nonclinical population. Behaviour Research and Therapy, 28(1), 83-85. Dorward, J. (1990). Cognitive phenomena associated with panic and nonpanic anxiety
in a student sample. Canadian Psychology, 31, 317. Dur, Y. C. (1994). Bilkent Üniversitesi öğrencilerinin alkol kullanım özellikleri ve alkol
kullanımını etkileyen bireysel ve psikososyal faktörler. Yayınlanmamış Yüksek Lisans Tezi, Hacettepe Üniversitesi Sağlık Bilimleri Enstitüsü, Ankara.
Durmuş-Sandler, G. D. (2001). Anxiety Sensitivity in Panic Attack. Unpublished
master’s thesis, Bogazici University, Istanbul, Turkey.
Ehlers, A. (1995). A one year prospective study of panic attacks: Clinical course and factors associated with maintenance. Journal of Abnormal Psychology, 104, 164-172.
Farber, P. D., Khavari, K. A., & Doglas, F. M. (1980). A factor analytic study of
reasons for drinking: Emprirical validation of positive and negative reinforcement dimensions. Journal of Consulting and Clinical Psychology, 48, 780-781.
Farrell, M., Howes, S., Bebbington, P. et al. (2001). Nicotine, alcohol and drug
dependence and psychiatric comorbidity. Results of a national household survey. British Journal of Psyhiatry, 179, 432-437.
For primary health care workers: Scoring of the Alcohol Use Disorders Identification Test – AUDIT. (n.d.). Retrieved April 14, 2006, from http://www.prodigy.nhs.uk/ProdigyKnowledge/PatientInformation/Content/pils/plaudit.htm

141
Forsyth, J. P., Eifert, G. H., & Thompson, R. N. (1996). Systemic alarms in fear conditioning II: An experimental methodology using 20%carbondioxide inhalation as an unconditioned stimulus. Behaviour Therapy, 27, 391-415.
Forsyth, J. P., Palav, A., & Duff, K. (1999). The absence of relation between anxiety
sensitivity and fear conditioning using 20% versus 13% CO2-enriched air as unconditioned stimuli. Behaviour Research and Therapy, 37, 143-153.
Forsyth, J. P., Parker, J. D., & Finlay, C. G. (2003). Anxiety sensitivity, controllability,
and experiential avoidance and their relation to drug of choice and addiction severity in a residential sample of substance-abusing veterans. Addictive Behaviours, 28, 851-870.
Galen, L. W., Henderson, M. J., & Coovert, M. D. (2001). Alcohol expectancies and
motives in a substance abusing male treatment sample. Drug and Alcohol Dependence, 62, 205-214.
Gender and women’s mental heath. (n.d.). Retrieved November 28, 2005, from
http://www.who.int/mental_health/prevention/genderwomen/en/ Gire, J. T. (2002). A cross-national study of motives for drinking alcohol. Substance
Use and Misuse, 37(2), 215-223. Goldstein, A. J. & Chambless, D. L. (1978). A re-analysis of agoraphobia. Behaviour
Therapy, 9, 47-59. Himle, J. A. & Hill, E. M. (1991). Alcohol abuse and the anxiety disorders: Evidence
from the Epidemiologic Catchment Area survey. Journal of Anxiety Disorders, 5, 237-245.
Hisli, N. (1988). Beck Depresyon Envanteri’nin geçerliliği üzerine bir çalışma.
Psikoloji Dergisi, 6(22), 118-122.
Kairouz, S., Gliksman, L., Demers, A., & Adlaf, E. M. (2002). For all the reasons, I do … drink : A multilevel analysis of contextual reasons for drinking among Canadian undergraduates. Journal of Studies on Alcohol, 63 (5), 600-609.
Karp, J. (1993). The interaction of alcohol expectancies, personality and
psychopathology among inpatient alcoholics [summary]. Dissertation Abstracts International, 53, 4375-4378.
Kassel, J. D., Jackson, S. L., & Unrod, M. (2000). Generalized exoectancies for
negative mood regulation and problem drinking among college students. Journal of Studies on Alcohol, 61, 332-340.
Kenardy, J. Evans, L., & Oei, T. P. S. (1992). The latent structure of anxiety symptoms
in anxiety disorders. American Journal of Psychiatry, 149, 1058-1061.

142
Klein, H. (1992). Self-reported reasons why college students drink. Journal of Alcohol and Drug Education, 37, 14-28.
Koven, N. S., Heller, W., & Miller, G. A. (2005). The unique relationship between fear
of cognitive dyscontrol and self-reports of problematic drinking. Addictive Behaviours, 30, 489-499.
Kuntsche, E., Knibbe, R., Gmel, G., & Engels, R. (in press). Who drinks and why? A
review of socio-demographic, personality, and contextual issues behind the drinking motives in young people. Addictive Behaviors.
Kuntsche, E., Knibbe, R., Gmel, G., & Engels, R. (2005). Why do young people drink?
A review of drinking motives. Clinical Psychology Review, 25, 841-861. Kushner, M. G., Thuras, P., Abrams, K., Brekke, M., & Stritar, L. (2001). Anxiety
mediates the association between anxiety sensitivity and coping-related drinking motives in alcoholism treatment patients. Addictive Behaviours, 26, 869-885.
Kushner, M. G., Sher, K. J., & Beitman, B. D. (1990). The relation between alcohol
problems and the anxiety disorders. American Journal of Psychiatry, 147, 685-695. Lawyer, S. R., Karg, R. S., Murphy, J. G., & McGlynn, F. D. (2002). Heavy drinking
among college students is influenced by anxiety sensitivity, gender, and context for alcohol use. Journal of Anxiety Disorders, 16, 165-173.
Lilienfeld, S. O. (1996). Anxiety sensitivity is not distinct from trait anxiety. In R. M.
Rapee, Current controversies in the anxiety disorders (pp. 214-227). New York: The Guilford Press.
Lilienfeld, S. O. (1997). The relation of anxiety sensitivity to higher and lower order
personality dimensions: implications for the etiology of panic attacks. Journal of Abnormal Psychology, 106, 539-544.
Lilienfeld, S. O., Jacob, R. G., & Turner, S. M. (1989). Comment on Holloway and
McNally’s (1987) “Effects of anxiety sensitivity on the response to hyperventilation.” Journal of Abnormal Psychology, 98, 100-102.
Lilienfeld, S. O., Turner, S. M., & Jacob, R. G. (1993). Anxiety sensitivity: An
examination of theoretical and methodological issues. Advances in Behaviour Research and Therapy, 15, 147-182.
Lilienfeld, S. O., Turner, S. M., & Jacob, R. G. (1996). Further comments on the nature
and measurement of anxiety sensitivity: A reply to Taylor. Journal of Anxiety Disorders, 10, 411-424.
Lo, C. (1995). Gender differences in collegiate alcohol use. Journal of Drug Issues, 25,
817-836.

143
MacDonald, A. B., Baker, J. M., Stewart, S. H., & Skinner, M. (2000). Effects of alcohol on the response to hyperventilation of participants high and low in anxiety sensitivity. Alcoholism: Clinical and experimental Research, 24, 1656-1665.
Maclean, M. G. & Lecci, L. (2000). A comparison of models of drinking motives in a
university sample. Psychology of Addictive Behaviours, 14, (1), 83-87. MacPherson, P. S. R., Stewart, S. H., & McWilliams, L. A. (2001). Parental problem
drinking and anxiety disorder symptoms in adult offspring: Examining the mediating role of anxiety sensitivity components. Addictive Behaviours, 26, 917-
934. Maier, W., Minges, J., & Lichtermann, D. (1993). Alcoholism and panic disorder: Co-
occurrence and co transmission in families. European Archives of Psychiatry and Clinical Neuroscience, 243, 205-211.
Maller, R. G. & Reiss, S. (1992). Anxiety sensitivity in 1984 and panic attacks in 1987.
Journal of Anxiety Disorders, 6, 241-247. Mangır, M., Aral, N., & Boran, G. (1992). Yurtlarda kalan üniversite öğrencilerinin
sigara ve alkol kullanımlarının incelenmesi. Ankara. Ankara Üniversitesi Ziraat Fakültesi Yayınları.
Manuzza, S., Klein, R. G., Moulton, J.L., Scarfone, N., Malloy, P., Vosburg, S.K.,
Klein, D.F. (2002). Anxiety sensitivity among children of parents with anxiety disorders: A controlled high-risk study. Journal of Anxiety Disorders, 16, 135-148.
McNally, R. J. (1989). Is anxiety sensitivity distinguishable from trait anxiety? Reply to
Lilienfield, Jacob and Turner (1989). Journal of Abnormal Psychology, 98, 193-194.
McNally, R. J. (1990). Psychological approaches to panic disorder: A review. Psychological Bulletin, 108, 403-419.
McNally, R. J. (1996). Anxiety sensitivity is distinguishable from trait anxiety. In R. M.
Rapee (Ed.), Current contoversies in the anxiety disorders, (pp. 214-244). New York: Guilford Press.
McNally, R. J. & Eke, M. (1996). Anxiety sensitivity, suffocation fear, and breath
holding duration as predictors of response to carbon dioxide challenge. Journal of Abnormal Psychology, 105, 146-149.
McNally, R. J. & Lorenz, M. (1987). Anxiety sensitivity in agoraphobics. Journal of
Behaviour Threapy and Experimental Psychiatry, 18, 3-11. McWilliams, L. A. & Asmundson, J. G. (1999). Alcohol consumption in university
women: A second look at the role of anxiety sensitivity. Depression and anxiety, 10, 125-128.

144
McWilliams, L. A. & Asmundson, J. G. (2001). Is there a negative association between anxiety sensitivity and arousal-increasing substances and activities? Journal of Anxiety Disorders, 15, 161-170.
McWilliams, L. A., Stewart, S. H., & MacPherson, P. S. R. (2000). Does the social
concerns component of the Anxiety Sensitivity Index belong to the domain of anxiety sensitivity or the domain of negative evaluation sensitivity? Behaviour Research and Therapy, 38, 985-992.
Merill, K. A. (2000). Effects of anxiety and anxiety sensitivity on alcohol use in females.
Unpublished doctoral dissertation, Indiana University, United States. Messenger, C. & Shean, G. (1998). The effects of anxiety sensitivity and history of
panic on reactions to stressors in a nonclinical sample. Journal of Behaviour Therapy and Experimental Psychiatry, 29 (4), 279-288.
Mohlman, J. & Zinbarg, R. (2000). “What kind of attention is necessary for fear
reduction? An empirical test of the emotional processing model.” Behavior Therapy, 31, 113-133.
Mohr, C. D., Armeli, S., Tennen, H., Temple, M., Todd, M., Clark, J. & Carney, M. A.
(2005). Psychology of Addictive Behaviors, 19(4), 392-403. Muris, P. (2002). An expanded childhood anxiety sensitivity index: its factor structure,
reliability, and validity in a non-clinical adolescents sample. Behaviour Research and Therapy, 40, 299-311.
Muris, P., Schmidt, H., Merckelbach, H., & Schouten, E. (2001). Anxiety sensitivity in adolescents: factor structure and relationships to trait anxiety and symptoms of anxiety disorders and depression. Behaviour Research and Therapy, 39, 89-100.
Norton, G. R., Rockman, G. E., Ediger, J., Peper, C., Goldberg, S., Cox, B. J., &
Asmundson, G. J. G. (1997). Anxiety sensitivity and drug choice in individuals seeking treatment for substance abuse. Behaviour Research and Therapy, 35, 859-862.
Novak, A., Burgess, E. S., Clark, M., Zvolensky, M., & Brown, R. A. (2003). Anxiety
sensitivity, self-reported motives for alcohol and nicotine use and level of consumption. Journal of Anxiety Disorders, 17, 165-180.
O’Haare, T. & Sherrer, M. V. (1999). Validating the Alcohol Use Disorders
Identification Test with college first-offenders. Journal of Substance Abuse Treatment, 17, 113-119.

145
Otto, M. W., Pollack, M. H., Fava, M., Uccello, R., & Rosenbaum, J. F. (1995). Elevated Anxiety Sensitivity Index scores in patients with major depression: Correlates and changes with anti depressant treatment. Journal of Anxiety Disorders, 9 (2), 117-123.
Öner, N., & Le Compte, A. (1985). Durumluluk- Sürekli Kaygı Envanteri elkitabı. İstanbul Boğaziçi Üniversitesi Yayınları.
Özer, Ö. A., Eradamlar, N., Karamustafalıoğlu, K. O., Alpkan, R., & Beyazyürek, M.
(1990). Alkol bağımlılığı ve yüksek öğretimde psikososyal faktörler. Düşünen Adam Dergisi, 3 (3), 65-69.
Park, C. L. & Levenson, M. R. (2002). Drinking to cope among college students:
Prevalence, problems and coping process. Journal of Studies on Alcohol, 63, 486-498.
Perkins, H. W. (2002). Social norms and the prevention of alcohol misuse in collegiate
contexts. Journal of Studies on Alcohol (Suppl. 14), 164-172.
Peterson, R. A., & Heilbronner, R.L. (1987). The Anxiety Sensitivity Index: construct validity and factor analytic structure. Journal of Anxiety Disorders, 1, 117-121.
Peterson, R. A. & Plehn, K. (1999). Measuring anxiety sensitivity. In: S. Taylor (Ed.),
Anxiety sensitivity: theory, research and treatment of the fear of anxiety (pp. 61-81). Mahwah, NJ: Erlbaum.
Peterson, R. A. & Reiss, S. (1992). Anxiety sensitivity index manual (2nd ed.).
Worthington, OH: International Diagnostic Systems. Pollack, M. H., Otto, M. W., Rosenbaum, J. F., Sachs, G. S., O’Neil, C., Asher, R., &
Meltzer-Brody, S. (1990). Longitudinal course of panic disorder: Findings from the Massachusetts General Hospital Naturalistic Study. Journal of Clinical Psychiatry, 51, 12-26.
Rabian, B., Peterson, R. A., Richters, J., & Jensen, P. S. (1993). Anxiety sensitivity
among anxious children. Journal of Clinical Child Psychology, 22, 441-446. Rachman, S. & Lopatka, C. (1986). Match And mismatch in the prediction of fear-1.
Behaviour Research and Therapy, 24, 387-393.
Rapee, R. M., Brown, T. A., Anthony, M. M., & Barlow, D. H. (1992). Response to hyperventilation and inhalation of 5.5.% carbon dioxide-enriched air across the DSM-III-R anxiety disorders. Journal of Abnormal Psychology, 3, 538-552.
Rapee, R. M. & Medero, L. (1994). Fear of sensations and trait anxiety as mediators of
the response to hyperventilation in nonclinical subjects. Journal of Abnormal Psychology, 103, 693-699.

146
Read, J. P., Wood, M. D., Kahler, C. W., Maddock, J. E., & Palfai, T. P. (2003). Examining the role of drinking motives in college student alcohol use and problems. Psychology of Addictive Behaviors, 17(1), 13-23.
Reiss, S. (1991). Expectancy model of fear, anxiety, and panic. Clinical Psychology
Review, 11, 141-153. Reiss, S. (1997). Trait anxiety: it is not what you think it is. Journal of Anxiety
Disorders, 11, 201-214. Reiss, S. & McNally, R. J. (1985). Expectancy model of fear. In S. Reiss & R. R.
Bootzin (Eds.), Theoretical issues in behavior therapy, (pp. 107-121) San Diego, CA: Academic Press.
Reiss, S., Peterson, R.A., Gursky, D. M., & McNally, R.J. (1986). Anxiety sensitivity,
anxiety frequency, and the prediction of fearfulness. Behaviour Research and Therapy, 24, 1-8.
Saatçioğlu, Ö., Evren, C., & Çakmak, D. (2002). Alkol kullanım bozuklukları tanıma
testinin geçerliği ve güvenilirliği. Türkiye’de Psikiyatri, 4 (2-3), 107-113. Sadava, S. W. & Pak, A. W. (1993). Stress-related problem drinking and alcohol
problems: A longitudinal study and extension of Marlatt’s model. Canadian Journal of Behavioural Science, 25, 446-464.
Samoluk, S. B. & Stewart, S. H. (1998). Anxiety sensitivity and situation-specific
drinking. Journal of Anxiety Disorders, 12, 407-419.
Samoluk, S. B., Stewart, S. H., Sweet, S., & MacDonald, A.B. (1999). Anxiety sensitivity and social affiliation as determinants of alcohol consumption. Behaviour Therapy, 30, 285-303.
Sandin, B., Chorot, P., & McNally, R. J. (1996). Validation of the Spanish version of
the Anxiety Sensitivity Index in a clinical sample. Behaviour Research and Therapy, 34 (3), 283-290.
Sandin, B., Chorot, P., & McNally, R. J. (2001). Anxiety Sensitivity Index: Normative
data and its differentiation from trait anxiety. Behaviour Research and Therapy, 39, 213-219.
Savaşır, I. & Şahin, N. H.. (Eds.). (1997). Bilişsel-davranışçı terapilerde
değerlendirme: Sık kullanılan ölçekler. Ankara: Türk Psikologlar Derneği. Shear, M. K., Pilkonis, P. A., Cloitre, M., & Leon, A. C. (1994). Cognitive behavioural
treatment compared to nonprescriptive treatment for panic disorder. Archives of General Psychiatry, 51, 395-401.

147
Scher, C. S. & Stein, M. B. (2003). Developmental antecedents of anxiety sensitivity. Journal of Anxiety Disorders, 17, 253-269.
Schmidt, N. B. & Joiner, T. E. (2002). Structure of the Anxiety Sensitivity Index
psychometrics and factor structure in a community sample. Journal of Anxiety Disorders, 16, 33-49.
Schmidt, N. B., Lerew, D. R., & Jackson, R. J. (1997). The role of anxiety sensitivity in
the pathogenesis of panic: Prospective evaluation of spontaneous panic attacks during acute stress. Journal of Abnormal Psychology, 106, 355-364.
Schmidt, N. B., Lerew, D. R., & Jackson, R. J. (1999). Prospective evaluation of
anxiety sensitivity in the pathogenesis of panic: replication and extension. Journal of Abnormal Psychology, 108, 532-537.
Selzer, M. L. & Barton, E. (1977). The drunken driver: A psychosocial study. Drug and
Alcohol Dependence, 2(4), 239-253.
Shipheard, J. C., Beck, J. G., & Ohtake, P.J. (2001). Relationships between the anxiety sensitivity index, the suffocation fear scale, and responses to CO2 inhalation. Journal of Anxiety Disorders, 15 (3), 247-258.
Silverman, W. K., Fleisig, W., Rabian, B., & Peterson, R. A. (1991). Childhood
Anxiety Sensitivity Index. Journal of Clinical Child Psychology, 20, 162-168. Silverman, W. K., Ginsburg, G. S., & Goedhart, A. W. (1999). Factor structure of the
childhood anxiety sensitivity index. Behaviour Research and Therapy, 37 (9), 903-917.
Simons, J., Correia, C. J., & Carey, K. B. (2000). A comparison of motives for
marijuana and alcohol use among experienced users. Addictive Behaviors, 25, 153-160.
Stein, M. B., Jang, K. L., & Livesley, W. J. (1999). Heritability of anxiety sensitivity: A
twin study. American Journal of Psychiatry, 156, 246-251. Stewart, S. H. (1993). Anxiety sensitivity and risk for alcohol abuse in young adult
females [summary]. Dissertation Abstracts International, 55(10), 4615-5098.
Stewart, S. H. (1995). Anxiety Sensitivity and risk for alcohol abuse in young adult females [Summary]. Dissertation Abstracts International, 55, 4615-B.
Stewart, S. H., Conrod, P. J., Gignac, M. L., & Pihl, R. O. (1998). Selective processing
biases in anxiety-sensitive men and women. Cognition and Emotion, 12 (1), 105-133.

148
Stewart, H. S. & Devine, H. (2000). Relationship between personality and drinking motives in young adults. Personality and Individual Differences, 29, 495-511.
Stewart, S. H. Karp, J., Pihl, R. O., & Peterson, R. (1997). Anxiety sensitivity and self-
reported reasons for drug use. Journal of Substance Abuse, 9, 223-240. Stewart, S. H., Knize, K., & Pihl, R. O. (1992). Anxiety sensitivity and dependency in
clinical and nonclinical panickers and controls. Journal of Anxiety Disorders, 6, 119-131.
Stewart, S. H., Peterson, J. B., & Pihl, R. O. (1995). Anxiety sensitivity and self-
reported alcohol consumption rates in university women. Journal of Anxiety Disorders, 9, 283-292.
Stewart, S. H. & Pihl, R. O. (1994). Effects of alcohol administration on
psychophysiological and subjective-emotional responses to aversive stimulation in anxiety sensitive women. Psychology of Addictive Behaviour, 8, 29-42.
Stewart, S. H., Samoluk, S. B., & MacDonald, R. B. (1999). Anxiety sensitivity and substance abuse. In: S. Taylor (Ed.), Anxiety sensitivity: theory, research and the treatment of the fear of anxiety (pp. 287-319). Mahvah, NJ: Lawrence Erlbaum Associates, Publishers. Stewart, S. H., Taylor, S., & Baker, J. M. (1997). Gender differences in dimensions of anxiety sensitivity. Journal of Anxiety Disorders, 11, 179-200. Stewart, S. H., Taylor, S., Jang, K. L., Cox, B. J., Watt, M. C., Fedoroff, I. C., & Borger, S. C. (2001). Causal modeling of relations among learning history, anxiety sensitivity and panic attacks. Behaviour Research and Therapy, 39, 443-456.
Stewart, S. H., & Zeitlin, S. B. (1995). Anxiety sensitivity and alcohol use motives. Journal of Anxiety disorders, 9, 229-240.
Stewart, S. H., Zeitlin, S. B., & Samoluk, S. B. (1996). Examination of a three-
dimensional drinking motives questionnaire in a young adult university student sample. Behaviour Research and Therapy, 34 (1), 61-71.
Stewart, S. H., Zvolensky, M. J., & Eifert, G. H. (2001). Negative-reinforcement
drinking motives mediate the relation between anxiety sensitivity and increased drinking behaviour. Personality and Individual Differences, 31, 157-171.
Tabachnick, B. G. & Fidell, L. S. (2001). Using multivariate statistics (4th ed.). Boston,
MA: Allyn & Bacon. Taylor, S. (1995a). Anxiety sensitivity.: Theoretical perspectives and recent findings.
Behaviour Research and Threapy, 33, 243-258.

149
Taylor, S. (1995b). Panic disorder and hypochondriacal concerns: Reply to Otto and Pollack (1994). Journal of Anxiety Disorders, 9, 87-88.
Taylor, S. (1996). Nature and measurement of anxiety sensitivity: Reply to Lilienfeld,
Turner and Jacob (1996). Journal of Anxiety Disorders, 10, 425-451. Taylor, S. (1998). What is anxiety sensitivity? Harvard Mental Health Letter, 16(4),
13-15. Taylor, S. (2000). Understanding and treating panic disorder. New York: Wiley.
Taylor, S., & Cox, B. J. (1998a). Anxiety sensitivity: multiple dimensions and hierarchic structure. Behaviour Research and Therapy, 36, 37-51.
Taylor, S., & Cox, B. J. (1998b). An expanded anxiety sensitivity index: evidence for a hierarchic structure in a clinical sample. Journal of Anxiety Disorders, 12, 463-484. Taylor, S., Koch, W. J., & Crockett, D. J. (1991). Anxiety sensitivity, trait anxiety, and the anxiety disorders. Journal of Anxiety Disorders, 5, 293-311.
Taylor, S., Koch, W. J., & McNally, R. J. (1992). How does anxiety sensitivity vary across the anxiety disorders? Journal of Anxiety Disorders, 7, 249-259.
Taylor, S., Koch, W. J., McNally, R. J., & Crockett, D. J. (1992). Conceptualizations of
anxiety sensitivity. Psychological Assessment, 4 (2), 245-250. Taylor, S., Koch, W. J., Woody, S., & McLean, P. (1996). Anxiety sensitivity and
depression: how are they related? Journal of Abnormal Psychology, 105, 474-479. Telch, M. J., Lucas, J. A., & Nelson, P. (1989b). Nonclinical panic in college students:
An investigation of prevalence and symptomatology. Journal of Abnormal Psychology, 98, 300-306.
Telch, M. J., Lucas, J. A., Schmidt, N. B., Hanna, H. H., Jaimez, T. L., & Lucas, R.
(1993). Group cognitive-behavioural treatment of panic disorder. Behaviour Research and Therapy, 31, 279-287.
Telch, M. J., Shermis, M. D., & Lucas, J. A. (1989a). Anxiety Sensitivity: Unitary
Personality trait or domain-specific appraisals? Journal of Anxiety Disorders, 3, 25-32.
Thombs, D. L., Beck, K. H., & Mahoney, C. A. (1993a). Effects of social contexts and
gender on drinking patterns of young adults. Journal of Counseling Psychology, 40, 115-119.
150
Thombs, D. L., Beck, K. H., & Pleace, D. J. (1993b). The relationship of social context and expectancy factors to alcohol use intensity among 18 to 22 year-olds. Addiction Research, 1, 59-68.
Topuz, A. (2004). Boğaziçi Üniversitesi öğrencileri ve alkol: neden, nasıl ve ne kadar kullanıyorlar? Unpublished master’s thesis, Bogazici University, Istanbul, Turkey.
Tot, Ş., Yazıcı, A., Erdem, P., Bal, N., Metin, Ö., & Çamdeviren, H. (2002). Mersin
Üniversitesi öğrencilerinde sigara ve alkol kullanım yaygınlığı ve ilişkili özellikler. Anadolu Psikiyatri Dergisi, 3, 227-231.
Uslanmaz, S. (1993). Ankara şehir merkezindeki lise öğrencilerinin sigara ve alkol kullanımının araştırılması. Çocuk Sağlığı ve Eğitim Programı Uzmanlık Tezi. Hacettepe Üniversitesi, Sağlık Bilimleri Enstitüsü, Ankara. Van Beek, N. & Griez, E. (2003). Anxiety sensitivity in first-degree relatives of patients with panic disorder. Behaviour Research and Therapy, 41, 949-957. Van Beek, Perna, G., Schruers, K., Muris, P., & Griez, E. (2005). Anxiety sensitivity in children of panic disorder patients. Child Psychiatry and Human Development, 35 (4), 315-322. Volk, R. J., Steinbauer, J. R., Cantor, S. B., & Holzer, C. E. (1997). The Alcohol Use Disorders Identification Test (AUDIT) as a screen for at-risk drinking in primary care patients of different racial/ethnic backgrounds. Addiction, 92 (2), 197-206.
Wardle, J., Ahmad, T., & Hayward, P. (1990). Anxiety sensitivity in agoraphobia. Journal of Anxiety Disorders, 4, 325-333. Watt, M. C. & Stewart, S. H. (2003). The role of anxiety sensitivity components in mediating the relationship between childhood exposure to parental dyscontrol and adult anxiety symptoms. Journal of Psychopathology and Behavioural Assessment, 25 (3), 167- 176.
Watt, M. C., Stewart, S. H., & Cox, B. J. (1998). A retrospective study of the learning origins of anxiety sensitivity. Behaviour Research and Therapy, 36, 505-525.
Weems, C. F., Hammond-Laurence, K., Silverman, W. K., & Ferguson, C. (1997). The
relation between anxiety sensitivity and depression in children and adolescents referred for anxiety. Behaviour Research and Therapy, 35, 961-966.
Yıldız, A. (1984). Alkolizmde sosyal faktörler. Uzmanlık Tezi. Cerrahpaşa Tıp
Fakültesi Psikiyatri Anabilim Dalı, İstanbul.
Zeitlin, S. B. & McNally, R. J. (1993). Alexithymia and anxiety sensitivity in panic disorder and obsessive-compulsive disorder. American Journal of Psychiatry, 150, 658-660.
151
Zinbarg, R. E. & Barlow, D. H. (1996). Structure of anxiety and the anxiety disorders: A hieararchical model. Journal of Abnormal Psychology, 105, 181-193.
Zinbarg, R. E. & Barlow, D. H., & Brown, T. A. (1997). Hierarchical structure and
general factor saturation of the Anxiety Sensitivity Index: Evidence and implications. Psychological Assessment, 9, 277-284.
Zinbarg, R. E., Mohlman, J., & Hong, N. N. (1999). Dimensions of anxiety sensitivity. In: S. Taylor (Ed.), Anxiety sensitivity: theory, research, and treatment of the fear of anxiety. (pp.83-114). Mahvah, NJ: Lawrence Erlbaum Associates, Publishers.
Zvolensky, M. J., Arrindell, W. A., Taylor, S., Bouvard, M., Cox, B. J., Stewart, S. H., Sandin, B., Cardenas, S. J., & Eifert, G. H. (2003). Anxiety sensitivity in six countries. Behaviour Research and Therapy, 41, 841-859.
Zvolensky, M. J., Kotov, R., Antipova, A. V., Leen-Feldner, E.W., Schmidt, N. B.
(2005). Evaluating anxiety sensitivity, exposure to aversive life conditions, and problematic drinking in Russia: A test using an epidemiplogical sample. Addictive Behaviours, 30, 567-570.

151
APPENDICES

152
APPENDIX A
ANXIETY SENSITIVITY INDEX - REVISED (ASI-R)
YÖNERGE:
Aşağıdaki her bir madde için, ifadelerin sağ tarafında yer alan ve o maddeyle ne derece hemfikir olduğunuzu gösteren seçeneklerden sizin için uygun olanını işaretleyerek belirtiniz. İfadelerden herhangi biri ile ilgili hiçbir deneyiminiz (örneğin, daha önce hiç ürpermeyen ya da titrediğini hissetmeyen bir kişi için “Titrediğimi hissetmek beni korkutur” maddesi gibi) ya da fikriniz yok ise, böyle bir yaşantınız olmuş olsaydı nasıl hissedeceğinizi düşünerek cevap veriniz. Diğer maddeleri kendi deneyimlerinizi /yaşantılarınızı temel alarak yanıtlayınız. Her madde için sadece bir seçeneği işaretleyiniz ve lütfen tüm maddelere cevap veriniz.
Çok
az
Az
Bira
z
Old
ukça
Çok
fa
zla
1- Kaygılı/endişeli görünmemek benim için
önemlidir
2- Bir şeye (örn., iş, konu) kendimi veremediğim
zaman, aklımı kaçırıyorum diye endişelenirim.
3- Ürperdiğimi (titrediğimi) hissetmek beni korkutur.
4- Bayılacağımı hissetmek beni korkutur.
5- Kalbimin çok hızlı atması beni korkutur.
6- Midemin bulanması beni korkutur.
7- Kalbimin çok hızlı çarptığnı fark ettiğimde, kalp
krizi geçirebilirim diye endişelenirim.
8- Nefesimin daralması beni korkutur.
9- Midem rahatsız olduğunda, ciddi bir hastalığım
olabilir diye endişelenirim.
10- Kendimi bir işe/konuya verememek beni
korkutur.
11- Başım uğuldadığında, felç geçirebilirim diye
endişelenirim.
12- Başkalarının yanında titrediğimde, insanlar
benim hakkımda ne düşünecek diye korkarım.
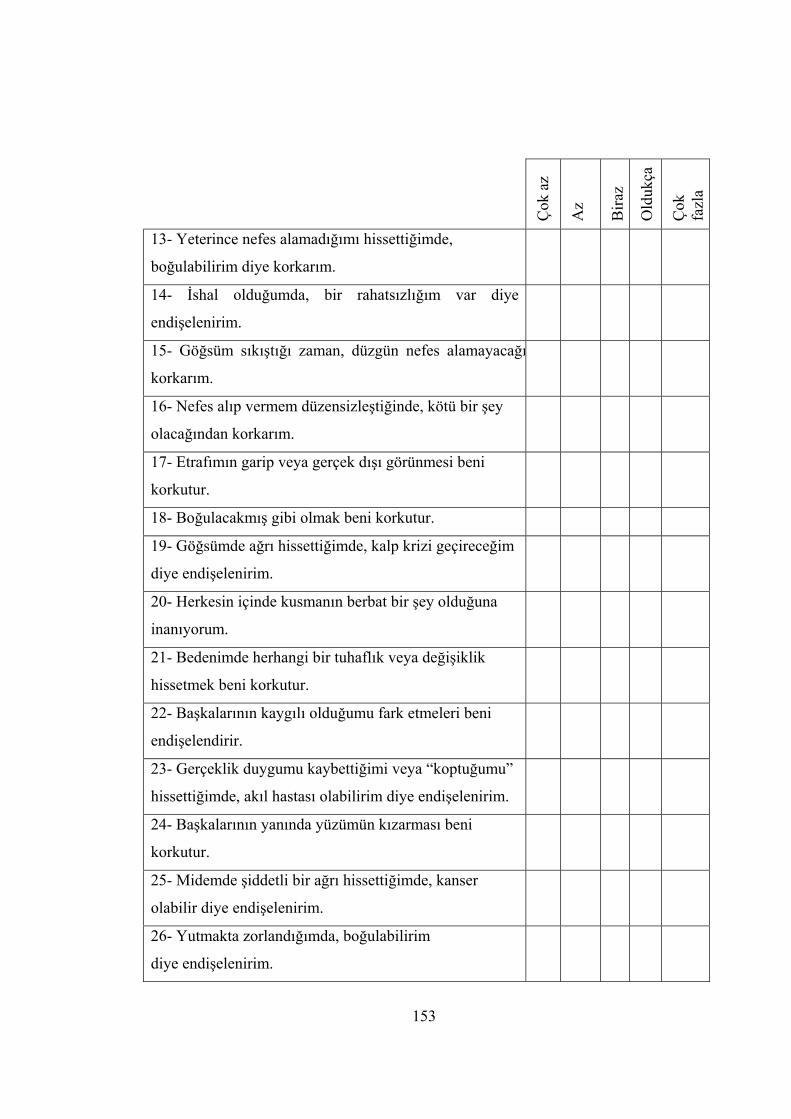
Çok
az
Az
Bira
z
Old
ukça
Çok
fa
zla
13- Yeterince nefes alamadığımı hissettiğimde,
boğulabilirim diye korkarım.
14- İshal olduğumda, bir rahatsızlığım var diye
endişelenirim.
15- Göğsüm sıkıştığı zaman, düzgün nefes alamayacağı
korkarım.
16- Nefes alıp vermem düzensizleştiğinde, kötü bir şey
olacağından korkarım.
17- Etrafımın garip veya gerçek dışı görünmesi beni
korkutur.
18- Boğulacakmış gibi olmak beni korkutur.
19- Göğsümde ağrı hissettiğimde, kalp krizi geçireceğim
diye endişelenirim.
20- Herkesin içinde kusmanın berbat bir şey olduğuna
inanıyorum.
21- Bedenimde herhangi bir tuhaflık veya değişiklik
hissetmek beni korkutur.
22- Başkalarının kaygılı olduğumu fark etmeleri beni
endişelendirir.
23- Gerçeklik duygumu kaybettiğimi veya “koptuğumu”
hissettiğimde, akıl hastası olabilirim diye endişelenirim.
24- Başkalarının yanında yüzümün kızarması beni
korkutur.
25- Midemde şiddetli bir ağrı hissettiğimde, kanser
olabilir diye endişelenirim.
26- Yutmakta zorlandığımda, boğulabilirim
diye endişelenirim.
153

154
Çok
az
Az
Bira
z
Old
ukça
Çok
fazl
a
27- Kalbimin teklediğinin farkına vardığımda, ciddi
bir rahatsızlığım var diye endişelenirim.
28- Ellerimin uyuşması veya karıncalanması beni
korkutur.
29- Başım döndüğünde, bir rahatsızlığım var diye
endişelenirim.
30- Sosyal bir ortamda terlemeye başladığım zaman,
insanların benim hakkımda olumsuz düşüneceğinden
korkarım.
31- Kafamda düşünceler uçuşmaya başladığında,
aklımı kaçırıyorum diye endişelenirim.
32- Boğazım düğümlendiğinde, boğulup öleceğim diye endişelenirim.
33- Yüzüm uyuştuğunda, felç geçiriyor olabilirim
diye endişelenirim.
34- Net bir şekilde düşünemediğimde, bir
rahatsızlığım var diye endişelenirim.
35-Herkesin içinde bayılmanın benim için korkunç birşey
olacağına inanıyorum
36- Zihnimi bomboş hissettiğimde, oldukça kötü bir
rahatsızlığım var diye
endişelenirim.

155
APPENDIX B
STATE-TRAIT ANXIETY INVENTORY-TRAIT FORM (STAI-T)
YÖNERGE
Aşağıda kişilerin kendilerine ait duygularını anlatmada kullandıkları bir takım ifadeler verilmiştir. Her ifadeyi okuyun, sonra da genel olarak nasıl hissettiğinizi, ifadelerin sağ tarafındaki seçeneklerden size uygun olanını işaretleyerek belirtiniz. Doğru ya da yanlış cevap yoktur. Herhangi bir ifadenin üzerinde fazla zaman sarfetmeksizin genel olarak nasıl hissettiğinizi gösteren cevabı işaretleyiniz.
Hem
en h
emen
hi
çbir
zam
an
Baz
en
Çoğ
u za
man
Hem
en h
emen
he
rzam
an
1. Genellikle keyfim yerindedir 2. Genellikle çabuk yorulurum. 3. Genellikle kolay ağlarım. 4. Başkaları kadar mutlu olmak isterim. 5. Çabuk karar veremediğim için fırsatlar kaçırırım. 6. Kendimi dinlenmiş hissederim. 7. Genellikle sakin, kendime hakim ve
soğukkanlıyımdır.
8. Güçlüklerin yenemeyeceğim kadar biriktiğini
hissederim.
9. Önemsiz şeyler hakkında endişelenirim. 10. Genellikle mutluyum. 11. Herşeyi ciddiye alır ve etkilenirim.
12. Genellikle kendime güvenim yoktur.
13. Genellikle kendimi emniyette hissederim.
14. Sıkıntılı ve güç durumlarla karşılaşmaktan
kaçınırım.
15. Genellikle kendimi hüzünlü hissederim. 16. Genellikle hayatımdan memnunum.
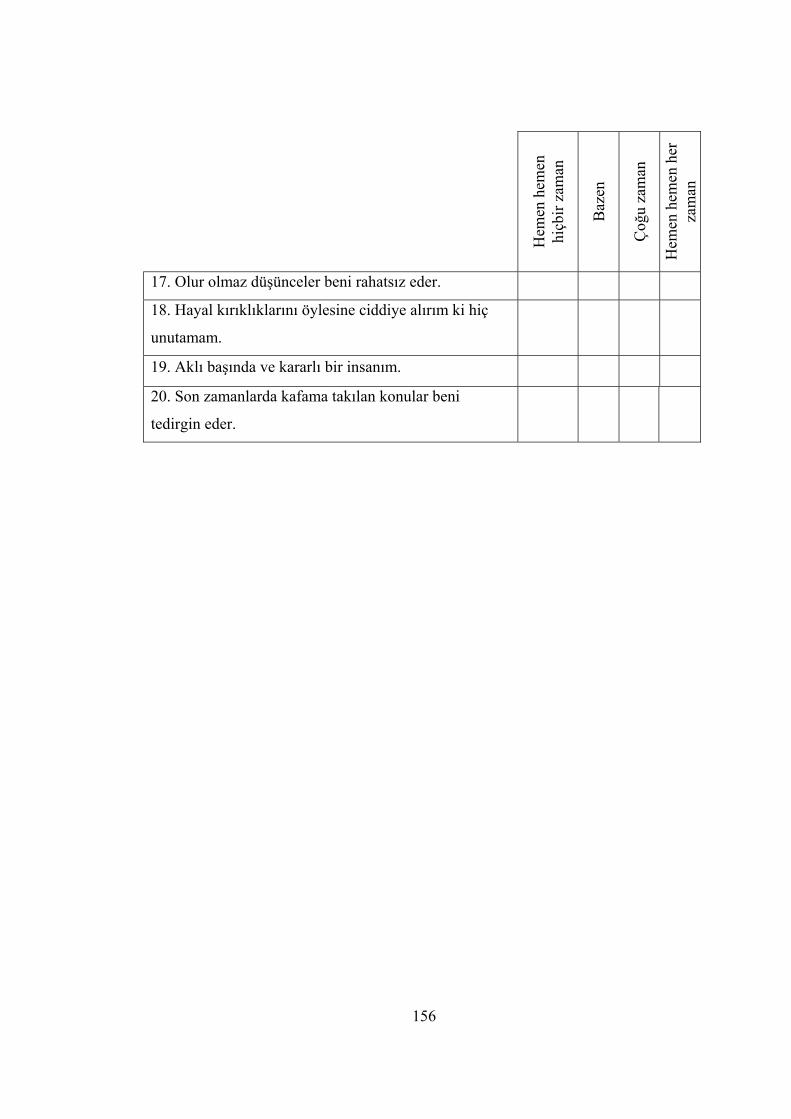
156
Hem
en h
emen
hi
çbir
zam
an
Baz
en
Çoğ
u za
man
Hem
en h
emen
her
za
man
17. Olur olmaz düşünceler beni rahatsız eder. 18. Hayal kırıklıklarını öylesine ciddiye alırım ki hiç
unutamam.
19. Aklı başında ve kararlı bir insanım. 20. Son zamanlarda kafama takılan konular beni
tedirgin eder.

157
APPENDIX C
BECK DEPRESSION INVENTORY (BDI)
YÖNERGE
Aşağıda, kişilerin ruh durumlarini ifade ederken kullandıkları bazı cümleler verilmiştir. Her madde, bir çesit ruh durumunu anlatmaktadır. Her madde için o ruh durumunun derecesini belirleyen 4 seçenek vardır. Lütfen bu seçenekleri dikkatle okuyunuz. Son bir hafta içindeki (şu an dahil) kendi ruh durumunuzu göz önünde bulundurarak, size en uygun olan ifadeyi bulunuz. Daha sonra, o maddenin yanındaki harfin üzerine (x) işareti koyunuz. 1. (a) Kendimi üzgün hissetmiyorum. (b) Kendimi üzgün hissediyorum. (c) Her zaman için üzgünüm ve kendimi bu duygudan kurtaramıyorum. (d) Öylesine üzgün ve mutsuzum ki dayanamıyorum. 2. (a) Gelecekten umutsuz değilim. (b) Geleceğe biraz umutsuz bakıyorum. (c) Gelecekten beklediğim hiçbir şey yok. (d) Benim için bir gelecek yok ve bu durum düzelmeyecek. 3. (a) Kendimi başarısız görmüyorum. (b) Çevremdeki bir çok kişiden daha fazla başarısızlıklarım oldu sayılır. (c) Geriye dönüp baktığımda, çok fazla başarısızlığımın olduğunu görüyorum. (d) Kendimi tümüyle başarısız bir insan olarak görüyorum. 4. (a) Herşeyden eskisi kadar zevk alabiliyorum. (b) Herşeyden eskisi kadar zevk alamıyorum. (c) Artık hiçbir şeyden gerçek bir zevk alamıyorum. (d) Bana zevk veren hiçbirşey yok. Herşey çok sıkıcı. 5. (a) Kendimi suçlu hissetmiyorum. (b) Arada bir kendimi suçlu hissettiğim oluyor. (c) Kendimi çoğunlukla suçlu hissediyorum. (d) Kendimi her an için suçlu hissediyorum. 6. (a) Cezalandırıldığımı düşünmüyorum. (b) Bazı şeyler için cezalandırılabileceğimi hissediyorum. (c) Cezalandırılmayı bekliyorum. (d) Cezalandırıldığımı hissediyorum. 7. (a) Kendimden hoşnutum. (b) Kendimden pek hoşnut değilim. (c) Kendimden hiç hoşlanmıyorum. (d) Kendimden nefret ediyorum. 8. (a) Kendimi diğer insanlardan daha kötü görmüyorum. (b) Kendimi zayıflıklarım ve hatalarım için eleştiriyorum. (c) Kendimi hatalarım için çoğu zaman suçluyorum. (d) Her kötü olayda kendimi suçluyorum.

158
9. (a) Kendimi öldürmek gibi düşüncelerim yok. (b) Bazen kendimi öldürmeyi düşünüyorum, fakat bunu yapmam. (c) Kendimi öldürebilmeyi isterdim. (d) Bir fırsatını bulsam kendimi öldürürdüm. 10.(a) Her zamankinden daha fazla ağladığımı sanmıyorum. (b) Eskisine göre şu sıralarda daha fazla ağlıyorum. (c) Şu sıralarda her an ağlıyorum. (d) Eskiden ağlayabilirdim, ama şu sıralarda istesem de ağlayamıyorum. 11.(a) Her zamankinden daha sinirli değilim. (b) Her zamankinden daha kolayca sinirleniyor ve kızıyorum. (c) Çoğu zaman sinirliyim. (d) Eskiden sinirlendiğim şeylere bile artık sinirlenemiyorum. 12.(a) Diğer insanlara karşı ilgimi kaybetmedim. (b) Eskisine göre insanlarla daha az ilgiliyim. (c) Diğer insanlara karşı ilgimin çoğunu kaybettim. (d) Diğer insanlara karşı hiç ilgim kalmadı. 13.(a) Kararlarımı eskisi kadar rahat ve kolay verebiliyorum. (b) Şu sıralarda kararlarımı vermeyi erteliyorum. (c) Kararlarımı vermekte oldukça güçlük çekiyorum. (d) Artık hiç karar veremiyorum. 14.(a) Dış görünüşümün eskisinden daha kötü olduğunu sanmıyorum. (b) Yaşlandığımı ve çekiciliğimi kaybettiğimi düşünüyor ve üzülüyorum. (c) Dış görünüşümde artık değiştirilmesi mümkün olmayan olumsuz değişiklikler
olduğunu hissediyorum. (d) Çok çirkin olduğumu düşünüyorum. 15.(a) Eskisi kadar iyi çalışabiliyorum. (b) Bir işe başlayabilmek için eskisine göre kendimi daha fazla zorlamam gerekiyor. (c) Hangi iş olursa olsun, yapabilmek için kendimi çok zorluyorum. (d) Hiçbir iş yapamıyorum. 16.(a) Eskisi kadar rahat uyuyabiliyorum. (b) Şu sıralarda eskisi kadar rahat uyuyamıyorum. (c) Eskisine göre 1 veya 2 saat erken uyanıyor ve tekrar uyumakta zorluk çekiyorum. (d) Eskisine göre çok erken uyanıyor ve tekrar uyuyamıyorum. 17.(a) Eskisine kıyasla daha çabuk yorulduğumu sanmıyorum. (b) Eskisinden daha çabuk yoruluyorum. (c) Şu sıralarda neredeyse herşey beni yoruyor. (d) Öyle yorgunum ki hiçbirşey yapamıyorum. 18.(a) İştahım eskisinden pek farklı değil. (b) İştahım eskisi kadar iyi değil. (c) Şu sıralarda iştahım epey kötü. (d) Artık hiç iştahım yok.

159
19.(a) Son zamanlarda pek fazla kilo kaybettiğimi sanmıyorum. (b) Son zamanlarda istemediğim halde üç kilodan fazla kaybettim. (c) Son zamanlarda istemediğim halde beş kilodan fazla kaybettim. (d) Son zamanlarda istemediğim halde yedi kilodan fazla kaybettim. Daha az yemeye çalışarak kilo kaybetmeye çalışıyorum. Evet ( ) Hayır ( ) 20.(a) Sağlığım beni pek endişelendirmiyor. (b) Son zamanlarda ağrı, sızı, mide bozukluğu, kabızlık gibi sorunlarım var. (c) Ağrı, sızı gibi bu sıkıntılarım beni epey endişelendirdiği için başka şeyleri
düşünmek zor geliyor. (d) Bu tür sıkıntılar beni öylesine endişelendiriyor ki, artık başka hiçbir şey
düşünemiyorum. 21.(a) Son zamanlarda cinsel yaşantımda dikkatimi çeken bir şey yok. (b) Eskisine oranla cinsel konularla daha az ilgileniyorum. (c) Şu sıralarda cinsellikle pek ilgili değilim.
(d) Artık, cinsellikle hiçbir ilgim kalmadı.

160
APPENDIX D
ALCOHOL USE DISORDERS IDENTIFICATION TEST (AUDIT)
1. Ne kadar sıklıkla alkol kullanırsınız? a) hiçbir zaman b) ayda bir ya da daha az c) ayda iki ya da dört kez d) haftada iki ya da üç kez e) haftada dört ya da daha fazla
2. Alkol almaya (içki içmeye) başladığınızda genellikle kaç tane (kadeh
ya da şişe) içersiniz? a) 1 ya da 2 b) 3 ya da 4 c) 5 ya da 6 d) 7 ya da 9 e) 10 ya da daha fazla
3. Ne kadar sıklıkta bir kerede 6 ya da daha fazla alkol alırsınız? a) hiçbir zaman b) ayda birden daha az c) ayda bir d) haftada bir e) her gün ya da hemen hemen her gün 4. Geçen yıl içinde alkol almaya başladıktan sonra kendinizi durduramadığınız (içmekten alıkoyamadığınız) bir durum ne kadar sıklıkta oldu?
a) hiçbir zaman b) ayda birden daha az c) ayda bir
d) haftada bir e) her gün ya da hemen hemen her gün
5. Geçen yıl içinde ne kadar sıklıkta normal olarak sizden beklenmeyen ancak alkollü olduğunuz için yaptığınız davranışlar oldu?
a) hiçbir zaman b) ayda birden daha az c) ayda bir
d) haftada bir e) her gün ya da hemen hemen her gün

161
6. Geçen yıl içinde ne kadar sıklıkta, çok alkol aldığınız bir gecenin sabahında, uyandığınızda tekrar hemen bir kadeh alkol almak istediniz? a) hiçbir zaman b) ayda birden daha az c) ayda bir d) haftada bir e) her gün ya da hemen hemen hergün 7. Geçen yıl içinde ne kadar sıklıkta, alkol aldıktan sonra kendinizi suçlu hissettiniz ya da pişmanlık duydunuz?
a) hiçbir zaman b) ayda birden daha az c) ayda bir d) haftada bir d) her gün ya da hemen hemen hergün 8. Geçen yıl içinde ne kadar sıklıkta, alkolden dolayı bir gece önce yaptıklarınızı hatırlamadığınız oldu?
a) hiçbir zaman b) ayda birden daha az c) ayda bir d) haftada bir e) her gün ya da hemen hemen hergün 9. Alkollüyken herhangi bir kişiyi yaraladığınız oldu mu? a) hiçbir zaman b) evet, fakat geçen yıl değil c) evet, geçen yıl içinde
10. Bir arkadaşınız ya da yakınınız ne kadar sıklıkta sizin alkol kullanma davranışınızdan dolayı kaygılanıp, alkolü bırakmanız gerektiğini söylüyor?
a) hiçbir zaman b) evet fakat geçen yıl değil c) evet, geçen yıl içinde
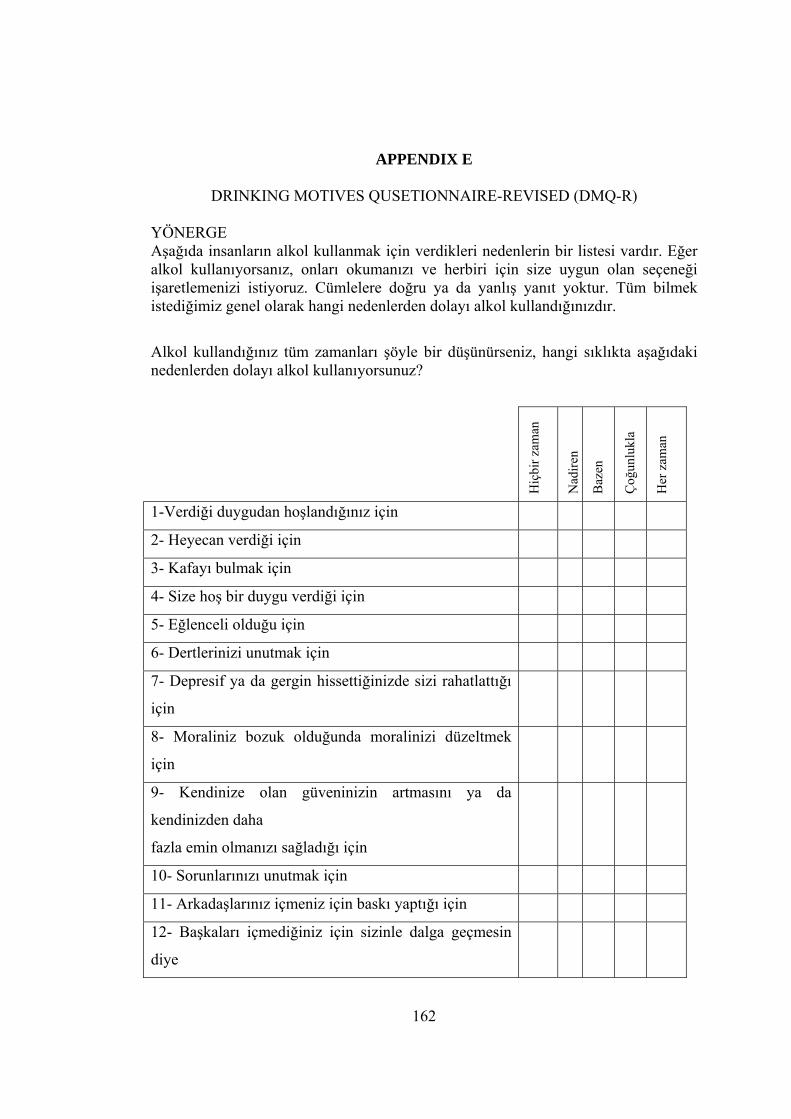
162
APPENDIX E
DRINKING MOTIVES QUSETIONNAIRE-REVISED (DMQ-R)
YÖNERGE Aşağıda insanların alkol kullanmak için verdikleri nedenlerin bir listesi vardır. Eğer alkol kullanıyorsanız, onları okumanızı ve herbiri için size uygun olan seçeneği işaretlemenizi istiyoruz. Cümlelere doğru ya da yanlış yanıt yoktur. Tüm bilmek istediğimiz genel olarak hangi nedenlerden dolayı alkol kullandığınızdır.
Alkol kullandığınız tüm zamanları şöyle bir düşünürseniz, hangi sıklıkta aşağıdaki nedenlerden dolayı alkol kullanıyorsunuz?
Hiç
bir z
aman
Nad
iren
Baz
en
Çoğ
unlu
kla
Her
zam
an
1-Verdiği duygudan hoşlandığınız için 2- Heyecan verdiği için 3- Kafayı bulmak için 4- Size hoş bir duygu verdiği için 5- Eğlenceli olduğu için 6- Dertlerinizi unutmak için 7- Depresif ya da gergin hissettiğinizde sizi rahatlattığı
için 8- Moraliniz bozuk olduğunda moralinizi düzeltmek
için 9- Kendinize olan güveninizin artmasını ya da
kendinizden daha
fazla emin olmanızı sağladığı için
10- Sorunlarınızı unutmak için 11- Arkadaşlarınız içmeniz için baskı yaptığı için 12- Başkaları içmediğiniz için sizinle dalga geçmesin
diye

163
Hiç
bir z
aman
Nad
iren
B
azen
Çoğ
unlu
kla
Her
zam
an
13- Birlikte olmaktan hoşlandığınız bir gruba uyum
göstermek için 14- Başkaları sizden hoşlansınlar diye 15- Kendinizi dışlanmış hissetmemek için 16- Bir eğlenceden /partiden /toplantıdan keyif almanıza
yardım ettiği için
17- İnsanlarla yakın olmak için 18- Sosyal birliktelikleri (ortamları) daha eğlenceli kıldığı 19- Parti ve kutlamaları daha zevkli/eğlenceli yaptığı için 20- Arkadaşlarla özel bir olayı kutlamak için