prova prova - rivas-project.eu · rivas scp0-ga-2010-265754 rivas_cedex_wp3_d3_7_part_a_final page...
TRANSCRIPT

RIVAS SCP0-GA-2010-265754
RIVAS_CEDEX_WP3_D3_7_PART_A_FINAL Page 237 of 241 07/06/2013
1/3 octave subballast-form layer acceleration insertion loss graphs for passenger train (upper graph), freight vehicle (middle graph) and dynamic load time history (lower graph) of TS3
track system compared to TS2 with ballast tamped and stabilized.
100
101
102
-2
0
2
4
6
8
10
12
14
16IL PTQ AceSB_FL GPvsGS
f(Hz)
IL(d
B)
100
101
102
-4
-3
-2
-1
0
1
2
3
4
5
6IL FTQ AceSB_FL GPvsGS
f(Hz)
IL(d
B)
100
101
102
-15
-10
-5
0
5
10
15IL DFT AceSB_FL GPvsGS
f(Hz)
IL(d
B)

RIVAS SCP0-GA-2010-265754
RIVAS_CEDEX_WP3_D3_7_PART_A_FINAL Page 238 of 241 07/06/2013
1/3 octave form layer-embankment acceleration insertion loss graphs for passenger train (upper graph), freight vehicle (middle graph) and dynamic load time history (lower graph) of
TS3 track system compared to TS2 with ballast tamped and stabilized.
100
101
102
-5
0
5
10
15
20IL PTQ AceFL_E GPvsGS
f(Hz)
IL(d
B)
100
101
102
-6
-4
-2
0
2
4
6
8IL FTQ AceFL_E GPvsGS
f(Hz)
IL(d
B)
100
101
102
-15
-10
-5
0
5
10
15IL DFT AceFL_E GPvsGS
f(Hz)
IL(d
B)

RIVAS SCP0-GA-2010-265754
RIVAS_CEDEX_WP3_D3_7_PART_A_FINAL Page 239 of 241 07/06/2013
1/3 octave middle embankment acceleration insertion loss graphs for passenger train (upper graph), freight vehicle (middle graph) and dynamic load time history (lower graph) of TS3
track system compared to TS2 with ballast tamped and stabilized.
100
101
102
-2
0
2
4
6
8
10
12
14
16
18IL PTQ AceE142 GPvsGS
f(Hz)
IL(d
B)
100
101
102
-5
-4
-3
-2
-1
0
1
2
3
4
5IL FTQ AceE142 GPvsGS
f(Hz)
IL(d
B)
100
101
102
-15
-10
-5
0
5
10
15IL DFT AceE142 GPvsGS
f(Hz)
IL(d
B)

RIVAS SCP0-GA-2010-265754
RIVAS_CEDEX_WP3_D3_7_PART_A_FINAL Page 240 of 241 07/06/2013
1/3 octave bottom embankment acceleration insertion loss graphs for passenger train (upper graph), freight vehicle (middle graph) and dynamic load time history (lower graph) of TS3
track system compared to TS2 with ballast tamped and stabilized.
100
101
102
-6
-4
-2
0
2
4
6
8
10
12
14IL PTQ AceE062 GPvsGS
f(Hz)
IL(d
B)
100
101
102
-6
-4
-2
0
2
4
6IL FTQ AceE062 GPvsGS
f(Hz)
IL(d
B)
100
101
102
-15
-10
-5
0
5
10IL DFT AceE062 GPvsGS
f(Hz)
IL(d
B)

RIVAS SCP0-GA-2010-265754
RIVAS_CEDEX_WP3_D3_7_PART_A_FINAL Page 241 of 241 07/06/2013

RIVAS
SCP0-GA-2010-265754
RIVAS_BAM_ WP3_D3_7_PartB_final.docx Page 1 of 89 10/06/2013
RIVAS
Railway Induced Vibration Abatement Solutions
Collaborative project
Results of laboratory tests for ballasted track mitigation measures
Under Sleeper Pads (USP) and heavy sleepers
Deliverable D3.7 (Part B)
Submission date: 10/06/2013
Project Coordinator:
Bernd Asmussen
International Union of Railways (UIC)

RIVAS
SCP0-GA-2010-265754
RIVAS_BAM_ WP3_D3_7_PartB_final.docx Page 2 of 89 10/06/2013
Title Results of laboratory tests for ballasted track mitigation
measures
Under Sleeper Pads (USP) and heavy sleepers
Domain WP3, Task 3.2, D3.7 (Part B)
Date 10/06/2013
Author/Authors Dipl. Ing. E. Knothe
Partner BAM
Document Code RIVAS_BAM_ WP3_D3_7_PartB_final.docx
Version V02
Status Final
Dissemination level:
Project co-funded by the European Commission within the Seventh Framework Programme
Dissemination Level
PU Public
PP Restricted to other programme participants (including the Commission Services)
RE Restricted to a group specified by the consortium (including the Commission) Services)
CO Confidential, only for members of the consortium (including the Commission Services) X
Document history
Revision Date Description
1 29/04/2013 First Draft
2 03/06/2013 Second Draft
3 10/06/2013 Final

RIVAS
SCP0-GA-2010-265754
RIVAS_BAM_ WP3_D3_7_PartB_final.docx Page 3 of 89 10/06/2013
1. EXECUTIVE SUMMARY
The laboratory tests of under sleeper pads and sleepers were carried out within the research
project RIVAS Railway Induced Vibration Abatement Solutions, Grant Agreement Number
265754, of the European Union EU.
This report describes the measurement of under sleeper pads and sleepers for ballasted
tracks, work package 3 “Mitigation measures track” of RIVAS, task 3.2 “Mitigation measures
for ballasted tracks” [5].
The tests for under sleeper pads have been performed in accordance with DIN 45673-6 –
Mechanical vibration – Resilient elements used in railway tracks – Part 6: Laboratory test
procedures for under sleeper pads of concrete sleepers, [1]. The tests for the sleepers have
been performed in accordance with DIN EN 13230-2 – Railway applications – Track –
Concrete sleepers and bearers – Part 2: Prestressed monoblock sleepers.
Three different types of under sleeper pads (SLN1010, SLN0613 and SLN0315) and one
sleeper type (B90.2) were investigated. For the examination of the under sleeper pads for
ballasted tracks tests for the static and dynamic bedding modulus, fatigue strength, bond
strength, shear strength and the freeze-thaw resistance were carried out. For the sleepers
static tests, dynamic tests and in a fatigue test were carried out.
The results of the measurements are documented in detail among others in stress-
displacement diagrams for the different static bedding moduli, bond strength and shear
strength. The so called low-frequency bedding modulus was determined for 5 Hz, 10 Hz, 20
Hz and 30 Hz at 23 °C and in addition for 10 Hz at 0 °C and -20 °C. The so called high-
frequency bedding modulus was determined at 10 Hz, 20 Hz, 40 Hz, 80 Hz and 160 Hz at
room temperature.
Two standards for tests of USP with different profiled loading plates exist, the German
standard DIN 45673-6 [1] and the draft European standard CEN/TC 256 [4]. The static
bedding modulus was determined at the same specimen with the test procedure of the
German standard with the two different loading plates. Looking at the influence of the loading
plates the static bedding modulus differs depending on the material between 10% and 18%
for medium ballast compaction.

RIVAS
SCP0-GA-2010-265754
RIVAS_BAM_ WP3_D3_7_PartB_final.docx Page 4 of 89 10/06/2013
2. TABLE OF CONTENTS
1. Executive Summary ....................................................................................................... 3
2. Table of contents ............................................................................................................ 4
3. Introduction .................................................................................................................... 6
4. Test Laboratory and Staff ............................................................................................... 7
5. Examination of the under sleeper pads for ballasted track .............................................. 8
5.1 Material and Specimen ............................................................................................ 8
5.1.1 Material ............................................................................................................ 8
5.1.2 Specimen ......................................................................................................... 9
5.2 Characteristic Values .............................................................................................12
5.2.1 Static bedding modulus Cstat and at-rest value Cstat0 of the static bedding
modulus 12
5.2.2 Different profiled loading plates (German-NSP and EU-GBP) - Static bedding
modulus 15
5.2.3 Low-frequency bedding modulus Cdyn1 (f) ........................................................17
5.2.4 Low-frequency stiffening ratio Kdyn1(10Hz) .......................................................19
5.2.5 High-frequency bedding modulus Cdyn2 (f) .......................................................20
5.2.6 High-frequency dynamic stiffening ratio Kdyn2 (80Hz) .......................................21
5.3 Serviceability ..........................................................................................................22
5.3.1 Mechanical fatigue strength.............................................................................22
5.3.2 Bond strength by pull-off .................................................................................23
5.3.3 Shear strength.................................................................................................25
5.3.4 Freeze-thaw resistance ...................................................................................27
6. Examination of the Sleepers B90.2 – ballasted track .....................................................29
6.1 Material and specimen ...........................................................................................29
6.2 Static test rail seat ..................................................................................................29
6.3 Static test centre ....................................................................................................32

RIVAS
SCP0-GA-2010-265754
RIVAS_BAM_ WP3_D3_7_PartB_final.docx Page 5 of 89 10/06/2013
6.4 Dynamic test rail seat .............................................................................................33
6.5 Fatigue test ............................................................................................................35
7. Conclusion ....................................................................................................................37
8. Annex ............................................................................................................................38
8.1 References .............................................................................................................38
8.2 Abbreviations .........................................................................................................38
8.2.1 Terms and definitions ......................................................................................38
8.2.2 Symbols ..........................................................................................................39
8.3 Tables – Examination of the USP ...........................................................................41
8.3.1 Measuring System ..........................................................................................44
8.3.2 Results USP ....................................................................................................49
8.4 Figures - Examination of the USP ..........................................................................60
8.4.1 Specimen ........................................................................................................60
8.4.2 Test rig ............................................................................................................61
8.4.3 Evaluation static bedding modulus ..................................................................66
8.5 Data sheets USP firm Getzner Werkstoffe GmbH ..................................................75
8.6 Tables –Examination of the sleepers ......................................................................76
8.6.1 Measuring system and test forces ...................................................................77
8.6.2 Results – sleepers ...........................................................................................79
8.7 Figures – Examination of the sleepers ...................................................................81
8.7.1 Test rig ............................................................................................................82
8.7.2 Tested sleepers ...............................................................................................85

RIVAS
SCP0-GA-2010-265754
RIVAS_BAM_ WP3_D3_7_PartB_final.docx Page 6 of 89 10/06/2013
3. INTRODUCTION
Railway induced vibrations are a growing problem in Europe. Therefore the European
Commission installed the research project RIVAS Railway Induced Vibration Abatement
Solutions, Grant Agreement Number 265754. The aim of RIVAS project is to reduce railway
induced ground-borne vibrations with mitigation measures on the track, the propagation path
and of the vehicles. The subjects investigated in this report aims for the measures in track
only.
Under sleeper pads (USP) and sleepers are investigated within the work package 3
“Mitigation measures track” of RIVAS, task 3.2 “Mitigation measures for ballasted tracks” [5].
The numerical study [7] in RIVAS-Deliverable 3.2 showed the mitigation potential of soft
under sleeper pads and heavy sleeper. Therefore, laboratory tests were carried out with soft
under sleeper pads and with a newly designed heavy sleeper. The tests include the
determination of characteristic values, which are necessary to predict the mitigation effect, as
well as serviceability tests which are necessary for the installation new elements in
commercial tracks.
During the laboratory tests three different materials from Getzner Werkstoffe GmbH for USP
were examined: SLN1010, SLN0613 and SLN0315.
One sleeper type B90.2 was examined.
All tests were planned in corporation with RAIL.ONE GmbH and all tested materials were
delivered as well by RAIL.ONE GmbH.
The report is subdivided into chapter 1 to 4 with the executive summary, the table of
contents, the introduction and the test laboratory and staff. The examination of the USP is
described in chapter 5 and the examination of the sleepers in chapter 6. The conclusions are
given in chapter 7. Additional information are given in chapter 8.

RIVAS
SCP0-GA-2010-265754
RIVAS_BAM_ WP3_D3_7_PartB_final.docx Page 7 of 89 10/06/2013
4. TEST LABORATORY AND STAFF
The measurements were carried out at
BAM Federal Institute for Materials Research and Testing
Division 7.2 Buildings and Structures
Unter den Eichen 87
12205 Berlin
Germany
The tests were carried out between August 2012 and Mai 2013.
The measuring staff was:
Dipl. Ing. E. Knothe Project Management,
Report
Evaluation
Dipl. Ing. E. Kretzschmar
Dipl.-Ing. R.Makris
Dipl.-Ing. H.-J. Peschke
Test organisation
Evaluation
M. Peuschel Evaluation with ATOS
I. Feick
N. Neumann
Test setup and procedure

RIVAS
SCP0-GA-2010-265754
RIVAS_BAM_ WP3_D3_7_PartB_final.docx Page 8 of 89 10/06/2013
5. EXAMINATION OF THE UNDER SLEEPER PADS FOR
BALLASTED TRACK
For the examination of the under sleeper pads for ballasted tracks the characteristic values
the static and dynamic bedding modulus were determined. The high-frequency bedding
moduli are the values which characterise the mitigation potential of the USP.
In addition tests for the serviceability the fatigue strength, bond strength, shear strength and
the freeze-thaw resistance were carried out.
The test procedure was carried out according to DIN 45673-6 [1] – Mechanical vibration –
Resilient elements used in railway tracks – Part 6: Laboratory test procedures for under
sleeper pads of concrete sleepers, English version of [1].
5.1 MATERIAL AND SPECIMEN
5.1.1 Material
Three different elastomer materials of USP from the company Getzner Werkstoffe GmbH
were examined. Table 5-1 gives the declaration of the USP as delivered by Getzner
Werkstoffe GmbH. Additional information are given in the data sheet exemplarily for the
material SLN 0315, Figure 8-30.
Table 5-1: USP, declaration of the manufacturer Getzner Werkstoffe GmbH
material thickness [mm]
declaration manufacturer
bedding modulus [N/mm³],
declaration manufacturer
SLN 1010 SLN 10 0.10
SLN 0613 SLN 13 0.06
SLN 0315 SLN 15 0.03
The single USP SLN 0613 is shown exemplarily in Figure 5-1. The USP consist of a felt layer
at the bottom, the elastomer and a geogrid. The felt layer protects the elastomer against
spiky ballast and the geogrid as a bonding layer to connect the USP with the concrete.
Pictures of USP SLN1010 and SLN0613 are shown in Figure 8-1 and Figure 8-2 in the
annex.

RIVAS
SCP0-GA-2010-265754
RIVAS_BAM_ WP3_D3_7_PartB_final.docx Page 9 of 89 10/06/2013
Figure 5-1: Under-sleeper pad SLN0613
5.1.2 Specimen
The specimens were concrete blocks with bonded USP as a substitute for the sleeper and
single USP, see Figure 5-2. The dimensions of the concrete blocks differ depending on the
kind of tests. The concrete blocks with bonded USP and the single USP were provided by
RAIL.ONE GmbH. An overview of all delivered specimen is given in Table 8-1 to Table 8-3,
page 41ff. Every specimen had his own notation.
Material SLN1010 notation C-xx
Material SLN0613 notation B-xx
Material SLN0315 notation A-xx
Single USP P-01, P-02 or P-03
The supplier´s notation e.g. SLN 0613 means a Material Sylodyn (SLN) with 0.06 N/mm³
nominal modulus and a thickness of 13 mm.
SLN 0613
5 cm
d = 15 mm
geogrid
elastomer
felt

RIVAS
SCP0-GA-2010-265754
RIVAS_BAM_ WP3_D3_7_PartB_final.docx Page 10 of 89 10/06/2013
Figure 5-2: Specimen, concrete blocks with USP, material Getzner Werkstoffe GmbH SLN, a) +
b) for different tests 300 * 300 * 100 mm³, 300 * 300 * 200 mm³, c) for the shear test
200 * 200 * 200 mm³
Static and dynamic Bedding modulus: For the static and at-rest value of the static
bedding modulus the specimens were concrete blocks with bonded USP with the dimensions
300 * 300 * 100 mm³ (only concrete block), see Figure 5-2. The area of the specimens was
90 000 mm². The height was reduced versus the requirement of the German standard
DIN 45673-6 [1] because of a better handling in the laboratory. The lower mass was
considered in the test.
The low-frequency bedding modulus was measured directly after the static bedding modulus
with the identical specimen as those for the static bedding modulus.
For the high-frequency bedding modulus single USP without bonding layer were used. One
side of the USP was plain and the other side had got the normal felt layer at the ballast
contact surface.
a)
b)
a)
c)

RIVAS
SCP0-GA-2010-265754
RIVAS_BAM_ WP3_D3_7_PartB_final.docx Page 11 of 89 10/06/2013
Fatigue test: The specimen for the fatigue test was a concrete block with USP with the
dimensions 300 * 300 * 200 mm³ (only concrete block) as provided in the German standard
DIN 45673-6. The area of the specimen was 90 000 mm².
Bond strength by pull-off: For the bond strength a specimen with a test area with a
diameter of 50 mm has to be prepared. The tear chips were drilled out of a concrete block
with bonded USP. The drill was made through the USP and about 10 mm down into the
concrete block, see Figure 5-3.
\\scl1\Service31\720SERV\02_Vorhaben\Vh 7243_Rivas_schwellenbesohlung\Bilder\
Haftabzug\bonding test USP ballasted track\JAN13\
Figure 5-3: Bond strength by pull-off, preparation of specimen, 5 test areas
Shear test: For the shear tests concrete cubes with USP on two opposite sides were
used. The dimensions of the cubes are 200*200*200 mm³ (only concrete cube) as provided
in the German standard DIN 45673-6.
Frost-thaw test: The specimen for the frost-thaw test is the same (identical in
construction) as for the static bedding modulus, concrete block with USP,
300 * 300 * 100 mm³.

RIVAS
SCP0-GA-2010-265754
RIVAS_BAM_ WP3_D3_7_PartB_final.docx Page 12 of 89 10/06/2013
5.2 CHARACTERISTIC VALUES
5.2.1 Static bedding modulus Cstat and at-rest value Cstat0 of the static
bedding modulus
The static bedding modulus is used for the calculation of the static deformation of the
rail under the service load. It is calculated with the following formula:
It is a reference parameter for the USP. For the determination three load cycles were
applied. The third cycle was analysed and the secant modulus between stress and and
the displacements s2 and s1 was calculated, see Figure 5-4.
The at-rest value of the static bedding modulus shows the static compression under
the dead load of a train. It is calculated between stress and , measured after a resting
time of 10 minutes, see Figure 5-4, with the following formula:
Test parameters:
The static bedding modulus was determined with 3 specimens. The at-rest value of the static
bedding modulus was determined with exactly the same specimen directly after the static
bedding modulus for each condition in accordance with [1]. The test routine for both bedding
moduli is shown in Figure 5-4. The test conditions for the static bedding modulus are
summarized in Table 5-2 and the evaluation range in Table 5-3. The test conditions for the
at-rest value of the static bedding modulus are the same as for the static bedding modulus
but the loading range is different.

RIVAS
SCP0-GA-2010-265754
RIVAS_BAM_ WP3_D3_7_PartB_final.docx Page 13 of 89 10/06/2013
Figure 5-4: Test routine static and at-rest value of the static bedding modulus
Table 5-2: Static bedding modulus - Test conditions
Conditions: dry test object,
test temperature must be achieved 16 h before the test
Specimen 3 concrete blocks with USP, 300 * 300 * 100 mm³
Temperature (23 ± 3)°C, (0 ± 3)°C, (-20 ± 3)°C
Load application The concrete block with the USP is placed on top of the profiled
plate (NSP). The USP is in contact with the plate. The weight of the
concrete block has to be taken into account for the applied force.
Loading and unloading rate /t = 0.01 N/mm²/s
Loading range: u = 0.01 N/mm², o = 0.25 N/mm²
Test rig servo-hydraulic tensile-compression testing machine with 100 kN
cylinder, see Table 8-4
Table 5-3: Static bedding modulus - evaluation ranges
Evaluation range for medium
ballast compaction:
1 = 0.01 N/mm², 2 = 0.10 N/mm²
Evaluation range for high
ballast compaction:
1 = 0.01 N/mm², 2 = 0.20 N/mm²
o
2
2*
u = 1
5 min 10 min 10 min 10 min time
str
ess
resting value
resting value
resting value
0
high ballast pressure
middleballast pres.
test forstatic bed. modulus test for at-rest value of the static bed. modulus

RIVAS
SCP0-GA-2010-265754
RIVAS_BAM_ WP3_D3_7_PartB_final.docx Page 14 of 89 10/06/2013
The results of the static and at-rest value of the static bedding modulus for the three
different materials are shown in Table 8-9 to Table 8-11. As an example the static bedding
modulus for different temperatures and for high ballast compaction is presented in Figure
5-5. The static bedding modulus for all different USP increases while the temperature
decreases.
Figure 5-5: static bedding modulus for high ballast compaction

RIVAS
SCP0-GA-2010-265754
RIVAS_BAM_ WP3_D3_7_PartB_final.docx Page 15 of 89 10/06/2013
5.2.2 Different profiled loading plates (German-NSP and EU-GBP) - Static
bedding modulus
The tests for the static and at-rest value of the static bedding modulus, for the low-frequency
bedding modulus and for the high-frequency bedding modulus are carried out with the
German ballast plate (NSP, in German Normschotterplatte), Figure 5-6. Surface area of the
German ballast plate is 300 x 300 mm². It is produced from a ballast cast from real ballast.
Figure 5-6: German ballast plate (NSP)
The other ballast plate is the European or Geometric ballast plate (GBP) with a pyramidal
structure instead of the real ballast and with the same surface area, Figure 5-7, according to
CEN [4].

RIVAS
SCP0-GA-2010-265754
RIVAS_BAM_ WP3_D3_7_PartB_final.docx Page 16 of 89 10/06/2013
Figure 5-7: European or Geometric ballast plate (GBP)
For the different USP the static bedding modulus was determined with the German ballast
plate and in addition with the geometric ballast plate to compare the influence of both profiled
plates. The tests with the NSP and the GBP were performed on the identical specimen for
each material and with the same test procedure. The test procedure was chosen according
to DIN 45673-6, [1]. It is described in chapter 5.2.
Results:
The results are shown in Table 8-12 and in Figure 8-19 for SLN1010, in Figure 8-20 for
SLN0613 and in Figure 8-21 for SLN 0315.
The static bedding modulus for medium ballast compaction differs for the three materials as
follows:
USP type variance in modulus measured with
EU-GBP / German-NSP
SLN1010 -10 %
SLN0613 10 %
SLN0315 18 %
The results are not the same and the test method has to be noted with every bedding
modulus.

RIVAS
SCP0-GA-2010-265754
RIVAS_BAM_ WP3_D3_7_PartB_final.docx Page 17 of 89 10/06/2013
5.2.3 Low-frequency bedding modulus Cdyn1 (f)
The low-frequency bedding modulus Cdyn1 (f) is used for the calculation of the time depending
bending deformation of the rail under a rolling wheel. It determines the superstructure
dynamics. The tests are carried out without preload. The low-frequency bedding modulus is
calculated with the following formula:
The low-frequency bedding modulus Cdyn1 (f) is determined at 23°C for f = 5 Hz, 10 Hz, 20 Hz
and 30 Hz and in addition for 10 Hz at 0°C and -20°C. The test routine is presented in Figure
5-8. The test conditions are summarized in Table 5-4 and the loading range was chosen for
main-line-railways, Table 5-5.
Figure 5-8: Test routine dynamic bedding modulus; 5, 10, 20, 30 Hz
~ 3 min ~ 10 s 10 cycles
str
ess
time
max
m
min
5 Hz 10 Hz 20 Hz 30 Hz

RIVAS
SCP0-GA-2010-265754
RIVAS_BAM_ WP3_D3_7_PartB_final.docx Page 18 of 89 10/06/2013
Table 5-4: Low-frequency bedding modulus - Test conditions
Conditions: dry test object,
test temperature must be achieved 16 h before the test
Specimen 3 concrete blocks with USP
Temperature and frequency (23 ± 3)°C 5 Hz, 10 Hz, 20 Hz, 30 Hz
(0 ± 3)°C, (-20 ± 3)°C 10 Hz
Load application The concrete block with USP is placed on top of the profiled plate
(NSP). The pad is in contact with the plate. The weight of the
concrete block has to be taken into account for the applied force.
Type of load harmonic excitation between u and o
Test rig servo-hydraulic tensile-compression testing machine with 100 kN
cylinder, see Table 8-4
Table 5-5: Low-frequency bedding modulus - Loading range
Loading range for main line
railway
u = 0.01 N/mm², o = 0.10 N/mm²
The results of the low-frequency bedding modulus Cdyn1 (f) for three different materials are
shown in Table 8-13 and Table 8-14 and in Figure 5-9.

RIVAS
SCP0-GA-2010-265754
RIVAS_BAM_ WP3_D3_7_PartB_final.docx Page 19 of 89 10/06/2013
Figure 5-9: Low-frequency bedding modulus
5.2.4 Low-frequency stiffening ratio Kdyn1(10Hz)
The low-frequency stiffening ratio Kdyn1 was calculated for 10 Hz due to the standard
DIN 45673-6 [1]. It is calculated as the quotient of the lower frequency bedding modulus at
10 Hz and the static bedding modulus with the following formula:
The values of both bedding moduli must be determined on the same specimen. The results
for all materials are summarized in Table 8-15.

RIVAS
SCP0-GA-2010-265754
RIVAS_BAM_ WP3_D3_7_PartB_final.docx Page 20 of 89 10/06/2013
5.2.5 High-frequency bedding modulus Cdyn2 (f)
The high-frequency bedding modulus Cdyn2 (f) is determined for under-sleeper pads to
characterise their mitigation potential.
In comparison to the low-frequency bedding modulus the test procedure of the
high-frequency bedding modulus Cdyn2 (f) is carried out with a static preload, only with the
single pad without bonding layer and concrete block and with a smaller vibration amplitude.
Therefore the values of low and high-frequency bedding modulus at the same frequency are
not the same and cannot be compared. For the test conditions see Table 5-6.
Table 5-6: High-frequency bedding modulus - Test condition
Conditions: dry test object,
Specimen single USP, 300 * 300 mm²
3 specimens: SLN1010 and SLN 0315
2 specimens: SLN 0613
Temperature (23 ± 3)°C
Load application The USP is placed between a flat loading plate (above) and the
profiled loading plate NSP. The tests are carried out under preload.
preload: main-line railway network: σv = 0,12 N/mm²
Type of load Harmonic excitation with a particle velocity amplitude of 7 mm/s
Frequency fj : 10 Hz to 160 Hz in octave intervals
Test rig servo-hydraulic tensile-compression testing machine with
7 kN cylinder see Table 8-5
The results of the high-frequency dynamic bedding moduli are summarized in Table 8-16 and
in Figure 5-10.

RIVAS
SCP0-GA-2010-265754
RIVAS_BAM_ WP3_D3_7_PartB_final.docx Page 21 of 89 10/06/2013
Figure 5-10: High-frequency bedding modulus
5.2.6 High-frequency dynamic stiffening ratio Kdyn2 (80Hz)
The high-frequency dynamic stiffening ratio Kdyn2 was calculated for a frequency of 80 Hz due
to the standard DIN 45673-6 [1]. It is calculated as the quotient of the high-frequency
bedding modulus at a frequency of 80 Hz and the static bedding modulus with the following
formula:
The values of both bedding moduli must be determined on the same specimen. The results
for all materials are summarized in Table 8-17.
0,00
0,05
0,10
0,15
0,20
0,25
0,30
0,35
0,40
0 50 100 150 200
be
dd
ing
mo
du
lus
[N
/mm
³]
frequency [Hz]
high frequency bedding modulus(structure borne noise)
SLN1010
SLN613
SLN315

RIVAS
SCP0-GA-2010-265754
RIVAS_BAM_ WP3_D3_7_PartB_final.docx Page 22 of 89 10/06/2013
5.3 SERVICEABILITY
5.3.1 Mechanical fatigue strength
The mechanical fatigue strength test shall characterize the long term functionality of the USP
and the bonding layer. One very soft type of USP was planned to test according to the
simulation [7].
Test conditions:
For the mechanical fatigue strength test a total of 8 million load cycles were applied on a
concrete block with bonded USP which was placed on the ballast in a ballast trough, see
Figure 8-7. The load cycles were applied in two 2 load levels. The loadings are induced
according to DIN 45673-6 (5.2) for main-line railways, Table 5-7.
Table 5-7: Mechanical fatigue strength – test conditions
Conditions: dry test object,
Specimen 1 concrete blocks with USP, 300 * 300 * 200 mm³
Temperature (23 ± 3)°C
Load application The concrete block with the sleeper pad is placed on top of the
ballast in a ballast trough. The USP is in contact with the ballast.
The weight of the concrete block has to be taken into account for
the applied force.
Type of load Harmonic excitation at f = 3 Hz
Loading range: Load level 1 (5 mill. load cycles):
preload FU = 1 kN upper load F0 = 21 kN
Load level 2 (3 mill. load cycles):
preload FU = 1 kN upper load F0 = 28 kN
Test rig see Table 8-6
Results:
There were several pressure areas after the first and the second load level as documented
after a manually evaluation in Figure 8-22 and Figure 8-23 after the first and the second load
level. The depth of the pressure areas were up to 11 mm after the first load level and up to
12 mm after the second load level, Table 8-18. At one place the USP was perforated by the

RIVAS
SCP0-GA-2010-265754
RIVAS_BAM_ WP3_D3_7_PartB_final.docx Page 23 of 89 10/06/2013
ballast up to the concrete. The edges of the USP were cracked at several places especially
at the corners.
In addition an evaluation by the system ATOS from GOM (GOM - Gesellschaft für Optische
Messtechnik mbH, Optical Measuring Techniques) was made. Using that system the surface
of the USP was photographed after both load steps out of two directions and so the structure
of the surface could be illustrated in colours with the relative depth to a self chosen area, see
Figure 8-24. The absolute depth couldn’t be determined because the ballast contact felt
didn’t allow defining an exact zero area before the loadings.
5.3.2 Bond strength by pull-off
The bond strength by pull-off shall be determined to ensure the required degree of the
bonding between under sleeper pad and concrete. For the test conditions see Table 5-8.
Table 5-8: Bond strength by pull-off – test conditions
Conditions: dry test object,
Specimen 1 concrete blocks with USP, 300 * 300 * 100 mm³
3 test areas each with a tear chip Ø 50 mm, drilled through the USP
in the concrete of the specimen, Figure 8-25
Temperature (23 ± 3)°C
Load application steel stud glued to the USP with a polyurethane glue defined from
the manufacturer of the USP Getzner Werkstoffe GmbH, Macroplast
UK 8303 B60
vertically to the bonded surface
Loading rate /t = 0.01 N/mm²/s
Test rig see Table 8-7
Results
The collapse area was the bonding layer between the concrete and the USP in the majority
of cases, 27 tests of 30 tests, Figure 8-26. The load deformation curves are given in Figure
8-26 and Figure 5-11. The values of the bond strength are documented in Table 8-19.
The Specimen SLN1010 A11 shows the highest maximum load and the lowest maximum
displacement. The bonding layer for the USP is a geogrid with different denseness, Figure

RIVAS
SCP0-GA-2010-265754
RIVAS_BAM_ WP3_D3_7_PartB_final.docx Page 24 of 89 10/06/2013
8-1 to Figure 8-2. The different bonding layer and the different materials had an influence on
the bond strength.
Figure 5-11: Bond strength, SLN1010, SLN0613, SLN0315 and SLN0613 after freeze thaw test
0
0,1
0,2
0,3
0,4
0,5
0,6
0,7
0,8
0,9
0 2 4 6 8 10 12 14 16
stre
ss [
N/m
m²]
Displacement [mm]
SLN 1010 A 11
Sample 1
Sample 2
Sample 3
Sample 4
Sample 50
0,1
0,2
0,3
0,4
0,5
0,6
0,7
0,8
0,9
0 2 4 6 8 10 12 14 16
stre
ss [
N/m
m²]
Displacement [mm]
SLN 0613 B 05
Sample 1
Sample 2
Sample 3
Sample 5
0
0,1
0,2
0,3
0,4
0,5
0,6
0,7
0,8
0,9
0 2 4 6 8 10 12 14 16
stre
ss [
N/m
m²]
Displacement [mm]
SLN 0315 C 09
Sample 1
Sample 2
Sample 3
Sample 4
Sample 5
0
0,1
0,2
0,3
0,4
0,5
0,6
0,7
0,8
0,9
0 2 4 6 8 10 12 14 16
stre
ss [
N/m
m²]
Displacement [mm]
SLN 0613 B 08 - after freeze thaw test
Sample 1
Sample 2
Sample 3
Sample 4
Sample 5

RIVAS
SCP0-GA-2010-265754
RIVAS_BAM_ WP3_D3_7_PartB_final.docx Page 25 of 89 10/06/2013
5.3.3 Shear strength
Table 5-9: Shear strength – test conditions
Conditions: dry test object,
Specimen for each material 3 concrete cubes with USP on two sides,
200 * 200 * 200 mm³
only SLN0613 and SLN0315
Temperature (23 ± 3)°C
Load application The two USP sides of the specimen were glued onto steel plates
and the steel plates were fixed vertically in the testing machine,
load applied in the middle of the concrete cube with a 30-mm-wide
loading blade
parallel to the bonded surface
Loading rate /t = 0.01 N/mm²/min
Test rig see Table 8-8
Results
All specimens had the breakdown within the USP material, see Figure 8-27 to Figure 8-29.
The stress-deformation curves are documented in Figure 5-12 and Figure 5-13. The values
of the shear strength are documented in Table 8-20.

RIVAS
SCP0-GA-2010-265754
RIVAS_BAM_ WP3_D3_7_PartB_final.docx Page 26 of 89 10/06/2013
Figure 5-12: Shear strength, SLN0613
Figure 5-13: shear strength, SLN0315
VII.2 Ingenieurbau
SLN0613
Layout: AbSch_SLN0615.TDR
Datei: SLN0613_AbSch.TDM
0 5 10 15 20 25
displacement [mm]
0.00
0.10
0.20
0.30
0.40
0.50
0.60
str
es
s [
N/m
m²]
B31
B32
B33
VII.2 Ingenieurbau
SLN0315
Layout: AbSch_SLN0315.TDR
Datei: SLN0315_AbSch_korr.TDM
0 5 10 15 20 25
displacement [mm]
0.00
0.10
0.20
0.30
0.40
0.50
0.60
str
es
s [
N/m
m²]
C31
C32
C33

RIVAS
SCP0-GA-2010-265754
RIVAS_BAM_ WP3_D3_7_PartB_final.docx Page 27 of 89 10/06/2013
5.3.4 Freeze-thaw resistance
One type of USP was foreseen for the freeze-thaw resistance test. The USP type SLN 0613
was chosen for the test, since this type has been preselected as potential useful soft USP
type for main line according to the simulation [7].
Figure 5-14: Test routine freeze-thaw test
Table 5-10: Freeze-thaw resistance - Test conditions
Conditions: dry test object before conditioning,
Specimen 1 concrete block with USP, 300 * 300 * 100 mm³
Test medium distilled water
Temperature (23 ± 3)°C, (-20 ± 3)°C, (30 ± 3)°C
Preparation USP of the concrete block 24 h in distilled water on the
German-NSP
Load application first 2 hours in water bath
pulsed load with u = 0,05 N/mm² and o = 0,15 N/mm²
Loading rate 30 strokes per hour
Temperature application 50 freeze-thaw cycles -20°C to 30°C, 1 day for each cycle
Temperature rate -20°C to 30°C in 1 hour
Before and after the test determine the low-frequency bedding modulus at 10 Hz
time
T
2h 24h
-20°C
30°C
RT
Test-cycle 50x1h + 11h + 1h + 11h = 24h
11h
u
RIVAS
SCP0-GA-2010-265754
RIVAS_BAM_ WP3_D3_7_PartB_final.docx Page 28 of 89 10/06/2013
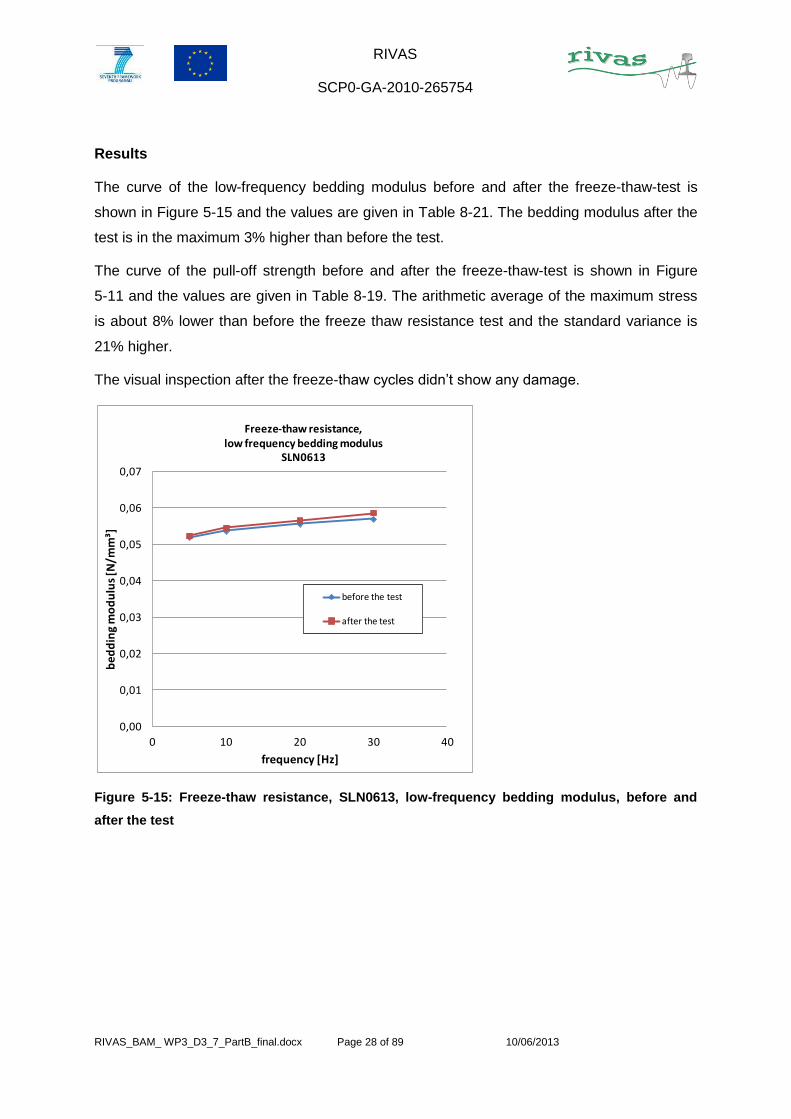
Results
The curve of the low-frequency bedding modulus before and after the freeze-thaw-test is
shown in Figure 5-15 and the values are given in Table 8-21. The bedding modulus after the
test is in the maximum 3% higher than before the test.
The curve of the pull-off strength before and after the freeze-thaw-test is shown in Figure
5-11 and the values are given in Table 8-19. The arithmetic average of the maximum stress
is about 8% lower than before the freeze thaw resistance test and the standard variance is
21% higher.
The visual inspection after the freeze-thaw cycles didn’t show any damage.
Figure 5-15: Freeze-thaw resistance, SLN0613, low-frequency bedding modulus, before and
after the test
0,00
0,01
0,02
0,03
0,04
0,05
0,06
0,07
0 10 20 30 40
be
dd
ing
mo
du
lus
[N/m
m³]
frequency [Hz]
Freeze-thaw resistance,low frequency bedding modulus
SLN0613
before the test
after the test

RIVAS
SCP0-GA-2010-265754
RIVAS_BAM_ WP3_D3_7_PartB_final.docx Page 29 of 89 10/06/2013
6. EXAMINATION OF THE SLEEPERS B90.2 –
BALLASTED TRACK
The test procedure was carried out according to DIN EN 13230-2 “Railway applications –
Track – Concrete sleepers and bearers – Part 2: Prestessed monoblock sleeper, English
version of [3].
The test program includes four different tests: The static and dynamic test for positive
moment at the rail seat section, the static test at the centre section for negative moment and
the fatigue test for positive moment at the rail seat section. All tests carried out are
summarized in Table 8-24. The loadings according to DBS 918 143 [6] as provided by
RAIL.ONE GmbH are summarized in Table 8-25. Photos of all tested sleepers are given in
Figure 8-39 to Figure 8-44.
6.1 MATERIAL AND SPECIMEN
The tested sleepers were of the type B90.2 as shown in Figure 8-31 and Figure 8-32. In total
16 + 4 sleepers, 16 for the tests and 4 in reserve, were delivered by RAIL.ONE GmbH.
The material of the sleepers is concrete C50/60 with an aggregate of iron ore. Therefore one
sleeper has got a weight of 600 kg, without fastening. In comparison, a standard sleeper B90
has a weight of 333 kg. The main dimensions of one sleeper are: Length 2600 mm, Width
320 mm.
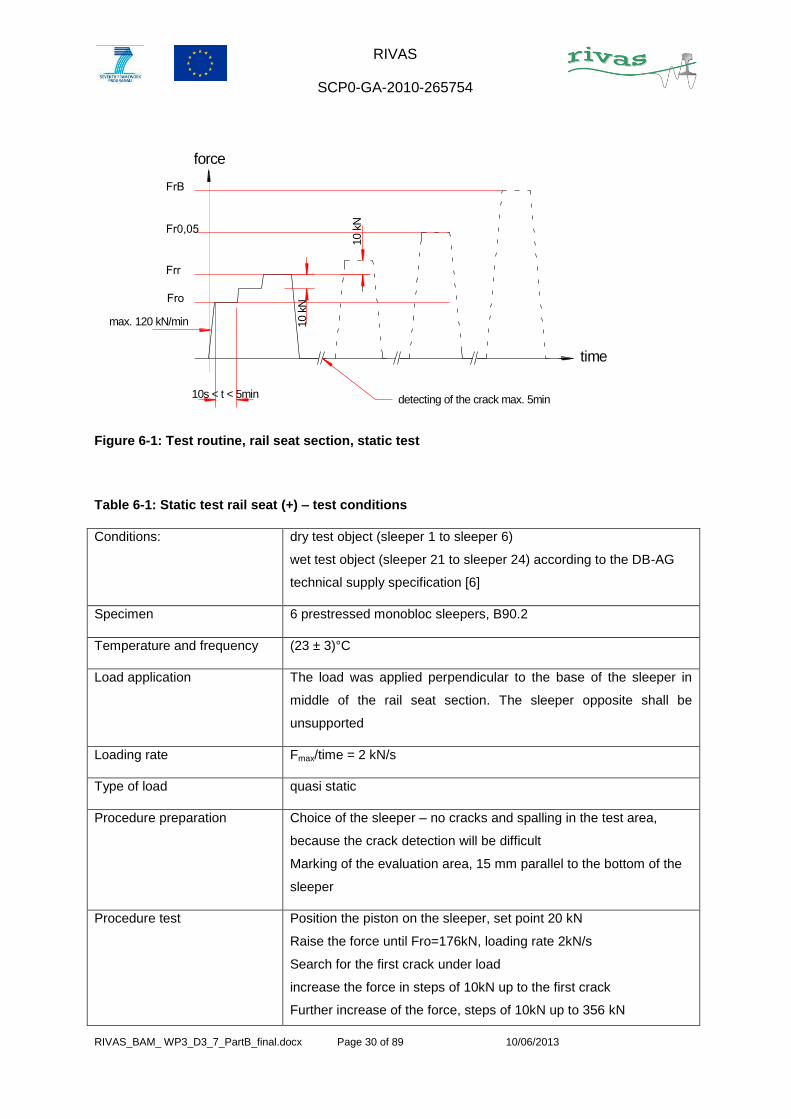
6.2 STATIC TEST RAIL SEAT
The static test on the rail seat section with positive load was carried out with 6 sleepers and
additionally with 4 sleepers. The test set-up is shown in Figure 8-34 and Figure 8-35. The
test routine is shown in Figure 6-1. For the test conditions see Table 6-1.
There were two test sequences. In the first sequence the sleepers were dry during the tests
and in the second one wet. Four sleepers were additionally tested because in the first
sequence 2/3 of the sleepers failed the tests. In tests afterwards the sleepers had been put
under water for a minimum of two days prior the testing according to the technical supply
specitication of the DB-AG.
RIVAS
SCP0-GA-2010-265754
RIVAS_BAM_ WP3_D3_7_PartB_final.docx Page 30 of 89 10/06/2013
Figure 6-1: Test routine, rail seat section, static test
Table 6-1: Static test rail seat (+) – test conditions
Conditions: dry test object (sleeper 1 to sleeper 6)
wet test object (sleeper 21 to sleeper 24) according to the DB-AG
technical supply specification [6]
Specimen 6 prestressed monobloc sleepers, B90.2
Temperature and frequency (23 ± 3)°C
Load application The load was applied perpendicular to the base of the sleeper in
middle of the rail seat section. The sleeper opposite shall be
unsupported
Loading rate Fmax/time = 2 kN/s
Type of load quasi static
Procedure preparation Choice of the sleeper – no cracks and spalling in the test area,
because the crack detection will be difficult
Marking of the evaluation area, 15 mm parallel to the bottom of the
sleeper
Procedure test Position the piston on the sleeper, set point 20 kN
Raise the force until Fro=176kN, loading rate 2kN/s
Search for the first crack under load
increase the force in steps of 10kN up to the first crack
Further increase of the force, steps of 10kN up to 356 kN
time
force
10s < t < 5min
max. 120 kN/min
detecting of the crack max. 5min
10 k
N
10 k
N
Fro
Frr
Fr0,05
FrB

RIVAS
SCP0-GA-2010-265754
RIVAS_BAM_ WP3_D3_7_PartB_final.docx Page 31 of 89 10/06/2013
Unloading of the sleeper and search for cracks
Repeat the loading and unloading up to a crack with a width of
0.05mm at the bottom of the sleeper
Further increase of the force up to the break of the sleeper
Crack detection Cracks are searched at the side of the sleeper in an area 15 mm
from the bottom and under the sleeper between the support
Detection equipment includes crack loupe, mirror, acetone (only
initial crack inspection prior testing)
The results for the static test at the rail seat section are shown in Table 8-26 and Figure 6-2.
For the dry sleeper two of six sleepers passed the first pass/fail criteria with Frr > Fr0, the
others had got the first crack at Frr = Fr0. All sleepers passed the second and third criteria.
For the wet sleeper all four sleepers passed the first, second and third criteria. Only the
testing of wet sleepers is in accordance with DB specification [6] and thus governing, testing
on dry sleepers is on the conservative side, when criteria are met.
Pass/fail criteria: 1. Frr > Fr0 with Fr0 = 176 kN
2. Fr0,05 > k1s * Fr0 = 264 kN with k1s = 1,5
3. FrB > k2s * Fr0 = 369,6 kN with k2s = 2,1
Figure 6-2: Static test, rail seat, B90.2
0
100
200
300
400
500
600
700
1 2 3 4 5 6 21 22 23 24
forc
e [
kN]
number of the sleeper
sleeper tests B90.2static, rail seat
Fr0
Frr
F r0.05
FrB
testcondition dry testcondition wet

RIVAS
SCP0-GA-2010-265754
RIVAS_BAM_ WP3_D3_7_PartB_final.docx Page 32 of 89 10/06/2013
6.3 STATIC TEST CENTRE
The static test at the centre section with negative load was carried out with three sleepers.
The test set-up is shown in Figure 8-36 and Figure 8-37. The test routine is shown in Figure
6-3. For the test conditions see Table 6-2.
Figure 6-3: Test routine, centre section, negative bending moment, static test
Table 6-2: Static test centre (-) – test conditions
Conditions: dry test object
Specimen 3 prestressed monobloc sleepers, B90.2
Temperature and frequency (23 ± 3)°C
Load application The load was applied perpendicular to the base of the sleeper in
middle of the centre section. The sleeper lies upside down in the
test rig.
Loading rate Fmax/time = 2 kN/s
Type of load quasi static
Procedure preparation Choice of the sleeper – no cracks and spalling in the test area,
because the crack detection will be difficult
Marking of the evaluation area, 15 mm parallel to the base (top in
fact) of the sleeper
time
force
10s < t < 5min
max. 120 kN/min 5 k
N
Fcon
Fcrn
FcBn

RIVAS
SCP0-GA-2010-265754
RIVAS_BAM_ WP3_D3_7_PartB_final.docx Page 33 of 89 10/06/2013
Procedure test Position the piston on the sleeper, set point 2 kN
Raise the force until Fc0n = 48 kN, Loading rate 2kN/s
Search for cracks under load
Further increase of the force, steps of 5kN up to Fcrn
Repeat further increase of the force, steps of 5kN up to the break of
the sleeper
Crack detection Cracks are searched at the side of the sleeper in an area 15 mm
from the bottom (top in fact) and under the sleeper between the
support
Detection equipment includes crack loupe, mirror, acetone (only
initial crack inspection prior testing)
The results for the static tests in the centre section are shown in Table 8-29. All three
sleepers passed the pass/fail criterion. Only the testing of wet sleepers is in accordance with
DB specification [6] and thus governing, testing on dry sleepers is on the conservative side,
when criteria are met.
Pass/fail criterion: Fcrn > Fc0n = 48 kN
6.4 DYNAMIC TEST RAIL SEAT
The dynamic test at the rail seat section with positive load was carried out with six sleepers.
The test set-up was the same as for the static test rail seat section. The test routine is shown
in Figure 6-4. For the test conditions see Table 6-3.

RIVAS
SCP0-GA-2010-265754
RIVAS_BAM_ WP3_D3_7_PartB_final.docx Page 34 of 89 10/06/2013
Figure 6-4: Test routine, rail seat section, dynamic test
Table 6-3: Dynamic test rail seat (+) – test conditions
Conditions: dry test object
Specimen 6 prestressed monobloc sleepers, B90.2
Temperature and frequency (23 ± 3)°C
Load application The load was applied perpendicular to the base of the sleeper in the
middle of the rail seat section of the sleeper.
Load levels see Table 8-27: Load steps B90.2, dynamic test rail seat (+)
Type of load Harmonic excitation at f = 5 Hz
Procedure preparation Choice of the sleeper – no spalling in the test area, because the
crack detection will be difficult
Marking of the evaluation area, 15 mm parallel to the bottom of the
sleeper
Procedure test Position the piston on the sleeper, set point 20 kN
Raise the force until Frmiddle = 113 kN, Loading rate 2kN/s
Search for cracks under load
20 kN
50 kN
176 kN = Fro
176 x 1,3 kN = 228,8 kN
176 * 1,7 kN = 299,2 kN
5.000load cycles
2Hz< f <5Hz max. 5 min time
force

RIVAS
SCP0-GA-2010-265754
RIVAS_BAM_ WP3_D3_7_PartB_final.docx Page 35 of 89 10/06/2013
Start the harmonic excitation
Further increase of the force, steps for Frmiddle ≤ 10kN up to
Fr0 = 319,2 kN, 10 kN over the 2nd
pass/fail criteria
Search for cracks after every load step
Crack detection Cracks are searched at the side of the sleeper in an area 15 mm
from the bottom and under the sleeper between the support
Detection equipment includes crack loupe, mirror, acetone (only
initial crack inspection prior testing)
The results for the dynamic test at the rail seat section are shown in Table 8-28. All six
sleepers passed the pass/fail criteria.
Pass/fail criteria: 1. Fr0,05 > k1d * Fr0 = 228,8 kN with k1d = 1,3
2. FrB > k2d * Fr0 = 299,2 kN with k2d = 1,7
6.5 FATIGUE TEST
The fatigue test at the rail seat section with positive load was carried out with one sleeper.
The test set-up is shown in Figure 8-38. The test routine is shown in Figure 6-5. For the test
conditions see Table 6-4.
Figure 6-5: Test routine, rail seat section, fatigue test (source [3])
Load rate 2 kN/s
time
force
2 mill cycles, f = 5 Hz

RIVAS
SCP0-GA-2010-265754
RIVAS_BAM_ WP3_D3_7_PartB_final.docx Page 36 of 89 10/06/2013
Table 6-4: Fatigue test 2 Mio LC (+) – test conditions
Conditions: dry test object
Specimen 1 prestressed monobloc sleepers, B90.2
Temperature and frequency (23 ± 3)°C
Load application The load was applied perpendicular to the base of the sleeper in
middle of the rail seat section. The overhanging sleeper opposite
shall be unsupported
Loading rate Fmax/time = 2 kN/s to the set point and after the harmonic excitation
up to FrB
Load levels Fru = 50 kN, Fr0 = 176 kN
Type of load harmonic excitation f = 3 Hz, 2 mill load cycles
Procedure preparation Choice of the sleeper – no spalling in the test area, because the
crack detection will be difficult
Marking of the evaluation area, 15 mm parallel to the bottom of the
sleeper
Procedure test Position the piston on the sleeper, set point 20 kN
Raise the force until Frr like in the static test rail seat section
start the harmonic excitation, 2 mill load cycles
Raise the force until Fr0 and then until FrB
Crack detection Cracks are searched at the side of the sleeper in an area 15 mm
from the bottom and under the sleeper between the support
Detection equipment includes crack loupe, mirror, acetone (only
initial crack inspection prior testing)
The results for the fatigue test in the rail seat section are given in Table 8-30. The sleeper
passed all three pass/fail criteria.
Pass/fail criteria after the 2 mill
load cycles:
1. Crack width is < 0,1 mm when loaded at Fr0
2. Crack width is < 0,05 mm when unloaded
3. FrB > k3 * Fr0 = 299,2 kN; k3 = k2d = 1,7

RIVAS
SCP0-GA-2010-265754
RIVAS_BAM_ WP3_D3_7_PartB_final.docx Page 37 of 89 10/06/2013
7. CONCLUSION
A possible mitigation measure at track has been found and intensely tested, a heavy sleeper
and soft under sleeper pads. The expected benefit of the heavy sleeper and soft sleeper
pads can be concluded from the results of the parametric study in [7] and the measured
characteristics of the track elements in the present report. The under sleeper pads yield a
reduction of the high-frequency dynamic loads. Therefore, the high-frequency bedding
modulus is of interest. The performance at the track depends on the stiffness per sleeper
which is calculated from the high-frequency bedding modulus multiplied by the sleeper base
area.
The three different under sleeper pads have the following values:
Table 7-1: Overview Results USP parametric study and laboratory tests
Type SLN1010 SLN0613 SLN0315
Dynamic bedding modulus (109 N/m
3)* 0.332 0.146 0.082
Stiffness per standard sleeper (109 N/m) 0.236 0.104 0.058
Resonance frequency standard sleeper (Hz)** 64 50 35
Resonance frequency heavy sleeper (Hz)** 57*** 42*** 28***
* The dynamic bedding modulus is the mean value of the frequencies 40, 80 and 160 Hz (see Table 8-16).
** The resonance frequencies are taken from the parametric study [7].
*** The frequencies with three asterisk are taken from the simulation results of the isolated wide sleeper track as a first
approximation since it has almost the same weight than the tested B90.2 sleeper type.
The reduction of the dynamic train loads starts at a frequency which is 1.4 times the
resonance frequency. The lowest resonance frequency yields the best mitigation of ground
vibrations. The heavier sleeper always yields a better reduction than the standard sleeper,
and the softer under sleeper pads yield better reduction than the stiffer under sleeper pads.
So, it can be concluded that efficient mitigation measures for train induced ground vibration
have been found. The soft under sleeper pads can be combined with the heavy or normal
sleepers, and the new heavy sleeper can be used with the tested or other soft under sleeper
pads. The results of the laboratory tests help to adjust the mitigation measures to the specific
site conditions.

RIVAS
SCP0-GA-2010-265754
RIVAS_BAM_ WP3_D3_7_PartB_final.docx Page 38 of 89 10/06/2013
8. ANNEX
8.1 REFERENCES
[1] DIN 45673-6:2010-08 (E) „Mechanical vibration - Resilient elements used in railway
tracks - Part 6: Laboratory test procedures for under-sleeper pads of concrete
sleepers”; DIN Institute; Beuth Verlag; August 2010
[2] DIN 45673-7:2010-08 (E) „Mechanical vibration - Resilient elements used in railway
tracks - Part 7: Laboratory test procedures for resilient elements of floating slab track
systems”; DIN Institute; Beuth Verlag; August 2010
[3] DIN EN 13230-2:2009-10 (E) “Railway applications Track – Concrete sleepers and
bearers – Part 2: Prestressed monoblock sleepers”; DIN Institute Beuth Verlag;
October 2009
[4] Draft CEN/TC 256: Railway applications – Track – Concrete sleepers and bearers –
concrete sleepers and bearers with under sleeper pads, 2012-02
[5] „Railway Induced Vibration Abatement Solutions“, Description of Work. Collaborative
project for theme SST.2010.1.1-3. “Attenuation of ground-borne vibration affecting
residents near railway lines” in the seventh framework programme, European
Commission, 2010-11
[6] DBS 918 143: Concrete sleepers and bearers for ballast superstructure and slab
track, Technical supply specification of DB-AG; January 2012
[7] Auersch L: Mitigation measures for ballasted tracks - sleepers, sleeper pads and
substructure - Results from the finite-element boundary element method. Report for
RIVAS Deliverable D3.2, BAM, Berlin, January 2012
8.2 ABBREVIATIONS
8.2.1 Terms and definitions
Bonding layer The bonding layer is a grid to connect concrete and USP. It can be
manufactured of felt or geogrid

RIVAS
SCP0-GA-2010-265754
RIVAS_BAM_ WP3_D3_7_PartB_final.docx Page 39 of 89 10/06/2013
Elastomer Material of the USP
Felt Protective layer for the elastomer of the USP, one side or both sides
Tear chip test area for the bonding test
NSP German ballast plate, in German: Normschotterplatte
GBP geometric ballast plate
gauge block ceramic slices with a defined thickness to validate the displacement sensors
8.2.2 Symbols
Examination of the USP
USP under sleeper pad
NSP German ballast plate
GBP geometric ballast plate
A area
C12 secant modulus
Cdyn(f) dynamic bedding modulus
Cstat static bedding modulus
Cstat 0 at-rest value of the static bedding modulus
stress
s1, s2 displacement
f test frequency
RIVAS
SCP0-GA-2010-265754
RIVAS_BAM_ WP3_D3_7_PartB_final.docx Page 40 of 89 10/06/2013
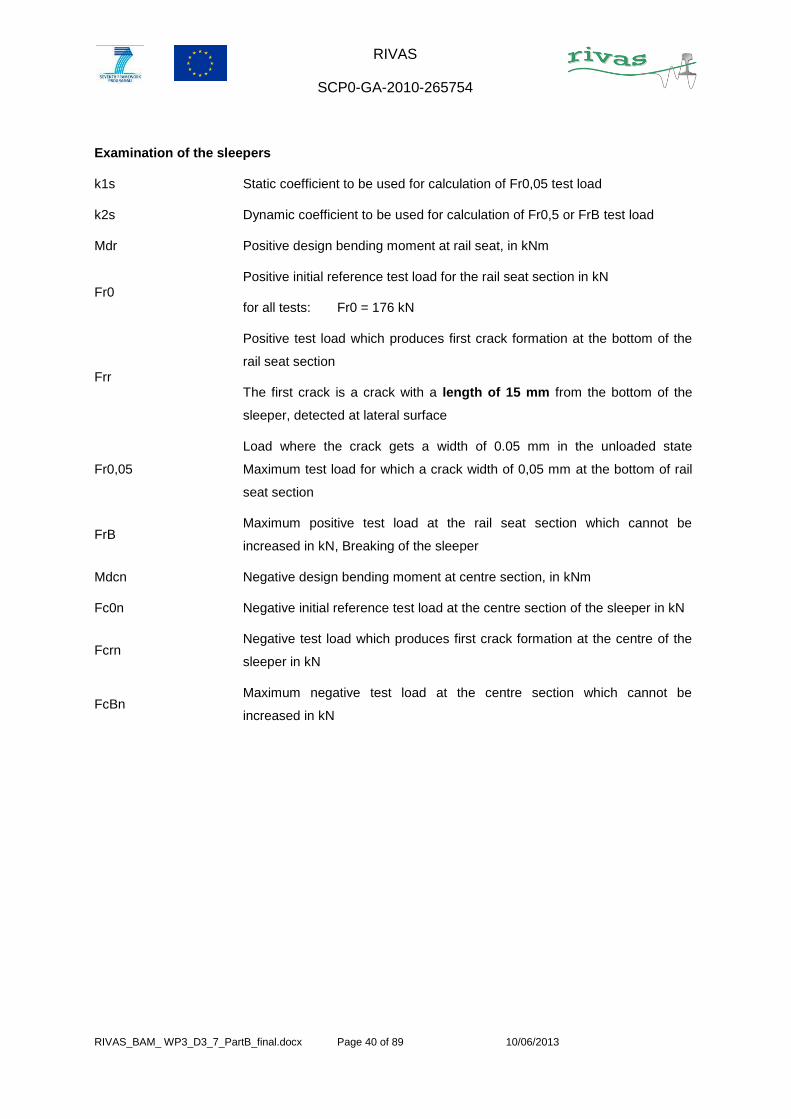
Examination of the sleepers
k1s Static coefficient to be used for calculation of Fr0,05 test load
k2s Dynamic coefficient to be used for calculation of Fr0,5 or FrB test load
Mdr Positive design bending moment at rail seat, in kNm
Fr0 Positive initial reference test load for the rail seat section in kN
for all tests: Fr0 = 176 kN
Frr
Positive test load which produces first crack formation at the bottom of the
rail seat section
The first crack is a crack with a length of 15 mm from the bottom of the
sleeper, detected at lateral surface
Fr0,05
Load where the crack gets a width of 0.05 mm in the unloaded state
Maximum test load for which a crack width of 0,05 mm at the bottom of rail
seat section
FrB Maximum positive test load at the rail seat section which cannot be
increased in kN, Breaking of the sleeper
Mdcn Negative design bending moment at centre section, in kNm
Fc0n Negative initial reference test load at the centre section of the sleeper in kN
Fcrn Negative test load which produces first crack formation at the centre of the
sleeper in kN
FcBn Maximum negative test load at the centre section which cannot be
increased in kN

RIVAS
SCP0-GA-2010-265754
RIVAS_BAM_ WP3_D3_7_PartB_final.docx Page 41 of 89 10/06/2013
8.3 TABLES – EXAMINATION OF THE USP
Table 8-1: Specimens, arrival, SLN 1010
Type Sample Weight L X B H = concrete H = USP* test
[g] [mm] [mm] [mm]
SLN 1010G A-01 22947,0 300x300 103 12 bedding modulus
SLN 1010G A-02 22997,5 300x300 103 12 bedding modulus
SLN 1010G A-03 23060,5 300x300 105 12 bedding modulus
SLN 1010G A-04 22728,0 300x300 103 12
SLN 1010G A-05 23267,0 300x300 103 12
SLN 1010G A-06 22913,5 300x300 105 12
SLN 1010G A-07 23418,0 300x300 105 12
SLN 1010G A-08 23013,5 300x300 105 12
SLN 1010G A-09 23131,5 300x300 105 12
SLN 1010G A-10 22964,0 300x300 103 12
SLN 1010G A-11 22793,0 300x300 103 12 bond strength
average 23021,2
SLN1010 P01 P-01 565,5 300 x 300 only USP 10,0 high-frequency bedding modulus
SLN1010 P02 P-02 554,6 300 x 300 only USP 10,0 high-frequency bedding modulus
SLN1010 P03 P-03 555,7 300 x 300 only USP 10,0 high-frequency bedding modulus
* Height H includes 2 mm ballast contact felt
Vh 7243_Rivas_schwellenbesohlung\Tabellen\Probeneingang\[Probeneingang_pieringer_bis_MAERZ13.xlsx]SLN-en

RIVAS
SCP0-GA-2010-265754
RIVAS_BAM_ WP3_D3_7_PartB_final.docx Page 42 of 89 10/06/2013
Table 8-2: Specimens, arrival, SLN 0613
Type Sample Weight L X B H = concrete H = USP test
[g] [mm] [mm] [mm]
SLN 0613 B-01 22501,5 300x300 102 15 bedding modulus
SLN 0613 B-02 22199,5 300x300 100 15 bedding modulus
SLN 0613 B-03 21826,5 300x300 102 15 bedding modulus
SLN 0613 B-04 22400,0 300x300 100 15
SLN 0613 B-05 22114,0 300x300 102 15 bond strength
SLN 0613 B-06 21998,5 300x300 100 15
SLN 0613 B-07 21734,5 300x300 100 15
SLN 0613 B-08 22078,5 300x300 102 15 freeze-thaw resistance, bond strength
SLN 0613 B-09 22448,5 300x300 100 15
SLN 0613 B-10 22448,5 300x300 103 15
SLN 0613 B-11 22056,0 300x300 100 15
SLN 0613 B-12 22466,5 300x300 102 15
average 22189,4
SLN 0613 B-21 42600,0 300x300 195 15 fatigue test
SLN 0613 B-31 20015,0 200x200 200 2x15 shear test
SLN 0613 B-32 20041,0 200x200 200 2x15 shear test
SLN 0613 B-33 20052,5 200x200 200 2x15 shear test
average 20036,2
SLN0613 P01 P-01 484,3 300 x 300 only USP 13 high-frequency bedding modulus
* Height H includes 2 mm ballast contact felt
Vh 7243_Rivas_schwellenbesohlung\Tabellen\Probeneingang\[Probeneingang_pieringer_bis_MAERZ13.xlsx]SLN-en

RIVAS
SCP0-GA-2010-265754
RIVAS_BAM_ WP3_D3_7_PartB_final.docx Page 43 of 89 10/06/2013
Table 8-3: Specimens, arrival, SLN 0315
Type Sample Weight L X B H = concrete H = USP test
[g] [mm] [mm] [mm]
SLN 0315 C-01 21855,0 300x300 100 17 bedding modulus
SLN 0315 C-02 21692,0 300x300 100 17 bedding modulus
SLN 0315 C-03 21969,0 300x300 100 17 bedding modulus
SLN 0315 C-04 21744,5 300x300 100 17
SLN 0315 C-05 21695,0 300x300 100 16
SLN 0315 C-06 22281,0 300x300 100 15
SLN 0315 C-07 21563,0 300x300 98 17
SLN 0315 C-08 21607,0 300x300 100 16
SLN 0315 C-09 22054,0 300x300 100 15 bond strength
SLN 0315 C-10 22110,0 300x300 100 15 bond strength
SLN 0315 C-11 22107,0 300x300 100 16
average 21879,8
SLN0315 P01 P-01 435,5 300 x 300 only USP 15 high-frequency bedding modulus
SLN0315 P02 P-02 435,9 300 x 300 only USP 15 high-frequency bedding modulus
SLN0315 P03 P-03 432,8 300 x 300 only USP 15 high-frequency bedding modulus
* Height H includes 2 mm ballast contact felt
Vh 7243_Rivas_schwellenbesohlung\Tabellen\Probeneingang\[Probeneingang_pieringer_bis_MAERZ13.xlsx]SLN-en

RIVAS
SCP0-GA-2010-265754
RIVAS_BAM_ WP3_D3_7_PartB_final.docx Page 44 of 89 10/06/2013
8.3.1 Measuring System
Table 8-4: Measuring system static and at-rest value of the static bedding modulus, low-
frequency bedding modulus
Test rig static and at-rest value of the static bedding modulus and low-frequency bedding modulus
Designation KPM - testing machine for small components 100 kN
Type: servo-hydraulic tensile-compression testing machine
Producer: Carl Schenck AG, Darmstadt
Piston stroke: smax = 125 mm
Force measurement
Designation Load cell PM 100 Rn; suitable for testing machines class 1
Producer: Carl Schenck AG, Darmstadt
Maximum static force Fmax = 100 kN
Maximum dynamic force Fdyn = 80 kN
Calibration periodically, test certificate MPA
Displacement measurement (external), because the piston stroke is not sufficient
Designation inductive displacement sensors WA 10 HBM
Quantity 2
Measuring range: 0 – 10 mm
Output signal: 80 mV/V
Linearity error: ≤ ±0.2 %
Temperature range: -20 to +80°C
Validation made by gauge blocks
Climatic chamber
Temperature range: – 40 °C to + 180 °C
Dimensions inside: height 1000 mm, width 1200 mm, depth 700 mm
Electronic control and measuring technique
type Instron series 8400
control computer
measurement amplifier separate, every single channel can be recorded digitally
Maximum measuring frequency per channel: 5 kHz

RIVAS
SCP0-GA-2010-265754
RIVAS_BAM_ WP3_D3_7_PartB_final.docx Page 45 of 89 10/06/2013
Table 8-5: Measuring system high-frequency bedding modulus
Test rig High-frequency bedding modulus of elastomer pads
Designation
Type: servo-hydraulic tensile-compression testing machine with 7 kN cylinder
Producer: BAM/ Instron Systems
Piston stroke: smax = ±50 mm
Force measurement
Designation Load cell PM 07 Rn; suitable for testing machines class 1
Producer: Instron
Maximum static force Fmax = ±7 kN
Maximum dynamic force Fdyn = 6 kN
Calibration periodically, test certificate MPA
Displacement measurement (external), because the piston stroke is not sufficient
Designation inductive displacement sensors WA05
Quantity 3
Measuring range: 0 – 2 mm
Output signal: 80 mV/V
Linearity error: ≤ ±0.2 %
Temperature range: -20 to +80°C
Validation made by gauge blocks
Electronic control and measuring technique
type Instron series 8800
control computer
Maximum measuring frequency per channel: 5 kHz

RIVAS
SCP0-GA-2010-265754
RIVAS_BAM_ WP3_D3_7_PartB_final.docx Page 46 of 89 10/06/2013
Table 8-6: Measuring system fatigue test
Test rig fatigue test
Designation ballast test rig with 400kN cylinder (ballast trough)
Type: fatigue test of elastomer pads in ballast
Producer: BAM/ Instron Systems, test area
Piston stroke: smax = ±200 mm
Force measurement
Designation Load cell PM 400 Rn; suitable for testing machines class 1
Producer: Carl Schenck AG, Darmstadt
Maximum static force Fmax = 400 kN
Maximum dynamic force Fdyn = 320 kN
Calibration Displacement measurement (external), because the piston stroke is not sufficient
Designation laser displacement sensors
Type Micro-Epsilon optoNCDT 1401
Quantity 4
Measuring range: 0 – 50 mm
Output signal: 12.5 mm/V
Linearity error: ≤ ±0.2 %
Temperature range: Validation made by gauge blocks
Electronic control and measuring technique
electronic control system type Instron series 8500
control computer
analogous signals sampled by 16 bit A-D converter
measuring system Cronos, IMC
Maximum measuring frequency per channel: 100 kHz

RIVAS
SCP0-GA-2010-265754
RIVAS_BAM_ WP3_D3_7_PartB_final.docx Page 47 of 89 10/06/2013
Table 8-7: Measuring system bond strength by pull-off
Test rig bond strength by pull-off
Designation „RK Toni“ 25 kN
Type: Producer: MFL/ Toni-Technik
Piston stroke: smax = 125 mm
Force measurement
Designation Load cell suitable for testing machines class 1
Producer: Maximum static force Fmax = 25 kN
Maximum dynamic force Fdyn = 25 kN
Calibration periodically, test certificate MPA
Displacement measurement (internal), piston stroke
Measuring range: 0 – 250 mm
Output signal: Linearity error: ≤ ±0.2 %
Validation Electronic control and measuring technique
type MTS Serie TestStar
control computer
Maximum measuring frequency per channel: 5 kHz
RIVAS
SCP0-GA-2010-265754
RIVAS_BAM_ WP3_D3_7_PartB_final.docx Page 48 of 89 10/06/2013
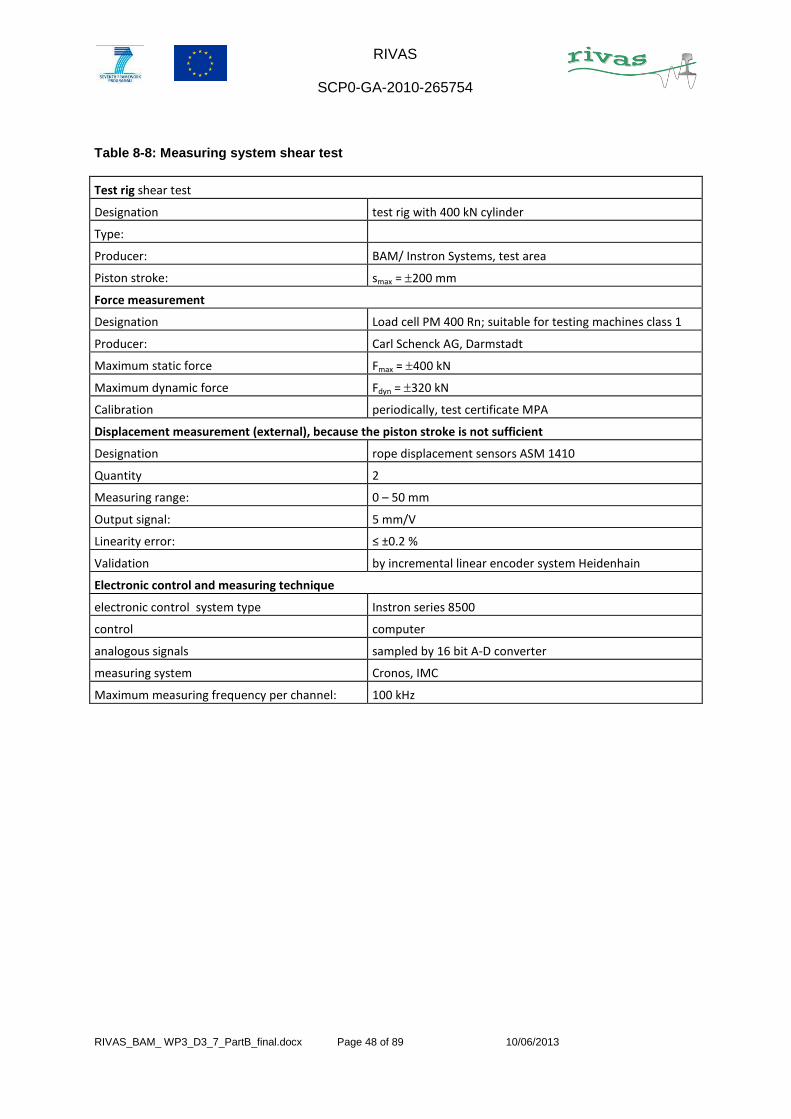
Table 8-8: Measuring system shear test
Test rig shear test
Designation test rig with 400 kN cylinder
Type: Producer: BAM/ Instron Systems, test area
Piston stroke: smax = 200 mm
Force measurement
Designation Load cell PM 400 Rn; suitable for testing machines class 1
Producer: Carl Schenck AG, Darmstadt
Maximum static force Fmax = 400 kN
Maximum dynamic force Fdyn = 320 kN
Calibration periodically, test certificate MPA
Displacement measurement (external), because the piston stroke is not sufficient
Designation rope displacement sensors ASM 1410
Quantity 2
Measuring range: 0 – 50 mm
Output signal: 5 mm/V
Linearity error: ≤ ±0.2 %
Validation by incremental linear encoder system Heidenhain
Electronic control and measuring technique
electronic control system type Instron series 8500
control computer
analogous signals sampled by 16 bit A-D converter
measuring system Cronos, IMC
Maximum measuring frequency per channel: 100 kHz

RIVAS
SCP0-GA-2010-265754
RIVAS_BAM_ WP3_D3_7_PartB_final.docx Page 49 of 89 10/06/2013
8.3.2 Results USP
Table 8-9: SLN1010 – static and at-rest value of the static bedding modulus - DIN 45673-6; 23°C,
0°C, -20°C
SLN1010 – static bedding modulus - DIN 45673-6; 23°C; NSP
sample C01 [N/mm³]
C02 [N/mm³]
C03 [N/mm³]
average [N/mm³]
Cstat medium ballast compaction 0,0991 0,0935 0,0945 0,0957
Cstat high ballast compaction 0,1322 0,1258 0,1264 0,1281
Cstat0 medium ballast compaction 0,0825 0,0787 0,0792 0,0801
Cstat0 high ballast compaction 0,1121 0,1076 0,1080 0,1092
SLN1010 – static bedding modulus - DIN 45673-6; 0°C; NSP
sample C01 [N/mm³]
C02 [N/mm³]
C03 [N/mm³]
average [N/mm³]
Cstat medium ballast compaction 0,0964 0,0920 0,0969 0,0951
Cstat high ballast compaction 0,1298 0,1240 0,1298 0,1279
Cstat0 medium ballast compaction 0,0816 0,0782 0,0820 0,0806
Cstat0 high ballast compaction 0,1123 0,1079 0,1122 0,1108
SLN1010 – static bedding modulus - DIN 45673-6; -20°C; NSP
sample C01 [N/mm³]
C02 [N/mm³]
C03 [N/mm³]
average [N/mm³]
Cstat medium ballast compaction 0,0931 0,1084 0,1035 0,1017
Cstat high ballast compaction 0,1262 0,1409 0,1383 0,1351
Cstat0 medium ballast compaction 0,0788 0,0838 0,0874 0,0833
Cstat0 high ballast compaction 0,1090 0,1147 0,1197 0,1145
\Vh7243_Rivas_schwellenbesohlung\Messdaten\T6_Ergebnisse_Excel\[1_Bericht_SLN-Getzner_Bettungsmodul-alle_B.xlsx]A_StatBett

RIVAS
SCP0-GA-2010-265754
RIVAS_BAM_ WP3_D3_7_PartB_final.docx Page 50 of 89 10/06/2013
Table 8-10: SLN0613 – static and at-rest value of the static bedding modulus - DIN 45673-6;
23°C, 0°C, -20°C
SLN0613 – static bedding modulus - DIN 45673-6; 23°C; NSP
sample B01 [N/mm³]
B02 [N/mm³]
B03 [N/mm³]
average [N/mm³]
Cstat medium ballast compaction 0,0468 0,0475 0,0441 0,0461
Cstat high ballast compaction 0,0568 0,0576 0,0532 0,0559
Cstat0 medium ballast compaction 0,0399 0,0405 0,0381 0,0395
Cstat0 high ballast compaction 0,0493 0,0500 0,0468 0,0487
SLN0613 – static bedding modulus - DIN 45673-6; 0°C; NSP
sample B01 [N/mm³]
B02 [N/mm³]
B03 [N/mm³]
average [N/mm³]
Cstat medium ballast compaction 0,0476 0,0473 0,0473 0,0474
Cstat high ballast compaction 0,0576 0,0577 0,0575 0,0576
Cstat0 medium ballast compaction 0,0405 0,0409 0,0401 0,0405
Cstat0 high ballast compaction 0,0504 0,0510 0,0502 0,0505
SLN0613 – static bedding modulus - DIN 45673-6; -20°C; NSP
sample B01 [N/mm³]
B02 [N/mm³]
B03 [N/mm³]
average [N/mm³]
Cstat medium ballast compaction 0,0520 0,0494 0,0495 0,0503
Cstat high ballast compaction 0,0626 0,0597 0,0600 0,0608
Cstat0 medium ballast compaction 0,0420 0,0403 0,0407 0,0410
Cstat0 high ballast compaction 0,0522 0,0502 0,0508 0,0511
\Vh7243_Rivas_schwellenbesohlung\Messdaten\T6_Ergebnisse_Excel\[1_Bericht_SLN-Getzner_Bettungsmodul-alle_B.xlsx]A_StatBett

RIVAS
SCP0-GA-2010-265754
RIVAS_BAM_ WP3_D3_7_PartB_final.docx Page 51 of 89 10/06/2013
Table 8-11: SLN0315 – static and at-rest value of the static bedding modulus - DIN 45673-6
(4.1); 23°C, 0°C, -20°C
SLN0315 – static bedding modulus - DIN 45673-6; 23°C; NSP
sample C01 [N/mm³]
C02 [N/mm³]
C03 [N/mm³]
average [N/mm³]
Cstat medium ballast compaction 0,0293 0,0292 0,0297 0,0294
Cstat high ballast compaction 0,0374 0,0374 0,0379 0,0376
Cstat0 medium ballast compaction 0,0251 0,0251 0,0254 0,0252
Cstat0 high ballast compaction 0,0331 0,0331 0,0335 0,0332
SLN0315 – static bedding modulus - DIN 45673-6; 0°C; NSP
sample C01 [N/mm³]
C02 [N/mm³]
C03 [N/mm³]
average [N/mm³]
Cstat medium ballast compaction 0,0306 0,0306 0,0308 0,0307
Cstat high ballast compaction 0,0387 0,0386 0,0388 0,0387
Cstat0 medium ballast compaction 0,0247 0,0252 0,0253 0,0251
Cstat0 high ballast compaction 0,0329 0,0333 0,0334 0,0332
SLN0315 – static bedding modulus - DIN 45673-6; -20°C; NSP
sample C01 [N/mm³]
C02 [N/mm³]
C03 [N/mm³]
average [N/mm³]
Cstat medium ballast compaction 0,0352 0,0332 0,0332 0,0339
Cstat high ballast compaction 0,0436 0,0423 0,0418 0,0426
Cstat0 medium ballast compaction 0,0267 0,0256 0,0259 0,0261
Cstat0 high ballast compaction 0,0354 0,0346 0,0346 0,0349
\Vh7243_Rivas_schwellenbesohlung\Messdaten\T6_Ergebnisse_Excel\[1_Bericht_SLN-Getzner_Bettungsmodul-alle_B.xlsx]A_StatBett

RIVAS
SCP0-GA-2010-265754
RIVAS_BAM_ WP3_D3_7_PartB_final.docx Page 52 of 89 10/06/2013
Table 8-12: static and at-rest value of the static bedding modulus – different loading plates
SLN1010 – static bedding modulus - DIN 45673-6, different profiled plates
C EU-GBP [N/mm³] German-NSP [N/mm³] variance EU-GBP / German-NSP
Cstat medium ballast compaction 0,0894 0,0992 -10 %
Cstat high ballast compaction 0,1212 0,1322 -8 %
Cstat0 medium ballast compaction
0,0746 0,0825 -10 %
Cstat0 high ballast compaction 0,1030 0,1121 -8 %
SLN0613 – static bedding modulus - DIN 45673-6, different profiled plates
C EU-GBP [N/mm³] German-NSP [N/mm³] variance EU-GBP / German-NSP
Cstat medium ballast compaction 0,0515 0,0468 10 %
Cstat high ballast compaction 0,0646 0,0568 14 %
Cstat0 medium ballast compaction
0,0425 0,0399 7 %
Cstat0 high ballast compaction 0,0546 0,0493 11 %
SLN0315 – static bedding modulus - DIN 45673-6, different profiled plates
C EU-GBP [N/mm³] German-NSP [N/mm³] variance EU-GBP / German-NSP
Cstat medium ballast compaction 0,0346 0,0293 18 %
Cstat high ballast compaction 0,0415 0,0374 11 %
Cstat0 medium ballast compaction
0,0265 0,0251 6 %
Cstat0 high ballast compaction 0,0338 0,0331 2 %
\\scl1\Service31\720SERV\02_Vorhaben\Vh 7243_Rivas_schwellenbesohlung\Messdaten\StatEUdeu\[StatEUdeu.xls]Tabelle1

RIVAS
SCP0-GA-2010-265754
RIVAS_BAM_ WP3_D3_7_PartB_final.docx Page 53 of 89 10/06/2013
Table 8-13: low-frequency bedding modulus - DIN 45673-6 (4.2); 23°C
SLN1010 – low-frequency bedding modulus - DIN 45673-6 (4.2); 23°C; NSP
frequency [Hz] A01 [N/mm³]
A02 [N/mm³]
A03 [N/mm³]
average [N/mm³]
5 0,1236 0,1176 0,1174 0,1195
10 0,1280 0,1212 0,1220 0,1237
20 0,1316 0,1249 0,1252 0,1272
30 0,1350 0,1294 0,1282 0,1309
SLN0613 – low-frequency bedding modulus - DIN 45673-6 (4.2); 23°C; NSP
frequency [Hz] B01 [N/mm³]
B02 [N/mm³]
B03 [N/mm³]
average [N/mm³]
5 0,0572 0,0582 0,0528 0,0561
10 0,0593 0,0600 0,0546 0,0580
20 0,0612 0,0620 0,0568 0,0600
30 0,0628 0,0636 0,0581 0,0615
SLN0315 – low-frequency bedding modulus - DIN 45673-6 (4.2); 23°C; NSP
frequency [Hz] C01 [N/mm³]
C02 [N/mm³]
C03 [N/mm³]
average [N/mm³]
5 0,0369 0,0357 0,0371 0,0366
10 0,0380 0,0370 0,0382 0,0377
20 0,0395 0,0386 0,0401 0,0394
30 0,0410 0,0402 0,0422 0,0411 \\scl1\Service31\720SERV\02_Vorhaben\Vh 7243_Rivas_schwellenbesohlung\Messdaten\Körperschall\Körperschall_Excel\[1_Bericht_Oct24Oct25Körperschall.xls]DatenBericht
Table 8-14: low-frequency bedding modulus - DIN 45673-6 (4.2)
SLN1010 – low-frequency bedding modulus - DIN 45673-6 (4.2); NSP, sample A3
Temperatur -20°C 0°C 23°C
Cdyn1 (10Hz) [N/mm³] 0,1649 0,1236 0,1220
SLN0613 – low-frequency bedding modulus - DIN 45673-6 (4.2); NSP, sample B01
Temperature -20°C 0°C 23°C
Cdyn1 (10Hz) [N/mm³] 0,1068 0,0635 0,0593
SLN0315 – low-frequency bedding modulus - DIN 45673-6 (4.2); NSP, sample C01
Temperature -20°C 0°C 23°C
Cdyn1 (10Hz) [N/mm³] 0,0824 0,0413 0,0380 \\scl1\Service31\720SERV\02_Vorhaben\Vh 7243_Rivas_schwellenbesohlung\Messdaten\Körperschall\Körperschall_Excel\[1_Bericht_Oct24Oct25Körperschall.xls]DatenBericht

RIVAS
SCP0-GA-2010-265754
RIVAS_BAM_ WP3_D3_7_PartB_final.docx Page 54 of 89 10/06/2013
Table 8-15: Low-frequency dynamic stiffening ratio on NSP
SLN1010 Low-frequency dynamic stiffening ratio DIN 45673-6 (4.3), NSP
Cdyn1(10 Hz) [N/mm³] Cstat [N/mm³] kdyn1(10 Hz)
SLN1010 medium ballast compaction 0,1237 0,0957 1,29
SLN1010 high ballast compaction 0,1237 0,1281 0,97
SLN0613 Low-frequency dynamic stiffening ratio DIN 45673-6 (4.3), NSP
Cdyn1(10 Hz) [N/mm³] Cstat [N/mm³] kdyn1(10 Hz)
SLN0613 medium ballast compaction 0,0580 0,0461 1,26
SLN0613 high ballast compaction 0,0580 0,0559 1,04
SLN0315 Low-frequency dynamic stiffening ratio DIN 45673-6 (4.3), NSP
Cdyn1(10 Hz) [N/mm³] Cstat [N/mm³] kdyn1(10 Hz)
SLN0315 medium ballast compaction 0,0377 0,0294 1,28
SLN0315 high ballast compaction 0,0377 0,0376 1,00
\\scl1\Service31\720SERV\02_Vorhaben\Vh 7243_Rivas_schwellenbesohlung\Messdaten\T6_Ergebnisse_Excel\[SLN_Dyn_Vers_T6.xls]Tabelle1

RIVAS
SCP0-GA-2010-265754
RIVAS_BAM_ WP3_D3_7_PartB_final.docx Page 55 of 89 10/06/2013
Table 8-16: high-frequency bedding modulus (under preload) - DIN 45673-6 (4.4) on NSP
SLN0315 – high-frequency bedding modulus - DIN 45673-6 (4.4); 23°C; NSP; 7,0 mm/s
frequency [Hz] P01 [N/mm³]
P02 [N/mm³]
P03 [N/mm³]
average [N/mm³]
average [N/mm³]
10 0,0718 0,0733 0,0731 0,0727
20 0,0757 0,0772 0,0764 0,0764
40 0,0796 0,0806 0,0802 0,0801
80 0,0817 0,0844 0,0826 0,0829 0,0822
160 0,0825 0,0818 0,0862 0,0835
SLN0613 – high-frequency bedding modulus - DIN 45673-6 (4.4); 23°C; NSP; 7,0 mm/s
frequency [Hz] P01 [N/mm³]
P02 [N/mm³]
P03 [N/mm³]
average [N/mm³]
average [N/mm³]
10 0,1230 0,1260 0,1245
20 0,1324 0,1337 0,1331
40 0,1397 0,1418 0,1408
80 0,1452 0,1480 0,1466 0,1462
160 0,1480 0,1546 0,1513
SLN1010 – high-frequency bedding modulus - DIN 45673-6 (4.4); 23°C; NSP; 7,0 mm/s
frequency [Hz] P01 [N/mm³]
P02 [N/mm³]
P03 [N/mm³]
average [N/mm³]
average [N/mm³]
10 0,2653 0,2773 0,2651 0,2692
20 0,2929 0,3067 0,2926 0,2974
40 0,3089 0,3288 0,3116 0,3164
80 0,3232 0,3489 0,3323 0,3348 0,3319
160 0,3342 0,3656 0,3333 0,3444
\\scl1\Service31\720SERV\02_Vorhaben\Vh 7243_Rivas_schwellenbesohlung\Messdaten\Körperschall\Körperschall_Excel\[1_Bericht_Oct24Oct25Körperschall.xls]DatenBericht

RIVAS
SCP0-GA-2010-265754
RIVAS_BAM_ WP3_D3_7_PartB_final.docx Page 56 of 89 10/06/2013
Table 8-17: Higher-frequency dynamic stiffening ratio on NSP
SLN1010 High-frequency dynamic stiffening ratio DIN 45673-6 (4.3); NSP
Cdyn2(80 Hz) [N/mm³] Cstat [N/mm³] kdyn2(80 Hz)
SLN1010 medium ballast compaction 0,3348 0,0957 3,50
SLN1010 high ballast compaction 0,3348 0,1281 2,61
SLN0613 High-frequency dynamic stiffening ratio DIN 45673-6 (4.3); NSP
Cdyn2(80 Hz) [N/mm³] Cstat [N/mm³] kdyn2(80 Hz)
SLN0613 medium ballast compaction 0,1466 0,0461 3,18
SLN0613 high ballast compaction 0,1466 0,0559 2,62
SLN0315 High-frequency dynamic stiffening ratio DIN 45673-6 (4.3); NSP
Cdyn2(80 Hz) [N/mm³] Cstat [N/mm³] kdyn2(80 Hz)
SLN0315 medium ballast compaction 0,0829 0,0294 2,82
SLN0315 high ballast compaction 0,0829 0,0376 2,20
\\scl1\Service31\720SERV\02_Vorhaben\Vh 7243_Rivas_schwellenbesohlung\Messdaten\T6_Ergebnisse_Excel\[SLN_Dyn_Versteifung_T6.xls]Tabelle1

RIVAS
SCP0-GA-2010-265754
RIVAS_BAM_ WP3_D3_7_PartB_final.docx Page 57 of 89 10/06/2013
Table 8-18: Mechanical fatigue strength - Minute of the damage - DIN 45673-6 (5.2)
Minute of the damages
5 Mio 09.11.2012 specimen: SLN 0613 B - 21
Nr. depth [mm] size or length [mm] comment
1 6 45 on the right side of [1]
2 3 25 three damages in the area of [2]
3 3 40 * 50 big area
4 5 20
5 9 45 perforated USP up to the concrete!
6 2,5 40 - 50
7 6 45 slender
8 11 40 broken off on the border (b) damage under [8] 5mm depth)
9 11 30 edge broken off up to the concrete
10 6 50 on the right side of [10]
\\scl1\Service31\720SERV\02_Vorhaben\Vh 7243_Rivas_schwellenbesohlung\Bilder\Schotterstand\2012_11_08_ 5M Lastwechsel\[Schadenaufnahmen.xlsx]Bericht-en
Minute of the damages 8 Mio 04.12.2012 specimen: SLN 0613 B - 21
Nr. depth [mm] size or length [mm] comment
1 7,5 50 pressure area
2 6 20 cut
3 3 45 cut
4 6 20 pressure area
5 8 60 pressure area
6 5 30 pressure area
7 6 15 pressure area
8 5 20 pressure area
9 5 60 pressure area
10 6 40 pressure area
11 5 45 pressure area
12 3,5 30 pressure area
13 12 20 pressure area
14 7 45 pressure area
15 4 20 pressure area
16 6,5 35 pressure area
17 6 40 pressure area
18 5 60 pressure area
19 3 50 pressure area
20 3 40 pressure area \\scl1\Service31\720SERV\02_Vorhaben\Vh 7243_Rivas_schwellenbesohlung\Tabellen\Schotter_dauerversuch\[Schadenaufnahme01.xlsx]Bericht-en

RIVAS
SCP0-GA-2010-265754
RIVAS_BAM_ WP3_D3_7_PartB_final.docx Page 58 of 89 10/06/2013
Table 8-19: bond strength by pull of - DIN 45673-6 (5.3)
Pull-off strength SLN 1010 A 11, DIN 45673-6
Sample Load Stress Displacement Position
- [N] [N/mm2] [mm] -
01 1595,3 0,812 4,50 bonding layer
02 1433,0 0,730 3,98 bonding layer
03 1225,5 0,624 3,71 bonding layer
04 1403,4 0,715 3,62 bonding layer
05 1285,8 0,655 3,28 bonding layer
Pull-off strength SLN 0613 B 05, DIN 45673-6
Sample Load Stress Displacement Position
- [N] [N/mm2] [mm] -
01 841,1 0,428 8,60 bonding layer
02 788,8 0,402 8,27 bonding layer
03 760,2 0,387 7,28 bonding layer
04 649,2 0,331 7,74 bonding layer
05 891,4 0,454 9,07 bonding layer
arithmetic average 0,400
standard deviation 0,042
Pull-off strength SLN 315 C 09, DIN 45673-6
Sample Load Stress Displacement Position
- [N] [N/mm2] [mm] -
01 758,4 0,386 10,18 bonding layer
02 747,5 0,381 9,97 bonding layer
03 845,0 0,430 12,94 Elastomer + bonding layer
04 939,2 0,478 14,85 Elastomer
05 854,5 0,435 12,65 Elastomer
Pull-off strength SLN 0613 B 08, DIN 45673-6, after freeze thaw test
Sample Load Stress Displacement Position
- [N] [N/mm2] [mm] -
01 848,3 0,432 9,42 bonding layer
02 825,1 0,420 7,48 bonding layer
03 680,9 0,347 8,41 Elastomer + bonding layer
04 609,5 0,310 5,37 bonding layer
05 633,6 0,323 5,72 bonding layer
arithmetic average 0,366
standard deviation 0,050
Vh 7243_Rivas_schwellenbesohlung\Messdaten\Abreißfestigkeit\Tabellen\[Abreißverhalten_Alle_Einfach_Tabellen.xlsx]Tabelle1

RIVAS
SCP0-GA-2010-265754
RIVAS_BAM_ WP3_D3_7_PartB_final.docx Page 59 of 89 10/06/2013
Table 8-20: shear strength - DIN 45673-6 (5.4)
Shear strength SLN0613 – DIN 45673-6 (5.4)
specimen stress [N/mm²]
B31 0,558
B32 0,567
B33 0,563
Shear strength SLN0315 – DIN 45673-6 (5.4)
specimen stress [N/mm²]
C31 0,407
C32 0,459
C33 0,457
Comment: SLN1010 was not requested (no specimen were delivered and no tests were carried out) \\scl1\Service31\720SERV\02_Vorhaben\Vh 7243_Rivas_schwellenbesohlung\Messdaten\AbSch\[Tabelle_Abscherfestigkeit_korr.xlsx]Tabelle1
Table 8-21: Freeze-thaw resistance - DIN 45673-6 (5.5)
SLN0613 – freeze-thaw resistance - DIN 45673-6 (5.5); 23 °C; NSP low-frequency bedding modulus
frequency [Hz]
before the test after the test variance
Hz [N/mm³] [N/mm³]
5 0,0520 0,0524 1%
10 0,0537 0,0546 2%
20 0,0556 0,0566 2%
30 0,0570 0,0587 3% \\scl1\Service31\720SERV\02_Vorhaben\Vh 7243_Rivas_schwellenbesohlung\Messdaten\FrostTau\FrostTau-Tabellen\[SLN0613_B05_FrostTau.xls]SLN0613_B05_FrostTau

RIVAS
SCP0-GA-2010-265754
RIVAS_BAM_ WP3_D3_7_PartB_final.docx Page 60 of 89 10/06/2013
8.4 FIGURES - EXAMINATION OF THE USP
8.4.1 Specimen
Figure 8-1: Under-sleeper pad SLN1010
Figure 8-2: Under-sleeper pad SLN0315
SLN 1010
SLN 0315
5 cm

RIVAS
SCP0-GA-2010-265754
RIVAS_BAM_ WP3_D3_7_PartB_final.docx Page 61 of 89 10/06/2013
8.4.2 Test rig
Figure 8-3: Test rig for small components (KPM), static and low-frequency bedding modulus
Figure 8-4: Test rig for small components (KPM), static and low-frequency bedding modulus,
detail
Concrete block with
USP
German ballast plate

RIVAS
SCP0-GA-2010-265754
RIVAS_BAM_ WP3_D3_7_PartB_final.docx Page 62 of 89 10/06/2013
Figure 8-5: Test rig for high-frequency bedding modulus (structure-borne noise)
Figure 8-6: Test rig for high-frequency bedding modulus (structure-borne noise), detail
Spring for preload
German ballast plate
Under sleeper pad

RIVAS
SCP0-GA-2010-265754
RIVAS_BAM_ WP3_D3_7_PartB_final.docx Page 63 of 89 10/06/2013
Figure 8-7: Test rig fatigue test for USP in ballast trough
Figure 8-8: Test rig fatigue test for USP in ballast trough, detail
Ballast trough
USP

RIVAS
SCP0-GA-2010-265754
RIVAS_BAM_ WP3_D3_7_PartB_final.docx Page 64 of 89 10/06/2013
Figure 8-9: Test rig bond strength
Figure 8-10: Test rig bond strength, detail

RIVAS
SCP0-GA-2010-265754
RIVAS_BAM_ WP3_D3_7_PartB_final.docx Page 65 of 89 10/06/2013
Figure 8-11: Test rig shear test
Figure 8-12: Test rig shear test, detail
USP
Concrete cube
200 * 200 * 200 mm

RIVAS
SCP0-GA-2010-265754
RIVAS_BAM_ WP3_D3_7_PartB_final.docx Page 66 of 89 10/06/2013
8.4.3 Evaluation static bedding modulus
Figure 8-13: SLN0315 static bedding modulus, stress and displacement during the test
Figure 8-14: SLN0315 static bedding modulus
SLN315 sample C01
7.2 IngenieurbauLayout: SLN0314_C01_demo_quad.TDR
File: SLN0314_C01_demo.TDM
0 500 1000 1500 2000 2500
time [s]
0.00
0.05
0.10
0.15
0.20
0.25
Str
es
s [
N/m
m²]
SLN315 sample C01
7.2 IngenieurbauLayout: SLN0314_C01_demo_quad.TDR
File: SLN0314_C01_demo.TDM
0 500 1000 1500 2000 2500
time [s]
0.00
1.00
2.00
3.00
4.00
5.00
6.00
7.00
dis
pla
ce
me
nt
[mm
]
SLN0315
7.2 Ingenieurbau Layout: SLN0315_C01_report.TDR
File: SLN0315_C_statBett_T6.TDM
0 2 4 6 8
displacement [mm]
0.00
0.05
0.10
0.15
0.20
0.25
Str
es
s [
N/m
m²]
SLN0315_C01_statBett_T6
SLN0315_C02_statBett_T6
SLN0315_C03_statBett_T6
hig
h b
alla
st
co
mp
ressio
n
mid
balla
st
co
mp
ressio
n

RIVAS
SCP0-GA-2010-265754
RIVAS_BAM_ WP3_D3_7_PartB_final.docx Page 67 of 89 10/06/2013
Figure 8-15: SLN0613 static bedding modulus, stress and displacement during the test
Figure 8-16: SLN0613 static bedding modulus
SLN0613
7.2 IngenieurbauLayout: SLN0613_report.TDR
File: SLN0613_B_statBett_T6.TDM
0 500 1000 1500 2000 2500
time [s]
0.00
0.05
0.10
0.15
0.20
0.25
Str
es
s [
N/m
m²]
SLN0613
7.2 IngenieurbauLayout: SLN0613_report.TDR
File: SLN0613_B_statBett_T6.TDM
0 500 1000 1500 2000 2500
time [s]
0.00
1.00
2.00
3.00
4.00
5.00
6.00
7.00
dis
pla
ce
me
nt
[mm
]
SLN0613
7.2 Ingenieurbau Layout: SLN0613_report.TDR
File: SLN0613_B_statBett_T6.TDM
0 1 2 3 4 5 6
displacement [mm]
0.00
0.05
0.10
0.15
0.20
0.25
Str
es
s [
N/m
m²]
SLN0613_B01_statBett_T6
SLN0613_B02_statBett_T6
SLN0613_B03_statBett_T6
hig
h b
alla
st
co
mp
ressio
n
mid
ba
llast
co
mp
ressio
n

RIVAS
SCP0-GA-2010-265754
RIVAS_BAM_ WP3_D3_7_PartB_final.docx Page 68 of 89 10/06/2013
Figure 8-17: SLN1010 static bedding modulus, stress and displacement during the test
Figure 8-18: SLN1010 static bedding modulus
SLN1010
7.2 IngenieurbauLayout: SLN1010_report.TDR
File: SLN1010_A_statBett_T6.TDM
0 500 1000 1500 2000 2500
time [s]
0.00
0.05
0.10
0.15
0.20
0.25
Str
ess
[N
/mm
²]
SLN1010
7.2 IngenieurbauLayout: SLN1010_report.TDR
File: SLN1010_A_statBett_T6.TDM
0 500 1000 1500 2000 2500
time [s]
0.00
1.00
2.00
3.00
4.00
dis
pla
ce
me
nt
[mm
]
SLN1010
7.2 Ingenieurbau Layout: SLN1010_report.TDR
File: SLN1010_A_statBett_T6.TDM
0 1 2 3 4
displacement [mm]
0.00
0.05
0.10
0.15
0.20
0.25
Str
es
s [
N/m
m²]
SLN1010_A01_statBett_T6
SLN1010_A02_statBett_T6
SLN1010_A03_statBett_T6
hig
h b
alla
st
co
mp
ressio
n
mid
balla
st
co
mp
ressio
n

RIVAS
SCP0-GA-2010-265754
RIVAS_BAM_ WP3_D3_7_PartB_final.docx Page 69 of 89 10/06/2013
Figure 8-19: Static bedding modulus – comparison German-NSP and GBP – SLN1010 – A01
Figure 8-20: Static bedding modulus – comparison German-NSP and GBP – SLN0613 – B01
Stat. bet. EU/DE
7.2 Ingenieurbau Layout: SLN1010_vergleich_EU_DE.TDR
File: StatEUdeu.TDM
0 0.5 1 1.5 2 2.5 3 3.5 4
displacement [mm]
0.00
0.05
0.10
0.15
0.20
0.25
Str
es
s [
N/m
m²]
SLN1010_A01_statBett_EU
SLN1010_A01_statBett_T6
hig
h b
alla
st
co
mp
ressio
n
mid
ba
llast
co
mp
ressio
n
Stat. bet. EU/DE
7.2 Ingenieurbau Layout: SLN0613_vergleich_EU_DE.TDR
File: StatEUdeu.TDM
0 1 2 3 4 5 6 7 8
displacement [mm]
0.00
0.05
0.10
0.15
0.20
0.25
Str
es
s [
N/m
m²]
SLN613_B01_statBett_EU
SLN0613_B01_statBett_T6
hig
h b
alla
st
co
mp
ressio
n
mid
balla
st
co
mp
ressio
n

RIVAS
SCP0-GA-2010-265754
RIVAS_BAM_ WP3_D3_7_PartB_final.docx Page 70 of 89 10/06/2013
Figure 8-21: Static bedding modulus – comparison German-NSP and GBP – SLN0315 – C01
Stat. bet. EU/DE
7.2 Ingenieurbau Layout: SLN0315_vergleich_EU_DE.TDR
File: StatEUdeu.TDM
0 1 2 3 4 5 6 7 8
displacement [mm]
0.00
0.05
0.10
0.15
0.20
0.25
Str
es
s [
N/m
m²]
SLN0315_C01_statBett_EU
SLN0315_C01_statBett_T6
hig
h b
alla
st
co
mp
ressio
n
mid
ba
llast
co
mp
ressio
n

RIVAS
SCP0-GA-2010-265754
RIVAS_BAM_ WP3_D3_7_PartB_final.docx Page 71 of 89 10/06/2013
Figure 8-22: Fatigue test specimen after 5 mio load cycles
Figure 8-23: Fatigue test, overview pressure marks, after 5 mio (l) and 8 mio (r) load cycles

RIVAS
SCP0-GA-2010-265754
RIVAS_BAM_ WP3_D3_7_PartB_final.docx Page 72 of 89 10/06/2013
Figure 8-24: Pressure marks (relative) on the fleece after 5 Mio (a) and 8 Mio (b) load cycles,
measuring system ATOS
a) after 5 mio load cycles
Relative
dimensions
b) after 8 mio load cycles

RIVAS
SCP0-GA-2010-265754
RIVAS_BAM_ WP3_D3_7_PartB_final.docx Page 73 of 89 10/06/2013
Figure 8-25: Bond strength, prepared specimen
Figure 8-26: Bond strength, SLN1010-A11-1 (left), SLN0613-B05 (right)

RIVAS
SCP0-GA-2010-265754
RIVAS_BAM_ WP3_D3_7_PartB_final.docx Page 74 of 89 10/06/2013
Figure 8-27: Shear strength, SLN0613 B-33, SLN0315 C-32, during the test
Figure 8-28: Shear strength, SLN0613 B-31, SLN0315 C-33, after the test
Figure 8-29: Shear strength,
SLN0315 C-32, after the test

RIVAS
SCP0-GA-2010-265754
RIVAS_BAM_ WP3_D3_7_PartB_final.docx Page 75 of 89 10/06/2013
8.5 DATA SHEETS USP FIRM GETZNER WERKSTOFFE GMBH
Figure 8-30: Product data sheet, SLN 0315, source Getzner Werkstoffe GmbH