protein expression of the epsilon subspecies of protein kinase c ceases as swiss 3t6 fibroblasts...
TRANSCRIPT
FEBS Letters 400 (1997) 304--308 FEBS 18000
Protein expression of the epsilon subspecies of protein kinase C ceases as Swiss 3T6 fibroblasts increase in cell density even though message for the
protein is still present
Paul Littlebury\ John Watson, Timothy Williams2, Gary Beale, Martin Rumsby* Department of Biology, University of York, York, Y01 5YW, UK
Received 5 November 1996
Abstract We have noted previously that growth of C6 glioma cells from low cell density to confluency and quiescence in serum is accompanied by changes in protein content of different protein kinase C (PKC) subspecies. Here we show that the same occurs as non-contact-inhibiting Swiss 3T6 fibroblasts grow to high density in the presence of serum. Protein expression of PKC subspecies a and 0 increases as the cells increase in density while that of PKC-r,; remains the same. Unusally, protein expression of PKC-E is completely down-regulated as cells grow beyond about 50% confluency and no PKC-E protein can be detected in 3T6 fibroblasts at high density by Western blotting. However, mRNA for PKC-E is expressed at all stages of fibroblast growth as revealed by RT -PCR. When high-density 3T6 fibroblasts are passaged to low density in fresh medium, re-expression of PKC-E protein is observed within 15 min and becomes down-regulated again as cells become more dense. This very rapid synthesis of PKC-E is not blocked by the transcription inhibitor actinomycin D but is inhibited by cycloheximide. PKC-E has some characteristics of a novel 'early response' protein whose synthesis in newly passaged 3T6 cells is regulated at the translational level.
Key words: Protein kinase C subspecies; Protein kinase C-e; Protein expression; mRNA; 3T6 fibroblast; Passage; Confluency; Translational control
1. Introduction
Twelve subspecies have been defined to date in the protein kinase C (PKC) family of phospholipid-dependent serine! threonine kinases [1-3] but the role of individual PKC subspecies in transducing the mitogenic effect of some hormones and growth factors is not fully characterised. PKC-r,; may be critical for mitogenic signal transduction since it can activate MAP kinase kinase [4] and can also induce phosphorylation and inactivation of IKB-a leading to an up-regulation of transcription [5]. PKC-a can activate Raf-l by direct phosphoryl-
*Corresponding author. Fax: (44) 1904-432860. E-mail: [email protected]
1 Present address: Institute for Cancer Studies, University of Birmingham, Birmingham, B15 2TT.
2 Present address: Imperial Cancer Research Fund, PO Box 123, 44 Lincoln's Inn Fields, London, WC2A 3PX.
Abbreviations: BCA, biochinchoninic acid; DAG, diacylglycerol; DMEM, Dulbecco's modified Eagle's medium; FBS, foetal bovine serum; PAGE, polyacrylamide gel electrophoresis; PBS, phosphatebuffered saline; PKC, protein kinase C; PMSF, phenylmethyl sulphonyl fluoride; RT-PCR, reverse transcription-polymerase chain reaction; SDS, sodium dodecylsulphate; TBS, Tris-buffered saline; TBST, Tris-buffered saline/0.2% Tween 20
ation leading to the activation of proliferation-associated genes via the MAP kinase cascade [6]. Over-expression experiments show that conventional and novel group PKC subspecies have contrasting effects on cell growth and cell morphology [7,8]. The activity of cyclin-dependent kinases regulating the cell cycle in endothelial cells is influenced by down-regulation-sensitive PKC subspecies such as a, ~, 0 and e [9]. PKC~II may regulate cell division through phosphorylation of lamins [10].
We have found [11] that the specific activity of PKC increases as C6 glioma cells grow from low seeding density through several cell cycles to confluency and quiescence in the presence of serum. This increase in PKC activity is mainly due to a 3-4-fold increase in protein expression of the a and 0 subspecies. At the same time protein expression of the 'Y and e subspecies is down-regulated while that of PKC-r,; does not alter. We find that such changes, especially of the a and 0 subspecies of PKC, occur in a range of cells including L929 fibroblasts and primary astrocytes and seem to be a common feature of cells growing to confluency. Here we show that the same changes occur as overgrowing 3T6 fibroblasts increase from low seeding density to high density in the presence of serum and that, most notably, protein expression of PKC-e is completely down-regulated as the cells increase in density even though message for this subspecies is still expressed. Further, resynthesis of PKC-e protein occurs rapidly when high-density 3T6 cells are passaged. We suggest that PKC-e is a novel form of 'early response' protein perhaps required in newly passaged cells for adherence and cell spreading.
2. Materials and methods
2.1. Materials Swiss 3T6 fibroblasts were obtained from the European Collection
of Animal Cell Cultures (Porton Down, UK). Cell culture plastic was from Corning (Bibby-Sterilin, Stone, Staff., UK). DMEM was from BioWhittaker (Wokingham, Berks., UK) or Life Technologies (Paisley, Scotland). Foetal calf serum was from Sigma (Poole, Dorset, UK). Nitrocellulose blotting membrane (0.2 11m) was from Schelicher and Schuell (Anderman, London, UK) or Amersham (Little Chalfont, Bucks., UK). BCA and Coomassie protein detection kits were from Pierce (Life Science Labs., Luton, UK) as was the Supersignal chemiluminescence detection system for detecting peroxidase-conjugated second antibodies on blots. Peroxidase-conjugated second antibodies for Western blotting were from Sigma. Dried milk powder, Marvel, was from KwikSave, York, UK. The Trizol RNA extraction kit and M-MLV reverse transcriptase were from Gibco (Paisley, Scotland). Hi-Strength LMP agarose and Hi-Pure agarose were from Biogene Ltd. (Bolnhurst, Beds., UK). Restriction enzymes were from New England Biolabs (Hitchen, UK). Taq polymerase was from Promega (Southampton, UK). Oligolabelling kit and the oligo dT(l2-18) and dNTPs were from Pharmacia (St. Albans, UK). [32yP]ATP was from NEN-DuPont (Stevenage, UK).
0014-5793/97/$17.00 © 1997 Federation of European Biochemical Societies. All rights reserved. PII SOO 14-5793(96)0 1394-4

P. Littlebury et al./FEBS Letters 400 (1997) 304-308
2.2. Cell Culture and cell sample preparation 3T6 cells were grown in DMEM supplemented with 10% foetal
bovine serum (DMEM/IO% FBS) in 25 or 75 cm2 flasks. Medium was changed every 2 days. The cells were passaged 1:4 when just confluent by rinsing twice with Tris/saline and then releasing cells with trypsin/EDTA (Gibco BRL) stopping the reaction with fresh DMEMIlO% FBS. Cells at different growth densities were taken for experimentation by rinsing twice with cold Tris/saline followed by either extraction with Trizol reagent to recover total RNA or scraping cells in 0.5 ml homogenisation buffer (HB, 50 mM Tris-HCI, pH 7.5, 0.5 mM EDTA, 2 mM EGTA, 10 Ilg/ml aprotinin, 10 Ilg/mlleupeptin, 2 mM PMSF). Cells in HB were then homogenised, aliquots taken for protein assay by the BCA method (Pierce) and the remainder solubilised with 10% SDS and sample buffer in a 2: 1: 1, v/v ratio followed by boiling for 5 min.
2.3. Western blotting Samples of cell homogenates equivalent to 30 Ilg protein, plus rat
brain control samples and suitable markers, were resolved by SDSPAGE on 15% gels at a constant 120 V in a Bio-Rad minigel system [11]. Proteins were electrophoretically transfered to nitrocellulose membrane in 25 mM Tris base, 180 mM glycine containing 10% methanol (v/v) for 75 min at a constant current of 250 rnA. Subsequent Western blotting with Supersignal chemiluminescence detection was under standard conditions as we have described [11). Polyclonal antisera to the C-terminal peptide sequences of rat PKC subspecies were raised and characterised as described previously [11,12). Antisera were used at a dilution of 1 :2000. Detection of second antibody by chemiluminescence was on X-ograph blue X-ray film (X-O-graph, Malmsbury, Wilts., UK). In some experiments developed bands on films were scanned using a laser densitometer.
2.4. RT-PCR reaction details Total RNA recovered using the Trizol extraction system was quan
titated by measuring absorbance at 260 nm and was analysed for purity by electrophoresis on I % formaldehyde gels and by measurement of the 260/280 nm ratio. The sequences of the 5' and 3' primers used for RT-PCR for PKC-li, PKC-£ were as we have described previously [13) but for PKC-~ the upstream primer was 5'-CTCACAGATGGAGCTGGAGG and the downstream primer was 3'GGTTCTCGGAGGTCATCTAC. First-strand cDNA was generated as follows: 5 Ilg total RNA (in 10 III ddH20) were heated to 70°C for 5 min, placed on ice for 10 min and then added to a reverse-transcriptase reaction mix. This contained I Ilg oligo dT(12-18), 50 mM Tris-HCI (PH 8.3), 75 mM KCI, 3 mM MgCh, 500 11M each dNTP, 10 mM DTT, 1 U/IlI RNAse Inhibitor (Promega) and 200 U of MML V Reverse Transcriptase (200 U/IlI, Gibco-BRL) in a final volume of 25 Ill. Reactions were incubated at 37°C for 60 min, then heated to 100°C for 5 min to denature the enzyme and placed on ice.
First-strand cDNA (2.5 Ill) was added to a PCR reaction containing 50 mM KCI, 10 mM Tris-HCI (pH 9.0), 0.1% Triton X-IOO, 40 pmol each of appropriate 5' and 3' primers, 200 11M each dNTP, 1.5 mM MgCh and 0.5 U Taq DNA polymerase in a final volume of 40 Ill. Samples were subjected to an initial denaturation step at 94°C for 4 min, then 30 subsequent cycles of 94°C/I min, 64°CIl min and 72°CI 35 s, followed by a final extension at 72°C/2 min. PCR products were resolved by electrophoresis on a 1.5% agaroselTBE gel and visualised by ethidium bromide staining and UV illumination. Capillary transfer of PCR products to nylon membranes was performed as described by Sambrook et al. [14). DNA probes were labelled with [32a:P)dCTP using a Pharmacia oligo-labelling kit according to manufacturer's instructions.
3. Results
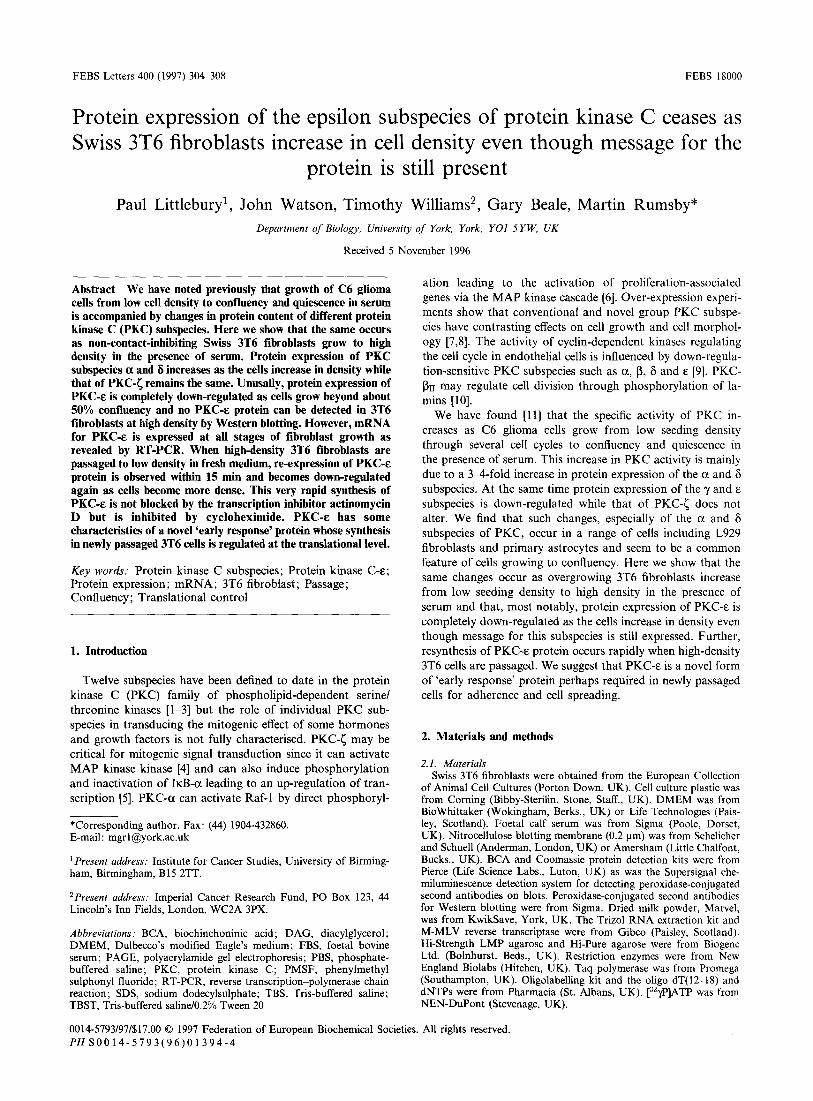
3.1. PKC subspecies protein expression in 3T3 and 3T6 cells The Swiss 3T6 cell line, derived from mouse embryos, has a
fibroblast morphology. Unlike contact-inhibiting Swiss 3T3 cells, 3T6 fibroblasts lack this property and overgrow. At various stages of growth to high density we found that 3T6 cells express PKC subspecies a, 131, 0, e, I;. and ~ as revealed by Western blotting using our polyclonal anti-PKC subspeciesspecific antisera [11]. Expression of the I3n, y, e, t and 11 sub-
A .,
br 1
.... br
2 .... -
3 4
I ·.11111_ ....... '. me $
1 2 3 4
305
Fig. I. Western blot analysis of (A) PKC-a:, (B) PKC-Ii and (C) PKC-~ protein expression in 3T6 fibroblasts at different stages of growth to high cell density. A (lanes 1-4): cells at 30-40%, 75%, 100% density and overgrowing, respectively. B (lanes 1-4): cells at 30-40%, 75%, 100% density and overgrowing, respectively. C: As for (B). In all cases 30 Ilg total cell protein was resolved by SDSPAGE on 15% gels and blotted under standard conditions as described. Markers are 89 and 77 kDa. br, rat brain control.
species of PKC was not detected at any growth stage. Contact-inhibiting Swiss 3T3 fibroblasts expressed a similar PKC subspecies profile (results not shown). As revealed in Fig. lA,B, Western blotting under standardised conditions with equal protein loadings (30 ~g) revealed that the protein content of PKC subspecies a and 0 increases as 3T6 fibroblasts grow from low cell density to high density in the presence of serum. Laser densitometry of chemiluminescence bands suggests that protein expression of PKC-a increases some 2-fold whereas that of PKC-o increases 4--5-fold. Protein expression of PKC-131 (results not shown) and of PKC-I;. (Fig. lC) does not change significantly as 3T6 cells grow to confluency under the same conditions.
3.2. Down-regulation of PKC-e protein expression in growing 3T6 fibroblasts
Western blotting results in Fig. 2A show that PKC-e protein is expressed in 3T6 fibroblasts growing at low cell density but that this expression is completely down-regulated as cells become more dense and exceeds 50% coverage of the plastic growth surface. PKC-e protein cannot be detected in 3T6 fibroblasts at higher cell densities growing in DMEM/lO% FBS, even when chemiluminescence detections are overexposed. Swiss 3T3 cells which have lost the property of contact inhibition show the same complete down-regulation of PKC-e protein when growing to increased cell density. However, this seems not to be the same for true contact inhibiting Swiss 3T3 fibroblasts where preliminary results show that PKC-e protein expression is decreased by about 50% but is not completely down-regulated as cells grow to confluency (Watson, J. and Rumsby, M.G., unpublished results). When confluent 3T6 fibroblasts, not expressing PKC-e protein, are passaged with trypsin/EDTA (5 min) and then transfered into new flasks with fresh medium, expression of PKC-e protein is rapidly up-regulated and protein can be detected by Western blotting within 15 min of cells settling on the plastic substratum (Fig. 2B). This new PKC-e protein synthesis is maintained for at least 60 min after passage but is down-regulated again as cells increase in density. No new PKC-e expression occurs during

306 P. Littlebury et al.lFEBS Letters 400 (1997) 304-308
Fig. 2. A: Protein expression of PKC-E (arrow head) is only detected in 3T6 cells at low (30%) cell density (lane I) and is down-regulated as cells grow to high density in the presence of serum. Lane 2: 50-60% density. Lane 3: 100% density. Lane 4: overgrowing. 30 Ilg cell protein was resolved in all cases as described. Markers are 89 and 77 kDa. B: Western blot analysis showing rapid PKC-E protein synthesis when confluent 3T6 cells are trypsinised and passaged to low density in fresh medium and new flasks. Lane I, rat brain control. Lanes 2-4: trypsin treatment for 0,5 and 10 min at 37°C. Lanes 5-8: 3T6 cells 15, 30,45 and 60 min after settling into new flasks in DMEMIlO% FBS. Lane 9: peptide control. Markers are 97, 89 and 77 kDa.
the trypsin treatment alone (Fig. 2B). This resynthesis of PKC-£ protein is inhibited by pre-incubating newly passaged cells during trypsinisation with 10 J..lM cycloheximide, an inhibitor of protein synthesis (Fig. 3). The PKC-£ resynthesis is not inhibited by pre-treatment of passaged cells with the transcription inhibitor actinomycin D (Fig. 3), also at 10 J..lM concentration.
3.3. Detection of PKC-£ mRNA by RT-PCR Results in Fig. 4A show that amplified cDNA fragments
produced using the appropriate primers for PKC-i) and PKC-£ have the predicted sizes of 359 and 506 bp, respectively [13]. The amplified cDNA bands cut with the predicted specific restriction endonuclease, namely HindIII for PKC-i) and BstXI for PKC-£, providing further confirmation of identity (results not shown). The nature of the PKC-£ amplified band was further confirmed when Southern blots were probed with a 32P-Iabelled DNA fragment corresponding to the V3 region of PKC-£ (Fig. 4B). We routinely observed an amplified cDNA fragment of approximately 440 bp which migrated in between the PKC-i) and PKC-£ amplified fragments (Fig. 4B, arrow): this band did not cut with the restriction enzymes specific for PKC-i) or PKC-£ and did not seem to hybridise to the probe specific for PKC-£ (Fig. 4B). The identity of this amplified fragment is unknown. We confirmed that equal amounts of total RNA were being taken for RT-PCR by running 3 J..lg total RNA on formaldehyde gels and noting that ribosomal bands had equal intensities on ethidium bromide staining (results not shown).
The results in Fig. 4A,B show that amplified cDNA fragments corresponding to PKC-£ are obtained by RT-PCR from total RNA extracted from 3T6 cells at all stages of cell growth to 100% density and overgrowing. The ethidium bromide staining intensity (Fig. 4A) and probe-binding (Fig. 4B) of the PKC-£ amplified band from cells at low, medium and high density and overgrowing (A) varied reflecting possible changes in mRNA levels. Regardless of such variations, mRNA for PKC-£ is clearly expressed in confluent and quiescent cells when protein cannot be detected by Western blotting methods. The amplified band for PKC-i) appears to decrease in ethidium bromide staining intensity in overgrowing 3T6 cells (Fig. 4A) against the trend in PKC-i) protein expres-
sion revealed by Western blotting (see Fig. 1). With the PKC~ 5' and ~ 3' primers an amplified cDNA band at the expected size of 376 bp was detected (Fig. 5). The ethidium bromidestained gel of the amplified RT-PCR cDNA fragments shows that message levels for PKC-~ in 3T6 cells were approximately the same at all stages of growth to full coverage and overgrowing in agreement with the protein findings by Western blotting. This latter observation is also further evidence that equal RNA loadings are being taken for RT-PCR.
4. Discussion
We have previously shown [11] that the cellular content of PKC subspecies ex and i) increases as C6 glioma cells grow through several cell cycles to confluency in the presence of serum and enter Go. At the same time the content of PKC-y and PKC-£ decreases. Protein expression of PKC-~ remains the same throughout C6 cell growth to confluency. It is not yet clear in C6 cells whether these alterations in PKC subspecies protein arise from changes in the regulation of mRNAI protein expression, or result from altered rates of protein turnover. The PKC subspecies protein expression patterns observed in 3T6 cells growing from low to high density in this present work follow a similar pattern. We have now observed similar PKC subspecies changes in a variety of cell lines and in astrocytes in primary culture growing to confluency. Such PKC protein changes may therefore be a normal feature of cell growth to confluency which may be important for regu-
-• -.-1 2 3 4 5 6 7
Fig. 3. Effect of actinomycin D (10 )lM) and cycloheximide (10 )lM) on synthesis of PKC-E protein by newly passaged 3T6 fibroblasts. Arrow heads indicate main PKC-E bands. Lanes I and 2: 15 and 30 min pretreatment of confluent cells with actinomycin D prior to passage. Lanes 3-5: 5-, 10- and 30-min pretreatment of confluent cells with cycloheximide prior to passage. Lane 6: Rat brain control. Lane 7: Peptide control showing elimination of PKC-E bands. Markers are 108, 89 and 77 kDa.

P. Littlehury et al.lFEBS Letters 400 (1997) 304-308
lating cell growth pathways, cell volume and/or cell shape as cells grow closer together. Over-expression of PKC-a in Swiss 3T3 cells has been found to enhance cell growth rate, especially in low serum conditions and to reduce cell EGF receptor numbers [15]: it is suggested that PKC-a may regulate pathways controlling EGF receptor expression. A decrease in EGF receptor numbers, regulated by increased PKC-a protein expression, may be important in modulating signalling pathways which presumably must alter as growth rates slow down in cells becoming more densely associated and entering Go. However, we show here that 3T6 cells which have lost the property of contact inhibition, show the same PKC-a changes. This suggests that PKC-a is not directly involved in the signalling pathways which regulate contact inhibition. PKC-a is clearly linked to growth control, perhaps via Raf-l [6], since over-expression of PKC-a in C6 glioma cells markedly increases cell growth while reducing PKC-a protein with antisense techniques slows growth slightly (Beale, G.S. and Rumsby, M.G., unpublished), as is also reported for U-S7 glioblastoma cells [16]. Overexpression of PKC-b in NIH3T3 cells also reduced cell growth rate [S]. The protein content of PKC-S, reported to be of importance in mitogenic signalling cascades [4,5], does not change as 3T6 cells increase in density and enter Go. However, PKC-S activity may be regulated by a specific PKC-S-interacting protein, Par-4, [24] whose expression has been shown to correlate with growth inhibition and apoptosis [25]. Our results indicate that the cellular content of individual PKC subspecies change considerably at different stages of cell growth from low to high density. Such changes emphasise that the state of cell density must be controlled for when examining PKC subspecies protein expression.
A notable feature of the PKC subspecies changes we have observed in 3T6 cells increasing in growth density is the rapid
B
--
Fig. 4. A: Agarose gel of RT-PCR amplified cDNA fragments showing expression of mRNA for PKC-E and PKC-o in 3T6 fibroblasts at different stages of growth density. Cells at: lane I, 30%; lane 2, 50%; lane 3, 70%; and lane 4, 100% (full) coverage of the plastic growth surface. Ethidium bromide-stained bands for PKC-E at the expected position of 506 bp and for PKC-o at the expected position of 359 bp. A minor unidentified band of 440 bp (arrow) was routinely observed. Marker bars are at 514, 448 and 339 bp. B: Identification of PKC-E mRNA (arrow) expressed in 3T6 cells at all stages of growth density to full coverage. Result shown was obtained when the gel in A was blotted and probed with a 32P-Iabelled DNA fragment corresponding to the V3 region of PKC-E. Marker bars are at 514 bp and 339 bp.
307
Fig. 5. Detection by RT-PCR of PKC-~ mRNA in 3T6 cells at different stages of growth density. Ethidium bromide-stained agarose gel shows 376 bp amplified cDNA fragments expected for PKC-~ in 3T6 cells at 40% coverage (lane 1), 90% coverage (lane 2) and overgrowing (lane 3). Ethidium bromide staining of the amplified bands is about equal indicating comparable levels of PKC-~ message at different stages of cell growth. Marker bars at 514, 448 and 339 bp.
down-regulation and disappearance of PKC-E protein as cells become established and cover more than about 50% of the plastic substratum. PKC-E protein was not detected in highdensity overgrowing 3T6 fibroblasts by Western blotting, even when chemiluminescence development was overexposed. Clearly some mechanism to down-regulate PKC-E protein synthesis is operating well before cells make substantial contacts with each other and at the same time as protein expression of the a and b PKC subspecies is increasing. This suggests that pathways controlling PKC subspecies protein expression can be differentially regulated. These findings match those we noted for PKC-y and PKC-E in C6 glioma cells [11], where protein expression of both is down-regulated as cells grow to confluency. The results differ in that PKC-E protein in confluent C6 cells was not completely down-regulated as occurs with these overgrowing 3T6 cells. We do not detect PKC-y protein expression in Swiss 3T6 fibroblasts. The fact that protein synthesis of some PKC subspecies is downregulated as cells grow and increase in density, while expression of other subspecies is up-regulated, further suggests that individual PKC subspecies are involved in the regulation of specific events in cells at discrete stages of cell growth.
It seems that the Swiss 3T3 fibroblast line can lose the property of contact inhibition. We have found that these abnormal 3T3 cells have PKC-E protein changes like the 3T6 line cells described above. On the other hand, in preliminary analyses we find that PKC-E protein expression in true contactinhibiting Swiss 3T3 cells follows a pattern like that observed in C6 glioma cells on growth to confluency and quiescence [11], namely, that PKC-E protein content decreases by about 50% but is not fully down-regulated. This perhaps represents an interesting difference important in the regulation of contact inhibition, the complete loss of PKC-E protein allowing cells to overgrow.
The rapid resynthesis of PKC-E protein which occurs when high-density 3T6 cells are passaged is not stimulated by the trypsinisation process alone; subsequent transfer of released cells at low density in fresh medium containing serum is required to provide the signals for PKC-E resynthesis. The rapid resynthesis of PKC-E within 15 min of newly passaged cells settling on the substratum suggests that this subspecies may be of importance in pathways controlling cell attachment and cell spreading. The rapid resynthesis of PKC-E is not blocked by the transcription inhibitor actinomycin D indicating that it is not dependent on new mRNA formation. Our RT-PCR results show that mRNA for PKC-E is present in confluent cells even when protein cannot be detected. Such mRNA may

308
thus be available for rapid translation in newly passaged cells. PKC-£ has some of the characteristics of a novel 'early response' protein. It is synthesised very rapidly when confluent 3T6 cells are passaged in the presence of serum and its synthesis is not dependent on transcription of new mRNA. Classical 'early response' proteins such as ornithine decarboxylase are under translational control [17,18], often via the 5' untranslated region of their mRNA which has considerable secondary structure. In a 'Fold RNA' programme we note that PKC-£ also has a long GtC-rich 5' -UTR containing considerable secondary structure with two distinct loops like other proteins under translational control and a i1G of -125 kcalf mol, about the same as that of ornithine decarboxylase [18,19]. The 5'-UTR of ornithine decarboxylase mRNA represses translation due to its stem-loop structure and removal of the 5'-UTR leads to normal translation [19]. mRNA for a number of early response proteins is present in quiescent cells as large messenger ribonuclear protein particles (mRNP) which are rapidly translated on stimulation of cells in Go with serum, insulin or certain growth factors [17]. We are looking to see if this switch also occurs for PKC-£ mRNA in newly passaged cells.
The origin of the unidentified amplified fragment of 440 bp which we detect routinely with the PCR primers for PKCs 0 and £ is unknown. It did not cut with the restriction endonucleases used to identify the PKC-o or £ amplified fragments and did not hybridise conclusively with the specific PKC-£ probe. It has been found that PKC-£ purified from brain tissue migrates as two closely related bands probably differing in phosphorylation status [19], as is also probably the case for the 95 and 87 kDa forms of PKC-£ we detected in C6 cell extracts [11]. A smaller PKC-£-related 4.7-kb transcript as well as the normal 7-kb transcript for 90 kDa PKC-£ protein has been identified in interferon-a.-treated Daudi cells suggesting that an alternative form of PKC-£ may exist [20].
It is not clear among the various PKC subspecies why the £-form should be briefly expressed in newly passaged 3T6 cells when other PKC subspecies, notably the a., 0 and S forms are continually present. Overexpression of PKC-£ in NIH3T3 cells results in increased cell growth and higher cell density in monolayers [8]. PKC-£ is the only subspecies to exhibit full oncogenic potential, emphasising a role in growth control [8]. It is the only subspecies to be localised to the Golgi apparatus [21] and it may contribute to neoplastic transformation [8]. It regulates cell adhesion to the extracellular matrix [22] and, uniquely, it contains an actin binding motif [23]. These latter observations suggest that PKC-£ may be rapidly required in newly passaged 3T6 cells for regulating cytoskeleton assembly in the control of cell spreading and cell shape. The rapid synthesis and down-regulation of PKC-£ protein expression in 3T6 fibroblasts offers a convenient system in which to define the role of this specific subspecies and to study how its protein expression is regulated.
P. Littlebury et aUFEBS Letters 400 (/997) 304-308
Acknowledgements: This work is supported by grants from The Wellcome Trust, the BBSRC (rCS grant to M.G.R. and a studentship to J.W.), the Yorkshire Cancer Research Campaign and by Smith and Nephew Group Research Centre (a studentship to G.S.B. and a CASE studentship to J.W.). We thank Rebecca Turner for maintaining our cell culture facility.
References
[I] Hug, H. and Sarre, T.F. (1993) Biochem. I. 291, 329-343. [2] Stabel, S. and Parker, P.1. (1991) Pharmacol. Ther. 51, 71-95. [3] Dekker, L.V. and Parker, P.J. (1994) Trends Biochem. Sci. 19,
73-77. [4] Berra, E., Diaz-Meco, M.T., Lozano, J., Frutos, S., Municio,
M.M., Sanchez, P., Sanz, L. and Moscat, J. (1995) EMBO J. 14,6157-6163.
[5] Diaz-Meco, M.T., Dominguez, I., Sanz, L., Dent, P., Lozano, J., Municio, M.M., Berra, E., Hay, R.T., Sturgill, T.W. and Moscat, J. (1994) EMBO 1. 13, 2842-2848.
[6] Daum, G., Eisenmann-Tappe, I., Fries, H.-W., Troppmair, J. and Rapp, UR (1994) Trends Biochem. Sci. 19,474-480.
[7] Watanabe, T., Ono, Y., Taniyama, Y., Hazama, K., Igarishi, K., Ogita, K., Kikkawa, U. and Nishizuka, Y. (1992) Proc. Natl. Acad. Sci. USA 89, 10159-10163.
[8] Mischak, H., Goodnight, 1., Ko1ch, W., Martiny-Baron, G., Schaechtle, C., Kazanietz, M.G., Blumberg, P.M., Pierce, I.H. and Mushinski, J.F. (1993) J. BioI. Chern. 268, 6090-6096.
[9] Zhou, W., Takuwa, N., Kumada, M. and Takuwa, Y. (1993) J. BioI. Chern. 268, 23041-23048.
[10] Goss, V.L., Hocevar, B.A., Thompson, J.1., Stratton, e.A., Bums, D.J. and Fields, A.P. (1994) 1. BioI. Chern. 269, 19074-19080.
[11] Moreton, K., Turner, R., Blake, N., Paton, A., Groome, N. and Rumsby, M.G. (1995) FEBS Lett. 372, 33-38.
[12] Drew, L., Groome, N., Hallam, T.J., Warr, J.R. and Rumsby, M.G. (1994) Oneol. Res. 6, 429-438.
[13] Turner, N.A., Rumsby, M.G., Walker, J.H., McMorris, F.A., Ball, S.G. and Vaughan, P.F.T. (1994) Biochem. 1. 297, 407-413.
[14] Sambrook, J., Fritsch, E.F. and Maniatis, T. (eds.) (1989) Molecular Cloning: a Laboratory Manual. Cold Spring Harbor Laboratory Press, Cold Spring Harbor, New York.
[15] Eldar, H., Zisman, Y., Ullrich, A. and Livneh, E. (1990) J. BioI. Chern. 265, 13290-13296.
[16] Ahmad, S., Mineta, T., Martuza, R.L. and Glazer, R.I. (1994) Neurosurgery 35, 904-909.
[17] Morris, D.R. (1995) Prog. Nucl. Acid Res. Mol. BioI. 51, 339-363.
[18] Manzella, J.M. and Blackshear, P.J. (1990) J. BioI. Chern. 265, 11817-11822.
[19] Saido, T.e., Mizuno, K., Konno, Y., Osada, S., Ohno, S. and Suzuki, K. (1992) Biochemistry 31, 482-490.
[20] Wang, e., Constantinescu, S.N., MacEwan, D.J., Strulovici, B., Dekker, L.V., Parker, P.J. and Pfeffer, L.M. (1993) Proc. Natl. Acad. Sci. USA 90, 6944-6948.
(21] Lehel, e., Olah, Z., Jakab, G. and Anderson, W.B. (1995) Proc. Natl. Acad. Sci. USA 92, 1406-1410.
[22] Chun, J.-S., Ha, M.-J. and Jacobson, B.S. (1996) J. BioI. Chern. 271, 13008-13012.
[23] Prekeris, R., Mayhew, M.W., Cooper, J.B. and Terrian, D.M. (1996) J. Cell BioI. 132, 77-90.
(24] Diaz-Meco, M.T., Municio, M.M., Frutos, S., Sanchez, P., Lozano, J., Sanz, L. and Moscat, J. (1996) Cell 86, 777-786.
[25] Sells, S.F., Wood, D.P., Joshi-Barve, S.S., Muthukumar, S., Jacob, R.J., Crist, S.A., Humphreys, S. and Rangnekar, V.M. (1994) Cell Growth Diff. 5, 457-466.