protect description supporting ~iaterzals · anthony m. vitti resolution honoring speaker antonio...
TRANSCRIPT

APPET~DIX O
PROTECT DESCRIPTION SUPPORTING ~IATERZALS

Trustees of The California State University
The California State University The Glenn S. Dumke Conference Center
401 Golden Shore ~ Long Beach, CA 90802-4210
Resolutions
The attached resolutions were adopted by the Board of Trustees at its meeting of March 14-15, 2000, held at San Jose State University,
One Washington Square, San Jose California
BOARD OF TRUSTEES i
Election of Five Members to Se~7re on Committee on Committees for 2000-2001 (RBOT 03-02-00)
RESOLVED, By the Board of Trustees of The California State University, that the following trustees are elected to constitute the board's Committee on Committees for the 2000-2001 term:
Martha C. Fallgatter, Chair William D. Campbell Bob Foster
Dee Dee Myers Anthony M. Vitti
Resolution Honoring Speaker Antonio Villaraigosa (RBOT 03-03-00)
WHEREAS, The Honorable Antonio Villaraigosa is completing his term of distinguished service as the Speaker of the California State Assembly, which has, under his leadership, proudly advanced its long record of accomplishment; and
WHEREAS, During his tenure as Speaker, he has, by virtue of his office, served as a member of the California State University Board of Trustees, bearing that august r-
responsibility both by his counsel to the Board and by his consideration of the University in its legislative dimension; and
WHEREAS, He has by his example of compassionate leadership set a standard for his office, while strengthening all of California education by his support of bond and funding measures, in particular Proposition 1A in 1998, as well as legislation establishing teacher peer assistance for K-12 teachers; and
WHEREAS, It is altogether fitting that the California State University recognize and applaud such outstanding examples of service and leadership to the citizens of this great state; therefore, be it
RESOLVED, By the Board of Trustees of the California State University, that this Board honors and commends Antonio Villaraigosa for his many accomplishments as a civic and educational leader, wishing him every success in his future endeavors.
COMMITTEE ON EDUCATIONAL POLICY
Review of California State University Enrollment Policies to Respond to Increasing Pressures on Access (REP 03-01-00)
WHEREAS, California law acknowledges the responsibility of the State of California to provide the resources necessary for higher education to fulfill the requirements of the Master Plan for Higher Education; and
WHEREAS, Education Code Section 66202.5 states,''The State of California reaffirms its historic commitment to ensure adequate resources to support enrollment growth ... to accommodate eligible California freshmen applicants and eligible California Community College transfer students...;"
now, therefore, be it
RESOLVED, By the Board of Trustees of The California State University, that the following principles are adopted by the Board of Trustees effective with students seeking admission to the CSU for fall 2001 to aid the chancellor and campuses in carrying out the mission of the CSU and to ensure that CSU campuses continue to comply with the provisions of the Master Plan for Education:
· CSU reaffirms its commitment to the Master Plan to accommodate within the
CSU all fully eligible students in the upper one-third of recent California high school graduates and all fully eligible, upper division California community college transfer students.
· Appropriate to the mission of the CSU system and that of its member campuses, each CSU campus is expected to maintain a balanced student body and to provide broad-based access to the people ofCalifornia.
· CSU outreach, admission, and retention policies shall continue to provide · encouragement, support, and access to studentstaadttoonaly underrepresented in California higher education toward the goal of enrolling a student population reflective ofCalifornia's growing diversity.
· It is the intent of the CSU Board of Trustees that campuswide impaction be avoided. The trustees will seek the instructional and physical capacity resources necessary to serve all fully eligible:students who desire a CSU education. The CSU system shall--work with CSU campuses for which program impaction is inadequate to manage their enrollment pressures. A campus may be designated as impacted campuswide only if the campus can demonstrate that it has exhausted existing enrollment capacity by implementing such approaches as flexible scheduling and year-round operations, expanding distance learning and use of technology, increasing the capacity of existing off-campus centers, establishing new centers, and using facilities imaginatively, but not at the expense of regular campus maintenance and capital outlay needs.

· CSU-eligible students are guaranteed admission to at least one local CSU campus. Admission, however, does not include assurance of admission to a specific program.
· First-time freshmen and upper division transfer students shall be admitted to a local CSU campus on the basis of established CSU system admission policies, i.e., those standards defined in the first principle listed above.
· For purposes of admission, "local" first-time freshmen are defined as those students who graduate from a high school historically served by a CSU campus in that region, and local upper division transfer students are defined as those who transfer from a community college historically served by a CSU campus in that region.
· CSU campuses shall utilize program impaction where appropriate prior to requesting campuswide impaction.
· CSU campuses may pursue program impaction for those programs receiving more fully eligible applicants than can be accommodated. Campuswide impaction shall be authorized only when program impaction is inadequate to cope with an excess number of fully eligible applicants.
· Supplementary admission criteria will be used to screen applicants for impacted programs and shall be publicized widely. Supplementary admission criteria may be used in campuswide impaction situations provided that CSU-eligiMe ( students guaranteed regional access shall be admitted.
· The effects of these principles and other CSU admission policies and practices shall be monitored carefully to ensure that CSU continues to honor its Master Plan obligations in a clear and consistent way.
Community Service: Responding to the Governor's Call (REP 03-02-00)
WHEREAS, The California State University has a tradition of such community-based activities as service learning and community service; and,
WHEREAS, Governor Davis has called on the CSU to establish a community service requirement for CSU students; and,
WHEREAS,Tthe CSU endorses Governor Davis's interest in strengthening an ethic of service as an important part of undergraduate education; and
WHEREAS, CSU Monterey Bay already has a service-learning requirement for graduation and a number of individual academic departments and programs throughout the CSU currently require community service or service learning; and

WHEREAS, The Academic Senate CSU, the California State Student Association, and the CSU Advisory Group on Community Service have carefully studied the place of community service and service learning in the undergraduate education experience; now, therefore, be it
RESOLVED, By the Trustees of The California State University, that the chancellor require each CSU president to ensure that all students have opportunities to participate in community service, service learning (deemed academically appropriate by faculty), or both; and, be it further
RESOLVED, That the Board of Trustees, through the chancellor, endorse campus efforts to make service an expectation, condition, or requirement for the undergraduate education experience; and, be it further
RESOLVED, That the chancellor report to the Board of Trustees, on an annual basis, CSU'·s increasing efforts to provide those opportunities to all students.
Academic Planning and Program Review (REP 03-03-00)
RESOLVED, By the Board of Trustees of The California State University, that the amended projections on the Academic Plans for the California State University las contained in Attachment A to Agenda Item 5 of the March 14-15, 2000, meeting of the Committee on Educational Policy), be approved and accepted as the basis for necessary facility planning; and, be it further
RESOLVED, That those degree programs included in the Academic Plans are authorized for implementation, at approximately the dates indicated, subject in each instance to the chancellor' s determination of need and feasibility, and provided that financial support, qualified faculty, facilities, and information resources sufficient to establish and maintain the programs will be available; and, be it further
RESOLVED, That degree programs not included in the Academic Plans are authorized for implementation only as pilot programs, subject in each instance to conformity with current procedures for establishing pilot programs.

COMMITTEE ON ORGANIZATION AND RULES j
Amendments to the Rules of Procedure (ROR 03-01-00)
RESOLVED, By the Board of Trustees of the California State University, that the Rules of Procedure of the Board of Trustees is amended as follows:
i. Article II, Section 2 is amended to read:
~ 2. Salary or Other Compensation
No Trustee except the Chancellor of the California State University shall receive salary for her or his services nor shall any Trustee other than the Chancellor be eligible for appointment to any position in connection with' the California State University to which salary or other compensation attaches, except that;effee~i·eFe 3aftt~tPs3~934; each appointive Trustee shall receive the sum of fif4-o~Le~ dollars ~58~88) ~0~ for each day he or she is attending official business, and a Trustee may be reimbursed for ~teft~expenses incurred by reason of her or his attendance at any meeting of the Board of Trustees or a committee thereof or in the performance of other official business of the Board of Trustees in accordance with the CSU policy concerning travel expense reimbursement.
"Official business" means any activity which is required to be performed in furtherance of the duties, obligations and functions of the Board of Trustees with
respecttothemanagementandcontrol oftheCalifomiaSrateuniversity.Ir includes CI acts which are required by law, and acts reasonably related to those which the law requires. It includes, but is not limited to, attendance at any meeting officially called by the Trustees or any state agency, at which the attendance of the Trustee is required or recommended. It does not include any purely personal business.
2. Article V, Section 2-b is amended to read:
b. Emergency Meetings.
As required by ~t~ifern~i·~he~t~ifti4,Title 5, California Code of Renulations, Section 42395, an emergency meeting may be called only when necessitated by unforeseen emergency conditions which might result in a detriment to the California State University or the public interest if such meeting were delayed for the ten day notice normally required by Government Code Section 111~5. Upon the convening of the emergency meeting, the Chancellor or her or his designee shall present a statement of the circumstances which constituted the unforeseen emergency conditions, and the detrimental consequences which might result in the event of such delay.
Notice of the time and place of an emergency meeting called pursuant to this section, and the nature of the matters to be considered shall be given as soon as possible after it has been determined that such a meeting is necessary. No.business other than that mentioned in the Notice of Emergency Meeting may be considered thereat. Notice to each Trustee shall be given by letter or telegram addressed to him or her at his or her last known place of business or residence.
3. Article V, Section 5 is amended to read:
O 5, Public Meetings; ~xeet~i~e Closed Session
Meetings of the Board of Trustees shall be open to the public except in executive closed sessions. Exeett~it~Closed sessions are restricted to consideration of those
matters which may lawfully be considered at such sessions.
4. Article V, Section 7 is amended to read:
~ 7, Order of Business at Regular Meetings
The Order of business at regular meetings of the Board of Trustees shall t~e~t~fe~et~s include the following:
Call to Order and Roll Call
Reports of Chair and Chancellor Approval of minutes eft~tt~-r~ee~e~i~ ~te~ ftel)et-~efike~tt~tltee~er Reports of Standing and Special Committees ~e~~eP~eff~eei~efft~4i~t ~fiftiske~Old business
New business
Public Comments
Adiournment
The regular order of business may be suspended at any meeting by a vote of a majority of the Trustees present and voting.
5. Article V, Section 9 is amended to read:
O 9, Agenda of Business
As required by California Government Code Section 11125, the Secretary shall prepare an agenda for, and provide notice of, each regular meeting of the Board of Trustees to any person who requests such notice in writing. Notice shall be given at least et~w~eek~a_4IS_in advance of, and shall include the~agenda for the meeting. Notice shall include the items of business to be transacted and no items shall be added
to the agenda subsequent to the provisions of such notice, except in emergency conditions as specified in these rules. In the event of objection by any member to the consideration of any emergency item or the change of an item from information to an action item in such a notice and agenda, further consideration shall be postponed until the next Board of Trustees' meeting unless two-thirds of the Trustees present and voting consent to consideration of the matter without such postponement.

6. Article VI, Sections 4-b and c are amended to read:
~ 4. General Provisions Applicable to Standing Committees
b. Duties.
The several Standing Committees are especially charged with the immediate care and supervision of the subject matters re~tee~e~i~Fe3pci~l~3specified in these Procedures and properly relating to their duties. These matters shall bere~s~ee~e~e~e~it~e~~p ~e referred to the appropriate committees and the committees shall severally report at the next regular meeting of the Board of Trustees following the reference, provided, however, that such matters may be considered without such referral upon the vote of two thirds of the Trustees present and voting. In addition to the duties prescribed by this paragraph, the Standing Committees shall perform such other functions as may be directed by the Board of Trustees.
c. Membership. Each Standing Committee shall consist of such number of members as the Board of Trustees from time to time may determine. Members of Standing Committees shall hold office until the appointment of their successors by the Board of Trustees.
Upon appointment to the Board, a Trustee shall become a member of those Standing Committees to which his or her predecessor was assigned except that a newly appointed Trustee shall not become Chair or Vice-Chair of any committee- to which
he or she is assigned by reason of this section. Q~se~4A_ newly appointed Trustee shall not become a member of the Committee on Collective Bargaining ·e~t~ef~r~i~e~e~t~ef~y reason of this section. If a newly appointed Trustee is the successor to the Chair of the Board of Trustees, the Committee on Committees shall appoint that person to Standing Committee assignments.
7. Article VI, Section 7-a is amended to read:
~ 7, Review of Proposed Agenda Item
a. A Committee shall be established by the Chair of the Board of Trustees when necessary to review non-staff items proposed by the Statewide Academic Senate and other constituent groups of this Board (i.e., f~af~wtei~S~H~·~P1·~ association California State Student Association and f~t~ewli~eCS~ Alumni Council)
for inclusion on the Board of Trustees' agenda.
8. Article X is amended to read:
Members of the public shall have the right to address the Board on items which are within the jurisdiction of the Board with proper notice. Individuals or organizational spokespersons wishing to appear before a committee of the Board or before the Board during a plenary session shall provide written notice stating the time necessary for the presentation and the reason for a personal appearance. Such

notice would have to be received by the Secretariat of the Trustees no later than the last working day preced~Ilg the regularly scheduled meeting of the Committee or two working days preceding the regularly scheduled meeting of the Board at which permission is sought to make such presentations. The Chair of the Committee or the Chair of the Board will inform the Committee or Board of the Chair's decision
regarding any restrictions on the presentations, such as the time limit or number of speakers. Should a member of the Committee or of the Board disagree with the Chair' s restrictions, that Trustee may introduce a motion reversing or amending the Chair's decision. The motion shall require a second, be debatable, be amendable, and take a majority to pass.
Individuals or organizational spokespersons wishing to appear before a committee or before the Board during a plenary session without submitting a written notice prior to the meeting may seek recognition by the Chair during the Committee or Board meeting. Should the Chair decide not to recognize the person seeking the floor, the Chair will announce his/her decision and then would be subject to a motion to appeal the decision of the Chair. Such a motion shall require a second and take a majority vote of the members of the Committee or Board present and voting.
Spokespersons for CSU constituencies ~Alumni Council, California State Student Association, and the Academic Senate CSU) shall not be subject to this policy.

COMMITTEE ON FINANCE
Student Fee Policy (RFLN 03-04-00)
RESOLVED, By the Board of Trustees of The California State University, that Attachment 1 to Agenda Item 2 of the March 14-15, 2000, meeting of the trustees' Committee on Finance, titled "The California State University Student Fee Policy," is approved and shall take effect immediately; and, be it further
RESOLVED, That the chancellor is directed to take all necessary action to implement the student fee policy in a manner consistent with existing statutes and provisions of bond indentures.
Authorize the Issuance and Sale of the California State Polytechnic University, Pomona Student Union Revenue Bonds, Series C, and Related Matters (RFIN 03-05-00)
Trustee Resolutions
Orrick, Henington & Sutcliffe LLP as bond counsel for the trustees is preparing resolutions for the sale and issuance of revenue bonds to be presented for approval at this meeting that will achieve the following:
1. Authorize the sale and issuance of the California State Polytechnic University, Pomona Student Union Revenue Bonds, Series C, in an~~amount not to exceed $21,115,000 and certain actions relating thereto including the approval of the form of the Notice of Sale as presented to the board at this meeting.
2. Approve the form of the official statement prepared by Kelling, Northcross & Nobriga, financial advisor, as presented to the board at this meeting.
3. Provide a delegation to authorize the chancellor, the executive vice chancellor and chief financial officer, and their designees to take any and all necessary actions to execute documents for the sale and issuance of the bonds.
Recommended Action
The resolutions being prepared by bond counsel and the form of the official statement will be distributed to the trustees at this meeting and presented for approval.

COMMITTEE ON CAMPUS PLANNING, BUILDINGS AND GROUNDS
Amend the 1999/2000 Capital Outlay Program, Nonstate Funded (RCPBG 03-05-00)
RESOLVED, By the Board of Trustees of The California State University, that the 1999/2000 Nonstate Funded Capital Outlay Program is amended to include: (1) $6,500,000 for preliminary plans, working drawings, construction and equipment for the California State University, Northridge, Alumni Center at Sierra Hall Complex; and (2) $2,425,000 for preliminary plans, working drawings, construction and equipment for the California State University, Northridge, Western Center for Adaptive Aquatics project.
Categories and Criteria for the 2001/02 State Funded Capital Outlay Program (RCPBG 03-06-00)
RESOLVED, By the Board of Trustees of The California State University, that the Categories and Criteria for the 2001/02 State Funded Capital Outlay Program, as contained in Attachment A of the trustees' Committee on Campus Planning, Buildings and Grounds Agenda Item 3 of the March 14-15, 2000, meeting of the Board of Trustees be approved; and, be it further
RESOLVED, That the chancellor is hereby directed to use these categories and criteria to prepare the 2001/02 State Funded Capital Outlay Program for The California State University. If this results in an "action year" (2001/02) request beyond reasonable expectation of available funding, the chancellor is delegated authority to adjust the number of campus projects submitted.
Approval of Schematic Plans (RCPBG 03-07-00)
1, California State University, Monterey Bay--Science Academic Center Project Architect: Anshen + Alien
RESOLVED, By the Boar$ of Trustees of The California State University, that:
i. The board finds that the Categorical Exemption for the California State University, Monterey Bay, Science Academic Center has been prepared in accordance with the requirements of the California Environmental Quality Act; and
2. The proposed project will not have a significant effect on the environment; and
3. The project will benefit The California State University; and
4. The schematic plans for the California State University, Monterey Bay Science Academic Center are approved at a project cost of $22,119,000 at CCCI 3909.

2. San Diego State University-Chemistry, Geology, Business Administration and Math i Buildings Renovation Project Architect: McGraw/Baldwin Architects
RESOLVED, By the Board of Trustees of The California State University, that:
i. The board finds that the Categorical Exemption for the San Diego State University, Chemistry/Geology/Business Administration/Math Buildings Renovation project has been prepared in accordance with the requirements of the California Environmental Quality Act; and
2. The proposed project will not have a significant effect on the environment; and
3. The project will benefit The California State University; and
4. The schematic plans for the San Diego State University, Chemistry/Geology/Business Administration/Math Buildings Renovation project are approved at a project cost of $22,950,000 at CCCI 3847.
3. California State University, San Marcos--Field House/Student Union Offices Project Architect: Robbins Jorgensen Christopher
RESOLVED, By the Board of Trustees of The California State University, that:
i. The board finds that the Final EIR for the Caliiomia State University, San Marcos ( master plan, certified on March 9, 1988, was prepared to specifically include the Field House/Student Union Offices pursuant to the requirements of the California Environmental Quality Act; and
2. Based on the information contained in the previously approved Final ELR and the mitigation measures identified therein and previously adopted, the proposed project will not have a significant effect on the environment; and
3. Therefore, no additional mitigation measures are necessary, and the project will benefit the California State University; and
4. The schematic plans for the California State University, San Marcos Field Housel Student Union Offices are approved at a project cost of $7,124,000 at CCCI 3847.

\ COMMITTEE ON GOVERNMENTAL RELATIONS
1999-2000 Legislative Report No. 8 (RGR 03-03-00)
RESOLVED, By the Board of Trustees of The California State University, that the 1999-2000 Legislative Report No. 8 is adopted.

Trustees of the California State University
Resolutions
The attached resolutions were adopted by the Board of Trustees at its meeting of May 13-14, 2003 held in the Dumke Auditorium of the CSU Office of the Chancellor, 401
Golden Shore, Long Beach, California
COMMITTEE ON CAMPUS PLANNING, BUILDINGS AND GROUNDS
Amend the 2002/2003 Capital Outlay Program, Nonstate Funded (RCPBG 05-03-06)
RESOLVED, By the Board of Trustees of the California State University, that the 2002/03 Nonstate Funded Capital Outlay Program is amended to include: 1) $1,390,000 for preliminary plans, working drawings, construction and equipment for the California State University, Long Beach, Nugget Remodel; 2) $7,341,000 for preliminary plans, working drawings, and construction for the California State University Northridge, Parking and Public Safety Building; 3) $35,854,000 for preliminary plans, working drawings and construction for the California State University, Sacramento, Parking Structure III project; 4) S874,000 for preliminary plans, working drawings, and construction for the California State University, San Bernardino, Palm Desert Campus, Phase II Parking Lots; and 5) $40,543,000 for preliminary plans, working drawings, construction and equipment for the Sonoma State University, Student Housing, Phase II, Beaujolais Village project.
Campus Master Plan Revision at California State University, Sacramento (RCPBG 05-03-07)
RESOLVED, By the Board of Trustees of the California State University that:
i. Upon consideration of the informationprovided in the Negative Declaration for the CSU Sacramento, campus master plan revision, the Negative Declaration has been prepared pursuant to the requirements of the California Environmental Quality Act.
2. The proposed CSU Sacramento, campus master plan revision will not have a significant effect on the environment.
3. The revision will benefit The California State University.
4. The chancellor or his designee is directed under the Delegation of Authority granted by the Board of Trustees to-file the Notice of Determination for the CSU Sacramento, campus master plan revision.
5. The CSU Sacramento, campus master plan revision dated May 2003 is approved.
Approval of schematic Plan ORCPBG 05-03-08)
1. CSU Hayward--Business and Technology Building

RESOLVED, By the Board of Trustees of the California State University, that:
i. The board fmds that the Negative Declaration was prepared for the California State University, Hayward, Business and Technology Building pursuant- to the requirements of the California Environmental Quality Act.
2. The proposed project will not have the potential for significant adverse impacts on the environment, and the project will benefit the California State University.
3. The chancellor is requested under the Delegation of Authority granted by the Board of Trustees to file the Notice of Determination for the project.
4. The schematic plans for the California State University, Hayward, Business and Technology Building are approved at a project cost of $25,000,000 at CCCI4019.
2. CSU Los Angeles--Parking Structure III
RESOLVED, By the Board of Trustees of the California State University, that:
i. The board finds that the Categorical Exemption for the California State University, Los Angeles, Parking Structure ILI project has been prepared in ~ccctprdance with the requirements of the California Environmental Quality
2. The proposed project will not have the potential for significant adverse impacts on the environment, and the project will benefit the California State University.
3. The schematic plans for the California State UniversitY, Los Angeles, Parking Structure In project are approved at a project cost of $12,000,000 at CCCI 4019.
3. CSU Northridge--Parking Structure, Phase D[
RESOLVED, By the Board of Trustees of the California State University, that:
i. The board finds that the Mitigated Negative Declaration for the California State University, Northridge, Parking Structure II has been prepared in ~iccctprdance with the requirements of the California Environmental Quality
2. With implementation of the recommended Mitigation Measures, the proposed project will not have the potential for significant adverse impacts on the environment, and the project will benefit the California State University.
3. The recommended Mitigation Measures are hereby approved and incorporated as a requirement for implementation of the project, along with the Mitigation Monitoring Plan which is also approved and incorporated by reference, and which meets the requirements of Public Resources Code Section 21081.6.

4. The chancellor is requested under Delegation of Authority granted by the Board of Trustees to file the Notice of Determination for the project.
5. The schematic plans for the California State University, Northridge, Parking Structure II are approved at a project cost of $20,347,000 at CCCI 4019.
4. CSU Northridge-Parking and Public Safety Building
RESOLVED, By the Board of Trustees of the California State University, that: i. The board finds that the Mitigated Negative Declaration for the California
State University, Northridge, Parking and Public Safety Building has been prepared in accordance with the requirements of the California Environmental Quality Act.
2. With implementation of the recommended Mitigation Measures, the proposed project will not have the potential for significant adverse impacts on the environment, and the project will benefit the California State University.
3. The recommended Mitigation Measures are hereby approved and incorporated as a requirement for implementation of the project, along with the Mitigation Monitoring Plan which is also approved and incorporated by reference, and which meets the requirements of Public Resources Code Section 2108 1.6.
4. The chancellor is requested under Delegation of Authority granted by the Board of Trustees to file the Notice of Determination for the project.
5. The schematic plans for the California State University, Northridge, Parking and Public Safety Building are approved at a project cost of $7,341,000 at CCCI 4019. C
5. CSPU, Pomona--American Red Cross Regional Headquarters
RESOLVED, By the Board of Trustees of the California State University, that: I. The board finds that the Mitigated Negative Declaration for the California
State Polytechnic University, Pomona, American Red Cross Regional Headquarters has been prepared in accordance with the requirements of the California Environmental Quality Act.
2. With implementation of the recommended Mitigation Measures, the proposed project will not have the potential for significant adverse impacts on the environment, and the project will benefit the California State University.
3. The recommended Mitigation Measures are hereby approved and incorporated as a requirement for implementation of the project, along with the Mitigation Monitoring Plan which is also approved and incorporated by reference, and which meets the requirements of Public Resources Code Section 21081.6.
4. The chancellor is requested under Delegation of Authority granted by the Board of Trustees to file the Notice of Determination for the project.5. The schematic plans for the American Red Cross Regional Headquarters facility to be located within the Innovation Village development of the California State Polytechnic University, Pomona are approved at a project cost $41,600,000 at CCCI 4019.

6. CSU San Bernardino--Student RecreationCenter
RESOLVED, By the Board of Trustees of the California State University, that: i. The board finds that the Categorical Exemption for the California State
University, San Bernardino, Student Recreation Center has been prepared in accordance with the requirements of the California Environmental Quality Act.
2. The proposed project will not have the potential for significant adverse impacts on the environment, and the project will benefit the California State University.
3. The schematic plans for the California State University, San Berzardino Student Recreation Center are approved at a project cost of $12,451,000 at CCCI 4019.
7. California State University, Stanislaus--Science n Seismic Replacement Building
RESOLVED, By the Board of Trustees of The California State University, that:
i. The board finds that the Negative Declaration for the California State University, Stanislaus, Science II Seismic Replacement Building has been prepared pursuant to the requirements of the California Environmental Quality Act.
2. The proposed project will not have the potential for significant adverse impacts on the environment, and the project will benefit the California State University.
3. The chancellor is requested under Delegation of Authority granted by the Board of Trustees to file the Notice of Determination for the project.
4. The schematic plans for the California State University, Stanislaus, Science 11 Seismic Replacement Building are approved at a project cost of $54,202,000 at CCCI4019.

COMMITTEE ON GOVERNMENTAL RELATIONS
2003/2004 Legislative Report No. 3 ~IGR 05-03-05)
RESOLVED, By the Board of Trustees of the California State University, that the 2003-04 Legislative Report No. 3 is adopted.
Education Bond Act: Endorsement by Board of Trustees (RGR 05-03-06)
RESOLVED, By the Board of Trustees of the California State University, that the board supports the education bond initiative that is scheduled to appear on either the March 2004 Primary Election or November 2004 General Election ballot.
F

COMMITTEE ON ORGANZZATION AM) RULES
Proposed Schedule of Board of Trustees' Meetings, 2004 (ROR 05-03-01)
RESOLVED, By the Board of Trustees of The California State University, that the following schedule of meetings for 2004 is adopted:
2004
January 27-28 Tuesday - Wednesday Headquarters March 16-17 Tuesday - Wednesday CSU Fresno May 18-19 Tuesday - Wednesday Headquarters July 13-14 Tuesday - Wednesday Headquarters September 14-15 Tuesday - Wednesday Headquarters October 28 Thursday Headquarters November 16-17 Tuesday - Wednesday Headquarter

COMMITTEE ON UNIVERSITY AND FACULTY PERSONNEL
Executive Compensation (RUFP 05-03-01)
RESOLVED, by the Board of Trustees of the California State University, that Dr. J. Michael Ortiz shall receive ·a salary set at the annual rate of $205,008, July i, 2003 or soon thereafter, effective with his appointment as president of the California State Polytechnic University, Pomona and he shall be required to occupy the official presidential residence, the Manor House, as a condition of employment; and that Dr. Alexander Gonzalez shall receive a salary set at the annual rate of $221,004 and a housing allowance set at the annual rate of $36,804, July i, 2003 or soon thereafter, effective with his appointment as president of the California State University, Sacramento.
Executive Compensation: Interim Presidents (RUFP 05-03-02)
RESOLVED, by the Board of Trustees of the California State University, that Dr. Joseph N. Crowley shall receive a salary set at the annual rate of $222,450, effective July i, 2003, through December 24, 2003, the period of his temporary non-resident appointment as interim president of San Jose State University and that he shall occupy university provided housing as a condition of employment; i that Dr. Poy McTarnaghan shall receive a salary set at the annual rate of $208,000, effective July i, 2003, through December 24, 2003, the period of his temporary non-resident appointment as interim president of California State University, San Marcos and that he shall occupy university provided housing as a condition of employment; and that Dr. Scott G. McNall shall receive a salary set at the annual rate of $208,000 and a housing allowance set at the annual rate of $27,000, effective July i, 2003, the date of his appointment~ as interim president of California State University, Chico, through the arrival of a new president.
COMMITTEE ON INSTITUTIONAL ADVANCEMENT
Approval of Naming of Facility- California State University, Hayward ~RIA 05-03-06)
RESOLVED, By the Board of Trustees of the California State University, that the Business and Technology Center at California State University, Hayward be named the Wayne and Gladys Valley Business and Technology Center.
Approval of Naming of Facility- California State University, San Bernardino CRZA 05-03-07)
RESOLVED, By the Board of Trustees of the California State University, that the Student Union facility at California State University, San Bernardino be named the Santos Manuel Student Union.

COMIMTTEE ON EDUCATIONAL POLICY
Campus Options to Achieve California State University Enrollment and Access Goals (REP 05-03-04)
RESOLVED, By the Board of Trustees of The California State University, that this Board advises the Governor, the Legislature, and the Califomia Postsecondary Education Commission of the following:
That, according to enrollment projections based upon current demographic projections and implementation of state policy directions regarding educational equity and access, the California State University must be prepared to accommodate some 107,000 additional students in the year 2011; and be it further
RESOLVED, That given appropriate state support, the California State University pledges to accommodate these additional students; and be it further
RESOLVED, That it is the policy of the Board of Trustees that campuses shall, within the constraints of state enrollment funding, expand summer term enrollments so as to better utilize existing physical capacity and facilitate student progress to their obj ectives; and be it further
RESOLVED, That it is the policy of the Board of Trustees that campuses shall expand existing and develop new off-campus centers to provide access to student populations that are unable to attend existing campuses and to relieve enrollment pressure on existing campuses that are at or approaching impaction; and be it further
RESOLVED, That it is the policy of the Board of Trustees that campuses shall expand the use of academic technology in ways that maint~ain and improve the high quality of education provided by the CSU in. order to free existing physical capacity and expand access; and be it further
RESOLVED, That the Board of Trustees directs the Presidents and their respective staffs, in consultation with constituent groups, to review campus master plans and where found to be appropriate, consider increasing enrollment ceilings; and be it further
RESOLVED, That the Board of Trustees authorizes campuses that are at or near the historic system maximum enrollment ceiling of 25,000 academic year full- time equivalent students to prepare campus master plan revisions that exceed the limit for presentation to the Board; and be it further
RESOLVED, That the Board of Trustees authorizes campuses to proceed within the scope of existing and proposed campus master plans, to fully utilize existing campus capacity and to accelerate new physical capacity within the context of the

annual CSU Five-Year Capital Outlay program; and be it further
RESOLVED, That these recommendations will be developed individually and subject to collective bargaining and campus or systemwide consultation as appropriate.
Recommendations of the California State University Presidents' Commission on Teacher Education CREP 05-03-05)
RESOLVED, By the Board of Trustees of The California State University, that the Board of Trustees endorses the ten recommendatioqs included in agenda item 2, Attachment A, of the May 13-14, 2003 meeting of the Committee on Educational Policy; and be it further
RESOLVED, That the Board of Trustees directs the Chancellor to encourage the
campus presidents and faculty to pursue actively the recommendations of the California State University Presidents' Commission on Teacher Education.

COMMITTEE ON FINANCE j
Approval to Issue Trustees of the California State University, Systemwide Revenue Bonds and Related Debt Instruments for Various Projects (RFIN 05-03-07)
Orrick, Herrington & Sutcliffe LLP, as bond counsel, prepared resolutions for projects at California State University, Fullerton (Parking Structure I) and California State University Los Angeles (Parking Structure III):
(1)Authorize the sale and issuance of Systemwide Revenue Bond Anticipation Notes and the related sale and issuance of the Trustees of the California State University, Systemwide Revenue Bonds in an amount not-to-exceed $40,995,000 and certain actions relating thereto.
(2) Provide a delegation to the Chancellor, the Executive Vice Chancellor and Chief Financial Officer, and their designees to take any and all necessary actions to execute documents for the sale and issuance of the bond anticipation notes and the revenue bonds.
The resolutions will be implemented subject to the receipt of all construction permits and good bids consistent with the projects financing budget.
Public/Private Venture to Develop Student Housing on Private Property Adjacent to California State University, San Bernardino (RFIN 05-03-08)
RESOLVED, by the Board of Trustees of the California State University, that the Trustees:
i. Approve the concept of a public-private partnership that would provide land and facilities to support the University's educational mission and academic programs, and bring additional student housing to the campus.
2. Authorize the chancellor and the campus to enter into negotiations for agreements as necessary to facilitate the public/private partnership as explained in Agenda Item 4 of the May 13-14, 2003 meeting of the Committee on Finance.
3. Will consider the following additional action items:
a) Approval of the development plan negotiated by the campus and the developer with the advice of the chancellor for additional student housing;

b) Approval of the master plan to delineate the future campus boundary as it pertains to the project;
c) Approval of an amendment to the Nonstate Capital Program; d) Approval of the schematic design; e) Approval of the EIR; and f) Approval ofafinancingplan.
Real Property Venture at California State University, Fresno for a Mixed-Use Development Project (RFIN 05-03-09)
RESOLVED, by the Board of Trustees of the California State University, that the Trustees:
i. Approve the concept of a public-private partnership for a mixed-use development on 49 acres at California State University, Fresno.
2. Authorize the chancellor and the campus to enter into negotiations for agreements as necessary to develop a final plan for the public/private partnership as explained in Agenda Item 4 of the May 13-14, 2003 meeting of the Committee on Finance.
3. Will consider the following additional action item8:
a) Approval ofa development and financial plan negotiated by the campus and a developer with the advice of the chancellor for additional student housing;
b) Approval of the master plan as it pertains to the project; c) Approval of an amendment to the Nonstate Capital Program; d) Approval of the schematic design; and e) Approval ofthe EIR.

BOARD OF TRUSTEES j
Conferral of The Title President Emeri~us (RBOT 05-03-03)
WHEREAS, Robert L. Caret was named in 1995 to the presidency of San Jose StateUniversity, which he promptly positioned as the Silicon Valley's Metropolitan University while instilling pride among students and faculty in their historic campus; and
WHEREAS, During his eight-year tenure, he oversaw the launching of the innovative, joint City-University Martin Luther King Jr. Library, the Campus Housing Village, the renovation of the University House for the student association, and a wide-spread upgrading of the university's infrastructure; and
WHEREAS, He actively addressed the needs of his campus, implementing a President's Scholars Program, creating a Campus Climate Office, helping to streamline the curriculum through a Curricular Priorities effort, creating innovative faculty housing programs, and leading the university into Title IX compliance; and
WHEREAS, He deeply involved himself in the community, actively supporting arts, civic initiatives, and businesses, as well as addressing regional workforce needs, especially in his nationally-recognized "It Takes a Valley" teacher pipeline program; and i
WHEREAS, It is altogether fitting that the California State University recognize those members who have made valuable contributions to their universities and to
this system of higher education; now, therefore, be it
RESOLVED, By the Board of Trustees of the California State University, that this board confer the title of President Emeritus on Robert L. Caret, with all the
rights and privileges thereto.

COMMITTEE ON COMMITTEES
Election of The Chair of The Board of Trustees for 2003/2004 (RCOC 05-03-01)
RESOLVED, By the Board of Trustees of The California State University, on recommendation by the Committee on Committees, that the following officer is elected as chair for the 2003/2004 year:
Chair: Debra S. Farar
Election of Vice Chair of The Board of Trustees for 2003/2004 (RCOC 05-03-02)
RESOLVED,By the Board of Trustees of The California State University, on recommendation by the Committee on Committees, that the following officer is elected as vice chair for the 2003/2004 year:
Vice Chair: Murray L. Galinson
Appointments to The California Postsecondary Education Commission for 2003/2004 (RCOC 05-03-03)
RESOLVED,By the Board of Trustees of The California State University, on recommendation by the Committee on Committees, that the following appointmentsbe made to the California Postsecondary Education Commission for the 2003/2004 year:
Ralph R. Pesqueira (Representative) Kyriakos Tsakopoulos (Alternate).

COMMITTEE ON COMMITTEES
COMMITTEE ASSIGNMENTS FOR 2003/2004 (RCOC 05-03-04)
RESOLVED, By the Board of Trustees of The California State University, on recommendation by the Committee on Committees, that the following appointments be made to the Standing Committees for the 2003/2004 year:
AUDIT
Shailesh J. Mehta, Chair
Kyriakos Tsakopoulos, Vice Chair GOVERNMENTAL RELATIONS Debra Farar Murray L. Galinson, Chair William Hauck Roberta Achtenberg, Vice Chair Frederick W. Pierce, IV Robert G. Foster
William Hauck
CAMPUS PLANNING, BUILDINGS & M. Alexander Lopez GROUNDS Ralph R. Pesqueira Ralph R. Pesqueira, Chair Kyriakos Tsakopoulos Anthony M. Vitti, Vice Chair Murray L. Galinson INSTITUTIONAL ADVANCEMENT Harold Goldwhite Kyriakos Tsakopoulos, Chair M. Alexander Lopez Frederick W. Pierce, IV, Vice Chair
Harold Goldwhite
COLLECTIVE BARGAINING M. Alexander Loplez fl :. Robert G. Foster, Chair Anthony M. Vitti William Hauck, Vice Chair Roberta Achtenberg ORGANIZATION AND RULES Murray L. Galinson Anthony M. Vitti, Chair Ricardo F. Icaza Ralph Pesqueira, Vice Chair Shailesh J. Mehta Ricardo F. Icaza
Ralph R. Pesqueira Dee Dee Myers
EDUCATIONAL POLICY UNIVERSITY AND FACULTY Roberta Achtenberg, Chair PERSONNEL Shailesh J. Mehta, Vice Chair Frederick W. Pierce IV, Chair Robert G. Foster Robert G. Foster, Vice Chair Murray L. Galinson Dee Dee Myers Harold Goldwhite Kyriakos Tsakopoulos M. Alexander Lopez Anthony M. Vitti Ralph Pesqueira
FINANCE
William Hauck, Chair Shailesh J. Mehta, Vice Chair Roberta Achtenberg Harold Goldwhite
Ricardo F. Icaza
M. Alexander Lopez
Frederick W. Pierce IV

PROVIDING 9~i-~
E;OR PEkOGBESS ~"~Y~i~"
Califo rn ia ~i~ Hi~ljer Education
Enrollment Demand i:-
and Resources into
the 21"' Gentzlry
CALIFORNIA c~ POSTSECONDARY
EDUCATION
~ (( COM1LIISSION
FEBRUARY 2000 (1 COMMISSION REPORT 00-I

~
1 Executive Summary, Findings, and Conclusions
Executive At the outset of the 21"' Century, California faces the certainty of phenomenal summary demographic growth and change in an environment of prospective continued
economic prosperity. Policy makers will be challenged in every quarter to anticipate and respond to these conditions. Decisions made today will shape the lives of all Californians tomorrow.
Nowhere is that challenge greater, or the stakes higher in terms of sustaining the State's future, than in higher education. Demographic changes, economic conditions, educational reforms, progress in preparing students from all groups and locales for college, and other factors will converge to produce his- toric increases in demand for higher education enrollment.
That projected demand raises questions about both the capacity at California colleges and universities to handle such increases as well as our ability and willingness to fund such growth from public sources. How we answer these and related questions will be critical in determining if California can provide for progress by sustaining the opportunity for quality education beyond high j school. As the State's higher education planning and coordinating agency, the California Postsecondary Education Commission is vitally interested in helping find those answers. That is the central focus of this report.
DISPLAY 1-1 Headcou,lt Enrolbne,us 61 California Public Higher Educario~l. 1960 to 1997; n~ld Projeaed Glrollmenls. 1998 to 2010
1~-I~~ Tidal Wave II
Tidal
'f~11.200.0~
~I
~ac"",·'c,~·,s~,s~i,~~ Source: Depamnenl of Hnance. Demographic Research Unit; Smelser, 1974.

California has been at a similar crossroads before and triumphed. Tn the three decades following World War II, a surge of students, termed Tidal Wave I, threatened to swamp the then-existing public higher educational facilities. The utility of the era's leaders' visionary response, including the develop- ment of the historic California Master Plan for Higher Education and the fi- nancing and construction of many, many new public college and university campuses, proved itself for decades. Concomitantly, the positive role of higher education -- both in serving students and, sparking technological inno- vation through campus-centered research -- in the State's subsequent overall economic and social gains is well documented.
Today, the question is whether California postsecondary enrollment growth will be "...moderate and steady by historical standards" as some contend (Legislative Analysts Office, 1999), or be the "Tidal Wave II" of burgeoning demand, on an order of magnitude exceeded only by the historic growth in the postwar years, cited by former University of California President Clark Kerr. California's historic college enrollment patterns, as well as the Com- mission's projected future growth, are shown in Display 1-1. It illustrates, and other data in this report support, the Commission's thesis that, not only is "Tidal Wave II" real, it is, rather than being imminent, already underway.
In carrying out its planning function (see Appendix B), the Commission has engaged in an ongoing assessment of higher education enrollment demand and the State's ability to accommodate it. The 1995 Commission report, A Capacityfou Growth: Enrollments, Resources, and Facilitiesfor California Higher Education, 1993-94 to 2005-06 (June 1995), accurately projected sig- nificant increases in enrollment demand to 2005.
This new report updates those projections through the current decade to 2010, revealing an enrollment growth trend that is stronger still. Commission analysis supports a projected increase of 714, 753 students by the end of this decade (a 12-year period from fall 1998 to 2010). It is certain, too, that this will be the most diverse group of students in the State's history. In that light, the Commission has assessed the present capacity of higher education facili- ties, concluding that more public higher education capacity will be needed across the board before the end of the decade. Also updated in this report are the State's higher education capital outlay needs. These ate now projected to add up to some $1.5 billion every year for the next 10 to 12 years, a signifi- cant increase over the Commission's 1995 estimates.
Among the questions raised by these Rndings for California policymakers and educators are the following:
· How much should California spend to maintain its current public colleges and universities?
· Should existing campuses be expanded, should new campuses be built and, if so, how many and where?
· Will new technologies aid in student instruction, expand distance learn- ing, and impact enrollment demand?
· Will higher education operational innovations like more summer sessions and networked off-campus centers help expand capacity~?
· Can California afford pay-as-you-go financing to expand public college enrollment capacity?
· How much bonded debt can California assume prudently, and how much should go to higher education?
This report, therefore, offers a thorough and solid analytical base and back- drop for a serious, ongoing public policy discussion concerning higher educa- tion in this decade and beyond. Based on this analysis, a number of Commis- sion findings and some concluding remarks are set forth below. However, a more comprehensive policy discussion and set of recommendations are in a companion report, Policyfor Progress, I~eafj~imzing California Higher Edu- cation, Accessibility, AfSordabi2ity, and Accountability Into the 21"1 Century. Together, these reports provide a comprehensive overview of the higher edu- cation challenges and the opportunities now before California.
Finding and crafting answers for these challenges will be complicated by other issues, including the expanding role of technology, the State's growing ethnic diversity, and increasing competition for public monies from areas like health care, transportation, the environment, and corrections,
A strong and resilient economy has produced a surplus in the 2000-01 State budget that may run as high as $9 billion. Such prosperity, if it continues, offers great opportunity to address the challenges posed by the projected en- rollmentt increases. However, coming close after the worst recession in 60 years, there is ample reminder that such economic good times cannot and will not last indefinitely. Given these imperatives, how policymakers, educators, and the public respond will help determine if the State's higher education in- stitutions can continue to provide the impetus behind, and the means by which, California will experience the progress that leads to the collective well being of its citizens.
Findings The findings and conclusions in this report are those of the Commission alone. However, the Commission staff was aided in producing this report by numerous individuals, including members of a Long-Range Planning Com- mittee with representatives from across the higher education spectrum (a complete list of acknowledgements and committee members is in Appendix A).
Based on the analyses in this report, the Commission offers the following findings :
Enrollment projections
1. California faces a powerful enrollment demand surge in the coming dec- ade that is generally referred to as "Tidal Wave II." Between 1998 and 2010, the Commission anticipates an increase of 714,753 students (35.8

percent) prepared to seek enrollment at ail levels in the public higher education sector.
This will be the most diverse student body in State history with respect to academic and career interest, demographic makeup, socioeconomic status, and preferred learning style. Representation of Latino and Asian students should increase significantly due primarily to their projected population growth. The numerical representation of African American and Native American students in higher education will increase substan- tially, although their proportional representation will remain virtually unchanged.
2. About 72.3 percent, or 516,801 more students, will result from popula- tion growth and changes in the class size of public high school graduates. The remaining 27.7 percent, or 197,952 students, will result from im- proved college participation rates.
3. Each public higher education system will experience substantial enroll- ment demand growth: 35.9 percent at the California Community Col- leges (CCC), 37.1 percent at the California State University (CSU), and 32.4 percent at the University of California (UC). Undergraduates will account for about 95.2 of this demand. Undergraduate demand will total over 2.25 million by 2005, before climbing to 2.57 million by 2010.
Enrollment capacity
4. Overall, California public higher education has some current excess ca- pacity but, without building new facilities and/or using existing facilities more efficiently, will soon be unable to accommodate all who would de- sire to enroll.
The University of California is at capacity now, and will need space for an additional 49,329 full-time equivalent (FfE) students by 2010-11. The California State University has excess capacity for an additional 13,982 FTE students that will be gone by 2002-03. By decade's end, GSU will need space for an additional 68,416 students. The community colleges have excess capacity for 73,272 FfE students, which will be filled by 2002-03. Thereafter, the community colleges will need capac- ity for an additional 226,518 students.
California's independent colleges and universities are growing rapidly too, although reported to now have about 23,000 unfilled student spaces, with another 12,300 spaces opening by 2010.
5. California public higher education has 116.7 million assignable square feet of space on 137 campuses, plus several dozen permanent educa- tionai centers: 45.6 percent at UC, 23.8percent at CSU, and 30.6 per- cent in CCC.
6. Classrooms and teaching laboratories, the primary determinants of en- rollment capacity, comprise 5.9 percent of the space at UC, 23.5 percent at CSU, and 44.5 percent of the CCC space.

Existing formulas that determine such enrollment capacity in California public higher education appear obsolete. The California State University is engaged in a promising major effort to revamp facilities planning and administration.
7. The Commission's estimates of unused capacity take into account the "mismatch problem," which reflects the fact that there is seldom a per- fect fit between facilities and students, since some facilities exist at un-
derutilized campuses. In addition, class size and facility size also ex- perience mismatches.
Capital outlay costs
8. Overall, the Commission estimates that California will need to spend $1.5 billion per year for each of the next 10 to 12 years, and quite possi- bly longer, both to maintain the existing physical plant, and to provide for the strong enrollment demand expected during that time. The annual needs in the three public systems of public higher education are as fol- lows: University of California - $618.1 million; California State Univer- sity - $358.7 million; California Community Colleges - $526.1 million.
9. Campus construction and renovation costs have risen since 1995. The Commission estimates that the cost of new construction at UC will be
$525 per assignable square foot (ASF), with renovation costs at $240 per ASF. Comparable costs at CSU are $390 and $240, respectively; costs at CCC are estimated at $350 and $210, respectively.
The Commission's estimated cost of maintaining the existing higher education physical plant is now $681 million per year and, due to the factors noted above, are up significantly since 1995.
10. Between 1998-99 and 2010-11, the Commission now estimates that
California public higher education will need to spend $821.4 million per year for enrollment growth, including the large initial expenditures for the new UC Merced campus. This was estimated at $400 million per year in 1995.
Economic andfiscalforecast
11. California is in the midst of an economic boom that may be unprece- dented in its history. It has produced multi-billion dollar surpluses in the State treasury for the past several years, and promises to deliver more such surpluses in the future.
12. Most recent economic forecasts, including the Commission's 1995 pro- jection, are conservative. However, a Sew economists and other analysts suggest that there is a confluence of demographic and technological fac- tors that are reinforcing each other to produce the current level of growth in national Gross Domestic Product (GDP), which is averaging about four percent per year when adjusted for inflation.

13. Since 1994, the national and State economies have been marked by both strong growth and low inflation which, historically, is an unusual combi- nation. The strong probability is that this has been made possible by ex- tremely strong productivity gains created by personal computers running sophisticated software, and by a telecommunications revolution of which the Internet is the centerpiece. The productivity gains measured by the Department of Commerce may be, like those for GDP, underestimates of the real gains.
14. The Department of Finance has projected national GDP growth for the next 10 years at 2.5 percent, which is close to the consensus forecast. The Department's California General Fund growth assumptions relate closely to this national rate, and average 5.4 percent per year between 1998-99 and 2010-11. The Commission believes that it is much more
likely that real GDP growth will be close to four percent, and that Gen- eral Fund growth will, accordingly, be greater than currently predicted, producing surpluses through at least 2008, and perhaps longer. It is likely that the General Fund will grow, at least through 2008-09, at a rate of 6.5 percent per year.
Debt capacity
15. A 1999 State Treasurer report, Smart Investments, suggests that Califor- nia's current ability to finance general obligation bonds and other debt instruments has grown because of the strong economy. There have been II elections for general obligation bonds in the past three decades, of which eight have passed. In general, the losing measures came during recessions or periods of economic uncertBinty (1976, 1990, 1994). The size of the bond issue appears to bear no relation to the outcome of the election.
16. As a general rule, California should not permit debt service (principal and interest repayments on bonds and related debt issues) to exceed 6.0 percent of General Fund revenues. Present debt service is 3.8 percent, based on 1999-00 revenue projections. Following this rule, and based on the Commission's revenue projections, California could sell over $5 bil- lion in General Obligations bonds each year, assuming voter approval, an amount exceeding the total indicated necessary by State agencies, ex- cluding the State Department of Transportation.
17. The State Treasurer notes in that report that selling suff~cient bonds to raise the debt serviceto five or six percent might place undue burdens on the General Fund, recommending that California limit itself to selling be- tween $3 and $3.5 billion in bonds per year. However, with the Com- mission's expanded General Fund projections and a modest expansion of debt service levels, it appears that California could afford annual sales of $4.5 billion.
Because public higher education's share of total statewide capital outlay need, excluding transportation, is between 20 and 25 percent, the three

systems could expect to receive about $1 billion per year, assuming voter approval of the bond issues at these projected levels.
Conclusions As it enters the 21"' century, California must prepare for an enrollment surge in higher education that has only one meaningful precedent in its history: the great flood of post-World War II and "Baby Boom" entrants that became known as the enrollment'"Tidal Wave." That group swelled the existing pub- lic campuses - and led to the creation of dozens more in the three systems - over a period of 30 years that can easily be divided into two eras. The first was the 1945 to 1960 post-war era, with the second coming between 1960- 1975 when the baby boomers matriculated, and California achieved a world- wide reputation for wisdom and foresight through its Master Planfor Higher Education in California. The challenge of growth faced then was unprece- dented, but the challenge for California's future may be no less of a test of commitment and resource allocation.
The Commission hopes that the present generation of policy makers will ex- ercise as much prudence and good judgment as those of previous eras. How- ever, if they are to do so, they must be given a clear picture of the challenges ahead. Such is the primary purpose of this report, to define the challenge, and to define as well the resources that will be available to meet it.
It is likely that the present technological and communications revolution will bring further changes at a rapid pace, and just when the policy leadership faces all of the usual challenges associated with demographic and economic expansions. Yet, in spite of the challenges to be faced in the next decade, the Commission believes there are many reasons for Californians to be optimis- tic. As great as the challenge is of finding the necessary resources to meet the Tidal Wave Il enrollment demand, there is ample reason to believe the resources will be present to do the job.
Higher education planning has been an ongoing Commission concern, al- though it has not always expressed such optimism. In 1995, the Commission concluded that there was almost no way to meet the capital outlay needs of higher education identified at the time. Today, with the continuing economic boom, and in spite of the fact that the needs have grown dramatically from $1.0 billion per year to $1.5 billion per year, it is time to alter that point of view. This is not to say that California can, or should, meet all of higher edu- cation's capital outlay needs by passing ever greater general obligation bond issues, but it does appear that bonds can now meet at least two-thirds of the need, and perhaps more. For the remainder, there are some obvious candi- dates.
For the community colleges, there is a large reservoir of unused debt capacity at the local level, a capacity fhat exists because of the great difficulty in achieving a two-thirds vote for bond approvals. If that requirement is re- duced to a simple majority, as is currently proposed in Senate Constitutional Amendment No. 1 (O'Connell), it would be a relatively simple matter to re-
quire a 50-50 match between the State and local community college districts tan initiative for a simple majority failed on the March 2000 ballot). Such

changes as those might add several hundred million dollars to the available pool of funds, and virtually close the gap between the need and the available resources. It is likely that private fund raising, particularly at the University of California, could raise all of the remaining funds needed by that system.
The current general obligation bond issue, Proposition 1A, provided $2.5 bil- lion in capital outlay funding over a four-year period that ends with the 2001- 02 fiscal year. That amount provides the three public systems with $625 mil- lion in funding per year, far short of the need identified in this report. When these resources are expended, it is likely that a new issue will be offered for a vote, probably in November 2002. if it is again a four-year offering, the Commission believes the amount should be for $4 billion, to be expended at the rate of approximately $1 billion per year. If the requirement for super majorities for community college elections cannot be relaxed, then the Legis- lature should consider a larger bond issue of about $5 billion. Even an amount that large, given the fiscal projections contained in this report, should not unduly strain General Fund resources.
The Commission also recognizes that recent advances in information tech- nology and digital electronics are creating exciting and unprecedented oppor- tunities for enhancing teaching and learning at all instructional levels. Al- though distributed learning arrangements, in particular, are providing stu- dents with greater flexibility and options for completing their educational goals, statewide planning efforts are needed to tie such arrangements to the student access challenges resulting from the burgeoning growth in new stu- dent demand. Enrollment issues facing higher education must be addressed by a combination of expanded physical facilities, increased uses of existing physical resources, and greater use' of information technology. In its next technology study, the Commission intends to consider in greater depth how various facets of technology-mediated environments can enhance both stu- dent access and success.
California's Master Plan has rested for almost 40 years on a tripod about which there was been a wide aTld resilient consensus: accessibility, quality, and affordability. During past college enrollment surges, resources have been arrayed to build the necessary facilities. When recessions have necessi- tated resource reductions that have an impact on quality, California has al- ways found a way to recoup before permanent damage was done. And, when student fees escalated rapidly - usually due to economic reversals - Califor- nia has greeted better times with fee reductions or a refusal to impose further increases.
In the immediate future, the two booms - in enrollment demand and eco-
nomic growth - offer a challenge to policy makers and educators that is unique in most lifetimes. It is not just the singular challenge of accommodat- ing enrollment growth, nor the challenge of managing a resilient economy; there is ample precedent for both. Today's challenge is not only to find a way to enroll the new tidal wave of students and to spend probable budget surpluses wisely, it is also the challenge of finding ways to do business dif-
ferently, to bring about changes in both economic and educational cultures occasioned by technology's overwhelming effects on everyone's lives.
More than anything, this era encompasses not only the trials occasioned by growth, but one of those exceedingly rare windows of opportunity where re- sources grow at such rates that one generation is given the chance to build a solid foundation for the next. An earlier generation, and the only one that ever saw economic growth at the levels anticipated, and already experienced, for this one - the generation that governed from 1900 to 1930 - failed in that responsibility as the Great Depression wiped out most of what had been gained. This generation has a similar opportunity, one that we hope will be seized and administered with greater wisdom.
~II - --------------------------- -
i ....

POLICU
FOR BRBGRESS
Reaffirming California HiRher
Edu ca t io n
Accessib ility, AffordaDility, and
Accountability into tlje 2~"" Century
Ea CALIFORNIA POSTSECONDARY
EDUCATION
C O N1 I~ I S S I O N ~s~n~~
COMMISSION REPORT 00-3

_ ~ ___ __ __~~~
1 Executive Summary and Recommendations
Executive Entering the first decade of a new century, California has embarked upon a pe- summary riod of profound change and, in many ways, daunting challenge. Higher edu-
cation is no exception. State policy makers, college and university administra- tors, faculty, students and their families will be affected.
As the State's higher education planning and coordinating agency, the Califor- nia Postsecondary Education Commission's response to help meet this chal- lenge has been twofold: First, in a companion to this report, Prqviding for Progress: California Higher Education Enrollment Demand and Resources into the 215' Century, the Commission presented analysis to support a projected higher education enrollment increase of 714,753 more students in California colleges and universities by 2010. That report also concluded that capacity of current higher education facilities must be improved and expanded to meet this need, projected the cost to the State for doing so will be $1.5 billion per year for at least the next decade, and examined the State's ability to finance these changes.
This report incorporated those findings and represents the Commission's next step: to set forth a cohesive set of higher education policy recommendations for the future to help guide elected officials, educational leaders, and State oversight or educational coordinating agencies. This report also discusses a number of other factors that influence the current discussion, including dra- matic changes in the State's demography and diversity, the ever-more impor- tant role of technology in higher education and elsewhere, and an economy that currently produces expanded economic resources for public education under- takings while also creating new employment demands and opportunities for all who pass through our institutions of higher education.
Together both of these new reports update the Commission's prior long-range planning reports, The Challenge of the Century and Capacity for Growth, completed in 1995. Those reports proved accurate and have been instrumental in higher education planning since their publication. We expect the Commis- sion's new report to be no less important or useful to all who address the chal- lenges that lie ahead for California higher education and the State at large.
Recommendations The recommendations of this report are summarized below. Some are slightly reordered or rephrased from the body of the report where they are more thor- oughly discussed; each has a page reference. The recommendations are di- vided into the three intended groups: (1) elected officials and policy makers, (2) higher education leadership; and (3) the Commission and other coordinat- ing entities. They focus on education access,· affordability, and accountability.

Recommendationsfor California Elected Officials and Policy Makers
* Invest in elementary and secondary school improvement (p. 17).
Assess progress in adopting school performance standards and assessment, and encourage and support stronger teacher education programs (p. 18).
* Continue support for outreach activities by public colleges and universities (p. 19).
* Search actively for ways in which high school graduates can be provided access to postsecond- ary education institutions that best fit their interests and abilities (D. 19).
* Conduct informational legislative hearings on the progress of the Bureau for Private Postsec- ondary and Vocational Education (BPPVE) in implementing the provisions of the Private Pdst- secondary and Vocational Act(p. 19).
Link State funding for public higher education with the undergraduate enrollment it is intended to support (p. 31).
* Increase appropriations for Cal Grants so that the State's goal of providing new awards equiva- lent to one-quarter of the total number of public high school graduates annually is achieved (p. 32).
* Develop a policy regarding funding requirements for insti~ution-administered aid programs, in- cluding the portion that should be funded by the State. In addition, the California State Univer- sity (CSU) and the University of California (UC) should develop clear detinitions of the pur- pose, funding, and uses of institutional grant support and how those institutional grant programs differ from and complement the State Cal Grant program (p. 32).
* Seek to develop consensus for General Fund support of scheduled and deferred maintenance (P· 32).
* Lnvest in technology initiatives that improve student learning, enhance access, and/or increase institutional productivity (p. 33).
* Identify specific outcome areas in which CSU and UC should provide evidence of institutional performance and condition future investment on maintaining or increasing performance in each area (p. 39).
* Request California independent colleges and universities to provide evidence of institutional performance similar to that requested of public colleges (p. 40).
Require the community colleges and the CSU -- and request UC and Independent colleges and universities -- to submit annual performance reports to the California Postsecondary Education Commission for its review and comment (p. 40).

Recommendationsfor California Higher Education Leadership
Expand collaborative efforts to ensure consistent levels of rigorous academic instruction for every elementary and secondary school student (p. 21).
Each sector of regionally accredited higher education should assign greater weight to teaching excellence and school collaboration in the faculty retention, tenure, and promotion OITP) proc- ess (p. 21).
All systems and sectors of regionally accredited higher education should regularly collect data on institutional effectiveness in facilitating student achievement, including placement data and success of its graduates in meeting external certification and professional licensure examinations (P· 42).
* The CSU and the UC should initiate a validation study of their respective admissions criteria (p. 21).
Selection by the community colleges, from the several definitions of "transfer-eligible'' students, of a single definition for purposes of developing a methodology for estimating annually the size of this student pool (p. 22).
Review, by the community colleges, CSU, and the UC, of their respective transfer plans to iden- tify ways in which the transfer process can be simplified and made more effective for students. Where appropriate, modifications should be made to accomplish this goal and to ensure com- patibility between and among each system's plan. Additionally they should each prepare 10- 1,-:-: - year plans to expand their capacity by establishing an FTES enrollment goal they will strive to accommodate through technology mediated teaching and learning opportunities (pp. 22 and 23).
* Urge California's independent colleges and universities to report how many more Californians they can accommodate, and define the distribution of such capacity statewide by location and type of institution (p. 24).
Seek to identify and implement strategies to permanently reduce or retard growth in costs of higher education in all sectors (p. 34).
Adopt the practice of all higher education institutions providing students information on the in- stitutional costs of providing a quality educational experience in relationship to the tuition and fees (sticker price) being charged to students (p. 34).
Seek ways to reduce expenditures in any year in which mandatory tuition and fees (sticker price) are increased by a percentage that exceeds the average percentage increase in per capita personal income (p. 35).
Declare the mission-specific goals and performance standards that each public college and uni- versity system and regionally accredited independent college or university seeks to achieve. To provide for statewide coordination and compatibility, review and comment should be sought from the Commission prior to finalizing performance goals for each of the public systems (p. 42).

MOVING
CALIFORNIA
AI-IEAD
An Executive
Summary Concerning Two Conzmission
Highei· Education Long-Raizge Planning Repovts,
Pro viding fo r Progress and Policy for Progress
"i;? CALIFORNIA
no POSTSECONDARY EDUCATION
71~ h
C O M_ N~ I S S I O N
JUNE 2000 1/ COMMISSION REPORT 00-5

1 Moving California Ahead; An Intro~uction
- -- --
A S THE POLICY DEVELOPMENT and coordinating entity for California higher education, the California Postsecondary Education Commission has produced hundreds of major reports and recommendations over the last quarter century. These Commission studies, reports, and analyses have addressed postsecondary issues, policies, and proposals of vital in- terest to those who govern California and administer or teach in its col- leges and universities, as well as students and their families.
In that tradition and because of the issues facing
higher education today, the Commission recently No,uhel·e is that challenge greater, or completed two major interlocking studies: Provid- the stakes highel· in tel7ns of sustailz- i,,g for Progress: Califorrzia Higher Education Erz- ing the State's future, than irt higher rollment Demand and Resources into the 21SI Cen- education. Dentographic changes, tury, and Policy for Progress ReaJj~imziizg Califor- economic corzditions, educational ~·e- .i, Higher Education Accessibility, Affordability, fornts, progress in preparilzg students ,,d Accountability into the 21S' Centtlry. from all groups and locales for col- lege, alld otherSactors ~uilE converge to Among other issues, these newly adopted Commis- produce historic increases il2 d~mand sion reports address California's continued bur- for higher educatiolz eltrollnlellt. geoning growth in higher education enrollment
demand and the State's ability to respond; eco- Providing for Progress: Ca lifornia Higher
Education Enrol Iment Demand and nomic trends that will affect both the ability to fi-
Resources into the 215C Century. nance higher education growth as well as the types of learning and~training opportunities it will be called upon to offer; how to retain our State's edu-
cational excellence while maintaining access for an increasingly diverse student body, and the growing importance of technology in the classroom and education environment. This is a summary of these important new
reports .
A pattern Ln a period of profound social, economic, and demographic change, the for progress: work of the Commission has been seminal in helping California imple-
present and past ment and evolve its acclaimed Master Plan for Higher Education and to Commission maintain the State's worldwide reputation for access to quality educa-
long-range tional opportunities beyond high school. Often, that work has influenced planning reports the course of higher education events in the state, helping California to
move ahead in a manner that benefits all.
One example of the Commission's past work is the 1995 report, A Capac- ity for Growth: Enrollments, Resources, and Facilities foi- California Higher Education, 1993-94 to 2005-06 (June 1995). It accurately pro-
jected California's dramatically increasing Tidal Wave I~ demand for en- rollment slots at public and private colleges and universities, and exam- ined the State's economic means and political will to finance the facility expansion and change necessary to meet such a challenge.
When Californian voters passed Proposition 1A on the November 1998 statewide ballot to provide some $2.5 billion more in education bond money, the Commission's Capacityfor Growth analysis was cited as be- ing instrumental in demonstrating the need for this measure.
Another example of the Commission's important past work is T~ze C72aI- lerzge of the Century, Plannirzg for Record Studelzt Elzrolbneitt atzd blz- proved Outcomes in Califonzia Postsecondary Educatiolz, also completed in 1995. It contained a number of specific policy recommendations on California higher education and has helped to guide not only the Com- mission's subsequent work but also figured prominently in the work of others as well. In it the Commission advanced the following vision to guide policy makers and educational leaders:
California requires a cohesive system of first-rate schools, col- leges, and universities -- both public and private -- that is charac- terized by a clear set of high expectations, collaboration among institutions, and public accountability for institutional perform- ance. Its colleges and universities should continually engage in critical self-examination to determine how teaching and learning
can best be improved and institutional efficiencies and produc- tivity enhanced. These institutions must receive adequate levels of financial support to ensure that all Californians who prepare themselves to benefit from instruction have access to educational
opportunities that nurture the very best in them. In this way, education can mitigate inequitable differences in family back- ,oround and prepare all Californians to participate fully in the State's political democracy, contribute to its continually chang- ing economy, and recognize the unique benefits of California's diversity for the creation of ideas and culture.
This vision continued to guide the Commission's new efforts in updating its postsecondary plan through 2010. Providing for Progress reexamines California's growing demand for higher education slots in light of con- temporary demographic and economic realities. It looks too at the State's current college and university enrollment, capacity, both public and pri- vate, and its ability to finance continued improvement and expansion of its public postsecondary facilities.
In Policy for Progress, the Commission more sharply defined its vision, asserting that students, and nurturing the very best in them, should be at the center of decisions to change or modify higher education institutional policies, practices, pricing, structure, or expansion. The Commission also stated that achieving this vision requires all constituent groups - policy makers, educational leaders, students, pari~nts, and business leaders - to

accept a share of responsibility. It offers a comprehensive set of recom- mendations to ail concerned with and responsible for the continued well- being of higher education in California.
Today, at the outset of a new century, we expect the Commission's latest work to be as much -- if not more -- important or useful to all whom ad- dress the challenges that lie ahead for higher education and California at large.
Factors that In completing both new reports, the Commission took into account a inf"luence tile number of critical demo~aphic, economic, social, and educational factors
future of that will likely influence significantly the future course of higher educa- California Higher tion in the state. Among them:
Education
California's total population now exceeds 33 million and will ,orow by approximately 600,000 people per year. Coupled with the perception that a college education is essential to future pros- perity, such growth has fueled and will continue to fuel steady demand for access to education beyond high school.
Californians are growing simultaneously older and younger. By 2020, those 65 years or older will grow by more than 70 percent for a total of 6,363,390 with the 14-year old and under age categories growing 26.7 percent to a total of 10,574,920 not only will many older citizens seek life-long learning opportunity, but the~sheer size of the younger cohort will strain the capacity of the State to provide adequate facilities and numbers of competent teachers needed to prepare students for success in postsecondary education and for gainful employment in California's economy.
Estimated Gzrollnze~zt Denzann to Public Colleges and Llniversities, Fall 2000 to Fall 2010
O T_rC= I CSLT ~ I=CC
z.sea,nso
Ztwep~o
I,~uupo~o
~I I-
1·8·····0 i/
soe~o%ro
1~98 1~9 t(100 38613 9~L? 1~LB~3 ~9641~B~f;L~06 ~ ~cesr ~eap 2,Is
Source: CPEC staff analysis.

California will attain soon the distinction of being the first mainland state in which no racial/ethnic group represents 50 percent or more of the population. This diversity also presents significant challenges to Califor- nia's public schools, colleges, and universities where many students do not speak English as their primary language.
* California also has considerable diversity in the distribution of in- come among households and the trend shows growing income inequality in different households. Since 1969, the average
household income of families in the 10" percentile declined by more than 22 percent
It is likely that the present teclzno- between 1969 and 1997 while the average household income of families within the
logical alzd comntulzications revo- lution will brilzg further clzaltges 90'" percentile increased by nearly 49 per- at a rapid pace, al2djust ~ohen the cent. policy leadership faces all of the * The Commission's work shows that more usual challel2ges associated with students than in the past - across all ra- denzographic artd economic ex- cial/ethnic and gender groups are pansions. Yet, in spite of the chal- completing college preparatory courses. lenges to be faced ilz the Itext dec- However, major disparities continue to exist ade, the CoalNlission believes tltere among distinct groups of high school are n2alIg reasons for Californialu graduates: White graduates are twice as to be optimlistic. As great as tl~e likely to achieve university eligibility as chalIel2ge is of finding the neces- their Black and Latino counterparts; Asians saly resources to Nleet the Tidal are twice as likely to achieve university eli- Wave II el2rollnterzt demaizd, tltere gibility as Whites, and suburban high school is anlple reasolz to believe the re- graduates achieve university eligibility at sources will be prese~zt to do tlze higher rates than do rural or urban gradu- job. ates.
Providing for Progress: Ca lifornia
Higher Education Enro I i ment Demand * California's economy is considerably im- and Resources into the 21st Century.
proved over that of the 1990's and has gen- erated renewed confidence in California's
future, and a resurgence of population growth. The strong current economic recovery will likely con- tinue into the first half-decade of the 21S' century.
* High quality educational opportunity is key to the public optimism in the California economy and is reflected in the steady demand for education beyond high school.
California's present economic recovery provides an opportunity to pursue goals and make investments -- both one-time and ongoing -- that were not economically feasible in the recent past and that can improve the quality of learner outcomes, update instructional support equipment, reduce deferred maintenance backlogs for campuses, install educational technology infrastructure, and en- sure adequate numbers of fully credentialed teachers in our schools.

* Increased use of technology is affecting all aspects of life, includ- ing education and employment opportunities. Nearly all Califor- nia schools, colleges, and universities are using the Intemet, as well as other forms of technology, to enhance teaching and learn- ing, to squeeze greater efficiencies from administrative operations, and to reduce inequities in access to current knowledge by stu- dents throughout the state.
While access to technology and use of the Internet has increased nationally, it has not increased equally for all groups.
--
Moving California It is fitting that the two new reports which are the foundation of this re- higher education ahead port - Providing for Progress (CPEC report 00-1) and Policy for PI-o-
gress (CPEC report 00-3)- were adopted at the last meeting of the Com- mission in 1999 and the first Commission session in 2000 respectively. Together, they bridge the Commission's work of the past quarter century with its contemporary efforts in moving California higher education pol- icy ahead to embrace the issues of the new century.
In this summary, the Commission has drawn upon those reports and their respective resources, collecting in a single document the major findings, conclusions, and recommendations of both reports. The complete text of each report contains all Commission assumptions, methodology and re- sources that underlie the Commission's new work. Readers are urged to consult the full text of each report for a more complete understanding of the Commission's work. These and other Commission reports are avail- able by calling (916) 445-7933 or via the Commission Website at www.cpec.ca.gov.
In the sections that follow, information is provided about Providing for PI-ogress and the issues of enrollment demand, institutional capacity, and higher education capital outlay funding. In many ways, the findings and conclusions set the stage for Policyfol· Progress and the topics of contin- ued accessibility, affordability, and accountability in California's public higher education systems. Because of their public funding, the primary focus of the two reports is the State's three public systems of postsecond- ary education -- the California Community Colleges, California State University (CSU), and University of California (UC). Therefore, the ma- jority of the findings, conclusions, and recommendations cited here deal with those public institutions. However, sections of both reports and, therefore, some of the findings and recommendations, are devoted to State-approved postsecondary and vocational institutions and to the inde- pendent colleges and universities that are located in California.
- - - ---- - - - --- --- - -

~
Summary
This in an executive summary of two long-range higher education planning reports completed at the outset of the 215' centui-y by the California Postsec- ondary Education Commission. They are Providirzs for Progress; Califol-nia Higker Educntiol~ Eizi·ollil~elzt Demalzd and Resources inlo the 21'' Celztuly, and the companion Policy for PI·ogress ReafJirmirzg Califonzia Higlzel- Educa- tiorz Accessibilit~l, Af7bl.dability, aizd Accoulztabilit~ ilzto Il?e 21S' Celztulv. To- ~nthor tl7PrP ~~lln TPnnt.t~ hrirtoe the Commission's past work of the past quar- tjc~rlt~l, L11~L)V ~*IV IV~Vlru u··~-0
ter century and its contemporary efforts to move higher education policy for- w~-d to embrace the issues of the new century.
Ln this summary, the Commission has drawn upon these companion reports and their respective resources, collecting in a single document the major find- ings, conclusions, and recommendations of both. Among othel- issues, these newly adopted Commission r-eports address:
California's continued burgeoning growth in higher education enroll- ment demand and the State's ability to respond;
economic trends that will affect both the ability to finance higher edu- cation growth as well as the types of learning and training opportuni- ties it will be called upon to offer;
how to retain educational excellence while maintaining access for an increasingly diverse student body, and
* the gl-owing importance of technology in the classroom and education environment.
The complete text of the Pi-oviding for Progl-ess (CPEC 00-1) and I>olicy fol- Progl-ess (CPEC 00-3) reports contains all Commission assumptions, method- ology, resources that underlie this new Commission work. R·aripra nrp Ilrued ------·- -·- --e
to consult the full '--' -' oo~h C~r a mnrp r~mnlptp Ilnt~Pratanrlino Of the mate- L~hL V1 ~u~l~ Iv, LL I~lvl~ ~vlll~t~lvru U"UV'U'""""~b
rial in t2lis summary. These and other Commission reports are available by calling (916) 445-75)33 or via the Commission Website at www.c~ec.ca.9ov .
-- --- --

ENROLLMENT NEEDS STUDY
FOR THE
SAN DTEGO COUNTY REGION
CSU Chancellor's Office May 2001 Division of Academic Affairs
Office of Analytic Studies
May 2001 i
Enrollmerzt Needs StudV for the San Die~o Re~f~ion
ENROLLMENT NEEDS STUDY FOR THE SAN DTEGO REGION
Summary
This study has been prepared for the California Postsecondary Education Commission, in part, to satisfy a legislative request. It has five component parts:
i. The first part involves a projection of the enrollment potential of San Diego State University (SDSU) and California State University, San Marcos (CSUSM), the two CSU campuses in San Diego County, to insure that all qualified local residents who want to attend a local CSU campus will be assured a place. The projections were made without regard to enrollment ceilings or facilities constraints and can be considered projections of enrollment demand, as such they include both local and non-local students.
The projections show growth due to San Diego County students at San Diego campuses of over 5,800 FTE by 2009-10.
2. The second part summarizes the plans of the two universities to accommodate the enrollments projected in Part 1.
SDSU, which is nearing its 25,000 FTE enrollment ceiling, is projecting total growth of approximately 9,100 FTE. It is responding to this growth in several ways including:
a) a proposal to increase its main campus enrollment ceiling to 27,600 FTE b) offering a expanded array of courses in the state supported summer term c) offering courses at off-campus sites including a center in National City tin
conjunction with Southwestern Community College), a center at Miramar Community College and a proposed center in South County (Otay Mesa in conjunction with Southwestern Community College).
(It is appropriate for SDSU to offer upper division coursework at Miramar Community College, located between the two universities, as all such coursework will be associated
with SDSU impacted m`ajors only. SDSU and CSUSM will also explore joint program and course offerings at the Miramar site.)
With these efforts, provided funding and facilities are available, the university should be able to accommodate all qualified local applicants but it is likely it will have to reject some qualified non-local applicants.
CSUSM, a newer university with substantial room to expand on its main campus in San Marcos, is projecting growth of approximately 4,200 FTE. It is focusing its efforts to accommodate all qualified students by expanding the programs and facilities available on its campus. It is also expanding its efforts at an off-campus site in southwest Riverside County in the city of Temecula. Provided funding and
May 2001 n

Enrollment Needs Sfud~ for fhe San Die~o Re~ion
facilities are available to support these efforts, the university should be able to accept all qualified applicants.
(Added capacity at San Marcos is the best way to accommodate growth from North County and southwest Riverside County. It is also the best way to accommodate students from North City who choose to attend San Marcos and students who cannot be admitted to San Diego State.)
It is the joint opinion of university and chancellor's office staff that, in total, the projections of new students from San Diego County are consistent with attendance patterns and projected high school graduates and community college enrollments from the county. Attainment of the FTE based upon these projections should ensure that all fully eligible California high school graduates and upper division California Community College transfers who apply from the local region will be accommodated locally.
3. The third part consists of a survey of growth patterns in a region consisting of San Diego County and southwest Riverside County (population, jobs, and community college enrollment) as a guide to identifying areas with expanding demand for CSU access.
The region is projected to undergo substantial population growth. San Diego County will add about 500,000 individuals in the 2000-2010 period and another 500,000 between 2010-2020. During these same two periods, southwest Riverside County will add over 200,000 and 290,000 individuals respectively. The areas in San Diego County that will show the most growth 2000-2020 are North County (+300,000), North City, and South Suburban (both +250,000).
In terms of employment, North City accounts for the largest number of jobs (450,000 currently) for any of the areas. Employment growth through 2020 will be largest in North County (+190,000) followedby North City (+165,000), southwest Riverside County (-t150,000), and East Suburban (+93,000).
The largest community college enrollments are in the San Diego Community College District which has campuses in the Central City and North City areas. Growth of enrollment 2000-2015 in the San Diego District will be approximately 26,000 students. During this same period growth of enrollments in the Palomar and Mira Costa districts, both of which are in North County, will be 18,000 students combined. The other three districts, Mount San Jacinto tin Riverside County), Grossmont/Cuyamaca (East Suburban) and Southwestern (South Suburban) will each add approximately 7,500 students.
4. The fourth part describes current efforts and plans of both universities for offering courses at various off-campus sites in the region are described (including programs to be offered at the contemplated centers).
May 2001 111

Enrollment Needs Studv for the San~Die~go Re~iop2
SDSU is currently offering off-site instruction at higher education centers located in South County/National City tin conjunction with Southwestern Community College), North City tin conjunction with Miramar Community College) and is planning a center in South Suburban/Otay Mesa area tin conjunction with Southwestern Community College). The campus is also evaluating an off-campus center in the East Suburban area.
CSUSM is currently offering off-site instruction at a site in Temecula tin conjunction with Mt. San Jacinto Community College).
5. Finally, the fifth part is an extensive description of outreach efforts currently underway at San Diego State and Cal State San Marcos that will assist with recruiting the disadvantaged and historically underrepresented students that will attend the campuses and the new centers.
May 2001 iv

Enrollment Needs StudV for the San Die~ro Re~ion
Table of Contents
~aae
Executive Summary
Introduction 1
Part 1 Survey of CSU Enrollment Demand arising from the Growth 2 of the San Diego Region
Projecting Enrollment with the Student Flow Model Projecting Enrollment and FTE from the San Diego Region
at San Diego State and Cal State San Marcos
Part 2 University Responses to the Enrollment Demand Proj ections: the Potential 8 of San Diego State and Cal State San Marcos to Accommodate the Demand
SDSU Enrollment Growth Planning Strategies CSUSM Enrollment Growth Planning Strategies
Part 3 Regional Considerations of Student Access 10 Regional Projections: population, jobs and community college
enrollment las a guide to identifying areas with expanding demand for CSU access)
Areas of the Region Where Demand for Access Is Likely to Increase
Part 4 Efforts in offering courses/programs at off-campus sites 18 San Diego State University
South Suburban/Otay Mesa Higher Education Center South County/National City Higher Education Center Miramar Higher Education Center
California State University, San Marcos
Southwest Riverside County Higher Education Center
Part 5 Description of outreach efforts at SDSU and CSUSM to recruit students 25 San Diego State's Outreach Efforts in K-12 Schools Cal State San Marcos Outreach Efforts in K-12 Schools
Community College Ou~each Activities
Appendix A Projections of new student enrollments at San Diego State and Cal State 33 San Marcos
Appendix B Maps of San Diego County Major Statistical Areas, Cities, Planning Areas, 34 etc. provided by San Diego Association of Governments
Appendix C Occupational Projections 40
May 2001 V

Enrollment Needs Stud)l for tlze San Die~go Re~gion
List of Tables, Charts and Maps
Tables
1. San Diego County Universities Enrollment Plan FTE and Projected FTE 5 Growth from San Diego County
2. San Diego County Net FTE Growth from 1999-00 at San Diego County 6 Universities
3. Reported and Projected Instruction at the SDSU National City Center 20
4. Enrollment, Courses, and FTE at the Southwest Riverside County Center 22
A-i. San Diego State University Projections of New Students 33
A-2. CSU, San Marcos Projections of New Students 33
C-l. Projections of Employment and Occupations in the U.S. 1988-2008 35
C-2. San Diego County Projections for Selected Occupations 1997-2004 36
Charts
I San Diego State University: FTE Enrollment Plan vs. Demand 8
II CSU San Marcos: FTE Enrollment Plan vs. Demand 9
III-A San Diego County Population Projections by Major Statistical Area 11
III-B Southwest Riverside County Population Projections 13
TV San Diego Region Changes in Populations of Six Major Statistical Areas 13
V-A San Diego County Employment Projections by Major Statistical Area 14
V-B Southwest Riverside County Employment Projections 15
VI San Diego Region Changes in Employment in Six Major Statistical Areas 15
VII Community College District Enrollments Projected through 2015 16
Maps i. San Diego and Southwest Riverside Counties (Note: A set of detailed maps of 12
San Diego County, prepared by SANDAG, is provided in Appendix B)
May 2001 vi

ENROLLMENT NEEDS STUDY FOR THE SAN DIEGO REGION
Introduction
For purposes of this report the San Diego Region is defined to include all of San Diego County and southwest Riverside County adjacent to the I-15 corridor immediately to the north. Two CSU campuses are located in this region: San Diego State University (SDSU) founded in 1898, located in the southwestern part of San Diego County in the city of San Diego, and California State University, San Marcos (CSUSM) founded in 19X9, located in the northwestern part of the county in the city of San Marcos.
San Diego County's population is estimated at 2.9 million in 2000, it is projected to grow to over 3.4 million in 2010 and to 3.9 million in 2020.' Public K-12 schools in the county enrolled almost 469,000 students in 1999-2000 and are proj ected to enroll 491,000 by 2009-10. Over 25,000 students graduated from the county's public high schools in 1999-00. More than 32,000 are projected to graduate in 2009-10 (the last year of DOF/DRU's 2000 Series Projection). Similar growth is forecast for southwest Riverside County, an area that encompasses Temecula and the cities surrounding it. Its population is estimated at 590,000 in 1995 and projected to grow to XX4,000 in 2010 and to 1.2 million in 2020 (Southern California Association of Governments). Public K-12 schools in Riverside County as a whole enrolled 307,055 students in 1999-2000 and are proJected to enroll 378,653 students by 2009-10. Approximately 15,400 students graduated from Riverside County high schools in 1999-2000 and close to 23,000 are projected to graduate in 2009-10 (California Department of Education and DOF/DRU).
The five community college districts in San Diego County enrolled almost 164,000 students in 1999-00 and are projected to enroll 207,000 by 2010-11. During this same period Mount San Jacinto District's enrollment in Riverside County is projected to grow from almost 10,000 to 14,600 students.2
San Diego State University is a mature campus currently enrolling approximately 31,000 students (24,000 FTE3) on the San Diego campus. It draws a substantial share of its enrollments from outside San Diego County. In 1998 and 1999, for example, new students from non-local sources tall sources except San Diego and Imperial counties) comprised 49 and 47 percent of all new enrollments respectively. Total San Diego campus enrollment is projected to be at the current campus enrollment ceiling of 25,000 FTE within two years. SDSU operates an off- campus center, the Imperial Valley Campus (IVC), approximately 90 miles to the east in the city of Calexico in Imperial County. The TVC adds approximately 600 F;TE to the main campus total.
California Department of Finance, DRU, Projections of County Populations to 2040 wilh Age, Sex and Ethnic Detail, Sacramento 1998.
Z The projections were provided by the Chancellor's Ofiice of the Caliiornia Community Colleges. 3 One FTE (Full-Time Equivalent) is a mythical student enrolled in 15.0 units.
May 2001 1

Enrollment Needs Study for the San Die~go Re~pion
San Marcos is one of the newer campuses in the CSU. During 2000-01 it enrolled approximately 6,250 students (4,700 FTE) and has substantial expansion potential before it reaches its built-out enrollment ceiling of25,000 FTE. In addition to San Diego County, San Marcos also draws students from the adjacent southwestern part of Riverside County. In 2000 fall term students originating from outside San Diego and Riverside counties comprised 24 percent of all new student enrollments.
Part I Survey of CSU Enrollment Demand arising from the Growth of the San Diego Region
San Diego State University is approaching its current main campus enrollment ceiling of 25,000 FTE. Several other CSU campuses across the state are also close to their ceilings. In response to issues arising from these situations, the CSU Board of Trustees recently raised the possibility of SDSU increasing its ceiling above 25,000. In addition, the Board has adopted a resolution dealing with campuswide impaction (i.e., a declaration by a campus that it cannot accept additional new students because to do so would cause it to grow beyond its enrollment ceiling). The resolution reaffirms the CSU commitment to the Master Plan to accommodate all fUlly eligible California high school graduates and upper division California Community College transfers. The resolution goes on to state, in part:
...A campus may be designated as impacted campuswide only if the campus can demonstrate that it has exhausted existing enrollment capacity by implementing such approaches as flexible scheduling and year-round operation, expanding distance learning and the use of technology, increasing the capacity of existing off-campus centers, establishing new centers, and using facilities imaginatively...(Board of Trustees, California State University, 3/15/00)
Consistent with this resolution, the survey of San Diego Region enrollment demand and campus potential was conducted at the request of the Chancellor and the Presidents of the two universities to insure that the needs of the entire region were addressed.
Proiectin~ Enrollment with the Student Flow Model
The enrollment projections for this study were made using an adaptation of a student flow model developed in the CSU Chancellor's Office in the early 1990s.4 The model provides a conceptually accurate description of a university student population which, at any given time, is composed of new students who started this year plus continuing students who started at some time in the past. The input to the model is three types of new students: (1) first-time freshmen (who are recent high school ~aduates), (2) new undergraduate transfer students (most of whom originate from community colleges), and (3) new graduate and postbaccalaureate students (students with bachelors degrees who are seeking graduate degrees or teaching credentials).
4 Philip Garcia, Projections ofEnrollmen~ Denzand~ 1990-2005, CSU, Chancellor's Off~ce, Division of Analytic Studies, Long Beach, CA, 1991. In addition to projecting statewide enrollment, versions of the model have been used to project enrollment at two new CSU campuses-Monterey Bay and Channel Islands. The model has also i been used to project enrollment demand in Orange County.
May 2001 2

Enrollment Needs StudV for the San Die~o Re~ion
Once individuals enroll as students, they either continue in the following year, or stop attending (drop-out), or graduate.' For each of the three types of new students who enroll each year there is a corresponding group of continuing students. The continuation rates used in the model incorporate information about both attrition (drop-outs) and graduation based upon the experience of SDSU and CSUSM. Because the continuation rates are estimated based upon the experience of a relatively large number of students over a period of several years, the rates tend to be relatively stable and useful for projection purposes.
The population of matriculated students in any given year is composed of first-time ~eshmen who started that year, plus continuing first-time freshmen (FTF) who started the previous year, plus continuing FTF who started two years before, plus continuing FTF who started three years before and so on; plus new transfer students who started that year, plus continuing transfers who started the previous year, plus continuing transfers who started two years before and so on; plus new postbaccalaureate and graduate students (Grad/postbacc.) who started that year, plus continuing Grad/postbacc. who started the previous year and so on.
The input to the model, new students in the three categories listed, is an accurate description of the basic enrollment management issues of where new students originate and how many should be admitted in each category. Although continuing students comprise the largest component of total enrollment, because they are continuing, their number next year is essentially a given from a management perspective. The management issue then becomes, given the number of continuing students, how many new students are needed to make the institution's enrollment targets measured in FTE.
The model introduces an element of population dynamics in the enrollment projections. Changes in the size of incoming cohorts of new students will have "ripple" effects upon total enrollments over a period of several years. A campus that has been admitting larger and larger cohorts of new students, as Cal State San Marcos has since its opening in 1990, will grow rapidly, not only because of each year's additional new students but because the size of successive cohorts of continuing students is also increasing. Conversely, a campus that admits fewer and fewer students over a period years will decline not only because of fewer new students but because the cohorts of continuing students are also decreasing in size. A campus that enrolls the same number of ne~j students for several years will approach a constant steady state enrollment where cohorts of incoming and continuing students are all of constant size.
Proiectin~ Enrollment and FTE from San Diego Region at San DieF~o State and Cal State San Marcos
The student flow model was adapted to project enrollment growth at San Diego State and Cal State San Marcos as follows:
S There are two additional categories of students: (a) a student who drops-out and returns two or three years later - the relatively small numbers of these "returning students" are included in the calculation of the continuation rates used in the model and (b) a student who is matriculated elsewhere who, for various personal reasons, attends courses for one or two terms - the very small numbers of these "transitory students" are excluded from the calculation ofthe continuation rates.
May 2001 3

Enrollment Needs StudV for the San Die~o Re~g·ion
i. The model was initialized to reproduce each university's fall 1999 enrollment and 1999- 00 annual FTE. Reported enrollments of new students back to 1988 for SDSU and 1 990 for CSUSM were used as input to the model to establish the actual size of initial cohorts of new students. Continuation rates6 were adjusted so that the model replicated fall 1999 enrollment experience in terms of new and continuing students in each of the three groups (FTF, Trans, and Grad/postbacc.).
2. A baseline projection was run for each university holding all new student enrollments constant into the future at their fall 1999 levels. This baseline shows the enrollment and
FTE that would be generated if the university were to transition to a steady state where all incoming cohorts land, consequently, all continuing cohorts) were of constant size. Because the continuation rates for FTF and transfers cover a twelve year period, it takes that many years of constant new student inputs for the student population to reach a steady state.'
3. Both campuses made projections through 2010-11 of three types of new students: first- time freshmen (FTF), transfer students (Trans), and graduate/postbaccalaureate students (Grad/postbacc.).
4. For each of the three types listed in item 3, SDSU separately identified students from San Diego County, Lmperial County, and from all other (non-locai) sources. For each of the three types, CSUSM separately identified students from San Diego County, Riverside County, and all other sources.8 The San Marcos projections ofFTF assume that the campus will receive an increasing share of projected high school graduates living within a 30 minute commute of the campus. Because of prevailing traffic patterns, the area considered is a large one, stretching from Poway to the south to the county boundary to the north. The transfer student projections reflect projected growth in San Diego and Riverside community college enrollments. The introduction of new degree programs as CSUSM grows and matures may further increase its demand projections above those used here.
5. The campuses made their projections without regard to enrollment ceilings, physical capacity, or other operating constraints that would limit their ability to accommodate students. The projections are based upon information about county high school graduates and community college enrollments, campus experience, and campus expectations about the distribution of students by level and the mix of local versus non-local. The total university enrollment and FTE projected by the student flow model should be regarded as the FTE that would occur if all qualified students could be accommodated, i.e., demand projections. This is an especially important distinction for SDSU because it is close to its enrollment ceiling which may well limit its ability to accommodate additional new students at the main campus but does not necessarily limit the number of students who would want to attend.
6 The continuation rates were provided by CSU Chancellor's Office, Division of Analytic Studies. 7 It is twelve years before essentially all students in a cohort have either graduated or withdrawn from the
university. . B The projections of new student made by each university are provided in Appendix A.
May 2001 4

Enrollmenf Needs Studt, for fhe San Die~-o Re~ion
It is the joint opinion of university and chancellor' s office staff that, in total, these projections of new students from San Diego County are consistent with attendance patterns and projected high school graduates and community college enrollments from the county. Attainment of these projections should ensure that all fully eligible California high school graduates and upper division California Community College transfers who apply from the local region will be accommodated locally.
6. As input to the student flow model, the pattern of enrollment change for each set of new student proj ections was used instead of the proj ection itself. This makes the university's FTE projections additive to the baseline projection and avoids the situation of reductions in new students when the smaller county values of new students replace the values of total new students. E.g., in fall 1999, 2,619 transfers from all sources enrolled at SDSU but only 1,417 were projected from San Diego County for fall 2000. The approach used was to calculate the difference between transfers from the county 2000 and 1999 (1,417- 1,344=73) and add it to the 2,619 total transfers in 1999 to obtain the 2000 projection value of 2,692. The difference between the baseline and the transfer projection represents enrollment and FTE growth due to transfers fkom San Diego County alone. Similar projections were made for first-time freshmen and Grad/postbacc. students.
Aggregates of the FTE projections are summarized in the tables below. The baseline rows in Table 1 show the FTE each campus would generate if new student input was held constant at 1999-2000 levels. At San Diego State, the baseline projection is almost
Table I San Diego Counfy Ur2iversities Enrollment Plan ~iTE and Projecfed FTE Growthfrom San Diego County
San Die State Universi
1999-00 2005-06 2009-10
Baseline 23,672 23,625 23,613
FTE change due to baseline -47 -59 FTE change above baseline due to
growth of new students from: San Diego Co. -t2,061 +3,464 All other** +3,605 +5,632
University Enr. Plan (to 2009) 29,291 32,709
California State University, San Marcos 1999-2000 2005-06 2009-10
Baseline 4,337 4,993 5,028 FTE change due to baseline ~-656 +691
FTE change above baseline due to
growth ofnew students from: San Diego Co. +912 +1,856 All other t-1,198 -t2,353
University Enr. Plan (to 2009) 7,103 9,237
*The SDSU data exclude FTE at the Calexico campus and other sites in Imperial County. **The SDSU "all other" data assume continued limits on out-of-county enrollmerit via campus program impaction.
May 2001 5

Enrollment Needs Study for the San l)ie~o Re~pion
constant over the 11 year period, showing a very slight decline of 59 FTE. This occurs because the university's new student enrollments have fluctuated down and then up between 1988 and 1999 with a very slight negative trend during the entire period. The situation at Cal State San Marcos has been one of steady growth of new students and this is reflected in the 691 FTE baseline growth through 2010-11. Ln addition to new larger cohorts of transfers and grad/postbaccs replacing older smaller cohorts since 1990 when the campus opened, the growth also reflects the fact that San Marcos only started admitting FTF in 1995 and will not grow into a full complement ofFTF cohorts until 2006.
The rows "FTE change above baseline due to new students from San Diego County" represent the additional FTE projected by the student flow model using the new student projections (FTF+Trans+Grad/postbacc.) provided by each university. The "University Enrollment Plan" rows are the aggregate FTE projection provided by each university.g The "All other" rows are calculated as the difference between the enrollment plan values and baseline plus San Diego County FTE, e.g. "All other" at San Diego State for 2005-06 is 3,605 ]FTE (29,291-23,625- 2,061=3,605), Values in the table can be added as follows: 1999-00 FTE plus change due to baseline plus change due to San Diego County plus Change due to All other equals University Enrollment Plan.
Table 2 San Diego Coun2ty Net FTE Growth from 1999-00 at San Diego County Universities
San Diego State Universi 2005-06 2009-10
San Diego Co. FTE growth above baseline +2,061 t-3,464 Adjustment for baseline (59.55%) -28 -35 San Diego Co. net FTE growth at SDSU t-2,033 t-3,429
California State University, San Marcos San Diego Co. FTE growth above baseline +912 t-1,856 Adjustment for baseline (82.82%) -t543 t572 San Diego Co. net FTE growth at CSUSM 1,455 2,428
Total San Diego Co. net FTE growth +3,488 t-5,857 accommodated at San Diego County universities
Growth of local students accommodated at local +4,561 -t·7,658 universities**
"The SDSU data exclude FTE at the Calexico campus and other sites in Imperial County. The SDSU data also assumes continued limits on out-of-county enrollment via campus program impaction. **Based upon 0.772 annual FTE per fall enrollment at SDSU and 0.755 at CSUSM.
9 The San Diego State plan values shown exclude projections for the Calexico Cdmpus and other proposed sites in Imperial County.
May 2001 6

Enrollment Needs Stud~ for the San Die~ro Re~-ion
The baseline projections in Table 1 show the FTE each university would have if it were to approach a steady state student population based upon 1999-00 new student enrollment levels. The existing student populations include large numbers of local students. The changes due to baseline include changes in local as well as non-local students. Table 2 combines the FTE change above baseline associated with growth of new students from San Diego County with estimates of San Diego County FTE in the baseline change to obtain net local FTE at local universities.
Because the baseline growth at San Diego State is slightly negative, growth above baseline must be reduced to obtain an estimate of net growth from 1999-00. Based upon recent attendance patterns, SDSU total enrollment is 59.55 percent from San Diego County. Baseline growth (decline) was adjusted by this percentage to obtain the baseline values shown for SDSU in Table 2. At San Marcos, 82.82 percent of total enrollment is from San Diego County and its baseline growth was adjusted in a similar fashion.
The result, shown in the last panel of Table 2, is that San Diego County students at San Diego County universities are projected to grow by over 7,600 in 2009-10. These additional students will generate an additional 5,857 FTE.
May 2001 7

Enrollment Needs Study for the San Die~o Re~ion
Part 2 University Responses to the Enrollment Demand Projections: the Potential of San Diego State and Cal State San Marcos to Accommodate the Demand
SDSU Enrollment Growth PlanninR Strate~es
SDSU has proposed, and the Chancellor's Office has agreed, that SDSU will utilize three principal strategies to accommodate future enrollment growth. The first strategy will be to grow the San Diego main campus from its current academic year enrollment of 24,620 FTE to 27,600 in 2009-10. This strategy will require approval by the CSU Board of Trustees to increase the main campus enrollment ceiling from 25,000 to 27,609. It is also contingent on funding to construct two additional academic buildings. The second strategy relates to an expansion of year- round operation in order to lessen the time to graduation, thereby freeing up enrollment places during the academic year. In particular, summer term enrollment is projected to increase from 352 FTE (annualized) in 2000 to 2,100 FTE (annualized) in summer of 2009. This strategy is contingent on increased student participation rates in summer term. The third strategy, which is a focus of this report, is the utilization of off-campus centers. This planning strategy projects a growth of San Diego County off-campus centers from 187 FTE in 2000-01 to 3,000 FTE in 2009-10. This strategy is contingent on SDSU obtaining lease funds, beyond marginal g-rowth enrollment funding, for these off-campus sites.
The planning strategies are illustrated in Chart I. Additional information about the use of off- campus centers to accommodate offsite enrollment is provided in Part 4.
Chart I
San Diego State University: FTE Enrollment Plan vs. Demand
36,000 --tfl-- Enrollment Demand 35.075
* - Main campus AY only 34,000
-Q- Main campus AY+ Summer+Offsite .~·709 32,000 ------Main campus enrollment ceiling
g·- ...--···
30,000 ..··- w -· ..-~3-
t: 28,000
24.600 ~--*--------.*~~ ---- *
~.. .~·-*·-- --- .~0- 27,609 26,000
-··- 000
24,000
23,685
22,000
2000- 2001- 2002- 2003- 2004- 2005- 2006- 2007- 2008- 2009-
2001 2002 2003 2004 2005 2006 2007 2008 2009 2010
Note: Reported 2000-01 FTE are shown. All data exclude FTE at the Calexico campus and other sites in Imperiat County. In addition, the SDSU planning data assume continued limits on out-of- county students via campus program impaction.
May 200/ s

Enrollment Needs Sfudy for t~e San Die~o Re~ion
CSUSM Enrollment Growth PlanninR StrateRies
The expeditious build-out of the Cal State San Marcos campus is the logical way for this newer university to accommodate the strong enrollment growth from the region projected in Part 1, above.'" Doing so has the added advantage that the increased classroom capacity and on-campus housing can accommodate the increasing numbers of high school graduates from both San Diego and southwest Riverside counties. In the long term, rapid build-out of the San Marcos campus also provides one of the most cost-effective means of relieving current enrollment pressures at the main SDSU campus. CSUSM has an off-campus center in southwest Riverside County that is further discussed in Part 4.
Chart II illustrates the FTE planning projections. The projections represent enrollment demand which the university plans to accommodate assuming adequate facilities and funding are provided. Because the university has substantial expansion potential before reaching its enrollment ceiling, its focus is primarily upon developing programs and facilities at its main campus.
Chart ~I
CSU San Marcos: FTE Enrollment Plan vs. Demand
25,000
-D- Enrollment Demand
20,000 -~- Main campus AY only
-Q-- Summertoffsite
Campus enrollment ceiling 15,000
10,000
5,000
2000- 2001- 2002- 2003- 2004- 2005- 2006- 2007- 2008- 2009-
2001 2002 2003 2004 2005 2006 2007 2008 2009 2010
'O Construction of on-campus housing, a requirement for non-local FTF, is well underway. Apartment space for 460 students will be completed by Fall 2003; this capacity may double by 2005.
May 2001 g

Enrollmeni Needs StudV for the San_ Die~o Re~gion
Part 3 Regional Considerations of Student Access
Prior to 1990, San Diego Cdunty residents who wished to attend a local CSU campus had but one choice, San Diego State University. By the early 1970s enrollment growth had brought San Diego State to its original enrollment ceiling of 20,000 FTE and the ceiling was revised upward to 25,000 FTE. By the early 1980s the campus was approaching its new 25,000 ceiling. Ln response to both the enrollment restrictions imposed by the ceiling and to increasing local demand in the northwestern part of the county, San Diego State started the North County Center in the city of Vista in 1979. In 1982 the center was moved to a shopping center in the city of San Marcos. Growth of the North County Center was instrumental in establishing the need for a new campus in San Diego County. In 1990 the new campus, California State University, San Marcos, commenced operation admitting its first cohorts of new students. Since then the new university has shown a vigorous growth pattern, it currently enrolls over 6,000 students.
The major rationale for the new university was to improve access for local students including: (i) those who reside in the northern part of San Diego County, (ii) those who reside in the southwestern part of Riverside County along the I-15 corridor, (iii) those who reside between Cal State San Marcos and San Diego State who now have the choice of attending either of the two campuses, and, finally, (iv) to the extent the North County students, the southwest Riverside students, and the "in-between" students choose San Marcos instead of San Diego State, spaces are freed up at San Diego State for admission of other local students who reside adjacent to San Diego State (especially to the south and east) and for whom San Marcos is not a viable alternative.
The preference of students for a university is influenced by factors other than proximity and commute times. The number of degree programs with established reputations is another important consideration. Thus, as time passes and Cal State San Marcos continues to grow and add programs, its share of the growing local market is likely to increase even as total enrollments at San Diego State are also increasing.
Regional Proiections: population, iobs and community college enrollment las a guide to identifying areas with expanding demand for CSU access)
Population
San Diego County added approximately 400,000 individuals between 1990 and 2000 to bring its population to 2.9 million. Similar growth is projected to prevail to 2b10 and 2020 when the population will reach 3.4 and 3.9 million respectively (California Department ofFinance, 1998). The San Diego Association of Governments (SANDAG) projects similar growth for the entire county and also projects population, housing units, and employment for regions within the county." SANDAG's population projections to 2020 for the major statistical areas of the county are shown in Chart III-A.
The western half of San Diego County contains over 99.2 percent of the population, East County (including Palomar-Julian and Anza-Borrego Springs) contains the other 0.8 percent. The
" SANDAG, 2020 Cities/County Forecast, September, 1999
May 2001 10

Enrollment Needs Sfurly for the San Die~o Re~ion
northwestern quadrant (the northern half of the western half) is designated North County in the charts below tit includes the communities of Carlsbad, Fallbrook, Escondido, San Marcos, Oceanside, and Vista'2), the southwest quadrant of the county contains the remaining four regions, Central City (including the central part of the City of San Diego and National City), North City (including Kearny Mesa, Del Mar-Mira Mesa, Miramar, North San Diego, and Poway), South Suburban (including Chula Vista and South Bay), and East Suburban (including El Cajon, Lemon G·rove, Ramona, Spring Valley, and Santee). Map 1 shows the western part of San Diego County (including the major statistical areas) and the southwestern part of Riverside County as well as the locations of the two CSU campuses and the community college campuses in San Diego County (more detailed maps with the SANDAG regions, cities, and place names are included in Appendix B.)
By 2010, North County will have a population of almost 900,000, North City will have a population of over 825,000, South Suburban will have population of almost 435,000, the four statistical areas that comprise the City of San Diego and its adjacent communities will total over 2.5 million individuals.
Chart III-A
San Diego County Population Projections by Major Statistical Area
1,000,000
900,000
800,000
700,000
600,000
500,000
400,000
300,000
200,000
100,000
1995 2000 2005 2010 2015 2020
Source: SANDAG, 2020 Cities/County Forecast, 10/99
~i~ North Co. ~ North City ~B Central City ~ East Suburb h~i~ So. Suburb a~l East Co.
Southwest Riverside County includes a large unincorporated area and the cities of Temecula, Murrieta, Hemet, Penis, Lake Elsinore, and San Jacinto. This region of the county grew by
'Z SANDAG actually projects two separate regions, North County West and North County East, which are combined as 'T\Jorth County" for present purposes.
May 2001 11

Enrollment Needs Study for the San Die~o Re~eiorz
approximately 200,000 individuals between 1990 and 2000. The Southern California Association of Governments (SCAG) projects the population will reach 885,000 in 2010 and almost 1.2 million in 2020, The population projection made by SCAG is shown in Chart III-B,
~Map I San Diego and Southwest RivePside Counties
.i · ulinl· `· .I
(,,,,
if'`'-·· ~i~i~i~~- Si;
·i I
"1· i-ZS";"' (NORTH COUNP/ _,Miatoste
i
Califom_~S~S~ateVnive,sity .,~~ ·-~··,
5
P -·· r'-~ I ·i Mi.ma/ NORTH I : ::'-: :- Tr,4i.r WPI EBST Oi
SUBURBAN j I ,'
~~ ~n-n.- S~n Diogo r-r-
~-::~:II:-:::::~~ i~' --·i-; E~U~y~C~·C· \" ~i~
-:-.::: cnu·· ii'vr
~b,m~e~L~ a DtayMEu
~t-~g_
~ CSUCEtmpus ~ Militair Bases ~ Existing HigherEd Center I ~g San Diego Major Statistical Areas ·~8~· ~t Community Colle;ge to 20 Miles I Potential HigllerEdCenter -- --~-
Ccnla for Dcmognphic R~scJrch CSUFulls~orq MayMO1
May 2001 12

EnrolEment Needs Study for the San Die~o Re~ion
Charr ~II-B
Southwest Riverside County Population Projections
1,200,000
1,000,000
800,000
600,000
400,000
200,000
1995 2000 2005 2010 2015 2020
Source: SCAG
Chart TV shows the growth patterns (from 1995) of the five largest areas in San Diego County through 2020. North County adds the most population, 220,000 by 2010. During this same period North City will add 200,000 and South Suburban over 150,000. Growth through 2020 shows the same pattern with North County adding over 300,000 and North City and South Suburban adding approximately 250,000 each. Southwest Riverside County is also projected to show substantial growth adding more than 500,000 people between 1995-2020.
Chart IV
San Diego Region Changes in Populations of Six Major Statistical Areas
600,000 (E91995-2010 B 1995-2020 1 fiI11995-2010 ~1995-2020
500,000
400,000
300,000
200,000
100,000
NorthCo. NorthCity Central East South S.W.
(SD) (SD) City (SD) Suburb Suburb Riverside
(SD) (SD) Co.
May 2001 13

Enrollment Needs Study for the San Die~o Renion
Employment
Projections of San Diego County employment made by SANDAG show an increase of35.7 percent in jobs between 1995 and 2010 and an increase in 50.0 percent for the period 195-2020. According to the California Employment Development Department ~EDD), the county currently has approximately 1.3 million people employed. One indication of the dynamic nature of the economy is that the county's unemployment rate is only 3.1 percent compared to the state's rate of5.2 percent. The description provided by EDD in the "County Snapshot" section of their website is that "San Diego is a growing thriving county." In addition to the large sectors of the economy represented by Services, Trade, and Government, the county also has had a relatively large sector related to defense industries which are transitioning into the so-called high-tech industries. In 2000 the American Electronics Association ranked San Diego County 21st among 50 high-tech regions in the country."
Chart V-A shows SANDAG's regional projections of employment. The North City region is clearly the largest in the county. By 2005, North County is proj ected to surpass the Central City region in terms of employment but the Central City region's employment will still be almost as large as that of the East and South Suburban areas combined by 2020.
Chart V-A
San Diego County Employment Projections by Major Statistical Area
500,000
400,000
300,000
200,000
100,000
1995 2000 2005 2010 2015 2020
Source: SANDAG, Cities/County Forecast 2020, 10/99
B North Co. · North City ~a central city ~ East Suburb B So. Suburb BIIEast Co.
13 Reported in the Orange County Register, 12/5/00. The high-tech sector includes electronic components, consumer-electronics and defense electronics.
May 2001 14

Enrollment Needs StudV for the San Die~o Re~ion
Chart V-B shows employment projections for southwest Riverside County made by the Western Riverside Council of Governments. This is another very dynamic region of the state with much of the employment growth projected in unincorporated parts of the county along the 1-15 corridor.
Chart F/-B
Southwest Riverside County Employment Projections
350,000
300,000
250,000
200,000
150,000
100,000
50,000
1995 2000 2005 2010 2015 2020
Source: Western Riverside Council ofGovemments
Chart V7
San Diego Region Changes in Employment in Six Major Statistical Areas
250,000
200,000
150,000
100,000
50,000
North Co NorthCity CentralCity EastSuburb So.Suburb S.\;V. (SD) (SD) (SD) (SD) (SD) Riverside
Co.
~1995-2010 Iii~ 1995-2020
May 2001 15

Enrollment Needs Study for the San Die~o Re~ion
In terms of employment growth in San Diego County, as shown in Chart VI, North County is the leader, adding almost 176,000 jobs in the 1995-2020 period, North City adds over 160,000 jobs, the East Suburban area adds over 90,000. Employment growth in Southwest Riverside County will also be substantial with 94,000 new jobs between 1995-2010 and 192,000 projected during the 1995-2020 period.
Community CoFlege Enrollments
San Diego County has five community college districts enrolling a total of approximately 168,000 students in 2000. In that same year, another 9,800 students were enrolled at Mount San Jacinto Community College in Riverside County. ProJected enrollments Tor each district are shown in Chart VII.
The districts in San Diego County more-or-less coincide with the Major Statistical Areas used in the previous charts. The Palomar district with a campus in San Marcos and the Mira Costa district with a campus in Oceanside are both in the North County area. The San Diego Community College District has three campuses, City College, Miramar College, and Mesa College, in the North and Central City areas; the Grossmont/Cuyamaca District has two campuses in El Cajon in the East Suburban area; and the Southwestern District has a campus in Chula Vista in the South Suburban area.
Clzart VII
Community College District Enrollments Projected through 2015 (Source: CCC Chancellor's Office)
B 2000
120,000 12005
100,000 12010
80,000 82015 60,000
40,000
20,000
o~\ c~,·~\ o \cc` c~
d·6' g 4 O 14~· ,a Po'
~P· ds~r ~ d g C` ~e~O;
,?~;P
May 2001 16

Enrollment Needs StudV for the San Die~po Re~gion -
Areas of the Region Where Demand for Access Is Likely to Increase
The region is projected to undergo substantial population growth. San Diego County will add about 500,000 individuals in the 2000-2010 period and another 500,000 between 2010-2020. During these same two periods, southwest Riverside County will add over 200,000 and 290,000 individuals respectively. The areas in San Diego County that will show the most growth 2000- 2020 are North County (t-300,000), North City, and South Suburb (both t-250,000).
In terms of employment, North City accounts for the largest number of jobs (450,000 currently) of any of the areas. Employment growth through 2020 will be largest in North County (+190,000) followed by North City (1-1~5,000), southwest Riverside County (+150,000), and East Suburban (+93,000).
The largest community college enrollments are in the San Diego Community College District which has campuses in the Central City and North City areas. Growth of enrollment 2000-2015 in the San Diego District will be approximately 26,000 students. During this same period growth of enrollments in the Palomar and Mira Costa districts, both of which are in North County, will be 18,000 students combined. The other three districts, Mount San Jacinto tin Riverside County), Grossmont/Cuyamaca (East Suburban) and Southwestern (South Suburban) will each add approximately 7,500 students.
May 2001 17

Enrollment Needs Study for the San Die~o Re~ion
Part 4 Efforts in offering courses/programs at off-campus sites
San Diego State University
San Diego State University has focused its off-campus efforts in three areas: South County/National City, South County/Otay Mesa, and Morth City/Miramar. The National City site is a partnership with Southwestern Community College and is currently up and running with approximately 200 annualized FTE. The proposed South County/Otay Mesa site is also a partnership with Southwestern Community College and is in the planning stage. The North City/Miramar site is a partnership with Miramar Community College located at the college and is tentatively scheduled to open in Fall 2001. While focusing its principal off-campus site efforts on the three aforementioned areas, SDSU has begun an evaluation of an off-campus site in the East Suburban area and plans to continue that evaluation process.
Sou2h County/National City
The Higher Education Center (HEC) in National City is a collaborative between SDSU and Southwestern College where courses from both institutions are offered at one site. The HEC is also within a mile of Naval Station San Diego, a base that contains over 50,000 Naval and civilian personnel. Enrollment figures at the HEC continue to surpass expectations.
Southwestern College offerings at the Center include broad-based general education curriculum. San Diego State University is offering upper division general education courses, a mix of upper division program courses, and graduate classes. Current undergraduate course offerings include: business administration, Chicana/Chicano studies, criminaljustice, general education, liberal studies, and psychology. Graduate courses are offered in educational administration and teacher education. The rapid enrollment growth of this site (SDSU is currently offering 40 classes spring semester, 2001) has prompted both partners to begin discussing with National City the construction of a significantly larger building across the street from the existing structure. With additional leased space, if lease funds are provided, SDSU would be able to offer a significantly increased selection of undergraduate courses. Reported and projected enrollment at the National City Center' are shown in Table 3.
Distance education is envisioned to be important to the future growth of this site. The existing National City facility supports the traditional faculty member and students being present in a common location with full media support. Future building plans include (1) the addition of compressed video television that would make it possible to broadcast classes being taught on- campus to students at the new Center, and (2) computer laboratory facilities dedicated to student access to distance education classes.
May 2001 18

Enrollment Needs Stud~ for the San Die~o Re~ion
Table 3 Reported and Projected Instruction at the SDSUNational City Center
Reported Reported Reported Reported Proiected Proiected Semester SD. '49 SD. '00 SP. '01 Fa11'99 S 00 Fall '00 S 01 Fall'Ol
Enrollment 287 519 660 881 1,200 1,800
Average class size 29 31 30 29 30 30
Number of classes 10 17 22 34 40 60
FTE 57.4 103.8 132.0 177.0 240.0 360.0
Miramar Higher Education Center
In October 2000, SDSU initiated a series of discussions exploring the feasibility of a cooperative venh~e with Miramar Community College that has led to a signed MOU establishing the Miramar Higher Education Center (MHEC) at Miramar Community College. SDSU plans to offer academic courses in impacted majors at MHEC when unmet enrollment demand on the main campus dictates the need for additional course sections. Initial plans call for SDSU to offer five upper division courses at MHEC in Fall 2001. Future planning for the MHEC allows for numerous possibilities including adding California State University, San Marcos as a formal partner in the MHEC should San Marcos wish to select that option.
Several meetings were held between faculty and administrators of the two institutions. General goals and the educational mission of the proposed Higher Education Center have been established as well as how to create an intellectual and physical environment that would promote academic programs and maximize educational opportunities consistent with individual and community interests and needs.
As a result of these meetings, and campus discussions, SDSU has concluded that there were numerous benefits to the Miramar Higher Education Center including:
· sustaining SDSU's commitment to access with slower anticipated growth on the main campus; · improved access to fast growing populations in the north; · greater flexibility in responding to business needs in the region; · enhancement of SDSU's ability to build public/private collaborations and focus on biotechnical
and high tech industries in the area;
· enhanced cooperative relationships with K-12 and community colleges; · f~icilitation of experimental/alternative teaching/research methods, which might include small-
scale experimental programs, collaboration with industries/businesses, new technologies; · enhanced availability of small-scale experimental programs, not feasible on the larger campus;
and
· opportunities for funded research projects.
May 2001 19

Enrol~ment Needs Study for the San Die~g·o Re~ion
Distance education is envisioned to be important to the fUture growth of this site. The existing college facility supports (1) the traditional faculty member and students being present in a common location with fullmedia support and (2) computer laboratory facilities dedicated to student access to distance education classes. Future building plans include the addition of closed circuit television that would make possible the broadcasting of classes being taught on-campus to students at the new Center.
What is perhaps most notable and encouraging about SDSU efforts is the enthusiasm and commitment of the community college partner. They clearly see this endeavor as enhancing their own delivery of education, expanding their transfer rates, and improving the quality of life for their students and faculty. We anticipate mutual benefits from this partnership.
South Suburban/Otay Mesa I~igher Education Center
In spring 1997, President Stephen Weber met with City of Chula Vista officials to explore the establishment of a Higher Education Center in south San Diego County. Also present at that initial meeting were Southwestern College officials and a University of California, San Diego representative, although it was made clear from the outset that UCSD would only bring extension courses to the Center. Additional meetings followed including meetings with National City officials. In Fall 1998, rental space was secured for a Higher Education Center in National City and SDSU and Southwestern College began offering courses at that site in Spring 1999 (see additional material on National City below).
Also in Fall 1998, a formal collaborative was established among SDSU, Southwestern College and the Sweetwater-Union School District which was named Project Synergy. The purpose of the collaborative was to secure fi~nding for acquisition of land and construction of buildings at the border in Otay Mesa for a second Higher Education Center. It was hoped that the Higher Education Center could be located in reasonably close proximity to Sweetwater-Union District's soon to be constructed High Tech High.
Subsequently, Southwestern College hired architects and other consultants to determine appropriate sites at Otay Mesa. Four sites were scrutinized by Southwestern College officials as possible acquisition targets, with SDSU input sought on the feasibility of each. The initial preferred site, located adjacent to the soon to be constructed High Tech High school, was ultimately rejected due to limited land use and extraordinary costs related to construction of sewage lines.
In November 2000, Southwestern College's bond issue was passed with $25.7 million targeted for an Otay Mesa site. Currently, an offer has been made for a suitable site on Otay Mesa not too far from the High Tech High site. It has now been determined that Southwestern College will purchase the Otay Mesa site and construct the buildings for the Higher Education Center. SDSU will lease space, as funds are provided, at that site.
Based upon a series of meetings between representatives of Southwestern College and SDSU, it has been proposed that the following interdisciplinary curricular areas be identified for implementation at the Otay Mesa site, emphasizing the unique opportunities of a center located
May 2001 20

Enrollment Needs Study for tlze Son Dieno Re~eion
near the international border. Students would be able to receive bachelor's and master's degrees from SDSU, as well as A.A. degrees and certificates from Southwestern College.
Computer Science/Technology (Computer Engineering, Lnformation Systems, Mathematics and Computer Science, Graphic Design) Joint programs dealing with computer science and engineering would be of great benefit to the region, since companies across the nation face an ever-increasing shortage of workers in information management and computer-related technology.
Border Issues (Psychology, Sociology, Political Science, Geography, Chicana and Chicano Studies) The San Diego/Tijuana region represents a unique environment to explore the varying perspectives on international and global issues, including political institutions, women's studies, transcultural ethical issues, health care delivery, children's rights, ecology, and so on.
Teacher Education (Education, Child Development) A transborder university could foster the development of innovative community-based teacher education programs that emphasize the bilinguaymulticultural aspects of the students in the region. The core curriculum will reflect, at once, the current global perspective and multicultural setting of education in general and of the Otay Mesa region, specifically.
Business Administration (International Business, Accounting) As the Tijuana/San Diego border booms, the greatest area that has attracted interest has been the development of businesses, leading to a demand for relevant academic programs. Emphasis will be given to those areas of business that are suited for the region, including international business issues, maquiladora management, labor law and history, entrepreneurship, environmental and public health issues, and start-up costs for small businesses.
Criminal Justice/Social Service (Criminal Justice, Social Work) The binational region has a mandate to control the flow of illegal substances and undocumented persons, requiring innovative research programs that address the challenges of law enforcement in a binational region. Areas of study might include social justice and equity issues, as well as research into the provision of social services needed for crime prevention, not just enforcement. The area can also study the history, economy, politics, and culture of the border region that leads to migration back and forth across the border.
California State University, San Marcos
CSUSM is primarily focused upon expanding its on-site facilities and programs to accommodate its projected enrollment growth. The university recognizes a need, however to provide outreach to certain student groups in southwest Riverside County.
Southwest Riverside County Higher Education Center
During the late 199Qs, community and business leaders in the Temecula area, who were increasingly concerned about the dearth of higher education opportunities in their rapidly
May 2001 21

Enrollment Needs Study for the San Die~po Re~ion
growing region initiated discussions with top administrators at Cal State San Marcos. At about the same time, CSUSM's College of Education entered into an agreement with three school districts in the southwest Riverside area, Temecula Valley, Murrieta, and Lake Elsinore; and two in the northwestern part of San Diego County, Fallbrook and Bonsall. The I-15 Consortium, as it is called, came into being in 1998-99 largely because the participating school districts were so pleased with the CSUSM graduates they had been hiring. The districts provide classrooms in which multiple subject credential students complete internships and leased space for the College of Education to offer its credential courses to cohorts of local students. The College also offers pre-requisite courses for its credential program and clear credential courses for teachers currently employed in the region.
CSUSM's College of Arts & Sciences (CoAS) first offered upper division courses in the region in spring 2000 to fill a gap between the lower division courses Mount San Jacinto College O~ISJC) has been offering in the Southwest Riverside County area since the early 1990s and the coursework required by the CSUSM credential program. Based upon student response, in fall 2000 the CoAS began offering courses for the Liberal Studies major in facilities leased from the Temecula Valley School District and MSJC. Currently, a cohort of approximately 25 students is enrolled in the degree program. Current and projected enrollments at the Southwest Riverside Center are shown in Table 4.
Table 4 Enrollment, Courses, and I;TE at the Southwest Riverside County Center"
1999-00 2000-01 2001-02 2002-03 Fall Fall S Fall S SDrinn S~rin~ S~rinn Fall S~rinn
Enrollment 72 110 194 281 380 420 560 640
No. of courses 4 6 13 15 19 20 33 37
FTE 17.3 22.0 44.5 56.2 76 84 112 128
* The enrollment figures for the 1999-2001 period include a small number of students enrolled through Extended Studies and Open University.
The university has developed a number of curricular emphases at the Southwest Riverside Center that are particularly appropriate for this rapidly expanding region. These emphases were developed with the aid of a 1998 survey of area residents and conversations with a range of local leaders. Several of the programs listed below are up and running; in fact, the first Southwest Riverside Center cohort is graduating this spring. All other program Piscussed should be fully operational within five years time. Students attending the Southwest Riverside Center will be able to receive bachelor's and master's degrees from CSUSM, as well as AA degrees and certificates from Mount San Jacinto College.
May 2001 22

Enrollment Needs Siudv for the San Die~o Re~gion
Teacher Education (Multiple Subject Credential with CLAD or Special Education Emphasis and Administrative Emphasis) Zn recent years, rapid population growth and a state- mandated reduction in class size have combined to create a number of challenges for schools in southwest Riverside County: a shortage of elementary teachers trained to teach an increasingly diverse student body, a growing need for special education specialists, and a shortage of administrators able to deal with newly constructed and growing schools. CSUSM is developing programs designed to respond to each of these challenges. A Multiple Subject Credential Program with a CLAD Emphasis was initiated in fall 1999 and a Substantive Change Proposal was approved by WASC shortly thereafter. A Multiple Subject Credential Program with a Special Education Emphasis will enroll its first cohort of students in fall 2001. At the same time, an MA program focusing on school administration will begin operation.
Liberal Studies Given the growing shortage of teachers in the southwest Riverside County area, CSUSM, in partnership with Mount San Jacinto College, began offering an undergraduate degree program in Liberal Studies this fall. This program is both a natural outgrowth of, and integral to, the teacher preparation programs described above.
Business Administration The 1998 survey of area residents revealed considerable interest in business programs. In addition, employment expansion in the southwest Riverside area during the next 10 years is likely to create an increasing need for people armed with sophisticated business skills. In response, the College of Business Administration at CSUSM is preparing to offer several of its degree programs at the Southwest Riverside Center within the next two to three years.
In addition to the I-15 Coalition partnership discussed above, CSUSM has collaborated extensively with MSJC. The College moved to its site in Menifee in 1990 and into the Temecula Valley in 1997. In four short years, enrollment at the Temecula Valley site has grown from 300 to 1,600 students. The partnership that has evolved between MSJC and CSUSM since 1998 is multi-faceted; it encompasses shared facilities, shared faculty and staff, contractual agreements for students in the transfer process, collaboration on curriculum development, and joint grant proposals.
The two institutions currently share administrative space on the Chaparral High School campus in Temecula. The partners are negotiating with the City of Murrieta for more permanent space, including classroom facilities. Munieta is in the process of designing a new town square and wants to include a proposed Center for Higher Education. The architectural design for the center includes approximately 35,000 square feet (with room to grow); the plans call for a videoconferencing room with complete state-of-the art technology. Murrieta would like to lease some or all of the Center space to MSJC, CSUSM, and/or UC Riverside. The facility is expected to be ready for occupancy late in 2002.
MSJC and CSUSM have developed a special program called Transfer Pathways (TP), a guaranteed admission program for students who enter into a contractual arrangement during their tenure at MSJC. Upon satisfactory completion of the MSIC portion of the program, students automatically enter CSUSM's Liberal Studies bachelor's degree program. As participants in the
May 2001 - 23

Enrollment Needs StudV for the San Dieno Renion ·
TP program, students have complete access to library and other services at both institutions. The two institutions expect to formalize an agreement for Transfer Pathways by the end of the Spring 2001 term.
In addition to developing a streamlined transfer program, CSUSM and MSJC have focused on making technology and distance education an essential component of the southwest Riverside County Center. The current facilities include computer workstations for email, Intemet, and library access, as well as for word processing, printing, and placement testing functions. Plans for the new Munieta facility envision on-site technical support and transmission of classes ~-om the main campus in San Marcos.
i
May 2001 24

Enrollment Needs Study for fhe San Die~o Re~ion
Part 5 Description of outreach efforts at SDSU and CSUSM to recruit students
Both SDSU and CSUSM have both made long term commitments to diversifying their student populations and providing outreach to K-12· schools and the region's community colleges. This section briefly reviews the most important of these efforts.
San Diego State's Outreach Efforts in K-12 Schools
SDSU's outreach and student academic preparation programs serve 382 K-12 schools. Ln addition, SDSU provides outreach to community colleges throughout California, with a particular focus on each of the 9 San Diego County and Imperial County Community Colleges. Currently 105 faculty members and 106 SDSU staff members work in various outreach programs. Funding support for these programs is provided from the General Fund, Lottery Fund, grants, and donations. The total amount expended in 1999-00 in support of these outreach programs was $6,048,455. Ongoing outreach efforts at SDSU include:
City Heights Educational Pilot City Heights, an inner-city community located one mile south of the SDSU campus, faces many social challenges, including poverty, crime, limited English proficiency, student transience, overcrowded schools, and low college attendance. To begin to address these issues, a partnership was founded in 1998 among Price Charities, San Diego State University, the San Diego Unified School District, and the San Diego Education Association undenvritten by a six year, $18 million grant from Price Charities. The City Heights Educational Pilot serves three public schools in the City Heights community: Rosa Parks Elementary, Monroe Clark Middle School, and Hoover High School. 5,000 students are potentially involved in pilot programs.
The main purpose of the pilot is to focus University-wide resources to significantly improve K- 12 student academic achievement and provide historically underrepresented students with access to college. The pilot serves as an umbrella for approximately 50 unique programs. Numerous innovative strategies target diverse academic and non-academic issues, such as curriculum design and integration, teacher and parent education, classroom technology, cross-age mentoring/tutoring, community service, recreation, health and human services, and college preparation.
SDSU's contribution to the Pilot in 1998-99 and 1999-2000 included: participation by 103 SDSU faculty from 40 departments across 47 different City Heights Educational Pilot programs; more than 50,000 student hours of course work, fieldwork and research; and more than 10,000 faculty and staff hours devoted to curriculum and program design, implementation, and teaching.
Compactfor Success The Sweetwater Union High School District, California's largest secondary district, consists of 25 schools located between San Diego's urban core and the international border with Mexico. More than 34,000 students are enrolled in 21 middle and high schools.
A partnership between Sweetwater Union High School District and San Diego State University, titled Compact for Success, was created in March 2000. The Compact ensures a pathway to
May 2001 25
Enrollmeni Needs Stud~ for the San Die~o Re~ion
admission to SDSU, with fees undennitten by the project's corporate partner, the Ellis Foundation. The specific objective of the program is to create a mindset among middle school students that a college education is an attainable goal. The pilot program helps students to work through obstacles that may prevent them from attending college and prepares them for the academic rigor of college. The initial goal of the pilot program is to reach all 5,400 incoming fall 2000 7" graders.
As part of the Compact, Sweetwater is developing benchmarks and providing incoming 7" graders with a rigorous program of study and support that will help them meet SDSU's entrance requirements. SDSU is providing guaranteed admission to SDSU for all current 7" graders, and future 7'" graders thereafter, who complete the rigorous SDSU/Sweetvater identified college preparatory program in grades 7-12 and who pass the required CSU placement exams.
SDSU is also conducting numerous outreach activities to help students who fall behind to improve and meet the requirements. SDSU students tutor middle school students, SDSU faculty members work with teachers on multiple_curriculum development projects,-and SDSU has developed student and parent orientation and visitation programs for pre-collegiate advising.
Pre-College Institute The SDSU Pre-College Institute promotes educational advancement among low-income, culturally diverse pre-college students. The Institute also provides field placement for pre-student teachers to train in culturally diverse settings and program evaluation services ranging from quantitative research to case study development. The Institute is a collaborative effort between federally funded programs and teacher training initiatives.
SDSU Classic Upward Bound (started September 1983; fi~nded by the U.S. Department of Education, Office ofPost-Secondary Education): Six-week summer residential (at SDSU) and academic year programs for ethnically diverse and economically challenged high school students to provide assistance with learning/study skill development, college and financial application, and general college and career preparation.
SDSU Upward Bound Math/Science Regional Center (started October 1990; funded by the U.S. Department of Education, Office of Post-Secondary Education): Intensive summer and academic year programs to begin exposing 11" and 12" grade students to science workshops, career exploration, and research.
SDSU Upward Bound for Limited English Speakers (started September 1999; funded by the U.S. Department of Education, Office of Post-Secondary Education): Summer residential and academic year programs for ethnically diverse, economically challenged limited English- speaking students to provide assistance with learning/Study skill.development, college and financial application, and general college and career preparation.
Educational Opportunity Center_(started September 1994; fUnded by WAHUPA, EOC, and the Pre-College Lnstitute): A center serving low-income, first generation potential college-bound, underrepresented adults in San Diego County to provide activities, information, and advising on financial aid, college admission, career options, and academic assistance.
May 2001 26

Enrollment Needs Study for the San Die~o Re~ion
SDSU Talent Student Literacy Project (started September 1992; funded by the U.S. Department ofEducation, Office ofPost-Secondary Education and Talent Search): Forty college-going volunteers spend four hours per week working with low-income middle and high school students. They provide assistance in reading comprehension and student motivation.
SDSU Talent Search High School for College Access_(started September 1991; funded by the U.S. Department of Education, Office of Post-Secondary Education and SDSU Talent Search): College-aged students are recruited and trained to work with low-income Ilth and 12'h grade students. They provide academic counseling, career and college options, assistance in the college application process, and infonuation on financial aid and scholarships.
SDSU Talent Search Explorers (started September 1991; funded by the U.S. Department of Education, Office of Post-Secondary Education and Talent Search): College-going volunteers mentor 7'h, 8th,,d g" grade students. Volunteers focus on academic achievement and motivation, team-building exercises, and academic and cultural events.
SDSU Regional Summer Science Enrichment Program_(started February 1998; funded by the National Cancer Institute): Assists ethnically diverse rising 10'h grade students in developingresearch skills in math, science, literacy, and computers.
TRIO Dissemination Partnership Program (started September 2000; funded by the U.S. Department ofEducation): 200 low-income, first generation 6"-8'" grade students at three public middle schools in El Centro are provided with in-depth tutoring by 60 college-going tutor/mentors. Mentor/tutors are trained by college faculty and middle school teachers using a service learning model developed by the Talent Search Literacy Program.
GEAR UP to City Heights_(started September 1999; funded by the U.S. Department of Education, Office of Post-Secondary Education with matching private funds by Price Charities in support the City Heights Educational Pilot): Low-income, potential first generation college bound 7'" grade students and adults/parents in the City Heights area are provided with mentoring, tutoring, extended day programs, academic enrichment classes, career awareness training, financial advising, field trips, study skills development, and more.
O~f~ce of College Readiness Programs, Precollegiate Academic Development CSU-High School Collaborative Academic Preparation Initiatives The Office of College Readiness Programs (CRIP) establishes collaborative efforts with local school districts to increase student achievement in mathematics, reading and writing as part ofa coordinated effort ensuring middle school and high school students are prepared to enter the CSU and SDSU. Many of the school districts are in disadvantaged communities throughout San Diego County.
CRP provides the following services: · Middle and high school math, reading and writing tutoring · SAT I test preparation seminars · K-12 teacher training and development conferences
May 2001 27

Enrollment Needs StuaS for the San Die~po Re~ion
Special student and parent academic preparation workshops and summer programs, such as Algebra Academies and AVID Summer Bridge
Two programs, the Precollegiate Academic Development (PAD) program and the CSU-High School Collaborative Academic Preparation Znitiatives (CAPI), serve as means of outreach for K-12 students.
The PAD program began in 1997. In 1999-2000, 45 SDSU student interns served 4,200 7'"- &'h grade students among 20 schools. In addition, six SDSU faculty members, one staff member, and 140 K-12 teachers participated in the program. The program, funded through the SDSU general fund, had a budget of $262,962 in 1999-2000.
CAPI began in 1999. ~n 1999-2000, the program served 4,000 9'h_12'h grade students among 10 high schools. Program participants included 110 SDSU student interns, 21 SDSU faculty members, 4 SDSU staff members, and 80 K-12 teachers. CAPI is also funded through the SDSU general fund and had a budget $741,599 in 1999-2000.
Cal State San Marcos Outreach Efforts in K-12 Schools
The Cal State San Marcos developmental and recruitment outreach programs are focused primarily on San Diego region elementary schools, middle schools, high schools, and the nine San Diego County and Imperial County community colleges. Developmental programming promotes the value and access of higher education and is provided through parent education, community collaboration, student tutoring, and faculty involvement. Recruitment outreach focuses on assisting potential students to gain an understanding of what CSUSM has to offer and on helping them with the process of admission to the University.
Brothers and Sisters Gonna ~ork ~t Out (BSGW;rO) Each year, on two Fridays in March, beginning students at nine area high schools with large populations ofunderrepresented students are invited to CSUSM to participate in workshops designed to motivate them to go to college. Two years later, during their junior year, they return to campus to participate in classes for a day. BSGWIO attracts over four hundred young men and women participants annually. In mid-June 2001,it will be among thirteen particularly valuable community programs recognized by The San Diego Union Tribune and the San Diego Padres.
Freshmanfor a Day (FFAD) This program provides an opportunity for high school juniors and seniors to tour the campus, hear an admissions presentation, and sit in on a class in session.
Admissions Day This event provides instant admissions decisions to high school seniors during their visit to the campus on a Saturday in late October. They bring with them unofficial high school transcripts, complete their admissions applications, and receive their admissions notices, all within a single
day on which they can also take advantage of workshops and meetings with advisors.
May 2001 28

Enuollme~It Needs StudV for the San Die,go Re~ion
Upward Bound The Upward Bound program, a federally fUnded TRIO program, provides academic counseling and guidance services to high-potential high school students in North County. Services include Saturday enrichment classes throughout the year, after school tutoring, field trips, leadership opportunities, counseling sessions, and a summer Bridge program that prepares students for their first year of college.
Student Academic Sewices Outreach Program (SASOP) This program seeks to prepare and increase the number of economically, educationally, physically, and environmentally disadvantages students entering and graduating from Cal State San Marcos. Committed to providing developmental academic outreach services during the K-12 years, SASOP provides tutoring, pre-college advising, skills and self-esteem workshops, CSUSM/School site visits, an "I'm Going to College" program for fifth-graders, and the Young Scholars Summer Academy.
Gaining Early Awareness and Readinessfor Undergraduate Programs (GEAR UP) At present, the CSUSM GEAR UP initiative focuses on encouraging students at Grant Middle School in Escondido to begin preparing for college entry. GEAR UP provides individualized mentoring, tutoring, and counseling, as well as after-school programs, summer academic and enrichment programs, and college visits. The initiative also sponsors activities aimed at involving parents in their children's education and enhancing the professional opportunities available to teachers.
Academic Support Programfor Intellectual Rewards and Enhancement (ASPIRE) Among other things, ASPIRE, a federally funded TRIO program, provides academic support services to those students about to enter Cal State San Marcos who are low-income, first- generation students or who have a verifiable disability. The services provided include individualized tutoring and mentoring, academic advising, and assistance for students laying out plans for completing their college educations. An important component of ASPIRE is the Summer Bridge Program, which, during the summer prior to students' initial entry, provides coursework designed to remedy deficiencies in basic skills and ease -the transition to college.
CAPI
Cal State San Marcos has implemented CAPI programs in English and/or Mathematics at six area high schools: Carlsbad, San Marcos, Vista, and Rancho Buena Vista high schools in North County; Rancho Bernardo High School in North City; and Temecula High School in Southwest Riverside County. CSUSM students provide tutoring to high school students, sometimes remotely through an On-line Writing Laboratory and via a Math Lab electronic mailbox. Student experiences at Temecula High School with the On-line Writing Center were so favorable that the teacher of one English class there expects her entire class to attend the next Open University Day at Cal State San Marcos. At another high school, CAPI involvement led to plans to administer the ELM test on-site to close to 200 students, many of whom it is hoped will pass the exam and then begin thinking seriously about attending CSUSM. Building on the increased levels of interest in CSUSM at CAPI high schools, the university is planning increased outreach activities at these sites.
May 2001 29

Enrollment Needs Study for the San Die~po Re~ion
The CAPI program extends well beyond the six schools directly involved. The program organizes a pair of conferences on curricular alignment between high schools and the university for mathematics and English teachers, counselors and administrators at all high school in the region. Additionally, the summer in-service programs are open to all interested high school faculty, regardless of whether they teach at a CAPI school.
Community ColleRe Outreach Activities
Both CSUSM and SDSU conduct a significant number of recruitment and outreach activities specifically targeted for community college transfers. These activities are designed to provide a smooth transition between community college and SDSU or CSUSI~I, especially for students from historically underrepresented groups with no support system in place to ensure a smooth transition to a four-year college. As SDSU and CSUSM develop their off-campus sites, current and new recruitment/outreach activities will encourage community college students who are in close proximity to the sites to consider the advantages and convenience of attending these sites. Among the activities undertaken are the following:
Teams consisting of an academic advisor, evaluator, and recruiter/school relations officer, are assigned to each community college in San Diego, Imperial, and Riverside counties. In addition to recruitment and outreach activities, these teams are responsible for enhancing university/community college relations, developing programs/workshops, and functioning as the primary information source for the assigned community college.
Information Fairs are held at each community college campus to provide information about CSUSM or SDSU and the transfer process to prospective students. The number of fairs held at each campus, between two and six each fall, varies based on campus size. In Fall 2000, approximately 2,100 students participated.
Preview Day where prospective students and their families are invited to the SDSU or CSUSM campus for admission application workshops; tours; information sessions (i.e., financial aid, scholarships, EOP, housing, transfer success); and the opportunity to meet with faculty, support staff, and student leaders. In Fall 2000, approximately 1,200 students and family members attended at SDSU and over 400 attended at CSUSM.
Campus Visits The teams referenced above schedule visits at their respective community college campuses with the Transfer Center Directors/Counseling Staff for the purpose of rebuilding and enhancing school relations, information exchange/program, or workshop development.
Cal State San Marcos regularly offers on-site admissions at some of the community colleges in the area, e.g., Miramar College.
San Diego State offers additional services to community college students as follows:
Transfer Days All local community college transfers who are admitted for the fall semester are invited to a spring workshop held at their community college campus. The workshop provides a review of enrollment procedures and requirements, information about testing,
May 2001 30

Enrollment Needs StudV for fhe San Die~o Re~pion
orientation, financial aid, etc. The SDSU teams also answer any questions transfer students may have.
Future Aztecs Day (formerly Open House). Admitted students and their families are invited to the SDSU campus for tours; information sessions (i.e., confirming admission, financial aid, EOP, housing, transfer success, the academic colleges); and the opportunity to meet with faculty, support staff, and student leaders. In Spring 2000, approximately 4,800 students and family members attended.
Prospective Student Center The Center is a new addition to SDSU's outreach activities and serves as the mainpoint of phone, e-mail and personal contact to meet the admissions information needs of prospective students, applicants to SDSU, and counselors and Transfer Center staff.
May 200~ 31

Enrollment Needs StudV for the San Die~o Re~ion
Appendices
Appendix A Projections of new student enrollments at San Diego State and Cal State San Marcos
Appendix B Maps of San Diego County Major Statistical Areas, Cities, Planning Areas, etc. provided by San Diego Association of Governments (SANDAG)
Appendiiw C Occupational Projections
May 2001 · 32

Enrollment Needs Study for the San Die~ro Re~ion
Appendix A
Table A-I San Die~o State University Proiections of New Students 1999 2000 2001 2002 2003 2004 2005 2006 2007 2008 2009 2010
-- -- -- --
FTF --
San Diego Co. 2,070 1,950 1,642 1,683 1,800 1,820 1,840 1,850 1,887 1,970 2,069 2,010 imperial Co. 38 38 38 32 25 32 33 33 34 35 37 39 Non-Local
2,139 2,161 2,800 3,200 3,300 3,450 3,600 3,725 3,900 3,900 3,850 3,850
sub-total 3,813 3,869 4,632 5,053 5,173 5,334 5,522 5,732 6,008 5,948 5,958 5,838
Transfers ----
San Diego Co. 1,929 1,898 1,344 1,417 1,608 1,655 1,680 1,705 1,750 1,810 1,900 1,934 Imperial Co. 26 26 26 17 17 22 22 23 23 24 25 26 Non-Local
1,258 1,166 1,250 1,300 1,350 1,400 1,425 1,450 1,475 1,500 1,525 1,500
sub-total 2,619 2,600 2,880 2,977 3,053 3,128 3,199 3385 3,401 3,460 3,480 3,424
GdPb
San Diego Co. 1,374 1,446 1,477 1,477 1,541 1,581 1,602 1,625 1,650 1,680 1,725 1,775
Imperial Co. 22 22 25 7 8 10 12 12 13 15 17 20 Non-Local
541 604 654 716 782 900 1,025 1,200 1,400 1,600 1,761 1,775
sub-total 1,922 2,058 2,141 2,205 2,335 2,494 2,642 2,842 3,070 3,302 3,508 3,575
Total 8,354 8,527 9,654 10,235 10,561 10,956 11,363 11,859 12,479 12,710 12,946 12,837
Per Sally Farris, 11/14/00
Table A-2 CSUSan Marcos Projections ofNew Students 1999 2000 2001 2002 2003 2004 2005 2006 2007 2008 2009 2010
-- -- --
FTF
San Diego Co. 833 863 379 429 504 553 602 635 665 713 750 793 Riverside Co.
50 70 83 91 101 106 111 119 125 132 139 144
Non-local 85 97 115 126 138 145 152 163 172 181 190 196
sub-total 514 596 701 770 841 887 929 996 1,048 1,107 1,163 1,203
Trans
San Diego Co. 836 862 891 756 750 735 739 744 741 755 782 807 Riverside Co.
75 67 77 81 105 128 155 184 215 249 286 330
Non-local 146 149 179 228 285 340 390 429 468 508 547 588
sub-total 977 967 991 1,049 1,133 1,209 1,300 1,395 1,490 1,593 1,695 1,809
GdPb
San Diego Co. 816 877 930 447 501 561 585 621 665 726 747 767 Riverside Co.
30 46 51 53 57 62 67 71 73 75 80 85
Non-local 47 46 51 53 64 69 76 96 132 148 153 170
sub-total 524 592 663 692 743 795 868 913 972 1,039 1,110 1,185
Total 2,015 2,155 2,356 2,511 2,717 2,891 3,097 3,304 3,510 3,739 3,968 4,197
Per Richard Riehl, 11/9/00, with adjustments. ?hese projections were used to generate the FTE projections referenced in P.E. Worden to M. Hirano-Nakanishi, 11/17/00.
May 2001 33

Enrollment Needs Study for tlze San Die~o Region
Appendix B
Maps of San Diego County Major Statistical Areas, Cities, Planning Areas, etc provided by San Diego Association of Governments (SANDA G)
May ZOOI 34

Enrollmenf Needs Study for tl~e San Dieno Re~lion
Appendix C
Occupational Projections tan example of the types of data, both national and regional, that are available)
Translating projections of jobs into projections of occupations that can be used as a guide to selecting specific degree programs to be offered at a rapidly growing campus such as San Marcos or at off-campus sites is a relatively long step because in many instances degree programs and occupations are only loosely related and because students are mobile and can move to localities where jobs related to their education are available.
Two types of projections are briefly discussed here: (a) aggregated projections of the occupational structure at the national level made by the Bureau of Labor Statistics and (b) specific occupational projections for San Diego County made by the California Employment Development Department.
(a) At the national level the Bureau of Labor Statistics makes bi-annual projections of occupations in the United States. The most recent projections, published in 1999, are shown in Table C-l for aggregated occupational levels. The occupations are arranged in the table in descending order of educational preparation, executive, administrative, and managerial and professional specialty with the highest educational requirements and operators, fabricators, and laborers with the least. The important fact demonstrated by the table is that the occupations with the highest educational requirements continue to grow faster than employment while the occupations with the least educational requirements grow slower than employment. For example, the share of total employment represented by occupations in the last four rows of the table will decline from 45.1 percent of the labor force in 1988 to 42.2 percent in 2008 (even though the service occupations share is projected to grow); the share represented by occupations in the first three rows, all of which require at least some college, will grow from 26.0 to 30.1 percent. This result represents a continuation of trends reported by the BLS back through the 1960s and provide good reason to believe that the demand for higher education in general will continue to grow faster than the population.
Table C-~ Projections ofElnploymenf and Occrcpatiorzs in the U.S. 1988-2008
1988 1998 2008
layment, all ons (,000) 120,010 140,514 160,795 Percentaae distribution of: (%) (%) (%)
Executive, administrative, and managerial. 10.3 10.5 10.7 Professional, specialty 12.5 14.1 15.6 Technicians and related support 3.2 3.5 3.8 Marketing and sales 10.3 10.9 11.0 Administrative support and clerical 18.5 17.4 16.6 Service 15.5 16.0 16.4
Agriculture, forestry, fishing 3.5 3.2 2.8 Precision production, craft, and repair 11.9 11.1 10.5 Operators, fabricators, and laborers 14.2 13.2 12.7
Percentages may not add to 100 because of independent rounding.
May 2001 41
Enrollment Needs Study for the San Die~o Re~ion
Source: Douglas Braddock, "Occupational Employment Projections to 2008," Monthly Labol- Review, November 1999.
(b) The California Employment Development Department makes projections of occupations for California counties available at the EDD website as part of the Labor Market Lnformation service. Projections for selected occupations for San Diego County are shown in Table C-2.
Table C-2 San Diego County Projectionsfor Selected Occupations 1997-2004
OES Change Total code Occupational title 1997 2004 (~owth) Separations o~eninas
21100 Accountants.etc. 14,140 16,550 2,410 2,130 4,540
53100 Banking,Finance... 10,810 12,100 1,290 2,120 3,410
25000 Computer, Math, ... 19,260 27,090 7,830 2,470 10,300
32000 Health Practioners... 46,010 52,930 6,920 5,470 12,390
10000 Managers &admin. 73,290 88,670 15,380 11,600 26,980
31000 Teachers, educators. 68,040 81,500 13,460 10,090 23,550
Source: California Employment Development Department, Labor Market Information for Economic Development Cprojection data available at EDD.
May 2001 42

Faculty Compensation and The Crisis in Recruiting and Retaining Faculty of High Quality
(Unanimonsly endorsed by the Academic Senate of the California State University May 2005)
In September 2001, the Academic Senate CSU adopted a report entitled The California State University at the Beginning ofthe 21S' Century.. Meeting the Needs ofthe People ofCalifornia. In a section entitled "The Crisis in Faculty Hiring," that report predicted:
As tlze CSU co~fi·orzts ... burgeoning enrollmelzts alzd [a] crisis ofspace, it will alsoface a crisis infaculty hiring due to a combination of increased elzuollilzerzts, the denzograplzics of the currelztfaculty, ctisir?centives to takefaculty positions in California ilz general and in the CSU in particzllar, and afailure to hire ahead oftl~e LZenzal2d cuwe.
Tl?e CSU hires t/ttfacultyfronz a natiorzalpool, and thereforefaces serious competitioizfor newfaculty r7zer7zbers. Tlze CSUfaces ss·ious constraints on its ability to recruit and retain afaculty ofhiglz quality during the coming decade because of
· the serious and continuing lag of CSU salaries behind those of comparable ir?stitutions,. ..
· excessive California Izousilzg costs;. ..
These circumstances have not improved during the nearly four years since the report was originally drafted. The current faculty continue to retire in large numbers. Enrollments continue to increase despite budget reductions. However, both of these constraints on recruiting and retaining a faculty of high quality have increased.
Faculty Compensatiol2 Pnttevns Over Twenty Years
For more than a decade, the legislatively mandated studies conducted by the California Postsecondary Education Commission (CPEC) have shown that compensation for faculty at California's world-renowned postsecondary public universities has failed to keep pace with that at comparison institutions. In fact, average faculty salaries have declined in actual purchasing power. This drop is attributable to the faltering economy of the state and the inability of the legislature to provide funding at the levels necessary to maintain and expand public postsecondary education in California and to serve the state's need for a superior workforce. Graph 1 makes clear the difference between the CPEC-recommended parity figure, designed to keep CSU faculty salaries at parity with those at comparison institutions, and the amount by which CSU faculty salaries actually increased. The results are well known and well documented: declining faculty morale; increasing difficulty by faculty in meeting the cost of living, especially in urban areas; reduced success in hiring new faculty and retaining junior faculty; specific workload increases for senior faculty and an increasing workload for all faculty, especially permanent faculty.

Graph i. CPEC Parity Figures and Actual CSU Salary Increases,
1986-87 through Projections for 2005-06
·18
16
14
12
t; 10
1986- 1987- 1988- 1989- 1990- 1991- 1992- 1993- 1994- 1995- 1996- 1 1997- 1998- 1999- 2000- 2001- 2002- 2003- 2094- 06
87 88 89 90 91 92 93 94 95 96 97 98 99 2000 1 02 03 04 05 (p~D-
CSUPan'tyFiguw 6.9 6.9 4.7 4.8 4.9 4.1 6 8.5 6.8 12.7 9.6 10.8 11.2 11.1 8.9 7.9 10.6 11.6 13.1 16.8
Acfual Increase 6·8 6.9 4.7 4.8 4.9 O 0 3 0 2.5 4 4 5.7 6 5.9 2 3 0.8 0 3.5
In our 2001 report, we noted that the purchasing power of CSU faculty was actually less than it had been ten years before. After a brief improvement in the late 1990s, that situation has worsened, as Graph 2 makes clear. Graph 2 is based on CSU data, which are complete only through the 2002-2003 academic year. Given the lack of any significant compensation increases in the intervening years, however, the current situation is unquestionably worse than it was in 2002. We can use CPEC data, for example, to compare the average faculty salary in 1999-2000 with that in 2004-05. According to CPEC data, the average CSU faculty salary in 1999-2000 was $66,281. To maintain the same purchasing power in 2004-05, the average faculty salary should have increased to $75,113. In fact, however, CPEC data show that the average faculty salary in 2004-05 was $69,327.'
i California Postsecondary Education Commission, Fac2tlty Salari~s at Califon2ia 's Pzlblic U12iversities, 2005-06, hnT7:/\y~W .C1)13C. C;l.eov~com pletc~c"l,orls~2 005 reports0j-0?.lldf
Graph 2. Average Salary of Full-time Faculty, in Current and Constant Dollars, 1986-2002
" 70,000 o ,, o
65,000
0 60,000 o r B d (-·-C U) 55,000
~ I 50,000
c0
45,000 ~--7~
40,000 1986119871988 98919901991 199211993 99419951199611997 1998 999 1
Average Sala~y.CondantDollars .1 ,91 ,9 5169131669816682
-- --· -Average Salary. Current Dollars 1 54, .7 ,1 1 69131688916981
Faculty Compensatiorz arzd the C~2allenge ofHiri~vlg Faculty ofHigh puality
Present compensation, thus, call be a major disincentive to a successful hire. In 2003, the Faculty Flow Committee (made up of individuals from the Academic Senate, the California Faculty Association, the campus provosts/academic vice-presidents, the CSU administration, and two consultants, one of whom was a member of the CSU administration, the other a faculty member) noted in its major findings that
Salary was listed as a I·easorz by only 12% offaculty who accepted CSU offers but over 20% of tPlefaculty who I·ejected CSU offers. For 3 7% ofresporzderzts who accepted a position with the CSU, tl?e CSU offer was Iziglzeu tharz other off~rs I·eceivecl. For 55% of respolzdents wlzo rejected alz offerfvom tlte CSU, t~ze CSU offer was lower than other offers received. ~emphasis added]
The report recommended that the CSU should "Work to increase CSU faculI~ salaries to a level at which they are comparable with those offered faculty in peer institutions.
It is widely recognized that many CSU faculty members are approaching retirement (see Graph 3), and that the number of temporary faculty providing instruction in the CSU hovers around the 50% mark.3 Although declining numbers of tenured faculty impose an enormous need to hire new faculty members, few incentives exist for a candidate to put the CSU high on his/her list. Fundamental impediments are tied to inadequate compensation.
2 h tln:/WV~~'. CillS LiltC.cd U!~ cad Sen iReco I·d s:l:e t)o rts!'Facu It~ F [O\YC mtRC`l)Ol.t.pdt-
3 This situation can be seen in Graphs 4 and 5, page 10.

Graph 3. The Graying of the Faculty: Distribution of Full-time Faculty by Age, Fall Semesters, 1980-2002
100
ge 60 and
70 59 years of
a, 60
50
9 years of 30
39 years of
1980 1981 1982 1983 1984 1985 1986 1987 1988 1989 19E~ 1993 1941 1995 19E~ 1997 1998 1959 2WO 2931 2m2
60arddder 89 105 113 107 10.8 12 122 131 125 1J1 132 125 10 116 125 139 149 151 164 118 17.6 17.4 182
OEa59*asolage 271 27.1 275 28.4 284 293 298 308 314 319 9.7 35 383 401 416 41.6 42 422 422 413 402 389 37.2 ~earsofage 348 351 365 37.7 377 373 37.7 382 383 38 372 36.8 37.4 354 335 328 314 295 28.4 271 268 268 25.5
3039)easalage 27 252 228 213 211 19.7 189 17 16.8 15 158 149 138 12.4 11.7 11 109 11.1 121 129 142 155 18.7 21 21 18 1.8 1.9 16 i-Jan 1 1 1.1 1 (19 65 06 06 07 09 08 09 09 12 13 14
A second major disincentive is the cost ofliving, especially in urban areas. Many candidates are wary of taking a position in a location where even a rental absorbs a disproportionate percent of one's income and where expectations for top salaries or retirement income are fragile at best. The gross average salary paid to an assistant professor--somewhat above the usual salary level for a new hire--in 2003-04 was $54,572; in 2004-05 it increased a total of $277, to $54,949.4 The average assistant professor's salary was critically inadequate in 2003-04; its inadequacy has been exacerbated by steep increases in housing prices. Salaries of associate professors were better matched to the housing market, but still inadequate in many areas of the state. Dependence on hiring new faculty at the associate professor level in order to offer a nationally competitive salary compresses the salary scale for those currently employed and is unfair to CSU faculty members who have had to serve as many as seven or eight years to reach similar salary levels. Table 1 summarizes HUD data on income in the six urban areas with the highest housing prices, and compares those income designations with CSU salaries.
4 Facul~y Salal-i~s at Public Ulzive~siti~s, April 2003; April 2004. CPEC identified the average salary of a full professor in as $83,434 in 2003-04 and $83,451 in 2004-05.

Table 1. HUD Data on Income Necessary to Purchase a Home Compared with CSU Salary Levels, Selected Urban Areas, 2005
HUD Income Designations, CSU Salary Levels, Family of3, 20056 2004-057
PMSA or MSAS/ Low Income Median Assistant Associate CSU Campus Income Professor Professor San Francisco/San $81,450 $101,800 Francisco
San Jos~/San JosC 76,400 95,500 Oakland/ $54,949 $67,093 East Bay, San Francisco 59,600 74,500 Ventura/Channel Islands 58,050 72,500 Santa Cruz-Watsonville/
Montere Ba 56,500 70,700 Oranee/Fullerton 55,300 69,100
Imagine how difficult it is to recruit faculty members to these campuses when federal data illustrate that entry-level salaries fall below the HUD standard for "low income.
The data in Table 1 highlight the disparity in selected geographic areas. The situation was only slightly better in other parts of the state. In San Diego County (San Diego State University, CSU San Marcos), the average salary of an assistant professor was $35,280 lower than the $89,852 income needed to purchase a median-priced home ($406,950) and $6,000 below the HUD median annual wage for the area. In Los Angeles County (CSU Los Angeles, Long Beach, Northridge, Dominguez Hills), the average CSU assistant professor's salary was $19,880 lower than the $74,452 needed to purchase a median-priced home ($337,200), although the salary was approximately equal to the HUD median annual wage for the area. In San Bernardino and Riverside counties (CSU San Bernardino, Cal Poly Pomona), the salary was $7,640 higher than the $46,932 needed to purchase a median-priced home ($212,560), but was $4,472 lower than the HUD median annual wage. In Sacramento County (CSU Sacramento), the salary was $1,100 more than the $53,792 needed to purchase a median-priced home of $243,630, yet was $5,228 less than the HUD median annual wage for the area. Table 2 summarizes changes in housing costs between 2003-04 and 2004-05, and compares those changes with changes in CSU salaries.
5 Primary Metl-opolitan Statistical Area (PMSA) and Metropolitan Statistical Area (MSA) are standard geographic designations developed by the Census Bureau.
6 U.S. Department of Housing and Urban Development, FY 2005 62con2e Li~lzils, hlt~~:i!'\\·ww.h~Iduser.ore:D~ltasetsiIl;iII~05ica ~fi~200j.~df The Department of Housing and Urban Development (HUD) is required by law to set income limits that determine the eligibility of applicants for HUD's assisted housing programs. Income limits are calculated for metl-opolitan areas and non-metropolitan counties in the United States and its territories using the Fair Market Rent (FMR) area definitions used in the HUD Section 8 program. They are based on HUD estimates of median family income, with adjustments for family size. Low-income families are defined as families whose incomes do not exceed 80 percent of the median family income for the area. See htln::iwwl\·.huiluscr.oreldalasetsliVilOSIlllil I_:,I'IN<:i-i\/ln'l:'~'.RIAl:,s.ucll-
7 California Postsecondary Education Commission, Faculty Salaries at Califonzia 4 Public U~liveusities, 2005-06, htlp:'!'\vwlr.co2c.ua.ro\··icomltletcrc·oorts::'20C).irL·pol·ts:;()5-04 .I,df

A further implication of these very high prices for housing is that property taxes begin at 1% of the sale price, another significant financial burden for entering faculty members.
Table 2. Changes in Cost of Median-priced House Compared with Changes in CSU Average Salaries, 2003-04 to 2004-05
Change in CSU Average Change in Cost of a Median- Salaries, 2003-04 to 2004-05"
priced House, 2003-04 to Assistant Associate Region 2004-058 Professor Professor San Francisco Ba Area 14% SanDi oCoun 24% Los eles Co 24%
San Bernardino and Riverside 0.7% -0.4% Counties 34% Sacramento Co 31% CentralValle Counties 23-25%
Fair Market Rental costs were also nearly prohibitive in relation to faculty salaries at the levels normally utilized for new faculty hires. While the Bay Area market rentals were reduced 13.3 percent and 15.6 percent for 2 and 3-bedroom apartments between November 1, 2003, and October 12, 2004, all others (except in Stanislaus County at the two-bedroom level) continued to increase at various rates. In the Bay Area (San Francisco, San Mateo and Marin counties), in 2004, a new faculty member who devoted one third of gross salaried income to rental costs'" would have to receive an annual take-home salary of $63,90011 to afford a 2-bedroom apartment ($1,775 monthly) and $87,660 ($2,435 monthly) for a 3-bedroom aparhnent. In 2005, the take- home salary would have to be $55,404 for a 2-bedroom apartment ($1,539 monthly) and $73,980 ($2,055 Inonthly) for a 3-bedroom apartment, a one-year decrease of 13.3 percent and 15.6 percent respectively. The situation is similar elsewhere."
S 2004 foul-th quarter figures are taken from CNN Money, "Top Housing Markets, February 15, 2005," ]Iltl):~W\I.C\:. money .cnn.cOmi2()05/01!1 5::rcal esiatellnetl·ot~lal·Icc·is, and accompanying internal links.
9 Figures derived from the CPEC Salary data cited above, for which also see salary averages for associate and full professors.
'O All subsequent calculations are based on a one-third of take-home wages devoted to apartment rental costs.
'' Take home salary would be the amount of wages after deductions for retirement, social security, Medicare, state and federal taxes, mandated fees for Union representation, etc.
'2 In San Diego County, in 2004, a new faculty member would have to receive an annual take-home salary of%42,300 for a a-bedroom apartment ($1,175 monthly) and $58,896 for a 3-bedroom apartment ($1,636 monthly). In 2005, the take- home salary would have to be $42,588 for a 2-bedroom apartment (%1,183 monthly) and $62,100 ($1725 monthly) for a 3-bedroom apartment, a one-year increase of 0.7 percent and 5.4 percent respectively. In Orange County, in 2004, a new faculty member would have to receive an annual take-home salary of $43,920 for a 2-bedroom apartment ($1,220 monthly) and $61,128 for a 3-bedroom apartment ($1,698 monthly). In 2005, the take-home salary would have to be $47,412 for a 2-bedroom apartment ($1,317 monthly) and $67,860 for a 3-bedroom apartment, a one-year increase of 8 percent and 11 percent respectively. In Los Angeles County, in 2004, a new faculty member would have to receive an annual take-home salary of $36,756 for a 2-bedroom apartment (($1,011 monthly) and $49,608 for a 3-bedroom apartment ($1,378 monthly). In 2005, the take-home salary would have to be $40,464 for a 2-bedroom apartment ($1,124 monthly) and $54,360 for a 3-bedroom apartment ($1,510 monthly), a one-year increase of 10.1 percent and 9.6 percent

liaculty Conzpensation and tlze Challenge ofaetainilzg Faculty ofHigh IQuality
The structure of compensation is a third major disincentive, especially for retention. CPEC notes the complexity of the factors that attract individuals to an employer such as the CSU: "compensation is only one factor that faculty use when considering job offers. Other factors such as pension plans, cost of housing, and quality of life often affect a faculty member's decision when accepting a new position in California." Thus the trend reported on some campuses: recent hires who have no other compelling reason to remain in California can, and do, seek positions elsewhere, positions with higher salaries and lower teaching loads, so they can fulfill the hopes and expectations that led them to higher education in the first place.
Compression of the salary scale is the compensation issue that most affects senior faculty; it also constrains the hiring of new faculty members and, especially, the retention ofmid-career faculty members. The need to hire at increasingly high salary levels, without providing corresponding increases in the salaries of senior faculty members, means that after years of work a median-level full professor now earns only 1.5 times as much as a recently hired, median-level assistant professor. This may be compared to the situation in the CPEC comparison institutions for the CSU, where a median-level full professor earns 1.7 times as much as a median-level assistant professor. In the UC system, the median-level full professor also earns 1.7 times as much as a median-level assistant professor."
This salary compression has several implications. One has to do with morale among continuing junior faculty members. In many departments across the CSU, newly hired assistant professors are earning more than assistant professors hired a few years previously. Because of the need to be as competitive as possible in hiring, salaries at the assistant professor rank are only 9.7% behind those at CPEC comparison institutions, and salaries for associate professors lag by only 7.1% On the other hand, senior faculty members--full professors--are the most seriously disadvantaged; their compensation lags 21.4% behind salaries at CPEC comparison institutions. This fact carries clear implications for retirement, since retirement income is tied directly to the faculty member's highest salary. Once nzid-rarzgefaculty menzbers understand the i~eality and ilnplications oftlzis salary conzpressiorz, it increases the likelihood t~zat they will seekjobs elsewhere. For senior faculty members who do not leave the CSU, this salary compression means that they are likely to delay retiring in the hopes of securing a few more annual salary increases.
respectively. In San Bemardino and Riverside Counties, in 2004, a new faculty member would have to receive an annual take-home salary of $26,244 for a 2-bedroom apartment ($729 monthly) and $36,396 for a 3-bedrrom apartment ($1,01 1 monthly). In 2005 the take-home salary would have to be $27,072 for a 2-bedroom apartment and $38,088 for a 3- bedroom apartment ($1,058 monthly), a one-year increase of 3.2 percent and 4.6 percent respectively. In Sacramento County, in 2004, a new faculty member would have to receive an annual take-home salary of $42,300 for a 2-bedroom apartment ($950 monthly) and $47,448 for a 3-bedroom apartment ($1,318 monthly). In 2005, the take-home salary would have to be $34,956 for a 2-bedroom apartment ($971 monthly) and $50,508 for a 3-bedroom apartment ($1,403 monthly), a one-year increase of2.2 percent and 6.4 percent respectively.
" California Postsecondary Education Commission, Fac2tlty Salal-ies at CaliSonlia Is Alblic Ullivelsiti~s, 2005-06, htln:i\vww,cp2c.ca.gov!'conl plzterc`l,ol.Cs2005 rzl,oI.ls()S-04.l,df

Uncertainty about the CSU retirement program has emerged as a potential, fourth disincentive, again, one that is especially likely to affect retention. As presently structured, PERS provides defined retirement benefits for faculty that are superior to those found in some private universities and in many public systems in other states. Such benefits may have enabled the state to hire and retain faculty at lower salaries than would have otherwise have been the case. In particular, it has been useful in the past fifteen years when the state has not maintained the level of compensation recommended by CPEC. The defined benefits of the PERS system have helped hold mid-career faculty members in the CSU when they compare the benefits available to them in other institutions. The potential of the Faculty Early Retirement Program (FERP) has contributed to recruitment success and provided an offset to the tendency of senior faculty to delay retirement. It has also benefited the CSU in providing for guaranteed and orderly departures of faculty from the system.
Adverse Effects on the CSU of Currerzt Patterns of Faculty Compensation
The potential impact on CSU as a whole, and on the faculty, is not difficult to predict: a smaller proportion -- and sometimes even smaller numbers -- of tenured and tenure-track faculty members; this can be clearly seen in Graphs 4 and 5, which carry the data only through 2002-03 because that is the latest year available in the CSU Statistical Abstracts. VJith fewer new
assistant professors and more lecturers, there is likely to be less diversity among faculty and perhaps a less-qualified faculty. The faculty is likely to be more mobile, with lessened long-term loyalty to the institution. Currently employed junior faculty will be less likely to remain, and those who do are likely to make it through the ranks only to find that their salaries have in effect been frozen. While these results have human consequences, they also have consequences for the institution, for it will be less able to provide students with a high-quality education, to nourish academic programs, and to meet the needs of the larger society by educating its teachers, nurses, engineers, counselors, business and corporate leaders. Thus, this situation will have a profound effect on the citizens and institutions of the state.
The disillusionment experienced by long-term faculty in the CSU is now creeping down the ranks; senior faculty see their salaries dwindle in relation to those of their peers; junior faculty cannot afford to buy homes or to rear their children as they would be able to do in other states; their enviable retirement system is under attack on two fronts (the pension program proposed for change by the Governor and special interest groups promoting ballot initiatives, and the FERP program proposed for elimination by the Trustees). Few faculty or staff in the CSU would recommend a career in the CSU to their children. Junior faculty members barely get by on their salaries as assistant or associate professors and they see professors with many years of commitment to the CSU go unrewarded. In that circumstance, assistant and associate professors inevitably ask themselves if they can afford a future of such limited economic opportunity. Professionals in few other fields -- for that matter, employees in any other industry -- would not tolerate the conditions now taken as baselines in CSU.

"c~ o ~lln3ej ~o JaqlunN r zo,OZ
'o o o o o o o o o a Q o o o o o o
o, ~r N O O O a,
2: 9b2 m ~D a Q4t (a 2002-03 1~i
6~a~ U. *
E ~~ r
2001-02
a a.dl a 2000-2001 5 sX n W a
E O 1999-2000 6; m \t
u, 1- 1998-99
~ * c 9 6i Lm
, ~" 1997-98 a, L·Cj
Y sl o a
"s, a 1996-97 o o
"6! E(u r8 1995-96 e~ 0~0 o a,E o "6·,
c x-, 1 1994-95 a, , a, a Eo
t-S ~~·" Q a 1993-94
c irsg: 03 c I 1992-93
o *
Y r ~a a, a) "EP o o\
~ , , 1991-92 bm J I Oi a 2) E~ b e" · O 1990-91
L
> o.~ t 1989-90 r ov) E~t? o ~p a
E 6 6i =I , 1988-89 a, 8;p, Z o E \* n 1987-88 m a C3)= E si ro \· o
~a L * 1986-87 a, z ;98 cna L ~n Cr cW
I 9a m \ 1985-86 r
D a, o, b, 0 a 1984-85
61 m \ SE Vj 1983-84 O "a a6i c
d~a. I 1982-83
m I 6i L 1981-82
a. C~ O \\ ~ \ I 1 1980-81 Q
(3 zs,C~' Ia o o o o o
O O O O O
8~8880a O O O O O Ll "~~88 ~ O O O O O N si O cO CO ~t N
r c? hi hi cv c~
(h~ S31j

The decline in quality will have a ripple effect throughout the state, one from which it may take decades to recover. Despite a persistently unhappy budget climate in California, it is incumbent on those who wear the mantle of leadership in the CSU to speak openly, decisively, and strongly on behalf of a system now hovering at a crossroad between excellence and mediocrity.
Recommerzdations Regarding Faculty Conzpensation and Related Issues
The Academic Senate CSU calls upon the Chancellor and Board ofTrustees to make faculty compensation one of the most important issues in budgeting, and to make clear in all annual budget proposals the strong and unwavering support of the Trustees for providing faculty compensation increases at the full parity figure recommended by CPEC.
· The Academic Senate CSU calls upon the Chancellor and Board ofTrustees, and the California Faculty Association, to address the issue of salary compression, and the Chancellor to seek additional budget support as necessary to accomplish that objective as has been done in other states.
· The Academic Senate CSU calls upon the Chancellor and the Board of Trustees to announce their strong support for the current faculty pension system and for the Faculty Early Retirement Program.
· The Academic Senate CSU calls upon the Chancellor and other CSU representatives to refrain from criticizing the CPEC methodology for determining the parity figure. The appropriate time and place for discussions of that methodology is in the meetings of CPEC's Faculty Salary Adjustment Committee, on which the CSU has fullrepresentation. Criticism of CPEC methodology in other venues serves only to persuade faculty members that the Chancellor and Trustees are not supportive of faculty compensation and to persuade state officials that they need not respect CPEC recommendations.
References:
Academic Senate of the CSU. The California State University at the Beginning of the Twenty- Jirst Century. Meeting the Needs of the People of California, September 200 1. Online at http://~ww .calstate.edujAcaclScl7/Recorclsllieports/C SIJ 2lstCentury.pdf
Advisory Committee for the CSU and Comparable Faculty Workload Studies. CSUFaculty I/t~orkload Report, February 2002. Online at
7~tl2l!i~:w\~·cal slatc.cd u!acadres:ciocs/cs~1 facM:1·l<:lcll-pt:.~d:f Conzparable Faculty ~orkload Report, January 2003. Online at
h~t~p:llw\·\iw.calstate.edu/aclzdreslctocs/C:I'~li-lie~~ort- :1 O.pdf Findings and liecornnzenctations of the Advisory Conznzitteefor the CSU and Conzparable
Faculty ~brMoad Studies, January 2003. Online at http:~www.ca Istate.ectu/acadres/docs/Flh'A I, Findin~s fiec.pdf IW~YW.Ca ca r oc
California Postsecondary Education Commission. Faculty Salaries at California 's Public Univevsities, 2005-06. Online at
httl~://www.cpec.ca.~!ov/compjetel.eports/2005re~olts/05-1)4.·~df vww c.ca. o
California State University, Faculty Flow Committee. Report oftlze Faculty Flow Cornnzittee, March 2003. Online at
httlp://www.calstate.edu/Acad Sen/Records/Re~ot·ts/Fr-lcultvFlo\?,CmtReport.pdf \i~~2~~ Ca Ca eco
Faculty Flow Suwey Report, January 2003. Online at httio:~y·L~w.cal state.edu/Acc?cl SenlRecordslIieportsiFacult\··I-`l owSut·vevRel30rt. I~df \Y·L~w.ca Cc? eco
California State University, ACR 73 Taskforce. Response To ACR 73 (Strolz-Martin): A Plan to Irzcrease tlze Percelztage ofTenzlred and Telzure-Track Faculty ilz the CSU, July 2002. Online at htt~:li~w\n~i.cal state.cduiAcad Sen/Recorc~ls/Ret>orts!ACR73 07222002.l~df i~w\n~i.ca Iii ca
California State University, Office of the Chancellor. California State Ui2iversity Statistical Abstract, 2002-2003. Online at
~-1Ctg://www.cal stale.edu/ris/stat abslract/stat0203/1,d flabstractlt\ '1Y)Cacl<.~d' www a
CNN Money. "Top Housing Markets, February 15, 2005," httQ :llw\Yw.moncy.cl~n .com/2005/02/ 1 5/lcal estate/m etrolnarket·s w\yw.m ne cnn
U.S. Department of Housing and Urban Development. FY2005 Inccozle Lii~zits. Online at http://Lvww.tluduscr.or~/Datasets/l I:,/1LOS/ca fv20C)5.pdf` and http:llwww.huduscr.ol-gldatasetsli I/i I05/1;3fllEFINC;-;\?tArI'`ER1Al,s.pdf- W use O 5
11
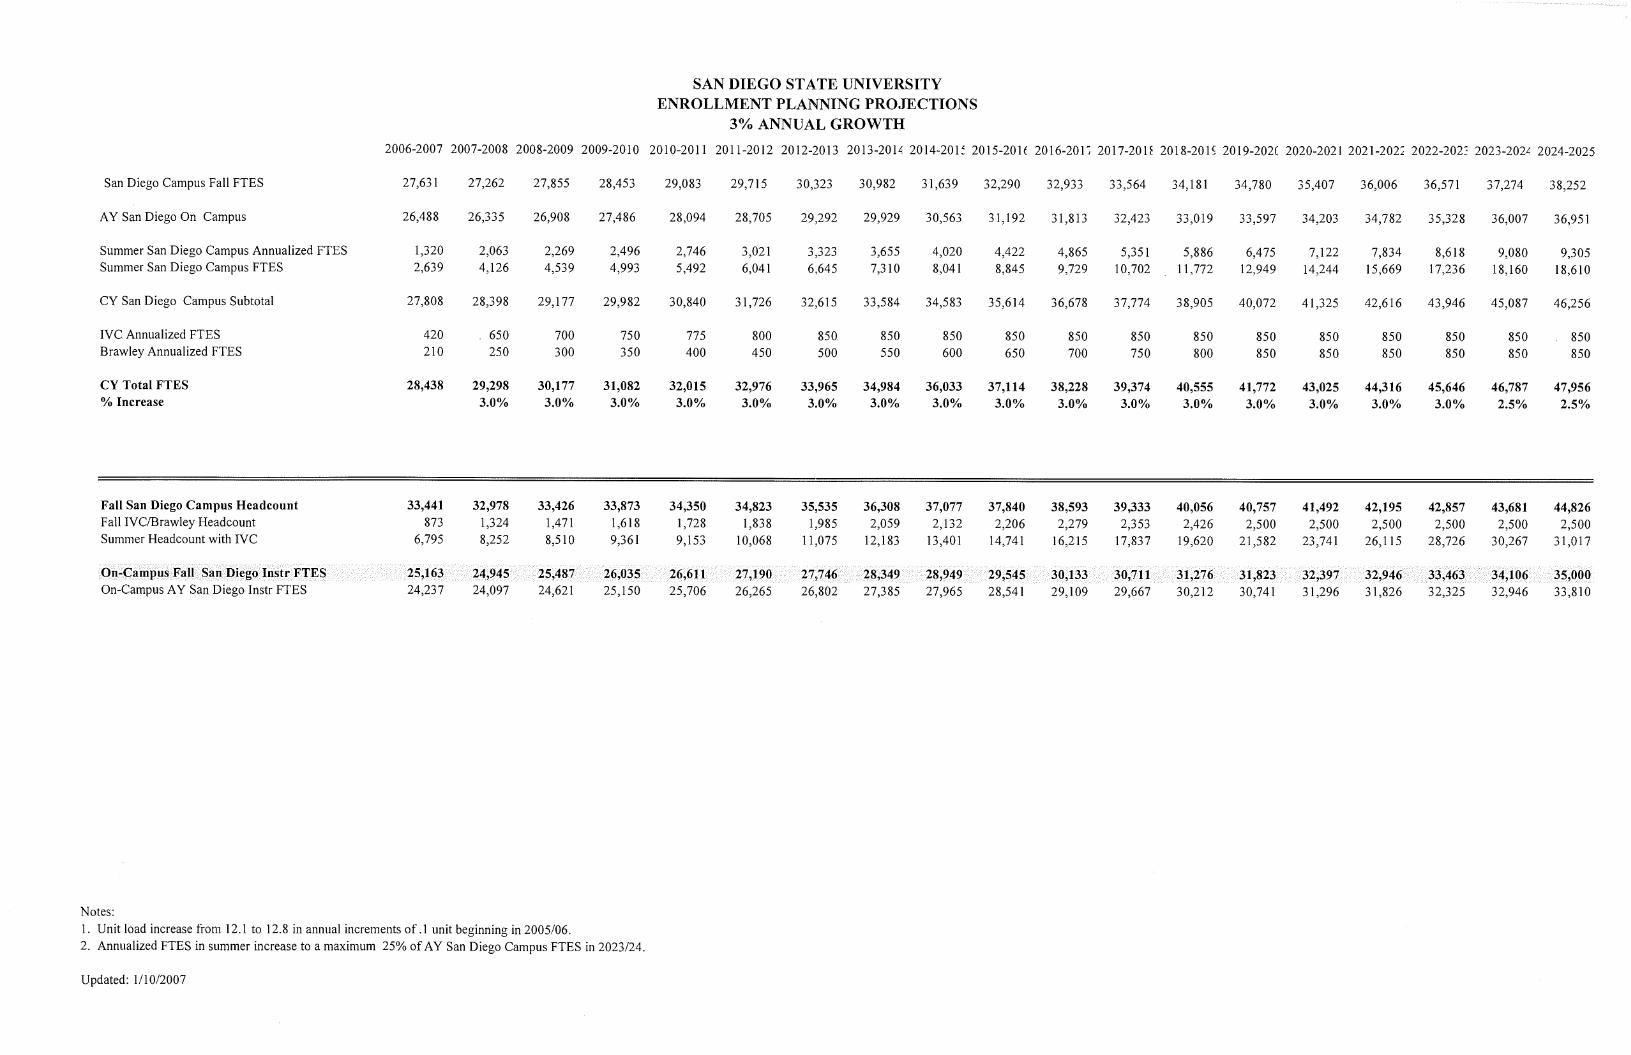
SAN DIEGO STATE UNIVERSITY
ENROLLMENT PLANNING PROJECTIONS
3% ANNUAL GROWTH
2006-2007 2007-2008 2008-2009 2009-2010 2010-2011 2011-2012 2012-2013 2013-2014 2014-201~ 2015-2016 2016-201; 2017-201~ 2018-2015 2019-202( 2020-2021 2021-202; 2022-202: 2023-2024 2024-2025
San Diego Campus Fall FTES 27,631 27,262 27,855 28,453 29,083 29,715 30,323 30,982 31,639 32,290 32,933 33,564 34,181 34,780 35,407 36,006 36,571 37,274 38,252
AY San Diego On Campus 26,488 26,335 26,908 27,486 28,094 28,705 29,292 29,929 30,563 31,192 31,813 32,423 33,019 33,597 34,203 34,782 35,328 36,007 36,951
Summer San Diego Campus Annualized FTES 1,320 2,063 2,269 2,496 2,746 3,021 3,323 3,655 4,020 4,422 4,865 5,351 5,886 6,475 7,122 7,834 8,618 9,080 9,305 Summer San Diego Campus FTES 2,639 4,126 4,539 4,993 5,492 6,041 6,645 7,310 8,041 8,845 9,729 10,702 11,772 12,949 14,244 15,669 17,236 18,160 18,610
CY San Diego Campus Subtotal 27,808 28,398 29,177 29,982 30,840 31,726 32,615 33,584 34,583 35,614 36,678 37,774 38,905 40,072 41,325 42,616 43,946 45,087 46,256
IVC Annualized FTES 420 . 650 700 750 775 800 850 850 850 850 850 850 850 850 850 850 850 850 850 Brawley Annualized FTES 210 250 300 350 400 450 500 550 600 650 700 750 800 850 850 850 850 850 850
CY Total FTES 28,438 29,298 30,177 31,082 32,015 32,976 33,965 34,984 36,033 37,114 38,228 39,374 40,555 41,772 43,025 44,316 45,646 46,787 47,956 % Increase 3.0% 3.0% 3.0% 3.0% 3.0% 3.0% 3.0% 3.0% 3.0% 3.0% 3.0% 3.0% 3.0% 3.0% 3.0% 3.0% 2.5% 2.5%
Fall San Diego Campus Headcount 33,441 32,978 33,426 33,873 34,350 34,823 35,535 36,308 37,077 37,840 38,593 39,333 40,056 40,757 41,492 42,195 42,857 43,681 44,826 Fall IVC/Brawley Headcount 873 1,324 1,471 1,618 1,728 1,838 1,985 2,059 2,132 2,206 2,279 2,353 2,426 2,500 2,500 2,500 2,500 2,500 2,500 Summer Headcount with IVC 6,795 8,252 8,510 9,361 9,153 10,068 11,075 12,183 13,401 14,741 16,215 17,837 19,620 21,582 23,741 26,115 28,726 ?0,267 31,017
O~Ca~~s~FalcxS~n ni~g~ Pgsf~~ESI '~~~~63~1~~~,~~aa~!I~- 25~87; :i26;035 127,1901 27,746~~~1~:28;3491 !1~ !28,9~81 29,545 30,133~:i ::30,7f 1 31,276 .-31,23 32,39 On-Campus AY San Diego Instr FTES 24,237 24,097 24,621 25,150 25,706 26,265 26,802 27,385 27,965 28,541 29,109 29,667 0,2;2 30,741 31,296 31,826 32,325 32,946 33,810
Notes:
i. Unit load increase from 12.1 to 12.8 in annual increments of.l unit beginning in 2005/06. 2. Annualized FTES in summer increase to a maximum 25% ofAY San Diego Campus FTES in 2023/24.
Updated: 1/10/2007