proposed existing environment study plan package
TRANSCRIPT
Placer County Water Agency Middle Fork American River Hydroelectric Project
(FERC No. 2079)
Proposed Existing Environment Study Plan Package
Placer County Water Agency P.O. Box 6570
Auburn, CA 95604
January 28, 2005
Table of Contents
Copyright 2005 by Placer County Water Agency i January 2005
TABLE OF CONTENTS
Page
1.0 Introduction ...........................................................................................................1-1 2.0 Resource Agency Interaction Schedule ................................................................2-1 3.0 Physical Habitat Characterization Study Plan .......................................................3-1
3.1 Introduction........................................................................................................3-1 3.2 Geographic Setting............................................................................................3-4 3.3 Geomorphology Study Plan...............................................................................3-5
3.3.1 Study Objectives ........................................................................................3-5 3.3.2 General Approach ......................................................................................3-5 3.3.3 Phase 1 Study Methodology.......................................................................3-6 3.3.4 Phase 2 Study Methodology.......................................................................3-9 3.3.5 Quality Assurance/Quality Control............................................................3-10 3.3.6 Reporting..................................................................................................3-10 3.3.7 Schedule Milestones ................................................................................3-11
3.4 Riparian Habitat Mapping Study Plan..............................................................3-11 3.4.1 Study Objective ........................................................................................3-11 3.4.2 General Approach ....................................................................................3-12 3.4.3 Phase 1 Study Methodology.....................................................................3-12 3.4.4 Phase 2 Study Methodology.....................................................................3-14 3.4.5 Quality Assurance/ Quality ControlProcedures ........................................3-15 3.4.6 Reporting..................................................................................................3-15 3.4.7 Schedule Milestones ................................................................................3-16
3.5 Aquatic Habitat Characterization Study Plan...................................................3-16 3.5.1 Study Objectives ......................................................................................3-16 3.5.2 General Approach ....................................................................................3-16 3.5.3 Study Methodology...................................................................................3-17 3.5.4 Quality Control Procedures ......................................................................3-22 3.5.5 Reporting..................................................................................................3-22 3.5.6 Schedule Milestones ................................................................................3-22
3.6 References ......................................................................................................3-23
Table of Contents
Copyright 2005 by Placer County Water Agency ii January 2005
4.0 Water Temperature Study Plan.............................................................................4-1 4.1 Introduction........................................................................................................4-1 4.2 Study Objectives................................................................................................4-2 4.3 General Approach .............................................................................................4-2 4.4 Study Methods...................................................................................................4-2
4.4.1 Stream Water Temperature Monitoring ......................................................4-2 4.4.2 Reservoir Water Temperature Profiling ....................................................4-10 4.4.3 Meteorological Data .................................................................................4-12
4.5 Reporting.........................................................................................................4-13 4.6 Schedule Milestones .......................................................................................4-13 4.7 References ......................................................................................................4-17
5.0 Hydrology Study Plan............................................................................................5-1 5.1 Introduction........................................................................................................5-1 5.2 Study Objectives................................................................................................5-1
5.2.1 General Approach ......................................................................................5-1 5.3 Study Methods...................................................................................................5-2
5.3.1 Stream Flow and Storage Data Collection..................................................5-2 5.3.2 Data Analysis Procedures ..........................................................................5-7
5.4 Reporting...........................................................................................................5-9 5.5 Schedule Milestones .......................................................................................5-10 5.6 References ......................................................................................................5-10
Table of Contents
Copyright 2005 by Placer County Water Agency i January 2005
LIST OF FIGURES
Page
Figure 1-1. Principle Project Facilities and Geographic Setting. ...............................1-3
Figure 2-1. Existing Environment Study Plan Schedule (2005-2006)........................2-2
Figure 3-1. Integration of Physical Habitat Characterization Studies (2005-2006)....3-2
Figure 4-1. MFP Water Temperature Monitoring Station Array (including existing and proposed stations). .................................................................................4-3
Figure 4-2. Location of Currrent and Proposed Water Temperature Monitoring Stations.................................................................................................4-14
Figure 5-1. Gage Station Locations...........................................................................5-5
Table of Contents
Copyright 2005 by Placer County Water Agency ii January 2005
LIST OF TABLES
Page
Table 3-1. Hawkins et al. (1993) Level I and Level II Habitat Classifications.............3-18
Table 3-2. Habitat Types and Codes Adapted from McCain et al. (1990). ................3-19
Table 3-3. Description of Spawning Gravel Quality. ..................................................3-21
Table 4-1. Current and Proposed Water Temperature Monitoring Locations Associated with the MFP, and their Operational Status and Proposed Download Frequency. ................................................................................. 4-4
Table 4-2. Current and Proposed Meteorological Monitoring Locations Associated with the MFP, and their Installation Dates, Status and Proposed Download Frequencies. ............................................................................................. 4-15
Table 5-1. USGS Gaging Stations (Middle- and North-Fork American Rivers). ..........5-3
Appendices
Appendix A. Project Description Placer County Water Agency Middle Fork American River Hydroelectric Project (FERC Project No. 2079)
Appendix B. Summary of Stream and Reservoir Water Temperature Pilot Program
Table of Contents
Copyright 2005 by Placer County Water Agency iii January 2005
Glossary and Acronyms
Afterbay – a impounded water body receiving the discharge of a powerhouse
Cfs – A measure of flow; cubic feet per second.
CDEC – California Data Exchange Center
DWR – Department of Water Resources
EPA – Environmental Protection Agency
FERC – Federal Energy Regulatory Commission
FERC Project Boundary – The legal boundary contained within the current FERC license. Generally the area of the major project facilities with a narrow (1/4 mile buffer) surrounding them.
FPUD – Foresthill Public Utility District
Forebay – A impounded water body that provides water to a powerhouse usually via a tunnel or penstock.
GPUD – Georgetown Public Utility District
IHA – Indicators of Hydraulic Alteration – A method for evaluating and calculating up to 32 hydrologic parameters, which are used to compare the degree of hydrologic alteration on the magnitude, timing, frequency, duration, and rate of change in a system using biologically relevant variables.
Integrated Licensing Process – FERC process for conducting a relicensing program by a licensee.
ILP – Integrated Licensing Process
Logger – A devise used to record data.
MET Station – A station that measures specific meteorological parameters such as wind speed, wind direction, solar radiation, precipitation and air temperature.
MFP – Middle Fork American River Hydroelectric Project
Montgomery-Buffington Classification – A classification system used to organize stream morphology into seven reach types based on distinctive bed morphology.
Non-Project Facilities – facilities associated with construction and operation of the Project that are not within the Project Boundary but which are maintained and used by the Agency incidental to the operation and maintenance of the Project.
Table of Contents
Copyright 2005 by Placer County Water Agency iv January 2005
PCWA – Placer County Water Agency
Pre-Project – period prior to construction of the MFP
Post-Project – period after completion of construction of the MFP
Project – The Middle Fork American River Hydroelectric Project, FERC Project No. 2079
Project Area – the general geographic area within which the Project occurs – generally the Middle Fork American River from below the Oxbow Powerhouse, upstream to above the French Meadows Reservoir, the Rubicon River from it’s confluence with the Middle Fork American River upstream to the Hell Hole Reservoir and the Duncan Creek and Long Canyon Creek drainages.
Project Facilities – Those facilities contained within the FERC Project Boundary and identified in the FERC license.
Relicensing Program – Activities conducted by the Agency in conformance with FERC licensing requirements to obtain a new FERC license for the Project in 2013.
Rosgen Classification – A classification system that uses five primary parameters to describe the morphology of a stream or river channel: gradient, sinuosity, width/depth ratio, bed material size, and degree of confinement.
Stream Reach – A specified stream or river segment.
SMUD – Sacramento Municipal Utility District
Technical Study Area – A geographic area investigated with respect to particular question or scientific issue. May be within or extend beyond the Project Area.
Thalweg – The line defining the lowest points along the length of a riverbed or valley.
USBR – United States Bureau of Reclamation
USFS – United States Forest Service
USGS – United States Geological Survey
Section 1.0 Introduction
Copyright 2005 by Placer County Water Agency 1-1 January 2005
1.0 INTRODUCTION
The Placer County Water Agency (PCWA) owns the Middle Fork American River Hydroelectric Project (MFP or Project), located on the Middle Fork American River, the Rubicon River, and several tributaries in Placer and El Dorado Counties, California. The MFP is a multipurpose project that was designed to supply water for recreation, irrigation, domestic and commercial purposes, and to generate hydroelectric power. The principle Project features are shown on Figure 1-1 and include two primary storage reservoirs, five smaller impoundments, five powerhouses, and water conveyance facilities. The two largest reservoirs, Hell Hole and French Meadows reservoirs, have a combined storage capacity of about 344,000 acre feet. The five powerplants have a combined nameplate generating capacity of approximately 224 megawatts (MWs). A more detailed description of the MFP is included in Appendix A. Note that a glossary of terms used throughout this document precedes this page.
PCWA operates the MFP under the terms of the Federal Energy Regulatory Commission (FERC), License No. 2079. The current license will expire on February 28, 2013, and PCWA will be seeking a new license for the MFP pursuant to the FERC’s Integrated Licensing Process (ILP) regulations. PCWA plans to file a Notice of Intent (NOI) to relicense the MFP with FERC in September 2007. A Pre-Application Document (PAD) will accompany the NOI per FERC regulations. The PAD will include a description of existing environmental resources in the vicinity of the MFP.
To augment resource information currently available, PCWA is planning to implement five environmental studies in 2005- 2006 to collect additional information to enhance the description of environmental resources in the PAD. The Existing Environment Studies will focus on five resource areas: channel geomorphology, riparian habitat, aquatic habitat, water temperature, and hydrology.
PCWA will obtain resource agency concurrence on the study objectives and methodologies for these Existing Environmental Studies prior to implementation. However, PCWA recognizes that additional resource information on these topics and others will need to be collected during the relicensing of the MFP. The purpose of these Existing Environmental Studies is to develop information early in the process that will assist in the development of future, more comprehensive technical studies necessary to evaluate Project effects and develop appropriate protection, mitigation and enhancement measures for the MFP. PCWA plans to consult a broad group of stakeholders (including agencies, Native American tribes, non-governmental organizations and the local community) in 2006-2007 to collaboratively develop comprehensive technical study plans for MFP. These collaboratively developed comprehensive study plans will be included in the PAD and implemented by PCWA in 2007-2009.
The Existing Environment Studies will center on the primary reservoirs, streams, rivers, and Project facilities in the vicinity of the MFP. These include: Hell Hole and French Meadows Reservoirs, Duncan Creek Diversion, North Fork Long Canyon and South Fork Long Canyon Diversions, Middle Fork Interbay, Ralston Afterbay, the Rubicon
Section 1.0 Introduction
Copyright 2005 by Placer County Water Agency 1-2 January 2005
River, the Middle Fork American River, Duncan Canyon Creek and the North and South Forks of Long Canyon Creek. The principle Project features and geographic setting are shown on Figure 1-1.
The remainder of this package includes a schedule followed by individual study plans, which address the five topics identified above, organized as follows:
• Physical Habitat Characterization Study Plan
− Geomorphology Study Plan
− Riparian Habitat Mapping Study Plan
− Aquatic Habitat Characterization Study Plan
• Water Temperature Study Plan
• Hydrology Study Plan In general, the geomorphology, riparian and aquatic habitat mapping study plans will characterize the geomorphic conditions and riparian and aquatic habitat associated with the streams and rivers in the vicinity of the MFP, using established methodologies. The Water Temperature Study Plan describes how PCWA will collect and compile existing water temperature information, profile Project reservoirs, and identify the need for new temperature monitoring stations. The Hydrology Study Plan describes how PCWA will collect and compile existing hydrology information, and how that information can be utilized to perform basic statistical analyses to support the other existing environmental studies described in this package.

Proposed Existing Environment Study Plan Package
Copyright 2005 by Placer County Water Agency January 2005
Placeholder for Figure 1-1
Figure 1-1 Principal Project Facilities & Geographic Setting
Non-Internet Public Information
These Figures have been removed in accordance with the Commission regulations at 18 CFR Section 388.112. These Figures are considered Non-Internet Public information and should not be posted on the Internet. This information may be accessed from the Placer County Water Agency’s (PCWA) Public Reference Room, but is not expected to be posted on PCWA’s Website, except as an indexed item.
Section 2.0 Resource Agency Interaction Schedule
Copyright 2005 by Placer County Water Agency 2-1 January 2005
2.0 RESOURCE AGENCY INTERACTION SCHEDULE
PCWA believes it is important to initiate the Existing Environment Studies early and understands the importance of obtaining the support of the key resource agencies prior to implementing the early studies. Therefore, PCWA developed this Draft Study Plan Package, which summarizes the study objectives and describes how the individual studies will be carried out. The Draft Study Plan Package is being circulated to the key resource agencies for review and comment. PCWA would like to meet with the key resource agencies, during the review and comment period to discuss the plans and to obtain concurrence on study objectives and methodologies.
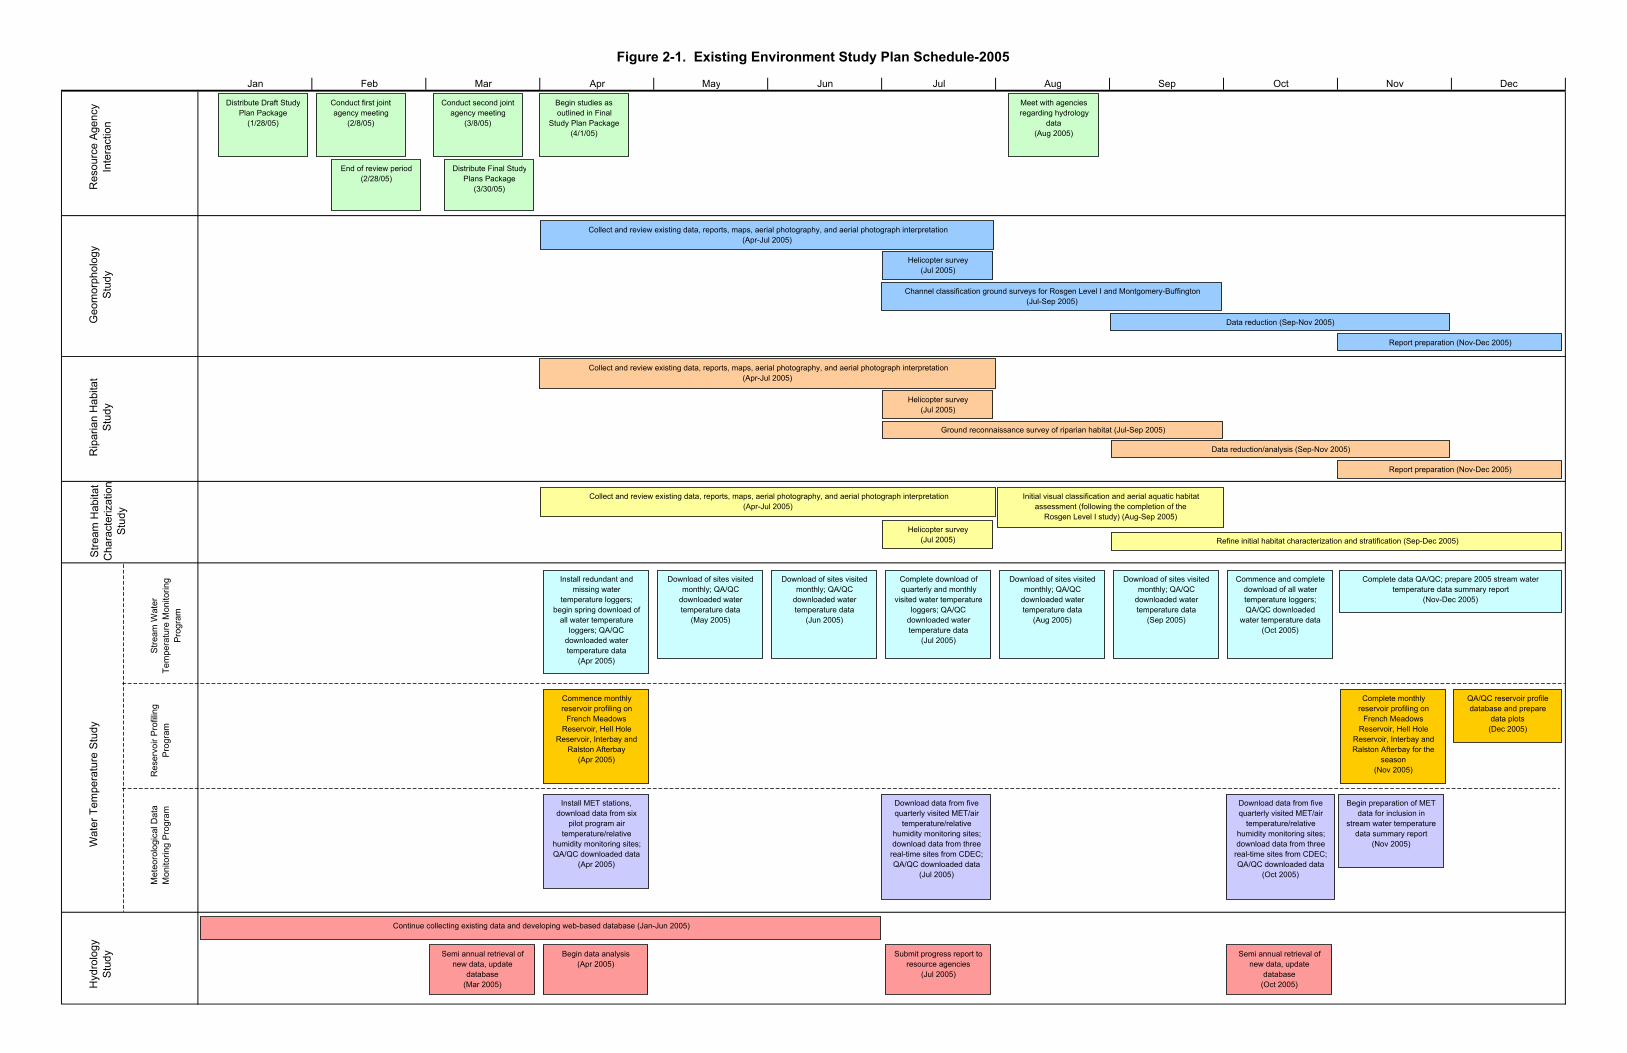
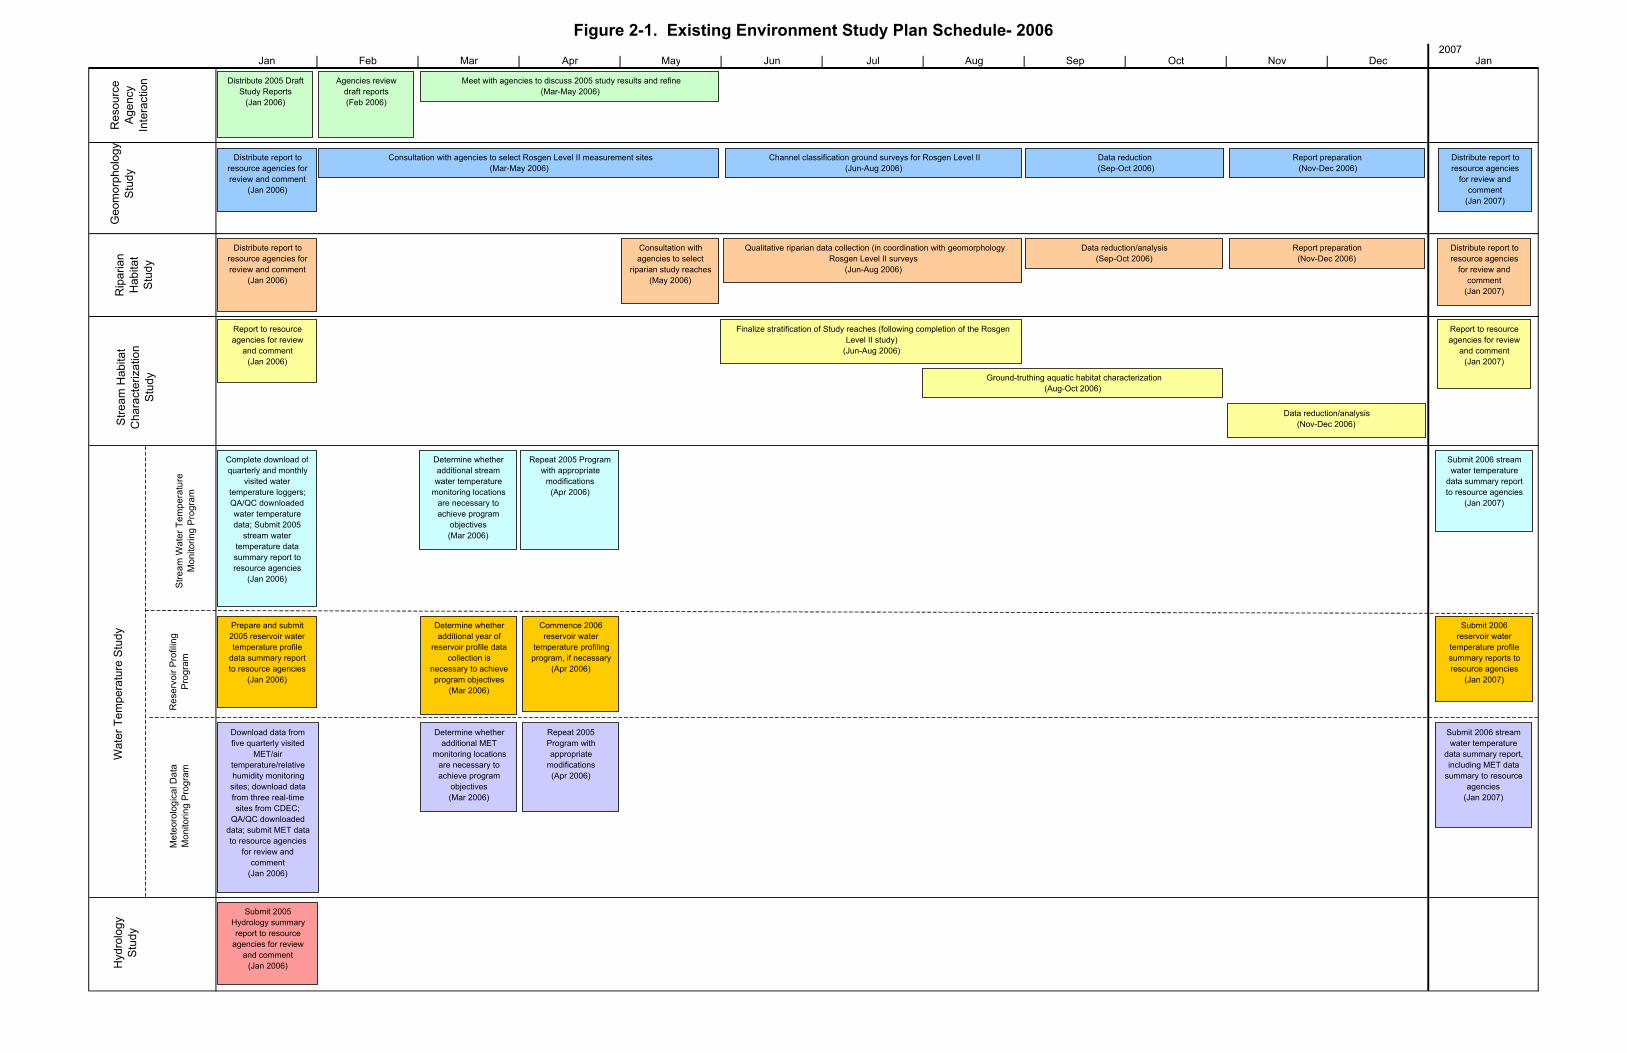
As the studies proceed, PCWA anticipates meeting with the resource agencies periodically to discuss progress, issues, concerns and preliminary results. PCWA will prepare reports summarizing the 2005 study results, which will be provided to the resource agencies in January 2006. Subsequent data collection efforts will be modified based on the 2005 study results and agency input. The results of studies conducted during 2006 will be documented in summary reports, which will be provided to the resource agencies in January 2007. More specific information about schedule, including important field survey and reporting milestones, is included at the end of each of the individual study plans. In addition, the study plan development schedule and major milestones are illustrated in Figure 2-1.
Jan Feb Mar Apr May Jun Jul Aug Sep Oct Nov Dec
Figure 2-1. Existing Environment Study Plan Schedule-2005
Geo
mor
phol
ogy
Stud
y
Collect and review existing data, reports, maps, aerial photography, and aerial photograph interpretation(Apr-Jul 2005)
Collect and review existing data, reports, maps, aerial photography, and aerial photograph interpretation(Apr-Jul 2005)
Collect and review existing data, reports, maps, aerial photography, and aerial photograph interpretation(Apr-Jul 2005)
Res
ourc
e Ag
ency
In
tera
ctio
nSt
ream
Hab
itat
Cha
ract
eriz
atio
n St
udy
Wat
er T
empe
ratu
re S
tudy
Stre
am W
ater
Tem
pera
ture
Mon
itorin
g Pr
ogra
m
Res
ervo
ir Pr
ofilin
g Pr
ogra
mM
eteo
rolo
gica
l Dat
a M
onito
ring
Prog
ram
Distribute Draft StudyPlan Package
(1/28/05)
Conduct first joint agency meeting
(2/8/05)
End of review period(2/28/05)
Conduct second joint agency meeting
(3/8/05)
Distribute Final StudyPlans Package
(3/30/05)
Begin studies as outlined in Final
Study Plan Package(4/1/05)
Hyd
rolo
gySt
udy
Helicopter survey(Jul 2005)
Channel classification ground surveys for Rosgen Level I and Montgomery-Buffington(Jul-Sep 2005)
Data reduction (Sep-Nov 2005)
Report preparation (Nov-Dec 2005)
Helicopter survey(Jul 2005)
Ground reconnaissance survey of riparian habitat (Jul-Sep 2005)
Data reduction/analysis (Sep-Nov 2005)
Report preparation (Nov-Dec 2005)
Initial visual classification and aerial aquatic habitat assessment (following the completion of the
Rosgen Level I study) (Aug-Sep 2005)
Refine initial habitat characterization and stratification (Sep-Dec 2005)
Install redundant and missing water
temperature loggers; begin spring download of
all water temperature loggers; QA/QC
downloaded water temperature data
(Apr 2005)
Download of sites visited monthly; QA/QC
downloaded water temperature data
(May 2005)
Download of sites visited monthly; QA/QC
downloaded water temperature data
(Jun 2005)
Complete download of quarterly and monthly
visited water temperature loggers; QA/QC
downloaded water temperature data
(Jul 2005)
Download of sites visited monthly; QA/QC
downloaded water temperature data
(Aug 2005)
Download of sites visited monthly; QA/QC
downloaded water temperature data
(Sep 2005)
Commence and complete download of all water temperature loggers; QA/QC downloaded
water temperature data(Oct 2005)
Complete data QA/QC; prepare 2005 stream water temperature data summary report
(Nov-Dec 2005)
Commence monthly reservoir profiling on
French Meadows Reservoir, Hell Hole
Reservoir, Interbay and Ralston Afterbay
(Apr 2005)
Complete monthly reservoir profiling on
French Meadows Reservoir, Hell Hole
Reservoir, Interbay and Ralston Afterbay for the
season(Nov 2005)
QA/QC reservoir profile database and prepare
data plots(Dec 2005)
Install MET stations, download data from six
pilot program air temperature/relative
humidity monitoring sites; QA/QC downloaded data
(Apr 2005)
Download data from five quarterly visited MET/air
temperature/relative humidity monitoring sites; download data from three
real-time sites from CDEC; QA/QC downloaded data
(Jul 2005)
Download data from five quarterly visited MET/air
temperature/relative humidity monitoring sites; download data from three
real-time sites from CDEC; QA/QC downloaded data
(Oct 2005)
Begin preparation of MET data for inclusion in
stream water temperaturedata summary report
(Nov 2005)
Continue collecting existing data and developing web-based database (Jan-Jun 2005)
Submit progress report to resource agencies
(Jul 2005)
Semi annual retrieval of new data, update
database(Oct 2005)
Semi annual retrieval of new data, update
database(Mar 2005)
Begin data analysis(Apr 2005)
Meet with agencies regarding hydrology
data(Aug 2005)
Helicopter survey(Jul 2005)
Rip
aria
n H
abita
tSt
udy
2007Jan Feb Mar Apr May Jun Jul Aug Sep Oct Nov Dec Jan
Figure 2-1. Existing Environment Study Plan Schedule- 2006
Wat
er T
empe
ratu
re S
tudy
Complete download of quarterly and monthly
visited water temperature loggers; QA/QC downloaded water temperature data; Submit 2005
stream water temperature data summary report to resource agencies
(Jan 2006)
Distribute report to resource agencies for review and comment
(Jan 2006)
Consultation with agencies to select Rosgen Level II measurement sites (Mar-May 2006)
Channel classification ground surveys for Rosgen Level II(Jun-Aug 2006)
Data reduction (Sep-Oct 2006)
Report preparation (Nov-Dec 2006)
Distribute report to resource agencies for review and comment
(Jan 2006)
Consultation with agencies to select
riparian study reaches(May 2006)
Qualitative riparian data collection (in coordination with geomorphology Rosgen Level II surveys
(Jun-Aug 2006)
Data reduction/analysis(Sep-Oct 2006)
Report preparation(Nov-Dec 2006)
Report to resource agencies for review
and comment(Jan 2006)
Finalize stratification of Study reaches (following completion of the Rosgen Level II study)
(Jun-Aug 2006)
Ground-truthing aquatic habitat characterization(Aug-Oct 2006)
Data reduction/analysis(Nov-Dec 2006)
Determine whether additional stream water temperature
monitoring locations are necessary to achieve program
objectives(Mar 2006)
Repeat 2005 Programwith appropriate
modifications(Apr 2006)
Prepare and submit 2005 reservoir water temperature profile
data summary report to resource agencies
(Jan 2006)
Determine whether additional year of
reservoir profile data collection is
necessary to achieve program objectives
(Mar 2006)
Commence 2006 reservoir water
temperature profiling program, if necessary
(Apr 2006)
Download data from five quarterly visited
MET/air temperature/relative humidity monitoring sites; download data from three real-time sites from CDEC;
QA/QC downloaded data; submit MET data to resource agencies
for review and comment
(Jan 2006)
Determine whether additional MET
monitoring locations are necessary to achieve program
objectives(Mar 2006)
Repeat 2005 Program with appropriate
modifications(Apr 2006)
Submit 2005 Hydrology summary report to resource
agencies for review and comment
(Jan 2006)
Res
ourc
eA
genc
yIn
tera
ctio
n
Geo
mor
phol
ogy
Stu
dyR
ipar
ian
Hab
itat
Stu
dy
Stre
am H
abita
tC
hara
cter
izat
ion
Stu
dy
Stre
am W
ater
Tem
pera
ture
M
onito
ring
Prog
ram
Res
ervo
ir Pr
ofili
ng
Prog
ram
Met
eoro
logi
cal D
ata
Mon
itorin
g Pr
ogra
m
Hyd
rolo
gyS
tudy
Distribute report to resource agencies
for review and comment
(Jan 2007)
Distribute report to resource agencies
for review and comment
(Jan 2007)
Report to resource agencies for review
and comment(Jan 2007)
Submit 2006 stream water temperature
data summary report to resource agencies
(Jan 2007)
Submit 2006 reservoir water
temperature profile summary reports to resource agencies
(Jan 2007)
Submit 2006 stream water temperature
data summary report, including MET data
summary to resource agencies
(Jan 2007)
Distribute 2005 Draft Study Reports
(Jan 2006)
Agencies review draft reports(Feb 2006)
Meet with agencies to discuss 2005 study results and refine(Mar-May 2006)
Section 3.0 Physical Habitat Characterization Study Plan
Copyright 2005 by Placer County Water Agency 3-1 January 2005
3.0 PHYSICAL HABITAT CHARACTERIZATION STUDY PLAN
3.1 INTRODUCTION
The Physical Habitat Characterization Study presents an integrated approach for coordinating early data collection for three inter related study elements: geomorphology, riparian habitat and aquatic habitat. The goal of the study is to characterize geomorphic conditions, identify and describe riparian and meadow habitat, and characterize the existing habitat in the streams upstream and downstream of the Project dams and diversions. The information collected during this early study phase will assist in the design of quantitative studies needed during subsequent phases of the MFP relicensing.
The general approach for these studies is to use a combination of existing information, aerial photography, helicopter surveys, and ground reconnaissance surveys to characterize the geomorphic conditions and riparian and stream habitats. The timing and coordination of data collection and analysis under each study element has been sequenced to allow for integration of information across resource disciplines, while minimizing data collection redundancy among the disciplines and streamlining data collection over time. This process also allows for resource agency input during the study implementation phases to select study sites and refine the technical approaches as new information is developed. Figure 3-1 shows how the three study elements interrelate and how major activities will be sequenced. A summary of information that will be collected during the three study elements is described below.
Existing information relevant to geomorphology, riparian and meadow habitat, and aquatic habitat will be collected, reviewed, and summarized for all stream reaches upstream and downstream of Project facilities and on selective streams for comparison purposes between April and June 2005. During this time, available historical aerial photography will be obtained and reviewed. A time series of historical aerial photographs will be compared beginning in the late 1930s through the present to document changes in geomorphology and riparian habitat that may have occurred over time. Present-day aerial photography will be used to collect information for characterizing the stream channel geomorphology, mapping riparian habitat locations and extent and mapping of stream habitat. Aerial photography interpretations will not be possible along the smaller streams or narrow, deeply entrenched reaches of larger streams. Information on narrow or deeply entrenched stream reaches will be collected through ground surveys, access permitting.
A helicopter survey, including video documentation, will be completed in the summer of 2005 to refine the geomorphic, riparian and aquatic habitat as characterized through interpretation of the aerial photographs. Closed canopies along the smaller streams or deeply entrenched streams may prevent channel, riparian, and aquatic habitat characterization and vegetation mapping along the smaller streams during the helicopter survey.
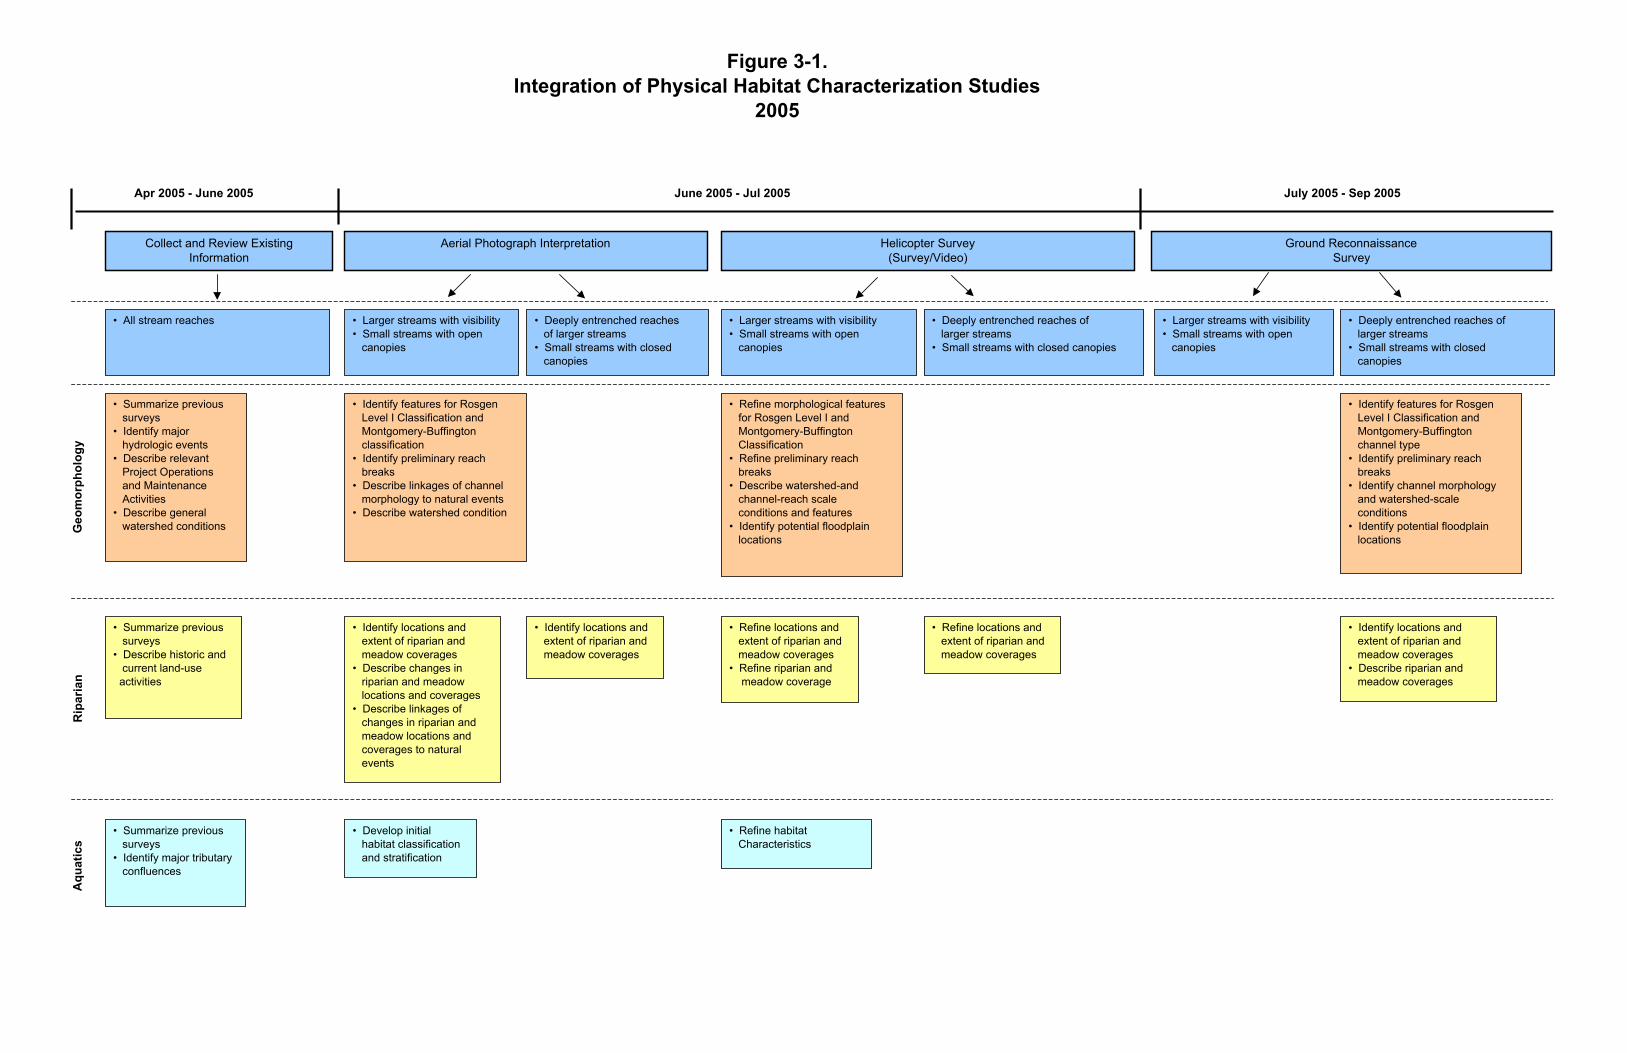
Figure 3-1.Integration of Physical Habitat Characterization Studies
2005
Apr 2005 - June 2005
Collect and Review Existing Information
Aerial Photograph Interpretation Helicopter Survey(Survey/Video)
Ground ReconnaissanceSurvey
Geo
mor
phol
ogy
Rip
aria
nA
quat
ics
• Summarize previous surveys• Identify major hydrologic events• Describe relevant Project Operations and Maintenance Activities• Describe general watershed conditions
• Identify features for Rosgen Level I Classification and Montgomery-Buffington classification• Identify preliminary reach breaks• Describe linkages of channel morphology to natural events• Describe watershed condition
• Summarize previous surveys• Describe historic and current land-use activities
• Summarize previous surveys• Identify major tributary confluences
• Identify locations and extent of riparian and meadow coverages• Describe changes in riparian and meadow locations and coverages • Describe linkages of changes in riparian and meadow locations and coverages to natural events
• Larger streams with visibility• Small streams with open canopies
• Deeply entrenched reaches of larger streams• Small streams with closed canopies
• Develop initial habitat classification and stratification
• Refine habitat Characteristics
June 2005 - Jul 2005 July 2005 - Sep 2005
• Refine morphological features for Rosgen Level I and Montgomery-Buffington Classification• Refine preliminary reach breaks• Describe watershed-and channel-reach scale conditions and features• Identify potential floodplain locations
• Identify features for Rosgen Level I Classification and Montgomery-Buffington channel type• Identify preliminary reach breaks• Identify channel morphology and watershed-scale conditions• Identify potential floodplain locations
• Identify locations and extent of riparian and meadow coverages
• Refine locations and extent of riparian and meadow coverages• Refine riparian and meadow coverage
• Refine locations and extent of riparian and meadow coverages
• Identify locations and extent of riparian and meadow coverages• Describe riparian and meadow coverages
• Deeply entrenched reaches of larger streams• Small streams with closed canopies
• Larger streams with visibility• Small streams with open canopies
• All stream reaches • Larger streams with visibility• Small streams with open canopies
• Deeply entrenched reaches of larger streams• Small streams with closed canopies
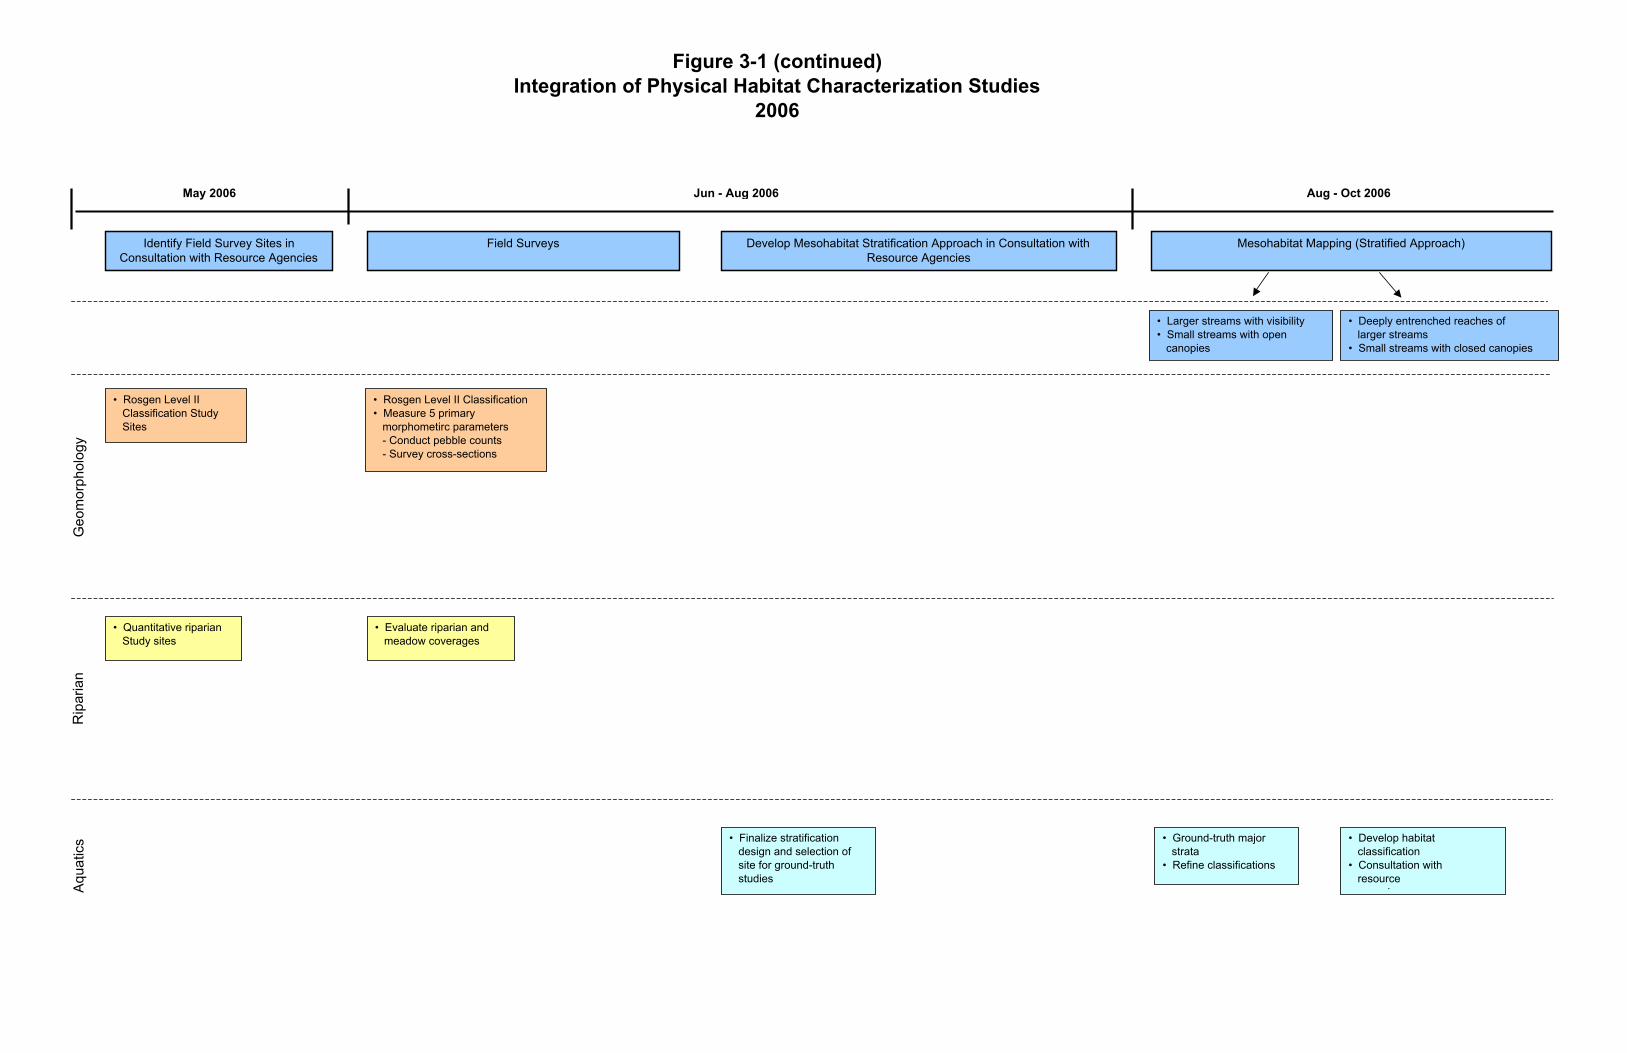
Figure 3-1 (continued)Integration of Physical Habitat Characterization Studies
2006
May 2006
Identify Field Survey Sites in Consultation with Resource Agencies
Field Surveys Develop Mesohabitat Stratification Approach in Consultation with Resource Agencies
Mesohabitat Mapping (Stratified Approach)
Geo
mor
phol
ogy
Rip
aria
nA
quat
ics
• Rosgen Level II Classification Study Sites
• Rosgen Level II Classification• Measure 5 primary morphometirc parameters - Conduct pebble counts - Survey cross-sections
• Quantitative riparian Study sites
• Finalize stratification design and selection of site for ground-truth studies
• Evaluate riparian and meadow coverages
• Larger streams with visibility• Small streams with open canopies
• Deeply entrenched reaches of larger streams• Small streams with closed canopies
• Ground-truth major strata• Refine classifications
• Develop habitat classification• Consultation with resource
agencies
Aug - Oct 2006Jun - Aug 2006
Section 3.0 Physical Habitat Characterization Study Plan
Copyright 2005 by Placer County Water Agency 3-4 January 2005
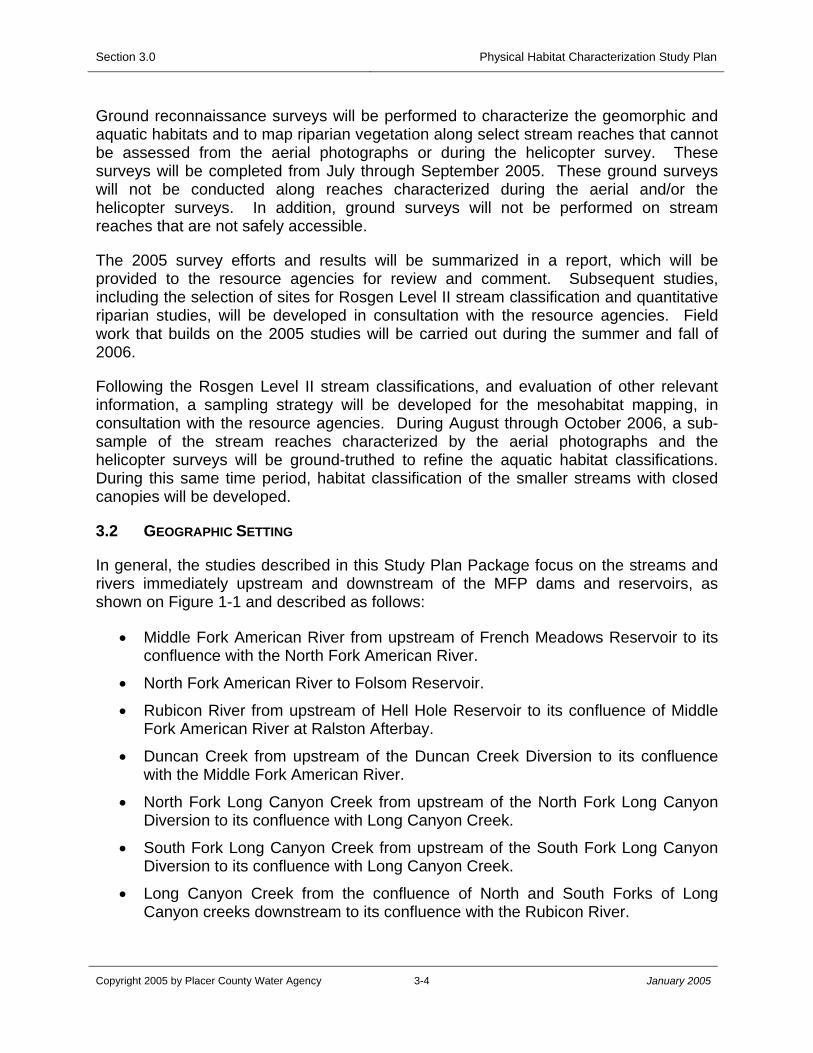
Ground reconnaissance surveys will be performed to characterize the geomorphic and aquatic habitats and to map riparian vegetation along select stream reaches that cannot be assessed from the aerial photographs or during the helicopter survey. These surveys will be completed from July through September 2005. These ground surveys will not be conducted along reaches characterized during the aerial and/or the helicopter surveys. In addition, ground surveys will not be performed on stream reaches that are not safely accessible.
The 2005 survey efforts and results will be summarized in a report, which will be provided to the resource agencies for review and comment. Subsequent studies, including the selection of sites for Rosgen Level II stream classification and quantitative riparian studies, will be developed in consultation with the resource agencies. Field work that builds on the 2005 studies will be carried out during the summer and fall of 2006.
Following the Rosgen Level II stream classifications, and evaluation of other relevant information, a sampling strategy will be developed for the mesohabitat mapping, in consultation with the resource agencies. During August through October 2006, a sub-sample of the stream reaches characterized by the aerial photographs and the helicopter surveys will be ground-truthed to refine the aquatic habitat classifications. During this same time period, habitat classification of the smaller streams with closed canopies will be developed.
3.2 GEOGRAPHIC SETTING
In general, the studies described in this Study Plan Package focus on the streams and rivers immediately upstream and downstream of the MFP dams and reservoirs, as shown on Figure 1-1 and described as follows:
• Middle Fork American River from upstream of French Meadows Reservoir to its confluence with the North Fork American River.
• North Fork American River to Folsom Reservoir.
• Rubicon River from upstream of Hell Hole Reservoir to its confluence of Middle Fork American River at Ralston Afterbay.
• Duncan Creek from upstream of the Duncan Creek Diversion to its confluence with the Middle Fork American River.
• North Fork Long Canyon Creek from upstream of the North Fork Long Canyon Diversion to its confluence with Long Canyon Creek.
• South Fork Long Canyon Creek from upstream of the South Fork Long Canyon Diversion to its confluence with Long Canyon Creek.
• Long Canyon Creek from the confluence of North and South Forks of Long Canyon creeks downstream to its confluence with the Rubicon River.
Section 3.0 Physical Habitat Characterization Study Plan
Copyright 2005 by Placer County Water Agency 3-5 January 2005
The upstream study boundaries of each of the river/stream segments identified above will be determined, in consultation with resource agencies, based on an evaluation of initial channel morphology data and access conditions. In general, the upstream study boundary will terminate at the point where channel morphology is clearly different than the morphology downstream of Project facilities.
It may be necessary to evaluate other streams in the vicinity of the MFP for comparison purposes. The best comparison streams (also referred to as “reference streams” or “reference reaches”) are typically unimpaired by water diversions. At this time, specific comparison streams have not been identified. Potential comparison streams in the vicinity of the MFP will be identified in consultation with the resource agencies as each of the individual studies progress and more information is developed.
3.3 GEOMORPHOLOGY STUDY PLAN
This section describes the geomorphology study component of the Physical Habitat Characterization Plan. It includes a discussion of study objectives, general approach, methods, reporting and schedule.
3.3.1 STUDY OBJECTIVES
The primary purpose of the geomorphology study is to characterize geomorphic conditions of the river channel upstream and downstream from Project dams and diversions. The study objectives are:
• Classify and organize bypass reaches (river reaches downstream of Project dams and/or diversions) into distinct reaches based on stream morphology.
• Distinguish the relative responsiveness (i.e. “sensitivity”) of river reaches to alterations of flow and sediment regimes.
• Describe geomorphic conditions of river reaches immediately upstream of Project facilities to evaluate their suitability to serve as reference reaches in later study phases.
• Identify potential comparison streams (reference reaches) in the vicinity of the MFP if reaches immediately upstream of Project facilities are determined to be unsuitable as reference reaches.
• Provide the framework for organizing future survey efforts.
3.3.2 GENERAL APPROACH
The geomorphology study will be conducted in two phases. Phase 1 will be completed in 2005 and consists of completing a Rosgen Level I and a Montgomery-Buffington classification on stream reaches upstream and downstream from Project dams and diversions. Supporting the stream classification tasks will be a review and description of general watershed conditions including geology and soil types, relative abundance of sediment recruitment to channels from hillslope mass-wasting processes, and a
Section 3.0 Physical Habitat Characterization Study Plan
Copyright 2005 by Placer County Water Agency 3-6 January 2005
description of current and historical land-use activities that may represent anthropogenic influences on channel morphology. Watershed conditions will be evaluated using existing reports and data, aerial photography, and a low-altitude aerial survey.
Phase 2 will be performed in 2006 and will consist of completing Rosgen Level II stream classification at agency–approved sites in each study reach. Agency consultation for Rosgen Level II study site selection will be initiated following distribution and agency review of study results collected during Phase 1.
3.3.3 PHASE 1 STUDY METHODOLOGY
Phase 1 of the geomorphology study will involve the following steps.
Collect and Review Existing Data and Information
Existing data, reports, maps, and aerial photography relevant to the geomorphology study will be collected and reviewed. These data are expected to include source documentation on geology, topography, soils, and land-use (i.e., timber management history, fires, mining, grazing, road development, and water diversions). A preliminary list of reports to be reviewed includes:
• Middle Fork American River Watershed Assessment (Foresthill Ranger District 2003),
• Technical study reports for Pacific Gas and Electric’s (PG&E’s) Chili Bar Project,
• Technical study reports for the Sacramento Municipal Utility District’s (SMUD’s) Upper American River Project,
• Various sediment study reports related to the Ralston Afterbay (PCWA 1997-2003),
• Duncan Canyon/Long Canyon Paired Watershed Study (PCWA 2002).
Aerial Photo Interpretation
PCWA has acquired aerial photography that covers portions of the rivers and streams in the vicinity of the MFP from a private company, Air Photo USA. However, this photography does not cover all of the area that will be evaluated as part of the Existing Environment Studies. Accordingly, PCWA will consult with the United States Forest Service (USFS) – Tahoe and El Dorado Forests - to obtain additional aerial photography covering the streams and rivers in the vicinity of the MFP. PCWA will also search, if necessary, other aerial photograph sources to augment the aerial photography available from the USFS.
Aerial photography available at the USFS-Foresthill Ranger District was briefly inspected to determine its usefulness for evaluating watershed and channel conditions. Specifically, dates of available photography, type, quality, and ability to discern channel features and vegetation were noted. Photographs are also available that document the
Section 3.0 Physical Habitat Characterization Study Plan
Copyright 2005 by Placer County Water Agency 3-7 January 2005
STAR fire, which occurred in August 2001. The photography is most useful where the valley and channel widen, which allows channel features to be more easily discerned. In general, the usefulness of the photography increases with downstream distance from French Meadows Reservoir in the lower portions of the watershed. The closed canopy along most of the smaller streams obscures the ability to view the channel. At this time, the availability of aerial photography for the Rubicon River has not been determined, but will be investigated as part of this study.
The features to be evaluated in the aerial photographs include river planform (i.e., position and sinuosity), channel width, presence of bar deposits (bar type, size, position, frequency), type of bed morphology (pool-riffle, plane-bed, cascade, bedrock, etc), evidence of hillslope mass-wasting, and relative presence of riparian vegetation. The extent to which any particular morphological features can be readily discerned depends on the quality and scale of the photography. The aerial photography will also be used to assist with the Rosgen Level I and Montgomery-Buffington classification tasks described below.
Work products from the aerial photo-interpretation will include a text description of the geomorphic features in the stream reaches that are identifiable in the photography. If the scale of the photography is suitable for viewing in a report format, work products may include reproductions of the aerial photography outlining the particular geomorphic features.
Rosgen Level I and Montgomery-Buffington Channel Classification
Rosgen Level I classification will be completed in 2005 on each of the rivers and streams upstream and downstream of the MFP dams and reservoirs. The Level I classification is a broad characterization of channel morphology that integrates the landform and fluvial features of valley morphology with channel relief, pattern, shape, and dimension. Level I provides a consistent framework for organizing river morphology, and also provides a basis for organizing other inventories such as riparian and aquatic habitat. The following channel attributes are used to determine the Level I classification:
• Slope (from topographic maps)
• Sinuosity (from aerial photographs and topographic maps)
• Width (from aerial photographs and aerial survey)
• Entrenchment (from aerial photographs and aerial survey)
• Valley Type (from geologic maps, aerial photographs, and aerial survey)
Rosgen Level I classification will be based on recent aerial photography, topographic and geologic maps, and an aerial survey of each of the study rivers and streams. Stream gradients will be graphically plotted using the topographic maps. Aerial photography will provide data on stream width, sinuosity, and an approximation of the degree of entrenchment.
Section 3.0 Physical Habitat Characterization Study Plan
Copyright 2005 by Placer County Water Agency 3-8 January 2005
Helicopter Survey
Aerial survey provides an efficient means of organizing channels into relatively uniform reaches based on their morphology. Accordingly, a low-altitude aerial survey by helicopter will be performed to collect additional data on channel morphology and watershed-scale conditions. Observations made from the helicopter will be recorded using various media, including voice recording, video and photographs. Location (latitude and longitude coordinates) will be recorded using GPS technology. The aerial survey will improve the ability to estimate the degree of channel entrenchment compared with aerial photography. The aerial survey will also be used to initially determine bed particle size, which is needed for the Rosgen Level II analysis.
The aerial survey will enhance collection of data on related watershed-scale and channel features and conditions that influence channel morphology including:
• Sediment contributions from large-scale mass-wasting sites
• Depositional features at tributary confluences
• Fine sediment deposits
• Dominant bank materials
• Relative presence of large woody debris
• Potential floodplain locations
Ground Reconnaissance Survey
Some of the stream channels, including the North and South Forks of Long Canyon Creek, are likely to have a dense riparian canopy cover that obscures the channel, limiting the usefulness of the aerial survey and aerial photography for determining Rosgen Level I classification. In these areas, a reconnaissance-level field survey of the channel will be performed where vegetation obscures the channel for the purpose of validating the Level I classification. Measurements of channel dimensions will not be performed during the Level I reconnaissance surveys.
Montgomery-Buffington Classification
A Montgomery-Buffington classification for each of the river/stream segments will also be completed in 2005. The Montgomery-Buffington classification synthesizes stream morphology into seven reach types based on distinctive bed morphology. The seven reach types can then be grouped for analysis into three basic types of channels: colluvial, alluvial, and bedrock. Montgomery-Buffington further classifies alluvial channels into five sub-types: dune-ripple, pool-riffle, plane-bed, step-pool, and cascade. Montgomery-Buffington channel type will be determined during the aerial surveys. For those channels that are not visible from the aerial survey (due to obscuring by the vegetative canopy), the Montgomery-Buffington classification will be
Section 3.0 Physical Habitat Characterization Study Plan
Copyright 2005 by Placer County Water Agency 3-9 January 2005
performed during the reconnaissance field surveys and/or the ground surveys to be performed for the Rosgen Level I classification task.
Work Products
Work products for Phase I of the geomorphology study will include a Level I stream reach classification and Montgomery-Buffington classification delineated on a base map or aerial photography. For mapping purposes, a Level I classified stream reach will have a minimum length of 0.2 miles. The base map will be annotated with the location of the various watershed and channel features listed above. A table will accompany the map to show the data associated with each of the Level I parameters. Channel geomorphic conditions will also be photo-documented during the aerial survey and used to depict selected conditions in the channel geomorphology technical report.
3.3.4 PHASE 2 STUDY METHODOLOGY
Phase 2 will consist of Rosgen Level II channel typing as described in the following section.
Rosgen Level II Classification
Rosgen Level II classification sites will be selected in consultation with the resource agencies, based on the Level I results. Access to some of the streams in the vicinity of the MFP is very limited and may constrain the ability to establish Level II quantification sites.
Level II classification is based on field measurements of five primary morphometric parameters:
• Entrenchment ratio (floodprone width divided by the bankfull width; Wfp/Wbf)
• Width-to-depth ratio (bankfull width divided by the average bankfull depth; Wbf/Dbf)
• Sinuosity (ratio of stream distance to valley distance)
• Water surface slope
• Bed particle size
These morphometric parameters will be measured at each agency-approved Level II quantification site. The measurements will be taken at two to three transects per quantification site. Standard procedures will be used to identify bankfull width using field indicators and to measure bankfull width and flood prone width, as outlined in Stream Channel Reference Sites: An Illustrated Guide to Field Technique (Harrelson et al. 1994). A quantification site will be at least 10 bankfull widths in length. Pebble counts will be performed at each quantification site based on procedures developed by Wolman (1954). Bankfull elevation will first be calibrated at gaging station locations with
Section 3.0 Physical Habitat Characterization Study Plan
Copyright 2005 by Placer County Water Agency 3-10 January 2005
long term gage records, as described by Rosgen (1996). For mapping purposes, a Level II classified stream reach will have a minimum length of 0.2 miles.
Work Products
The work products for Phase 2 of the geomorphology study will consist of Level II stream reach classifications delineated on a base map or aerial photographs. For each quantification site, data associated with each of the Level II parameters will be shown in a tabular format. Transect locations will be photo-documented and monumented with rebar pins, and GPS coordinates recorded so that they can be relocated for future use, if necessary. Transects will be graphically plotted, with bankfull and floodprone widths identified. Pebble counts will be graphically plotted as cumulative particle size distribution curves and frequency histograms.
3.3.5 QUALITY ASSURANCE/QUALITY CONTROL
Staff performing the aerial survey will be provided with both a USGS topographic map and aerial photographs, as available, to record spatial data during the low-altitude helicopter surveys. Stream gradient data obtained from topographic maps will be graphically plotted and checked by another staff geomorphologist. Rosgen Level II data will be collected and recorded onto field data sheets to ensure that all data necessary for classification purposes is obtained. Cross-section surveys will include all major slope breaks to accurately characterize the channel form. Data will be checked in the field before leaving the site to ensure that information has been completely and accurately recorded.
3.3.6 REPORTING
The Phase I Geomorphology Study Report will provide a description of the study objectives, methods, and results. Deliverable work products described in Section 3.3.3 will be incorporated into the report, with text descriptions, tables, graphs, and photographs, as appropriate. All study measurement sites will be identified on a base map. The study report will provide:
• Rosgen Level I and Montgomery-Buffington geomorphic classification results.
• Aerial photo interpretation results, including an over-view of land-use activities in the watershed that may influence channel geomorphology.
• Identification of relative responsiveness of stream reaches to alterations of flow and sediment regimes.
• Description of geomorphic conditions upstream from Project facilities with an explanation of their likely suitability as reference reaches.
• Identification of potential comparison streams (reference reaches), if necessary.
A river mile stationing system divided into 0.1-mile units will be developed in coordination with the key resource agencies and presented on a map. Select streams
Section 3.0 Physical Habitat Characterization Study Plan
Copyright 2005 by Placer County Water Agency 3-11 January 2005
in the vicinity of the MFP will be included in the stationing system. This will provide a consistent and accurate means to identify a specific location on any study stream. All future studies are expected to use the river mile stationing system for geo-referencing purposes.
The Phase II Geomorphology Study Report will provide a description of the study objectives, methods, and the Rosgen Level II geomorphic classification results. Deliverable work products described in Section 3.3.4 will be incorporated into the report, with text descriptions, tables, graphs, and photographs, as appropriate. All study measurement sites will be identified on a base map.
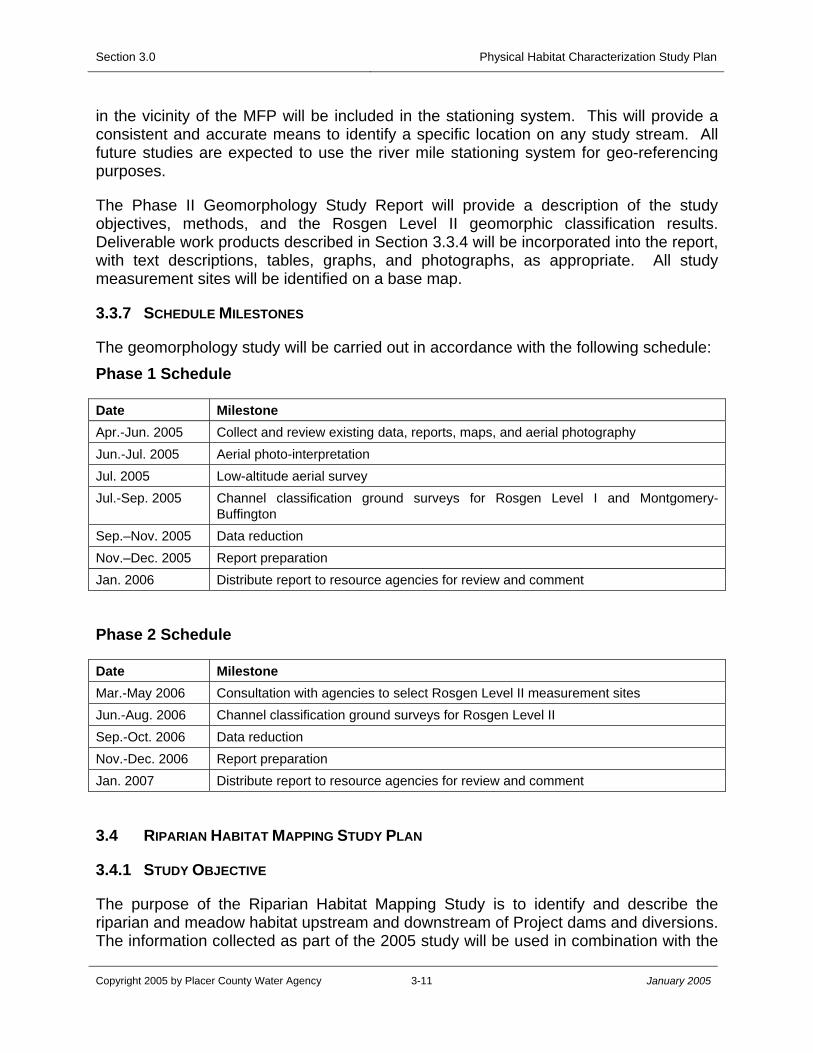
3.3.7 SCHEDULE MILESTONES
The geomorphology study will be carried out in accordance with the following schedule: Phase 1 Schedule
Date Milestone Apr.-Jun. 2005 Collect and review existing data, reports, maps, and aerial photography Jun.-Jul. 2005 Aerial photo-interpretation Jul. 2005 Low-altitude aerial survey Jul.-Sep. 2005 Channel classification ground surveys for Rosgen Level I and Montgomery-
Buffington Sep.–Nov. 2005 Data reduction Nov.–Dec. 2005 Report preparation Jan. 2006 Distribute report to resource agencies for review and comment
Phase 2 Schedule
Date Milestone Mar.-May 2006 Consultation with agencies to select Rosgen Level II measurement sites Jun.-Aug. 2006 Channel classification ground surveys for Rosgen Level II Sep.-Oct. 2006 Data reduction Nov.-Dec. 2006 Report preparation Jan. 2007 Distribute report to resource agencies for review and comment
3.4 RIPARIAN HABITAT MAPPING STUDY PLAN
3.4.1 STUDY OBJECTIVE
The purpose of the Riparian Habitat Mapping Study is to identify and describe the riparian and meadow habitat upstream and downstream of Project dams and diversions. The information collected as part of the 2005 study will be used in combination with the
Section 3.0 Physical Habitat Characterization Study Plan
Copyright 2005 by Placer County Water Agency 3-12 January 2005
geomorphology information as a basis for developing quantitative riparian studies to be performed later in the relicensing process. The study objectives are to:
• Identify the locations of riparian and meadow habitat along the streams and rivers upstream and downstream of the MFP dams and reservoirs,
• Qualitatively describe riparian and meadow habitats ,
• Identify unregulated streams in the vicinity of the MFP that could serve as comparison reaches for subsequent studies, and
• Identify potential historical and existing activities that may have or are currently affecting the development of riparian habitat.
3.4.2 GENERAL APPROACH
The general study approach is to map the riparian and meadow habitat along the streams and rivers upstream and downstream of MFP dams and reservoirs using a combination of existing information, aerial photography, helicopter surveys, and ground surveys. The main purpose of the study will be to collect qualitative information on the riparian habitat to facilitate the planning of subsequent focused riparian studies. Riparian conditions will be evaluated using existing reports and data, including a description of recent historical (beginning in the early 1900’s) land-use activities. Recent aerial photographs will be obtained to document riparian and meadow coverage. This information will be supplemented with information from the geomorphology study regarding channel morphology and watershed conditions.
3.4.3 PHASE 1 STUDY METHODOLOGY
Phase 1 of the riparian habitat study will involve the following steps.
Collect and Review Existing Data and Information
Existing data, including GIS data, reports, maps, and aerial photography relevant to riparian vegetation will be collected and reviewed. These sources are expected to provide documentation on geology, topography, soils, riparian vegetation coverage and type, and land-use (i.e. mining, timber management, recreation, road development, fires, grazing, and water diversions). A preliminary list of reports to be reviewed include:
• Duncan Canyon/Long Canyon Paired Watershed Study (PCWA 2002),
• Technical reports associated with the relicensing of SMUD’s Upper American River Project,
• Middle Fork American River Watershed Assessment (Foresthill Ranger District 2003),
• South Fork American River-Chili Bar Watershed, Lower Middle Fork American River Watershed Landscape and Roads Analyses (El Dorado National Forest 2003),
Section 3.0 Physical Habitat Characterization Study Plan
Copyright 2005 by Placer County Water Agency 3-13 January 2005
• Draft Resource Inventory Folsom Lake State Recreation Area (California Department of Parks and Recreation 2003),
• Sediment Study of Ralston Afterbay (PCWA 1997), and
• Ralston Afterbay Sediment Management Project (PCWA 2001).
Aerial Photograph Interpretation
An important component of the riparian study will be mapping the coverage and location of riparian habitat using recent aerial photography. The aerial photography component of this study will be conducted in coordination with the geomorphology study to minimize duplication of efforts.
All of the streams and rivers upstream and downstream of the MFP dams and reservoirs will be evaluated. However, visibility of the channel and riparian shrub canopy layer may be limited along deeply entrenched reaches of the larger streams and the smaller streams with closed canopies. Differences in channel geomorphic features will be identified as part of the geomorphology study, and will be related to differences in riparian habitat as part of this study.
If the existing aerial photography is available digitally or can be scanned, and the scale, resolution, and quality are suitable for GIS, the extent of riparian coverage will be mapped and digitized, as feasible, and incorporated into GIS. Riparian coverages greater than ¼ acre in size will be displayed as polygons; a continuous or non-continuous narrow riparian corridor will be displayed as solid or dashed lines, respectively; and isolated patches of riparian vegetation that are smaller than ¼ acre in size will be displayed as points. Differences in location or extent can then be analyzed. Meadow areas will also be delineated.
Helicopter Survey
A low-altitude aerial survey by helicopter will be performed to efficiently collect additional information on the coverage and location of riparian habitat, particularly along the stream and river reaches with poor visibility on the aerial photographs. The stream channel will be videotaped during the helicopter flight to document channel and riparian characteristics. However, visibility may still be limited for the deeply entrenched reaches of the larger streams and the smaller streams with closed canopies. The survey will be coordinated with the geomorphology and aquatic habitat studies. During the flight, the location and extent of riparian vegetation will be identified with GPS and mapped on a common base map. The flight will be tape-recorded, and later transcribed. The GPS coordinates, location and extent of riparian coverage, and other observations will be entered into a database and will be used to modify the GIS riparian vegetation mapping on present-day aerial photographs, as needed.
Section 3.0 Physical Habitat Characterization Study Plan
Copyright 2005 by Placer County Water Agency 3-14 January 2005
Ground Survey
Some of the stream channels, including North and South Fork Long Canyon, are likely to have dense riparian or upland cover obscuring the shrub layer (i.e. willows and alders). Reconnaissance field surveys will be conducted at these locations for the purposes of mapping the riparian vegetation along the channel. A botanist/riparian ecologist will accompany the geomorphologists during the Rosgen Level I classification surveys. During the survey, the botanist/riparian ecologist will collect qualitative information on the riparian community, including percent canopy cover (tree, shrub, and ground), dominant species of shrub and tree canopy layers, shrub size classes present, tree size classes present, riparian width, observations of encroachment and recruitment, and evidence of unusual mortality and land use. Observations of bank instability and substrate will also be noted. This information will assist in the identification of locations for subsequent quantitative riparian studies. Ground surveys will only be performed where safe access is possible.
Work Products
The Phase 1 riparian habitat study will result in the following work products:
Work products developed as part of the aerial photo-interpretation effort will include a text description of the coverage and location of riparian habitat that are identifiable in the photography. If the scale, resolution, and quality of the photography are suitable for GIS, work products may include GIS maps and/or aerial photography depicting the location and extent of riparian habitat.
The information collected during the helicopter and ground reconnaissance surveys will be used to revise the GIS base map with the location and extent of the present-day riparian vegetation along the channels. A data table will accompany the base map including GPS coordinates with the extent (polygon, continuous line, non-continuous line, or point) of the riparian vegetation collected from the helicopter survey, and percent canopy cover (tree, shrub, and ground), dominant species of shrub and tree canopy layers, shrub size classes present, tree size classes present, riparian width, observations of encroachment and recruitment, and evidence of unusual mortality and land use collected during the ground surveys.
3.4.4 PHASE 2 STUDY METHODOLOGY
A botanist/riparian ecologist will accompany the geomorphologists during the Rosgen Level II classification tasks (Phase 2 of the geomorphology study), as feasible. The Rosgen Level II reaches will be selected in consultation with the resource agencies. During these Rosgen Level II classification surveys, the botanist/riparian ecologist will collect quantitative information on the riparian community, including plant species composition, percent cover, height and canopy structure, relative density, size classes present, riparian width, observations of encroachment and recruitment, and evidence of unusual mortality, and land use. The data will be collected along the transects surveyed for the geomorphology studies, as feasible, in order to relate riparian habitat
Section 3.0 Physical Habitat Characterization Study Plan
Copyright 2005 by Placer County Water Agency 3-15 January 2005
characteristics to elevation and distance from the channel during later phases of the relicensing process. Plots will be sampled at varying elevations and distances along the transect to evaluate changes in riparian characteristics along these gradients. Observations of bank instability, channel type and substrate will also be noted. The reaches will be photo-documented.
Work Products
Work products include a revised GIS base map with the location and extent of the riparian vegetation along the channels. Quantitative riparian plot data collected will be summarized, and will include text descriptions, tables, graphs, figures, photographs, and maps, as appropriate.
3.4.5 QUALITY ASSURANCE/ QUALITY CONTROLPROCEDURES
Aerial photographic interpretations will be checked for accuracy and completeness by a second ecologist. Mapping completed from the helicopter survey will also be checked by another botanist/ecologist. All data collected onto field datasheets will be checked by the accompanying field crew member. All electronically entered data will be checked for accuracy and completeness against the field data sheets.
3.4.6 REPORTING
The Phase 1 Riparian Habitat Report will provide a description of the study objectives, methods, and results. Deliverable work products described in Section 3.4.3 will be included in the report, with text descriptions, tables, graphs, figures, photographs, and maps, as appropriate. Pertinent GIS layers developed as part of this study will be provided on a common base map.
The riparian habitat mapping will use the same river mile stationing system as used for the geomorphic and aquatic habitat studies. The stationing system will progress in 0.1-mile increments and will include all streams below and immediately above Project diversions and dams. This will provide a consistent and accurate means for identification of specific locations for all studies. Future studies are expected to use the river mile stationing system for georeferencing purposes.
The study report will identify and describe: 1) the present-day riparian and meadow habitats within the area of investigation; 2) locations that are most susceptible to fluvial geomorphic change; and 3) unregulated streams that could serve as comparison streams for subsequent studies.
The Phase 2 Riparian Habitat Report will provide a description of the study objectives, methods, and results of the qualitative riparian mapping. The text will also include documentation of the selection process of the reaches for the 2006 studies. Deliverable work products, described in Section 3.4.4, will be included, with text descriptions, tables, graphs, figures, photographs, and maps, as appropriate. Any pertinent GIS layers will be provided on a common base map.
Section 3.0 Physical Habitat Characterization Study Plan
Copyright 2005 by Placer County Water Agency 3-16 January 2005
3.4.7 SCHEDULE MILESTONES
The riparian studies will be carried out in accordance with the following schedule.
Phase 1 Schedule
Date Milestone Apr.–Jul. 2005 Collect and review existing data, reports, maps, and aerial photography and aerial
photograph interpretation July 2005 Helicopter survey Jul.–Sep. 2005 Ground reconnaissance survey of riparian habitat Sep.–Nov. 2005 Data reduction/analysis Nov.–Dec. 2005 Report preparation Jan. 2006 Distribute report to resource agencies for review and comment
Phase 2 Schedule
Date Milestone May 2006 Consultation with agencies to select riparian study reaches Jun.–Aug. 2006 Qualitative riparian data collection (in coordination with geomorphology Rosgen
Level II surveys) Sep.–Oct. 2006 Data reduction/analysis Nov.–Dec. 2006 Report preparation Jan. 2007 Distribute report to resource agencies for review and comment
3.5 AQUATIC HABITAT CHARACTERIZATION STUDY PLAN
3.5.1 STUDY OBJECTIVES
The purpose of the Aquatic Habitat Characterization Study is to develop information regarding the types and distributions of stream habitats in stream and river reaches upstream and downstream of Project dams and reservoirs. Aquatic habitat immediately upstream of Project facilities will be characterized and assessed as potential reference sites for future technical studies. Habitat information is important in developing an understanding of the factors that influence the distribution and abundance of fish and other stream organisms. Information developed in this study will also be used to design future technical studies involving aquatic resources.
3.5.2 GENERAL APPROACH
The streams and rivers in the vicinity of the MFP are characterized by long stretches of steep terrain with limited access points. These conditions contribute to potential safety concerns for fieldwork conducted in the most rugged and isolated areas. In order to
Section 3.0 Physical Habitat Characterization Study Plan
Copyright 2005 by Placer County Water Agency 3-17 January 2005
characterize habitats under these conditions, an approach has been developed that combines the use of stratification of stream reaches (based on habitat-forming and geomorphologic characteristics), and classification of habitats using aerial imagery and helicopter reconnaissance, with focused ground-truthing of habitats by strata. All major strata that are reasonably accessible will be ground truthed.
In order to achieve the study objective, the following approach will be utilized:
• Review existing reports, topographic maps, geological maps, hydrologic units and contributing watershed areas, and other available materials.
• Stratify and classify habitats in the study streams based on review of existing information, Rosgen Level I geomorphologic classifications, topographic maps, and aerial imagery.
• Evaluate habitats and strata in the field using helicopter reconnaissance for confirmation and a higher level of resolution.
• Incorporate Rosgen Level II information for finalization of strata.
• Select habitats in portions of major strata to be ground-truthed in consultation with resource agencies.
• Ground-truth habitats in representative lengths of major strata.
A percentage of each major stratum will be ground-truthed based on the size of stream, the amount of canopy, and access. Efforts will focus on areas that are less amenable to habitat characterization by aerial imagery and helicopter reconnaissance. In areas of heavy canopy, 30 to 50 percent of the stream length will be classified on the ground, depending upon access conditions. For stream strata, habitat classifications with little or no canopy, which are most amenable to the proposed visual classification, 20 to 30 percent of habitats of major strata will be ground-truthed.
3.5.3 STUDY METHODOLOGY
Due to the inaccessibility to large segments of the streams and rivers in the vicinity of the MFP, aquatic habitat will be characterized based on a combination of visual classification and a stratified approach to ground-level study. The study stream reaches will be initially stratified based on stream size, Project facilities, major hydrologic features, major changes in stream substrate and geology, elevation changes, Rosgen Level I analysis, differences in riparian vegetation, major sediment inputs, and land-use activities. The information will be developed based on aerial imagery, topographical maps, geological maps, the Rosgen Level I classification results, and results of riparian analyses.
Initial classification of habitats will be based on aerial imagery and a helicopter reconnaissance survey. Depending upon the type of aerial imagery available, GIS may be used to assist in defining habitat lengths, widths, and locations. The helicopter reconnaissance survey will include visual assessment and videotaping of selected
Section 3.0 Physical Habitat Characterization Study Plan
Copyright 2005 by Placer County Water Agency 3-18 January 2005
reaches. Emphasis will be placed on areas that were difficult to resolve from the aerial imagery.
The strata and sites to be ground truthed will be chosen in consultation with the resource agencies after completion of the initial visual classification and the Rosgen Level II geomorphic classification. Access will be an important consideration during the selection of sites to be ground-truthed.
Visual Classification Methods
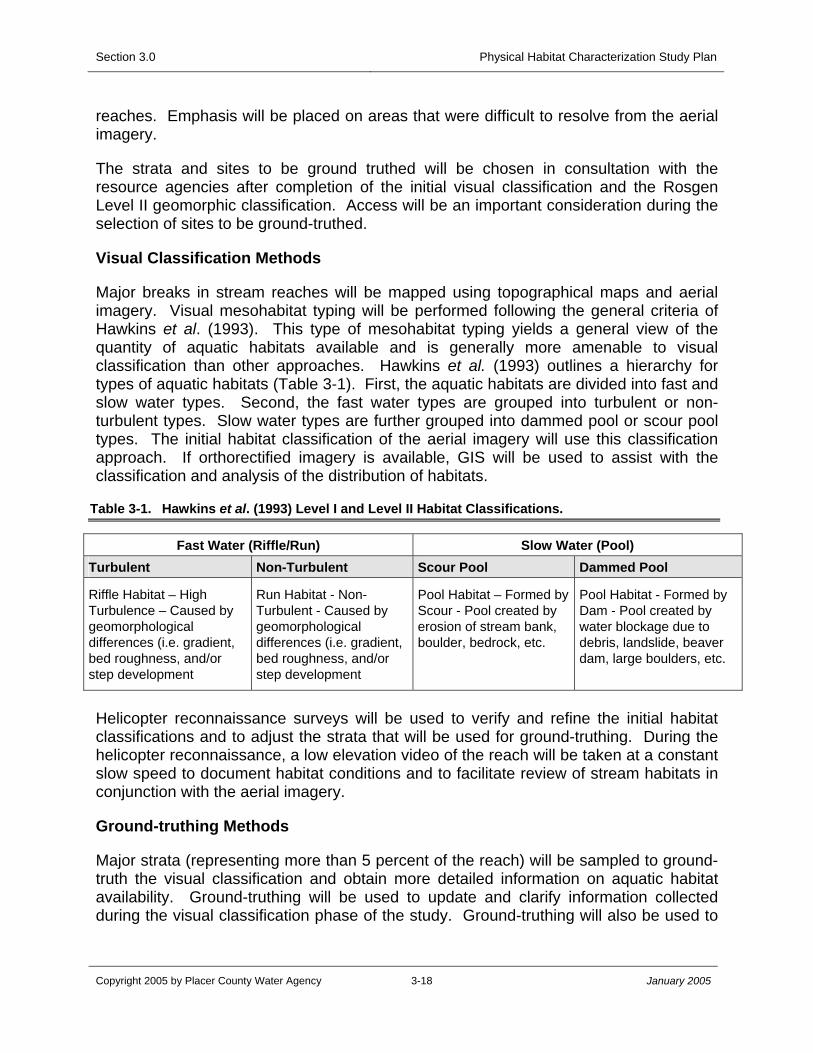
Major breaks in stream reaches will be mapped using topographical maps and aerial imagery. Visual mesohabitat typing will be performed following the general criteria of Hawkins et al. (1993). This type of mesohabitat typing yields a general view of the quantity of aquatic habitats available and is generally more amenable to visual classification than other approaches. Hawkins et al. (1993) outlines a hierarchy for types of aquatic habitats (Table 3-1). First, the aquatic habitats are divided into fast and slow water types. Second, the fast water types are grouped into turbulent or non-turbulent types. Slow water types are further grouped into dammed pool or scour pool types. The initial habitat classification of the aerial imagery will use this classification approach. If orthorectified imagery is available, GIS will be used to assist with the classification and analysis of the distribution of habitats.
Table 3-1. Hawkins et al. (1993) Level I and Level II Habitat Classifications.
Fast Water (Riffle/Run) Slow Water (Pool) Turbulent Non-Turbulent Scour Pool Dammed Pool
Riffle Habitat – High Turbulence – Caused by geomorphological differences (i.e. gradient, bed roughness, and/or step development
Run Habitat - Non-Turbulent - Caused by geomorphological differences (i.e. gradient, bed roughness, and/or step development
Pool Habitat – Formed by Scour - Pool created by erosion of stream bank, boulder, bedrock, etc.
Pool Habitat - Formed by Dam - Pool created by water blockage due to debris, landslide, beaver dam, large boulders, etc.
Helicopter reconnaissance surveys will be used to verify and refine the initial habitat classifications and to adjust the strata that will be used for ground-truthing. During the helicopter reconnaissance, a low elevation video of the reach will be taken at a constant slow speed to document habitat conditions and to facilitate review of stream habitats in conjunction with the aerial imagery.
Ground-truthing Methods
Major strata (representing more than 5 percent of the reach) will be sampled to ground-truth the visual classification and obtain more detailed information on aquatic habitat availability. Ground-truthing will be used to update and clarify information collected during the visual classification phase of the study. Ground-truthing will also be used to
Section 3.0 Physical Habitat Characterization Study Plan
Copyright 2005 by Placer County Water Agency 3-19 January 2005
develop additional detailed information that will assist in the identification of candidate sites for potential additional studies.
Study streams will be classified into three categories based on aerial imagery: 1) large streams with little to no canopy; 2) small streams with little to no canopy; and 3) small streams with heavy canopy. For streams with little to no canopy (both large and small streams), 20 to 30 percent of the length of each major strata type will be ground-truthed. In streams with heavy canopy, 30 to 50 percent of the length of reach of each major strata type will be ground-truthed if reasonably accessible. Stream segments proposed for ground truthing will be selected in consultation with the resource agencies.
During ground-truthing surveys in representative river/stream reaches, mesohabitat typing will be performed following the procedures and criteria of both Hawkins et al. (1993) and the more detailed information of McCain et al. 1990. In general, mesohabitat units represent the basic stream channel structure that aquatic organisms use for shelter, feeding, spawning, rearing or other activities. The relative abundance and distribution of the types of structures can be linked to the particular geomorphology of the stream channel. Substrate, including the presence of fines and spawning substrate, pool depth, riparian vegetation, and woody debris will be characterized and recorded. Potential fish passage barriers will be identified, described and located in the field.
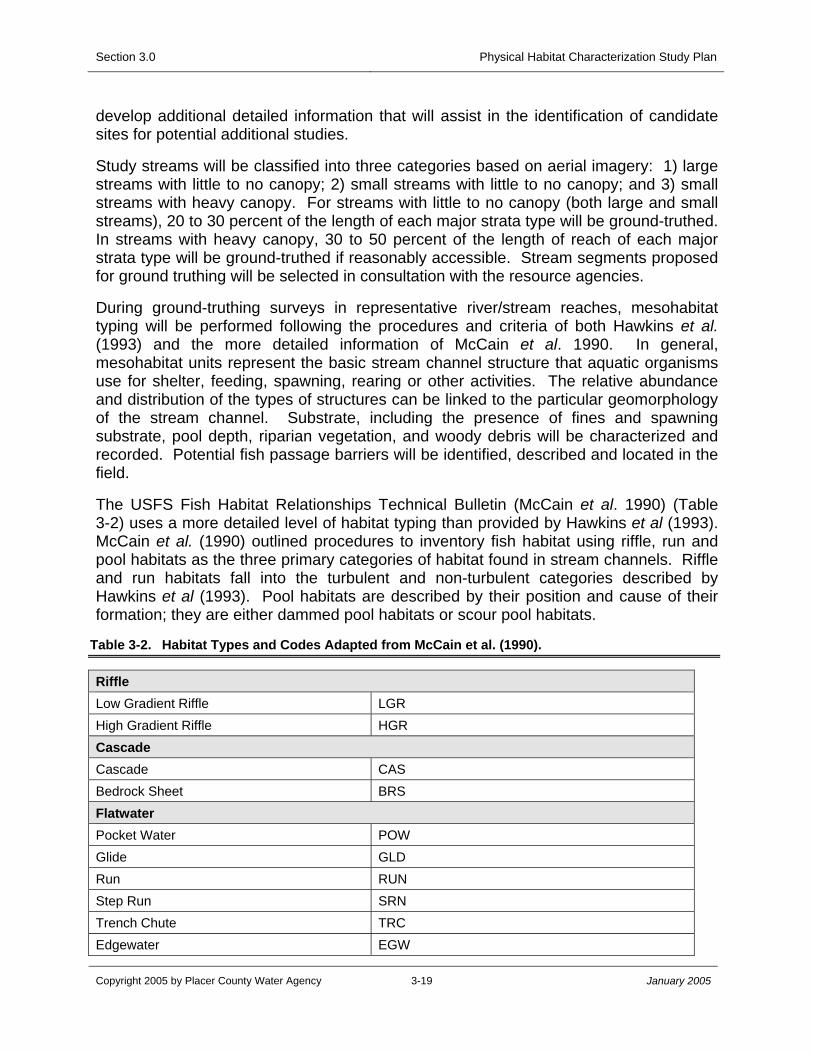
The USFS Fish Habitat Relationships Technical Bulletin (McCain et al. 1990) (Table 3-2) uses a more detailed level of habitat typing than provided by Hawkins et al (1993). McCain et al. (1990) outlined procedures to inventory fish habitat using riffle, run and pool habitats as the three primary categories of habitat found in stream channels. Riffle and run habitats fall into the turbulent and non-turbulent categories described by Hawkins et al (1993). Pool habitats are described by their position and cause of their formation; they are either dammed pool habitats or scour pool habitats.
Table 3-2. Habitat Types and Codes Adapted from McCain et al. (1990).
Riffle Low Gradient Riffle LGR High Gradient Riffle HGR Cascade Cascade CAS Bedrock Sheet BRS Flatwater Pocket Water POW Glide GLD Run RUN Step Run SRN Trench Chute TRC Edgewater EGW
Section 3.0 Physical Habitat Characterization Study Plan
Copyright 2005 by Placer County Water Agency 3-20 January 2005
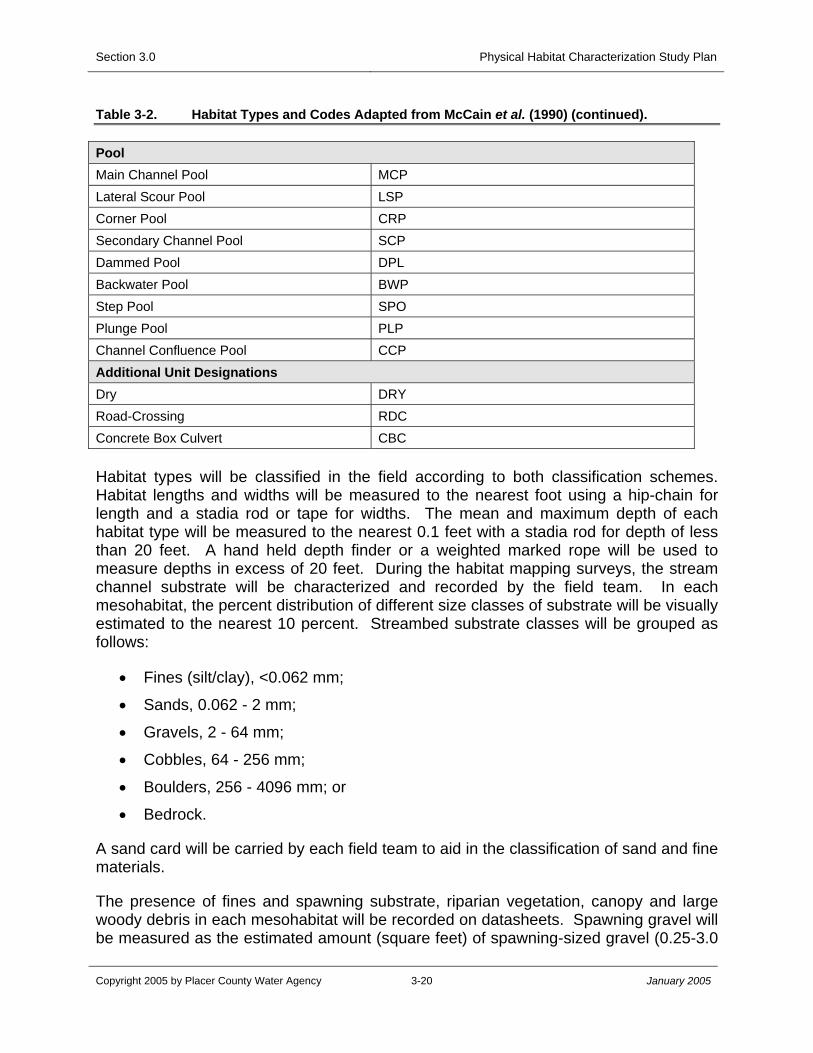
Table 3-2. Habitat Types and Codes Adapted from McCain et al. (1990) (continued).
Pool Main Channel Pool MCP Lateral Scour Pool LSP Corner Pool CRP Secondary Channel Pool SCP Dammed Pool DPL Backwater Pool BWP Step Pool SPO Plunge Pool PLP Channel Confluence Pool CCP Additional Unit Designations Dry DRY Road-Crossing RDC Concrete Box Culvert CBC Habitat types will be classified in the field according to both classification schemes. Habitat lengths and widths will be measured to the nearest foot using a hip-chain for length and a stadia rod or tape for widths. The mean and maximum depth of each habitat type will be measured to the nearest 0.1 feet with a stadia rod for depth of less than 20 feet. A hand held depth finder or a weighted marked rope will be used to measure depths in excess of 20 feet. During the habitat mapping surveys, the stream channel substrate will be characterized and recorded by the field team. In each mesohabitat, the percent distribution of different size classes of substrate will be visually estimated to the nearest 10 percent. Streambed substrate classes will be grouped as follows:
• Fines (silt/clay), <0.062 mm;
• Sands, 0.062 - 2 mm;
• Gravels, 2 - 64 mm;
• Cobbles, 64 - 256 mm;
• Boulders, 256 - 4096 mm; or
• Bedrock.
A sand card will be carried by each field team to aid in the classification of sand and fine materials.
The presence of fines and spawning substrate, riparian vegetation, canopy and large woody debris in each mesohabitat will be recorded on datasheets. Spawning gravel will be measured as the estimated amount (square feet) of spawning-sized gravel (0.25-3.0
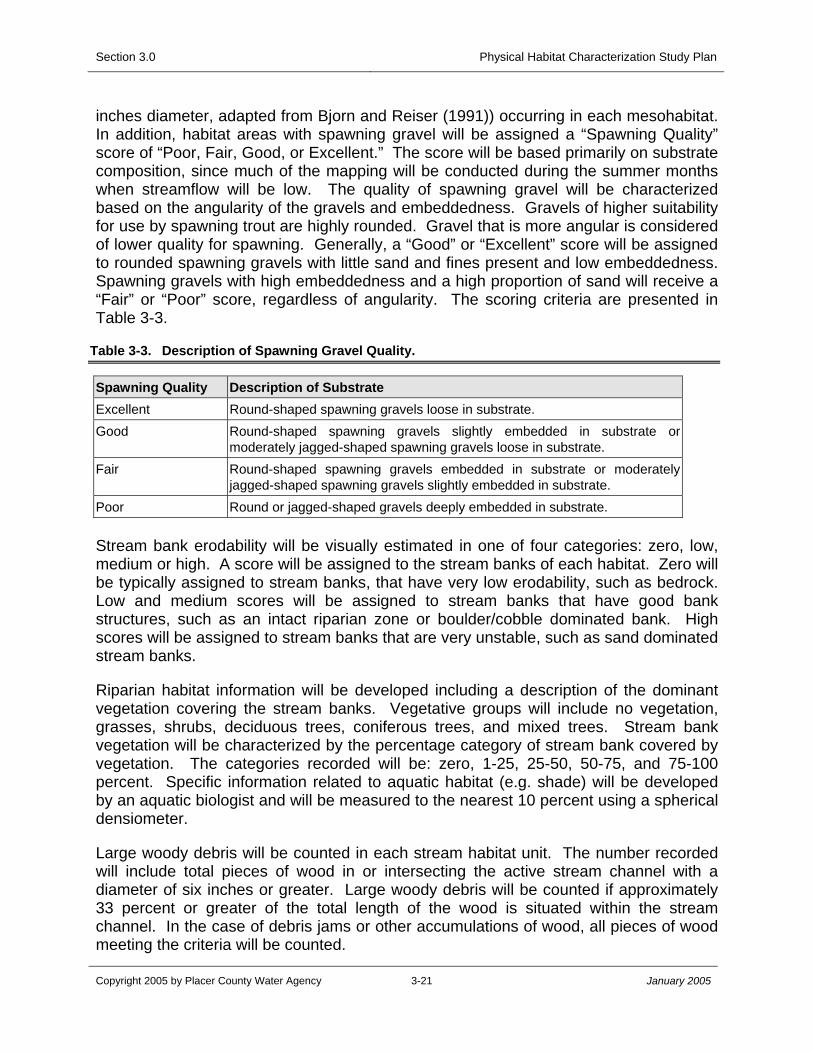
Section 3.0 Physical Habitat Characterization Study Plan
Copyright 2005 by Placer County Water Agency 3-21 January 2005
inches diameter, adapted from Bjorn and Reiser (1991)) occurring in each mesohabitat. In addition, habitat areas with spawning gravel will be assigned a “Spawning Quality” score of “Poor, Fair, Good, or Excellent.” The score will be based primarily on substrate composition, since much of the mapping will be conducted during the summer months when streamflow will be low. The quality of spawning gravel will be characterized based on the angularity of the gravels and embeddedness. Gravels of higher suitability for use by spawning trout are highly rounded. Gravel that is more angular is considered of lower quality for spawning. Generally, a “Good” or “Excellent” score will be assigned to rounded spawning gravels with little sand and fines present and low embeddedness. Spawning gravels with high embeddedness and a high proportion of sand will receive a “Fair” or “Poor” score, regardless of angularity. The scoring criteria are presented in Table 3-3.
Table 3-3. Description of Spawning Gravel Quality.
Spawning Quality Description of Substrate Excellent Round-shaped spawning gravels loose in substrate. Good Round-shaped spawning gravels slightly embedded in substrate or
moderately jagged-shaped spawning gravels loose in substrate. Fair Round-shaped spawning gravels embedded in substrate or moderately
jagged-shaped spawning gravels slightly embedded in substrate. Poor Round or jagged-shaped gravels deeply embedded in substrate. Stream bank erodability will be visually estimated in one of four categories: zero, low, medium or high. A score will be assigned to the stream banks of each habitat. Zero will be typically assigned to stream banks, that have very low erodability, such as bedrock. Low and medium scores will be assigned to stream banks that have good bank structures, such as an intact riparian zone or boulder/cobble dominated bank. High scores will be assigned to stream banks that are very unstable, such as sand dominated stream banks.
Riparian habitat information will be developed including a description of the dominant vegetation covering the stream banks. Vegetative groups will include no vegetation, grasses, shrubs, deciduous trees, coniferous trees, and mixed trees. Stream bank vegetation will be characterized by the percentage category of stream bank covered by vegetation. The categories recorded will be: zero, 1-25, 25-50, 50-75, and 75-100 percent. Specific information related to aquatic habitat (e.g. shade) will be developed by an aquatic biologist and will be measured to the nearest 10 percent using a spherical densiometer.
Large woody debris will be counted in each stream habitat unit. The number recorded will include total pieces of wood in or intersecting the active stream channel with a diameter of six inches or greater. Large woody debris will be counted if approximately 33 percent or greater of the total length of the wood is situated within the stream channel. In the case of debris jams or other accumulations of wood, all pieces of wood meeting the criteria will be counted.
Section 3.0 Physical Habitat Characterization Study Plan
Copyright 2005 by Placer County Water Agency 3-22 January 2005
Potential fish passage barriers will be visually assessed and characterized by experienced fish biologists. These will include culverts, road crossings, debris jams, cascades, bedrock sheets, shallow riffles, and dewatered areas, among others. Photographs will be taken and spatial coordinates collected using GPS for each of the barriers identified during the ground surveys. Crews also will identify the location of prominent features, such as tributaries, gaging stations, diversions, recreational facilities and other facilities with GPS coordinates.
3.5.4 QUALITY CONTROL PROCEDURES
All data entered onto field data sheets will be checked for accuracy and completeness by the accompanying field crewmember. All data entered electronically will be checked for accuracy against the field data sheets.
3.5.5 REPORTING
A report describing the habitat and channel conditions associated with the streams and rivers in the vicinity of the MFP will be prepared. The report will summarize conditions observed during stream habitat mapping. Work products described in Section 3.5.4 will be incorporated into the report, with text descriptions, tables, graphs, and photographs, as appropriate. All study measurement sites will be identified on a base map.
The aquatic habitat characterization will utilize the same river mile stationing system as that used for the geomorphology study and the riparian habitat mapping. The stationing system will progress in 0.1-mile units and will include all streams below and immediately above Project diversions. This will provide a consistent and accurate means to identify a specific location on any study stream. All future studies are expected to use the river mile stationing system for geo-referencing purposes.
3.5.6 SCHEDULE MILESTONES
The stream habitat characterization will be completed during 2005 in accordance with the following schedule.
2005 Schedule
Date Milestone Apr.-Jul. 2005 Collect and review existing data, reports, maps, and aerial imagery Jul.-Sep. 2005 Initial visual classification and aerial aquatic habitat assessment Sep.-Dec. 2005 Refine initial habitat characterization and stratification Jan. 2006 Report to resource agencies for review and comment
Section 3.0 Physical Habitat Characterization Study Plan
Copyright 2005 by Placer County Water Agency 3-23 January 2005
2006 Schedule
Date Milestone Jun.-Aug. 2006 Finalize stratification of Study reaches (following completion of the Rosgen Level II
study) Aug.-Oct. 2006 Ground-truthing aquatic habitat characterization Nov.-Dec. 2006 Data reduction/analysis Jan. 2007 Report to resource agencies for review and comment 3.6 REFERENCES
The following references were used to develop the Physical Habitat Characterization Study Plan and are available for review by the public and resource agencies from PCWA.
Bjorn, T.C. and D.W. Reiser. 1991. Habitat requirements for salmonids in streams. Pages 83-138 in W.R. Meehan [editor] Influences of forest and range land management of salmonid fishes and their habitats. American Fisheries Society Special Publication 19, Bethesda, MD.
Busch, W.D., and Sly, P. G., Editors. 1992. The Development of an Aquatic Habitat Classification for Lakes. CRC Press. Boca Raton, Fl.
California Department of Parks and Recreation. 2003. Draft Resource Inventory Folsom Lake State Recreation Area.
El Dorado National Forest. 2003. South Fork American River-Chili Bar Watershed, Lower Middle Fork American River Watershed Landscape and Roads Analyses.
Foresthill Ranger District. 2003. Middle Fork American River Watershed Assessment.
Harrelson, Cheryl C., C.L. Rawlins, John P. Potyondy. 1994. Stream channel reference sites: an illustrated guide to field technique. USDA, Forest Service GTR RM-245, Fort Collins, Colorado.
Hawkins, C. P., J. L. Kershner, P. A. Bisson, M. D. Bryant, L. M. Decker, S. V. Gregory, D. A. McCullough, C. K. Overton, G. H. Reeves, R. J. Steedman, and M. K. Young. 1993. A hierarchical approach to classifying habitats in small streams. Fisheries. 18(6): 3-12.
McCain, M., D. Fuller, L. Decker, and K. Overton. 1990. Stream habitat classification and inventory procedures for northern California. FHR Currents: R-5’s fish habitat relationships technical bulletin. No. 1. US Dept. of Agriculture, Forest Service, Pacific Southwest Region, Arcata, California.
Section 3.0 Physical Habitat Characterization Study Plan
Copyright 2005 by Placer County Water Agency 3-24 January 2005
Meals, K. and L. Miranda. 1991. Variability in abundance of age-0+ centrarchids among littoral habitats of flood reservoirs in Mississippi. North American Journal of Fisheries Management 11:298-304.
Montgomery, D.R. and J.M. Buffington. 1997. Channel reach morphology in mountain drainage basins. Geological Society of America Bulletin 109: 596-611.
Nack, S., D. Brunnell, D. Green and J. Forney. 1993. Spawning and nursery habitats of largemouth bass in the tidal Hudson River. Transactions of the American Fisheries Society 12:208-216.
Placer County Water Agency. 1997. Sediment Study of Ralston Afterbay. Prepared by Geotechnical and Hydraulic Engineering Services Bechtel Corporation.
Placer County Water Agency. 2001. Ralston Afterbay Sediment Management Project. Prepared by Jones and Stokes.
Placer County Water Agency. 2002. Duncan Canyon/Long Canyon Paired Watershed Study. Prepared by WRC Environmental. 22 pp.
Rosgen, D.L. 1996. Applied river morphology. Wildland Hydrology, Pagosa Springs, Colorado.
Wolman, G.M. 1954. A method of sampling coarse river bed material. Transactions of the American Geophysical Union 35: 951-956.
Section 4.0 Water Temperature Study Plan
Copyright 2005 by Placer County Water Agency 4-1 January 2005
4.0 WATER TEMPERATURE STUDY PLAN
4.1 INTRODUCTION
Some historical water temperature data is available for the streams and rivers in the vicinity of the MFP. However, historical data is not available for all of the streams and rivers and those data that do exist consist mainly of spot measurements taken during water quality monitoring and flow gage station maintenance. Although potentially useful for some comparisons, spot water temperatures alone cannot characterize the water temperature regimes of streams and rivers in the vicinity of the MFP. Historic temperature data for the MFP reservoirs is not available.
A limited amount of meteorological data is available from three stations situated in the vicinity of the MFP, one located at Greek Store in the Duncan Canyon Creek basin, one located in the upper Duncan Canyon Creek basin, and one located at Hell Hole Reservoir. The Greek Store station is operated by the U.S. Bureau of Reclamation (USBR) and measures, among other parameters, precipitation and air temperature. Data from this site are available from 1995 to the present. The upper Duncan Canyon Creek area station is operated by the USFS and measures, among other parameters, relative humidity, solar radiation, precipitation and air temperature. Data from this site are available from 2001 to the present. The Hell Hole station is operated by the USFS. Air temperature and precipitation data are available from this station from 1991 through April 2004. Relative humidity data are available from 1995 through April 2004.
Considering the limited availability of water temperature data for the MFP, PCWA initiated a stream water temperature monitoring pilot program in the fall of 2003, which included the installation of 22 water temperature loggers. During the summer of 2004, eight additional stream water temperature monitoring sites were established and a reservoir profiling program was developed and initiated at French Meadows and Hell Hole reservoirs. To support the water temperature pilot program, PCWA installed six ambient air temperature/relative humidity loggers to obtain basic meteorological data. Appendix B, titled “Summary of Stream and Reservoir Water Temperature Pilot Program,” describes PCWA’s reservoir profiling and water temperature monitoring pilot program. Specific recommendations and considerations for future water temperature and meteorological monitoring also are provided in Appendix B.
This Water Temperature Study Plan describes PCWA’s approach to augmenting the existing water temperature and meteorological data sets based upon the methodologies, protocols, and recommendations developed and refined during implementation of the pilot program in 2003 and 2004. The work described in this Plan will be conducted in 2005 and 2006. Because warm summer water temperatures are a potential biological concern, data collection will focus on obtaining summer water temperature data and ensuring the loggers are operating properly during the late spring through early fall period. A report summarizing the 2005 study results and other existing temperature information will be prepared and provided to the resource agencies in early 2006 for review and comment. Monitoring in 2006 will be adjusted and refined based on the 2005 study results and resource agency comments. A report describing
Section 4.0 Water Temperature Study Plan
Copyright 2005 by Placer County Water Agency 4-2 January 2005
the 2006 monitoring effort will be prepared and provided to the resource agencies in early 2007.
4.2 STUDY OBJECTIVES
The objective of the Water Temperature Study Plan is to establish a water temperature monitoring station array that would enable PCWA to collect a consistent, thorough data set that can be used to adequately characterize water temperatures in the reservoirs and streams associated with the MFP. The water temperature and reservoir profile data will be used to characterize water temperature conditions in the Rubicon River, the Middle Fork American River, Duncan Creek and Long Canyon Creek. In addition, the data will be used to initially evaluate whether the water temperatures downstream of Project facilities meet the Cold Freshwater Habitat beneficial use goals identified in the California Regional Water Quality Control Board, Central Valley Region’s “Water Quality Control Plan (Basin Plan) for the Sacramento River and San Joaquin River Basins” (1998).
4.3 GENERAL APPROACH
The general approach outlined in this Study plan focuses on building upon and supplementing the existing water temperature data set. This Plan describes PCWA’s stream temperature monitoring station array, including existing and proposed stations, and describes how water temperature data will be collected, stored and analyzed. In addition, this Plan describes how water temperature and other parameters will be measured in the Project reservoirs.
4.4 STUDY METHODS
Implementation of the stream and reservoir water temperature monitoring pilot program during 2003 and 2004 provided useful experience and insight regarding the operation and maintenance of a water temperature monitoring program. This Study Plan describes how PCWA will augment the water temperature information developed through the pilot program and is based on the results and recommendations provided in the pilot program report included in Appendix B. PCWA’s Study Plan includes a stream water temperature monitoring program, a reservoir monitoring program, and a meteorological monitoring program, each of which is described in the following sections.
4.4.1 STREAM WATER TEMPERATURE MONITORING
As a result of the pilot program, a total of 32 temperature monitoring stations are positioned in the vicinity of the MFP, of which 30 were installed by PCWA. SMUD and the USGS installed the other two stations. SMUD maintains a water temperature monitoring station on the South Fork Rubicon River and has offered to share data from this station with PCWA. The USGS temperature station is located on the North Fork American River and the data from this station are publicly available. The locations of the existing 32 water temperature monitoring stations are described in Table 4-1 and illustrated on Figure 4-1.
Proposed Existing Environment Study Plan Package
Copyright 2005 by Placer County Water Agency January 2005
Placeholder for Figure 4-1
Figure 4-1 Water Temperature Monitoring Station Array (including existing & proposed stations)
Non-Internet Public Information
These Figures have been removed in accordance with the Commission regulations at 18 CFR Section 388.112. These Figures are considered Non-Internet Public information and should not be posted on the Internet. This information may be accessed from the Placer County Water Agency’s (PCWA) Public Reference Room, but is not expected to be posted on PCWA’s Website, except as an indexed item.
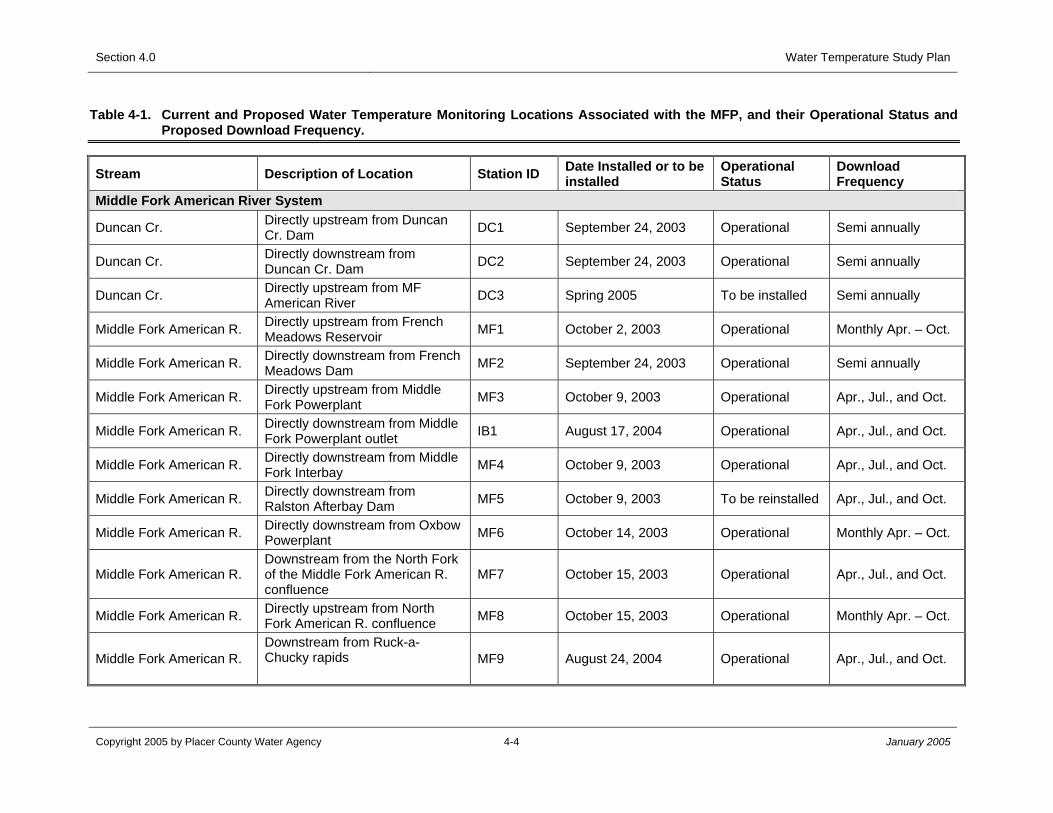
Section 4.0 Water Temperature Study Plan
Table 4-1. Current and Proposed Water Temperature Monitoring Locations Associated with the MFP, and their Operational Status and Proposed Download Frequency.
Stream Description of Location Station ID Date Installed or to be installed
Operational Status
Download Frequency
Middle Fork American River System
Duncan Cr. Directly upstream from Duncan Cr. Dam DC1 September 24, 2003 Operational Semi annually
Duncan Cr. Directly downstream from Duncan Cr. Dam DC2 September 24, 2003 Operational Semi annually
Duncan Cr. Directly upstream from MF American River DC3 Spring 2005 To be installed Semi annually
Middle Fork American R. Directly upstream from French Meadows Reservoir MF1 October 2, 2003 Operational Monthly Apr. – Oct.
Middle Fork American R. Directly downstream from French Meadows Dam MF2 September 24, 2003 Operational Semi annually
Middle Fork American R. Directly upstream from Middle Fork Powerplant MF3 October 9, 2003 Operational Apr., Jul., and Oct.
Middle Fork American R. Directly downstream from Middle Fork Powerplant outlet IB1 August 17, 2004 Operational Apr., Jul., and Oct.
Middle Fork American R. Directly downstream from Middle Fork Interbay MF4 October 9, 2003 Operational Apr., Jul., and Oct.
Middle Fork American R. Directly downstream from Ralston Afterbay Dam MF5 October 9, 2003 To be reinstalled Apr., Jul., and Oct.
Middle Fork American R. Directly downstream from Oxbow Powerplant MF6 October 14, 2003 Operational Monthly Apr. – Oct.
Middle Fork American R. Downstream from the North Fork of the Middle Fork American R. confluence
MF7 October 15, 2003 Operational Apr., Jul., and Oct.
Middle Fork American R. Directly upstream from North Fork American R. confluence MF8 October 15, 2003 Operational Monthly Apr. – Oct.
Middle Fork American R. Downstream from Ruck-a-Chucky rapids
MF9 August 24, 2004 Operational Apr., Jul., and Oct.
Copyright 2005 by Placer County Water Agency 4-4 January 2005
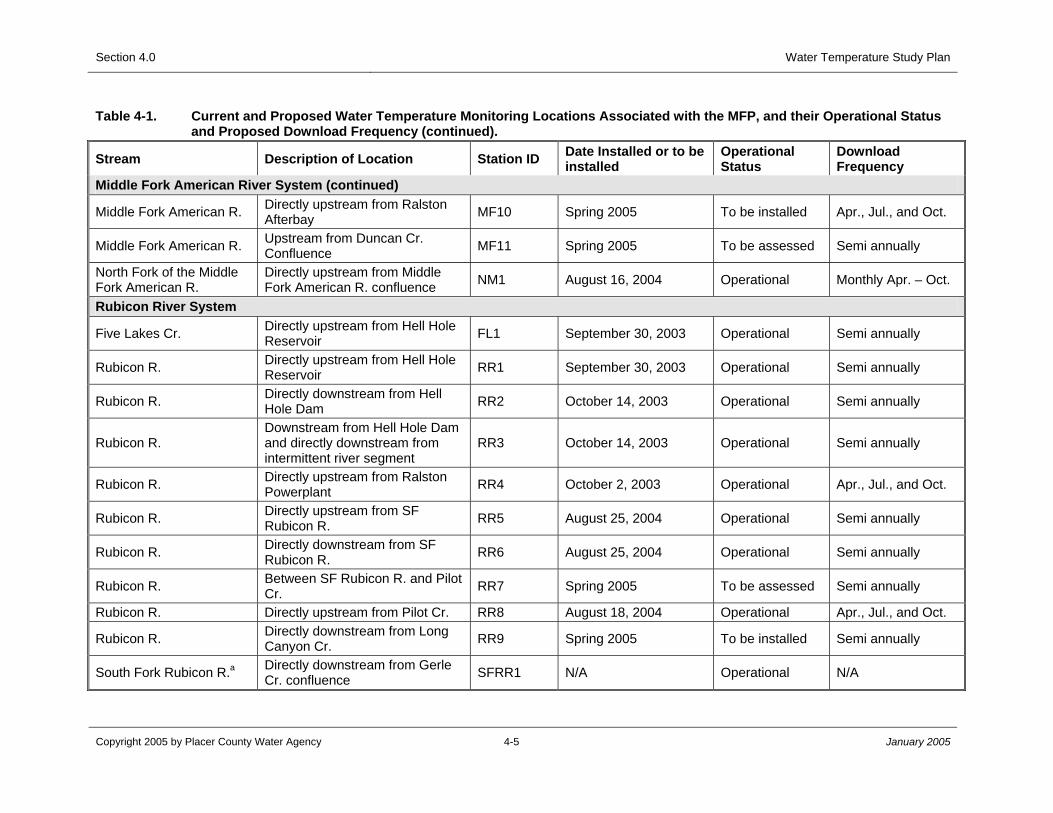
Section 4.0 Water Temperature Study Plan
Table 4-1. Current and Proposed Water Temperature Monitoring Locations Associated with the MFP, and their Operational Status and Proposed Download Frequency (continued).
Stream Description of Location Station ID Date Installed or to be installed
Operational Status
Download Frequency
Middle Fork American River System (continued)
Middle Fork American R. Directly upstream from Ralston Afterbay MF10 Spring 2005 To be installed Apr., Jul., and Oct.
Middle Fork American R. Upstream from Duncan Cr. Confluence MF11 Spring 2005 To be assessed Semi annually
North Fork of the Middle Fork American R.
Directly upstream from Middle Fork American R. confluence NM1 August 16, 2004 Operational Monthly Apr. – Oct.
Rubicon River System
Five Lakes Cr. Directly upstream from Hell Hole Reservoir FL1 September 30, 2003 Operational Semi annually
Rubicon R. Directly upstream from Hell Hole Reservoir RR1 September 30, 2003 Operational Semi annually
Rubicon R. Directly downstream from Hell Hole Dam RR2 October 14, 2003 Operational Semi annually
Rubicon R. Downstream from Hell Hole Dam and directly downstream from intermittent river segment
RR3 October 14, 2003 Operational Semi annually
Rubicon R. Directly upstream from Ralston Powerplant RR4 October 2, 2003 Operational Apr., Jul., and Oct.
Rubicon R. Directly upstream from SF Rubicon R. RR5 August 25, 2004 Operational Semi annually
Rubicon R. Directly downstream from SF Rubicon R. RR6 August 25, 2004 Operational Semi annually
Rubicon R. Between SF Rubicon R. and Pilot Cr. RR7 Spring 2005 To be assessed Semi annually
Rubicon R. Directly upstream from Pilot Cr. RR8 August 18, 2004 Operational Apr., Jul., and Oct.
Rubicon R. Directly downstream from Long Canyon Cr. RR9 Spring 2005 To be installed Semi annually
South Fork Rubicon R.a Directly downstream from Gerle Cr. confluence SFRR1 N/A Operational N/A
Copyright 2005 by Placer County Water Agency 4-5 January 2005
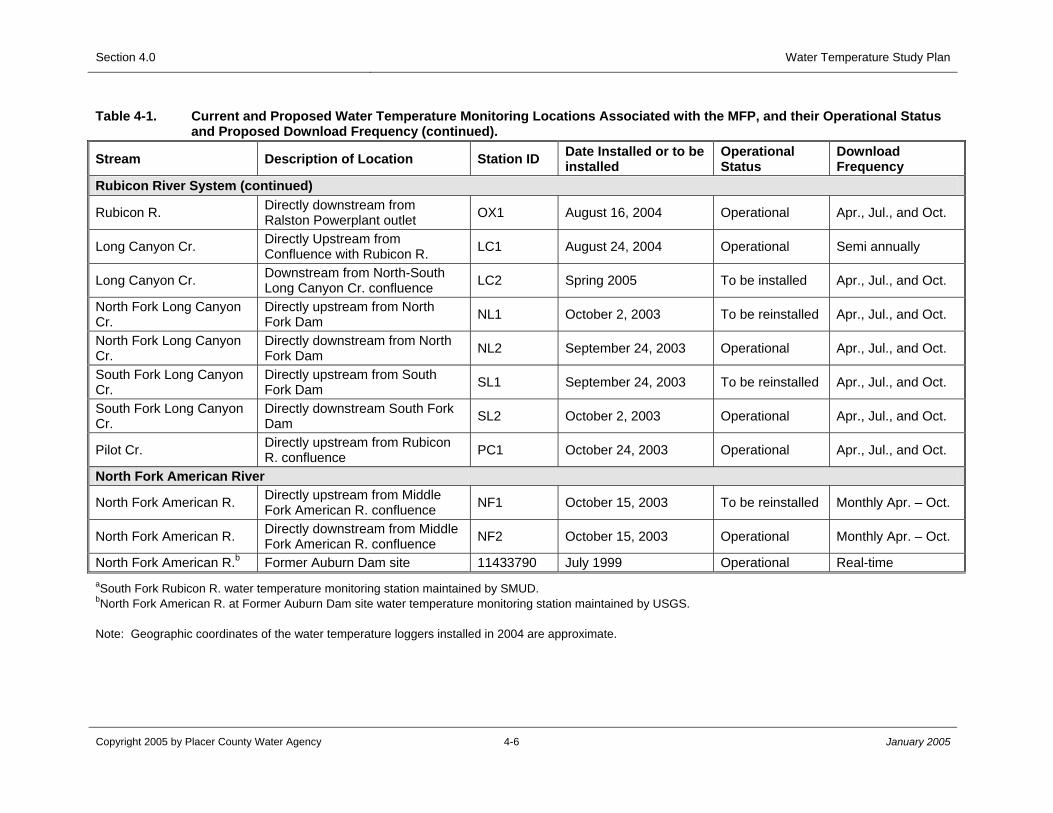
Water Temperature Study Plan
Copyright 2005 by Placer County Water Agency 4-6 January 2005
Table 4-1. Current and Proposed Water Temperature Monitoring Locations Associated with the MFP, and their Operational Status and Proposed Download Frequency (continued).
Stream Description of Location Station ID Date Installed or to be installed
Operational Status
Download Frequency
Rubicon River System (continued)
Rubicon R. Directly downstream from Ralston Powerplant outlet OX1 August 16, 2004 Operational Apr., Jul., and Oct.
Long Canyon Cr. Directly Upstream from Confluence with Rubicon R. LC1 August 24, 2004 Operational Semi annually
Long Canyon Cr. Downstream from North-South Long Canyon Cr. confluence LC2 Spring 2005 To be installed Apr., Jul., and Oct.
North Fork Long Canyon Cr.
Directly upstream from North Fork Dam NL1 October 2, 2003 To be reinstalled Apr., Jul., and Oct.
North Fork Long Canyon Cr.
Directly downstream from North Fork Dam NL2 September 24, 2003 Operational Apr., Jul., and Oct.
South Fork Long Canyon Cr.
Directly upstream from South Fork Dam SL1 September 24, 2003 To be reinstalled Apr., Jul., and Oct.
South Fork Long Canyon Cr.
Directly downstream South Fork Dam SL2 October 2, 2003 Operational Apr., Jul., and Oct.
Pilot Cr. Directly upstream from Rubicon R. confluence PC1 October 24, 2003 Operational Apr., Jul., and Oct.
North Fork American River
North Fork American R. Directly upstream from Middle Fork American R. confluence NF1 October 15, 2003 To be reinstalled Monthly Apr. – Oct.
North Fork American R. Directly downstream from Middle Fork American R. confluence NF2 October 15, 2003 Operational Monthly Apr. – Oct.
North Fork American R.b Former Auburn Dam site 11433790 July 1999 Operational Real-time aSouth Fork Rubicon R. water temperature monitoring station maintained by SMUD. bNorth Fork American R. at Former Auburn Dam site water temperature monitoring station maintained by USGS. Note: Geographic coordinates of the water temperature loggers installed in 2004 are approximate.
Section 4.0
Section 4.0 Water Temperature Study Plan
Copyright 2005 by Placer County Water Agency 4-7 January 2005
PCWA has reviewed preliminary data downloaded from the existing temperature stations and, based on the results, has determined that the following changes to the water temperature monitoring program are necessary to more adequately depict water temperatures in the area of investigation:
• PCWA will install four additional water temperature stations;
• PCWA will assess access conditions at two potential water temperature monitoring remote locations on the Rubicon River and the Middle Fork American River;
• PCWA will reinstall four of the original monitoring stations that were either lost due to vandalism or are subject to recording erroneous data (i.e., air temperature data at certain times); and
• PCWA will install redundant water temperature loggers at all water temperature monitoring locations.
Combined, the water temperature monitoring program will consist of 36 to 38 strategically positioned water temperature monitoring sites, depending upon the results of the accessibility assessment. The locations of these monitoring sites are shown in Figure 4-1 and are described in Table 4-1.
Installation of Four Additional Water Temperature Monitoring Stations
PCWA will install four new water temperature stations in the vicinity of the MFP. The identification of these additional water temperature monitoring sites resulted from inspection of the available water temperature data and the spatial array of sites, with consideration of the objectives of the Water Temperature Study Plan. Combined with the existing temperature station array, these sites will allow PCWA to evaluate: 1) water temperature conditions upstream and downstream of Project facilities; and 2) the influence of tributary streams on water temperature. Additional sites could be considered in the future as more data from the existing stations become available and are evaluated. The four additional sites include:
• Middle Fork American River upstream from Ralston Afterbay (MF10);
• Duncan Canyon Creek upstream from the Middle Fork American River (DC3);
• Long Canyon Creek downstream from the North-South Long Canyon Creek confluence (LC2); and
• Rubicon River downstream from the Long Canyon Creek confluence (RR9).
Accessibility Assessment
Although additional water temperature monitoring sites on the Middle Fork American River and the Rubicon River may help to characterize water temperature regimes in these rivers, preliminary assessments indicate that additional sites may be inaccessible.

Section 4.0 Water Temperature Study Plan
Copyright 2005 by Placer County Water Agency 4-8 January 2005
PCWA will continue to assess the possibility of accessing two remote locations on the Middle Fork American River and on the Rubicon River, identified as follows:
• Middle Fork American River upstream from Duncan Canyon Creek Confluence (MF11); and
• Rubicon River between the South Fork Rubicon River and Pilot Creek (RR7).
PCWA will install temperature monitoring stations at these two location provided: 1) data recorded at other stations indicates these stations are needed; and 2) the sites can be safely accessed.
Reinstallation of Existing Temperature Loggers
The pilot program data indicates that some of the existing temperature monitors should be moved or reinstalled because they were vandalized or are recording erroneous data. Therefore, PCWA will reinstall monitors NL1, SL1, MF5, and NF1.
Redundant Water Temperature Loggers
PCWA will install redundant water temperature loggers at all of the existing and proposed water temperature monitoring locations. The purpose of installing redundant water temperature loggers is twofold. First, redundant loggers will minimize the probability that water temperature data at any particular site will be lost due to data logger or optic shuttle malfunction, computer download failure or malfunction, vandalism or logger displacement. Each of the sites identified for monitoring is important for achieving the objectives of the water temperature-monitoring program and loss of data from any one site restricts characterization of water temperatures and potential analyses or data applications.
Second, redundant loggers will help to identify possible compromises in the accuracy of the water temperature data collected due to potential logger measurement drift or localized instream heating or cooling, as may have occurred at SL1 (see Appendix B). Redundant data loggers will help ensure that good water temperature data are available for future aquatic resources analyses.
A non-descript installation will be used for the redundant water temperature loggers. A metal box or pipe requiring specialized instrumentation (such as a key or wrench) to open will be used to house the logger. This box or pipe can be secured to a tree trunk or large boulder using a rubber coated steel cable. PCWA has successfully installed water temperature loggers using this application.
Data Collection Methodology
Consistent collection of the water temperature data is important to minimizing the potential for data gaps (missing data points in the continuous record). Because the loggers have the capacity to hold over 300 days of water temperature data collected at
Section 4.0 Water Temperature Study Plan
Copyright 2005 by Placer County Water Agency 4-9 January 2005
15-minute intervals, a larger concern than running out of memory is the loss of data due to vandalism, logger malfunction or logger loss.
Water temperature loggers will be visited and data downloaded either semi-annually, 3 times per year, or monthly from April through mid-October, depending on the logger location. If deemed necessary, some loggers may be downloaded more frequently. Loggers that are more subject to vandalism due to accessibility and public exposure, including NF1, NF2, MF6, MF8, and NM1, will be visited monthly during the April through October period. Should a logger not listed above be vandalized, it then would be downloaded under this schedule, as well. High country loggers, those subject to being snowbound or inaccessible due to high spring flows or requiring difficult access, including DC1, DC2, MF1, MF2, FL1, RR1, RR2, RR3, RR5, and RR6, will be downloaded as soon as possible during the spring and again prior to winter storms (mid-October). MF1 is located in a relatively accessible location and therefore will be checked more frequently, depending upon weather conditions. Because warm summer water temperatures are a potential biological concern, data collection will focus on obtaining summer water temperature data and ensuring the loggers are operating properly during the summer. The remaining sites will be visited during mid-April, mid-July and mid-October. Table 4-1 provides descriptions of the download frequencies for the individual monitoring stations.
During the time the data is downloaded from the logger, air and water temperature measurements, the depth of the water temperature logger, and other observations will be noted on the data download data sheet. After the logger is removed from the water, it will be gently cleaned and visually inspected. The data will be downloaded into an optic shuttle and then later to a personal computer.
The equipment necessary to replace or fix an installation will be in the possession of the technicians downloading the data. Should a logger need to be replaced because of failure or vandalism, the technicians will be able to do so immediately to reduce the potential for additional data loss. Any loggers or optic shuttles that fail to download will be returned to Onset Corporation, where trained technicians can attempt to download the data.
Immediately after the raw water temperature data files are safely downloaded to the computer, back-ups will be recorded on two CDs that will be stored in two different locations. Only after the raw water temperature data is safely backed-up will the optic shuttle be cleared or data manipulated.
Data Quality Assurance/Quality Control
Data QA/QC commences prior to downloading the data from each logger. A NIST-traceable digital thermometer will be used to determine the water temperature at the logger prior to data download. The water temperature reading from the NIST-traceable thermometer will then be compared to the last logger reading to evaluate potential accuracy drift of the logger. To minimize the potential for error in data collection, care will be taken to record the exact time that: 1) the water temperature is recorded with the
Section 4.0 Water Temperature Study Plan
Copyright 2005 by Placer County Water Agency 4-10 January 2005
thermometer; 2) the temperature logger is removed from the water; 3) the data begins downloading; 4) the data finishes downloading; and 5) the logger is re-deployed.
After the data is downloaded, reviewing water temperature data for errors prior to analysis is important. Water temperature data downloaded from each monitoring location will be viewed graphically as soon as possible to check for errors. Plotting the data period of record allows the data set to be scrutinized for anomalous or incorrect segments. Common anomalies in water temperature data include air temperature values (extreme spikes on the graphs) recorded prior to placement into water and after removal from water, and sudden changes in the magnitude of the daily temperature ranges. Values that are determined to be anomalous will be removed from the database. The raw data files will be retained in their unaltered state for future reference.
Data Analysis Procedures
Following QA/QC, an Excel macro program will then be applied to the 15-minute interval data that calculates daily average, maximum, and minimum water temperature, variance and standard error of the daily average water temperature, and time of daily maximum and daily minimum water temperatures. As well as providing valuable information regarding the water temperature regimes of the streams monitored, review of the variance, standard error, and time of daily maximum and minimum water temperature provides a second tier of QA/QC. For example, if the daily maximum water temperature in August is observed at 0800, then that would suggest logger malfunction, vandalism or tampering, or some other abnormality, which should be further investigated. The daily average water temperature and range for each monitoring site will then be plotted similarly to the plots presented in Appendix B. Stream system plots, such as those presented in Appendix B for the Middle Fork American River, the Rubicon River, Long Canyon Creek and Duncan Canyon Creek also will be prepared. Furthermore, the data collected will be available for use in other yet-to-be identified analyses and characterizations of aquatic resource habitat availability.
4.4.2 RESERVOIR WATER TEMPERATURE PROFILING
PCWA measured water temperature, dissolved oxygen and specific conductance at Hell Hole and French Meadows reservoirs during the pilot program implemented during the fall of 2004. A description of this effort and the resultant data profiles are provided in Appendix B. PCWA will continue to measure water temperature, dissolved oxygen and specific conductance at French Meadows and Hell Hole reservoirs during 2005 and 2006. The other Project impoundments (Middle Fork Interbay, Ralston Afterbay, Duncan Diversion Dam, North Fork Long Canyon Dam and South Fork Long Canyon Dam) are believed to be too small and have insufficient water residence time to stratify and, therefore, will not be profiled. Continuous water temperature data will continue to be collected upstream and downstream from these impoundments in the stream monitoring element of this Study plan.
Section 4.0 Water Temperature Study Plan
Copyright 2005 by Placer County Water Agency 4-11 January 2005
The reservoir sampling protocol implemented during 2004 proved to be robust and repeatable, and will be followed again in 2005. Should the examination of 2005 data suggest there is little difference longitudinally in the thermal structures within the reservoirs (e.g., if FM1, FM2, and FM3 profiles are similar), as was illustrated by the limited sample data from 2004, then reservoir profiling may be reduced to one or two locations each in French Meadows and Hell Hole reservoirs in 2006.
Data Collection Methodology
Water temperature profiling will continue at French Meadows and Hell Hole reservoirs at each of the previously identified and sampled sites (FM1, FM2, FM3, HH1, HH2, and HH3) (Appendix B, Figures 3 and 4). A GPS receiver will be used during each successive sampling occasion to locate the geographical coordinates of each sample site.
A Hydrolab® Quanta® multi-parameter water quality monitoring system will be used to measure water temperature (±0.2 degrees Celsius (°C)), dissolved oxygen (±0.2 milligrams per liter (mg/l)) and specific conductance (±0.001 millisiemens (mS/cm)) at each of the reservoir sampling sites. Specific conductance will be calibrated prior to entering the field and dissolved oxygen will be calibrated at each reservoir following the manufacturer’s calibration protocols. Temperature does not need to be calibrated.
Information collected at each site on each sampling occasion will include:
• General description of the weather;
• Start and end time of data collection;
• Air temperature at the start and end time of data collection;
• Maximum water depth observed using the sonar; and
• Additional general comments regarding the data collection process.
Generally, measurements will be taken at 1-meter (m) vertical increments beginning just beneath the water surface until the thermocline is reached, at which point measurements will be taken at 2-m increments. At each sample depth, the parameter readings will be allowed to stabilize, which usually takes between 15 and 60 seconds, before the water temperature, dissolved oxygen and specific conductance values are recorded on the data sheet. Readings are taken at each site until the sample depth approximates the depth reading on the sonar or the specific conductance reading rapidly increases (which is usually accompanied by a rapid decrease in dissolved oxygen concentration), indicating that the multi-parameter probe is at the bottom of the reservoir.
It is anticipated that reservoir profiles in French Meadows and Hell Hole reservoirs will be taken approximately monthly beginning in the spring as soon as access to reservoirs is possible, and ending in the fall when the reservoirs thermally destratify (i.e., are isothermic), or when access is prohibited due to weather.
Section 4.0 Water Temperature Study Plan
Copyright 2005 by Placer County Water Agency 4-12 January 2005
Data Quality Assurance/Quality Control
As during the 2004 reservoir profiling, all manufacture’s protocols will be followed for calibrating and utilizing the Hydrolab® Quanta®. A NIST-traceable digital thermometer will be utilized to determine surface water temperature, which will be compared to the reading provided by the multi-parameter probe to provide a measure of instrument accuracy. Careful notes will be taken on the environmental conditions experienced while collecting the reservoir profile data that might affect data collection, such as strong winds, extreme air temperatures or storms.
Hand-written data collected on field data sheets will be entered into an electronic database. After the data is entered into the database, it will be reviewed for accuracy. The data will then be plotted to provide an additional means of QA/QC. When the data in the electronic database is determined to be correct, the database will be recorded onto two CDs and stored in two different locations.
Data Analysis Procedures
Water temperature profile data will be plotted and examined for relationships among reservoirs, sample sites, depths, water temperatures and seasons. Additional plots will be created to illustrate the seasonal changes in the thermal profiles of each reservoir. Reservoir water temperature data will also be compared to stream water temperature data collected from tributaries flowing into the reservoirs, and reservoir release water temperatures to identify potential relationships among these sites. Furthermore, the data collected will be available for use in other yet-to-be identified analyses and characterizations of aquatic resources habitat availability.
4.4.3 METEOROLOGICAL DATA
PCWA will expand upon the meteorological monitoring that began in 2004. Relative humidity and air temperature will continue to be monitored in association with the water temperature monitoring program, however some of the existing stations will be replaced or upgraded to monitor additional meteorological parameters. Specifically, loggers measuring air temperature and relative humidity at Ralston Afterbay Reservoir (OA1) and Middle Fork Interbay (IA1) will be replaced with MET stations (station IDs: RAB and IBR, respectively) capable of measuring six parameters: wind speed; wind direction; relative humidity; air temperature; solar radiation; and precipitation. The USFS MET station at Hell Hole (HLH) currently monitoring wind speed, wind direction, relative humidity, air temperature, and precipitation will replace the PCWA logger monitoring air temperature and relative humidity at Hell Hole Reservoir (HA1). HLH will be upgraded to be capable of also measuring solar radiation.
With these upgrades, the meteorological monitoring array would consist of eight stations strategically located in the vicinity of the MFP. Stations FA1, NA1, and RA1 will continue to monitor air temperature and relative humidity at French Meadows Dam, North Fork American River at the Auburn State Recreation Headquarters, and at Ellicott Bridge on the Rubicon River, respectively. Stations RAB, IBR, and HLH will monitor
Section 4.0 Water Temperature Study Plan
Copyright 2005 by Placer County Water Agency 4-13 January 2005
wind speed, wind direction, relative humidity, air temperature, solar radiation, and precipitation at Ralston Afterbay Reservoir, Middle Fork Interbay, and Hell Hole Reservoir, respectively. Air temperature and precipitation will be monitored in the Duncan Canyon Creek watershed at station GKS, maintained by USBR. The USFS MET station at Upper Duncan Canyon Creek (Station ID DUN) will monitor wind speed, wind direction, relative humidity, air temperature, solar radiation, and precipitation. Figure 4-2 shows the existing and proposed meteorological station array. Table 4-2 provides additional information about each station, including parameters to be measured, operational status and download frequency.
Data collected at meteorological stations installed and maintained by PCWA (RAB, IBR, RA1, NA1, and RA1) will be downloaded in April, July, and October. The procedures for data retrieval will be similar to those used for the stream water temperature data retrieval described in Section 4.4.1 of this study plan. Data from the three stations operated by the USBR and/or USFS, Duncan (DUN), Greek Store (GKS) and Hell Hole Reservoir (HLH), will be downloaded quarterly from CDEC. Data QA/QC and analysis procedures will be similar to those identified for stream water temperature monitoring. A meteorological data summary report will be prepared and incorporated into the stream water temperature summary reports.
4.5 REPORTING
Data summary reports will be prepared following the fall download of water temperature data and the end of the reservoir profiling season. The summary reports will briefly summarize the data collected and the status of the monitoring programs. The reports will integrate the data collected to date, including meteorological data, and provide recommendations or modifications to the stream and reservoir water temperature monitoring programs, if appropriate. The summary reports will be submitted to the resource agencies for review and comment once in January 2006 and again in January 2007.
4.6 SCHEDULE MILESTONES
The water temperature study will be carried out in accordance with the milestones shown below.
Proposed Existing Environment Study Plan Package
Copyright 2005 by Placer County Water Agency January 2005
Placeholder for Figure 4-2
Figure 4-2 Location of Current and Proposed Water Temperature Monitoring Stations
Non-Internet Public Information
These Figures have been removed in accordance with the Commission regulations at 18 CFR Section 388.112. These Figures are considered Non-Internet Public information and should not be posted on the Internet. This information may be accessed from the Placer County Water Agency’s (PCWA) Public Reference Room, but is not expected to be posted on PCWA’s Website, except as an indexed item.
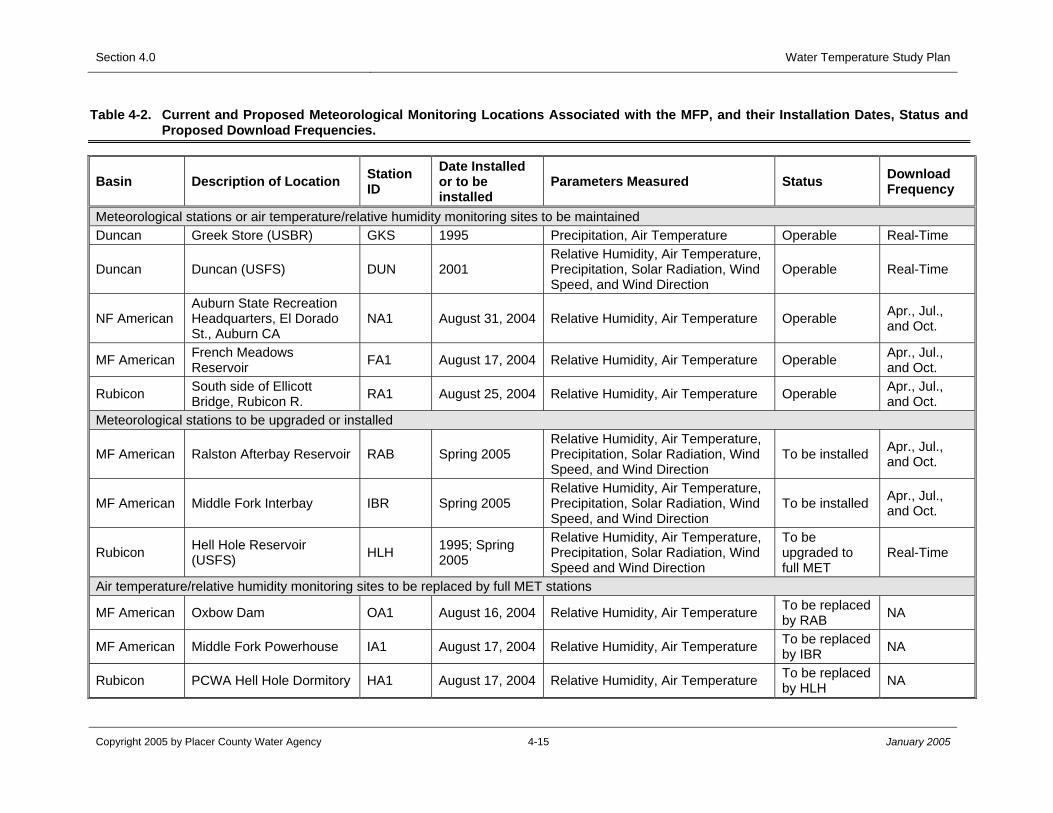
Water Temperature Study Plan
Copyright 2005 by Placer County Water Agency 4-15 January 2005
Table 4-2. Current and Proposed Meteorological Monitoring Locations Associated with the MFP, and their Installation Dates, Status and Proposed Download Frequencies.
Basin Description of Location Station ID
Date Installed or to be installed
Parameters Measured Status Download Frequency
Meteorological stations or air temperature/relative humidity monitoring sites to be maintained Duncan Greek Store (USBR) GKS 1995 Precipitation, Air Temperature Operable Real-Time
Duncan Duncan (USFS) DUN 2001 Relative Humidity, Air Temperature, Precipitation, Solar Radiation, Wind Speed, and Wind Direction
Operable Real-Time
NF American Auburn State Recreation Headquarters, El Dorado St., Auburn CA
NA1 August 31, 2004 Relative Humidity, Air Temperature Operable Apr., Jul., and Oct.
MF American French Meadows Reservoir FA1 August 17, 2004 Relative Humidity, Air Temperature Operable Apr., Jul.,
and Oct.
Rubicon South side of Ellicott Bridge, Rubicon R. RA1 August 25, 2004 Relative Humidity, Air Temperature Operable Apr., Jul.,
and Oct. Meteorological stations to be upgraded or installed
MF American Ralston Afterbay Reservoir RAB Spring 2005 Relative Humidity, Air Temperature, Precipitation, Solar Radiation, Wind Speed, and Wind Direction
To be installed Apr., Jul., and Oct.
MF American Middle Fork Interbay IBR Spring 2005 Relative Humidity, Air Temperature, Precipitation, Solar Radiation, Wind Speed, and Wind Direction
To be installed Apr., Jul., and Oct.
Rubicon Hell Hole Reservoir (USFS) HLH 1995; Spring
2005
Relative Humidity, Air Temperature, Precipitation, Solar Radiation, Wind Speed and Wind Direction
To be upgraded to full MET
Real-Time
Air temperature/relative humidity monitoring sites to be replaced by full MET stations
MF American Oxbow Dam OA1 August 16, 2004 Relative Humidity, Air Temperature To be replaced by RAB NA
MF American Middle Fork Powerhouse IA1 August 17, 2004 Relative Humidity, Air Temperature To be replaced by IBR NA
Rubicon PCWA Hell Hole Dormitory HA1 August 17, 2004 Relative Humidity, Air Temperature To be replaced by HLH NA
Section 4.0
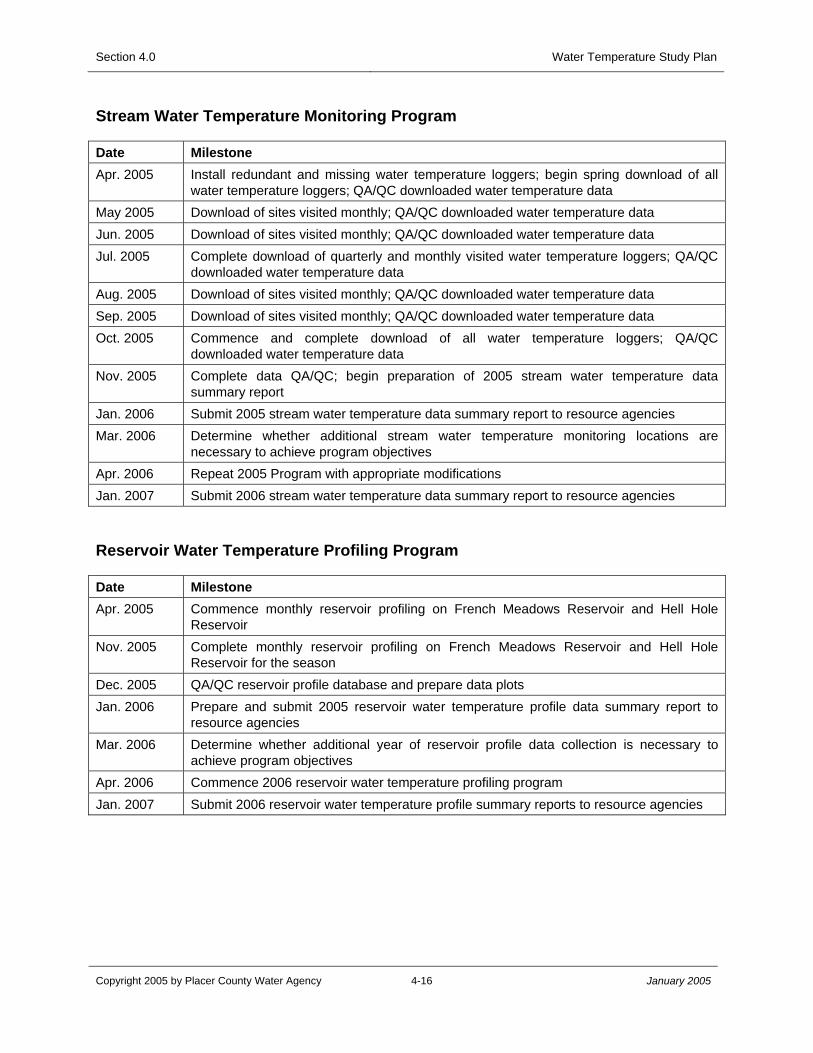
Section 4.0 Water Temperature Study Plan
Copyright 2005 by Placer County Water Agency 4-16 January 2005
Stream Water Temperature Monitoring Program
Date Milestone Apr. 2005 Install redundant and missing water temperature loggers; begin spring download of all
water temperature loggers; QA/QC downloaded water temperature data May 2005 Download of sites visited monthly; QA/QC downloaded water temperature data Jun. 2005 Download of sites visited monthly; QA/QC downloaded water temperature data Jul. 2005 Complete download of quarterly and monthly visited water temperature loggers; QA/QC
downloaded water temperature data Aug. 2005 Download of sites visited monthly; QA/QC downloaded water temperature data Sep. 2005 Download of sites visited monthly; QA/QC downloaded water temperature data Oct. 2005 Commence and complete download of all water temperature loggers; QA/QC
downloaded water temperature data Nov. 2005 Complete data QA/QC; begin preparation of 2005 stream water temperature data
summary report Jan. 2006 Submit 2005 stream water temperature data summary report to resource agencies Mar. 2006 Determine whether additional stream water temperature monitoring locations are
necessary to achieve program objectives Apr. 2006 Repeat 2005 Program with appropriate modifications Jan. 2007 Submit 2006 stream water temperature data summary report to resource agencies
Reservoir Water Temperature Profiling Program
Date Milestone Apr. 2005 Commence monthly reservoir profiling on French Meadows Reservoir and Hell Hole
Reservoir Nov. 2005 Complete monthly reservoir profiling on French Meadows Reservoir and Hell Hole
Reservoir for the season Dec. 2005 QA/QC reservoir profile database and prepare data plots Jan. 2006 Prepare and submit 2005 reservoir water temperature profile data summary report to
resource agencies Mar. 2006 Determine whether additional year of reservoir profile data collection is necessary to
achieve program objectives Apr. 2006 Commence 2006 reservoir water temperature profiling program Jan. 2007 Submit 2006 reservoir water temperature profile summary reports to resource agencies
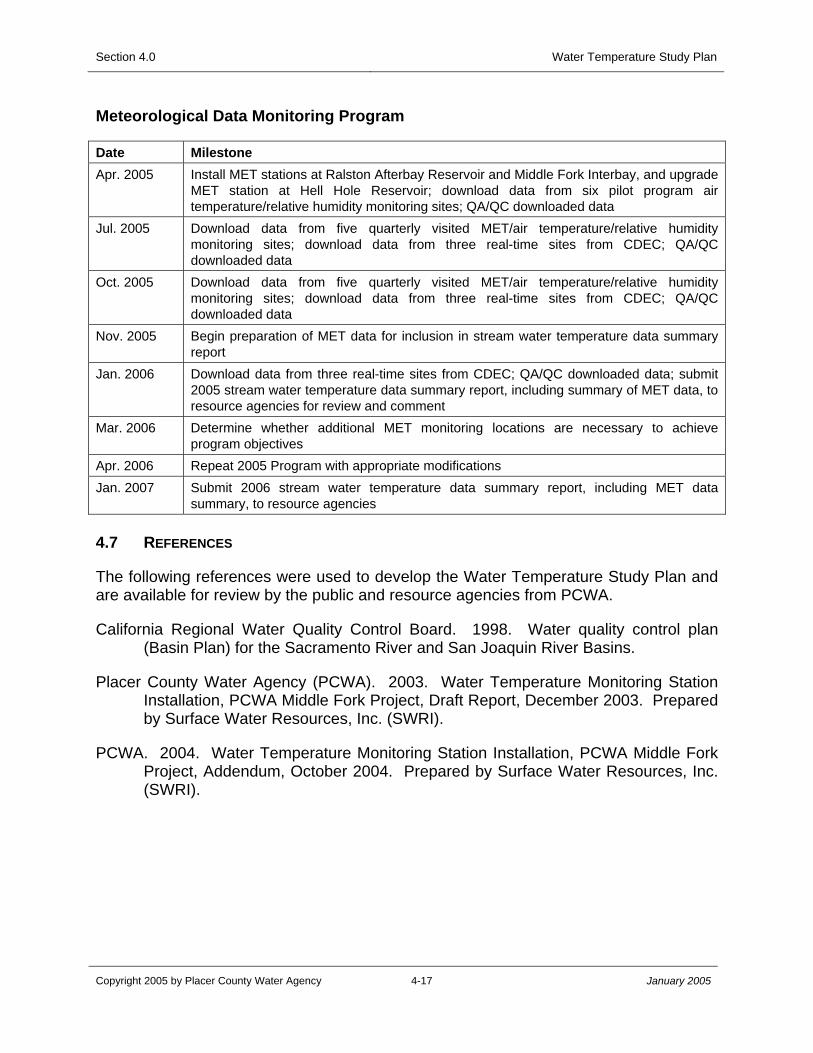
Section 4.0 Water Temperature Study Plan
Copyright 2005 by Placer County Water Agency 4-17 January 2005
Meteorological Data Monitoring Program
Date Milestone Apr. 2005 Install MET stations at Ralston Afterbay Reservoir and Middle Fork Interbay, and upgrade
MET station at Hell Hole Reservoir; download data from six pilot program air temperature/relative humidity monitoring sites; QA/QC downloaded data
Jul. 2005 Download data from five quarterly visited MET/air temperature/relative humidity monitoring sites; download data from three real-time sites from CDEC; QA/QC downloaded data
Oct. 2005 Download data from five quarterly visited MET/air temperature/relative humidity monitoring sites; download data from three real-time sites from CDEC; QA/QC downloaded data
Nov. 2005 Begin preparation of MET data for inclusion in stream water temperature data summary report
Jan. 2006 Download data from three real-time sites from CDEC; QA/QC downloaded data; submit 2005 stream water temperature data summary report, including summary of MET data, to resource agencies for review and comment
Mar. 2006 Determine whether additional MET monitoring locations are necessary to achieve program objectives
Apr. 2006 Repeat 2005 Program with appropriate modifications Jan. 2007 Submit 2006 stream water temperature data summary report, including MET data
summary, to resource agencies 4.7 REFERENCES
The following references were used to develop the Water Temperature Study Plan and are available for review by the public and resource agencies from PCWA.
California Regional Water Quality Control Board. 1998. Water quality control plan (Basin Plan) for the Sacramento River and San Joaquin River Basins.
Placer County Water Agency (PCWA). 2003. Water Temperature Monitoring Station Installation, PCWA Middle Fork Project, Draft Report, December 2003. Prepared by Surface Water Resources, Inc. (SWRI).
PCWA. 2004. Water Temperature Monitoring Station Installation, PCWA Middle Fork Project, Addendum, October 2004. Prepared by Surface Water Resources, Inc. (SWRI).
Section 5.0 Hydrology Study Plan
Copyright 2005 by Placer County Water Agency 5-1 January 2005
5.0 HYDROLOGY STUDY PLAN
5.1 INTRODUCTION
A substantial amount of hydrologic data is available for the streams, rivers and reservoirs in the vicinity of the MFP. PCWA has been assembling, compiling, and reviewing these data in preparation for the relicensing of the MFP. This Hydrology Study Plan describes the type of hydrologic data currently available for the streams and rivers in the vicinity of the MFP and the analyses proposed for completion during early relicensing activities. The scope of work described in this Plan will be completed in 2005. A report summarizing the study results will be prepared and provided to the resource agencies in early 2006 for review and comment. PCWA recognizes that additional hydrologic analyses may be required during the course of relicensing. Future analyses will be adjusted and refined based on the 2005 study results and resource agency comments.
5.2 STUDY OBJECTIVES
The objectives of the Hydrology Study Plan are:
• Assemble the existing hydrologic data available in the Project vicinity into a comprehensive database.
• Select a preliminary water-year type classification for the watershed, in consultation with the resource agencies.
• Select the period of record for analysis of Project and unimpaired hydrology.
• Describe the Project and unimpaired hydrology through a series of hydrologic analyses.
• Determine if additional data are needed to support the upcoming relicensing.
• Provide a complete hydrologic data set and corresponding analyses to support the geomorphology, riparian and aquatic habitat, and water temperature studies described in this package.
5.2.1 GENERAL APPROACH
The first task of the Hydrology Study Plan is to assemble the existing hydrologic data in the Project vicinity and develop a complete database. Once the dataset is complete it will be analyzed and developed into both Project and unimpaired flow records. Magnitude, timing, duration, rate of change and frequency of flows will be described with hydrographs and exceedance tables. Time-scales will be those allowed by the existing data. This will generally be in daily, monthly, hourly, or 15-minute increments. In addition, PCWA expects that the resource agencies will request an Indicators of Hydrologic Alteration (IHA) analysis. Therefore, PCWA will perform an IHA analysis if requested by the agencies, using streamflow data for gages with reasonably long periods of record (at least 10-20 years). The daily streamflow data also will be used to
Section 5.0 Hydrology Study Plan
Copyright 2005 by Placer County Water Agency 5-2 January 2005
reconstruct the unregulated hydrology at sites selected in consultation with the resource agencies.
Development of accurate hydrology information is a key component to the successful evaluation of any water resources system. Developing a hydrology dataset that is suitable for evaluating a system is a multi-step process that begins with collecting stream and reservoir gage data. Fortunately, there are several gages in the Middle Fork Project area and vicinity. However, even with numerous gages, there may be data gaps. For example, the period of record may not be the same for all the gages. The challenge is to take the data that is available, identify data gaps, and determine how best to estimate the missing data. For areas with limited data or no data, hydrologic analysis will be augmented using comparison to similar-sized, nearby subwatersheds, precipitation estimates, or other hydrologic techniques.
5.3 STUDY METHODS
5.3.1 STREAM FLOW AND STORAGE DATA COLLECTION
The existing network of stream gaging stations will be used to describe the surface water hydrology in streams and rivers upstream and downstream of the MFP dams and reservoirs. Flow measurements have been recorded and published by the USGS from at least 47 locations within the Middle Fork American River basin. These locations are identified in Table 5-1 for reference. Most of these locations include gages that measure flow in the tributaries of the American River. However, some of the gages measure diversions from streams or flow through power plants. The locations of the known gages are shown on Figure 5-1. All of these data will be useful for developing and analyzing Project and unimpaired flow conditions in the Middle Fork American River and its tributaries.
PCWA and a number of other agencies also collect flow data in the American River Basin but these data are not necessarily transmitted to and published by the USGS. These agencies include: the SMUD, Georgetown Public Utility District (GDPUD), Foresthill Public Utility District (FPUD), and other state or federal agencies. PCWA has contacted these agencies to inquire about obtaining their unpublished data. These data will be subject to a rigorous quality control review prior to inclusion in any analysis.
Ten dams/reservoirs are present in the area of investigation that may significantly alter the timing and magnitude of natural flow in the South Fork Rubicon River, Rubicon River, Middle Fork American River and the North Fork American River. These reservoirs are identified below and are shown on Figure 5-1, for reference.
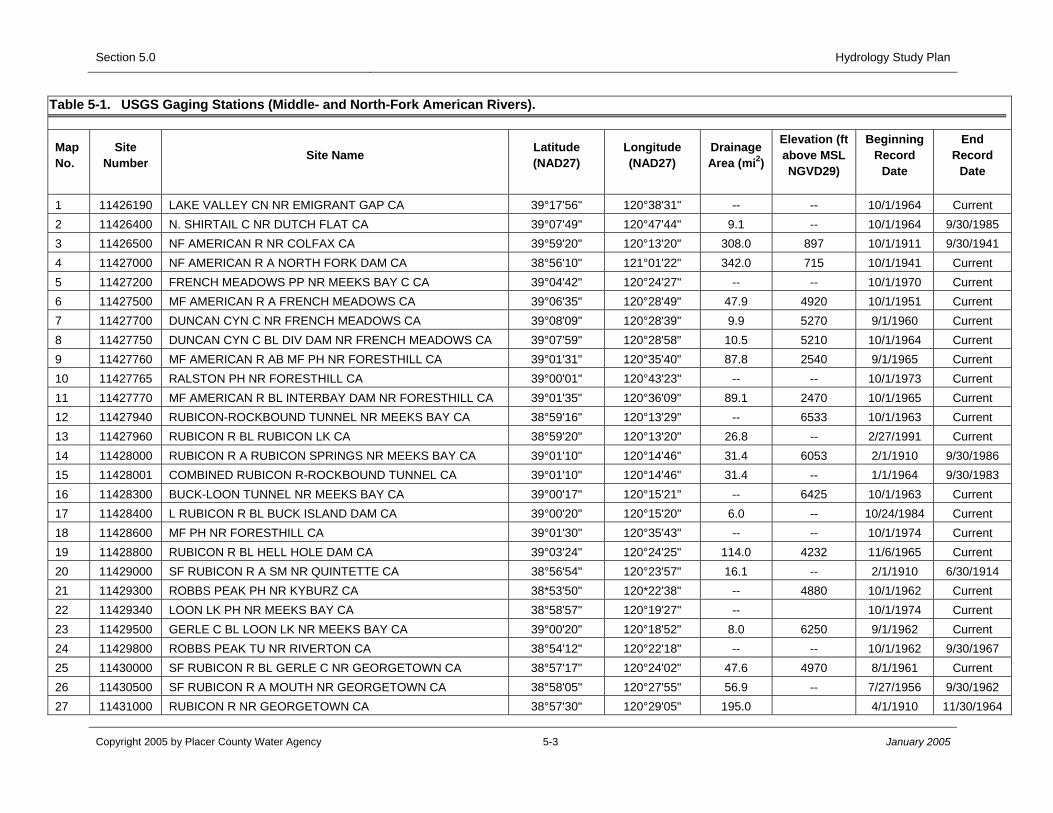
Section 5.0 Hydrology Study Plan
Table 5-1. USGS Gaging Stations (Middle- and North-Fork American Rivers).
Map No.
Site Number Site Name Latitude
(NAD27) Longitude (NAD27)
Drainage Area (mi2)
Elevation (ft above MSL NGVD29)
Beginning Record
Date
End Record
Date
1 11426190 LAKE VALLEY CN NR EMIGRANT GAP CA 39°17'56" 120°38'31" -- -- 10/1/1964 Current 2 11426400 N. SHIRTAIL C NR DUTCH FLAT CA 39°07'49" 120°47'44" 9.1 -- 10/1/1964 9/30/1985 3 11426500 NF AMERICAN R NR COLFAX CA 39°59'20" 120°13'20" 308.0 897 10/1/1911 9/30/1941 4 11427000 NF AMERICAN R A NORTH FORK DAM CA 38°56'10" 121°01'22" 342.0 715 10/1/1941 Current 5 11427200 FRENCH MEADOWS PP NR MEEKS BAY C CA 39°04'42" 120°24'27" -- -- 10/1/1970 Current 6 11427500 MF AMERICAN R A FRENCH MEADOWS CA 39°06'35" 120°28'49" 47.9 4920 10/1/1951 Current 7 11427700 DUNCAN CYN C NR FRENCH MEADOWS CA 39°08'09" 120°28'39" 9.9 5270 9/1/1960 Current 8 11427750 DUNCAN CYN C BL DIV DAM NR FRENCH MEADOWS CA 39°07'59" 120°28'58" 10.5 5210 10/1/1964 Current 9 11427760 MF AMERICAN R AB MF PH NR FORESTHILL CA 39°01'31" 120°35'40" 87.8 2540 9/1/1965 Current 10 11427765 RALSTON PH NR FORESTHILL CA 39°00'01" 120°43'23" -- -- 10/1/1973 Current 11 11427770 MF AMERICAN R BL INTERBAY DAM NR FORESTHILL CA 39°01'35" 120°36'09" 89.1 2470 10/1/1965 Current 12 11427940 RUBICON-ROCKBOUND TUNNEL NR MEEKS BAY CA 38°59'16" 120°13'29" -- 6533 10/1/1963 Current 13 11427960 RUBICON R BL RUBICON LK CA 38°59'20" 120°13'20" 26.8 -- 2/27/1991 Current 14 11428000 RUBICON R A RUBICON SPRINGS NR MEEKS BAY CA 39°01'10" 120°14'46" 31.4 6053 2/1/1910 9/30/1986 15 11428001 COMBINED RUBICON R-ROCKBOUND TUNNEL CA 39°01'10" 120°14'46" 31.4 -- 1/1/1964 9/30/1983 16 11428300 BUCK-LOON TUNNEL NR MEEKS BAY CA 39°00'17" 120°15'21" -- 6425 10/1/1963 Current 17 11428400 L RUBICON R BL BUCK ISLAND DAM CA 39°00'20" 120°15'20" 6.0 -- 10/24/1984 Current 18 11428600 MF PH NR FORESTHILL CA 39°01'30" 120°35'43" -- -- 10/1/1974 Current 19 11428800 RUBICON R BL HELL HOLE DAM CA 39°03'24" 120°24'25" 114.0 4232 11/6/1965 Current 20 11429000 SF RUBICON R A SM NR QUINTETTE CA 38°56'54" 120°23'57" 16.1 -- 2/1/1910 6/30/1914 21 11429300 ROBBS PEAK PH NR KYBURZ CA 38*53'50" 120*22'38" -- 4880 10/1/1962 Current 22 11429340 LOON LK PH NR MEEKS BAY CA 38°58'57" 120°19'27" -- 10/1/1974 Current 23 11429500 GERLE C BL LOON LK NR MEEKS BAY CA 39°00'20" 120°18'52" 8.0 6250 9/1/1962 Current 24 11429800 ROBBS PEAK TU NR RIVERTON CA 38°54'12" 120°22'18" -- -- 10/1/1962 9/30/1967 25 11430000 SF RUBICON R BL GERLE C NR GEORGETOWN CA 38°57'17" 120°24'02" 47.6 4970 8/1/1961 Current 26 11430500 SF RUBICON R A MOUTH NR GEORGETOWN CA 38°58'05" 120°27'55" 56.9 -- 7/27/1956 9/30/1962 27 11431000 RUBICON R NR GEORGETOWN CA 38°57'30" 120°29'05" 195.0 4/1/1910 11/30/1964
Copyright 2005 by Placer County Water Agency 5-3 January 2005
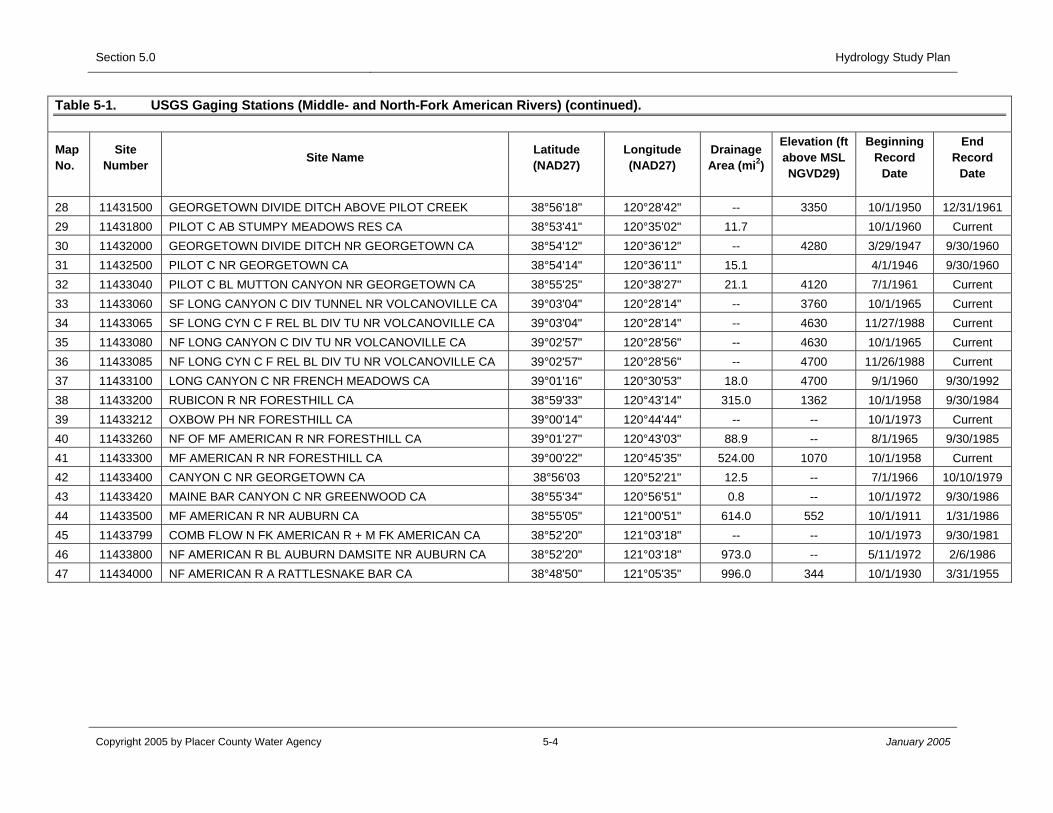
Section 5.0 Hydrology Study Plan
Table 5-1. USGS Gaging Stations (Middle- and North-Fork American Rivers) (continued).
Map No.
Site Number Site Name Latitude
(NAD27) Longitude (NAD27)
Drainage Area (mi2)
Elevation (ft above MSL NGVD29)
Beginning Record
Date
End Record
Date
28 11431500 GEORGETOWN DIVIDE DITCH ABOVE PILOT CREEK 38°56'18" 120°28'42" -- 3350 10/1/1950 12/31/1961 29 11431800 PILOT C AB STUMPY MEADOWS RES CA 38°53'41" 120°35'02" 11.7 10/1/1960 Current 30 11432000 GEORGETOWN DIVIDE DITCH NR GEORGETOWN CA 38°54'12" 120°36'12" -- 4280 3/29/1947 9/30/1960 31 11432500 PILOT C NR GEORGETOWN CA 38°54'14" 120°36'11" 15.1 4/1/1946 9/30/1960 32 11433040 PILOT C BL MUTTON CANYON NR GEORGETOWN CA 38°55'25" 120°38'27" 21.1 4120 7/1/1961 Current 33 11433060 SF LONG CANYON C DIV TUNNEL NR VOLCANOVILLE CA 39°03'04" 120°28'14" -- 3760 10/1/1965 Current 34 11433065 SF LONG CYN C F REL BL DIV TU NR VOLCANOVILLE CA 39°03'04" 120°28'14" -- 4630 11/27/1988 Current 35 11433080 NF LONG CANYON C DIV TU NR VOLCANOVILLE CA 39°02'57" 120°28'56" -- 4630 10/1/1965 Current 36 11433085 NF LONG CYN C F REL BL DIV TU NR VOLCANOVILLE CA 39°02'57" 120°28'56" -- 4700 11/26/1988 Current 37 11433100 LONG CANYON C NR FRENCH MEADOWS CA 39°01'16" 120°30'53" 18.0 4700 9/1/1960 9/30/1992 38 11433200 RUBICON R NR FORESTHILL CA 38°59'33" 120°43'14" 315.0 1362 10/1/1958 9/30/1984 39 11433212 OXBOW PH NR FORESTHILL CA 39°00'14" 120°44'44" -- -- 10/1/1973 Current 40 11433260 NF OF MF AMERICAN R NR FORESTHILL CA 39°01'27" 120°43'03" 88.9 -- 8/1/1965 9/30/1985 41 11433300 MF AMERICAN R NR FORESTHILL CA 39°00'22" 120°45'35" 524.00 1070 10/1/1958 Current 42 11433400 CANYON C NR GEORGETOWN CA 38°56'03 120°52'21" 12.5 -- 7/1/1966 10/10/1979 43 11433420 MAINE BAR CANYON C NR GREENWOOD CA 38°55'34" 120°56'51" 0.8 -- 10/1/1972 9/30/1986 44 11433500 MF AMERICAN R NR AUBURN CA 38°55'05" 121°00'51" 614.0 552 10/1/1911 1/31/1986 45 11433799 COMB FLOW N FK AMERICAN R + M FK AMERICAN CA 38°52'20" 121°03'18" -- -- 10/1/1973 9/30/1981 46 11433800 NF AMERICAN R BL AUBURN DAMSITE NR AUBURN CA 38°52'20" 121°03'18" 973.0 -- 5/11/1972 2/6/1986 47 11434000 NF AMERICAN R A RATTLESNAKE BAR CA 38°48'50" 121°05'35" 996.0 344 10/1/1930 3/31/1955
Copyright 2005 by Placer County Water Agency 5-4 January 2005
Proposed Existing Environment Study Plan Package
Copyright 2005 by Placer County Water Agency January 2005
Placeholder for Figure 5-1
Figure 5-1 Gage Station Locations
Non-Internet Public Information
These Figures have been removed in accordance with the Commission regulations at 18 CFR Section 388.112. These Figures are considered Non-Internet Public information and should not be posted on the Internet. This information may be accessed from the Placer County Water Agency’s (PCWA) Public Reference Room, but is not expected to be posted on PCWA’s Website, except as an indexed item.
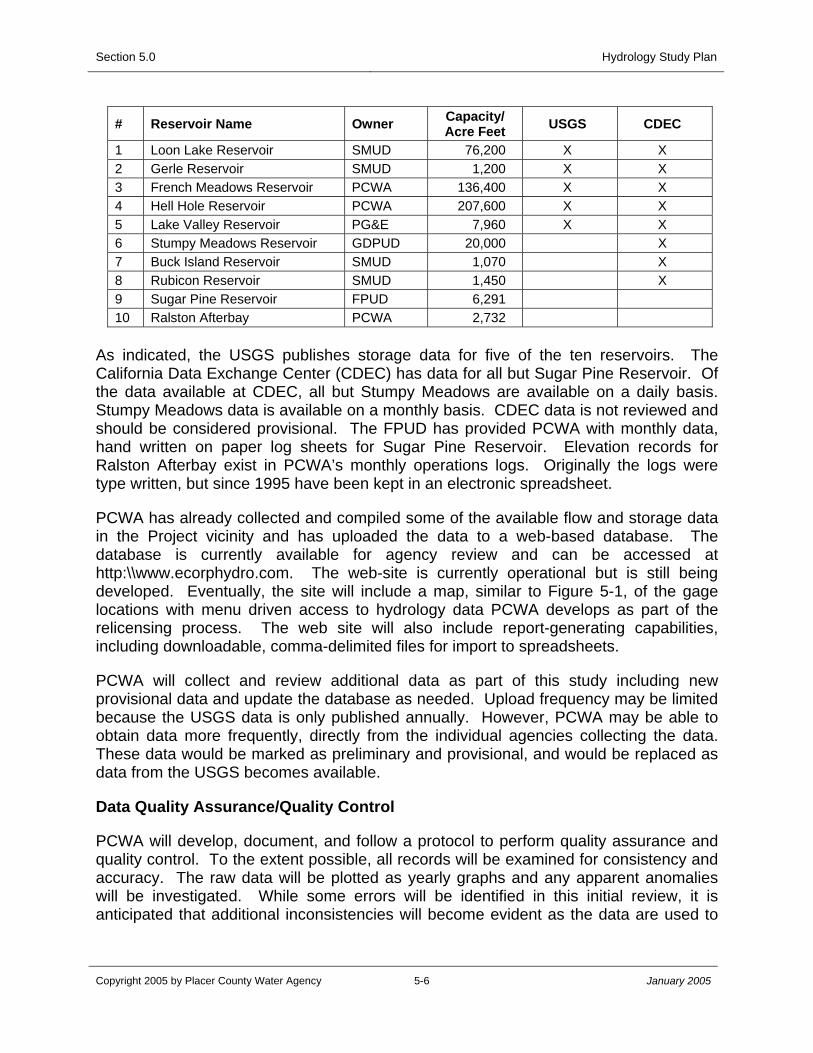
Section 5.0 Hydrology Study Plan
Copyright 2005 by Placer County Water Agency 5-6 January 2005
# Reservoir Name Owner Capacity/ Acre Feet USGS CDEC
1 Loon Lake Reservoir SMUD 76,200 X X 2 Gerle Reservoir SMUD 1,200 X X 3 French Meadows Reservoir PCWA 136,400 X X 4 Hell Hole Reservoir PCWA 207,600 X X 5 Lake Valley Reservoir PG&E 7,960 X X 6 Stumpy Meadows Reservoir GDPUD 20,000 X 7 Buck Island Reservoir SMUD 1,070 X 8 Rubicon Reservoir SMUD 1,450 X 9 Sugar Pine Reservoir FPUD 6,291 10 Ralston Afterbay PCWA 2,732
As indicated, the USGS publishes storage data for five of the ten reservoirs. The California Data Exchange Center (CDEC) has data for all but Sugar Pine Reservoir. Of the data available at CDEC, all but Stumpy Meadows are available on a daily basis. Stumpy Meadows data is available on a monthly basis. CDEC data is not reviewed and should be considered provisional. The FPUD has provided PCWA with monthly data, hand written on paper log sheets for Sugar Pine Reservoir. Elevation records for Ralston Afterbay exist in PCWA’s monthly operations logs. Originally the logs were type written, but since 1995 have been kept in an electronic spreadsheet.
PCWA has already collected and compiled some of the available flow and storage data in the Project vicinity and has uploaded the data to a web-based database. The database is currently available for agency review and can be accessed at http:\\www.ecorphydro.com. The web-site is currently operational but is still being developed. Eventually, the site will include a map, similar to Figure 5-1, of the gage locations with menu driven access to hydrology data PCWA develops as part of the relicensing process. The web site will also include report-generating capabilities, including downloadable, comma-delimited files for import to spreadsheets.
PCWA will collect and review additional data as part of this study including new provisional data and update the database as needed. Upload frequency may be limited because the USGS data is only published annually. However, PCWA may be able to obtain data more frequently, directly from the individual agencies collecting the data. These data would be marked as preliminary and provisional, and would be replaced as data from the USGS becomes available.
Data Quality Assurance/Quality Control
PCWA will develop, document, and follow a protocol to perform quality assurance and quality control. To the extent possible, all records will be examined for consistency and accuracy. The raw data will be plotted as yearly graphs and any apparent anomalies will be investigated. While some errors will be identified in this initial review, it is anticipated that additional inconsistencies will become evident as the data are used to
Section 5.0 Hydrology Study Plan
Copyright 2005 by Placer County Water Agency 5-7 January 2005
“unimpair” the flows at the key locations. All data will be described with the following sections.
• USGS or other identification number
• Geographic location
• Type of data available (flow, storage or temperature)
• Time step of data (15 minute, hourly, daily, etc.)
• Period of record
5.3.2 DATA ANALYSIS PROCEDURES
Analysis of hydrologic data will involve two primary components, developing unimpaired flows and utilizing the Project and unimpaired hydrologic data to conduct specific analyses. These components are described further in the following.
Developing Unimpaired Flows
Unimpaired flows will be used in both the environmental studies and hydrologic analysis of the system. Proposed unimpaired flow locations include:
A. Duncan Canyon Creek below Duncan Creek Diversion B. Middle Fork American below French Meadows Reservoir C. Middle Fork American River below Middle Fork Interbay D. Middle Fork American River below Ralston Afterbay E. Middle Fork American River below Foresthill F. North Fork American River downstream of the confluence of the Middle Fork
American River G. Rubicon River below Hell Hole Reservoir H. Rubicon River downstream of confluence of South Fork Rubicon River I. North Fork Long Canyon Creek below North Fork Long Canyon Diversion J. South Fork Long Canyon Creek below of the South Fork Long Canyon Diversion K. Long Canyon Creek L. Pilot Creek below Mutton Canyon, near Georgetown
Unimpaired Flow Data from SMUD
SMUD owns and operates the Upper American River Project (UARP) that includes facilities on the Rubicon River and its tributaries, upstream of some of the MFP facilities. As part of the data gathering process, PCWA reviewed the Sacramento Municipal Utility District’s Upper American River Project and Pacific Gas and Electric Company’s Chili
Section 5.0 Hydrology Study Plan
Copyright 2005 by Placer County Water Agency 5-8 January 2005
Bar Project Technical Report on Hydrology dated April 2004. During the review, four key locations were identified that can be used in the development of unimpaired stream flows along the Rubicon River. Due to the complex operations of the UARP and SMUD’s familiarity with the watershed, the unimpaired flow estimates are likely the best available. However, PCWA proposes to review SMUD’s estimates of unimpaired flow and consult with the resource agencies to determine the suitability of including these estimates as part of an unimpaired flow analysis in the Rubicon River. Locations M–P, below, are the four key locations in the Rubicon watershed where unimpaired flows were developed by SMUD.
M. Rubicon River below Rubicon Reservoir N. Little Rubicon River below Buck Island Reservoir O. Gerle Creek below Gerle Lake P. South Fork Rubicon River above Rubicon River
Methods for calculating unimpaired flows vary by the type of information available for the specified stream location. The basic principle is to remove the effects of man-made structures on stream flow. That process may be as simple as adding measured diversions to a stream gage below the diversion. Estimates where reservoirs are involved can include a more complex formula including change in storage plus outflow (releases, diversions, evaporation, leakage, etc). Records often include periods where data is missing. In those cases, correlations will be developed with other nearby gages to fill gaps in the data. If gaged data is not available, area relationships can be developed with nearby unimpaired gages in watersheds of similar characteristics. Choosing a method depends on what data is available. The proposed list of unimpaired flow locations assumes sufficient data is available to develop estimates. If sufficient data is not available, PCWA will consult with the resource agencies to discuss alternative approaches.
Data Analysis
PCWA will perform a variety of hydrologic analyses for both Project and unimpaired flows. Important steps in the process are 1) selecting the period of record for analysis, and; 2) establishing an appropriate water year type classification system. Accordingly, PCWA will first work with the resource agencies to establish the period of record that should be evaluated. PCWA will then complete basic statistical analyses using hydrologic data for the agreed upon period of record. After reviewing the hydrologic data, PCWA will work with the resource agencies to select an appropriate water year classification system. Currently, PCWA does not operate the MFP using typical year type criteria (i.e. the Department of Water’s (DWR’s) classification system). Instead, PCWA uses three different storage and two different release operating criteria that are tied to Folsom Reservoir annual unimpaired inflow. The year type classification system to be used for the MFP relicensing studies will need to consider PCWA’s operating criteria and obvious hydrologic data breaks.
Section 5.0 Hydrology Study Plan
Copyright 2005 by Placer County Water Agency 5-9 January 2005
Once concurrence with the resource agencies has been reached on the period of record and water year type classification, the magnitude, timing, duration, rate of change and frequency of flows will be described with hydrographs and exceedance tables. The time-scales will be those allowed by the existing data, daily, monthly, hourly, or in 15-minute increments. A series of tables will also be generated from the streamflow gaging data including: mean monthly flow, monthly exceedance flows, and mean daily flow for each year of the period of record. Duration curves depicting the median flow for each station will also be generated. In addition, hydrographs illustrating mean daily stream flow at the point of diversion and in the bypassed reaches for each month of representative water year types will be presented. The hydrologic analyses will also provide the following information:
• Flood frequency curves for both Project and unimpaired flows (both mean daily flow and instantaneous flow depending on data availability).
• Base flow curves for both Project and unimpaired flows (mean daily flow depending on data availability.
• Return intervals for peak flows (1.5, 2, 5, 10, and 25 years depending on data availability).
• Return intervals on 14-day high flows.
IHA Analysis
The Indicators of Hydrologic Alteration (IHA) program developed by Richter et al (1996) allows calculation of up to 32 hydrologic parameters to compare the degree of hydrologic alteration on the magnitude, timing, frequency, duration, and rate of change in a system using biologically relevant variables. PCWA anticipates that the resource agencies will be interested in running the IHA model. Accordingly, PCWA will perform the IHA analysis using all of the selected indicators of hydrologic alteration if requested by the resource agencies.
5.4 REPORTING
A progress report will be prepared for agency review in mid-2005 summarizing the availability of existing hydrologic data. This information will be used to identify, through agency consultation, the period of record for hydrologic analysis. A detailed report presenting the results of the hydrologic analyses proposed for this phase of work will be distributed for agency review and comment in January 2006.
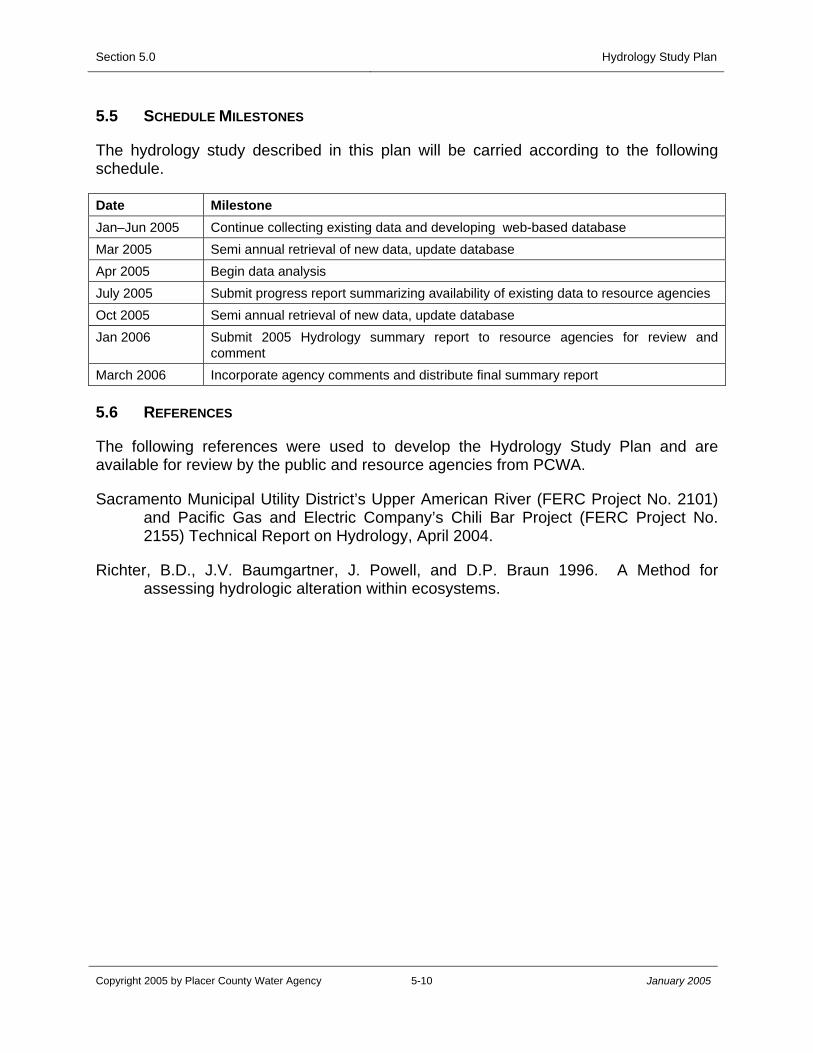
Section 5.0 Hydrology Study Plan
Copyright 2005 by Placer County Water Agency 5-10 January 2005
5.5 SCHEDULE MILESTONES
The hydrology study described in this plan will be carried according to the following schedule.
Date Milestone Jan–Jun 2005 Continue collecting existing data and developing web-based database Mar 2005 Semi annual retrieval of new data, update database Apr 2005 Begin data analysis July 2005 Submit progress report summarizing availability of existing data to resource agencies Oct 2005 Semi annual retrieval of new data, update database Jan 2006 Submit 2005 Hydrology summary report to resource agencies for review and
comment March 2006 Incorporate agency comments and distribute final summary report 5.6 REFERENCES
The following references were used to develop the Hydrology Study Plan and are available for review by the public and resource agencies from PCWA.
Sacramento Municipal Utility District’s Upper American River (FERC Project No. 2101) and Pacific Gas and Electric Company’s Chili Bar Project (FERC Project No. 2155) Technical Report on Hydrology, April 2004.
Richter, B.D., J.V. Baumgartner, J. Powell, and D.P. Braun 1996. A Method for assessing hydrologic alteration within ecosystems.
APPENDIX A
Project Description Placer County Water Agency
Middle Fork American River Hydroelectric Project (FERC Project No. 2079)
Copyright 2005 by Placer County Water Agency January 2005
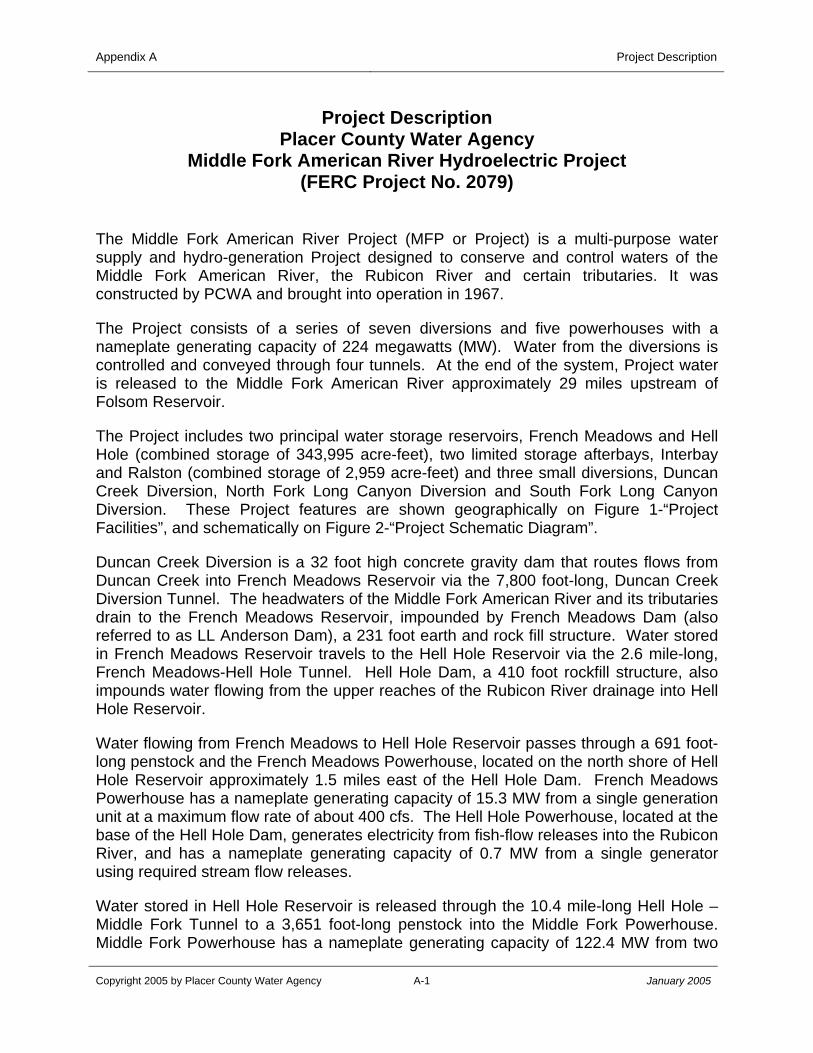
Appendix A Project Description
Copyright 2005 by Placer County Water Agency A-1 January 2005
Project Description Placer County Water Agency
Middle Fork American River Hydroelectric Project (FERC Project No. 2079)
The Middle Fork American River Project (MFP or Project) is a multi-purpose water supply and hydro-generation Project designed to conserve and control waters of the Middle Fork American River, the Rubicon River and certain tributaries. It was constructed by PCWA and brought into operation in 1967.
The Project consists of a series of seven diversions and five powerhouses with a nameplate generating capacity of 224 megawatts (MW). Water from the diversions is controlled and conveyed through four tunnels. At the end of the system, Project water is released to the Middle Fork American River approximately 29 miles upstream of Folsom Reservoir.
The Project includes two principal water storage reservoirs, French Meadows and Hell Hole (combined storage of 343,995 acre-feet), two limited storage afterbays, Interbay and Ralston (combined storage of 2,959 acre-feet) and three small diversions, Duncan Creek Diversion, North Fork Long Canyon Diversion and South Fork Long Canyon Diversion. These Project features are shown geographically on Figure 1-“Project Facilities”, and schematically on Figure 2-“Project Schematic Diagram”.
Duncan Creek Diversion is a 32 foot high concrete gravity dam that routes flows from Duncan Creek into French Meadows Reservoir via the 7,800 foot-long, Duncan Creek Diversion Tunnel. The headwaters of the Middle Fork American River and its tributaries drain to the French Meadows Reservoir, impounded by French Meadows Dam (also referred to as LL Anderson Dam), a 231 foot earth and rock fill structure. Water stored in French Meadows Reservoir travels to the Hell Hole Reservoir via the 2.6 mile-long, French Meadows-Hell Hole Tunnel. Hell Hole Dam, a 410 foot rockfill structure, also impounds water flowing from the upper reaches of the Rubicon River drainage into Hell Hole Reservoir.
Water flowing from French Meadows to Hell Hole Reservoir passes through a 691 foot-long penstock and the French Meadows Powerhouse, located on the north shore of Hell Hole Reservoir approximately 1.5 miles east of the Hell Hole Dam. French Meadows Powerhouse has a nameplate generating capacity of 15.3 MW from a single generation unit at a maximum flow rate of about 400 cfs. The Hell Hole Powerhouse, located at the base of the Hell Hole Dam, generates electricity from fish-flow releases into the Rubicon River, and has a nameplate generating capacity of 0.7 MW from a single generator using required stream flow releases.
Water stored in Hell Hole Reservoir is released through the 10.4 mile-long Hell Hole – Middle Fork Tunnel to a 3,651 foot-long penstock into the Middle Fork Powerhouse. Middle Fork Powerhouse has a nameplate generating capacity of 122.4 MW from two

Appendix A Project Description
Copyright 2005 by Placer County Water Agency A-2 January 2005
generating units at a design flow rate of about 990 cfs. Middle Fork Powerhouse releases water to Middle Fork Interbay, impounded by Interbay Dam, a 70 foot high concrete dam on the Middle Fork American River. Interbay Reservoir acts as an afterbay for the Middle Fork Powerhouse and as a forebay for the inlet to the Middle Fork-Ralston Tunnel.
Water in the Hell Hole - Middle Fork Tunnel is augmented by diversions from the North and South Forks of Long Canyon Creeks. Water diverted by a 10 foot concrete gravity dam from North Fork Long Canyon Creek and a 27 foot concrete gravity dam from South Fork Long Canyon Creek flows through respective short metal pipes into 6 foot diameter vertical shafts into the Hell Hole – Middle Fork Tunnel.
The 6.7 mile-long, Middle Fork-Ralston Tunnel terminates in a 1,670 foot-long penstock that supplies water to drive a single generating unit at the Ralston Powerhouse. The powerhouse has a nameplate electrical generating capacity of 79.2 MW from a single generating unit at a maximum flow rate of about 924 cfs, and discharges to the Ralston Afterbay. The Ralston Afterbay Dam is a 89 foot concrete dam located on the Middle Fork American River just down stream of the Rubicon River’s confluence with the Middle Fork American River.
The Ralston Afterbay supplies water to the 400 foot-long Oxbow Tunnel. Oxbow Powerhouse at the downstream end of the tunnel has a nameplate electrical generating capacity of 6.1 MW from a single generator at a maximum flow rate of about 1075 cfs.
Water from the Oxbow Powerhouse is discharged back to the Middle Fork American River approximately 29 miles upstream of Folsom Reservoir.
Operation of the Middle Fork Project
The Project is operated to meet three objectives: maintenance of water flows to protect environmental resources, water supply for PCWA customers, and generation of electrical energy. In addition to the FERC license, operation of the Project is also governed by water rights permits, water supply contracts, and a power purchase contract with PG&E. Water flows to protect and maintain environmental resources are defined in the FERC License and in agreements with the State of California.
The water rights permits, water supply contracts and FERC License conditions constrain how PCWA plans for water use and how PG&E optimizes electrical generation. Management of flows is also constrained by the water available annually and within each season. In late fall and early winter the water levels in French Meadows and Hell Hole reservoirs are reduced to provide adequate storage to manage spring runoff. The fall/winter drawdown must balance the objectives of providing sufficient storage space to minimizing the potential for spilling the reservoirs if the following spring is wet, but must also retain sufficient water in storage to ensure an adequate water supply to meet environmental and consumptive demands if the following spring is dry. During spring runoff operating flows are adjusted to store as much runoff as possible without spilling the reservoirs. After the reservoirs have
Appendix A Project Description
Copyright 2005 by Placer County Water Agency A-3 January 2005
reached their maximum capacity in late spring or summer, flows are regulated to first meet environmental flow requirements, then to meet consumptive water supply requirements, and then to optimize power generation. Operation of the system varies from year to year based on the winter snow pack and amount of precipitation (wet year vs. dry).
Under typical operating conditions the Project generates approximately 1 million-megawatt hours annually. Operations patterns for the Project may include full load operations (typically during when runoff is high), “peaking” operations (when the Project is operated 15 to 18 hours a day to conserve water but help meet peak electrical demand), to low flow operations to conserve water for consumptive use or during Project maintenance periods.
While not within the FERC Project Boundaries, PCWA’s consumptive water rights permits identify two points of diversion for water for consumptive purposes downstream of the Project facilities. The Auburn Pumping Station diversion point is approximately 28 miles downstream of the Project’s FERC boundary. The second point of consumptive diversion is via facilities near Folsom Dam, at the downstream end of Folsom Reservoir, approximately 48 miles downstream of the Project’s FERC boundary.

FIGURES
Copyright 2005 by Placer County Water Agency January 2005
Proposed Existing Environment Study Plan Package
Copyright 2005 by Placer County Water Agency January 2005
Placeholder for Figure 1
Figure 1 Project Facilities
Non-Internet Public Information
These Figures have been removed in accordance with the Commission regulations at 18 CFR Section 388.112. These Figures are considered Non-Internet Public information and should not be posted on the Internet. This information may be accessed from the Placer County Water Agency’s (PCWA) Public Reference Room, but is not expected to be posted on PCWA’s Website, except as an indexed item.
Proposed Existing Environment Study Plan Package
Copyright 2005 by Placer County Water Agency January 2005
Placeholder for Figure 2
Figure 2 Project Schematic Diagram
Non-Internet Public Information
These Figures have been removed in accordance with the Commission regulations at 18 CFR Section 388.112. These Figures are considered Non-Internet Public information and should not be posted on the Internet. This information may be accessed from the Placer County Water Agency’s (PCWA) Public Reference Room, but is not expected to be posted on PCWA’s Website, except as an indexed item.
APPENDIX B
Summary of Stream and Reservoir Water Temperature Pilot Program
Copyright 2005 by Placer County Water Agency January 2005
Placer County Water Agency Middle Fork American River Hydroelectric Project
(FERC NO. 2079)
Summary of Stream and Reservoir Water Temperature Pilot Program
Prepared for:
Placer County Water Agency P.O. Box 6590
Auburn, CA 95604
Prepared by:
Surface Water Resources, Inc.
2031 Howe Ave., Suite 110 Sacramento, CA 95825
January 28, 2005
Copyright 2005 by Placer County Water Agency January 2005
Appendix B Summary of Stream and ReservoirWater Temperature Pilot Program
Copyright 2005 by Placer County Water Agency B-i January 2005
TABLE OF CONTENTS
Page
1.0 Introduction .............................................................................................................. 1 2.0 Geographic Setting .................................................................................................. 2 3.0 Construction of Pilot Program .................................................................................. 2 4.0 Data Collection Objectives and Methods ................................................................. 3
4.1 Stream Temperature Monitoring........................................................................... 3 4.1.1 Objectives...................................................................................................... 3 4.1.2 Methods......................................................................................................... 3
4.2 Reservoir Water Temperature Profiling ................................................................ 4 4.2.1 Objectives...................................................................................................... 4 4.2.2 Methods......................................................................................................... 4
5.0 Results and Recommendations ............................................................................... 9 5.1 Stream Temperature Monitoring........................................................................... 9
5.1.1 Duncan Canyon Creek ................................................................................ 10 5.1.2 Middle Fork American River ........................................................................ 10 5.1.3 Long Canyon Creek .................................................................................... 11 5.1.4 Rubicon River.............................................................................................. 11 5.1.5 North Fork American River .......................................................................... 12 5.1.6 Recommendations ...................................................................................... 12
5.2 Reservoir Water Temperature Profiling .............................................................. 13 5.2.1 French Meadows Reservoir......................................................................... 13 5.2.2 Hell Hole Reservoir ..................................................................................... 14 5.2.3 Recommendations ...................................................................................... 15
5.3 Meteorological Monitoring .................................................................................. 15 5.3.1 Recommendations ...................................................................................... 16
Appendix B Summary of Stream and ReservoirWater Temperature Pilot Program
Copyright 2005 by Placer County Water Agency B-ii January 2005
Table
Table 1. Current Water Temperature Monitoring Locations Associated with the MFP.
Figures
Figure 1. The Stream and Reservoir Network in the Vicinity of the MFP. Figure 2. The Current Water Temperature, Air Temperature and Relative Humidity
Monitoring Station Locations in the vicinity of the MFP. Figure 3. Water Temperature Profile Locations in French Meadows Reservoir. Figure 4. Water Temperature Profile Locations in Hell Hole Reservoir. Figure 5. Comparison of Daily Average Water Temperatures Measured in Duncan
Canyon Creek Upstream (DC1) and Downstream (DC2) from Duncan Canyon Creek Diversion Dam.
Figure 6. Comparison of Daily Average Water Temperatures Measured in the Middle Fork American River.
Figure 7. Comparison of Daily Average Water Temperatures Measured in North Long Canyon Creek Upstream (NL1) and Downstream (NL2) from North Fork Diversion Dam, and South Long Canyon Creek Upstream (SL1) and Downstream (SL2) from South Fork Diversion Dam.
Figure 8. Comparison of Daily Average Water Temperatures Measured Upstream (FL1 and RR1) and Downstream (RR2 and RR4) from Hell Hole Reservoir.
Figure 9. French Meadows Reservoir Water Temperature Profiles at Site FM1 on September 7, 20, 30 and October 13, 2004.
Figure 10. Hell Hole Reservoir Water Temperature Profiles of Site HH2 on September 7, 20, 30 and October 13, 2004.
Appendix B Summary of Stream and ReservoirWater Temperature Pilot Program
Copyright 2005 by Placer County Water Agency B-iii January 2005
Attachment A
Figure A.1 Daily Average and Range of Water Temperatures in Duncan Canyon Creek Upstream from Duncan Canyon Creek Diversion Dam (DC1).
Figure A.2 Daily Average and Range of Water Temperatures in Duncan Canyon Creek Downstream from Duncan Canyon Creek Diversion Dam (DC2).
Figure A.3 Daily Average and Range of Water Temperatures in the Middle Fork American River Downstream from French Meadows Reservoir (MF2).
Figure A.4 Daily Average and Range of Water Temperatures from the Middle Fork American River Upstream from Middle Fork Powerplant (MF3).
Figure A.5 Daily Average and Range of Water Temperatures in the Middle Fork American River Downstream from Middle Fork Interbay (MF4).
Figure A.6 Daily Average and Range of Water Temperatures in the Middle Fork American River Downstream from Ralston Afterbay Dam (MF5).
Figure A.7 Daily Average and Range of Water Temperatures in the Middle Fork American River Downstream from Oxbow Powerplant (MF6).
Figure A.8 Daily Average and Range of Water Temperatures in the Middle Fork American River Downstream from the North Fork of the Middle Fork American River Confluence (MF7).
Figure A.9 Daily Average and Range of Water Temperatures in North Long Canyon Creek Upstream from North Fork Diversion Dam (NL1).
Figure A.10 Daily Average and Range of Water Temperatures in North Long Canyon Creek Downstream from North Fork Diversion Dam (NL2).
Figure A.11 Daily Average and Range of Water Temperatures in South Long Canyon Creek Upstream from South Fork Diversion Dam (SL1).
Figure A.12 Daily Average and Range of Water Temperatures in South Long Canyon Creek Downstream from South Fork Diversion Dam (SL2).
Figure A.13 Daily Average and Range of Water Temperatures in Five Lakes Creek Upstream from Hell Hole Reservoir (FL1).
Figure A.14 Daily Average and Range of Water Temperatures in the Rubicon River Upstream from Hell Hole Reservoir (RR1).
Figure A.15 Daily Average and Range of Water Temperatures in the Rubicon River Downstream from Hell Hole Reservoir (RR2).
Figure A.16 Daily Average and Range of Water Temperatures in the Rubicon River Upstream from Ralston Powerplant (RR4).
Figure A.17 Daily Average and Range of Water Temperatures from North Fork American River Downstream from the Middle Fork American River Confluence (NF2).
Appendix B Summary of Stream and ReservoirWater Temperature Pilot Program
Copyright 2005 by Placer County Water Agency B-iv January 2005
Attachment A (continued)
Figure A.18 Daily Average and Range of Water Temperatures from North Fork American River at the Former Auburn Dam Site.
Figure A.19 French Meadows Reservoir Water Temperature Profiles of Sites FM1, FM2 and FM3 on September 7, 2004.
Figure A.20 French Meadows Reservoir Water Temperature Profiles of Sites FM1, FM2 and FM3 on September 20, 2004.
Figure A.21 French Meadows Reservoir Water Temperature Profiles of Sites FM1, FM2 and FM3 on September 30, 2004.
Figure A.22 French Meadows Reservoir Water Temperature Profiles of Sites FM1, FM2 and FM3 on October 13, 2004.
Figure A.23 Hell Hole Reservoir Water Temperature Profiles of Sites HH1, HH2 and HH3 on September 7, 2004.
Figure A.24 Hell Hole Reservoir Water Temperature Profiles of Sites HH1, HH2 and HH3 on September 20, 2004.
Figure A.25 Hell Hole Reservoir Water Temperature Profiles of Sites HH1, HH2 and HH3 on September 30, 2004.
Figure A.26 Hell Hole Reservoir Water Temperature Profiles of Sites HH1, HH2 and HH3 on October 13, 2004.
Appendix B Summary of Stream and ReservoirWater Temperature Pilot Program
Copyright 2005 by Placer County Water Agency B-1 January 2005
1.0 INTRODUCTION
To prepare for relicensing, Placer County Water Agency (PCWA) searched various databases and resource agency records to determine whether existing historical water temperature information is available for the streams, rivers and reservoirs in the vicinity of the Middle Fork American River Hydroelectric Project (MFP or Project). PCWA’s search included examining records maintained by public agencies and private organizations, including:
• United States Geological Survey (USGS);
• California Department of Water Resources (DWR);
• U.S. Environmental Protection Agency (EPA);
• Sacramento Municipal Water District (SMUD);
• U.S. Forest Service (USFS);
• U.S. Bureau of Reclamation (USBR);
• PCWA’s historical data; and
• Other databases and published reports.
To date, PCWA has determined that three types of existing historical water temperature data are available for the streams and rivers in the vicinity of the MFP: 1) spot measurements; 2) continuous data from two temperature monitoring stations; and 3) data collected in association with a recent sediment transport study in the Middle Fork American River, downstream of PCWA’s Oxbow Powerhouse. In addition, a limited amount of meteorological data exists. Existing water temperature data does not appear to be available for any of the Project reservoirs.
Spot water temperature measurements are available for the streams and rivers at various locations in the vicinity of the MFP. Spot water temperature measurements are those taken periodically during the collection of other, specifically targeted, water quality parameters such as dissolved oxygen, bacteria, or chemical constituents, or during normal flow gage maintenance. Although potentially useful for some comparisons, spot water temperatures cannot be used to characterize stream or reservoir water temperatures.
Continuous water temperature data is available from two stations, one operated by the USGS and the other operated by SMUD. The USGS station is located on the Middle Fork American River, downstream from the MFP, at the former Auburn Dam site. This station has been operated continuously since 1999 and the data from this station is publicly available. SMUD’s water temperature monitoring station is located on the South
Appendix B Summary of Stream and ReservoirWater Temperature Pilot Program
Copyright 2005 by Placer County Water Agency B-2 January 2005
Fork Rubicon River, which discharges to the Rubicon River, downstream from Hell Hole Reservoir. SMUD has offered to share its data with PCWA.
PCWA has collected some continuous water temperature data in the American River, downstream of the Oxbow Powerhouse. These data were collected in 2002, 2003 and 2004 in association with a sediment transport study. No other continuous historical water temperature data for any of the streams, rivers and reservoirs within the vicinity of the MFP were identified.
A limited amount of meteorological data is available from three stations situated in the vicinity of the MFP, one located at Greek Store in the Duncan Canyon Creek basin, one located in the upper Duncan Canyon Creek basin, and one located at Hell Hole Reservoir. The Greek Store station is operated by the USBR and measures, among other parameters, precipitation and air temperature. Data from this site is available from 1995 through present. The upper Duncan Canyon Creek area station is operated by the USFS and measures, among other parameters, relative humidity, solar radiation, precipitation and air temperature. Data from this site is available from 2001 through present. The Hell Hole station is operated by the USFS. Air temperature and precipitation data are available from this station from 1991 through April 2004. Relative humidity data is available from 1995 through April 2004.
2.0 GEOGRAPHIC SETTING
The MFP is located on the Middle Fork American River, the Rubicon River and several tributaries. The principal Project features include two primary reservoirs (Hell Hole and French Meadows), five smaller impoundments, water conveyance facilities and five powerplants. The reservoirs and streams in the vicinity of the MFP are shown on Figure 1.
3.0 CONSTRUCTION OF PILOT PROGRAM
Considering the absence of widespread and continuous water temperature data for the rivers, streams and reservoirs in the vicinity of the MFP, PCWA initiated a pilot program to monitor the stream and river reaches associated with the MFP. The pilot program consisted of installing water temperature monitoring stations and profiling the two primary Project reservoirs, Hell Hole and French Meadows, as summarized in the following.
PCWA installed 22 water temperature loggers in the streams and rivers in the vicinity of the MFP during September and October of 2003. Selection of water temperature monitoring sites to be included in the pilot program considered:
• The location of MFP diversions and powerplants;
• The influence of major tributaries, and the potential of each to affect the water temperatures in the vicinity of the MFP;
Appendix B Summary of Stream and ReservoirWater Temperature Pilot Program
Copyright 2005 by Placer County Water Agency B-3 January 2005
• The locations of established instream flow monitoring stations;
• The locations of existing water temperature monitoring stations; and
• Site accessibility.
Section 4.1 provides greater detail on general and specific water temperature monitoring site selection considerations and criteria.
Data from most of the 22 temperature gages was downloaded and reviewed, and the results prompted PCWA to install eight additional water temperature loggers during the summer of 2004. Additionally, due to the absence of available reservoir water temperature data in the primary MFP reservoirs, PCWA initiated a reservoir profiling program in the fall of 2004. PCWA also installed six ambient air temperature and relative humidity loggers to obtain meteorological information that could be used to help interpret the water temperature data. The locations of these relative humidity/ambient air temperature loggers are shown on Figure 2.
Currently, the water temperature monitoring array consists of 32 stream monitoring stations (30 maintained by PCWA, one maintained by SMUD and one maintained by the USGS), and three reservoir profiling sites each in French Meadows and Hell Hole. The following describes PCWA’s water temperature monitoring and reservoir profiling pilot program in more detail, and provides recommendations for future water temperature monitoring.
4.0 DATA COLLECTION OBJECTIVES AND METHODS
4.1 STREAM TEMPERATURE MONITORING
4.1.1 OBJECTIVES
The principal objectives of the stream water temperature monitoring program were to characterize water temperatures in the streams and rivers upstream and downstream of MFP facilities and to determine how major tributaries influence water temperatures in the Middle Fork American River and the Rubicon River. Figure 2 illustrates the current array of water temperature stations associated with the water temperature monitoring program.
4.1.2 METHODS
General Water Temperature Logger Site Selection
Monitoring locations are situated to reflect the complex movement of water throughout the MFP system. Table 1 describes the locations, installation dates, and measurement objectives for the 32 water temperature loggers currently monitoring water temperatures in the streams and rivers in the vicinity of the MFP, including the 30 stations installed by PCWA and each of the stations maintained by SMUD and the USGS.
Appendix B Summary of Stream and ReservoirWater Temperature Pilot Program
Copyright 2005 by Placer County Water Agency B-4 January 2005
Specific Water Temperature Logger Site Selection
The specific placement and procedures for installing the water temperature gages required consideration of several issues. The installation of each logger followed standard manufacturer and USGS protocols. Water temperature gages were placed in areas considered to be representative of the thermal characteristics of the river in the area.
The water temperature data loggers were placed as near the thalweg of the stream channel as possible to ensure complete mixing of the water, in consideration of potential seasonal fluctuations in streamflow. The document titled “Water Temperature Monitoring Station Installation, PCWA Middle Fork Project, Draft Report, December 2003” (PCWA 2003) provides additional details regarding the installation procedure for the water temperature loggers. PCWA (2003), in association with “Water Temperature Monitoring Station Installation, PCWA Middle Fork Project, Addendum, October 2004” (PCWA 2004), provides specific site accounts for each water temperature logger installed for the MFP water temperature monitoring pilot program.
4.2 RESERVOIR WATER TEMPERATURE PROFILING
4.2.1 OBJECTIVES
The primary objective of the reservoir water temperature profiling program was to characterize the water temperatures of the MFP reservoirs and to identify the occurrence, timing and nature of the thermal processes, such as thermal stratification, occurring in MFP reservoirs.
4.2.2 METHODS
Water temperature profiling efforts were undertaken on September 7, 20, 30 and October 13, 2004 at French Meadows and Hell Hole reservoirs. Three locations within each reservoir were profiled to identify potential longitudinal water temperature gradients that may exist within each reservoir. Figures 3 and 4 illustrate the profile locations in French Meadows and Hell Hole reservoirs, respectively.
Utilizing topographic maps of the reservoirs, the French Meadows and Hell Hole reservoir monitoring locations were chosen first by selecting a site along the former stream channel near the dam (FM1 and HH1, respectively). The upstream sample site (FM3 and HH3) was selected next by identifying a site along the former stream channel in the upper end of the main body of each reservoir. The third sample location (FM2 and HH2) was placed within the former stream channel approximately midway between the lower- and upper-most sites. The approximate geographical coordinates of each site were determined using ESRI ArcMap – ArcView and were input as waypoints into a Garmin III Plus Global Positioning System (GPS) receiver.
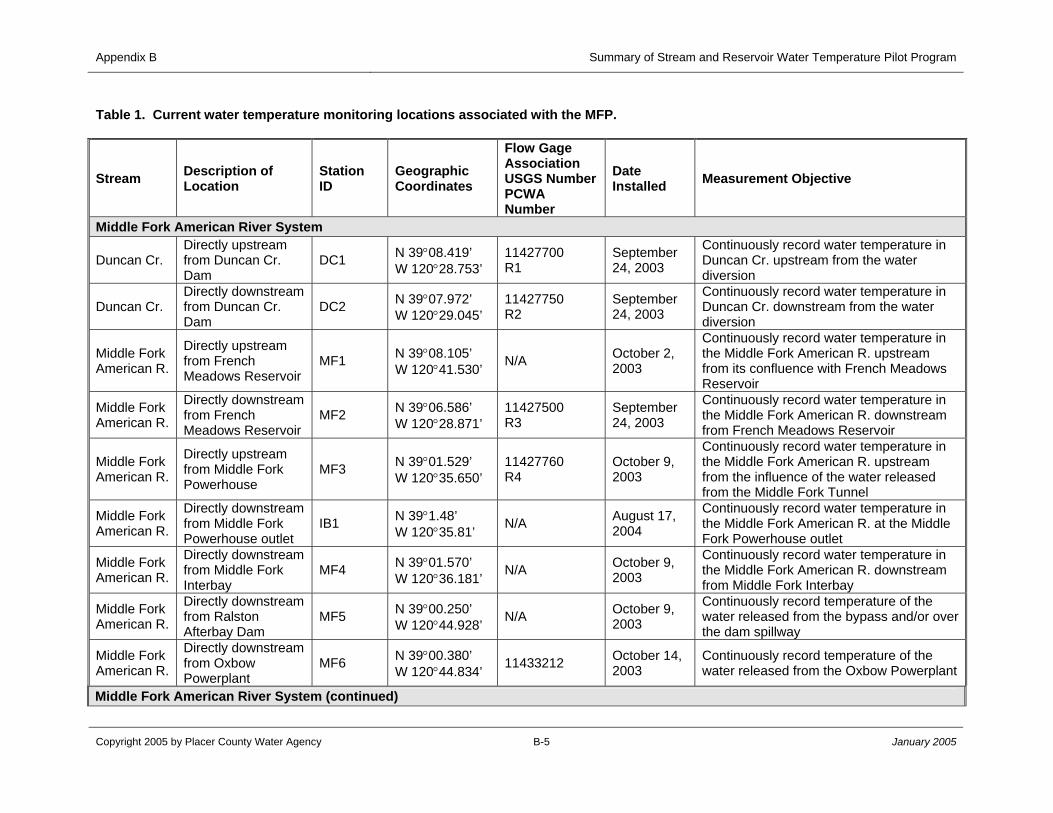
Appendix B Summary of Stream and Reservoir Water Temperature Pilot Program
Table 1. Current water temperature monitoring locations associated with the MFP.
Stream Description of Location
Station ID
Geographic Coordinates
Flow Gage Association USGS Number PCWA Number
Date Installed Measurement Objective
Middle Fork American River System
Duncan Cr. Directly upstream from Duncan Cr. Dam
DC1 N 39°08.419’ W 120°28.753’
11427700 R1
September 24, 2003
Continuously record water temperature in Duncan Cr. upstream from the water diversion
Duncan Cr. Directly downstream from Duncan Cr. Dam
DC2 N 39°07.972’ W 120°29.045’
11427750 R2
September 24, 2003
Continuously record water temperature in Duncan Cr. downstream from the water diversion
Middle Fork American R.
Directly upstream from French Meadows Reservoir
MF1 N 39°08.105’ W 120°41.530’ N/A October 2,
2003
Continuously record water temperature in the Middle Fork American R. upstream from its confluence with French Meadows Reservoir
Middle Fork American R.
Directly downstream from French Meadows Reservoir
MF2 N 39°06.586’ W 120°28.871’
11427500 R3
September 24, 2003
Continuously record water temperature in the Middle Fork American R. downstream from French Meadows Reservoir
Middle Fork American R.
Directly upstream from Middle Fork Powerhouse
MF3 N 39°01.529’ W 120°35.650’
11427760 R4
October 9, 2003
Continuously record water temperature in the Middle Fork American R. upstream from the influence of the water released from the Middle Fork Tunnel
Middle Fork American R.
Directly downstream from Middle Fork Powerhouse outlet
IB1 N 39°1.48’ W 120°35.81’ N/A August 17,
2004
Continuously record water temperature in the Middle Fork American R. at the Middle Fork Powerhouse outlet
Middle Fork American R.
Directly downstream from Middle Fork Interbay
MF4 N 39°01.570’ W 120°36.181’ N/A October 9,
2003
Continuously record water temperature in the Middle Fork American R. downstream from Middle Fork Interbay
Middle Fork American R.
Directly downstream from Ralston Afterbay Dam
MF5 N 39°00.250’ W 120°44.928’ N/A October 9,
2003
Continuously record temperature of the water released from the bypass and/or over the dam spillway
Middle Fork American R.
Directly downstream from Oxbow Powerplant
MF6 N 39°00.380’ W 120°44.834’ 11433212 October 14,
2003 Continuously record temperature of the water released from the Oxbow Powerplant
Middle Fork American River System (continued)
Copyright 2005 by Placer County Water Agency B-5 January 2005
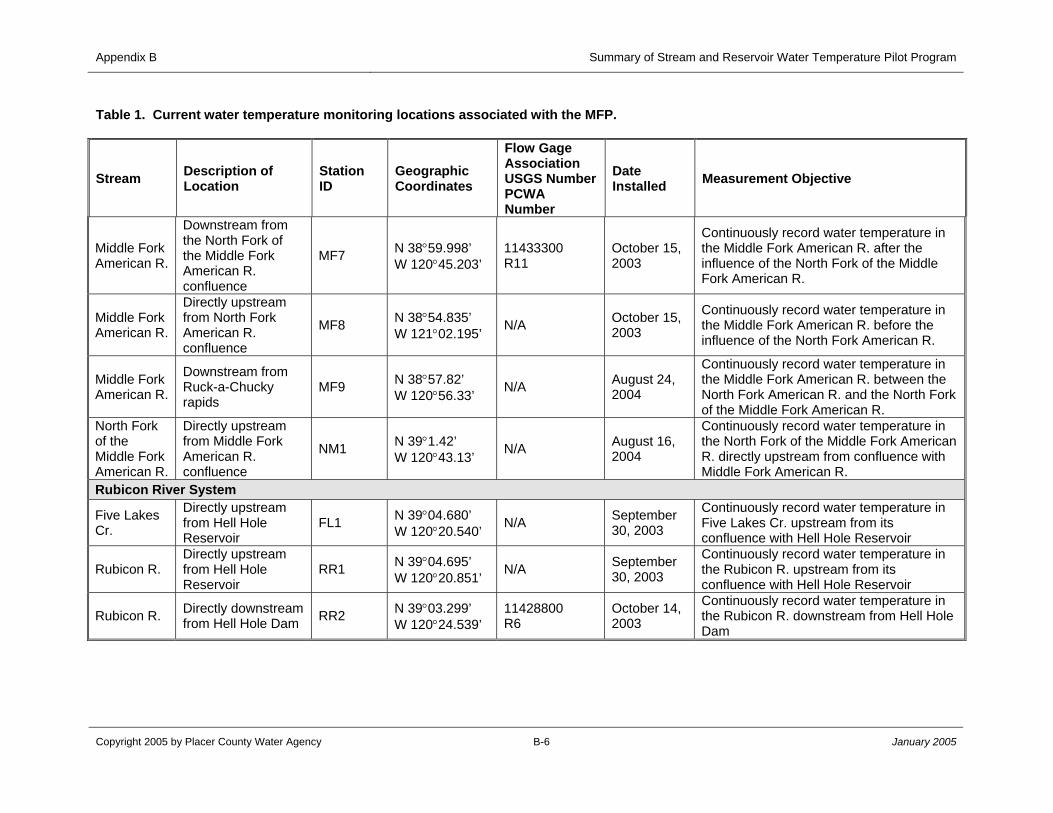
Appendix B Summary of Stream and Reservoir Water Temperature Pilot Program
Copyright 2005 by Placer County Water Agency B-6 January 2005
Table 1. Current water temperature monitoring locations associated with the MFP.
Stream Description of Location
Station ID
Geographic Coordinates
Flow Gage Association USGS Number PCWA Number
Date Installed Measurement Objective
Middle Fork American R.
Downstream from the North Fork of the Middle Fork American R. confluence
MF7 N 38°59.998’ W 120°45.203’
11433300 R11
October 15, 2003
Continuously record water temperature in the Middle Fork American R. after the influence of the North Fork of the Middle Fork American R.
Middle Fork American R.
Directly upstream from North Fork American R. confluence
MF8 N 38°54.835’ W 121°02.195’ N/A October 15,
2003
Continuously record water temperature in the Middle Fork American R. before the influence of the North Fork American R.
Middle Fork American R.
Downstream from Ruck-a-Chucky rapids
MF9 N 38°57.82’ W 120°56.33’ N/A August 24,
2004
Continuously record water temperature in the Middle Fork American R. between the North Fork American R. and the North Fork of the Middle Fork American R.
North Fork of the Middle Fork American R.
Directly upstream from Middle Fork American R. confluence
NM1 N 39°1.42’ W 120°43.13’ N/A August 16,
2004
Continuously record water temperature in the North Fork of the Middle Fork American R. directly upstream from confluence with Middle Fork American R.
Rubicon River System
Five Lakes Cr.
Directly upstream from Hell Hole Reservoir
FL1 N 39°04.680’ W 120°20.540’ N/A September
30, 2003
Continuously record water temperature in Five Lakes Cr. upstream from its confluence with Hell Hole Reservoir
Rubicon R. Directly upstream from Hell Hole Reservoir
RR1 N 39°04.695’ W 120°20.851’ N/A September
30, 2003
Continuously record water temperature in the Rubicon R. upstream from its confluence with Hell Hole Reservoir
Rubicon R. Directly downstream from Hell Hole Dam RR2 N 39°03.299’
W 120°24.539’ 11428800 R6
October 14, 2003
Continuously record water temperature in the Rubicon R. downstream from Hell Hole Dam
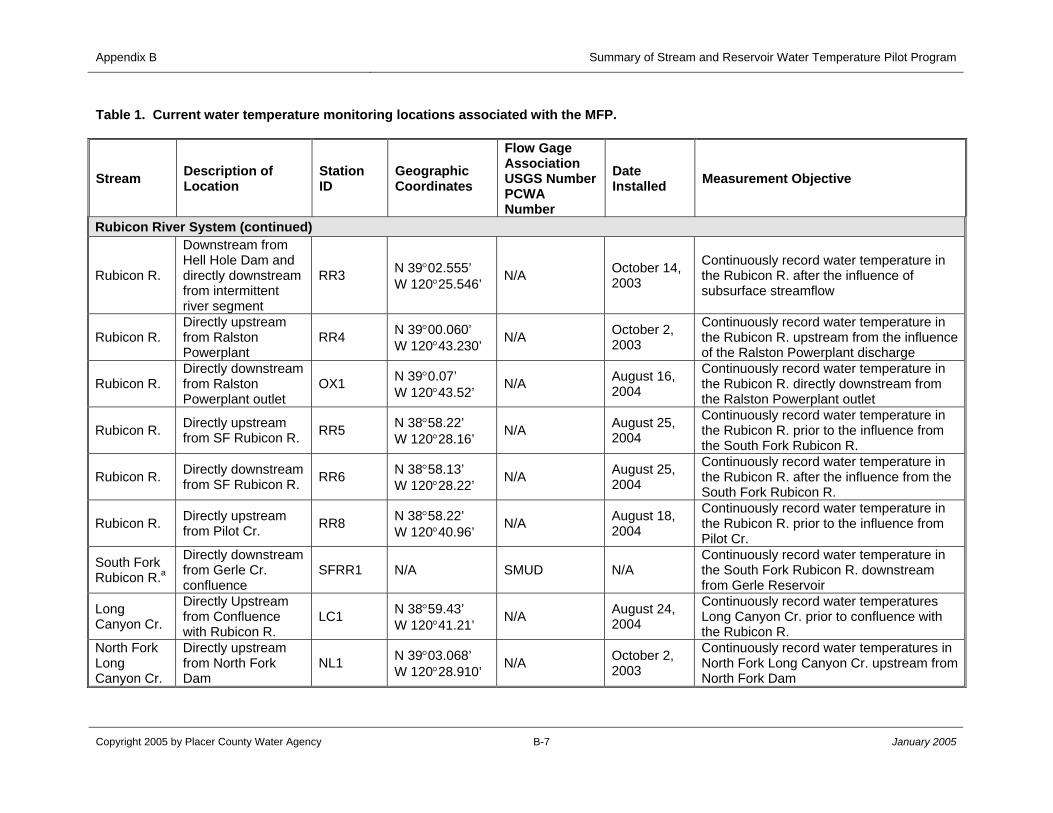
Appendix B Summary of Stream and Reservoir Water Temperature Pilot Program
Copyright 2005 by Placer County Water Agency B-7 January 2005
Table 1. Current water temperature monitoring locations associated with the MFP.
Stream Description of Location
Station ID
Geographic Coordinates
Flow Gage Association USGS Number PCWA Number
Date Installed Measurement Objective
Rubicon River System (continued)
Rubicon R.
Downstream from Hell Hole Dam and directly downstream from intermittent river segment
RR3 N 39°02.555’ W 120°25.546’ N/A October 14,
2003
Continuously record water temperature in the Rubicon R. after the influence of subsurface streamflow
Rubicon R. Directly upstream from Ralston Powerplant
RR4 N 39°00.060’ W 120°43.230’ N/A October 2,
2003
Continuously record water temperature in the Rubicon R. upstream from the influence of the Ralston Powerplant discharge
Rubicon R. Directly downstream from Ralston Powerplant outlet
OX1 N 39°0.07’ W 120°43.52’ N/A August 16,
2004
Continuously record water temperature in the Rubicon R. directly downstream from the Ralston Powerplant outlet
Rubicon R. Directly upstream from SF Rubicon R. RR5 N 38°58.22’
W 120°28.16’ N/A August 25, 2004
Continuously record water temperature in the Rubicon R. prior to the influence from the South Fork Rubicon R.
Rubicon R. Directly downstream from SF Rubicon R. RR6 N 38°58.13’
W 120°28.22’ N/A August 25, 2004
Continuously record water temperature in the Rubicon R. after the influence from the South Fork Rubicon R.
Rubicon R. Directly upstream from Pilot Cr. RR8 N 38°58.22’
W 120°40.96’ N/A August 18, 2004
Continuously record water temperature in the Rubicon R. prior to the influence from Pilot Cr.
South Fork Rubicon R.a
Directly downstream from Gerle Cr. confluence
SFRR1 N/A SMUD N/A Continuously record water temperature in the South Fork Rubicon R. downstream from Gerle Reservoir
Long Canyon Cr.
Directly Upstream from Confluence with Rubicon R.
LC1 N 38°59.43’ W 120°41.21’ N/A August 24,
2004
Continuously record water temperatures Long Canyon Cr. prior to confluence with the Rubicon R.
North Fork Long Canyon Cr.
Directly upstream from North Fork Dam
NL1 N 39°03.068’ W 120°28.910’ N/A October 2,
2003
Continuously record water temperatures in North Fork Long Canyon Cr. upstream from North Fork Dam
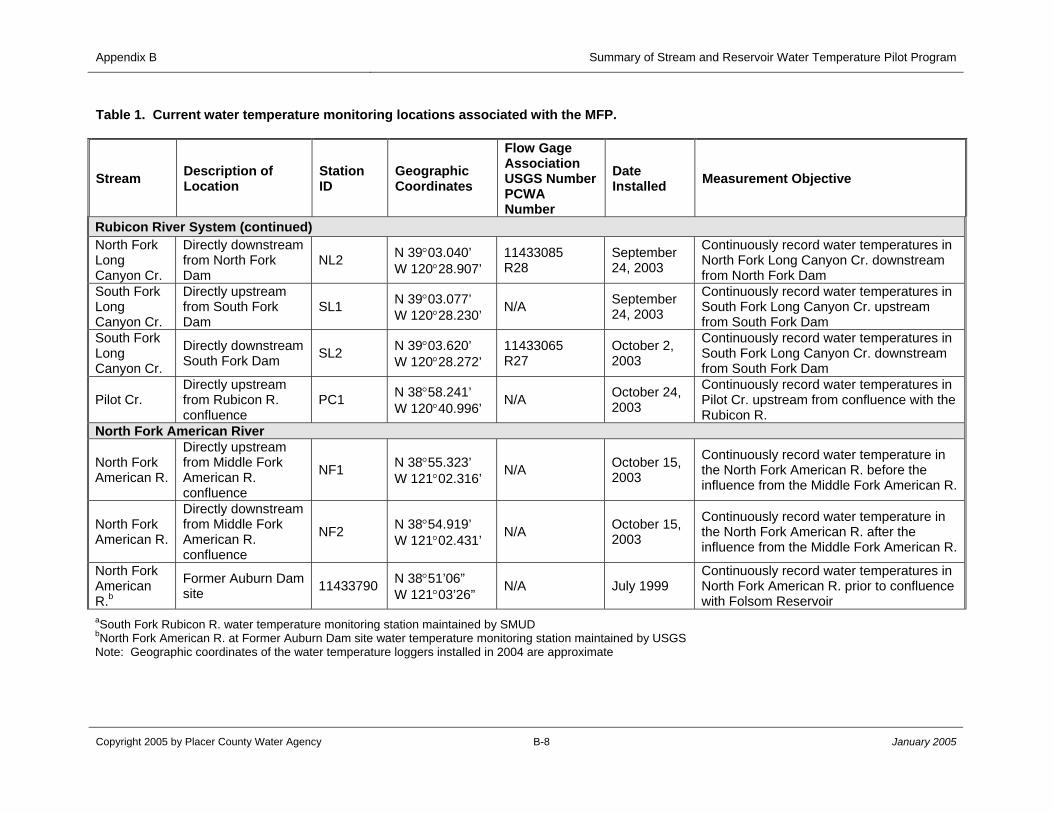
ndix B Summary of Stream and Reservoir Water Temperature Pilot Program
Copyright 2005 by Placer County Water Agency B-8 January 2005
Table 1. Current water temperature monitoring locations associated with the MFP.
Stream Description of Location
Station ID
Geographic Coordinates
Flow Gage Association USGS Number PCWA Number
Date Installed Measurement Objective
Rubicon River System (continued) North Fork Long Canyon Cr.
Directly downstream from North Fork Dam
NL2 N 39°03.040’ W 120°28.907’
11433085 R28
September 24, 2003
Continuously record water temperatures in North Fork Long Canyon Cr. downstream from North Fork Dam
South Fork Long Canyon Cr.
Directly upstream from South Fork Dam
SL1 N 39°03.077’ W 120°28.230’ N/A September
24, 2003
Continuously record water temperatures in South Fork Long Canyon Cr. upstream from South Fork Dam
South Fork Long Canyon Cr.
Directly downstream South Fork Dam SL2 N 39°03.620’
W 120°28.272’ 11433065 R27
October 2, 2003
Continuously record water temperatures in South Fork Long Canyon Cr. downstream from South Fork Dam
Pilot Cr. Directly upstream from Rubicon R. confluence
PC1 N 38°58.241’ W 120°40.996’ N/A October 24,
2003
Continuously record water temperatures in Pilot Cr. upstream from confluence with the Rubicon R.
North Fork American River
North Fork American R.
Directly upstream from Middle Fork American R. confluence
NF1 N 38°55.323’ W 121°02.316’ N/A October 15,
2003
Continuously record water temperature in the North Fork American R. before the influence from the Middle Fork American R.
North Fork American R.
Directly downstream from Middle Fork American R. confluence
NF2 N 38°54.919’ W 121°02.431’ N/A October 15,
2003
Continuously record water temperature in the North Fork American R. after the influence from the Middle Fork American R.
North Fork American R.b
Former Auburn Dam site 11433790 N 38°51’06”
W 121°03’26” N/A July 1999 Continuously record water temperatures in North Fork American R. prior to confluence with Folsom Reservoir
aSouth Fork Rubicon R. water temperature monitoring station maintained by SMUD bNorth Fork American R. at Former Auburn Dam site water temperature monitoring station maintained by USGS Note: Geographic coordinates of the water temperature loggers installed in 2004 are approximate
Appe
Appendix B Summary of Stream and ReservoirWater Temperature Pilot Program
Copyright 2005 by Placer County Water Agency B-9 January 2005
The exact geographical coordinates were determined at each site on September 7, 2004. Once a waypoint for a site was located using the GPS receiver, the location of the former stream channel was determined by utilizing a Lowrance X-85 sonar unit. After this location was found, the GPS receiver was used to collect the geographic coordinates of the site. The stream channel location process was repeated at each sample location to determine the geographic coordinates of each sample site. The GPS receiver was used each successive sampling occasion to locate the geographical coordinates of each sample site.
A Hydrolab® Quanta® multi-parameter water quality monitoring system was used to measure water temperature (±0.2 degrees Celsius (°C)), dissolved oxygen (±0.2 milligrams per liter (mg/l)) and specific conductance (±0.001 millisiemens (mS/cm)) at each of the three sample sites in French Meadows and Hell Hole reservoirs. Specific conductance was calibrated prior to entering the field and dissolved oxygen was calibrated at each reservoir (temperature need not be calibrated), following the manufacture’s calibration protocols.
Information collected at each site on each sampling occasion included a general description of the weather, the start and end time of data collection, air temperature at the start and end time of data collection, the maximum water depth observed using the sonar, and additional general comments regarding the data collection process. Generally, measurements were taken at 1-meter (m) vertical increments beginning just beneath the water surface until the thermocline was reached, at which point measurements were taken at 2-m increments. At each sample depth, the parameter readings were allowed to stabilize, which usually took between 15 and 60 seconds, before the water temperature, dissolved oxygen and specific conductance values were recorded on the data sheet. Readings were taken at each site until the sample depth approximated the depth reading on the sonar or the specific conductance reading rapidly increased (which was usually accompanied by a rapid decrease in dissolved oxygen concentration), indicating that the multi-parameter probe was at the bottom of the reservoir.
5.0 RESULTS AND RECOMMENDATIONS
5.1 STREAM TEMPERATURE MONITORING
Water temperature data of varying duration have been collected from 17 of the 22 water temperature loggers that were installed in 2003. Two loggers were lost, apparently due to vandalism, and data from the three remaining loggers was lost due to logger or computer failure. Data from the eight water temperature loggers installed in 2004 have not been downloaded since installation.
According to DWR’s water year hydrologic classification indices, water year 2003 was considered to be above normal, and water year 2004 was considered to be below normal (DWR 2004). The daily average and daily range of stream water temperatures recorded under the MFP monitoring program are presented on Figures A.1 through
Appendix B Summary of Stream and ReservoirWater Temperature Pilot Program
Copyright 2005 by Placer County Water Agency B-10 January 2005
A.18 in Attachment A. Although gaps exist in the records for many of the water temperature monitoring stations, some trends can be observed. Because many of the water temperature records are incomplete, the following discussion focuses on those stations where water temperatures are available for July and August, typically the warmest months of the year. Water temperatures during the winter in the MFP are cold, with daily averages at or near 0°C in the higher elevations (e.g., FL1) and around 5°C to 7°C in the lower elevations (e.g., MF6).
5.1.1 DUNCAN CANYON CREEK
Some of the warmest water temperatures observed in the vicinity of the MFP occurred in Duncan Canyon Creek. Daily average water temperatures at DC1 and DC2 exceeded 15°C from about the middle of June through August 2004, and approached 20°C at their warmest (Figures A.1 and A.2, respectively). Daily maximum water temperatures in Duncan Canyon Creek at DC1 and DC2 exceeded 20°C, but remained less than 24°C, for much of July and August 2004. Duncan Canyon Creek downstream from the diversion dam was generally about 0.5°C to 3°C warmer than upstream from the diversion dam during most of the period of record (Figure 5).
5.1.2 MIDDLE FORK AMERICAN RIVER
Water temperatures in the Middle Fork American River downstream from French Meadows Reservoir (MF2) remained consistently cool throughout the period of record (Figure A.3). At their highest, MF2 daily maximum water temperatures approached 15°C during parts of June, July and August 2004, while the daily average water temperature during this period remained less than about 12°C.
The period of record at MF3 (the Middle Fork American River upstream from Middle Fork Powerplant) does not include the July or August water temperatures. However, daily average water temperatures in June 2004 approached 19°C, while daily maximums exceeded 20°C (Figure A.4).
Daily average water temperatures in the Middle Fork American River downstream from Middle Fork Interbay (MF4) appear to be cool, remaining below 12°C for the period of record of mid-November 2003 through mid-June 2004 (Figure A.5). Daily maximum water temperatures during this period remained below 15°C.
Daily maximum and average water temperatures at MF5 (downstream from Ralston Afterbay Dam) remained below 20°C and at or below 15°C, respectively, for the period of mid-January through June 2004 (Figure A.6).
Water temperatures at the Oxbow Powerplant Outlet (MF6) peaked at approximately 14°C in late June and early July 2004 (Figure A.7). The daily maximum water temperature for the period of record of November 2003 to early October 2004 indicates that water temperatures did not exceed 15°C.
Appendix B Summary of Stream and ReservoirWater Temperature Pilot Program
Copyright 2005 by Placer County Water Agency B-11 January 2005
Daily average water temperatures for five Middle Fork American River locations are presented for comparison purposes on Figure 6. Although the records are incomplete and do not include the warmest part of the year for some of the stations, water temperatures downstream from discharge points such as French Meadows Reservoir (MF2), Middle Fork Interbay (MF4) and Oxbow Powerplant (MF6) appear to remain cool throughout the year. Locations relatively far downstream from discharge points such as MF3 appear to warm, although the incomplete record prohibits accurately quantifying water temperature increase.
5.1.3 LONG CANYON CREEK
Water temperature records for North Long Canyon Creek upstream from North Fork Dam (NL1) indicate that the water temperature logger was dewatered during summer and fall 2004. Daily maximum water temperatures at North Long Canyon Creek downstream from North Fork Dam (NL2) reached 20°C during June 2004, while daily average water temperatures peaked around 16°C during September 2003 and June 2004 during the period of record of mid-September 2003 to late June 2004 (Figure A.10).
Daily average water temperatures in South Long Canyon Creek upstream from South Fork Dam (SL1) during late September 2003 to late October 2004 peaked in August 2004 around 15°C, while daily maximum water temperatures were highest in July and August 2004 at approximately 19°C (Figure A.11). Daily average and maximum water temperatures downstream from South Fork Dam (SL2) were similar to SL1, albeit slightly cooler (Figure A.12). Additionally, the partial records indicate that, in general, North Long Canyon Creek is slightly warmer during the spring and early summer than South Long Canyon Creek (Figure 7).
5.1.4 RUBICON RIVER
Five Lakes Creek (FL1) daily average water temperatures remained below 15°C during the period of October 2003 through June 2004 (Figure A.13 in Attachment A). Maximum water temperatures during this period were approximately 17°C.
Water temperatures in the Rubicon River upstream from Hell Hole Reservoir (RR1) exhibited maximum daily averages of approximately 17°C during June 2004 for the period of record of October 2003 through June 2004. Daily maximum water temperatures during this period remained below 19°C (Figure A.14).
Daily average water temperatures collected on the Rubicon River system at four sites are illustrated on Figure 8. It is not possible to accurately detect trends regarding the downstream persistence of water temperatures until further data is collected.

Appendix B Summary of Stream and ReservoirWater Temperature Pilot Program
Copyright 2005 by Placer County Water Agency B-12 January 2005
5.1.5 NORTH FORK AMERICAN RIVER
Water temperature data for the North Fork American River at the former Auburn Dam site (USGS Gage #11433790) for 2003 and 2004 indicate that daily average water temperature exceeded 20°C during June and July 2003 and 2004 (Figure A.18). Daily maximum water temperatures routinely exceeded 20°C during the summer in 2003 and 2004, but did not increase by more than 5°C.
5.1.6 RECOMMENDATIONS
Continuation of the stream water temperature monitoring program is recommended. Four recommendations are suggested for improving the existing pilot program. First, a data downloading schedule should be established and strictly adhered to in order to minimize the potential for data loss. For example, water temperature loggers located in high visibility areas, such as the confluence of the North Fork and Middle Fork American rivers, should be visited approximately monthly during the summer months to minimize the amount of the disruptions in data series, should vandalism occur. Moreover, a data retrieval schedule should be established that considers the characteristics of the individual monitoring sites such as accessibility (e.g., is the logger located near a road or an often-visited Project facility), probability for inaccessibility due to environment (e.g., is the logger located at a site subject to being snowbound in the winter or inundated by high spring snow-melt runoff), or other factors potentially affecting site access, such as safety concerns. Because the loggers have over 300 days of capacity for water temperature data collected at 15-minute intervals, it is recommended that loggers at the most inaccessible sites be downloaded at least twice a year.
Second, additional monitoring sites should be considered at six locations:
• Middle Fork American River upstream from Middle Fork Interbay;
• Middle Fork American River upstream from Duncan Creek;
• Duncan Creek upstream from Middle Fork American River;
• Rubicon River downstream from Long Canyon Creek;
• Rubicon River between South Fork Rubicon River and Pilot Creek; and
• Long Canyon Creek downstream from the North-South Long Canyon Creek confluence.
Third, three currently installed loggers should be moved. The plots of the raw water temperature data collected at NL1 and MF5 reveal spikes in water temperatures that suggest the loggers were exposed to air. Also, inspection of the SL1 and SL2 water temperature data illustrates that SL1 temperatures are warmer than SL2 temperatures – a trend not detected at the two other locations where water temperature is monitored
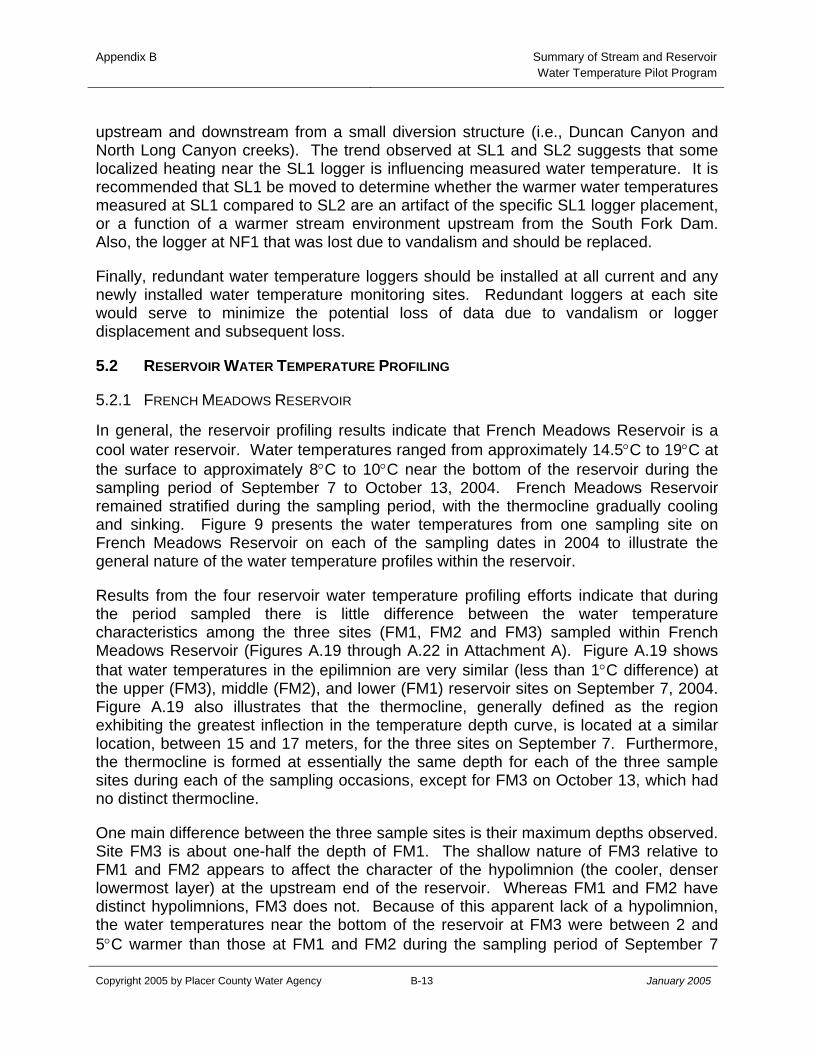
Appendix B Summary of Stream and ReservoirWater Temperature Pilot Program
Copyright 2005 by Placer County Water Agency B-13 January 2005
upstream and downstream from a small diversion structure (i.e., Duncan Canyon and North Long Canyon creeks). The trend observed at SL1 and SL2 suggests that some localized heating near the SL1 logger is influencing measured water temperature. It is recommended that SL1 be moved to determine whether the warmer water temperatures measured at SL1 compared to SL2 are an artifact of the specific SL1 logger placement, or a function of a warmer stream environment upstream from the South Fork Dam. Also, the logger at NF1 that was lost due to vandalism and should be replaced.
Finally, redundant water temperature loggers should be installed at all current and any newly installed water temperature monitoring sites. Redundant loggers at each site would serve to minimize the potential loss of data due to vandalism or logger displacement and subsequent loss.
5.2 RESERVOIR WATER TEMPERATURE PROFILING
5.2.1 FRENCH MEADOWS RESERVOIR
In general, the reservoir profiling results indicate that French Meadows Reservoir is a cool water reservoir. Water temperatures ranged from approximately 14.5°C to 19°C at the surface to approximately 8°C to 10°C near the bottom of the reservoir during the sampling period of September 7 to October 13, 2004. French Meadows Reservoir remained stratified during the sampling period, with the thermocline gradually cooling and sinking. Figure 9 presents the water temperatures from one sampling site on French Meadows Reservoir on each of the sampling dates in 2004 to illustrate the general nature of the water temperature profiles within the reservoir.
Results from the four reservoir water temperature profiling efforts indicate that during the period sampled there is little difference between the water temperature characteristics among the three sites (FM1, FM2 and FM3) sampled within French Meadows Reservoir (Figures A.19 through A.22 in Attachment A). Figure A.19 shows that water temperatures in the epilimnion are very similar (less than 1°C difference) at the upper (FM3), middle (FM2), and lower (FM1) reservoir sites on September 7, 2004. Figure A.19 also illustrates that the thermocline, generally defined as the region exhibiting the greatest inflection in the temperature depth curve, is located at a similar location, between 15 and 17 meters, for the three sites on September 7. Furthermore, the thermocline is formed at essentially the same depth for each of the three sample sites during each of the sampling occasions, except for FM3 on October 13, which had no distinct thermocline.
One main difference between the three sample sites is their maximum depths observed. Site FM3 is about one-half the depth of FM1. The shallow nature of FM3 relative to FM1 and FM2 appears to affect the character of the hypolimnion (the cooler, denser lowermost layer) at the upstream end of the reservoir. Whereas FM1 and FM2 have distinct hypolimnions, FM3 does not. Because of this apparent lack of a hypolimnion, the water temperatures near the bottom of the reservoir at FM3 were between 2 and 5°C warmer than those at FM1 and FM2 during the sampling period of September 7
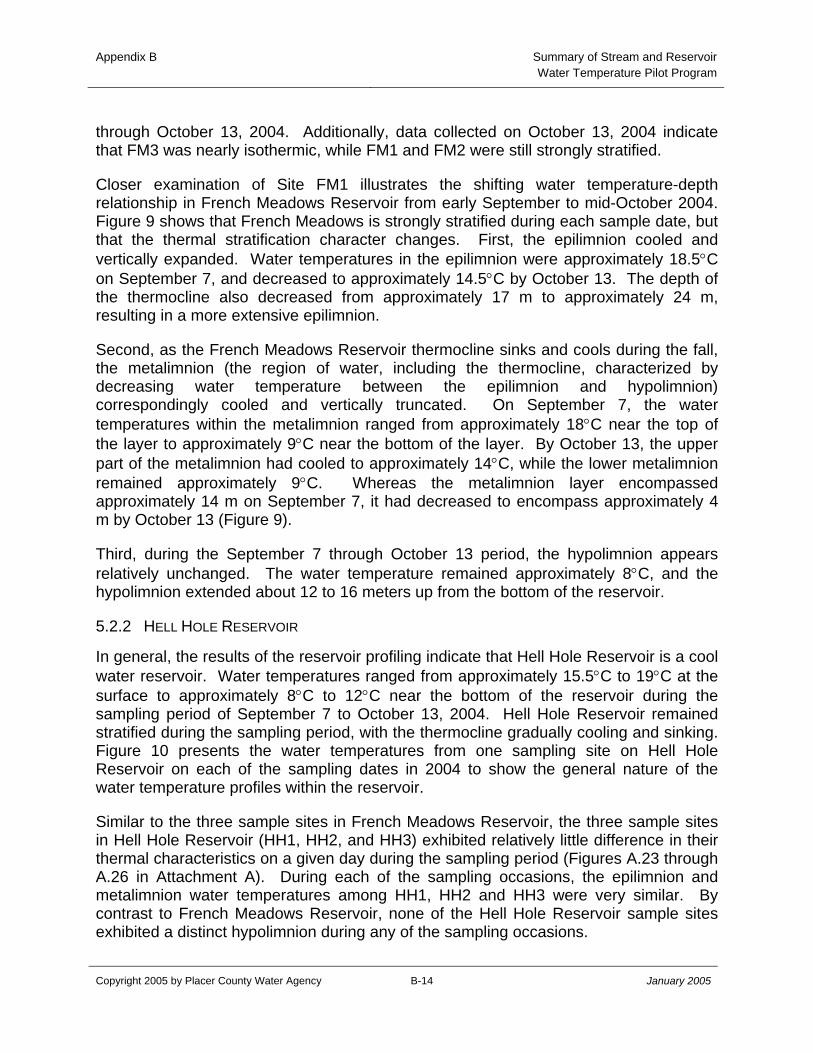
Appendix B Summary of Stream and ReservoirWater Temperature Pilot Program
Copyright 2005 by Placer County Water Agency B-14 January 2005
through October 13, 2004. Additionally, data collected on October 13, 2004 indicate that FM3 was nearly isothermic, while FM1 and FM2 were still strongly stratified.
Closer examination of Site FM1 illustrates the shifting water temperature-depth relationship in French Meadows Reservoir from early September to mid-October 2004. Figure 9 shows that French Meadows is strongly stratified during each sample date, but that the thermal stratification character changes. First, the epilimnion cooled and vertically expanded. Water temperatures in the epilimnion were approximately 18.5°C on September 7, and decreased to approximately 14.5°C by October 13. The depth of the thermocline also decreased from approximately 17 m to approximately 24 m, resulting in a more extensive epilimnion.
Second, as the French Meadows Reservoir thermocline sinks and cools during the fall, the metalimnion (the region of water, including the thermocline, characterized by decreasing water temperature between the epilimnion and hypolimnion) correspondingly cooled and vertically truncated. On September 7, the water temperatures within the metalimnion ranged from approximately 18°C near the top of the layer to approximately 9°C near the bottom of the layer. By October 13, the upper part of the metalimnion had cooled to approximately 14°C, while the lower metalimnion remained approximately 9°C. Whereas the metalimnion layer encompassed approximately 14 m on September 7, it had decreased to encompass approximately 4 m by October 13 (Figure 9).
Third, during the September 7 through October 13 period, the hypolimnion appears relatively unchanged. The water temperature remained approximately 8°C, and the hypolimnion extended about 12 to 16 meters up from the bottom of the reservoir.
5.2.2 HELL HOLE RESERVOIR
In general, the results of the reservoir profiling indicate that Hell Hole Reservoir is a cool water reservoir. Water temperatures ranged from approximately 15.5°C to 19°C at the surface to approximately 8°C to 12°C near the bottom of the reservoir during the sampling period of September 7 to October 13, 2004. Hell Hole Reservoir remained stratified during the sampling period, with the thermocline gradually cooling and sinking. Figure 10 presents the water temperatures from one sampling site on Hell Hole Reservoir on each of the sampling dates in 2004 to show the general nature of the water temperature profiles within the reservoir.
Similar to the three sample sites in French Meadows Reservoir, the three sample sites in Hell Hole Reservoir (HH1, HH2, and HH3) exhibited relatively little difference in their thermal characteristics on a given day during the sampling period (Figures A.23 through A.26 in Attachment A). During each of the sampling occasions, the epilimnion and metalimnion water temperatures among HH1, HH2 and HH3 were very similar. By contrast to French Meadows Reservoir, none of the Hell Hole Reservoir sample sites exhibited a distinct hypolimnion during any of the sampling occasions.
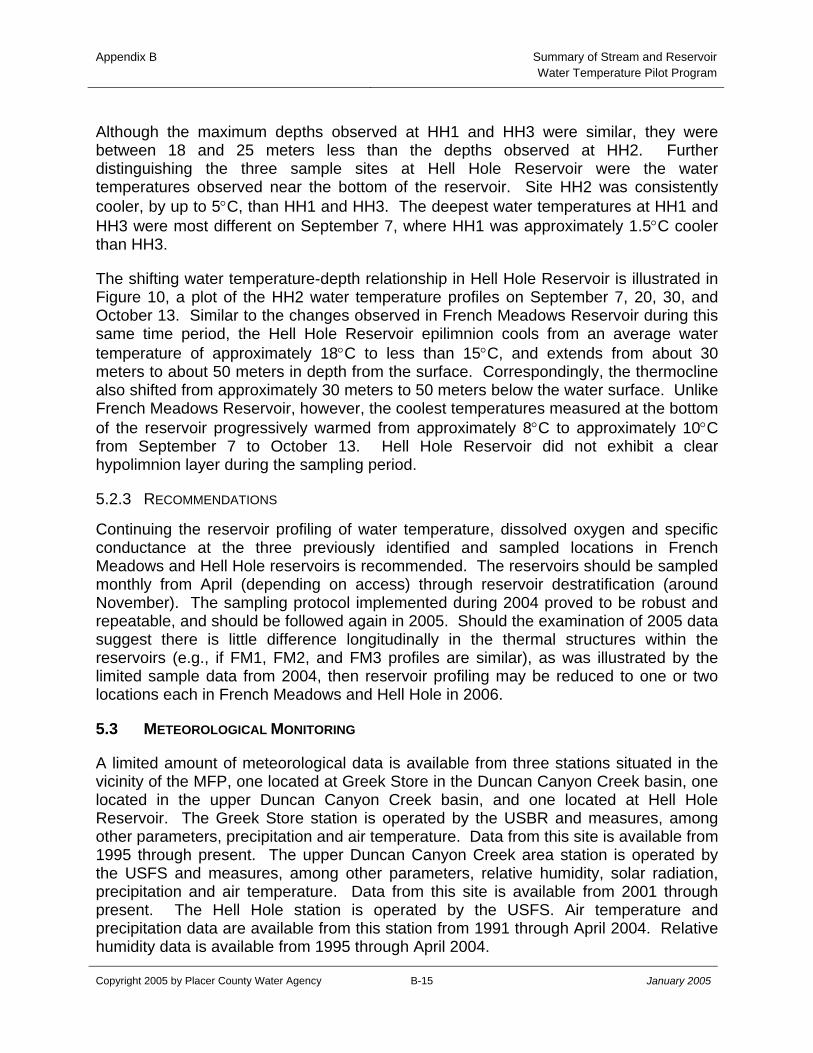
Appendix B Summary of Stream and ReservoirWater Temperature Pilot Program
Copyright 2005 by Placer County Water Agency B-15 January 2005
Although the maximum depths observed at HH1 and HH3 were similar, they were between 18 and 25 meters less than the depths observed at HH2. Further distinguishing the three sample sites at Hell Hole Reservoir were the water temperatures observed near the bottom of the reservoir. Site HH2 was consistently cooler, by up to 5°C, than HH1 and HH3. The deepest water temperatures at HH1 and HH3 were most different on September 7, where HH1 was approximately 1.5°C cooler than HH3.
The shifting water temperature-depth relationship in Hell Hole Reservoir is illustrated in Figure 10, a plot of the HH2 water temperature profiles on September 7, 20, 30, and October 13. Similar to the changes observed in French Meadows Reservoir during this same time period, the Hell Hole Reservoir epilimnion cools from an average water temperature of approximately 18°C to less than 15°C, and extends from about 30 meters to about 50 meters in depth from the surface. Correspondingly, the thermocline also shifted from approximately 30 meters to 50 meters below the water surface. Unlike French Meadows Reservoir, however, the coolest temperatures measured at the bottom of the reservoir progressively warmed from approximately 8°C to approximately 10°C from September 7 to October 13. Hell Hole Reservoir did not exhibit a clear hypolimnion layer during the sampling period.
5.2.3 RECOMMENDATIONS
Continuing the reservoir profiling of water temperature, dissolved oxygen and specific conductance at the three previously identified and sampled locations in French Meadows and Hell Hole reservoirs is recommended. The reservoirs should be sampled monthly from April (depending on access) through reservoir destratification (around November). The sampling protocol implemented during 2004 proved to be robust and repeatable, and should be followed again in 2005. Should the examination of 2005 data suggest there is little difference longitudinally in the thermal structures within the reservoirs (e.g., if FM1, FM2, and FM3 profiles are similar), as was illustrated by the limited sample data from 2004, then reservoir profiling may be reduced to one or two locations each in French Meadows and Hell Hole in 2006.
5.3 METEOROLOGICAL MONITORING
A limited amount of meteorological data is available from three stations situated in the vicinity of the MFP, one located at Greek Store in the Duncan Canyon Creek basin, one located in the upper Duncan Canyon Creek basin, and one located at Hell Hole Reservoir. The Greek Store station is operated by the USBR and measures, among other parameters, precipitation and air temperature. Data from this site is available from 1995 through present. The upper Duncan Canyon Creek area station is operated by the USFS and measures, among other parameters, relative humidity, solar radiation, precipitation and air temperature. Data from this site is available from 2001 through present. The Hell Hole station is operated by the USFS. Air temperature and precipitation data are available from this station from 1991 through April 2004. Relative humidity data is available from 1995 through April 2004.
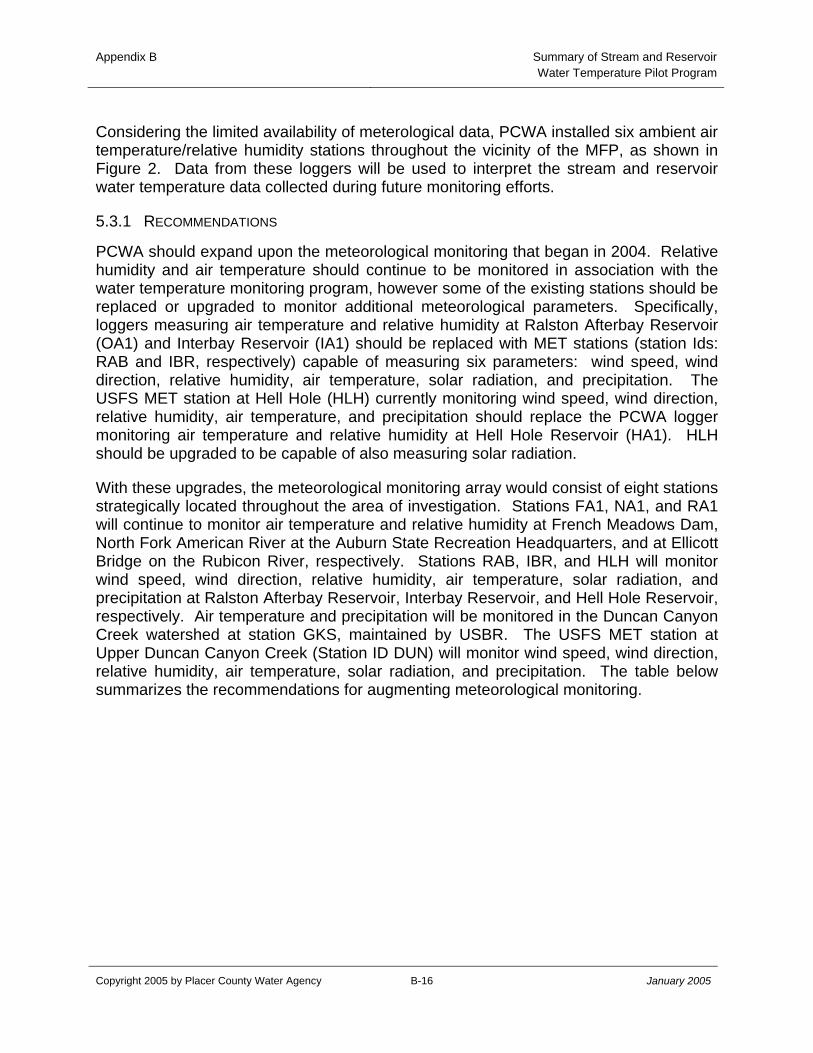
Appendix B Summary of Stream and ReservoirWater Temperature Pilot Program
Copyright 2005 by Placer County Water Agency B-16 January 2005
Considering the limited availability of meterological data, PCWA installed six ambient air temperature/relative humidity stations throughout the vicinity of the MFP, as shown in Figure 2. Data from these loggers will be used to interpret the stream and reservoir water temperature data collected during future monitoring efforts.
5.3.1 RECOMMENDATIONS
PCWA should expand upon the meteorological monitoring that began in 2004. Relative humidity and air temperature should continue to be monitored in association with the water temperature monitoring program, however some of the existing stations should be replaced or upgraded to monitor additional meteorological parameters. Specifically, loggers measuring air temperature and relative humidity at Ralston Afterbay Reservoir (OA1) and Interbay Reservoir (IA1) should be replaced with MET stations (station Ids: RAB and IBR, respectively) capable of measuring six parameters: wind speed, wind direction, relative humidity, air temperature, solar radiation, and precipitation. The USFS MET station at Hell Hole (HLH) currently monitoring wind speed, wind direction, relative humidity, air temperature, and precipitation should replace the PCWA logger monitoring air temperature and relative humidity at Hell Hole Reservoir (HA1). HLH should be upgraded to be capable of also measuring solar radiation.
With these upgrades, the meteorological monitoring array would consist of eight stations strategically located throughout the area of investigation. Stations FA1, NA1, and RA1 will continue to monitor air temperature and relative humidity at French Meadows Dam, North Fork American River at the Auburn State Recreation Headquarters, and at Ellicott Bridge on the Rubicon River, respectively. Stations RAB, IBR, and HLH will monitor wind speed, wind direction, relative humidity, air temperature, solar radiation, and precipitation at Ralston Afterbay Reservoir, Interbay Reservoir, and Hell Hole Reservoir, respectively. Air temperature and precipitation will be monitored in the Duncan Canyon Creek watershed at station GKS, maintained by USBR. The USFS MET station at Upper Duncan Canyon Creek (Station ID DUN) will monitor wind speed, wind direction, relative humidity, air temperature, solar radiation, and precipitation. The table below summarizes the recommendations for augmenting meteorological monitoring.
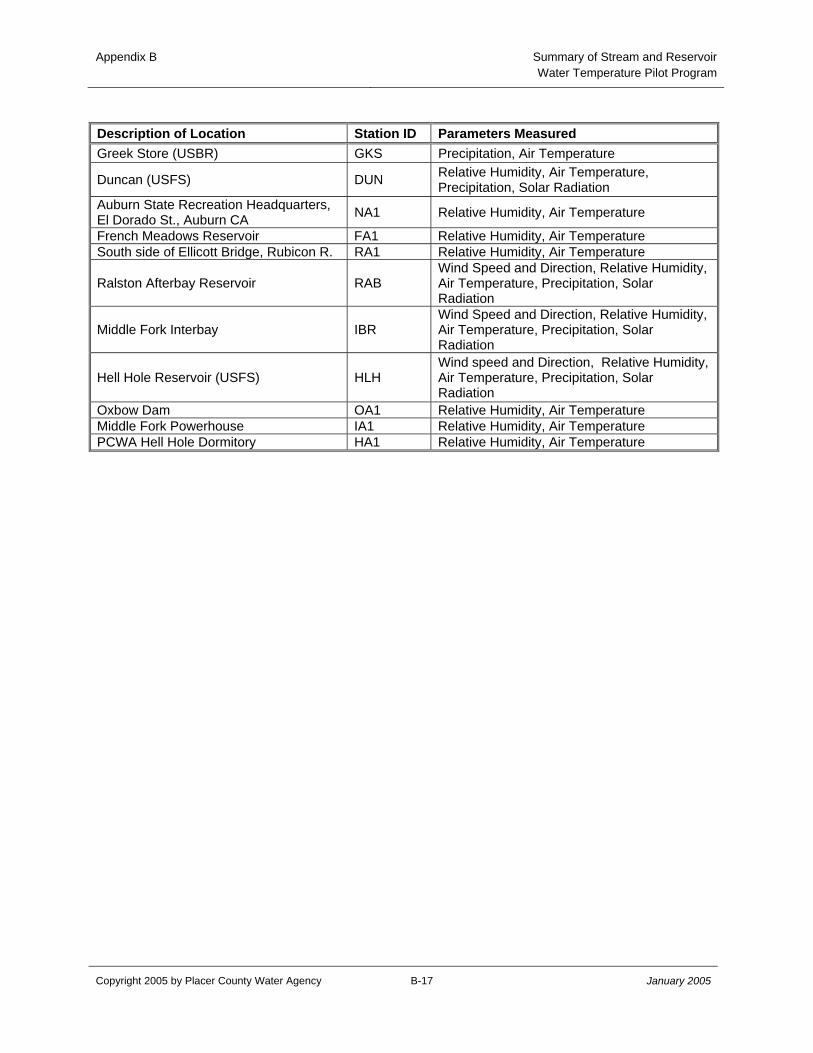
Appendix B Summary of Stream and ReservoirWater Temperature Pilot Program
Copyright 2005 by Placer County Water Agency B-17 January 2005
Description of Location Station ID Parameters Measured Greek Store (USBR) GKS Precipitation, Air Temperature
Duncan (USFS) DUN Relative Humidity, Air Temperature, Precipitation, Solar Radiation
Auburn State Recreation Headquarters, El Dorado St., Auburn CA NA1 Relative Humidity, Air Temperature
French Meadows Reservoir FA1 Relative Humidity, Air Temperature South side of Ellicott Bridge, Rubicon R. RA1 Relative Humidity, Air Temperature
Ralston Afterbay Reservoir RAB Wind Speed and Direction, Relative Humidity, Air Temperature, Precipitation, Solar Radiation
Middle Fork Interbay IBR Wind Speed and Direction, Relative Humidity, Air Temperature, Precipitation, Solar Radiation
Hell Hole Reservoir (USFS) HLH Wind speed and Direction, Relative Humidity, Air Temperature, Precipitation, Solar Radiation
Oxbow Dam OA1 Relative Humidity, Air Temperature Middle Fork Powerhouse IA1 Relative Humidity, Air Temperature PCWA Hell Hole Dormitory HA1 Relative Humidity, Air Temperature

Appendix B Summary of Stream and ReservoirWater Temperature Pilot Program
Copyright 2005 by Placer County Water Agency January 2005
FIGURES

Proposed Existing Environment Study Plan Package
Copyright 2005 by Placer County Water Agency January 2005
Placeholder for Figure 1
Figure 1 The Stream and Reservoir Network in the Vicinity of the MFP.
Non-Internet Public Information
These Figures have been removed in accordance with the Commission regulations at 18 CFR Section 388.112. These Figures are considered Non-Internet Public information and should not be posted on the Internet. This information may be accessed from the Placer County Water Agency’s (PCWA) Public Reference Room, but is not expected to be posted on PCWA’s Website, except as an indexed item.
Proposed Existing Environment Study Plan Package
Copyright 2005 by Placer County Water Agency January 2005
Placeholder for Figure 2
Figure 2 Current Water Temperature, Air Temperature and Relative Humidity Monitoring Station Locations.
Non-Internet Public Information
These Figures have been removed in accordance with the Commission regulations at 18 CFR Section 388.112. These Figures are considered Non-Internet Public information and should not be posted on the Internet. This information may be accessed from the Placer County Water Agency’s (PCWA) Public Reference Room, but is not expected to be posted on PCWA’s Website, except as an indexed item.

Proposed Existing Environment Study Plan Package
Copyright 2005 by Placer County Water Agency January 2005
Placeholder for Figure 3
Figure 3 Water Temperature Profile Locations in French Meadows Reservoir.
Non-Internet Public Information
These Figures have been removed in accordance with the Commission regulations at 18 CFR Section 388.112. These Figures are considered Non-Internet Public information and should not be posted on the Internet. This information may be accessed from the Placer County Water Agency’s (PCWA) Public Reference Room, but is not expected to be posted on PCWA’s Website, except as an indexed item.
Proposed Existing Environment Study Plan Package
Copyright 2005 by Placer County Water Agency January 2005
Placeholder for Figure 4
Figure 4 Water Temperature Profile Locations in Hell Hole Reservoir.
Non-Internet Public Information
These Figures have been removed in accordance with the Commission regulations at 18 CFR Section 388.112. These Figures are considered Non-Internet Public information and should not be posted on the Internet. This information may be accessed from the Placer County Water Agency’s (PCWA) Public Reference Room, but is not expected to be posted on PCWA’s Website, except as an indexed item.
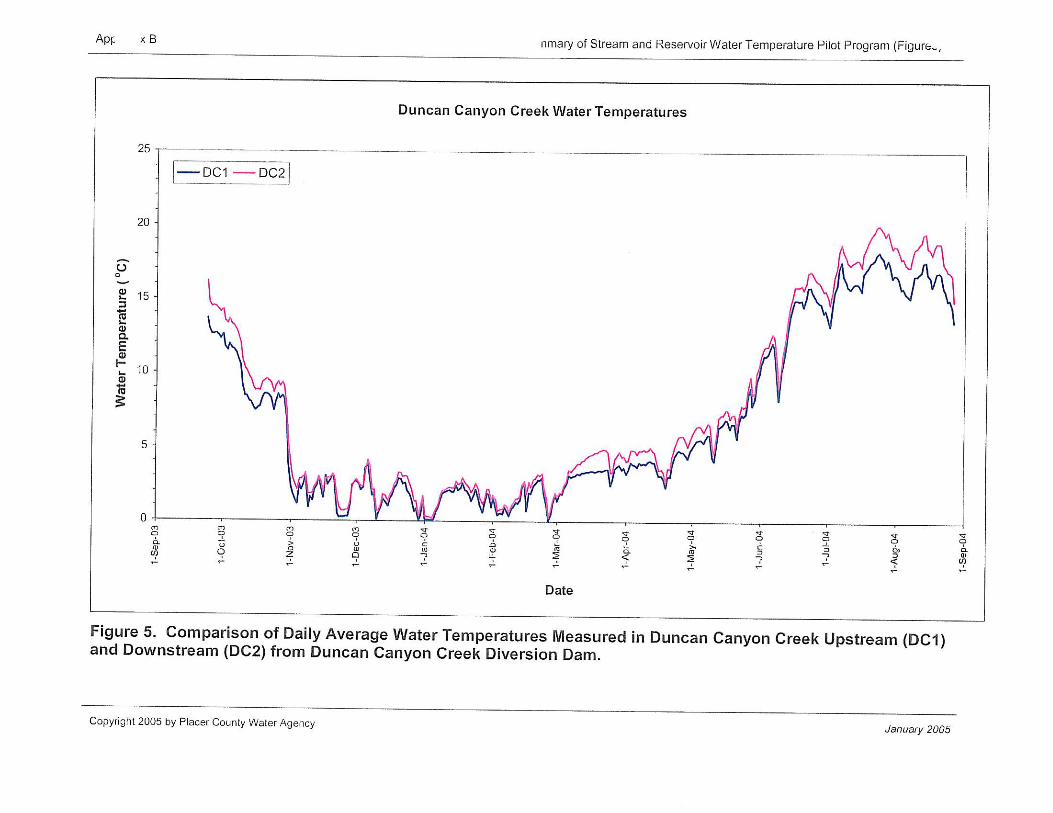
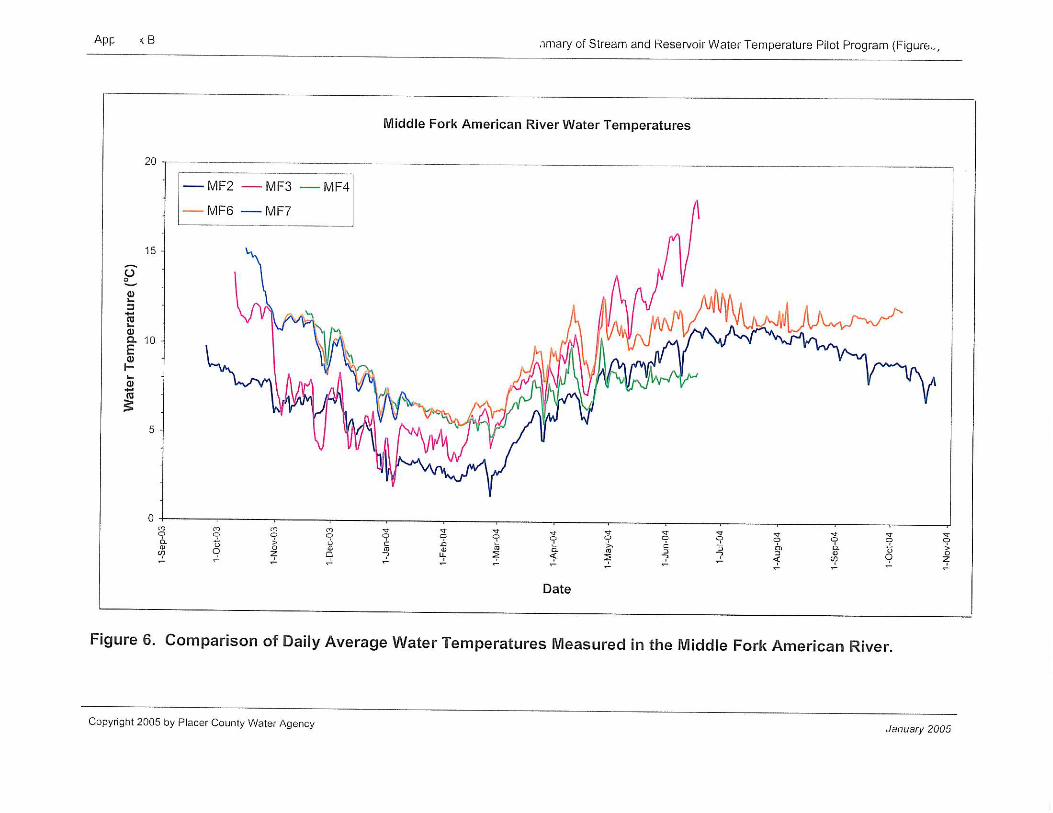
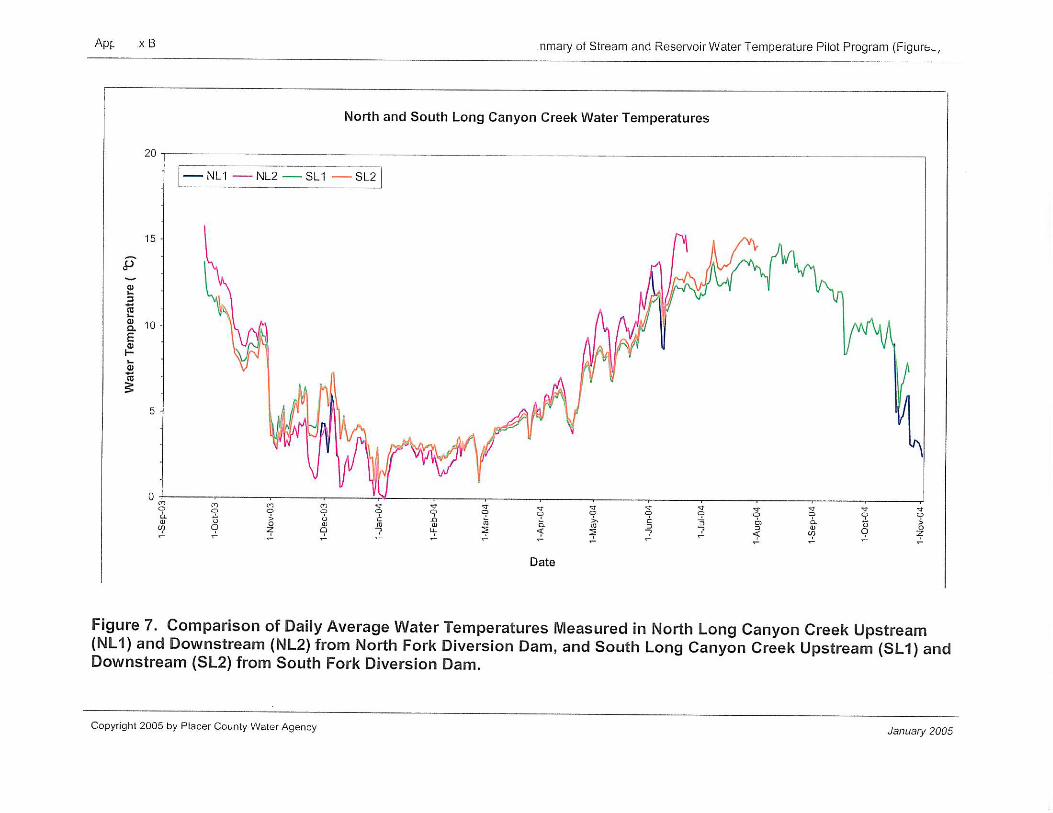
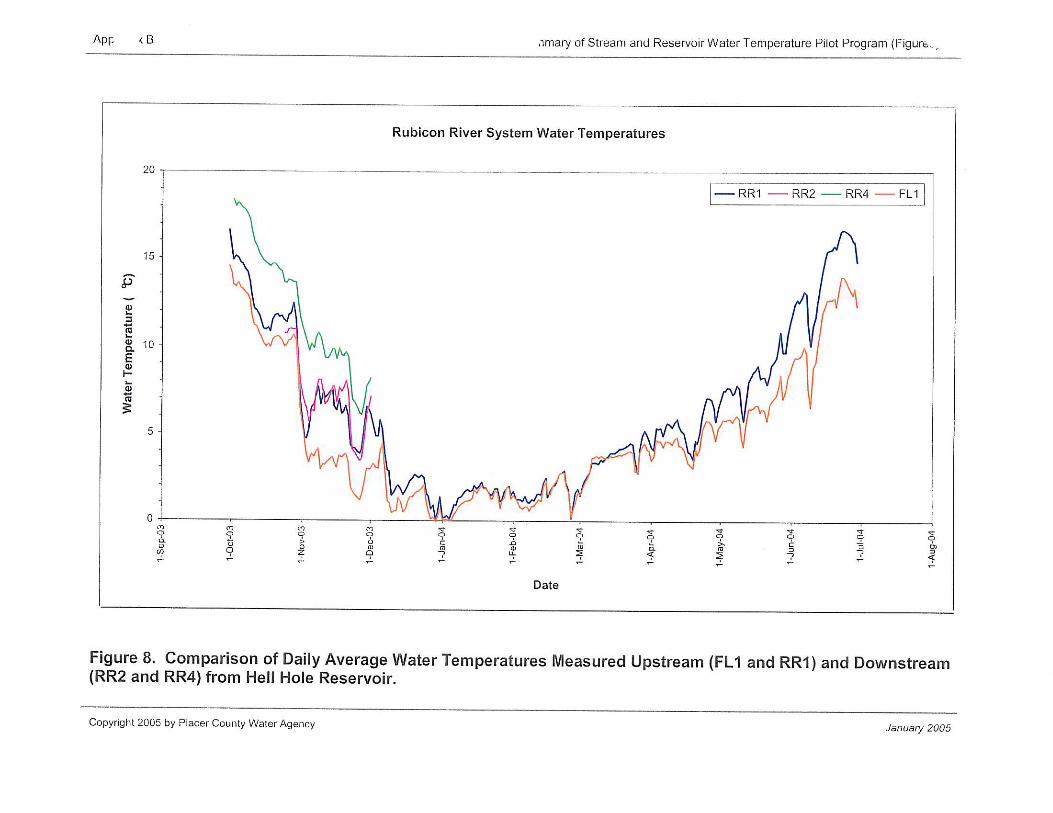
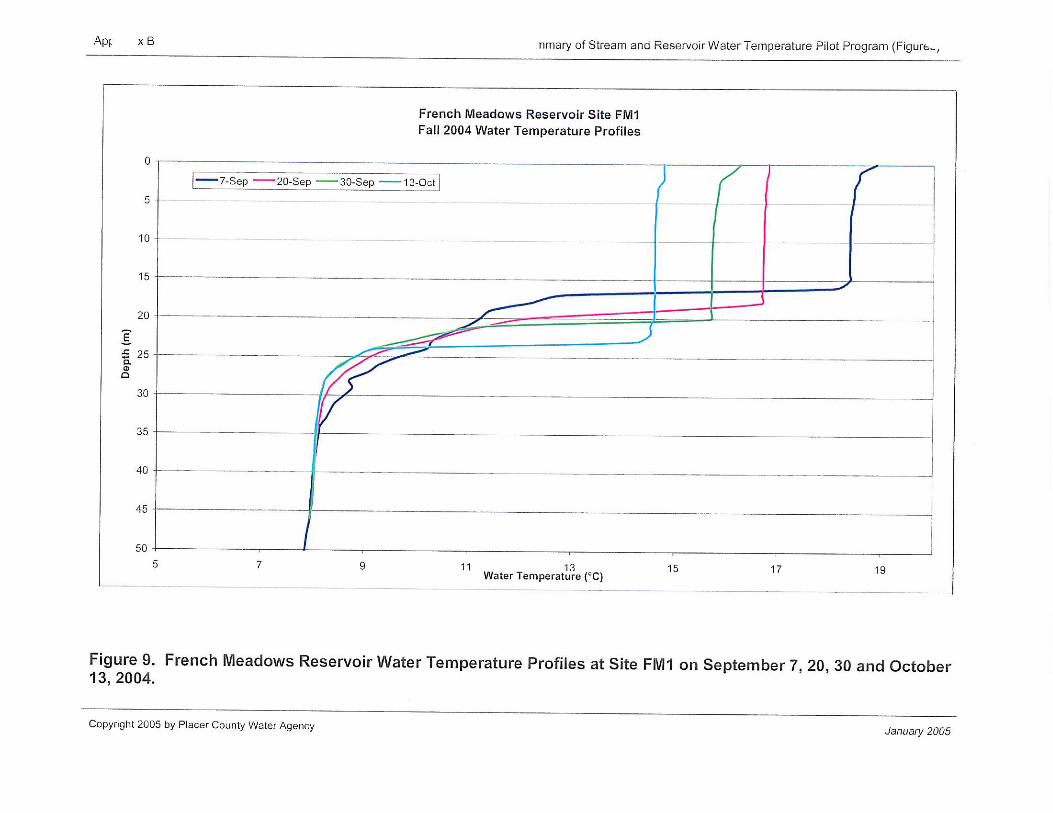
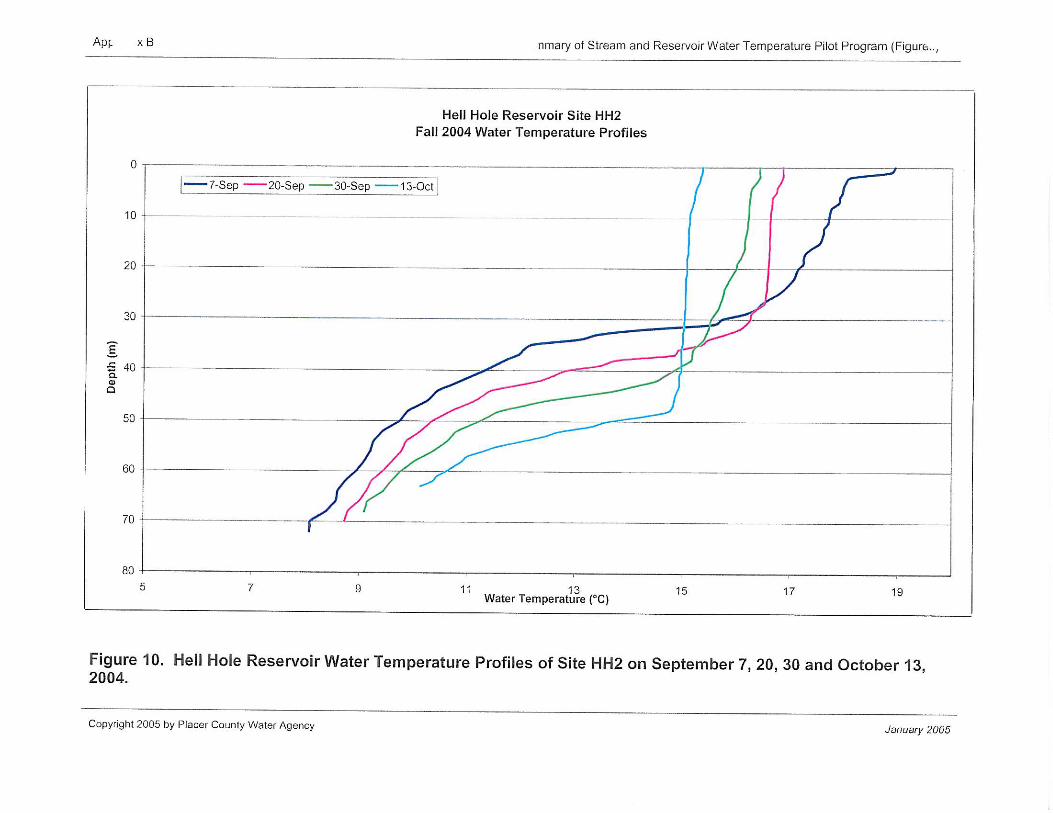
Appendix B Summary of Stream and ReservoirWater Temperature Pilot Program
Copyright 2005 by Placer County Water Agency January 2005
ATTACHMENT A
PLOTS OF RESERVOIR WATER TEMPERATURE PROFILES AND STREAM WATER TEMPERATURES