proposed annual action plan 2012-13 under the centrally sponsored scheme on national horticulture...
TRANSCRIPT

PROPOSED ANNUAL ACTION PLAN 2012-13 UNDER THE CENTRALLY SPONSORED SCHEME
ON NATIONAL HORTICULTURE MISSION
Date : 21st March 2012.Venue : Room No.142, Krishi Bhavan, New Delhi.
STATE HORTICULTURE MISSIONRAIPUR, CHHATTISGARH

Budget Sanction & Received Amount Under NHM
Year
Sanction Received Amount
Expenditure
%age of expenditure
against sanctioned
amount
GOI Share
State share
TotalGOI Share
State share
Total
2005-06 50.29 0.00 50.29 23.68 0.00 23.68 3.42 7
2006-07 111.92 0.00 111.92 55.00 0.00 55.00 47.33 42
2007-08 91.03 16.06 107.09 62.52 7.50 70.02 33.57 31
2008-09 107.49 18.97 126.46 30.00 8.83 39.00 84.76 67
2009-10
68.46 12.08 80.54 60.00 10.59 70.59 78.48 97
2010-11 97.75 17.25 115.00 96.57 17.04 113.61 97.94 85
2011-12* 93.50 16.50 110.00 85.00 15.00 100.00 98.73 90
Total - 620.44 80.86 701.30 412.77 58.96 471.90 444.23 94
(`. in Crore)
* Expenditure up to 15th March, 2012.

Total Area (lakh Ha.)
Cultivable (lakh Ha.)
Irrigated (lakh Ha.)
Non-irrigated (lakh Ha.)
Fallow (lakh Ha.)
Area under Micro Irrigation (Ha.)
Drip Sprinkler Total
137.9 47.5 13.23 34.27 3.47 7843 71,812 79,655
Sl.No.
Area under HorticultureBefore NHM (2004-05)
(Area in lakh ha.)Post NHM (2011-12)
(Area in lakh ha.)
1. Fruits 0.46 1.82
2. Vegetables 1.23 3.40
3. Spices 0.28 0.80
4. Medicinal & Aromatics 0.02 0.09
5. Flowers 0.02 0.12
Total - 2.01 6.23
Information of Land
Area

Sl.No.
Crops
2004-05 2011-12
Area (lakh ha.)
Production (lakh Mt.)
Yield / Productivity
(Mt./Ha.)
Area (lakh ha.)
Production (lakh Mt.)
Yield / Productivity
(Mt./Ha.)
1. Fruits 0.46 3.24 7.00 1.82 15.51 8.52
2. Vegetables 1.23 12.50 10.12 3.40 43.25 12.72
3. Spices 0.28 1.70 5.97 0.80 5.22 6.52
4.Medicinal & Aromatics
0.02 0.11 5.70 0.09 0.33 3.66
5. Flowers 0.02 0.03 1.88 0.12 0.86 7.16
Total - 2.01 17.58 8.72 6.23 65.17 10.46
Area & Production of Horticulture Crops

• Area of fruit and vegetable is increased sharply from 2005-06 to 2007-08 but now it is static.
• Production of fruits grew at the rate of 40% initially but later production has declining due to the fact that new orchards are in their gestation period and old orchards are becoming senile.
• The productivity of all major horticulture crops except Okra, Coriander, Cashew-nut, Lime and Banana, is lower than its potential.
• Although productivity is increasing but still far below than the expected yield potential. In Mango (-4.1 Mt./ha.), Litchi (-1.08 Mt./ha.), Custard apple (-3.99 Mt./ha.), Okra (-1.1 Mt./ha.), Ginger (-5.8 Mt./ha.) and Turmeric (-4.1 Mt./ha.) have shown decline in yield in last 5 years.
Production trend of Horticulture

Year wise Sectoral Percentage Share of Sanctioned Allotment
(in %age)
Sl. No.
Components 2005-06 2006-07 2007-08 2008-09 2009-10 2010-11 2011-12 2012-13
1.Production of Planting
Material6 2 3 3 5 8 3 3.88
2.Establishment of New
Gardens32 32 35 43 39 38 41 14.81
3.Creation of Water
Resources6 15 12 25 4 5 4 13.61
4. Protected Cultivation 1 1 5 2 8 3 4 9.38
5.INM/IPM & Organic
farming1 35 31 17 14 12 19 2.64
6. HRD 19 7 6 2 4 2 1 3.27
7.Post Harvest Management
0 1 0 0 9 9 16 30.62
8.Marketing
Infrastructure7 0 0 0 11 11 1 12.45

Capacity Building
PHM
Marketing
Protected Cultivation
MIS
Focus Activities

Proposed Focus Activities
Sl. No.
CropArea
(in Ha.)Production
(in Mt.)Proposed Focus Activities
1. Mango 57,590 2,85,070Ripening Chamber, Grading &
Packaging, Processing / VA
2. Litchi 4361 23,988 Area expansion, Processing / VA
3. Guava 14,933 1,16,479Area expansion, Grading & Packaging, Processing / VA
4. Cashew nut 21,656 10,828Area expansion, Processing / VA,
Rejuvenation
5. Banana 16,335 3,91,235Area expansion, Ripening
Chamber, Processing of Fiber
6. Chili 32,056 2,04,838CA Cold Storage, Grading,
Packaging & Drying
7. Ginger 10,316 1,13,483 Marketing & Processing / VA
8. Turmeric 9830 84,151 Marketing & Processing / VA

Proposed Focus Activities
Sl. No.
CropArea
(in Ha.)Production
(in Mt.)Proposed Focus Activities
9. Marigold 2112 14,005 Marketing
10. Rose 962 2040Protected Cultivation, Marketing &
Packaging11. Gladiolus 1988 5866
12. Rajnigandha 2191 8328
13. E.citridora 3248 13,612 Marketing & Processing / VA
14.
Lemon grass / Khus /
Pama rosa / Jama rosa
5044 18,694 Marketing & Processing / VA
15. Vegetable crops 3,39,745 43,24,949Cold Chain, Grading, Packaging,
Processing / VA & Protected Cultivation in some crops

YearHorticulture Area
(in Ha.)Area Expansion per year – NHM
(in Ha.)
2004-05 2,01,556 --
2005-06 3,03,710 3585
2006-07 3,88,663 16,633
2007-08 4,84,696 31,111
2008-09 5,00,259 31,043
2009-10 5,39,152 18,472
2010-11 5,97,526 18,075
2011-12 6,21,866 (Provisional) 21,300
Total - 6,21,866 1,40,219
Area Expansion Under NHM

Focus Crops – Area Expansion
Sl. No. CropsArea Expansion in last 6 years
under NHM (in Ha.)
Average Area Expansion per year (in Ha.)
Fruits -
1. Mango 18307 3051
2. Cashew 12826 2138
3. Banana 6607 1101
4. Litchi 4414 736
5. Lime 3864 644
6. Guava 2530 422
Spices -
7. Chili 32780 5463
8. Turmeric 8860 1477
9. Ginger 8129 1355
10. Coriander 4867 811
(Contd...)

Focus Crops – Area Expansion
Sl. No. CropsArea Expansion in last 6 years
under NHM (in Ha.)
Average Area Expansion per year (in Ha.)
Flowers -
11. Rajnigandha 3300 550
12. Marigold 2938 490
13. Gladiolus 2850 475
14. Rose 495 83
15. Gerbera 391 65
Medicinal & Aromatic -
16. E.citridora 9726 1621
17. Palmarosa/Jamarosa 6276 1046
18. Lemon grass 5954 992
19. Aloevera 2584 431
20. Khus 2257 376

Ratio of Self Production and Out-sourcing of Planting Material
Year Self Production %age Out-sourcing %age
2005-06 47 53
2006-07 46 54
2007-08 31 69
2008-09 45 55
2009-10 58 42
2010-11 57 43
2011-12 82 18

Area Expansion
• Around 10-20% of total allocation.
• Objective –
As introduction of new variety or new species (crop) with proven results in a new area.
As replacement of useless and un-productive variety or a variety which has become susceptible to a particular disease or particular micro climate.
As introduction of rare and expensive variety - The cost of seeds/planting material farmers initially can not afford.

Requirement of Planting Material – 2012-13
Sl. No.
Name of the Crop
Physical Target
Total requirement
Variety wise availability in Departmental Nurseries
Out Sourcing
Name of VarietyNo. of Plants availability
Name of the Agency
No. of Plants
1. Mango 1200 120000
Dashehari 1,08,726 --- ---Langda 63,193 --- ---Chausa 13,592 --- ---Mallika 11,580 --- ---Fazali 1990 --- ---
Amrapali 8016 --- ---Total - 2,07,097 --- ---
2. Litchi 420 63000 Muzaffarpur 66,398 --- ---
3. Lime 495 137115 Kagji (Air layering) 3,08,615 --- ---
4. Guava790+135
=925Allahabadi Safeda
(Air layering)--- --- 2,35,056
5.Cashew
nut400 80000
V-1 Odisha State Cashew
Development Corporation
20,000V-4 40,000
H/16 20,000Total - 80,000
6. Banana 1000 2252000 G/9 (Tissue Culture) CG State Seed and Agriculture Development Corporation Ltd.
Raipur by Approved State Tissue Culture Labs
22,52,0007. Rose 150 315000 Gladiator
3,15,0008. Gerbera 150 163500 TC 1,63,500
• Mother plants of Cashew and Sitaphal has been newly planted in Govt. Nurseries . Grafted plants will be produced in near future in departmental nurseries.
• Tissue culture Banana plants are procured from the 2 tissue culture labs established in the state .

Requirement of Seeds – 2012-13
Sl. No.
Crops UnitArea (Ha.)
Seed per ha.
Total Seed Requirement
Self Source
Out Sourcing
1. Chili (Hybrid Seeds) Kg 500 0.3 150 --- 150
2.Coriander
(Certified Seeds)Kg 500 20 10000 --- 10000
3. Ginger (Tuber) Kg 1000 175 175000 --- 175000
4. Turmeric (Tuber) Kg 1000 258 258000 --- 258000
5. Tube rose (Tuber) Nos 100 56962 5696200 --- 5696200
6. Gladiolus (Tuber) Nos 300 14285 4285500 --- 4285500
7.Marigold
(Hybrid Seeds)Pkt (100 seed)
500 95 47500 --- 47500
8. Vetiver (Slips) Nos 50 31250 1562500 1562500 ---

Name of Crops Area in ha.Area already
rejuvenated (in Ha.)Annual target for rejuvenation
(in Ha.)
Mango 1305
2404 655 (2012-13)
Guava 604
Cashew 215
Ber 280
Total - 2404 2404 655
Rejuvenation (Till 2011-12)

Year wise Establishment of Model Nurseries & Increase in Plant Production Capacity
Sl. No.
YearNo. of model
nurseries established
Infrastructure DevelopedIncrease in plant
production capacity (Annual)Green House
Agro Shednet House
Total
1. 2005-06 7 14 42 56 14,00,000
2. 2006-07 7 14 42 56 14,00,000
3. 2007-08 11 11 44 55 22,00,000
4. 2008-09 14 --- 112 112 28,00,000
5. 2009-10 18 --- 126 126 36,00,000
6. 2010-11 10 --- 126 126 20,00,000
7. 2011-12 5 --- 84 84 10,00,000
Total - 72 39 576 615 1,44,00,000
There are 117 departmental nurseries – 2.50 Crore plants per year.

REQUIREMENT & PROCUREMENT
• In the last six years – average requirement was about 15 lakh fruit plants each year.
• During last three years of NHM – most of the planting material was procured from CG State Seed and Agriculture Development Corporation Ltd.
• Since last three years – about 80% of the planting material is produced in departmental nurseries.
• But in case of hybrid seeds situation is dismal.

STRENGTHENING OF NURSERIES
• There are 117 departmental nurseries.
• Most of the nurseries were very old and without appropriate infrastructure to produce quality planting material.
• Since last three years 72 nurseries are upgraded and modernized to produce about 1 crore good quality plants per year.
• This program ensures production of high quality grafted / other planting material and timely supply.

• Infrastructure created in five years –
576 Shed net Houses (57,600 sq.mtr.)
- Size 100 sq.mtr. each - Production 5,000 plants per batch- Total capacity created 115 lakh plants per year- 30-40 days cycle
24 Mist Chambers (3600 sq.mtr.)- Size 150 sq.mtr. each- Production 20,000 plants per batch- Total capacity created 20 lakh plants per year- 25-40 days cycle
STRENGTHENING OF NURSERIES

• Infrastructure created in five years –
24 Hardening Yards (6000 sq.mtr.)- Size 250 sq.mtr. each - Production 35,000 plants per batch- Total capacity created 30 lakh plants per year- 20-30 days cycle
39 Green Houses (3900 sq.mtr.)
• All these protected structures created total 72,000 sq.mtr. area to produce about 1 crore high quality plants per year.
STRENGTHENING OF NURSERIES
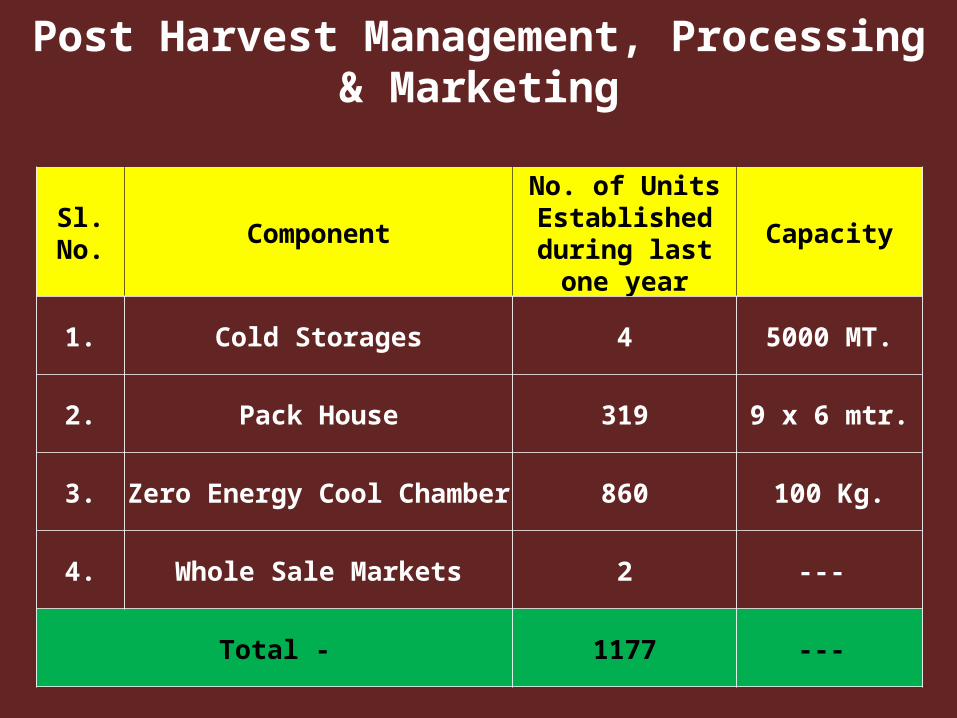
Post Harvest Management, Processing & Marketing
Sl. No. ComponentNo. of Units
Established during last one year
Capacity
1. Cold Storages 4 5000 MT.
2. Pack House 319 9 x 6 mtr.
3. Zero Energy Cool Chamber 860 100 Kg.
4. Whole Sale Markets 2 ---
Total - 1177 ---

Issues in PHM• Lack of awareness among farmers in the field of
PHM. Department is also not properly equipped with knowledge / resources to motivate farmers.
• Capital intensive activity, it requires huge capital investment and technical know-how to establish entire cold-chain.
• To make PHM successful activity about 300-400.00 crore rupees are required within 5 years. Neither the farmers nor the entrepreneurs of Chhattisgarh are financially capable of investing this huge capital amount. Therefore intervention from government is required.
• Subsidy given for PHM and marketing is not attractive and lucrative. Provision of credit linked back ended subsidy in some activities, is major de-motivating factor for availing subsidy.

• At present horticulture is a individual activity, there is no system of group farming or contract farming. Since entire cold chain management requires sufficient quantity of raw material to operate it efficiently and optimally. For bulk production, compact production cluster of particular produce is required.
• For processing, round the year availability of raw material is essential to make it viable. To ensure availability of raw material during off-season safe storage of raw material in the glut season is required.
• In marketing sector private entrepreneurs are not coming forward due to various reason like capital investment APMC Act, geographical remoteness and mind set and barnding.
Issues in PHM

• APMC Act prohibits transaction outside the regulated mandis and does not allow direct marketing and direct procurement of agriculture produce from farmers fields. APMC implementation restricts the setting up of markets other than by the state government. This restricts the scope for corporate houses venturing into horticulture sector.
• In absence of institutions like Grower Associations, Farmers Cooperative/Society, Common Enterprise Group, Contract Farming etc., marketing sector is unable to organize and strengthen.
• Single gateway to regulated market would save time and improve efficiency.
Issues in PHM
• Participation of private sector to contract farming and land leasing arrangements will allow accelerated technology transfer, capital flow and assured market for horticulture.
• Food processing industry on part of private sector should be simplified and encouraged, therefore backward linkages of horticulture crop can be developed.
• Most of the produce is directly procure from the field of big farmers by commission agents / middle man from outside the state.
• Small farmers are depend on village merchants or on nearby rural markets to lift their surplus produce. Infrastructure development at all the tires of market is essential to organize small farmers having no bargaining power, quality incentive and share in final consumer price.
• Vertical coordination of farmers with cooperatives / societies, contract farming and retail chain would facilitate them to deliver better output due to lower risk, better infrastructure, better price and created awareness to prevailing technology.
Issues in PHM
New Interventions Proposed
• Create and develop micro irrigation infrastructure and popularization of micro irrigation system by establishing viable micro irrigation networks.
• Bring more area under protected cultivation to fulfill the demand of vegetables in urban areas throughout the year.
• Create appropriate infrastructures like pack house, cold storage, low energy cool chambers, ripening chambers and marketing facilities to minimize post harvest losses special package of 75-90% subsidy for PHM is proposed for the state.
• Focus 2-3 crops will be selected in different regions of the state.

USP of the state in term of horticulture• Production of lean period vegetables and fruits like
Banana – Oct planting & Nov/Dec harvesting (5000 Mt. surplus), Papaya – Feb planting & Nov/Dec harvesting (55,000 Mt.), Brinjal – Jun planting & Sep/Nov harvesting (8000 Mt.), Cauliflower - Jun planting & Sep/Nov harvesting (31,500 Mt.), Tomato - Jun planting & Sep/Nov harvesting (2,11,000 Mt.), Kharif Potato (2,27,00Mt.), Okra – Feb planting & Apr/May harvesting (3000 Mt.) and Chili – Jun planting & Oct/Nov harvesting (8000 Mt.) can be further strengthened and developed due to favorable climatic condition.
• Surplus of fruits and vegetables like Cashew-nut (5000 Mt.), Mango (55,000 Mt.), Tomato (2,00,000 Mt.) and Chili (20,000 Mt.) can be used for processing, value addition and export.

• Good network of department nurseries (117 with production capacity of 2.50 crore plants) that can be strengthened to produce quality planting material and reduce the demand supply gap (50% shortfall, especially due to TC Banana).
• Good transport network to get access to in-land markets as-well-as exporting the products outside the state.
• Convergence with MNREGS helps in effective implementation of NHM through providing protection, irrigation, maintenance etc., to the plantation crops.
• Locational advantage of sharing borders with state like Orissa, M.P., A.P., Maharastra and Jharkhand that have huge market demand for fruits and vegetables, can be en-cashed as a pull factor for promotion of horticulture.

• Area, production and productivity has increased but due to lack of PHM practices there is considerable post harvest losses (25-40%) and ultimately reduction in net return.
• No facility for proper collection and storage of surplus produce at farm-gate level as-well-as off-farm level and absence of organize market network from rural market to terminal market.
• Absence of forecasting facilities both in term of weather/ disease and price of products, it makes position of farmers vulnerable and increases the risk factor.
• Lack of exposure as-well-as orientation of both the farmers and departmental staff towards modern horticulture practices.
Strategy – Key issues

• Increasing productivity of horticulture crops.
• Reduce / minimize post harvest losses at farm-gate level.
• Strengthening and consolidating organic cultivation and achieving organic certification.
• Developing network of cold storages and cold chain.
• Developing market infrastructure across the state, identify target consumers through market segmentation.
• Developing new institutions like Grower Associations or Farmers Cooperative / Society, Common Enterprise Groups and strengthening the old ones like existing SHGs / WUAs / Micro Credit Groups for production, processing and marketing of the product.
Strategy – Key Focus Areas

Strategy – Implementation A. Increase in crop productivity –
Productivity is low and declining – Considerable gap in yield potential and average yield.
This gap can be reduce through -
i. Creating assured irrigation facility –• Cost effective with in-line drip system.• Drip irrigation facility with multiple use of laterals as per crop option
through crop planning.• Exploring new and existing sources of surface water in the village like
pond, tanks etc.• De-silting and rejuvenation of existing canal systems of the state.
To achieve this goal apart from support from NHM and MIS institutional linkage will be developed with irrigation department and convergence with MNREGS.

Yield Potential & Gap in Horticulture Crops
in Mt.

ii. Ensuring Plant health to ensure effective protection of crops and efficient pest management through -
• Setting up of disease forecasting units (8), bio-control labs (18) and plant health clinics (36) are required to reduce the risk of losses from pest and diseases.
• Capacity building of farmers and staff in the field of IPM and aggressive campaigning in support of IPM .
To achieve the goal along with inputs from NHM, institutional linkages will be developed with agriculture universities for research inputs, private research institutes and laboratories and KVKs for dissemination of information.

iii. Ensuring Soil health for knowing status of macro & micro nutrient in the soil and their availability to the plant through -
• Setting up of leaf-tissue analysis lab (5) to identify the status of micro nutrients in the plant to know the nutritional status of the crop.
• Soil testing of all the beneficiaries and preparation of soil health card for individual farmer. This will be helpful to identify the status of micronutrient and their appropriate requirement in the soil, that will help in crop planning, nutritional management and introduction of new crops. (In Dhamtari & Janjgir-Champa district process is complete with the help of RKVY but in NHM districts there is no such provision).
To achieve the goal along with inputs from NHM, institutional linkages will be developed with soil testing labs of Agriculture department and University for soil testing and KVKs for dissemination of information.

Trends in yield for major horticulture crops
Sl. No
CropsAverage
yield 2004-05
Average yield
2010-11
Gains in yield
Yield potential of Chhattisgarh
(SAU recommendation)
Yield Gap
National average
1 Mango 7.45 4.76 -2.69 8 3.24 6.30
2 Litchi 2.28 5.47 3.19 6 0.53 6.00
3 Lime 6.01 6.63 0.62 8 1.37 9.00
4 Guava 7.09 7.70 0.61 16 8.30 11.10
5 Banana 7.10 23.75 16.65 40 16.25 35.90
6 Papaya 7.09 23.31 16.22 50 26.69 33.40
7 Cashew 0.42 0.47 0.05 2 1.53 0.80
8Custard
apple6.96 3.21 -3.75 4 0.79 ---
9Jack fruit
6.58 15.24 8.66 --- --- ---
10 Potato 11.00 14.45 3.45 25 10.55 19.90

Sl. No
CropsAverage
yield 2004-05
Average yield
2010-11
Gains in yield
Yield potential of Chhattisgarh
(SAU recommendation)
Yield Gap
National average
11 Tomato 10.14 14.63 4.49 15 0.37 17.90
12 Brinjal 11.09 16.46 5.37 20 3.54 17.00
13 Cabbage 11.11 17.52 6.41 25 7.48 22.20
14Cauli- flower
10.60 16.64 6.04 20 3.36 18.10
15 Okra 9.95 17.42 7.47 10 -7.42 10.30
16 Onion 10.75 15.55 4.80 20 4.45 15.10
17 Peas 7.89 9.24 1.35 --- --- 8.20
18 Arbi 10.85 13.48 2.63 --- --- ---
19 Chilli 5.74 6.19 0.45 17.5 11.31 1.60
20 Coriander 3.33 3.74 0.41 3 -0.74 0.60
21 Ginger 13.63 10.90 -2.73 20 9.10 3.50
22 Turmeric 11.25 8.48 -2.77 25 16.52 4.60
23 Garlic 7.35 5.35 -2.00 7.5 2.15 4.80
B. Creating credit linkages -
• The estimated loan distributed for horticulture crops is around `.150.38 crores by co-operative and other banks. Which is about 12.7% of total agricultural loan.
• Per ha. loan distribution is around `.2520.00 for horticulture crops. Which comes about 2% (Spices and non-perennial fruits) and 5-6% (Fruits and Vegetables) of total production cost. Credit situation is very poor.
• Most of the forms of the banks that needed to be filled up by the farmers are in English that creates a hindrance for dissemination of information. The selection criteria for getting the loan from the bank is also such that most of the farmers can not avail the facilities.

• Grooming and sensitization of bank staff is needed. Co-ordination between bank staff and agriculture department is not very satisfactory.
• It is required to take the landless, marginal and small farmers of the state in the fold of financial institutions like banks through creating awareness among the farmers about their entitlements, better coordination with banks and government agencies to reduce the cumbersome processing practices.
To achieve the goal linkages will be developed with Lead Banks, nationalized banks, Rural Banks & Primary Agricultural Societies and SFAC . For creating infrastructure venture capital assistance from SFAC will be very helpful.

C. Proper Harvesting and Post Harvest Management of Crops – Shifting of focus from expansion of area to PHM, Marketing and Processing of the produce through-
The state has identified 96 potential production clusters and collection centers. The analysis has been made to identify the quantum of produces that needs to be stored. Based on the volume of produce further analysis is being made to design the storage facilities with requisite space. Based on the calculation establishment of 41 cold storages and 75 low cost onion storage is planned which are distributed across the state.
• To give access to the farmers in different agro-climatic zones. • To reduce transportation cost and promote horticulture cultivation.
Among the horticulture crops in the state Tomato (60,000 Mt.), Mango (55,000 Mt.) and Cashew-nut (4000 Mt.) are identified as major target crops for further processing and value addition. The crops are identified based on their surplus production.
• To make it economically viable for processing.

Based on the production and collection centers of horticulture products a market network is planned.
• To cater to the need of the farmers right from the village level to the terminal market. Focus is being made to develop a network of primary rural markets with appropriate infrastructure (113), whole sale market (13), terminal market (1) across the states to give benefit to the farmers just after the farm-gate level.
• Analysis is made based on the crop wise production volume (8.53 lakh Mt. vegetable and fruits) that can be marketed and designed.
• Input support for marketing of the products by creating pre-cooling units (18), zero energy based cool chamber (3155), low energy cool chambers (44), mobile pre-cooling unit (1), ripening chamber (16) and pack houses (848) for increasing the price premium of the crops.

It is planned to develop institution such as Farmers Interest Groups (FIGs) at villages level and Farmers Producer Organization (FPOs).
• Formation of FIGs with mobilizing 15-20 farmers in each FIGs.
• Association of FIGs to form FPOs at appropriate federating point. For improved input and output market access and negotiating power.
• Identification of local market aggregator at FPO level and State/National market aggregator.
• Whole sale markets will be developed at the blocks/district level based on the potential of the crops. FIGs/farmers will get the opportunity to participate in the open auction to sell the products in the wholesale market.
To achieve this goal SFAC will act as coordinator and resource organization. To develop market setup linkage will be developed with CG Rajya Krishi Vipran Board (Mandi Borad) and financial assistance from NHM & RKVY will be taken.
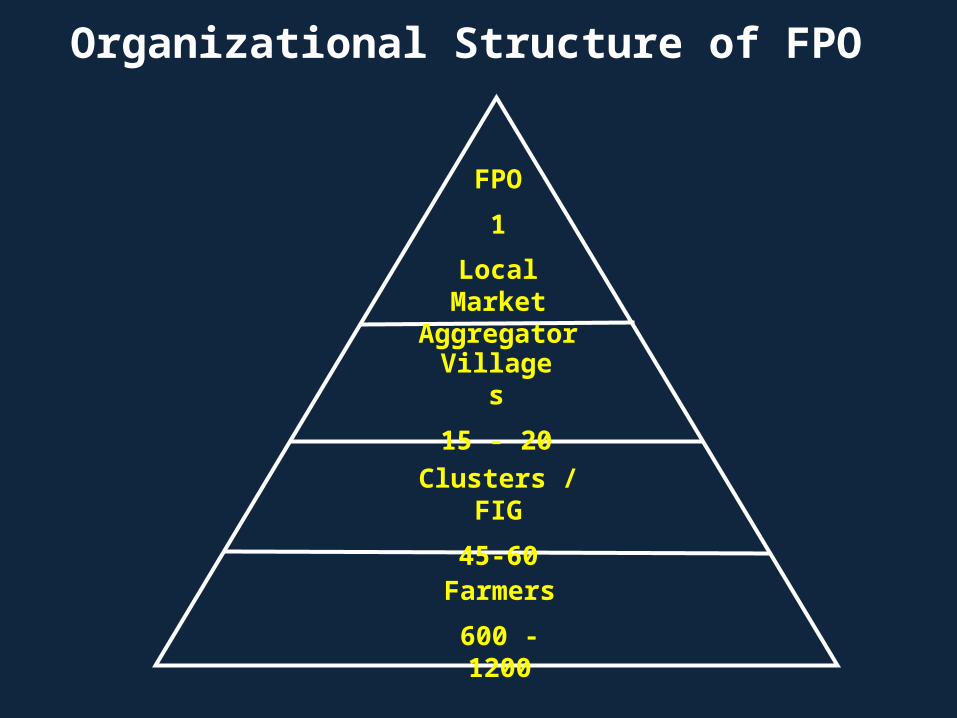
Organizational Structure of FPO
FPO
1
Local Market Aggregator
Villages
15 - 20
Clusters / FIG
45-60
Farmers
600 - 1200

Establishment of network for disseminating real time information of product prices. A market information system will be developed. Farmers can access the real time information related to product prices through the e-kiosks to be set at the primary rural market / wholesale market / terminal market level where information will be uploaded about the prices of the major mandis of the state as well as other cities of the country. The farmers can also get registered in the mobile phone network through which they will be receiving information in their mobile phone periodically.
• This will help farmers gaining better bargaining power, price forecasting and planning for marketing their products.
To achieve this goal linkages will be developed with ORG NIELSEN. The firm has already started the base work for collection of data related to production, processing and marketing of horticulture products from all the districts of the state.

Developing Management Information System (MIS) right from point of production to collection, storage, processing and marketing at different levels using Geographic Information System (GIS).
• To facilitate effective decision making both at the Mission Management Level and Farm Level.
To achieve this goal linkages will be developed with the firms having experience of developing and implementing such programs in natural resource based activities.

PROPOSAL FOR CAPACITY BUILDING AT DIFFERENT LEVEL
Type of Training
Proposed Participants
Tentative areas to be covered Expected outcomesPotential Training
Institutes
For Farmers -
Institution building and management at the district
level
Selected Farmers and
SHG members
- Formation of SHGs, and CEGs
Institutionalized production of
horticulture crops, visible impact in terms
of better economic, social and ecological return at the cluster level, integration with existing programs for pulling of resources
and facilities
IBRAD and other organizations having
similar experiences
- Group Management
- Conflict Management skills
- Leadership development
- Financial management
- Participatory planning and monitoring skills
- Convergence with existing programs like MNREGA, NRLM etc

PROPOSAL FOR CAPACITY BUILDING AT DIFFERENT LEVEL
Type of Training
Proposed Participants
Tentative areas to be covered Expected outcomesPotential Training
Institutes For Farmers -
Issue based in situ Training
at district level
Farmers (50 farmers in a batch at the district
level)
Though the issues will be identified based on the district specific requirements but the emphasis will be on issues like After the training
farmers will be able to increase the
productivity and there will be increase in
production of crops. The post harvest losses will be reduced both at the farm gate level and during transit, shelf life
of the crops will be increased and farmers
will get increased return. mar
KVKs, Extension departments of
Agriculture Colleges, NGOs having experience in
conducting such trainings
Improved Production- High density plantation- Canopy management- Pruning of fruit trees- Vermi compost preparation- Integrated Pest Management- MIS, fertigation and
automation- Water conservation methods- In situ mulching for moisture
conservation- Hybrid seed production- Precision farming- Protected cultivation- Integrated farming

PROPOSAL FOR CAPACITY BUILDING AT DIFFERENT LEVEL
Type of Training
Proposed Participants
Tentative areas to be covered Expected outcomesPotential Training
Institutes For Farmers -
Issue based in situ Training
at district level
Farmers (50 farmers in a batch at the
district level)
Improved Production
After the training farmers will be able to
increase the productivity and there
will be increase in production of crops.
The post harvest losses will be reduced both at the farm gate level and during transit, shelf life
of the crops will be increased and farmers
will get increased return. mar
KVKs, Extension departments of
Agriculture Colleges, NGOs having experience in
conducting such trainings
- Climate change adaptation through horticulture for rural livelihood
- High value cropping and diversification of agriculture
- Nursery raising Post Harvest Management
- PHM and value addition of horticulture produce
- Packaging and Preservation - Processing of selected
productsMarketing- Developing Marketing
Network of horticulture produces
- Application of ICT for marketing
- Organic Certification

PROPOSAL FOR CAPACITY BUILDING AT DIFFERENT LEVEL
Type of Training
Proposed Participants
Tentative areas to be covered Expected outcomesPotential Training
Institutes For Farmers -
Issue based Training at
the state level
Selected farmers from
cluster of districts
The focus will be on
This will lead to enhanced productivity and better return for
the farmers
KVKs, Extension departments of
Agriculture Colleges, NGOs having experience in
conducting such trainings
- Tissue culture cultivation of banana, papaya etc
- Organic cultivation practices- Improved seed production and
Certification - Agribusiness practices- Advanced Technology for oil
palm production- Integrated production and post
harvest management of tropical tuber crops
- Management of Honey bee colonies for effective pollination
- Integrated nutrient management
- Integrated farming system- Innovative vegetable and fruits
production techniques- Orchard planning and
establishment

PROPOSAL FOR CAPACITY BUILDING AT DIFFERENT LEVEL
Type of Training
Proposed Participants
Tentative areas to be covered Expected outcomesPotential Training
Institutes
For Farmers -
Training of Trainers
Selected farmers at
different agro climatic
regions with follow up
Focus will be on developing
The trained participants will in turn
act as trainer for the local farmers
Institute’s having experience in
conducting TOTs for the farmers.
Experienced subject matter specialists from reputed institutes will be invited as resource
persons for specific topics
- Training skills
- Training management
- Developing Technical Skills to improve production techniques, post harvest management, value addition and marketing of selected crops of the region like banana, litchi, mango, cashew, chilly, tomato, aloevera etc

PROPOSAL FOR CAPACITY BUILDING AT DIFFERENT LEVEL
Type of Training
Proposed Participants
Tentative areas to be covered Expected outcomesPotential Training
Institutes
For Farmers -
Developing Para
Horticultur-ists at the state level
Educated Rural Youth (minimum class XII
pass)
Focus will be on
After learning the skills the participants can
develop as entrepreneurs and also
can earn through providing services to the farmers of their
area
The training will be delivered in Hybrid Distance Learning
mode. The participants will have Personal
Contact Program for about 15 days spreaded
over four months coupled with practical implementation of the
skills learned in selected nurseries and
field as well as web based tutorial classes.
- Production of high value crops and management
- Nursery raising
- Grafting
- Organic cultivation Integrated Pest Management
- Irrigation management- Post Harvest Management
like Grading, Sorting, Packaging, Storage of products
- Processing of selected products etc
- Improved vegetable and fruit cultivation

PROPOSAL FOR CAPACITY BUILDING AT DIFFERENT LEVEL
Type of Training
Proposed Participants
Tentative areas to be covered Expected outcomesPotential Training
Institutes
For Farmers -
Developing Para
Horticulturists at the state
level
Educated Rural Youth (minimum class XII
pass)
Focus will be on
After learning the skills the participants can
develop as entrepreneurs and also
can earn through providing services to the farmers of their
area
The course module can be developed and the
course can be coordinated by IBRAD who have experience of running such courses at
national level. Inputs for designing the course
will be taken from subject matter
specialists of the relevant topics.
- Protected cultivation
- Micro climate and soil management
- Integrated nutrient management
- Precision farming
- Marketing and financial management
- Inventory management and record keeping

PROPOSAL FOR CAPACITY BUILDING AT DIFFERENT LEVEL
Type of Training
Proposed Participants
Tentative areas to be covered Expected outcomesPotential Training
Institutes For the Technical staff/Field functionaries -
Resource Person
Development program with study
tour outside the state
Technical staff and
field functionaries
- Tissue culture
After training, the participants can in turn train the local
farmers
Institute of Horticulture
Technology, Noida BAIF, Pune Indian
Institute of Horticulture Research,
Bangalore CFTRI, Mysore Post Harvest Technology Centre,
IIT, Kharagpur, National Institute of Organic Farming, Noida, MANAGE,
Hyderabad
- High Density Plantation- Rejuvination of senile
orchards- Irrigation and fertigation
techniques in greenhouse- Raising nursery in mist
chamber- Greenhouse management and
production- Production of high value
crops under poly house and management
- Nursery management- Innovations in vegetable,
fruits and flower production- Plug type vegetable cultivation - Post Harvest Management of
crops

PROPOSAL FOR CAPACITY BUILDING AT DIFFERENT LEVEL
Type of Training
Proposed Participants
Tentative areas to be covered Expected outcomesPotential Training
Institutes
For the Technical staff / Field functionaries -
Training of Trainers for
selected officials at
the state level
Selected ADHO and RHEO from
the state
- Training skills
After training they will in turn conduct
training in the state
Organisations having experience in
organizing ToTs for the officials will be the
training coordinator. They will invite
resource persons from reputed institutions like
Central Tuber Crops Research Institute,
Kerala, Directorate of Cashew and Cocoa, Indian Institute of
Horticulture, BCKV, IGKV as required
- Training management
- Specific skills related to crop specific production, post harvest management and marketing like cashew, banana, mango, litchi, tuber crops etc

PROPOSAL FOR CAPACITY BUILDING AT DIFFERENT LEVEL
Type of Training
Proposed Participants
Tentative areas to be covered Expected outcomesPotential Training
Institutes For the Technical staff/Field functionaries -
Refreshers Courses
Selected ADHO and RHEO from
the state
- Climate Change and Horticulture management
Participants will learn the contemporary
issues, potentials and skills in horticulture and will be able to
apply them in the field to increase horticulture
production and productivity
National institute of organic farming,
Institute of Horticulture
Technology IBRAD
- Management of Extension System
- High value cropping and diversification of agriculture
- Contribution of Horticulture towards CDM
- Organic Certification of Horticulture crops
- Gender sensitization and gender budgeting
- Participatory Planning and monitoring
Orientation Training with
study tour
Senior officials of the state
- ICT in Horticulture
Participants will get exposure and can apply the skills learnt in the
state
Exposure visits can be organized at Indian
Institute of Horticulture Research, Tamil Nadu Agriculture University,
Coimbatore, IIT, Kharagpur BCKV GBPUm Pantnagar
- Improved Vegetable and fruit production technology
- Seed production and certification
- Organic farming

PROPOSAL FOR CAPACITY BUILDING AT DIFFERENT LEVEL
Type of Training
Proposed Participants
Tentative areas to be covered Expected outcomesPotential Training
Institutes
Mission Management staff -
Training on Project
Management
Mission Management
staff
- Project Management
Efficient implementation of
the project will be ensured
Institute’s having experience in
conducting such trainings like IBRAD
- Project planning
- Monitoring

Sl. No.
Training Activities
Apr May Jun Jul Aug Sep Oct Nov Dec Jan Feb Mar
1 Seed Sowing
2Cultivation of Fruit and Vegetable Crops
3 Seed Production
4Propagation and Plant Production
5Use of Micronutrients
6 Organic Farming
7
Implementation of Micro Irrigation System and its Maintenance
A) TRAINING FOR FARMERS / PANCHAYAT FUNCTIONARIES -
Schedule of Training Activities - Pert

B) TRAINING FOR MALI'S (DEPARTMENTAL) -Sl. No.
Training Activities Apr May Jun Jul Aug Sep Oct Nov Dec Jan Feb Mar
1Seed Sowing and Seed Bed Preparation
2Vegetative Propagation Methods
3Training and Pruning of Mother Plants
4 Preparation of Bud Stick 5 Top Working
6Technique of Plant Production in Mist Chamber, Green House and Root Trainer
7 Mulching and Drip Technique
8Utilization of Micro Elements, Fertigation through Drip System
9Preparation of Bordaux Mixture and Bordaux Paste
10Maintenance and Operation of Modern Horticulture Equipments
11 Tissue Culture 12 Plantation High Density
13Fruit and Vegetables Preservation
14 Canopy Management

C) TRAINING FOR FRONT LINE STAFF (RHEO, SHDO & HDO)/EXTENSION OFFICERS-
Sl. No.
Training Activities Apr May Jun Jul Aug Sep Oct Nov Dec Jan Feb Mar
1Management of Extension System
2Improved Vegetable Production Technology
3Hybrid Seed Production and Certification
4Enhancing Agricultural Productivity through pressurized irrigation system
5 Mushroom Cultivation
6Management of Honey Bee Colonies for effective Pollination
7Water Conservation method in Horticulture
8 Integrated Farming System
9 Organic Farming
10 Precession Farming
11Protected Cultivation of Horticulture Crops
12 Human Resources Development
13Promotion of Integrated Pest Management
14PHM and Value Addition of Horticulture Produce
15Agricultural and Horticultural Marketing

Sl. No
Training Activities Apr May Jun Jul Aug Sep Oct Nov Dec Jan Feb Mar
1High value cropping and diversification of Agriculture
2Climate change and Agriculture Management
3ICT in Agriculture / Horticulture
4 Horticulture Export
5Value Addittion and Agribusiness
6
Intensive Horticulture Production under climate change system for rural livelihood
7
Advanced technology for resource management for sustainable Oil Palm Production
8Integrated Production with Post Harvest Management in Tropical Tuber crop.
9 Training Management
10
Gender Sensitization Modules (GSM) to cutting edge level extension functionaries.
D) TRAINING FOR SENIOR LEVEL OFFICIALS (DDH / ADH) -

E) CERTIFICATE COURSE TO DEVELOP PARA PROFESSIONALS -
Sl. No.
Training Activities Apr May Jun Jul Aug Sep Oct Nov Dec Jan Feb Mar
1Model Nursery Training Course
2Plant Protection Training Course
3Mali Training Course
F) TRAINING FOR STATE HORTICULTURE MISSION STAFF -
Sl. No.
Training Activities Apr May Jun Jul Aug Sep Oct Nov Dec Jan Feb Mar
1
Training on Project Management - Plan, Design, Implement and Controll
2 Organic Farming
3Protected Cultivation
4Horticulture Mechanization
5 Rejuvenation

Linkage of Production Clusters with PHM
No. of district
No. of prod-uction Cluster
Total area
(in ha.)
Total expected
production available for marketing
(Mt.)
Total expected Surplus
Production available for cold chain/ processing
(Mt.)
Proposed cold chain unit with location & expenditure for each
item like Cold storage, Pack houses, Refrigerated vans,
Packaging unit, Pre-cooling units, Zero energy cool chamber, On-
farm collection & storage unit & other unit suitable to the cluster
Proposed processing unit with location,
capacity
1. 2. 4. 5. 6. 7. 8.
167 --- 84,134 15,11,975 7,65,435
i. Pack House – 488ii. Cold Storage – 21iii. Pusa Zero Energy Cool Chamber – 1430iv. Low Energy Cool Chamber – 129v. Preservation Unit – 125vi. Low Cost Onion Storage Unit – 70vii. Pre-cooling Unit – 1
Tomato Processing Unit – 2 &
Cashew nut Processing
Unit – 1

Linkage of Production Clusters with Markets
No. of district
No. of production
clusters
No. of collection
centre (a place
from where
produce is collected
& directly goes to
various markets)
Total area of
crops (in ha.)
No. of existing nearest market linkage (Haat/ Bazar)
No. of existing
forwarding Market/
Terminal Market
No. of proposed Primary
Rural Market
No. of proposed Whole Market
No. of proposed Terminal Market
1. 2. 3. 5. 6. 7. 8. 9. 10.
11 96 80 51726 209 57 113 13 1

Change in cropping patternObservation –
– Overall food grain sector has experienced a decline in area of paddy (-1.97%) and coarse cereals (-29.45%) in last 7 years. This shift is in area from food grains is towards fruits (260.70%), vegetables (171.20%), spices (171.57%) and oil seeds (10.91%).
– The gain in horticulture area is a collective impact of diversification of production pattern of farmers and increase demand of consumers due to shift in their consumption pattern.
Sl. No. Crop 2004-05 2010-11% age increase in the area during last
7 years
1. Paddy 39,43,800 38,66,000 -1.97
2. Wheat 99,200 1,10,000 10.88
3. Oilseeds 2,89,400 3,21,000 10.91
4. Coarse cereals 1,94,200 1,37,000 -29.45
5. Fruits 46,247 1,66,813 260.70
6. Vegetables 1,23,491 3,34,917 171.20
7. Spices 28,399 77,126 171.57
8. Flowers 1508 7130 372.81
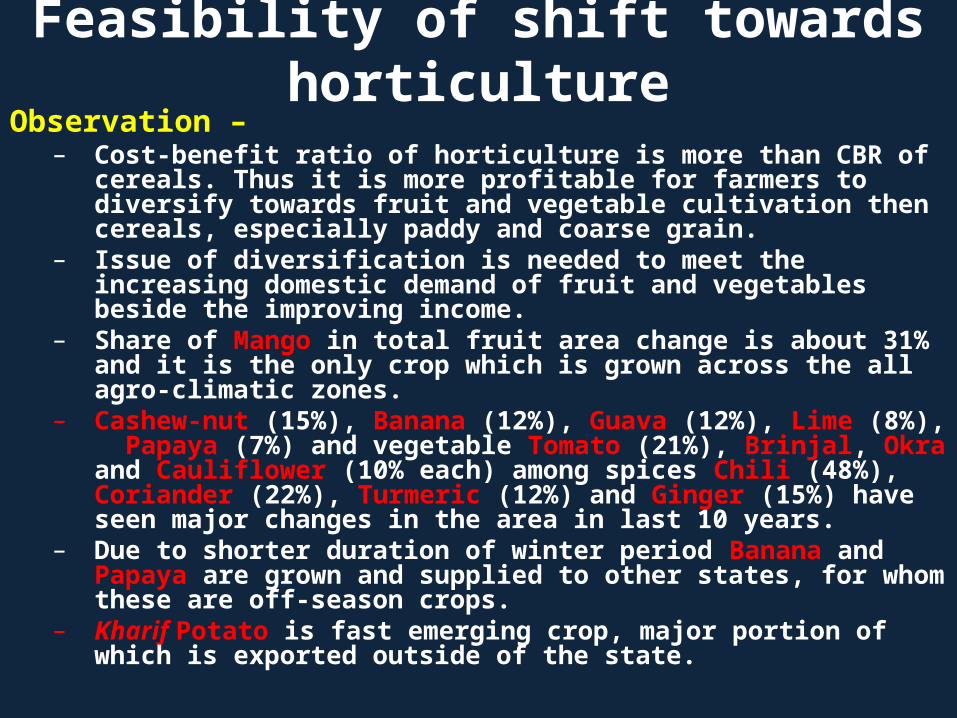
Feasibility of shift towards horticultureObservation –
– Cost-benefit ratio of horticulture is more than CBR of cereals. Thus it is more profitable for farmers to diversify towards fruit and vegetable cultivation then cereals, especially paddy and coarse grain.
– Issue of diversification is needed to meet the increasing domestic demand of fruit and vegetables beside the improving income.
– Share of Mango in total fruit area change is about 31% and it is the only crop which is grown across the all agro-climatic zones.
– Cashew-nut (15%), Banana (12%), Guava (12%), Lime (8%), Papaya (7%) and vegetable Tomato (21%), Brinjal, Okra and Cauliflower (10% each) among spices Chili (48%), Coriander (22%), Turmeric (12%) and Ginger (15%) have seen major changes in the area in last 10 years.
– Due to shorter duration of winter period Banana and Papaya are grown and supplied to other states, for whom these are off-season crops.
– Kharif Potato is fast emerging crop, major portion of which is exported outside of the state.

Change in Area under Major Horticulture crop
Sl. No. CropsIncrease in Area during 2000-2004
Increase in Area during 2005-2009
Increase in Area during 2000-2009
Total Area up to 2008-09
%age Change in
area
1. 2. 3. 4. 5. 6. 7.
1 Mango 481 30633 31114 49765 30.95
2 Cashew 77 15408 15485 19677 15.40
3 Banana 215 12160 12375 14800 12.31
4 Guava 2165 9712 11877 13353 11.81
5 Lime 235 7848 8083 9975 8.04
6 Papaya 144 7187 7331 10597 7.29
7 Jack Fruits 353 5281 5634 6065 5.60
8 Custerd Apple 1241 3474 4715 3911 4.69
9 Litchi 497 3424 3921 5059 3.90
Total Fruits - 5408 95127 100535 201070 100
1 Turmeric 4740 21284 26024 31576 47.68
2 Ginger 3408 8025 11433 13091 20.95
3 Chilli 1269 7091 8360 9600 15.32
4 Coriander 454 6274 6728 8636 12.33
5 Garlic 386 1652 2038 3949 3.73
Total Spices - 10257 44326 54583 109166 100
(in ha.)

Sl. No. CropsIncrease in Area during 2000-2004
Increase in Area during 2005-2009
Increase in Area during 2000-2009
Total Area up to 2008-09
%age Change in
area1. 2. 3. 4. 5. 6. 7.
1 Tomato 4737 22537 27274 42919 21.51
2 Brinjal 2832 22030 24862 36419 19.60
3 Cauliflower 2204 15002 17206 25233 13.57
4 Okra 1440 15564 17004 26703 13.41
5 Cabbage 669 12547 13216 18384 10.42
6 Potato 468 10089 10557 14715 8.32
7 Onion 693 7300 7993 11196 6.30
8 Arbi 536 4909 5445 7627 4.29
9 Peas 540 2725 3265 10355 2.57
Total Vegetable - 14119 112703 126822 253644 100
1 Merigold 90 1466 1556 1961 32.50
2 Tube Rose 30 1317 1347 1347 28.13
3Chrysanth-
emum0 1296 1296 1353 27.07
4 Gladiouls 20 444 464 955 9.69
5 Rose 20 105 125 182 2.61
Total Flowers - 160 4628 4788 9576 100
Change in Area under Major Horticulture crop(in ha.)
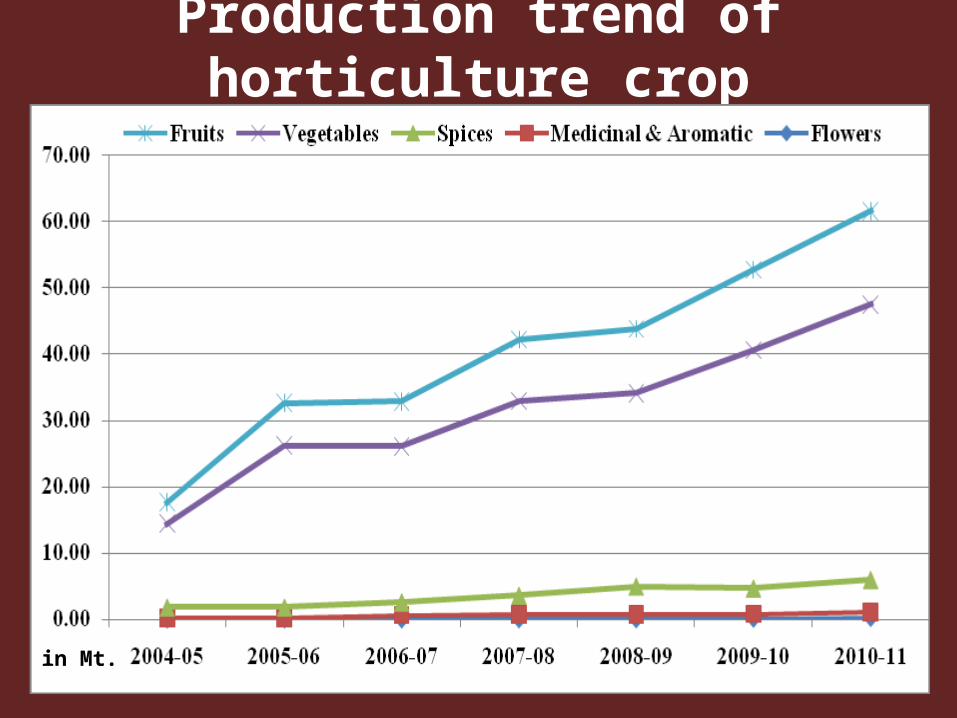
Production trend of horticulture crop
in Mt.

Area expansion trend of horticulture crop
in Ha.

Area & Production of horticulture crop(Area in lakh ha./Production in lakh Mt.)
Sl. No
Crops
2004-05 2005-06 2006-07 2007-08 2008-09 2009-10 2010-11
Area Prod Area Prod Area Prod Area Prod Area Prod Area Prod Area Prod
1. Fruits 0.46 3.24 0.75 6.43 1.00 6.81 1.25 9.32 1.30 9.78 1.46 12.14 1.67 14.10
2. Vegetables 1.23 12.50 1.96 24.32 2.36 23.40 2.93 29.25 2.94 29.04 3.13 35.86 3.35 41.49
3. Spices 0.28 1.70 0.29 1.68 0.41 1.99 0.54 2.89 0.62 4.26 0.64 3.94 0.77 4.87
4.Medicinal &
Aromatic0.02 0.11 0.02 0.12 0.10 0.59 0.12 0.66 0.12 0.66 0.11 0.64 0.12 0.85
5. Flowers 0.02 0.03 0.02 0.03 0.02 0.04 0.02 0.07 0.02 0.07 0.04 0.13 0.07 0.27
Total - 2.01 17.58 3.04 32.58 3.89 32.83 4.86 42.19 5.00 43.81 5.38 52.71 5.98 61.58

Domestic Demand & Supply
Per capita consumption (2010-11) - in
Kg./person/ annum
Total production (2010-11) – in lakh
Mt.
Total demand (2010-11) – in lakh
Mt. *
Per capita demand (2020) – in
Kg./person /annum ** & ***
Total production (2020) – in lakh Mt.
****
Fruit Vegetable Fruit Vegetable Fruit Vegetable Fruit Vegetable Fruit Vegetable
12.1 64.5 14.09 41.49 5.45 19.33 17 95 13.9 41.34
(Unit – in Kg. per person per annum)
(Source – National Sample Survey Organization (NSSO) collects data on house hold consumption by sample survey techniques. This study uses data from consumer expenditure survey of National Sample Survey (NSS) of rounds number 55 pertaining to year 1999-2000).
* Demand projection is made on assumptions about populations, urbanization, poverty and economic growth per capita demand.
** Future population growth will follow the past population growth trend and urban population proportion in total population will also follow past trends.*** 8% GDP growth rate per year is assumed.**** Future production of horticulture crop will follow the current trend of 3% growth per
annum.
Observation -Chhattisgarh in-spite of being one of the largest producers of
vegetables and spices does not have much export volume because of huge domestic demand. Besides this there are supply constraints and huge post harvest losses which lead to lower net availability of produces.

Supply Chain from Farm-gate to Market
CommodityTotal
annual production
Post harvest losses
Total annual consumption
within the state (raw form)
Raw material used for
processing
Total surplus for export to other states
Total import from other
states
1. 2. 3. 4. 5. 6. 7.
Fruit 14.09 4.23 3.08 0.83 * 1.54 *** 1.54
Vegetables 41.49 12.44 16.44 1.24 ** 9.13 **** 1.65 *****
2010-11 (Unit – inLakh Mt.)
(Source – National Sample Survey Organization (NSSO) collects data on house hold consumption by sample survey techniques. This study uses data from consumer expenditure survey of National Sample Survey (NSS) of rounds number 55 pertaining to year 1999-2000).
* Mango is the main crop used for processing Amchoor and Pickle.** Tomato is the main crop used for processing Ketchup and Purie.*** Papaya, Cashew-nut, Banana and Mango are the main crops exported to other states. **** Tomato, Cauliflower, Cabbage, Kharif Potato, Brinjal, Okra, are the main crops exported to other states. ***** Potato, Onion and Garlic are major crops imported from other states.
Observation -The annual per capita consumption of vegetable has increased.
The increase in consumption levels of vegetable and fruits has been quite similar in both the rural and urban areas.

Supply Chain from Farm-gate to Market
(in Lakh Mt.)
(2010-11)

Planting Material Sub-Plan 2012-13
Sl.No.
Fruit cropTarget (in ha.)
No. of plants per ha.
Total no. of plants
required
Procurement
SelfOut
sourcing
1. Mango 1200 100 1,20,000 2,26,715 ---
2. Litchi 420 150 63,000 77,640 ---
3. Lime 495 277 1,37,115 2,75,352 ---
4. Guava 790 277 2,18,830 2,35,690 ---
5.Guava
(High Density)135 1600 2,16,000 --- 1,99,140
6. Banana (TC) 2000 2500 50,00,000 --- 50,00,000
7. Cashew nut 400 200 80,000 --- 80,000
Total - 5440 --- 2,35,001 2,15,403 1,79,191

Sl. No.
Spices cropTarget (in ha.)
Seed rate per ha. (in Kg.)
Total Seed Requirement (in Kg.)
Procurement
Self Out sourcing
1. Chilli 700 0.30 210 --- 210
2. Coriander 500 20 10000 --- 10000
3. Turmeric 1000 250 250000 --- 250000
4. Ginger 1000 175 175000 --- 175000
Total - 4200 --- 4,35,210 --- 4,35,210
Planting Material Sub-Plan 2012-13

Sl. No
Aromatic cropTarget in ha.
Plant/Seed/ Slips per ha.
Total Plant/Seed/
Bulb Requirement
Procurement
Self Out sourcing
1. Vetiver 50 31,250 (Slips) 15,62,500 --- 15,62,500
Planting Material Sub-Plan 2012-13
Sl. No
Flower cropTarget (in ha.)
Plant/Seed/Bulb rate per ha.
Total Plant/Seed/Bulb
Requirement
Procurement
SelfOut
sourcing
1. Rose 150 2100 (Plants) 3,15,000 --- 3,15,000
2. Gerbera 150 1090 (Plants) 1,63,500 --- 1,63,500
3. Rajnigandha 100 56,962 (Bulbs) 56,96,200 --- 56,96,200
4. Gladiolus 300 14,225 (Bulbs) 42,67,500 --- 42,67,500
5. Marigold 500 95 (Pkt.) 47,500 --- 47,500
Total - 1200 --- 1,04,89,700 --- 1,04,89,700

Component wise financial break-up of AAP 2012-13 under NHM
Sl. No.
ComponentFinancial (`. in Lakhs)
% share of totalGOI State Total
A. Plantation Infrastructure & Development -1. Production of Planting Material 367.84 64.91 432.75 3.842. Establishment of New Gardens 1402.45 247.49 1649.94 14.643. Rejuvenation 83.51 14.74 98.25 0.874. Creation of Water Resources 1289.27 227.52 1516.79 13.465. Protected Cultivation 888.63 156.82 1045.45 9.27
6.Promotion of Integrated Nutrient Management (INM)/Integrated Pest Management (IPM)
17.00 3.00 20.00 0.18
7. Organic Farming 262.65 46.35 309.00 2.748. Pollination support through Beekeeping 21.68 3.83 25.50 0.239. Horticulture Mechanization 290.49 51.26 341.75 3.03
10.Technology Dissemination through demonstration/Front Line Demonstration (FLD)
21.25 3.75 25.00 0.22
11. Human Resource Development (HRD) 386.31 68.17 454.48 4.03C. Integrated Post Harvest Management 2899.44 511.67 3411.10 30.26
D.Establishment of Marketing Infrastructure for Horticulture Produce
1179.38 208.13 1387.50 12.31
F. Mission Management 466.33 82.29 548.63 4.92Total - 9581.53 1690.86 11272.39 100.00

Component wise financial break-up of AAP 2012-13 under NHM

PROPOSED ANNUAL ACTION PLAN 2012-13
(`. in lakhs)
Sl. No
Programme UnitScale Per
Unit (lakh)
Subsidy (Proposed Assistance)
Phy. Target
Fin. Target
GoI Share (85%)
State Share (15%)
Remark
I. Research
Central Government Institutes under ICAR, CSIR and others will take up research & development works out of their existing budget for which a Research Advisory Committee will identify the thrust areas.
A. Plantation Infrastructure & Development - 1. Production of planting material -
i) Model Nursery -
(a) Model Nursery (2 to 4 ha.) in Public Sector (`.6.25 lakh / one ha. unit)
No. 25.000 25.000 8 200.00 170.00 30.00
(b) Model Nursery (2 to 4 ha.) in Private Sector (`.6.25 lakh / one ha. unit)
No. 25.000 12.500 4 50.00 42.50 7.50
Sub Total - 12 250.00 212.50 37.50

PROPOSED ANNUAL ACTION PLAN 2012-13
(`. in lakhs)
Sl. No
Programme UnitScale Per
Unit (lakh)
Subsidy (Proposed Assistance)
Phy. Target
Fin. Target
GoI Share (85%)
State Share (15%)
Remark
A. Plantation Infrastructure & Development - 1. Production of planting material -
ii) Small Nursery -(a) Small Nursery (1 ha.) in Public Sector (`.6.25 lakh / one ha. unit)
No. 6.250 6.250 3 18.75 15.94 2.81
(a) Small Nursery (1 ha.) in Private Sector (`.6.25 lakh / one ha. unit)
No. 6.250 3.125 8 25.00 21.25 3.75
Sub Total - 11 43.75 37.19 6.56 iii) Rehabilitation of existing Tissue Culture (TC) units -(b) Rehabilitation of existing Tissue Culture (TC) units in Private Sector (@ 50% subsidy)
No. 15.000 7.500 1 7.50 6.38 1.13
Sub Total - 1 7.50 6.38 1.13
PROPOSED ANNUAL ACTION PLAN 2012-13
(`. in lakhs)
Sl. No
Programme UnitScale Per
Unit (lakh)
Subsidy (Proposed Assistance)
Phy. Target
Fin. Target
GoI Share (85%)
State Share (15%)
Remark
A. Plantation Infrastructure & Development - 1. Production of planting material -
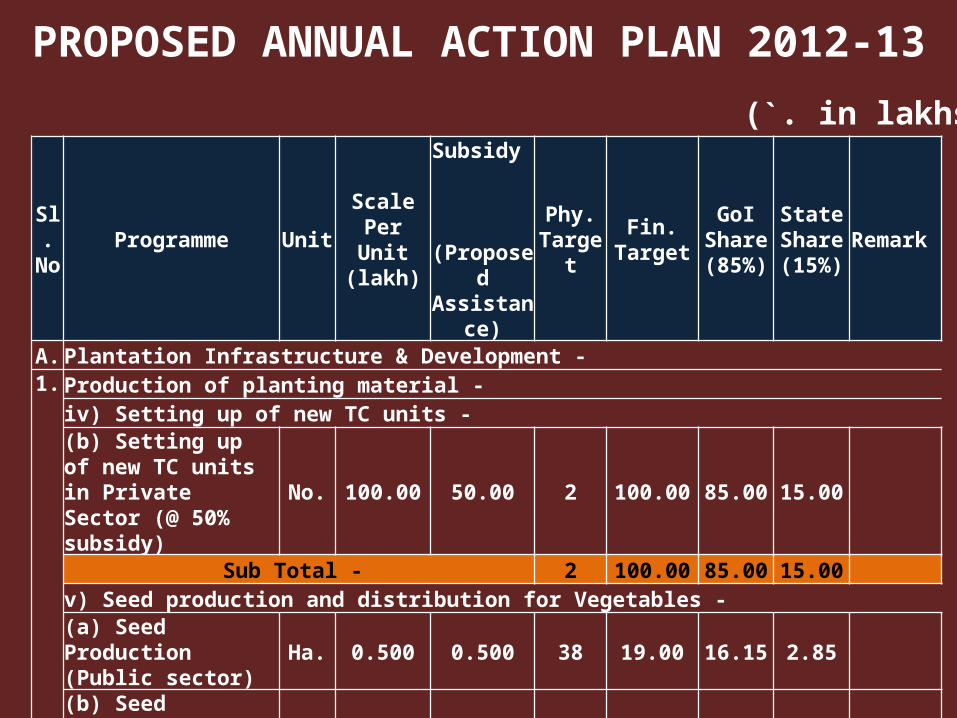
iv) Setting up of new TC units -
(b) Setting up of new TC units in Private Sector (@ 50% subsidy)
No. 100.00 50.00 2 100.00 85.00 15.00
Sub Total - 2 100.00 85.00 15.00 v) Seed production and distribution for Vegetables -(a) Seed Production (Public sector)
Ha. 0.500 0.500 38 19.00 16.15 2.85
(b) Seed Production (Private sector) - @50% subsidy.
Ha. 0.500 0.250 50 12.50 10.63 1.88
Sub Total - 88 31.50 26.78 4.73 Total - 114 432.75 367.84 64.91

PROPOSED ANNUAL ACTION PLAN 2012-13
(`. in lakhs)
Sl. No
Programme UnitScale Per
Unit (lakh)
Subsidy (Proposed Assistance)
Phy. Target
Fin. Target
GoI Share (85%)
State Share (15%)
Remark
A. Plantation Infrastructure & Development - 2. Establishment of New Gardens (Area Expansion) -I. Fruits -
(a) Cost intensive crops (For a maximum area of 4 ha. per beneficiary)iii) Banana (TC) (@50% subsidy)
Ha. 0.832 0.312
- 75% subsidy on planting material in 1st year.
Ha. 0.832 0.312 1000 312.02 265.21 46.80
Sub total - 1000 312.02 265.21 46.80 (b) High density planting (Guava) - @50% subsidy.
Ha. 0.628 0.314
- 60% subsidy on planting material in 1st year.
Ha. 0.314 0.188 135 25.42 21.61 3.81
Sub total - 135 25.42 21.61 3.81

PROPOSED ANNUAL ACTION PLAN 2012-13
(`. in lakhs)
Sl. No
Programme UnitScale Per
Unit (lakh)
Subsidy (Proposed Assistance)
Phy. Target
Fin. Target
GoI Share (85%)
State Share (15%)
Remark
A. Plantation Infrastructure & Development - 2. Establishment of New Gardens (Area Expansion) -I. (c) (i) Fruit crops other
than cost intensive crops using normal spacing. (@75% subsidy)
Ha. 0.400 0.300
- 60% subsidy on planting material in 1st year -a) Mango (Grafted) Ha. 0.220 0.099 1200 118.80 100.98 17.82 b) Litchi (Gooti) Ha. 0.235 0.106 420 44.42 37.75 6.66 c) Lime (Gooti) Ha. 0.3534 0.159 495 78.72 66.91 11.81 d) Guava (Budded) Ha. 0.2195 0.0988 790 78.03 66.33 11.70
Sub total - 2905 319.97 271.97 48.00 - 20% subsidy on planting material in 2nd year -a) Mango Ha. 0.220 0.033 970 32.01 27.21 4.80 b) Litchi Ha. 0.235 0.0353 340 11.99 10.19 1.80 c) Lime Ha. 0.3534 0.053 245 12.99 11.04 1.95 e) Guava Ha. 0.2195 0.033 50 1.65 1.40 0.25 f) Custard Apple Ha. 0.220 0.033 30 0.99 0.84 0.15
Sub total - 1635 59.62 50.68 8.94

PROPOSED ANNUAL ACTION PLAN 2012-13
(`. in lakhs)
Sl. No
Programme UnitScale Per
Unit (lakh)
Subsidy (Proposed Assistance)
Phy. Target
Fin. Target
GoI Share (85%)
State Share (15%)
Remark
A. Plantation Infrastructure & Development - 2. Establishment of New Gardens (Area Expansion) -I. (c) (i) Fruit crops other
than cost intensive crops using normal spacing. (@75% subsidy)
Ha. 0.400 0.300
- 20% subsidy on planting material in 3rd year -a) Mango Ha. 0.220 0.0330 995 32.84 27.91 4.93 b) Litchi Ha. 0.235 0.0353 100 3.53 3.00 0.53 c) Lime Ha. 0.3534 0.0530 100 5.30 4.51 0.80 d) Aonla Ha. 0.2334 0.0350 200 7.00 5.95 1.05
Sub total - 1395 48.66 41.36 7.30 Total - 7070 765.69 650.83 114.85
II. Mushrooms -(a) Integrated mushroom unit for spawn, compost production and training -ii) Publice Sector Unit 50.000 50.000 1 50.00 42.50 7.50 (b) Spawn making unit -
i) Public Sector Unit 15.000 15.000 4 60.00 51.00 9.001 Unit at Dhamtari
Total - 5 110.00 93.50 16.50
PROPOSED ANNUAL ACTION PLAN 2012-13
(`. in lakhs)
Sl. No
Programme UnitScale Per
Unit (lakh)
Subsidy (Proposed Assistance)
Phy. Target
Fin. Target
GoI Share (85%)
State Share (15%)
Remark
A. Plantation Infrastructure & Development - 2. Establishment of New Gardens (Area Expansion) -
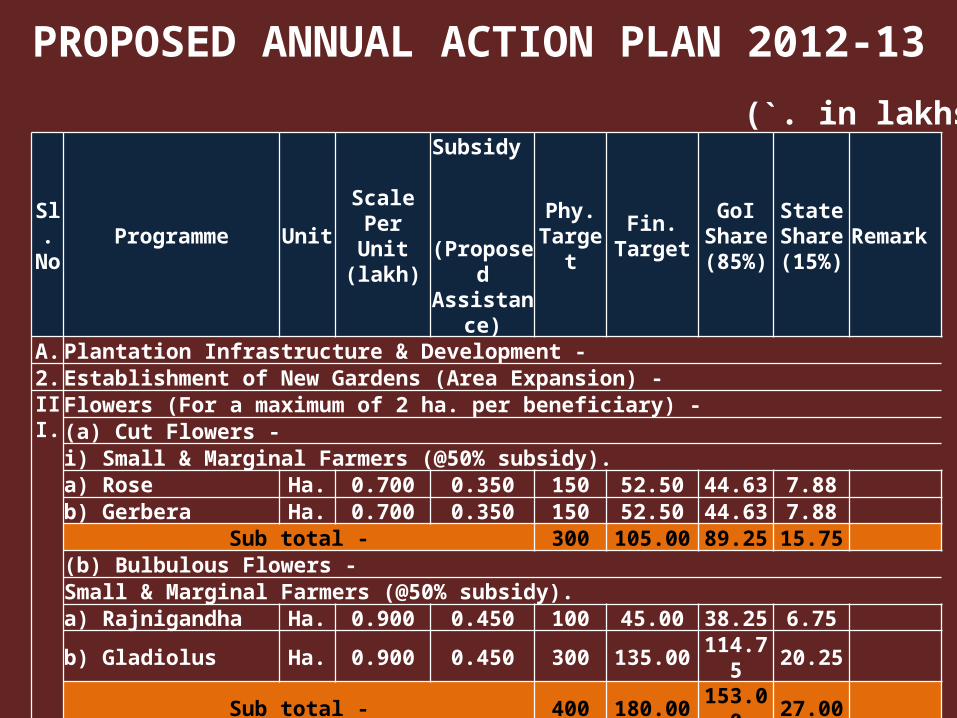
III.Flowers (For a maximum of 2 ha. per beneficiary) -(a) Cut Flowers -i) Small & Marginal Farmers (@50% subsidy).a) Rose Ha. 0.700 0.350 150 52.50 44.63 7.88 b) Gerbera Ha. 0.700 0.350 150 52.50 44.63 7.88
Sub total - 300 105.00 89.25 15.75 (b) Bulbulous Flowers -Small & Marginal Farmers (@50% subsidy).a) Rajnigandha Ha. 0.900 0.450 100 45.00 38.25 6.75 b) Gladiolus Ha. 0.900 0.450 300 135.00 114.75 20.25
Sub total - 400 180.00 153.00 27.00 (c) Loose Flowers -i) Small & Marginal Farmers (@50% subsidy).a) Marigold Ha. 0.240 0.120 500 60.00 51.00 9.00
Sub total - 500 60.00 51.00 9.00 Total - 1200 345.00 293.25 51.75

PROPOSED ANNUAL ACTION PLAN 2012-13
(`. in lakhs)
Sl. No
Programme UnitScale Per
Unit (lakh)
Subsidy (Proposed Assistance)
Phy. Target
Fin. Target
GoI Share (85%)
State Share (15%)
Remark
A. Plantation Infrastructure & Development -
2. Establishment of New Gardens (Area Expansion) -IV.Spices (For a maximum area of 4 ha. per beneficiary) -
Seed spices and Rhizomatic Spices. (@50% subsidy)
b) Chilli Ha. 0.250 0.125 500 62.50 53.13 9.38
c) Coriander Ha. 0.250 0.125 500 62.50 53.13 9.38
e) Ginger Ha. 0.250 0.125 1000 125.00 106.25 18.75
f) Turmeric Ha. 0.250 0.125 1000 125.00 106.25 18.75
Total - 3000 375.000 318.750 56.250 V.
Aromatic Plants (For a maximum area of 4 ha. per beneficiary) -
(a) Cost intensive aromatic plants (Patchouli, Geranium, Rosemary, etc.) - @50% subsidy
(b) Other aromatic plants. (@50% subsidy)
c) Vetiver Ha. 0.250 0.125 50 6.25 5.31 0.94
Total - 50 6.25 5.31 0.94

PROPOSED ANNUAL ACTION PLAN 2012-13
(`. in lakhs)
Sl. No
Programme UnitScale Per
Unit (lakh)
Subsidy (Proposed Assistance)
Phy. Target
Fin. Target
GoI Share (85%)
State Share (15%)
Remark
A. Plantation Infrastructure & Development - 2. Establishment of New Gardens (Area Expansion) -
VI.Plantation crops (For a maximum area of 4 ha. per beneficiary) -(a) Cashew & Cocoa including replanting - (@50% subsidy).
Ha. 0.400 0.200
- 60% subsidy on planting material in 1st year.
Ha. 0.200 0.120 400 48.00 40.80 7.20
Total - 400 48.00 40.80 7.20 Total Sr.No. 2 (I to VI) - 1649.94 1402.45 247.49
3.
Rejuvenation / replacement of senile plantation including Canopy management. (@50% subsidy to a limited of 2 ha. per beneficiary)
Ha. 0.300 0.150 655 98.25 83.51 14.74

PROPOSED ANNUAL ACTION PLAN 2012-13
(`. in lakhs)
Sl. No
Programme UnitScale Per
Unit (lakh)
Subsidy (Proposed Assistance)
Phy. Target
Fin. Target
GoI Share (85%)
State Share (15%)
Remark
A. Plantation Infrastructure & Development - 4. Creation of water resources -
(a) Community Tanks -i) Community tanks/on farm ponds/on farm water reservoirs with use of plastic/RCC lining - (10 ha. of command area, with pond size of 100m x 100m x 3m) -- In Plain areas No. 15.000 15.000 50 750.00 637.50 112.50 - In Hilly areas No. 17.250 17.250 10 172.50 146.63 25.88
Sub total - 60 922.50 784.13 138.38 (b) Water harvesting system for individuals - for storage of water in 20m x 20m x 3m ponds/wells @Rs.100.00 cum (@50% subsidy) -- In Plain areas No. 1.200 0.600 266 159.60 135.66 23.94 - In Hilly areas No. 1.380 0.690 1 0.69 0.59 0.10
Sub total - 267 160.29 136.247 24.044 (c) Bore-wells -- In Plain areas No. 0.700 0.700 600 420.00 357.00 63.00 - In Hilly areas No. 0.700 0.700 20 14.00 11.90 2.10
Sub total - 620 434.00 368.900 65.100 Total - 937 1516.79 1289.27 227.519

PROPOSED ANNUAL ACTION PLAN 2012-13(`. in lakhs)
Sl. No
Programme UnitScale Per
Unit (lakh)
Subsidy (Proposed Assistance)
Phy. Target
Fin. Target
GoI Share (85%)
State Share (15%)
Remark
A. Plantation Infrastructure & Development - 5. Protected Cultivation -
1. Green House Structure -(a) Fan & Pad System (`.1465.00 sq.mtr. @50% subsidy of the cost limited to 4000 sq.mtr. per beneficiary).
Sq. Mtr.
0.01465 0.00733 20000 146.50 124.53 21.98
(b) Naturally ventilated System-i) Tubular Structure (`.935.00 sq.mtr. @50% subsidy of the cost limited to 4000 sq.mtr. per beneficiary).
Sq. Mtr.
0.00935 0.00468 40000 187.00 158.95 28.05
i) Bamboo Structure (`.375.00 sq.mtr. @50% subsidy of the cost limited to 5 unit not to exceed 200 sq.mtr. per beneficiary).
Sq. Mtr.
0.00375 0.00188 25000 46.88 39.84 7.03
Sub total - 65000 233.88 198.79 35.08
PROPOSED ANNUAL ACTION PLAN 2012-13
(`. in lakhs)
Sl. No
Programme UnitScale Per
Unit (lakh)
Subsidy (Proposed Assistance)
Phy. Target
Fin. Target
GoI Share (85%)
State Share (15%)
Remark
A. Plantation Infrastructure & Development - 5. Protected Cultivation -
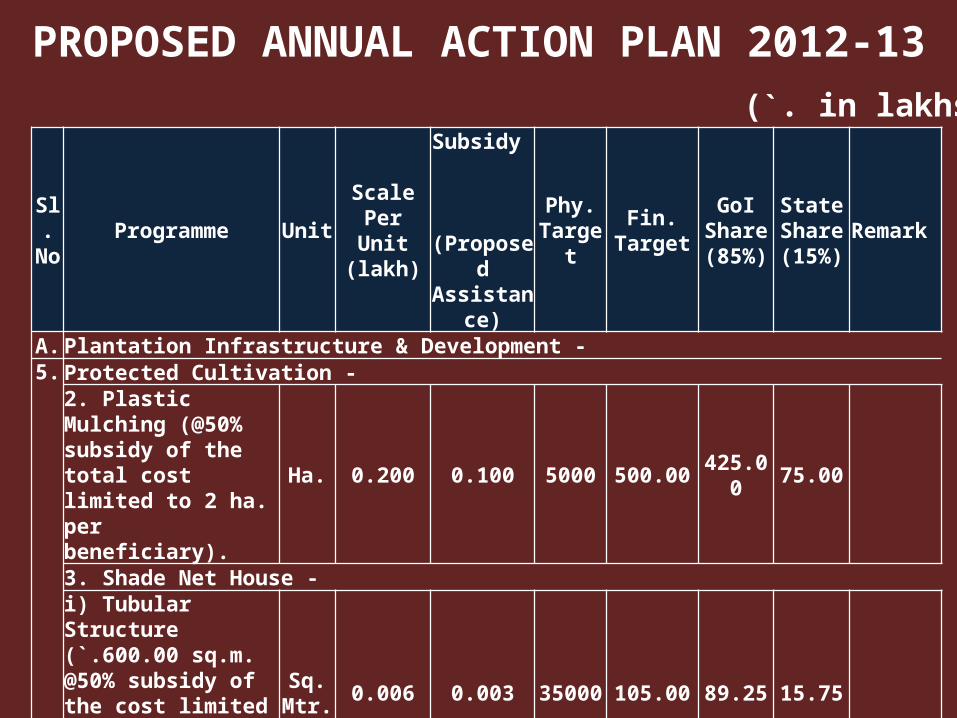
2. Plastic Mulching (@50% subsidy of the total cost limited to 2 ha. per beneficiary).
Ha. 0.200 0.100 5000 500.00 425.00 75.00
3. Shade Net House - i) Tubular Structure (`.600.00 sq.m. @50% subsidy of the cost limited to 1000 sq.mtr. per beneficiary).
Sq. Mtr.
0.006 0.003 35000 105.00 89.25 15.75
ii) Wooden Structure (`.410.00 sq.m. limited to 5 units not to exceed 200 sq.mtr. per beneficiary) - @50% subsidy.
Sq. Mtr.
0.0041 0.0021 4000 8.20 6.97 1.23
PROPOSED ANNUAL ACTION PLAN 2012-13
(`. in lakhs)
Sl. No
Programme UnitScale Per
Unit (lakh)
Subsidy (Proposed Assistance)
Phy. Target
Fin. Target
GoI Share (85%)
State Share (15%)
Remark
A. Plantation Infrastructure & Development - 5. Protected Cultivation -
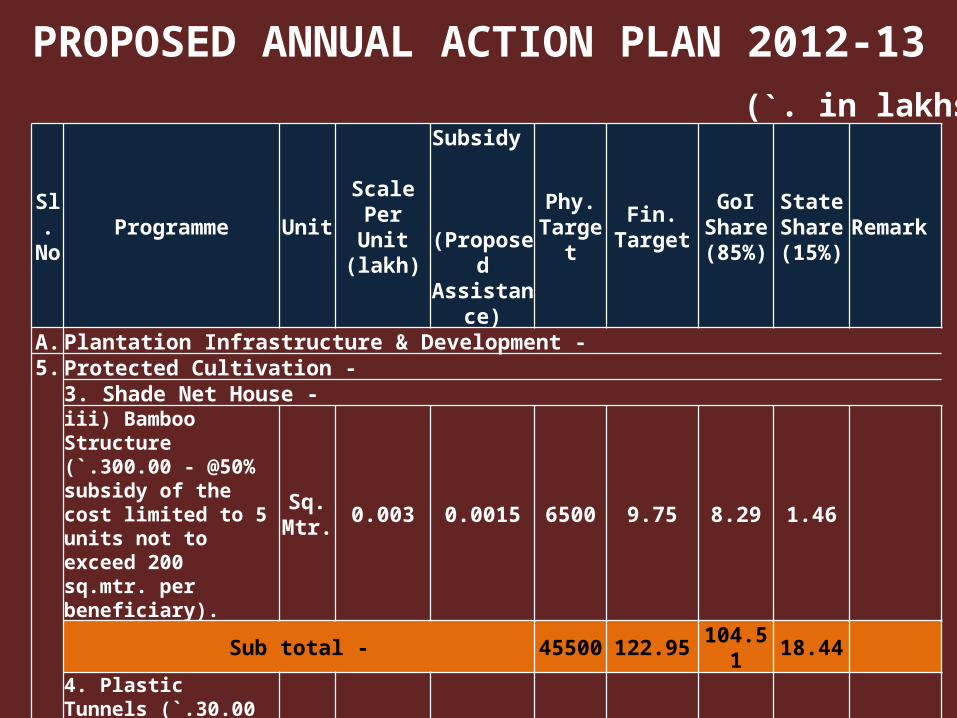
3. Shade Net House - iii) Bamboo Structure (`.300.00 - @50% subsidy of the cost limited to 5 units not to exceed 200 sq.mtr. per beneficiary).
Sq. Mtr.
0.003 0.0015 6500 9.75 8.29 1.46
Sub total - 45500 122.95 104.51 18.44 4. Plastic Tunnels (`.30.00 sq.m. @50% subsidy of cost limited to 1000 sq.mtr. per beneficiary).
Sq. Mtr.
0.0003 0.0002 137000 20.55 17.47 3.08
5. Anti Bird/Anti Hail Nets (`.20.00 per sq.mtr. @50% subsidy of cost limited to 5000 sq.m. per beneficiary).
Sq. Mtr.
0.0002 0.0001 70000 7.00 5.95 1.05
PROPOSED ANNUAL ACTION PLAN 2012-13
(`. in lakhs)
Sl. No
Programme UnitScale Per
Unit (lakh)
Subsidy (Proposed Assistance)
Phy. Target
Fin. Target
GoI Share (85%)
State Share (15%)
Remark
A. Plantation Infrastructure & Development - 5. Protected Cultivation -
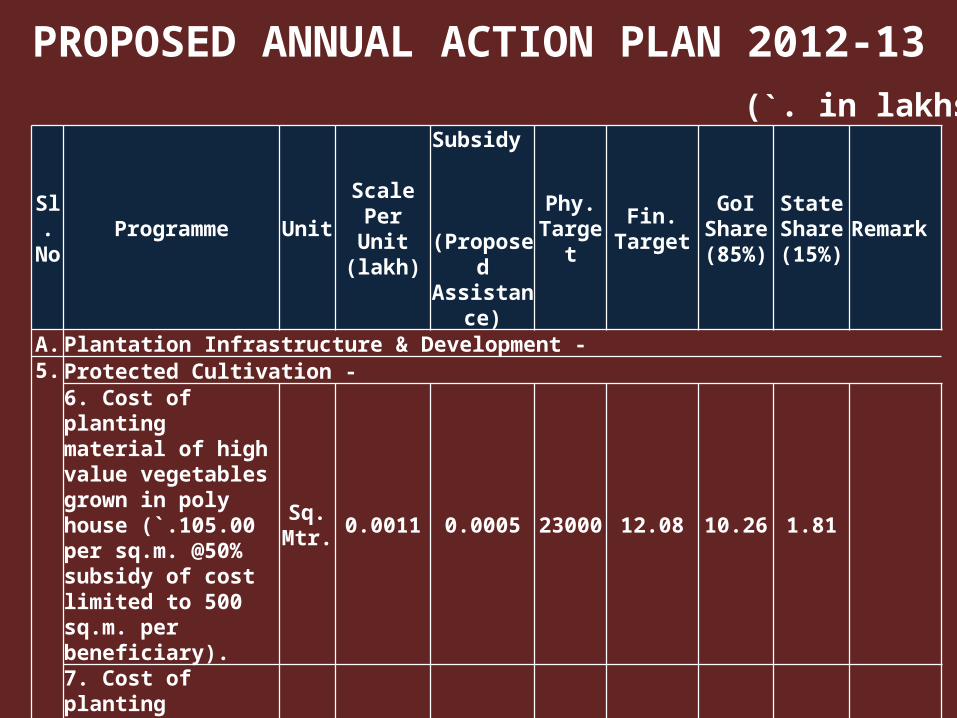
6. Cost of planting material of high value vegetables grown in poly house (`.105.00 per sq.m. @50% subsidy of cost limited to 500 sq.m. per beneficiary).
Sq. Mtr.
0.0011 0.0005 23000 12.08 10.26 1.81
7. Cost of planting material of flowers for poly house (`.500.00 per sq.m. @50% subsidy of cost limited to 500 sq.m. per beneficiary).
Sq. Mtr.
0.005 0.0025 1000 2.50 2.13 0.38
Total - 1045.45 888.63 156.82

PROPOSED ANNUAL ACTION PLAN 2012-13
(`. in lakhs)
Sl. No
Programme UnitScale Per
Unit (lakh)
Subsidy (Proposed Assistance)
Phy. Target
Fin. Target
GoI Share (85%)
State Share (15%)
Remark
A. Plantation Infrastructure & Development - 6. Promotion of Integrated Nutrient Management (INM) / Integrated Pest Management (IPM) -
ii) Promotion of IPM/INM (`.2000.00/ ha. @50% subsidy of cost subject to a maximum of `.1000.00/ha. limited to 4 ha./beneficiary).
No. 0.020 0.010 2000 20.00 17.00 3.00
Total - --- 20.00 17.00 3.00 7. Organic Farming -
(a) Adoption of organic farming (Rs.20,000.00 - @50% subsidy of cost limited to Rs.10,000.00/ha. for a maximum area of 4 ha. per beneficiary) -
i) 40% subsidy in 1st year.
Ha. 0.100 0.040 900 36.00 30.60 5.40
Cary forwarded incomplete
activity of 500 ha. of AAP
2011-12
iii) 30% subsidy in 3rd year.
Ha. 0.100 0.030 1500 45.00 38.25 6.75
Sub total - 2400 81.00 68.85 12.15

PROPOSED ANNUAL ACTION PLAN 2012-13
(`. in lakhs)
Sl. No
Programme UnitScale Per
Unit (lakh)
Subsidy (Proposed Assistance)
Phy. Target
Fin. Target
GoI Share (85%)
State Share (15%)
Remark
A. Plantation Infrastructure & Development - 7. Organic Farming -
(b) Organic Certification (Rs.5.00 lakh for a cluster of 50 ha.) -
i) 30% subsidy in 1st year Clus-
ter
5.000 1.500 18 27.00 22.95 4.05
Cary forwarded incomplete
activity of 500 ha. of AAP
2011-12
iii) 40% subsidy in 3rd year.
5.000 2.000 30 60.00 51.00 9.00
Sub total - 48 87.00 73.95 13.05 (c) Vermi compost units/organic input production unit -i) 50% of cost conforming for permanent structure to the size of 30' x 8' x 2.5' dimension to be administered on pro-rata basis.
No. 0.600 0.300 470 141.00 119.85 21.15
Sub total - 470 141.00 119.85 21.15 Total - 2408 274.00 232.90 41.10

PROPOSED ANNUAL ACTION PLAN 2012-13
(`. in lakhs)
Sl. No
Programme UnitScale Per
Unit (lakh)
Subsidy (Proposed Assistance)
Phy. Target
Fin. Target
GoI Share (85%)
State Share (15%)
Remark
A. Plantation Infrastructure & Development - 8. Pollination support through beekeeping -
(c) Honey bee colony (`.1400.00/colony of 4 farmers @50% subsidy of cost limited to 50 colonies/ beneficiary).
No. 0.014 0.007 720 5.04 4.28 0.76
(d) Hives (`.1600.00/hive @50% subsidy of cost limited to 50 colonies/beneficiary).
No. 0.016 0.008 720 5.76 4.90 0.86
(e) Equipment including honey extractor (4 farmer), food grade container (30 kg), net, etc. (`.14,000.00/set @50% subsidy of the cost limited to one set per beneficiary).
No. 0.140 0.070 210 14.70 12.50 2.21
Total - 1650 25.50 21.68 3.83

PROPOSED ANNUAL ACTION PLAN 2012-13(`. in lakhs)
Sl. No
Programme UnitScale Per
Unit (lakh)
Subsidy (Proposed Assistance)
Phy. Target
Fin. Target
GoI Share (85%)
State Share (15%)
Remark
A. Plantation Infrastructure & Development - 9. Horticulture Mechanization -
(a) Power operated machines/ tools including Power Saw and Plant Protection equipments etc. (@50% subsidy limited to one set per beneficiary).
No. 0.350 0.175 110 19.25 16.36 2.89
(b) Power Machines (up to 20 HP) & with rotavator/equipment - @50% subsidy limited to one set per beneficiary.
No. 3.000 1.500 115 172.50 146.63 25.88
(c) Power Machines (20 HP & above including accessories/equipments) - @50% subsidy limited to one set per beneficiary.
No. 3.000 1.500 100 150.00 127.50 22.50
Total - 325 341.75 290.49 51.26 10. Technology Dissemination through demonstration/Front Line Demonstration (FLD) -
i) Public Sector Ha. 25.000 25.000 1 25.00 21.25 3.75Total - 1 25.00 21.25 3.75

PROPOSED ANNUAL ACTION PLAN 2012-13
(`. in lakhs)
Sl. No
Programme UnitScale Per
Unit (lakh)
Subsidy (Proposed Assistance)
Phy. Target
Fin. Target
GoI Share (85%)
State Share (15%)
Remark
A. Plantation Infrastructure & Development - 10. Human Resource Development (HRD) -
(b) HRD for Gardeners. No. 15.000 15.000 1 15.00 12.75 2.25 (c) Training of Farmers -i) Within the district (`.400.00/ day per farmer excluding transport, 2 days training is proposed.
No. 0.008 0.008 4000 32.00 27.20 4.80
i) Within the State (`.750.00/ day per farmer excluding transport, 6 days training is proposed.
No. 0.045 0.045 2800 126.00 107.10 18.90
iii) Outside the State (`.1000.00 /day per farmer excluding transport, 7 days training is proposed.)
No. 0.070 0.070 1500 105.00 89.25 15.75
Sub total - 8300 263 223.55 39.45

PROPOSED ANNUAL ACTION PLAN 2012-13
(`. in lakhs)
Sl. No
Programme UnitScale Per
Unit (lakh)
Subsidy (Proposed Assistance)
Phy. Target
Fin. Target
GoI Share (85%)
State Share (15%)
Remark
A. Plantation Infrastructure & Development - 10. Human Resource Development (HRD) -
(e) Exposure visit of farmers -i) Within the district (`.250.00 / day per farmer excluding transport, 1 day visit is proposed.
No. 0.0025 0.0025 3700 9.25 7.86 1.39
ii) Within the state (`.300.00 / day per farmer excluding transport, 6 day visit is proposed.
No. 0.0030 0.0030 2650 7.95 6.76 1.19
iii) Outside the State (`.600.00 /day per farmer excluding transport, 7 days visit is proposed.
No. 0.042 0.042 1525 64.05 54.44 9.61
iv) Outside of India (`.3.00 lakh per participant) No. 3.000 3.000 15 45.00 38.25 6.75
Carry forward
incomplete activities of
AAP 2011-12
Sub total - 7890 126.25 107.31 18.94

PROPOSED ANNUAL ACTION PLAN 2012-13
(`. in lakhs)
Sl. No
Programme UnitScale Per
Unit (lakh)
Subsidy (Proposed Assistance)
Phy. Target
Fin. Target
GoI Share (85%)
State Share (15%)
Remark
A. Plantation Infrastructure & Development - 10. Human Resource Development (HRD) -
(f) Training/Study Tour of Technical Staff/Field Functionaries -ii) Within the state (`. 200.00 day per participants @ `.650.00/day per participant plus TA/DA, as admissible, 7 days tour is proposed).
No. 0.046 0.046 80 3.64 3.09 0.55
ii) Study tour to progressive Sates/Units (group of minimum 5 participants @ `.650.00/day per participant plus TA/DA, as admissible, 7 days tour is proposed).
No. 0.046 0.046 35 1.59 1.35 0.24
iii) Outside of India (`.5.00 lakh per participant) No. 5.000 5.000 9 45.00 38.25 6.75
Carry forward
incomplete activities of
AAP 2011-12
Sub total - 124 50.23 42.70 7.53 Total - 16315 454.48 386.31 68.17

PROPOSED ANNUAL ACTION PLAN 2012-13
(`. in lakhs)
Sl. No
Programme UnitScale Per
Unit (lakh)
Subsidy (Proposed Assistance)
Phy. Target
Fin. Target
GoI Share (85%)
State Share (15%)
Remark
C. Integrated Post Harvest Management -i) Pack house/On farm collection & storage unit (`.3.00 lakh/per unit with size of 9m x 6m - @50% subsidy).
No. 3.000 1.500 300 450.00 382.50 67.50
ii) Pre-cooling unit -(a) Credit linked back-ended subsidy @40% of the cost of project in General areas for 6MT capacity.
No. 15.000 6.000 5 30.00 25.50 4.50
iii) Cold storage units (Construction/Expansion/Modernization) -(a) `.6000.00/MT credit linked back-ended subsidy @40% of the capita cost of project in General areas for 5000 MT capacity.
No. 300.000 120.000 7 840.00 714.00 126.00

PROPOSED ANNUAL ACTION PLAN 2012-13
(`. in lakhs)
Sl. No
Programme UnitScale Per
Unit (lakh)
Subsidy (Proposed Assistance)
Phy. Target
Fin. Target
GoI Share (85%)
State Share (15%)
Remark
C. Integrated Post Harvest Management -iii) Cold storage units (Construction/Expansion/Modernization) -
(b) `.6000.00/MT credit linked back-ended subsidy @55% of the capita cost of project in Hilly & Scheduled areas for 5000 MT capacity.
No. 300.000 165.000 4 660.00 561.00 99.00
Sub total - 11 1500.00 1275.00 225.00 iv) Processing units -(a) Cashew nut processing unit credit linked back-ended subsidy @40%.
No. 15.000 6.000 1 6.00 5.10 0.90
(b) Tomato processing unit credit linked back-ended subsidy @40%.
No. 20.000 8.000 2 16.00 13.60 2.40
Sub total - 3 22.00 18.70 3.30

PROPOSED ANNUAL ACTION PLAN 2012-13
(`. in lakhs)
Sl. No
Programme UnitScale Per
Unit (lakh)
Subsidy (Proposed Assistance)
Phy. Target
Fin. Target
GoI Share (85%)
State Share (15%)
Remark
C. Integrated Post Harvest Management -v) Refer vans/Containers -
(a) `.24.00 lakh/unit credit linked back-ended subsidy @40% of the capita cost of project in General areas for 6 MT capacity.
No. 24.000 9.600 1 9.60 8.16 1.44
vi) Primary / Mobile / Minimal processing unit -(a) `.6000.00/MT credit linked back-ended subsidy @40% of the capita cost of project in General areas for 5000 MT capacity.
No. 300.00 120.00 1 120.00 102.00 18.00
vii) Ripening chamber -(a) `.6000.00/MT credit linked back-ended subsidy @40% of the capita cost of project in General areas for 5000 MT capacity.
No. 300.000 120.000 2 240.00 204.00 36.00

PROPOSED ANNUAL ACTION PLAN 2012-13
(`. in lakhs)
Sl. No
Programme UnitScale Per
Unit (lakh)
Subsidy (Proposed Assistance)
Phy. Target
Fin. Target
GoI Share (85%)
State Share (15%)
Remark
C. Integrated Post Harvest Management -vii) Ripening chamber -(b) `.6000.00/MT credit linked back-ended subsidy @55% of the capita cost of project in Hilly & Scheduled areas for 5000 MT capacity.
No. 300.000 165.000 1 165.00 140.25 24.75
Sub total - 3 405.00 344.25 60.75 viii) Evaporative / low energy cool chamber (8 MT) - @50% subsidy.
No. 4.000 2.000 305 610.00 518.50 91.50
ix) Preservation unit (low cost) - `. 2.00 lakh/ unit for new unit @50% subsidy.
No. 2.000 1.000 100 100.00 85.00 15.00
x) Low cost onion storage structure (25 MT) - @50% subsidy.
No. 1.000 0.500 297 148.50 126.23 22.28
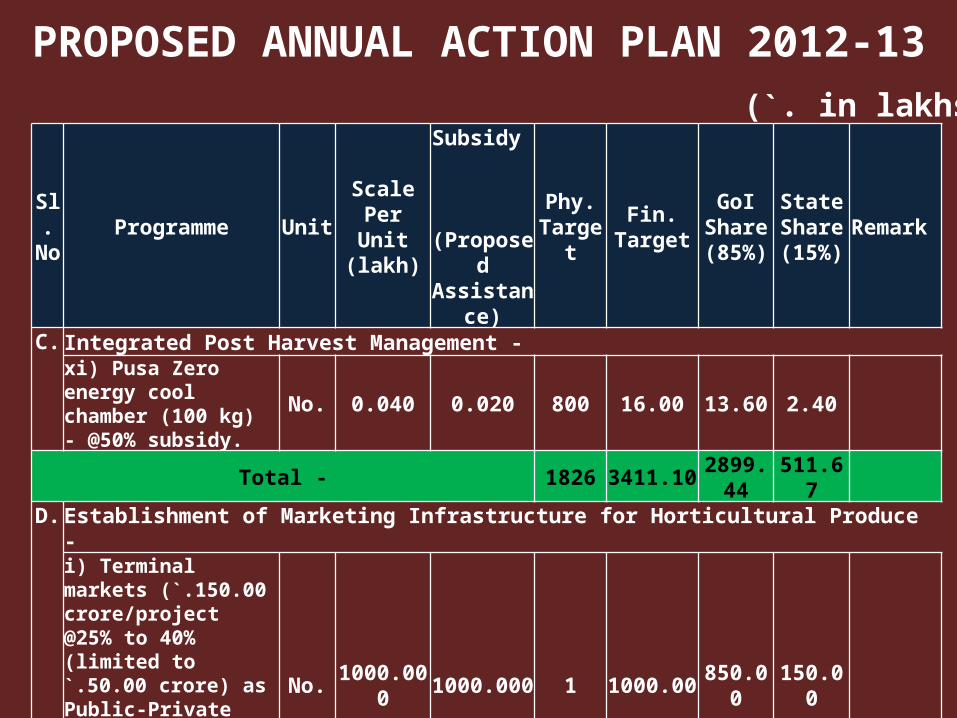
PROPOSED ANNUAL ACTION PLAN 2012-13
(`. in lakhs)
Sl. No
Programme UnitScale Per
Unit (lakh)
Subsidy (Proposed Assistance)
Phy. Target
Fin. Target
GoI Share (85%)
State Share (15%)
Remark
C. Integrated Post Harvest Management -xi) Pusa Zero energy cool chamber (100 kg) - @50% subsidy.
No. 0.040 0.020 800 16.00 13.60 2.40
Total - 1826 3411.10 2899.44 511.67 D. Establishment of Marketing Infrastructure for Horticultural Produce -
i) Terminal markets (`.150.00 crore/project @25% to 40% (limited to `.50.00 crore) as Public-Private Partnership mode through competitive bidding.
No. 1000.000 1000.000 1 1000.00 850.00 150.00
ii) Rural Markets / Apni Mandies / Direct Markets -(a) Credit linked back-ended subsidy @40% of the capital cost of project in General areas.
Unit 20.000 8.000 27 216.00 183.60 32.40

PROPOSED ANNUAL ACTION PLAN 2012-13(`. in lakhs)
Sl. No
Programme UnitScale Per
Unit (lakh)
Subsidy (Proposed Assistance)
Phy. Target
Fin. Target
GoI Share (85%)
State Share (15%)
Remark
D. Establishment of Marketing Infrastructure for Horticultural Produce -iii) Retail Markets / Outlets (environmentally controlled) -Credit linked back-ended subsidy @55% in case of Hilly & Scheduled areas for individual entrepreneurs.
Unit 10.000 5.500 29 159.50 135.58 23.93
iv) Market extension, quality awareness & market led extension activities for fresh products (100% assistance to State Govt. / SHM / Public Sector Agencies).
No. 3.000 3.000 2 6.00 5.10 0.90
v) Static/Mobile Vending Cart/ Platform with cool chamber (@50% subsidy).
Unit 0.300 0.150 40 6.00 5.10 0.90
Total - --- 1387.50 1179.38 208.13 Total Project Cost - 10717.51 9088.63 1603.88

PROPOSED ANNUAL ACTION PLAN 2012-13
(`. in lakhs)
Sl. No
Programme UnitScale Per
Unit (lakh)
Subsidy (Proposed Assistance)
Phy. Target
Fin. Target
GoI Share (85%)
State Share (15%)
Remark
F. Mission Management -I. State Level -
(a) State & Districts Mission Offices and implementing agencies for administrative expenses, project, preparation, computerization, contingency etc.
L.S. 535.87 455.49 80.38
(c) Seminars, conferences, workshops, exhibitions, Kisan Mela, horticulture shows, honey festivals etc. -
ii) State level (`.2.00 lakh per event of two days).
No. 3.000 3.000 1 3.00 2.55 0.45
ii) District level (`.2.00 lakh per event of two days).
No. 2.000 2.000 8 16.00 13.60 2.40
Total - --- 554.87 471.64 83.23
Grand Total - 11272.39 9581.53 1690.86


SWOT AnalysisStrength –
• Climatic condition favors growing frost resistant crops that are supplied as off-season crops to other states.
• Traditionally farmers, especially tribals, are vegetable grower and collector of wild fruits that helps in easy transfer of technology and availability of skilled labours.
• Good network of road and rail. • Demand-driven market at local as-well-as in other
states due to increase purchasing power of people and rapid industrialization/urbanization in the state.
• Existing network of departmental nurseries.• Convergence of MNREGS in the state for effective
implementation of NHM.

Weakness –• Low and declining productivity.• Poor exposure of farmers and staff to modern
practices.• Open grazing practices for 8 months in the year
causing damage to crops.• Net irrigated area is lower.• Lack of well trained extension person in the
remote blocks.• Lack of infrastructure for processing, value
addition and post harvest management.• Lack of organized market/Mandis at block level.• Lack of appropriate transport facilities.

• Presence of culturable fallow land 5.13 lakh ha.
• Scope for crop diversification from traditional paddy/coarse grain farming to horticulture.
• Huge demand and increase in production of off-season crops.
• Presence of technical institutions like IGKVV, 18 - KVK, 17 - Horticulture Colleges may help in tapping modern knowledge in the field.
• Processing of surplus produces for value addition.
• Establishing network for organized agri-business through PPP.
Opportunities –

• Excessive expansion of area without PHM may create de-motivation among farmers.
• Absence of weather and disease forecasting mechanism will adversely effect crop protection.
• Excessive withdrawal of ground water will lead to ecological imbalance.
• Excessive use of chemical fertilizers and pesticide will cause ecological imbalance and decrease in productivity.
• Lengthy procedure to access credit facilities from banks de-motivate the farmers.
Threat –
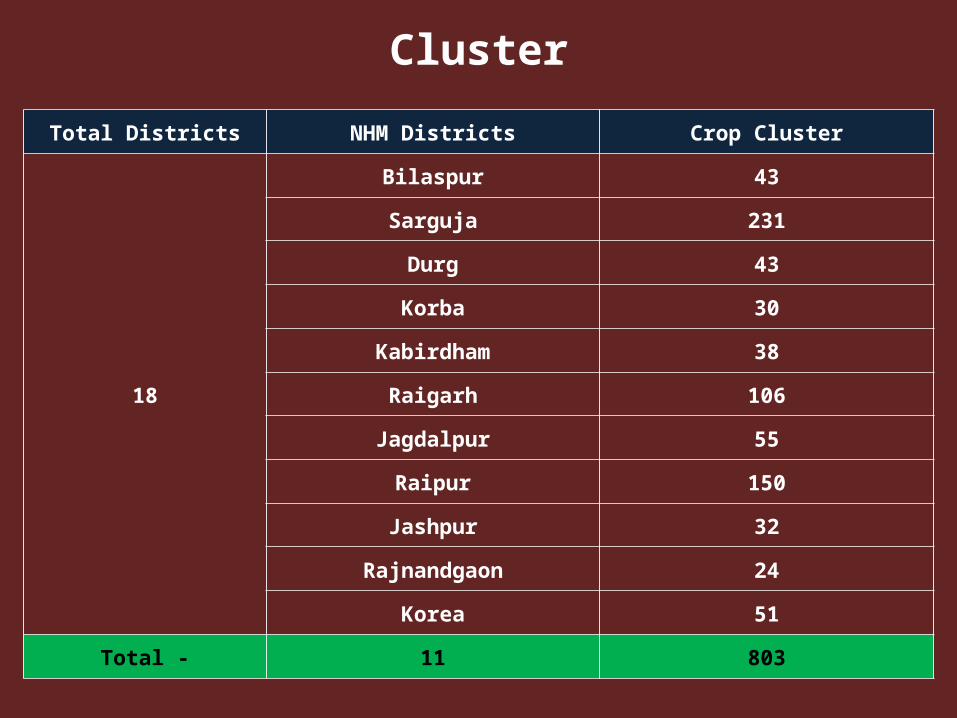
Total Districts NHM Districts Crop Cluster
18
Bilaspur 43
Sarguja 231
Durg 43
Korba 30
Kabirdham 38
Raigarh 106
Jagdalpur 55
Raipur 150
Jashpur 32
Rajnandgaon 24
Korea 51
Total - 11 803
Cluster
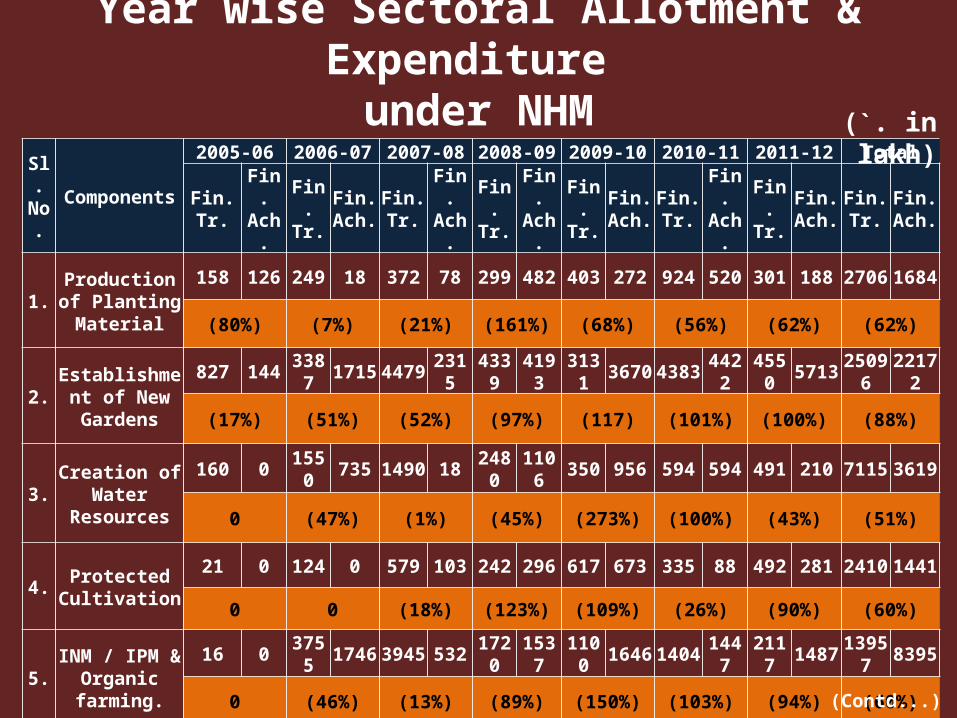
Year wise Sectoral Allotment & Expenditure under NHM
Sl. No.
Components2005-06 2006-07 2007-08 2008-09 2009-10 2010-11 2011-12 Total
Fin. Tr.
Fin. Ach.
Fin. Tr.
Fin. Ach.
Fin. Tr.
Fin. Ach.
Fin. Tr.
Fin. Ach.
Fin. Tr.
Fin. Ach.
Fin. Tr.
Fin. Ach.
Fin. Tr.
Fin. Ach.
Fin. Tr.
Fin. Ach.
1.Production of
Planting Material
158 126 249 18 372 78 299 482 403 272 924 520 301 188 2706 1684
(80%) (7%) (21%) (161%) (68%) (56%) (62%) (62%)
2.Establishment
of New Gardens
827 144 3387 1715 4479 2315 4339 4193 3131 3670 4383 4422 4550 5713 25096 22172
(17%) (51%) (52%) (97%) (117) (101%) (100%) (88%)
3.Creation of
Water Resources
160 0 1550 735 1490 18 2480 1106 350 956 594 594 491 210 7115 3619
0 (47%) (1%) (45%) (273%) (100%) (43%) (51%)
4.Protected
Cultivation
21 0 124 0 579 103 242 296 617 673 335 88 492 281 2410 1441
0 0 (18%) (123%) (109%) (26%) (90%) (60%)
5.INM / IPM &
Organic farming.
16 0 3755 1746 3945 532 1720 1537 1100 1646 1404 1447 2117 1487 13957 8395
0 (46%) (13%) (89%) (150%) (103%) (94%) (60%)
(`. in lakh)
(Contd...)

Year wise Sectoral Allotment & Expenditure under NHM
Sl. No.
Components
2005-06 2006-07 2007-08 2008-09 2009-10 2010-11 2011-12 Total
Fin. Tr.Fin. Ach.
Fin. Tr.
Fin. Ach.
Fin. Tr.
Fin. Ach.
Fin. Tr.
Fin. Ach.
Fin. Tr.
Fin. Ach.
Fin. Tr.
Fin. Ach.
Fin. Tr.
Fin. Ach.
Fin. Tr.
Fin. Ach.
6. HRD
489 30 725 231 725 178 213 415 345 77 273 238 135 29 2905 1198
(6%) (32%) (25%) (195%) (22%) (87%) (21%) (41%)
7.Post Harvest Management
4 0 92 0 0 0 0 0 738 38 1054 642 1808 527 3696 1207
0 0 0 0 (5%) (61%) (31%) (33%)
8.Marketing
Infrastructure 192 0 0 0 0 0 0 0 864 0 1252 1246 1111 0 3419 1246
0 0 0 0 0 (100%) 0 (36%)
Total -
1867 301 9881 4444 11589 3223 9292 8030 7546 7331 10218 9197 11005 8435 61304 40962
(16%) (45%) (28%) (86%) (97%) (90%) (71%) (67%)
(`. in lakh)

Year wise Requirement, Availability from Departmental Nurseries & Out Sourcing of Planting
Material
Sl. No.
Name of Crop
Year SchemeTarget (in
Ha.)
Required No. of Plants
Plants available
from depart-mental
nurseries
%age availability
from depart-mental
nurseries
Plants purchased from out sourcing agencies
%age availability
from out sourcing
1.Mango
2005-06
State Sector 1801 180100 180100 0
2.
National Horticulture Mission
2696 269600 58780 210820
3. Cashewnut 1500 150000 0 150000
4. Litchi 500 75000 25000 50000
5. Lemon 380 105260 105260 0
Sub Total - 6877 779960 369140 47 410820 53
1. Mango2006-
07
State Sector 12654 126540 126540 0
2.Cashew
nutNational
Horticulture Mission1500 150000 0 150000
Sub Total - 14154 276540 126540 46 150000 54
(Contd...)

Year wise Requirement, Availability from Departmental Nurseries & Out Sourcing of Planting
Material
Sl. No.
Name of Crop
Year SchemeTarget
(in Ha.)
Required No. of Plants
Plants available
from depart-mental
nurseries
%age availability
from depart-mental
nurseries
Plants purchased from out sourcing agencies
%age availability
from out sourcing
1.
Mango
2007-08
State Sector 1377 137700 137700 0
2.Rashtriya Krishi
Vikas Yojna1057 105700 0 105700
3.
National Horticulture Mission
5888 588670 0 588670
4. Cashewnut 1800 180000 0 180000
5. Sitaphal 988 160750 0 160750
6. Litchi 700 105000 0 105000
7. Lemon 1150 318550 318550 0
8. Aonla 800 80000 0 80000
9. Jamun 100 10000 10000 0
10. Bel 100 10000 0 10000
11. Ber 300 83100 83100 0
Sub Total - 14260 1779470 549350 31 1230120 69
(Contd...)

Year wise Requirement, Availability from Departmental Nurseries & Out Sourcing of Planting Material
Sl. No.
Name of Crop
Year SchemeTarget
(in Ha.)
Required No. of Plants
Plants available
from depart-mental
nurseries
%age availability
from depart-mental
nurseries
Plants purchased from out sourcing agencies
%age availability
from out sourcing
1.Mango
2008-09
State Sector 1941 194100 194100 0
2.National
Horticulture Mission5550 555000 60000 495000
3. Litchi
National Horticulture Mission
1080 162000 100000 62000 4. Lemon 1250 346250 346250 0 5. Aonla 500 50000 0 50000 6. Sitaphal 550 55000 0 55000 7. Cashewnut 2000 200000 0 200000
Sub Total - 12871 1562350 700350 45 862000 551.
Mango
2009-10
State Sector 1941 194100 194100 0 2.
National Horticulture Mission
1900 190000 70000 120000 3. Litchi 980 147000 147000 0 4. Lemon 900 249300 249300 0 5. Aonla 400 40000 0 40000 6. Sitaphal 800 221600 0 221600 7. Cashewnut 1000 100000 0 100000
Sub Total - 7921 1142000 660400 58 481600 42
(Contd...)
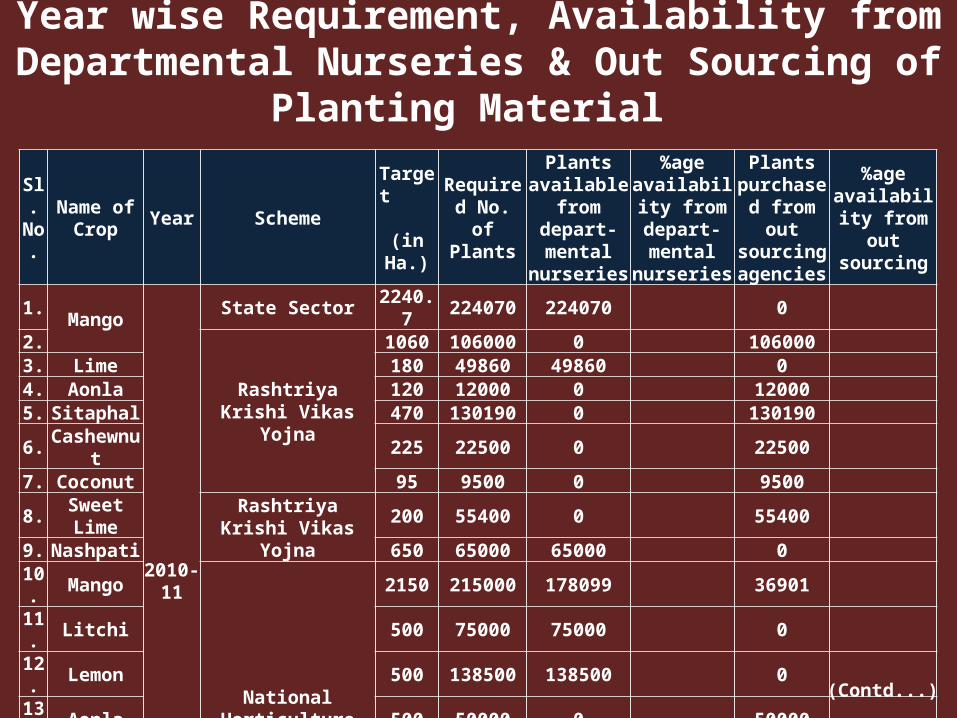
Year wise Requirement, Availability from Departmental Nurseries & Out Sourcing of Planting Material
Sl. No.
Name of Crop
Year SchemeTarget
(in Ha.)
Required No. of Plants
Plants available
from depart-mental
nurseries
%age availability
from depart-mental
nurseries
Plants purchased from out sourcing agencies
%age availability
from out sourcing
1.Mango
2010-11
State Sector 2240.7 224070 224070 0 2.
Rashtriya Krishi Vikas Yojna
1060 106000 0 106000 3. Lime 180 49860 49860 0 4. Aonla 120 12000 0 12000 5. Sitaphal 470 130190 0 130190 6. Cashewnut 225 22500 0 22500 7. Coconut 95 9500 0 9500 8. Sweet Lime Rashtriya Krishi
Vikas Yojna200 55400 0 55400
9. Nashpati 650 65000 65000 0 10. Mango
National Horticulture Mission
2150 215000 178099 36901 11. Litchi 500 75000 75000 0 12. Lemon 500 138500 138500 0 13. Aonla 500 50000 0 50000 14. Guava 650 180050 180050 0 15. Sitaphal 250 69250 0 69250 16. Cashewnut 1000 200000 0 200000
Sub Total - 10790.7 1602320 910579 57 691741 43
(Contd...)

Year wise Requirement, Availability from Departmental Nurseries & Out Sourcing of Planting
Material
Sl. No.
Name of Crop
Year SchemeTarget (in
Ha.)
Required No. of Plants
Plants available
from depart-mental
nurseries
%age availability
from depart-mental
nurseries
Plants purchased from out sourcing agencies
%age availability
from out sourcing
1. Mango
2011-12
National Horticulture Mission
900 90000 90000 0
2. Litchi 400 60000 60000 0
3. Lemon 250 69250 69250 0
4. Guava 650 180050 180050 0
5. Sitaphal 200 55400 0 55400
6. Cashewnut 150 30000 0 30000
Sub Total - 2550 484700 399300 82 85400 18
Grand Total - 69423.7 7627340 3715659 49 3911681 51

Information about Clusters Formed under NHMSl. No.
Year Name of Districts
No. of clusters
No. of villages in the cluster
Area (Ha.)
No. of beneficiaries
Main Crops Remark
1
2005-06
Bilaspur 5 54 580 1219 Litchi, Mango, Lime, Cashew, Ginger, Chili,
Garlic, Patchouli, Jamarosa, Pamarosa,
E.citridora, Khus, Lemon grass,
No. of distircts
selected - 06
2 Sarguja 15 87 2361 32833 Durg 4 78 1190 12144 Korba 5 50 1940 34215 Kabridham 3 52 1720 30336 Raigarh 4 61 1619 1710
Total - 36 382 9410 13880 --- ---1
2006-07
Bilaspur 5 34 450 745 Litchi, Mango, Lime, Cashew, Ginger, Chili,
Garlic, Patchouli, Jamarosa, Pamarosa, Aloevera, E.citridora,
Khus, Lemon grass
No. of distircts
selected - 06
2 Durg 4 78 1190 12413 Jagdalpur 6 113 2050 27014 Sarguja 6 37 700 13925 Kabridham 8 74 950 15466 Korba 5 50 1940 3421
Total - 34 386 7280 11046 --- ---1
2007-08
Raipur 15 152 3216 3084Litchi, Mango, Lime,
Sitaphal, Aonla, Cashew, Jamun, Bel, Ginger, Chili, Garlic, Coriander, Marigold,
Rose, Tuberose, Patchouli, Pamarosa, Aloevera, E.citridora, Khus, Lemon grass,
No. of districts
selected - 11
2 Bilaspur 10 89 1140 25173 Durg 9 101 1475 22294 Jagdalpur 13 173 4923.4 52215 Sarguja 15 51 2040 33646 Kabridham 11 104 2165 32037 Jashpur 5 28 800 22238 Raigarh 11 103 1827 39169 Korba 5 37 3300 5236
10 Rajnandgaon 10 101 2000 209611 Korea 9 49 1950 1646
Total - 113 988 24836.4 34735 --- ---

Information about Clusters Formed under NHMSl. No.
Year Name of Districts
No. of clusters
No. of villages in the cluster
Area (Ha.)
No. of beneficiaries
Main Crops Remark
1
2008-09
Raipur 10 102 2140 2044Litchi, Mango, Lime,
Sitaphal, Aonla, Cashew, Banana,
Ginger, Chili, Turmeric, Coriander,
Garlic, Marigold, Rose, Tuberose, Gailardia, Pamarosa, Aloevera,
E.citridora, Khus, Lemon grass
No. of districts
selected - 11
2 Bilaspur 8 47 900 15683 Durg 7 13 3151 16304 Jagdalpur 11 132 3169 41225 Sarguja 21 65 3000 35186 Kabridham 4 99 1967 13927 Jashpur 6 24 1250 15268 Raigarh 12 133 2569 38849 Korba 3 24 2350 2237
10 Rajnandgaon 5 63 1592 218911 Korea 8 44 1700 1509
Total - 95 746 23788 25619 --- ---1
2009-10
Raipur 14 71 1100 1667
Litchi, Mango, Lime, Sitaphal, Aonla,
Cashew, Banana, Chili, Turmeric, Coriander,
Marigold, Rose, Tuberose, Gailardia, Gladiolus, Aloevera, E.citridora, Khus,
Lemon grass
No. of districts
selected - 11
2 Bilaspur 5 48 400 11453 Durg 3 12 260 3134 Jagdalpur 10 64 1161 14585 Sarguja 45 163 4646.22 63946 Kabridham 4 42 925 3967 Jashpur 5 18 381 2968 Raigarh 16 23 1460 6359 Korba 5 31 2400 3185
10 Rajnandgaon 3 13 400 48211 Korea 12 68 1750 2593
Total - 122 553 14883.22 18564 --- ---

Information about Clusters Formed under NHMSl. No.
Year Name of Districts
No. of clusters
No. of villages in the cluster
Area (Ha.)
No. of beneficiaries
Main Crops Remark
1
2010-11
Raipur 36 542 2370 3513 Litchi, Mango, Lime, Sitaphal, Aonla, Cashew, Banana,
Ginger, Chili, Turmeric, Coriander,
Garlic, Methi, Marigold,
No. of districts
selected - 11
2 Bilaspur 7 43 600 16033 Durg 10 62 410 4164 Jagdalpur 6 25 416 3345 Sarguja 49 188 2646.4 6657
6 Kabridham 4 135 1490 834
7 Jashpur 8 30 500 487 Rose, Tuberose, Gerbera, Gailardia, Gladiolus, Aloevera, E.citridora, Khus,
Lemon grass
No. of districts
selected - 11
8 Raigarh 34 113 880 9099 Korba 2 9 620 4046
10 Rajnandgaon 4 23 700 165811 Korea 13 59 1250 2244
Total - 173 1229 11882.4 22701 --- ---1
2011-12
Raipur 75 1275 2995 6157
Litchi, Mango, Lime, Guava, Aonla, Cashew, Banana, Ginger, Chili, Turmeric, Coriander,
Methi, Marigold, Rose, Tuberose, Gladiolus, Aloevera, E.citridora
No. of districts
selected - 11
2 Bilaspur 3 17 200 5003 Durg 6 19 225 1694 Jagdalpur 9 16 50 775 Sarguja 80 262 4280 96526 Kabridham 4 162 1460 24257 Jashpur 8 77 400 5988 Raigarh 29 85 990 12189 Korba 5 30 350 2000
10 Rajnandgaon 2 18 500 23011 Korea 9 39 450 1105
Total - 230 2000 11900 24131 --- ---
Grand Total - 803 6284103980.0
2150676 --- ---

Status of Electrical Tariff Applicable for Primary Processing, Cold Storage, CA / MA Storage &
Food Ripening Units
• At present Chhattisgarh State Electricity Regulatory Commission has kept the primary processing units, cold storages, CA/MA storages and food ripening units etc., under tariff LV-5, LT industry (applicable to light and fan and power for industries) and the energy charges are `.3.00 per unit.
• SHM Chhattisgarh has written a letter to Ministry of Agriculture, Government of Chhattisgarh regarding fixing of tariff for these industries under tariff order of LV-4, LT Agriculture allied activities where the energy charges are of `.2.40 per unit (letter no.1356 dated 31.03.2010).
• The matter is under consideration.

Information about Technical Staff Position of Chhattisgarh State
Sl. No.
Name of Post Sanctioned postNo. of post
filledVacant post
1. Director Horticulture 1 1 02. Joint Director Horticulture 3 3 03. Deputy Director Horticulture 7 7 04. Assistant Director Horticulture 19 8 11
5.Senior Horticulture Development Officer
73 42 31
6.Horticulture Development Officer
92 70 22
7.Rural Horticulture Development Officer
427 195 232
8. Gardner (4th class) 404 390 14Total - 1026 716 310
Sanctioned Positioned Required
Staff strength sanctioned in State 1026 716 --
Contractual employees 136 108 --

Literature Published• Success story of Horticulture in Chhattisgarh – I
(under NHM).• Success story of Horticulture in Chhattisgarh – II
(under NHM).• Success story of Horticulture in Chhattisgarh – III
(under NHM).• Vermi compost – Assistance provided to villagers from
National Horticulture Mission & Chhattisgarh Government. • Technical document on – Banana Processing & Value
Addition “End to End Approach”.• Technical document on – Aloevera Processing & Value
Addition “End to End Approach”.• Field Training Manual of Horticulture Survey.• Technical document on – Cashew Nut “End to End
Approach”.• Technical document on – “Safal Bagwani Ke Upaye”.
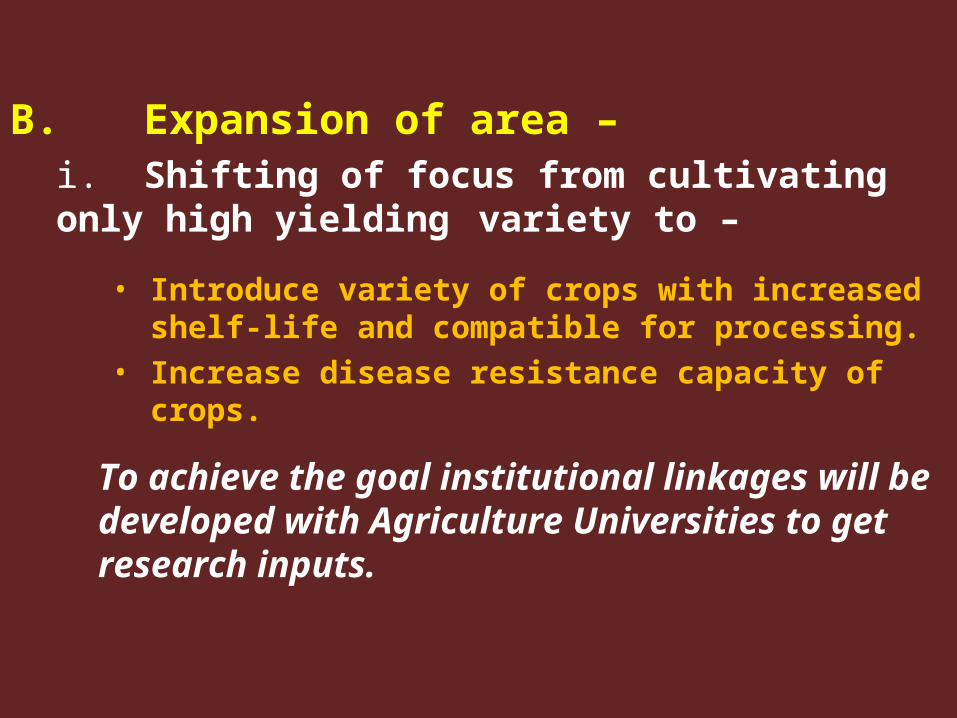
B. Expansion of area –i. Shifting of focus from cultivating only high yielding variety to –
• Introduce variety of crops with increased shelf-life and compatible for processing.
• Increase disease resistance capacity of crops.
To achieve the goal institutional linkages will be developed with Agriculture Universities to get research inputs.

ii. Crop diversification by shifting from coarse grain and paddy production to horticulture crops through -
• Crop planning.• Re-allocation of culturable fellow land (5.13 lakh
ha.) and up-land under cereals (71,500 ha.).• Lowering of establishment (due to high labour
input) and maintenance cost (especially due to open grazing system) of horticulture crop.
To achieve the goal proper crop planning and appropriate subsidy for area expansion will be given from NHM. Institutional linkages will be developed with KVK for motivation of farmers.

iii. Preparation of Comprehensive Land Use Plan to introduce horticulture cultivation in -
• Culturable fallow land (5,13,000 ha.).• Marginal land & Common land (3,44,000 ha.).• Land under miscellaneous tree crops (1000 ha.)
and old orchards on common land (3000 ha.).
To achieve the goal area identified for horticulture development shall be put before land use board and a comprehensive plan shall be made. Land identified for the horticulture shall not be diversified for the other purpose.

C. Organic Farming and Organic Certification – Chattisgarh is by-default practicing organic cultivation
especially in the tribal belt, mainly due to the low paying capacity for modern agri-inputs of the farmers. Thus the state does not need to invest much for promotion of organic farming systems rather the need is –
• To identify and develop a network of resource persons to integrate the modern technical knowledge of vermi-composting and Integrated Pest Management with the traditional knowledge base.
• For promotion of organic cultivation in the state, it neither requires high capital inputs nor a paradigm shift from inorganic to organic practices but an intensive awareness and sensitization campaign through demonstration is needed.

Already existing organic practices in the state create a conducive environment to go for organic certification of products. Therefore –
• The state has already identified target species like Mango, Cashew nut, Lime, Banana, Papaya and Aloevera for organic certification (11,000 ha.).
• The emphasis of the state will be on persuing different stages for certification through promotion of Good Agriculture Practices (GAP).
To achieve the goal, along with inputs from NHM, institutional linkages will be developed with KVKs, NGOs and Training Organizations for capacity building and skill up-gradation and certification bodies like CGCERT. To institutilize organic certification system and setting-up of ICS help of NERAMC will be taken up.

E. Production of planting material for assured supply of quality planting material through -
• Strengthening the existing nurseries, developing model nurseries (114), small nurseries (133 in private sector), setting up new Tissue Culture units (9) and Rehabilitation of existing TC (4).
To achieve this goal financial assistance from NHM & RKVY and technical assistance from training institutions (for gardeners) and NERAMC will be taken.

F. Promotion of Horticulture Mechanization –
To increase the efficiency and increase in productivity promotion of horticulture mechanization will taken up in a big way through –
• Introduction of small tractors (1645), rotavators (2200), levelers, power tillers, earth augers, seed drillers, ridge and furrow makers, reapers, power sprayers, tractor mount sprayers, power operated pruning saw/chain saw, weed/bush cutters (1760) and plastic crates, to help in increasing productivity.
To achieve this goal financial assistance from NHM & RKVY and technical assistance from CG Seed Corporation Limited will be taken.

H. Human Resource Development – It is very important to build the capacity of both the farmers and the
staff on issues related to production, harvesting, post harvest management of products on the one hand and soft skills and managerial skills like inter-personal communication, leadership, institution building, group management and financial management on the other. It is extremely important to build efficient resource persons from within the department and also from among the farmers who can act as peer educators and change agents to implement the program especially adoption of new practices / technology.
Capacity building programs are designed in the following model –
• Training Need Assessment (TNA) – Training will not be uniform in nature rather modules will be developed
based on training need assessment of the stakeholders keeping in mind the project objectives, project deliverables and existing gaps in performance.
i. For the farmers – Issue based in situ training within the district for a batch of 50 farmers
per training. Exposure visits/study tours within the district, within the state, outside
the state

ii. For the Technical Staff / Field Functionaries• Refreshers course at the district level• Training of Trainers for selected officials at the state level• Resource Person Development program with study tour outside the
state.
iii. For the Supervisors and Entrepreneurs• Training of supervisors on project management and project
monitoring.• Training of Entrepreneurs from among the progressive farmers on
entrepreneurship development, modern techniques of agri-business.
iv. For the Gardeners• Training on garden management and rejuvenation of senile orchards.
To achieve this goal help of the prestigious training institutes will be taken. Such type of Capacity Building Interventions in the form of training is already going on in the state.

Schedule of training activities - Pert

Schedule of training activities - Pert

Schedule of training activities - Pert
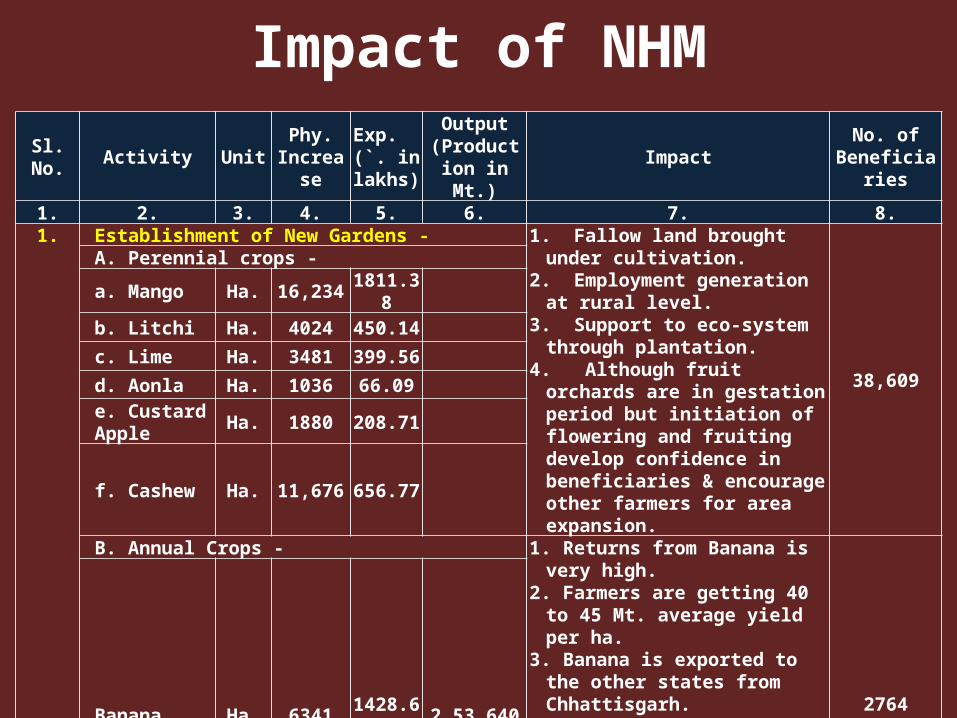
Impact of NHM
Sl. No. Activity UnitPhy.
Increase
Exp. (`. in lakhs)
Output (Production
in Mt.)Impact
No. of Beneficiaries
1. 2. 3. 4. 5. 6. 7. 8.1. Establishment of New Gardens - 1. Fallow land brought under
cultivation.2. Employment generation at rural
level.3. Support to eco-system through
plantation.4. Although fruit orchards are in
gestation period but initiation of flowering and fruiting develop confidence in beneficiaries & encourage other farmers for area expansion.
38,609
A. Perennial crops - a. Mango Ha. 16,234 1811.38
b. Litchi Ha. 4024 450.14
c. Lime Ha. 3481 399.56
d. Aonla Ha. 1036 66.09e. Custard Apple
Ha. 1880 208.71
f. Cashew Ha. 11,676 656.77
B. Annual Crops - 1. Returns from Banana is very high. 2. Farmers are getting 40 to 45 Mt.
average yield per ha. 3. Banana is exported to the other
states from Chhattisgarh.4. Whole sale traders from Delhi,
UP. are purchasing farmers produce from farm gate. Farmers need not to pay charges of harvesting, packing & transport to market.
2764Banana Ha. 6341 1428.60 2,53,640

Sl. No. Activity UnitPhy.
Increase
Exp. (`. in lakhs)
Output (Production
in Mt.)Impact
No. of Beneficiaries
1. 2. 3. 4. 5. 6. 7. 8.
2. Spices crops - 1. Under Spices Chilli has become
main crop and it occupies highest position both in area & production.
2. Due to cluster approach larger area of spices developed in a cluster which increased the bargaining power & also facilitate the farmers to send their produce to distant markets where they fetched good prices.
3. Farmers are now inclined to grow these crops in larger area at their own cost.
4. Chili is exported to the adjoining states from Chhattisgarh.
52,393
a. Chili Ha. 30,804 3546.03 1,84,824
b. Onion Ha. 500 56.25 7790
c. Coriander Ha. 2658 310.92 7442
d. Turmeric Ha. 7684 915.48 53,788
e. Ginger Ha. 7200 857.50 56,160
Impact of NHM

Sl. No.
Activity UnitPhy.
Increase
Exp. (`. in lakhs)
Output (Production in
Mt.)Impact
No. of Beneficiaries
1. 2. 3. 4. 5. 6. 7. 8.3. Floriculture crops -
1. Production of Cut flowers of Roses, Gerbera, Tuberose & Gladiolus in the field of local farmers fulfilling the local need of the state & also increased their income & open a new area of cultivation.
2. Farmers are also exporting the cut flowers to adjacent markets like Nagpur, Culcutta out of state.
9032
a. Rose Ha. 250 87.5020 to 25 lakhs
cut flower
b. Gerbera Ha. 231 80.711.22 to 1.31 lakhs cut
flower
c. Tuberose Ha. 2913 1309.50160 to 175 lakhs cut
flower initially
d. Gladiolus Ha. 2530 1147.46527 lakh sticks
approx.e. Marigold Ha. 2659 318.97 31893 approx.f. Chrysanthemum Ha. 150 18.00 450 approx.
4.Community
Bore-wellsNos. 4629 2955.15 ---
1. About 11,500 ha. area is brought under irrigation through bore-wells.
2. Productivity of crops increased due to assured irrigation.
17,316
5. Organic Farming Ha. 5790 524.99 ---
Farmers are motivated to use traditional old techniques for production of crops. Process of certification of the produce is in progress.
7179
Impact of NHM
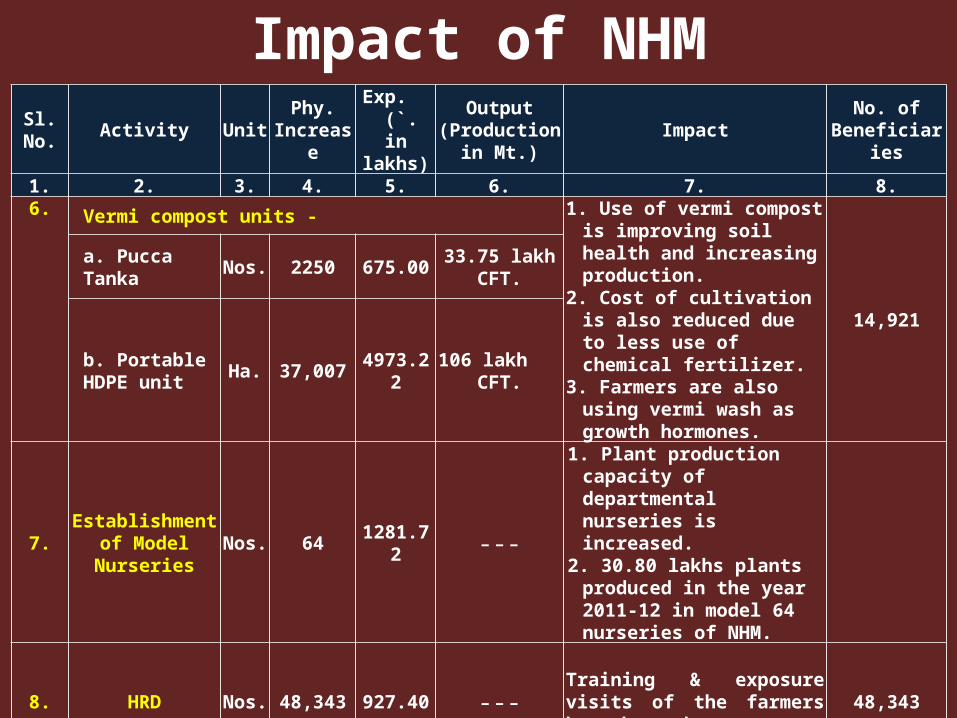
Sl. No. Activity UnitPhy.
Increase
Exp. (`. in lakhs)
Output (Production in
Mt.)Impact
No. of Beneficiaries
1. 2. 3. 4. 5. 6. 7. 8.6. Vermi compost units -
1. Use of vermi compost is improving soil health and increasing production.
2. Cost of cultivation is also reduced due to less use of chemical fertilizer.
3. Farmers are also using vermi wash as growth hormones.
14,921
a. Pucca Tanka Nos. 2250 675.0033.75 lakh
CFT.
b. Portable HDPE unit
Ha. 37,007 4973.22106 lakh
CFT.
7.Establishment of Model Nurseries
Nos. 64 1281.72 ---
1. Plant production capacity of departmental nurseries is increased.
2. 30.80 lakhs plants produced in the year 2011-12 in model 64 nurseries of NHM.
8. HRD Nos. 48,343 927.40 --- Training & exposure visits of the farmers have been done.
48,343
Impact of NHM

Plant Production
Sl. No. Year No. of Plants
1. 2005-06 69,97,854
2. 2006-07 68,85,187
3. 2007-08 51,35,680
4. 2008-09 58,97,597
5. 2009-10 71,15,973
6. 2010-11 73,21,693
7. 2011-12 67,27,690