property prices and bank risk taking giovanni dell’ariccia (imf and cepr) the views expressed in...
TRANSCRIPT

Property Prices and Bank Risk Taking
Giovanni Dell’Ariccia (IMF and CEPR)
The views expressed in this paper are those of the authors and do not necessarily represent those of the IMF, its Executive Board, or Management.
Norges Bank Macroprudential Regulation Workshop, Oslo, November 29-30, 2012

Monetary policy to focus on inflation and output gap
Asset prices a concern only through their impact on GDP and inflation (exceptions RBA, Riksbank, some EMs)
Benign neglect approach to boom/busts:
Bubbles difficult to identify
Costs of clean up limited and policy effective
Better clean up than prevent
Bank risk taking important, but job of regulators
Before the crisis …A policy gap

Regulatory policy focused on individual institutions
Limited attention to credit aggregates or asset price dynamics
Ill equipped to deal with booms:
Correlated risk taking
Fire sales and other externalities
Few regulators had necessary tools (exceptions: Spain/Colombia)
Before the crisis … A policy gap

Macro literature: Financial intermediation seen as macro neutral
Asset prices (including property prices) did matter. They could accentuate the cycle through financial accelerator
But macro models largely ignored their impact on bank risk taking. In equilibrium, no bank defaults
Banking literature Focused on excessive risk taking by intermediaries operating
under limited liability and asymmetric information
There are defaults/crises in equilibrium
But there is little attention to macro and monetary policy
Before the crisis … A theory gap

Before crisis … Macro looked OK
-3
-2
-1
0
1
2
2000 02 04 06 08:Q4
Output Gap2Core CPI Inflation
0.0
0.5
1.0
1.5
2.0
2.5
3.0
3.5
4.0
2000 02 04 06 08:Q4
Euro area United States Average of other economies1
1 Japan omitted.2 Estimate of output gap using rolling Hodrick-Prescott filter.

But house prices were rising rapidly
-40
-20
0
20
40
60
80
JPN
DE
U
AU
T
PR
T
CH
E
NL
D
GR
C
US
A
ITA
NO
R
FIN
AU
S
CA
N
SW
E
DE
N
GB
R
FR
A
IRL
NZ
L
ES
P
Change in real house prices (2001:Q4-2006:Q3)
Real house price falls from recent peak

Standard policies rapidly hit their limits
Limited effectiveness of less traditional policies
Large fiscal and output costs
Multiple banking crises; especially in countries with their own real estate booms
Then the crisis came …
7

House boom/busts and great recession
AUS
AUT
BGR
CAN
CHN
HRV
CYP
CZEDNK
EST
FIN
FRA
GRC
HUN
ISL
IND
IRL
ITA
KOR
LVALTU
NLD
NZL
NOR
POL
PRT
SVN
ZAFESP
SWE
CHE
UKR
GBR
USA
y = -0.0416x - 4.1152R² = 0.1496
-30
-20
-10
0
10
-20 0 20 40 60 80 100 120 140 160 180 200 220 240
Cum
ulat
ive
dec
line
in G
DP
fro
m s
tart
to e
nd o
f re
cess
ion
Change in house prices f rom 2000 to 2006
Figure 2. House Price Run-Up and Severity of Crisis
Source: Claessens et al (2010).
Bubble size shows the change in bankcredit f rom 2000 to 2006.

A closer look at real-estate booms and bank risk taking behavior Most large banking crises preceded by some form
of property price boom Scandinavia 1990s Asia 1997 Japan 1990 More recently: US, Spain, Ireland, Iceland, Latvia,…
Property cycles can have macro consequences, even without open banking crises Borrower debt overhang
But things are worse when credit booms (and lax standards) are involved

Boomfollowed by
financial crisis
followed by poor
performance
followed by financial crisis
or poor performance
followed by financial crisis
and poor performance
Number of countries
Real estate 53% 77% 87% 43% 30Credit 67% 78% 93% 52% 27
Real estate but not credit 29% 71% 71% 29% 7
Credit but not real estate 100% 75% 100% 75% 4
Both 61% 78% 91% 48% 23
Neither 27% 18% 45% 0% 11
Text Table 1. Booms, Crises, Macroeconomic Performance
Notes: The sample consists of 40 countries. The numbers, except in the last column, show the percent of the cases in which a crisis or poor macroeconomic performance happened after a boom was observed (out of the total number of cases where the boom occurred). The last column shows the number of countries in which a boom occurred. A real estate boom exists if the annual real house price appreciation rate during 2000-2006 is above the ad-hoc threshold of 1.5 percent or the annual real house price appreciation rate in the upward phase of the housing cycle prior to the crisis exceeds the country-specific historical annual appreciation rate. A credit boom exists if the growth rate of bank credit to the private sector in percent of GDP is more than the arbitrary cut-off of 20 percent or it exceeds the rate implied by a country-specific, backward-looking, cubic time trend by more than one standard deviation. A financial crisis is a systemic banking crisis as identified in Laeven and Valencia (2010). Poor performance is defined as more than 1 percentage point decline in the real GDP growth rate in 2008-09 compared to the 2003-07 average.

-30 -20 -10 0 10 20 30-50
-25
0
25
50
75
100
87.51578
84.61261
50.05025
201.0558
44.3627100000001
169.9191
30.92781
78.211990000000255.32269
90.01009
97.90594
25.949219999999951.81
98.76449
19.5002919.91
35.17473
109.2423
44.31
41.0997500000001
139.3958
60.00078
65.96198
31.07376
138.7727
59.939925.9416299999999
161.8021
38.6253500000002
166.3921
91.67
42.53386
60.15205
103.877597.8950744.48181
63.39933
157.1905
64.19488
36.152.46726
85.66792
47.11219
20.7203524.644.07178
22.5424199999999
39.48
77.78537
11.7157618.08
107.8282
38.21
25.06
35.17784
27.484937.7531
118.03
172.7685
95.59301
95.13801148.7592
27.23902
31.29615
60.6406548.32169
11.99246
25.07045
82.87102
103.8533
13.675412.56504
54.93
17.59686
31.06
14.94018
13.33
25.87158
33.2915100000001
43.34382
35.74367
49.290920000000134.4719410.46573
25.066739999999918.4
22.17047
15.80233
44.95334
47.54016
28.841529999999964.0134.5632161.0091712.66331
20.18507
85.93
25
20.55589
41.1675842.78
71.21608
12.8617.996489999999917.28
36.15777
22.73
21.9544299999999
14.2867.45574
39.51122.51
24.60602
108.7962
Credit Growth and Depth of Great Recession
Change in GDP from 2007 to 2009
Ch
an
ge
in c
red
it-to
-GD
P r
atio
fro
m 2
00
0 to
20
06
Bubble size shows the level of credit-to-GDP ratio in 2006.

Real-estate cycles and bank behavior
Credit constraints – Leverage cycles
Adverse selection and strategic interaction
Bubbles
Govt. guarantees - Risk externalities

Financial Accelerators – Leverage Cycles Collateralized credit as solution to agency problems
(Kiyotaki/Moore, 1997)
Cycle emerges: asset prices credit aggregates investment/demand asset prices
Effect magnified if logic applied to intermediaries (Kiyotaki/Gertler, 2009, Iacoviello, 2011)
Further widening if leverage is cyclical (Adrian/Shin, 2009/Geanakoplos 2010)
Regulation may also contribute (Herring/Wachter, 1999)
But most models do not deal with risk taking

Magnified macro fluctuations
0
1
2
3
4
5
6
Credit Boom House Price Boom
Recoveries withoutRecoveries withRecoveries with Strong
* *
0
1
2
3
4
5
Credit Crunch House Price Bust
Recessions withoutRecessions withRecessions with Severe
* *
Duration of recession (quarters)
Time to return to trend (quarters)
Source: Claessens/Kose/Terrones, 2008

Adverse selection and strategic effects Rising house prices reduce incentives to screen
borrowers Even bad borrowers can refinance/sell property
Winner curse reduced in good times: My competitors screen less More untested applicant borrowers Better distribution of applicants Less incentives to screen
“Conservative” lending punished Investor pressure on managers (compensation schemes) Borrowers shop for lax standards

Easy mortgages during U.S. boom
68
70
72
74
76
78
80
82
84
86
0
10
20
30
40
50
60
70
80
2001 2002 2003 2004 2005 2006 2007
Decline in Lending Standards(share of no-downpayment and limited documentation loans in
originations; combined loan-to-value in percent)No downpayment & limited documentation No downpayment Limited documentation Combined LTV
Source: Dell’Ariccia, Igan, and Laeven 2009

0 20 40 60 80 100 120 140 160
-50
0
50
100
150
200
250
19.3324.1816.59
22.13 51.77
25.02
32.3378.1840.92
54.84
19.27
63.99
12.13
32.00
20.81
8.49
9.9410.74
18.25
29.81
40.35
18.54
9.22
24.24
22.50
16.48
26.18
32.349.31
8.34
20.75
21.83
28.34
47.98
25.90
9.29 10.71
38.06
14.85
34.57
30.38
13.6118.03
13.38
24.0737.43
18.61
31.28
8.41
12.43
24.39
Subprime Boom and Defaults
House price appreciation, 2000-06
Ch
an
ge
in m
ort
ga
ge
de
linq
ue
ncy
ra
te, 2
00
7-0
9
Bubble size shows the percentage point change in the ratio of mortgage credit outstanding to household income from 2000 to 2006.

Bubbles Normal times: prices reflect fundamentals
Bubble: speculative motive allows for deviation from fundamentals (Allen/Carletti, 2011)
Banks may fund speculators: Govt. guarantees Risk shifting (limited liability) Can’t separate speculators from “legitimate” consumers
Increasing recourse to instruments with correlated risks U.S.: teaser-rate/interest-only loans East Europe: FX denominated loans

Interest-only loans and boom
Source: Barlevy and Fisher (2011)

Credit and housing booms in East Europe
Bulgaria
Czech Republic
Estonia
Hungary
Serbia
Lithuania
Poland
Russia
Slovak Republic
y = 3.0989x - 16.334R² = 0.3625
0
50
100
150
200
250
-50
0
50
100
150
200
250
0 10 20 30 40 50 60
Change in
real h
ousi
ng p
rice
s, 2
003–
08
Change in private sector credit-to-GDP ratio, 2003–08
Sources: IMF International Financial Statistics; and country statistical offices.1As the boom in the Baltic states ended in 2007, data for the Baltics refer to 2002–07.
Figure A1. Selected CEE Countries: Private Sector Credit and Housing Prices, 2003–081
Croatia
Ukraine
Slovenia

FX lending and credit boom
0
20
40
60
80
100
120
0
20
40
60
80
100
120
Est
onia
Latv
ia
Bul
garia
Ukr
aine
Hun
gary
Cro
atia
Lith
uani
a
Bos
nia
& H
erze
govi
na
Cze
ch R
epub
lic
Pol
and
Slo
vak
Rep
ublic
Mac
edon
ia
Rus
sia
Ser
bia
Rom
ania
Mol
dova
Alb
ania
Turk
ey
Bel
arus
National currencyForeign currencyForeign currency indexed
Sources: National authorities; and IMF, International Financial Statistics.
Emerging Europe: Total Private Sector Credit by Currency, 2008(Stock in percent of GDP)

Strategic complementarities Government guarantees
Do not want to die alone (Farhi/Tirole, 2012) Greenspan put FX in Eastern Europe
Risk taking externalities Poor incentives structure if systemic banks take
excessive risk Correlated risk taking Self fulfilling equilibria
Ex-post … Macro bailouts did occur
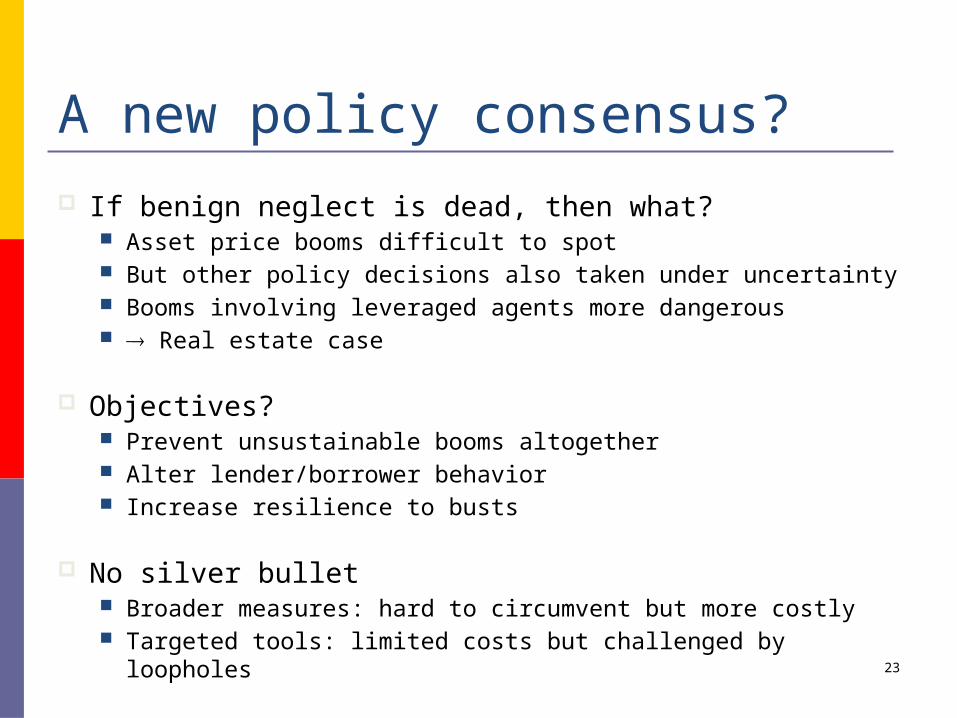
If benign neglect is dead, then what? Asset price booms difficult to spot But other policy decisions also taken under uncertainty Booms involving leveraged agents more dangerous Real estate case
Objectives? Prevent unsustainable booms altogether Alter lender/borrower behavior Increase resilience to busts
No silver bullet Broader measures: hard to circumvent but more costly Targeted tools: limited costs but challenged by loopholes
A new policy consensus?
23

Natural place to start
Credit highly correlated with monetary aggregates
Increase cost of borrowing, decrease loan demand, lower collateral values
Risk-taking channel
Potential issues
Conflict of objectives
Impact on balance sheets
Capital inflows (especially in SOEs)
Switch to riskier lending (FX, IO loans)
Monetary policy


9
Figure 8. Credit Growth and Monetary Policy(Selected countries that had a boom in the run-up and a crisis in 2007-08)
Sources: IMF International Financial Statistics, World Economic Outlook; staff calculations.Notes: Credit is indexed with a base value of 100 five years prior to the crisis.
0
50
100
150
200
250
0
1
2
3
4
T-5 T-4 T-3 T-2 T-1 T
United Kingdom 2007
Core inf lationCredit (right axis)
0
50
100
150
200
250
0
1
2
3
4
T-5 T-4 T-3 T-2 T-1 T
Ireland 2008
Core inf lationCredit (right axis)
0
50
100
150
200
250
0
1
2
3
4
T-5 T-4 T-3 T-2 T-1 T
Spain 2008
Core inf lationCredit (right axis)
0
50
100
150
200
250
0
1
2
3
4
T-5 T-4 T-3 T-2 T-1 T
Greece 2008
Core inf lationCredit (right axis)
Credit Growth and Core Inflation

Evidence of risk shifting
Source: Landier et al. 2011

Prudent stance can: Reduce overheating Buffer for bailout/stimulus during a potential bust Reduce incentives for leverage (deductibility, FAT)
Time lags make it an impractical tool Some measures hard to use countercyclically “Tax planning”, circumvention, calibration
Little evidence of effectiveness in stopping booms… …but fiscal room critical in busts
Fiscal policy
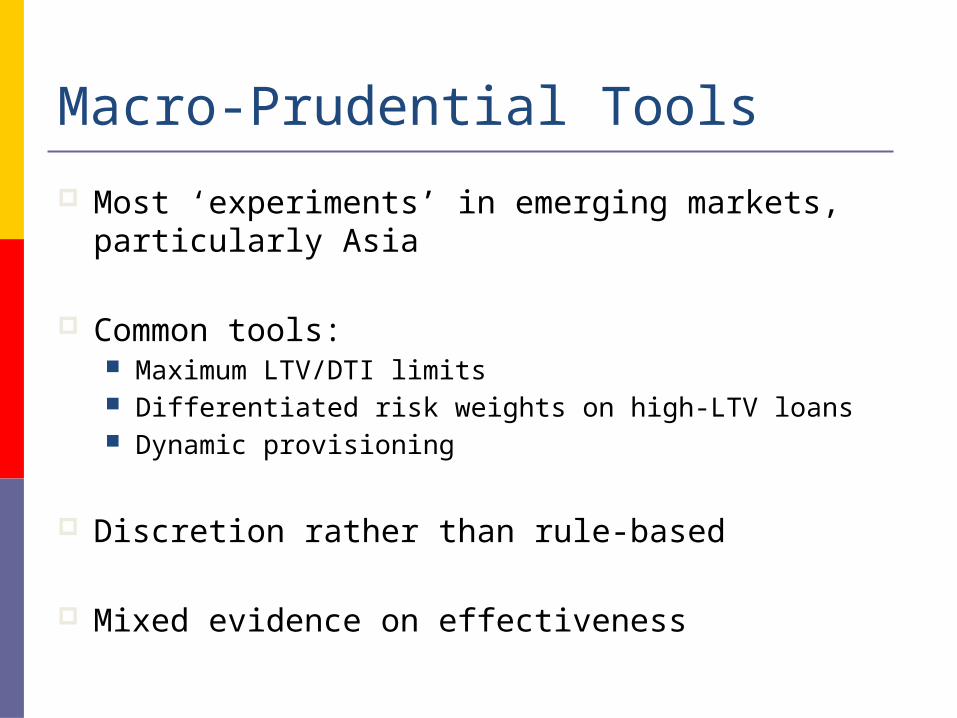
Most ‘experiments’ in emerging markets, particularly Asia
Common tools: Maximum LTV/DTI limits Differentiated risk weights on high-LTV loans Dynamic provisioning
Discretion rather than rule-based
Mixed evidence on effectiveness
Macro-Prudential Tools

Hong Kong: Limited Effectiveness of LTV Limits
110
120
130
140
150
160
70
90
110
130
150
170
2009 - Mar 2009 - May 2009 - Jul 2009 - Sep 2009 - Nov 2010 - Jan 2010 - Mar 2010 - May 2010 - Jul
New loans approved Prices
October 2009:Maximum LTV for properties over HK$20 million lowered to 60 percent, maximum loan size for mortgage insurance eligibility reduced and non-owner-occupied properties disqualified.
August 2010:LTV for properties over HK$12 million lowered to 60 percent, applications for mortgage insurance exceeding 90% LTV and 50% DTI suspended, maximum loan size for mortgage insurance eligibility if LTV>90%.

Korea: Effective LTV Limits, but Difficult Calibration?
0
1
2
3
4
5
6
-2%
-1%
0%
1%
2%
3%
4%
5%
6%
2000 - Jan 2001 - Apr 2002 - Jul 2003 - Oct 2005 - Jan 2006 - Apr 2007 - Jul 2008 - Oct 2010 - Jan
September 2002:Introduced LTV limits
June 2003:Lowered LTV in speculative areas
October 2003:Lowered LTV in speculative areas
July 2009:Lowered LTV in non-speculative areas
February 2007:Tightened DTI
August 2005:Introduced DTI limits
September 2009:Tightened DTI
Month-on-month house price changes in 'speculation zones' (LHS)
Policy rate (RHS)

Conclusions Benign neglect might be dead, so …
Emerging consensus that leveraged bubbles (real estate in particular) are dangerous
What to do. Still many open questions: Monetary policy remains blunt instrument Fiscal impractical. Perhaps helpful on liability structures Macroprudential tools promising …
But it will take time: Develop new macro models Design/calibrate macroprudential tools Build institutions to control them

Limited liability and speculators
q
1-q
H-P(1+r)
L-P(1+r)
q
1-q
H-P(1+r)
L-P(1+r)
Unlevered consumer
Levered speculator