property market insight: norfolk uk
TRANSCRIPT
History of Property Market in NorfolkFrom Recession Ripple Effect to
Bouncing Back

About Us
I spend my time sourcing new investment opportunities and project managing them fromstart to finish once they are secured.
My day job used to be working in the Insolvency and Business Recovery industry, both inEast Anglia and London. Along the way I built up an extensive network of professional and
business contacts whose advice and expertise is worth its weight in gold.
I have also been involved in a family run commercial property business which hasprovided me with invaluable experience and knowledge in the property world.
I can be contacted on 01603 567804 or via email at [email protected]
I spend my time sourcing new investment opportunities and, once they’re secured,project managing them from start to finish.
I previously worked in the insolvency and business recovery industry, both in EastAnglia and London. Along the way, I built up an extensive network of professional
and business contacts whose advice and expertise has proved to be worthits weight in gold.
I have also been involved in a family-run commercial property business which hasprovided me with invaluable experience and knowledge of the property market.
I can be contacted on 01603 567804 or via email at [email protected]
Richard
Wayne

House Price Index summary for Norfolk PERIOD: January 1996 to April 2016
GreatYarmouth
Norwich
King's Lynn&
West Norfolk
Breckland
NorthNorfolk
Broadland
SouthNorfolk
Norwich
min max current £
38,554 152,011 152,011 18.73% 43.16% 27 181
min minmax max
39,242 187,346 187,346 22.01% 37.94% 59 363
% annual change total sales in 1 month
43,265 191,218 189,566 16.44% 27.80% 32 308
46,432 195,984 193,607 16.61% 32.39% 22 298
47,208 221,249 219,898 14.82% 32.96% 32 244
52,895 232,009 230,464 21.63% 27.91% 88 237
53,567 232,258 232,258 18.27% 24.20% 36 306

The minimum average pricerecorded was in Great
Yarmouth (£38,554) and themaximum average price
recorded was in South Norfolk(£232,258).
For the currentaverage house price,South Norfolk is themost expensive area(£232,258) and Great
Yarmouth is thecheapest (£152,011).
Norwich experiencedthe most significantdrop in house prices(-22.01%) during the2009 property crisis.
Great Yarmouth hashad the highest
percentage annualchange in price
(43.16%).
Norwich has had thehighest total sales
volum
Norwich enjoyed the highesttotal monthly sales of 363 inJanuary 2009, in contrast toBrecklands lowest recordedmonthly sales of 22 units in
the same month.
Over 20 years of datarecorded in Norfolk, a
property has increased invalue 4.4 times.
House Price Index Highlights

Total sales by Local Authorities over aperiod of 20 years
50k
40k
30k
20k
10k
0
Gre
at Y
arm
outh
- 19
,017
Nor
th N
orfo
lk -
25,1
22
Bre
ckla
nd -
27,6
93
Sou
th N
orfo
lk -
30,2
88
Kin
g's
Lynn
& W
est
Nor
folk
- 31
,597
Bro
adla
nd -
36,4
80
Nor
wic
h - 4
4,01
2
Ave
rage
- 10
,710
Sou
th N
orfo
lk -
30,2
88
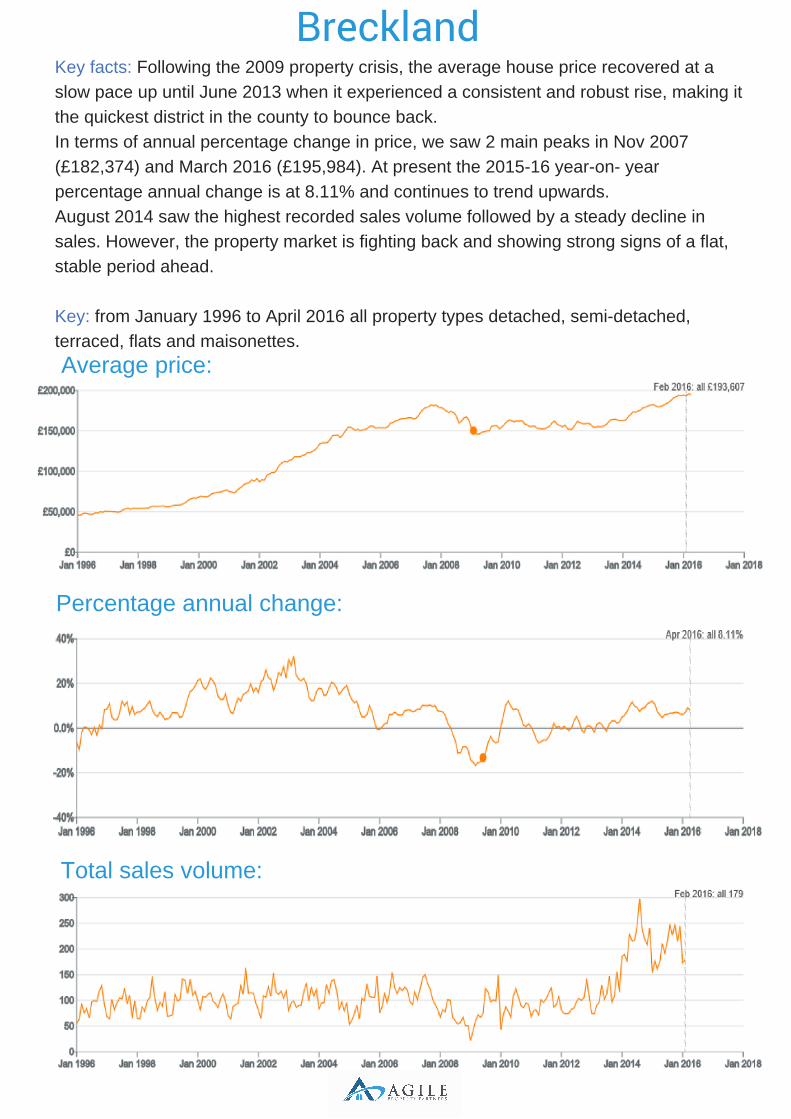
Key facts: Following the 2009 property crisis, the average house price recovered at a
slow pace up until June 2013 when it experienced a consistent and robust rise, making it
the quickest district in the county to bounce back.
In terms of annual percentage change in price, we saw 2 main peaks in Nov 2007
(£182,374) and March 2016 (£195,984). At present the 201516 yearon yearpercentage annual change is at 8.11% and continues to trend upwards.
August 2014 saw the highest recorded sales volume followed by a steady decline in
sales. However, the property market is fighting back and showing strong signs of a flat,
stable period ahead.
Key: from January 1996 to April 2016 all property types detached, semidetached,
terraced, flats and maisonettes.
Breckland
Average price:
Percentage annual change:
Total sales volume:

BroadlandKey facts: Much like neighbouring Breckland, following the 2009 property crisis, the average
house price in Broadland recovered at a slow pace. June 2014 saw the tide turn and the
house prices embarked on a consistent and robust rise. In terms of annual percentage change
in price, we saw 2 main peaks in September 2007 (£205,661) and March 2016 (£232,009). At
present the 201516 yearonyear percentage annual change is at 7.78% and is
trending down. October 2015 saw the highest recorded sales volume followed by a steady
decline in sales. However, based on February's encouraging sales volume, sales are showing
positive signs of recovery.
Key: from January 1996 to April 2016 all property types detached, semidetached, terraced,
flats and maisonettes.
Average price:
Percentage annual change:
Total sales volume:

Great YarmouthKey facts: Great Yarmouth was the second quickest district to bounce back from the 2009
property crisis, with, following a previous slow recovery, the average house price robustly
rising in November 2013. In terms of annual percentage change in price, we saw 2 main
peaks in December 2007 (£150,246) and April 2016 (£152,011). At present the 201516yearon year percentage annual change is at 8.7% and is trending upwards. July and
October 2015 saw the highest recorded sales volume followed by a steady decline insales.
Key: from January 1996 to April 2016 all property types detached, semidetached,
terraced, flats and maisonettes.
Average price:
Percentage annual change:
Total sales volume:

King's Lynn & West NorfolkKey facts: This district enjoyed its own resurgence following the 2009 property crisis, with
the average house price recovering at a slow pace up until March 2014, when it started a
consistent and notable rise. In terms of annual percentage change in price, there were 2
main peaks in December 2007 (£170,777) and March 2016 (£191,218). At present the
201516 yearon year percentage annual change is at 7.54% and is flat trending. Sales
volumes in August 2014 were the highest recorded with a steady decline on
sales thereafter. However, sales are showing positive signs of recovery based on
February’s encouraging sales.
Key: from January 1996 to April 2016 all property types detached, semidetached, terraced,
flats and maisonettes.
Average price:
Percentage annual change:
Total sales volume:

North NorfolkKey facts: Much like the other districts in the county, the average house price in North
Norfolk was hit by the 2009 property crisis, but has since recovered at a slow pace then
experiencing a more significant boost in March 2014 and beyond. In terms of annual
percentage change in price, there were 2 main peaks in December 2007 (£202,233) and
November 2015 (£221,249). At present the 201516 yearon year percentage annualchange is 9.26% and is flat trending. July 2014 saw the highest recorded sales by volume
followed by a steady decline on sales, however February’s sales suggest an recovery.
Key: from January 1996 to April 2016 all property types detached, semidetached, terraced,
flats and maisonettes.
Average price:
Percentage annual change:
Total sales volume:

NorwichKey facts: Mirroring its surrounding districts, Norwich also saw March 2014 become a
positive turning point for house prices in the area. Once again hit by the 2009 property crisis,
the milestone in the market’s fortunes follows a slow but steady recovery in the months and
years between. In terms of annual percentage change in price, there were 2 main peaks in
October 2007 (£166,498) and April 2016 (£187,346). At present the 201516 yearon year percentage annual change is at 11.56% and, like Breckland and Broadland, is trending
up. Sales volume in May 2007 was the highest recorded, followed by a steady decline in
sales but once again February’s sales reflect a recovery in the market.
Key: from January 1996 to April 2016 all property types detached, semidetached, terraced,
flats and maisonettes.
Average price:
Percentage annual change:
Total sales volume:

South NorfolkKey facts: Having also fallen victim to the effects of the 2009 property crisis, in the period
since, South Norfolk has seen the average house price recover at a slow pace up to April
2014 when it started a consistent and robust rise. In terms of annual percentage change in
price, there were 2 main peaks in October 2007 (£207,081) and April 2016 (£232,258). At
present the 201516 yearon year percentage annual change is at 12.2% and is trending
up. Following the start of a notable increase in the average house price from April 2014
onwards, just two months later June 2014 saw the highest recorded sales volume by June
2014, followedby a steady decline on sales. However, once again, it is showing recovery
based on February’s sales.
Average Price:
Percentage annual change:
Total sales volume:

Norfolk Market Rent Summary (April 2016) Rental price analysis for Norfolk summarises the advertised rents for homes to
let, calculated daily from the rental properties found by the Home.co.uk
Property Search Engine. The postcode NR5 represents the highest yield
6.27%.
NOTE: The Mean for rental and asking price is the average calculated by
adding up all the values in the sample and then dividing by the number of
values. Yield for each post code is calculated by the mean of rental times 12
months divided by the mean of asking price times
100. Yield = (average rental NR x 12/ average house asking price NR) * 100
NR5

Norfolk's coastal hotspots (2016)
“Living by the coast appeals to people from all walks of life, from
secondhome buyers and downsizers to young professionals and
families, but this lifestyle choice invariably comes at a price. On
average, buyers of homes within 100 metres of the coast pay a
premium of 11.7 per cent for proximity to the sea, according to our
latest research.” (Savills)
Ultra prime locations – often traditionally longestablished areas
such as WellsNextTheSea has an average detached sale price
of £469,000 and a premium above the country average of at least
70 per cent. In contrast, the traditional seaside resort Caisteron
Sea sits on the bottom of the table with premium below country
average of 37%.
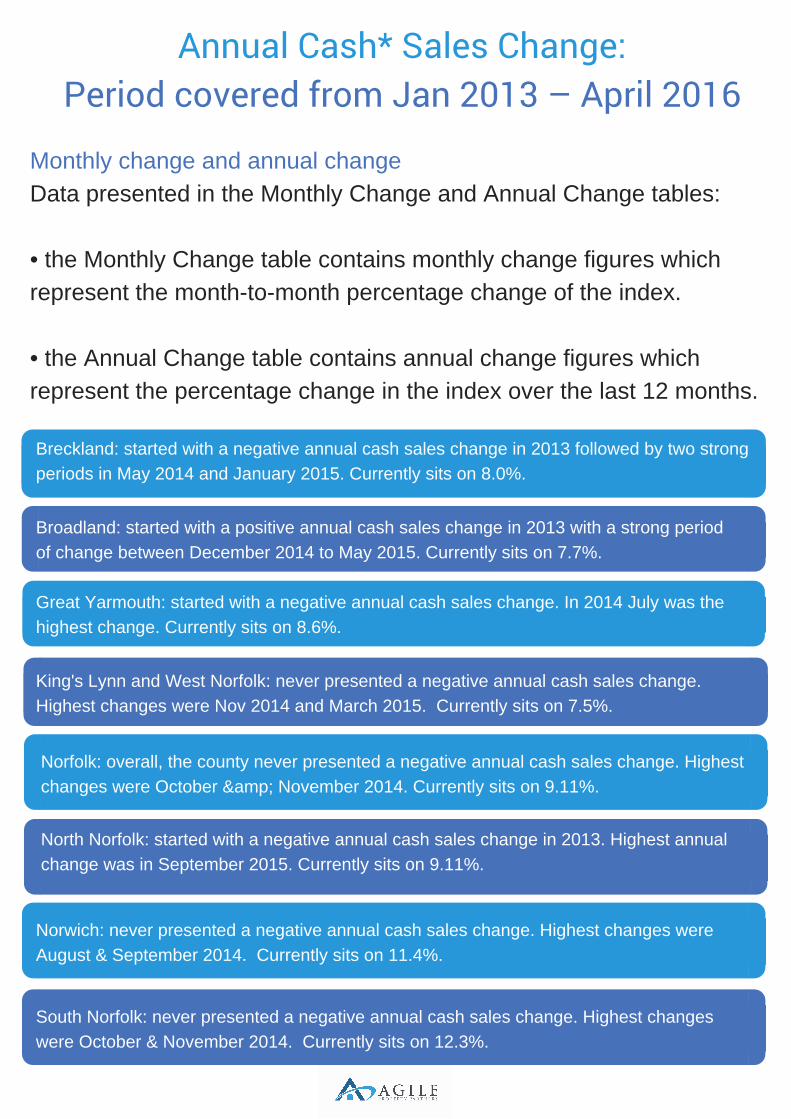
Annual Cash* Sales Change:Period covered from Jan 2013 – April 2016
Monthly change and annual change
Data presented in the Monthly Change and Annual Change tables:
• the Monthly Change table contains monthly change figures which
represent the monthtomonth percentage change of the index.
• the Annual Change table contains annual change figures which
represent the percentage change in the index over the last 12 months.
Breckland: started with a negative annual cash sales change in 2013 followed by two strong
periods in May 2014 and January 2015. Currently sits on 8.0%.
Broadland: started with a positive annual cash sales change in 2013 with a strong period
of change between December 2014 to May 2015. Currently sits on 7.7%.
Great Yarmouth: started with a negative annual cash sales change. In 2014 July was the
highest change. Currently sits on 8.6%.
King's Lynn and West Norfolk: never presented a negative annual cash sales change.
Highest changes were Nov 2014 and March 2015. Currently sits on 7.5%.
Norfolk: overall, the county never presented a negative annual cash sales change. Highest
changes were October & November 2014. Currently sits on 9.11%.
North Norfolk: started with a negative annual cash sales change in 2013. Highest annual
change was in September 2015. Currently sits on 9.11%.
Norwich: never presented a negative annual cash sales change. Highest changes were
August & September 2014. Currently sits on 11.4%.
South Norfolk: never presented a negative annual cash sales change. Highest changes
were October & November 2014. Currently sits on 12.3%.


Land Registry for England and Wales
Information on residential property transactions for England and Wales, collected as part
of the official registration process, will be provided by Land Registry for properties that are
sold for full market value. The dataset contains the sale price of the property, the date
when the sale was completed, full address details, the type of property (i.e. detached,
semidetached, terraced or flat), if it is a newly built property or an established residential
building and a variable to indicate if the property has been purchased as a financed
transaction (for example using a mortgage) or as a nonfinanced transaction (cash
purchase).
Monthly change and annual change
Data presented in the Monthly Change and Annual Change tables:
• the Monthly Change table contains monthly change figures which represent the month
tomonth percentage change of the index.
• the Annual Change table contains annual change figures. These represent the
percentage change in the index over the last 12 months.
Monthly and annual price changes
The ‘annual’ percentage change in house prices is simply the price change relative to the
same month twelve months earlier. For example, if the HPI release is for February, then
the ‘annual’ price change reports the percentage change in values relative to February in
the previous year.
This annual rate of price change reflects the best estimate for how much the value of a
typical property has changed over the preceding twelve months. Similar to the ‘annual’
change, the ‘monthly’ percentage change estimates the percentage change in average
house prices relative to the previous month.
Calculating the standard average price
The standard average house price is calculated by taking the average (geometric mean)
price in January 2015 and then recalculating it in accordance with the index change back
in time and forward to the present day. A 3 month moving average has been applied to
estimates below the regional level to remove some of the volatility in the series.
Sales volumes table
This table contains counts of all sales included in the electronic register at the time of
data extraction. The data collection delay mainly affects the most recent months. The two
most recent months are therefore omitted from this data to avoid reporting misleading
volumes.
Methodology
The UK HPI applies a hedonic regression model that utilizes the various sources of data
on property price (for example the Price Paid dataset) and attributes to produce upto
date estimates of the change in house prices each period. More details of the UK HPI
methodology on the ONS website.

Calculating the UK HPI
The calculation of the UK HPI is performed by the Office for National Statistics. Further
information on the methodology applied is available via the published article ‘Development
of a single official House Price Index’.
Republishing data
The data can be republished for noncommercial purposes. However, no part of the UK
HPI may be reproduced in any form or for any purpose without the prior permission of
Land Registry. Enquiries can be made to [email protected]. Neither Land
Registry nor any third party shall be liable for any loss or damage, direct, indirect or
consequential, arising from:
• any inaccuracy or incompleteness of the data in the UK HPI
• any decision made or action taken in reliance upon the data
• neither shall Land Registry or any third party be liable for loss of business resources, lost
profits or any punitive indirect, consequential, special or similar damages whatsoever,
whether in contract or tort
Source: https://www.gov.uk/government/publications/abouttheukhouseprice
index/abouttheukhousepriceindex
Research by Carlos Cesari