properties ofboundary -linerelease criteria in north
TRANSCRIPT

Ann. For. Sci. 66 (2009) 205 Available online at:© INRA, EDP Sciences, 2009 www.afs-journal.orgDOI: 10.1051/forest/2008087
Original article
Properties of boundary -line release criteria in North Americantree species
Bryan A. BLACK1,*, Marc D. ABRAMS2, James S. RENTCH3, Peter J. GOULD4
1 Hatfield Marine Science Center, 2030 Marine Science Drive, Newport, OR 97365, USA24 Ferguson Building, School of Forest Resources, Penn State University, University Park, PA 16802, USA
3 Division of Forestry and Natural Resources, West Virginia University, P.O. Box 6125, Morgantown, WV 26506, USA4 US Forest Service, Forest Sciences Laboratory, 3625 93rd Ave. SW, Olympia, WA 98512, USA
(Received 18 June 2008; accepted 26 November 2008)
Keywords:dendrochronology /disturbance ecology /forest ecology /release criteria
Mots-des:dendrochronologie /ecologie des perturbations /ecologie forestiere /crlteres de degagement
Abstract• Boundary line release criteria are increasingly applied to evaluate forest disturbance histories fromtree-ring data. However, a number ofimportant properties central to the technique have not been eval-uated, including: (i) the ability of boundary line release criteria to standardize releases across varioussites, species, and tree life stages (ii) the minimum sample sizes necessary for developing boundarylines, and (iii) the.degree to which the criteria can resolve the degree of crown exposure following adisturbance event.• In an analysis of eleven North American tree species, boundary line release criteria do not fullycompensate for declines in release response a tree experiences with increasing age and size, with theexception Tsuga canadensis.• A bootstrapping analysis indicates that approximately 50000 ring width measurements are neces-sary to develop boundary line release criteria for a given species.• In a Quercus prinus stand, boundary line release criteria better predict the degree of crown exposurefollowing a disturbance than an earlier running mean technique.• Despite certain limitations, boundary line release criteria have the potential to standardize releasecalculation across most life stages of a tree, and possibly among sites and species.
Resume - Proprietes des criteres des lignes limites de degagement chez les arbres Nord Ameri-cains,• Les lignes lirnites de dcgagement sont des criteres de plus en plus appliques pour evaluer l'his-torique des perturbation des forets a partir des donnees des cernes des arbres. Toutefois, un certainnombre de proprietes importantes au cceur de la technique n' ont pas ete evaluees, y compris : (i) lacapacite du critere de la ligne limite de degagement pour standardiser les degagernents a travers dif-ferents sites, especes et stades de la vie des arbres, (ii) la taille minimale des echantillons necessairespour Ie developpemcnt de ligneslirnitcs, et (iii) Ie degre avec lequel les criteres peuvent resoudre ledegre d'exposition de la couronne suite a un evenement perturbant.• Dans une analyse de onze especes d' arbres d' Amerique du Nord, les criteres de ligne limite necompensent pas entierement la baisse de reponse au degagement d'un arbre en relation avec l'age etla dimension, a l'exception Tsuga canadensis.• Une analyse bootstrap indique que pres de 50 000 mesures de largeur sent necessaires pour deve-lopper des criteres de ligne limite de degagement pour une espece donnee.• Dans un peuplement de Quercus prinus, les criteres de ligne limite de degagement permettent demieux predire le degre d' exposition de la couronne a la suite d'une perturbation que la technique dela moyenne courante.• En depit de certaines limitations, les criteres de ligne de limite de degagement ont le potentiel destandardiser les calculs de degagement dans la plupart des etapes de la vie d'un arbre et, eventuelle-ment, entre les sites et les especes,
* Corresponding author: [email protected]
Article published by EDP Sciences

Ann. For. Sci. 66 (2009) 205
1. INTRODUCTION
Tree rings represent a key data source for reconstructingforest dynamics and disturbances such as windstorms, icestorms, fires, insect outbreaks, logging, and agricultural activ-ities (Abrams et al., 2001; Lafon and Speer, 2002; Lorimerand Frelichn, 1989; Shumway et al., 2001; Speer et al., 2001).The timing, duration, and magnitude of these events are of-ten inferred by analyzing the growth pulses, also known as re-leases, associated with disturbance-related reductions in com-petition. Over the past several decades a wide range of criteriafor identifying releases have been developed to quantify dis-turbance histories using time series of tree-ring measurements(Rubino and McCarthy, 2004). Some of the most widely usedare radial-growth averaging techniques, in which a runningpercent-growth change calculation is performed on each tree-ring time series, and release events are indicated when percent-growth change values exceed a certain minimum value. Forexample, in the Nowacki and Abrams (1997) criteria, percent-growth change is calculated in 10-year running windows witha release threshold of twenty-five percent. These criteria havebeen successfully applied in a number of studies (Rozas, 2003;Schuler and Fajvan, 1999; Winter et al., 2002), validated byindependent testing (Rentch et al., 2002), and found to reflectthe magnitude and timing of percent crown exposure (Rentchet al., 2003).
The Nowacki and Abrams (1997) criteria were originallydesigned to address crown releases in dominant and codom-inant trees, but may not be appropriate to apply to younger,smaller individuals. In comparison to overstory trees, whichare already growing near an optimum level, suppressed under-story trees often show much more dramatic growth responsesin response to reduced competition (Black and Abrams, 2004;Lorimer and Frelich, 1989). To compensate for these differ-ences in release response, some have employed a hybrid ap-proach in which more stringent criteria are applied to the un-derstory phase of growth (Ruffner and Abrams, 1998). Build-ing on this concept, boundary line release criteria were pro-posed to better account for differences in release responsethroughout the lifespan of the tree. The technique was basedon the observation that prior radial growth rate was a strongpredictor of the maximum percent-growth change pulse thetree could experienced following a disturbance event (Blackand Abrams, 2003). In summary, young, small, and suppressedtrees maintained slower radial growth rates, and were found tobe capable of extremely large pulses in percent-growth changein comparison to their older, larger, dominant counterparts.Radial growth rate appeared to be closely related to the magni-tude of percent-growth change pulses. Indeed, when percent-growth change was graphed against average radial growth overthe past ten years, percent growth-change values extended toa well-defined boundary that declined exponentially across in-creasing levels of prior growth (Black and Abrams, 2003).
An important aspect of this finding is that Tsuga canadensisof almost any age, size, and canopy class demonstrated per-cent growth-change pulses that reached this upper boundary,with the exception of sites near the boundaries of the species'range (Black and Abrams, 2004). Slow-growing trees, which
B.A. Black et al.
tended to be small understory individuals, reached the bound-ary with large pulses in percent-growth change. Fast-growingtrees, which tended to be large dominant individuals, couldreach the boundary with only modest pulses in percent-growthchange. Release criteria were proposed in which all percentgrowth-change pulses are scaled in terms of their maximumpossible value, as predicted by level of prior radial growth.This should better compensate for differences among age, size,and canopy classes and allow for better direct comparisons ofrelease events across all phases of a tree's lifespan.
In addition to Tsuga canadensis, strong effect of priorgrowth has been demonstrated for the North American treespecies Pinus strobus, Pinus echinata, Quercus macrocarpa,Quercus alba, Quercus prinus, Pseudotsuga menziesii (Blackand Abrams, 2003; 2004), flex opaca (Forrester et al., 2007),and Betula alleghaniensis (Webster and Jensen, 2007), as wellas the European tree species Fagus sylvatica, Abies alba,and Picea abies (Nagel et al., 2007; Splechtna et al., 2005).As in Tsuga canadensis, the upper thresholds of percent-growth change follow negative exponential trends with in-creasing levels of prior growth. However, the configuration ofeach species' boundary line is unique, reflecting differences inlife history characteristics and thus, release response (Blackand Abrams, 2003; 2004; Splechtna et al., 2005). By scalingeach percent-growth change pulse to the maximum value pre-dicted by prior growth, boundary line release criteria may alsohelp compensate for species-specific differences in release re-sponse, facilitating more direct comparisons of disturbancehistories among species and sites (Black and Abrams, 2003;2004).
In this study we address a number of issues related toboundary line development and the assumptions underlyingthe criteria using eleven North American tree species that oc-cur in diverse habitats and have contrasting ecological charac-teristics: Tsuga canadensis, Pinus strobus, Pinus echinata, Pi-nus ponderosa, Quercus macrocarpa, Quercus alba, Quercusprinus, Quercus stellata, Picea glauca, Picea mariana, Pseu-dotsuga menziesii. Specifically, the objectives are to (i) de-velop boundary lines for Pinus ponderosa, Quercus stellata,Picea glauca, and Picea mariana, and compare them to allother boundary lines that have been created to date, (ii) applya bootstrapping analysis to estimate the minimum sample sizenecessary to develop a boundary line, (iii) identify whetherthe boundary line release criteria fully compensates for age-and size-related changes in release response, and (iv) assessthe extent over which a single boundary line may be applied.Finally, we evaluate the ability of boundary-line release cri-teria to resolve the degree of crown release in a Quercus pri-nus stand with a known disturbance history. Overall, we morethoroughly evaluate the strengths and weaknesses of bound-ary line release criteria and discuss interpretations of releaseevents detected through this technique.
2. MATERIALS AND METHODS
2.1. Boundary line development and effects of age andsize
Tree-ring data were obtained from previous studies and the Inter-national Tree-Ring Data Bank (Appendix available online at www.
205p2

Boundary line release criteria
afs-journal.org). Percent-growth change and prior growth were cal-culated for all tree ring data following the formula of Nowacki andAbrams (1997) in which percent-growth change for a year equals (M2
- M1)/M1 where M1 equals average growth over the prior 10 yearsand M2 equals average growth over the subsequent 10 years. Priorgrowth was defined as the average radial growth over the past tenyears (Black and Abrams, 2004). For each species, the boundary linewas constructed by first dividing the data set into 0.5 mm segments ofprior growth. Then within each segment, the percent-growth changevalues of the top ten points were averaged. The top ten points in eachsection ensured an equal sample size across all prior growth classes,and limited the analysis to the few points that represented true max-imal releases. To quantify the boundary line linear, power, logarith-mic, and exponential curves were fitted to all positive segment aver-ages, and the function that yielded the highest R2 value was selected(Black and Abrams, 2003; 2004).
Approximate age of each growth increment was estimated bycounting all preceding growth rings, while radius was estimatedby summing the widths of all preceding growth lings. Growth in-crements were assigned radius classes in 50 mm increments (0-49.9 mm, 50-99.9 mm, etc.) and age classes in 50 year increments(0-49 years, 50-99 years, etc.). All growth increments were plottedwith respect to age or radius class, prior growth, and percent-growthchange to evaluate difference in percent growth changes among ageand radius classes. If all age and radius classes approach the upperthreshold of percent-growth change values, then all classes are capa-ble of maximum percent-growth change as predicted by prior growth.If any age and radius classes fell short of the threshold, then the ef-fects of prior growth on maximum percent-growth change did notadequately explain percent growth change differences among age orradius classes.
2.2. Minimum sample sizes
A bootstrapping test to estimate minimum sample size was con-ducted by sampling percent-growth change values with replacementat increasingly large sample sizes. Sampling from each species' com-plete data set began at 10000 growth increments and increased insteps of 10 000 to a maximum of 200000 percent-growth changevalues. The prior growth rate associated with each percent-growthchange value was retained. For each species, sampling was repli-cated 300 times at each of the twenty sample sizes to yield a total of6000 resamplings. In every sampling replicate, data were divided into0.5 mm prior growth classes (0.0-0.49 mm, 0.5-0.99 mm, etc.) andthe top ten percent-growth change values in each class were averaged.The, mean, standard deviation, and coefficient of variation of these300 percent-growth change averages were calculated in each priorgrowth class. Minimum sample size was estimated by plotting stan-dard deviation and mean across all sample sizes (10 000 to 200000)and identifying the sample size at which both become asymptotic.The coefficient of variation (standard deviation/mean) was calculatedin order to summarize the combined effects of increasing mean anddecreasing standard deviation that typically occur with increasingsample size.
2.3. Boundary-line release criteria validation
The ability of boundary-line release criteria to resolve crown ex-posure was evaluated using Quercus prinus increment cores fromthinned stands in West Virginia (Rentch et al., 2002). The study
Ann. For. Sci. 66 (2009) 205
site is located on a northeast-facing upper slope of ChestnutRidgein the West Virginia University Forest, 13 km east of MorgantownWV. Elevation is 640 m and slopes range from 0 to 15% and soilsare derived from resistant sandstone and are acidic with low fertil-ity (Rentch et al., 2002). Twenty oak-dominated 1,2-ha experimentalplots were thinned in 1982 at one of three treatment levels: 45, 60,or 75% relative density. Four years later, dominant and codominanttrees were assigned a free-to-grow rating from 0 (control; no crownrelease) to 4 (crown fully released) in increments of 0.5 (Rentch et al.,2002). In 2000, dominant and codominant Quercus prinus (n = 52)were randomly selected in each of the crown release classes (0, 12.5,25, 37.5, 50, 67.5, 75, 87.5, and 100%) for coring, These cores weremounted, sanded, cross-dated, and measured according to standarddendrochronological techniques.
Prior growth and percent-growth change were calculated for everygrowth increment within every tree-ling series, with the exception ofthe first and last ten years of growth, in which these calculations couldnot be applied. In the percent-growth change pulses that followedthe 1982 thinning, the year of maximum percent-growth change wasidentified and the percent-growth change value and prior growth levelwere recorded. If no discernab1e pulse occurred following the thin-ning, as was the case in the controls and some 12.5% crown releases,percent-growth change and prior growth were recorded for 1985.This compensates for the average three-year lag that occurred beforethe maximum value of percent-growth change (Rentch et al., 2002).For each tree, maximum percent-growth change and prior growthfollowing the thinning were plotted with respect to the species-wide Quercus prinus boundary line, described by the function:y = 742.83 e-0.9977x (Black and Abrams, 2003).
3. RESULTS AND DISCUSSION
3.1. Boundary line properties
Prior growth strongly influences maximum percent-growthchange in all of the very diverse species reviewed by this study.The relationship between prior growth and percent growthchange consistently follows a declining trend such that treesexperiencing slow growth are capable of much larger pulses inpercent growth change than those experiencing rapid growth(Tab. I and Fig. 1). However, boundary line configurationvaries considerably among species, in such a way that looselyfollowed each species' level of understory tolerance (Fig. 1).For example, in the shade-tolerant Fagus sylvatica, Abies alba,flex opaca, and Tsuga canadensis, maximum percent-growthchange values are quite high when prior growth is slow, andthen steeply decline as prior growth rate increases (Fig. 1A).In contrast, maximum percent-growth change of the interme-diate and shade-intolerant species is much lower when priorgrowth is slow, as is the rate of decline in these values asprior growth increases (Figs. 1B and 1C). Such a pattern inthe boundary lines makes ecological sense considering thatthese species are capable of sustaining extremely low growthrates and rapidly exploiting any newly formed gaps (Black andAbrams, 2003). However, there are several notable exceptionsto this pattern, such as the very low percent growth changevalues for the shade-tolerant Picea mariana (Fig. 1A), or therather high boundary line values for Betula alleghaniensis and
205p3

Ann. For. Sci. 66 (2009) 205 B.A. Black et al.
Table I. Tolerance rankings and boundary line equations, sample sizes, and understrory tolerance ratings for elevenNorth American tree speciesincluded in this study or Black and Abrams 2003 or 2004. The percentage of sites in which trees approach the boundaryline is shown, as is theage and size at which each species fails to attain maximum release responses predicted by the prior-growth boundary line, also expressed as apercentage of the maximumsize (% of max size) and maximum age (% of max age) observed for each species.
Pinus echinata (Figs. 1B and lC). Thus, the steepest boundarylines generally tend to occur in shade-tolerant species, but thisgeneralization is not always true.
For most species, simple negative exponential functionsprovide a good fit. Yet for some species, modifications werenecessary to follow steeply declining values of percent growthchange (Splechtna et al., 2005). In Fagus sylvatica, Piceaabies, and Abies alba, parameters were added so the func-tions would better fit the relationship between prior growth andpercent growth change. Also, for Fagus sylvatica, data weresubdivided into 0.25 mm classes to capture the very rapid de-clines observed in percent growth change values (Splechtnaet al., 2005). On a more fundamental level, the procedure ofquantifying an upper boundary remains somewhat subjective,and other alternatives could be explored. The number of max-imal data points in each prior growth class could be varied, ascould the width of each prior growth class, or the functionsused to fit the relationship between prior growth and percent-growth change. An approach such as quantile regression couldbe considered, which would identify the upper boundary us-ing all points in the data set rather than the highest percentgrowth change values in each prior growth class (Cade andNoon, 2003). Such techniques could potentially improve thecriteria, though major alterations of boundary lines would re-quire the redefinition of thresholds for "moderate" or "major"releases as well as the lowest thresholds necessary to excludethe effects of climate.
3.2. Adequate sample sizes for boundary linedevelopment
Another important aspect of boundary line release criteriais identifying the minimum sample size of growth increments
necessary for boundary line development. According to boot-strapping analysis for Tsuga canadensis, the mean percentgrowth change in each prior growth class increases with in-creasing sample size, and the increase is most rapid in thesmallest (0.25 mm) prior growth class (Fig. 2A). Also, stan-dard deviation in the smallest prior growth class decreases un-til a sample size of approximately 150000 after which point itremains stable through a sample size of 200000 growth incre-ments (Fig. 2B). The combined effects of increasing mean anddecreasing standard deviation are reflected in the coefficientof variation, which declines in all prior-growth classes as sam-ple size increases. In comparison to the slowest prior growthclasses (0.25 and 0.75 mm), the coefficients of variation in thehighest growth classes (2.25 and 2.75 mm) appear to be quitelarge. However, this is due to low values of the mean, whichare subject to yield high coefficients of variation even whenaccompanied by low standard deviation values (Fig. 2).
The most relevant property of the coefficient of variationis its pattern of change with increasing sample size, whichfollows similar patterns across all prior growth classes. In al-most every prior growth class, the steepest declines in the co-efficient of variation occur between sample sizes of approx-imately 10 000 to 50000, thereafter only gradually decliningwith increasing sample size (Fig. 2C). Where the coefficientof variation stabilizes indicates the point at which the meanis at its maximum and the variance around that mean is sta-ble. In Tsuga canadensis, that point is reached at a samplesize of approximately 50000 data points. Beneath this sam-ple size the maximum possible percent-growth change valuescould be underestimated, particularly in the highest (2.75 mm)prior growth class.
Coefficients of variation are shown for six other species,representative of the eleven total species in the sample set
205p4

Boundary line release criteria Ann. For. Sci. 66 (2009) 20S
Figure 1. Boundary lines for (A) shade-tolerant species, (B) speciesof intermediate tolerance, and (C) shade-intolerant species.
(Fig. 3). In general, the patterns are similar to Tsuga canaden-sis whereby the fastest prior growth classes are subject to high-est coefficients of variation, especially for sample sizes lessthan 50 000 (Figs. 3 and 2C). Once the sample size reaches50 000, the decline in the coefficient of variation generally sta-bilizes and approaches a value of ten percent. The only excep-tion is Tsuga canadensis, in which the coefficient of variationstabilizes at values closer to fifteen percent (Fig. 2C). Con-sidering that is the pair where the coefficient of variation be-gins to stabilize, 50000 should be a sufficient sample size forboundary line development in most species. However, particu-
Figure 2. (A) Means, (8) standard deviations, and (C) the coeffi-cients of variation of maximum percent-growth change in O.S mmprior-growth classes for Tsuga canadensis. Three hundred resarn-plings were performed at each sample size.
lar caution should be given to the highest prior growth classes,which are subject to the largest coefficient of variation values.
Definitive conclusions about the necessary sample sizes ofeach species are not possible to discern from this bootstrap-ping test, and the minimum sample size of 50 000 shouldonly be considered as a rough guideline, especially for thehighest prior growth values. The tree-ring collections repre-sented in this study are far from random and may contain anumber of biases. This is especially true for collections in
205p5

Ann. For. Sci. 66 (2009) 205 B.A. Black et al.
Figure 3. Coefficients of variation of maximum percent-growth change values in 0.5 mm prior-growth classes. Three hundred resamplingswere performed at each sample size.
the American west where many dendrochronological studieswere conducted for climate reconstructions (Grissino-Mayerand Fritts, 1997; Meko et al., 1993). Selecting trees on extremesites where competition is low and the climate signal is strongcould severely complicate the calculation of species' bound-ary lines. Relatively few if any trees would show maximumrelease responses, and bootstrapping may overestimate mini-mum sample sizes necessary to develop a boundary line. Yeteven with these complications, the bootstrapping results aresomewhat consistent in suggesting a minimum sample size ofapproximately 50000 data points for boundary line develop-ment given the type of data that are typically available.
3.3. Effects of age and size
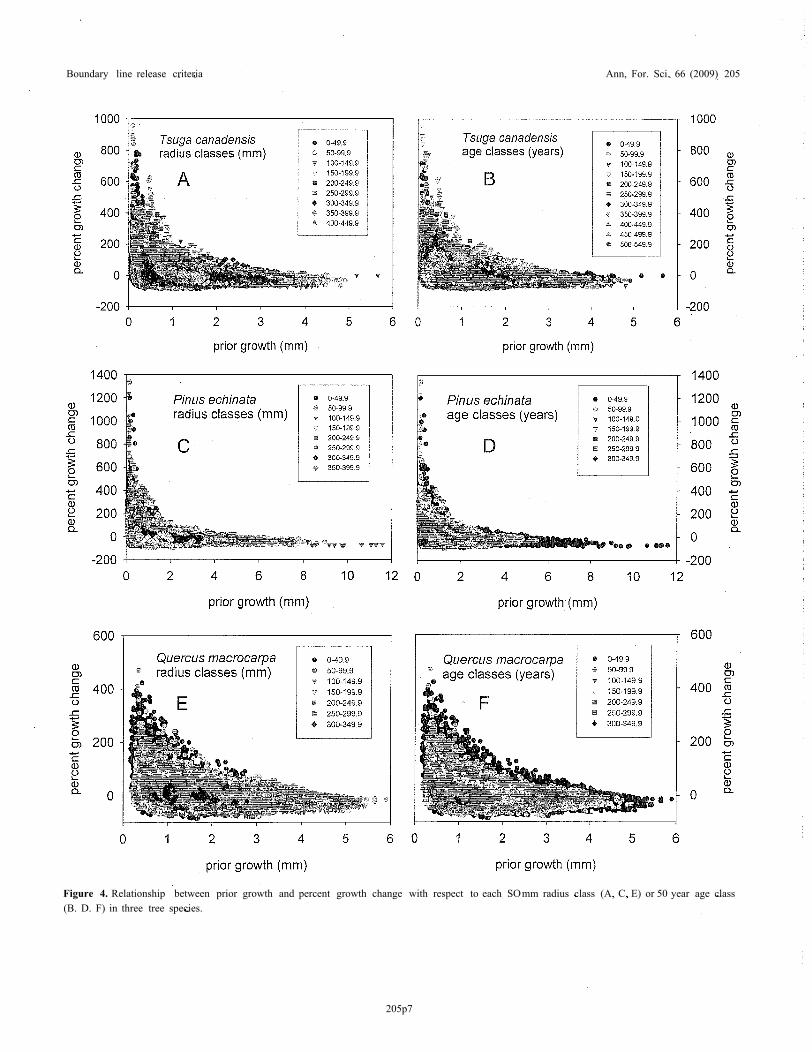
An analysis of growth patterns in these eleven North Amer-ican tree species indicates that prior growth does not fullycompensate for the effects of age or size in most species.Among the species included in this study, effects of age andsize are best mitigated in Tsuga canadensis. Percent growthchange pulses fail to reach the boundary line (values > 90 % ofthe boundary line) after the trees have reached approximately350 mm in radius or 350 years in age (Tab. I and Figs. 4A, 4B).Considering that some individuals can reach ages of 550 years,an age of 350 includes approximately 64% of the species'
205p6
Boundary line release criteria Ann, For. Sci. 66 (2009) 205
Figure 4. Relationship between prior growth and percent growth change with respect to each SOmm radius class (A, C, E) or 50 year age class(B. D. F) in three tree species.
205p7

Ann. For. Sci. 66 (2009) 205
maximum lifespan (Tab. I). Boundary line release criteria alsoappear to perform quite well at standardizing across variousage and size classes for Picea mariana (Tab. I). Yet for ma-jority of species, pulses in percent-growth change consistentlyfail to reach the prior growth boundary line at much youngerages and smaller sizes (Tab. I and Fig. 4).
In a preliminary analysis, understory tolerance appears toprovide little predictive ability as to the age or size at whicha species fails to attain percent growth change values that fallwithin 90% of the boundary line (Tab. I). In terms of abso-lute age (F = 2.47; p = 0.15) or size (F = 2.11; p = 0.18),or relative age (F = 1.86; p = 0.22) or size (F = 14.36;p = 0.002) with respect to the largest or oldest individualobserved, significant (p < 0.05) differences among the threetolerance classes only occur for relative size, according to ananalysis of variances. Shade-tolerant species may reach verylarge sizes before they are no longer able to experience re-leases that approach the boundary line (Tab. I). However, thisanalysis is rather coarse, and when the data are investigatedin more detail, the shade-intolerant species show a much moreprofound loss in ability to reach the boundary line, particularlywith increasing age. For example, when data are plotted withrespect to size and age classes, Pinus echinata and Quercusmacrocarpa show much greater declines in release potentialwith increasing age than Tsuga canadensis (Fig. 4). The abilityto attain the boundary line diminishes with increasing size andespecially age, typical of the other shade-intolerant speciesand many species intermediate in shade tolerance.
The reduction in release response of fast-growing, shade-intolerant species and the retention of release response in thevery shade-tolerant, slow growing Tsuga canadensis may re-flect adaptations to the unique environments in which eachgroup of species are most competitive. For example, the shade-intolerant species of this study tend to occupy droughty habi-tats characterized by historically high fire frequencies thatwould have reduced competition within and among species,especially among larger and older trees (Burns and Honkala,1990). On the opposite extreme, Tsuga canadensis dominatesclosed, competitive stands and is adapted to capturing the fre-quent small gaps and occasional large gaps that typify an old-growth Tsu.ga canadensis forest (Abrams et al., 2000; Dahirand Lorimer, 1996). Unlike intolerant trees, large and oldTsuga canadensis maintain considerable foliage in the under-story that can rapidly exploit any light allowed through thecanopy by gap-forming events. Age and size may affect theability of intolerant species to attain the boundary line and thisshould be thoroughly checked before applying boundary-linerelease criteria.
These age and size-related effects on maximum percent-growth change may invalidate the species-wide boundary linefor growth increments formed when trees become old andlarge. Yet before an appropriate set of methods can be devel-oped to address this problem, the causes of these failures toreach the boundary line must first be understood. One possi-bility is that competitive influences are very low during thosesegments of a tree's lifespan in which it fails to reach theboundary line. Those species with the most pronounced ageand size-related limitations in their ability to reach the bound-
B.A. Black et al.
ary line may simply experience relatively little competition.Indeed, once mature, species with severe age and size-relatedreductions in release response such as Quercus stellata or Pi-nus ponderosa are often widely spaced such that competitionis low and large portions of their crowns are exposed to di-rect light (Burns and Honkala, 1990). Even if a disturbanceoccurred in the stand, only a rather small percentage of fo-liage would be newly exposed and a minimal growth pulsewould follow. In contrast, shade-tolerant species tend to oc-cur in highly closed stands and maintain a large portion of fo-liage in the shade, even in larger, older trees. If a disturbanceoccurred under these conditions, a relatively large amount offoliage would be exposed, leading to large gains in total photo-synthesis that could result in an acceleration ofradial growth.Therefore, a growth pulse that reaches the boundary line mayrequire a substantial reduction in competition, and those treesthat stop showing maximal releases may have attained a po-sition where competitive effects are consistently low. Untilthe mechanisms behind this inability to attain the boundaryline are determined, release patterns cannot be properly inter-preted for trees once they become older or larger, especiallyfor shade-intolerant species.
Given these uncertainties as to why these larger or oldertrees fail to reach the boundary line, modifications of re-lease criteria to include these age and size classes are prema-ture. For now, size and age limits may be necessary, as hasbeen proposed in past release criteria (Lorimer and Frelich,1989; Nowacki and Abrams, 1997). Yet modifications of theboundary line approach may be possible once the responses ofolder, larger trees are better understood. If indeed the bound-aries of maximum percent-growth change are low for older,larger trees, then size or age-specific subsets of the boundaryline could be constructed to scale maximum percent-growthchange. Inclusion of growth increments from trees after theybecome old and large could increase sample size and allow formore complete release analyses in stands dominated by olderand large trees. Or once trees become old and large, they sim-ply may not be very useful for reconstructing forest distur-bances.
3.4. Potential site influences
An additional consideration in developing and applyingboundary lines is whether a single boundary line is truly rep-resentative across many sites. The most thoroughly studiedspecies to date is Tsuga canadensis in which trees from high-elevation bog forests to steep talus to broad stream valleys allapproach the boundary line if they have experienced sufficientdisturbance (Black and Abrams, 2003; 2004). However, no-table exceptions include sites ncar the northern boundaries ofthe species' range, which show unique relationships betweenprior growth and percent growth change (Black and Abrams,2004). Overall, though, the tendency of most sites to follow asingle boundary line agrees with the results in this study. Forexample, the percentage of sites that approach the boundaryline is comparable among the majority of species, generallyranging from thirty to forty percent (Tab. I). The only excep-tions are the two Picea species, in which the percentage of
205p8

Boundary line release criteria Ann.For. Sci. 66 (2009) 205
Figure 5. Relationship between prior growth and percent growth change for Pseudotsuga menziesii and Quercus alba sites. (A) Eastern portionof Quercus alba's range include Ohio, Pennsylvania, and Virginia. (B) Western Quercus alba sites include Minnesota, Iowa, and Missouri.The species-specific boundary line is shown for both species. (C) Northwest Pseudotsuga menziesii sites are located in the CascadeMountainsor Washington, Oregon, and Canada. (D) Southwestern Pseudotsuga menziesii sites are located in Arizona, New Mexico, and Mexico. Eachsymbol represents a different site.
sites that approach the boundary line is somewhat low at ap-proximately twenty percent (Tab. I). Therefore, approximatelyone third of all data sets experience disturbance capable ofeliciting a response that approaches the boundary line, or al-ternately, occupy sites that would require the development ofunique boundary lines.
In a more detailed evaluation, Quercus alba on sites fromthe eastern portion of its range (Pennsylvania, New Jersey,Ohio, and Virginia) approach the boundary line (Fig. 5A) as dothose on sites from the western portion of its range (Missouri,Iowa, and Minnesota) (Fig. 5B). Also, Pseudotsuga menziesiion sites from the Cascade Mountains of the Pacific North-west (Oregon, Washington, and Canada) approach the bound-ary line (Fig. 5C) as do sites from the mountains of Arizona,New Mexico, and Mexico (Fig. 5D). The fact that trees locatedacross broad portions of a species' range show similar level ofrelease does not resolve potential influences of site conditions.Larger data sets that include more extreme sites and detailedrecords of site conditions will be necessary to better address
the issue. Yet the existing data set provides evidence that asingle boundary line appears could potentially be applied tothe majority of locations in each species' range.
3.5. Comparisons with running mean criteria
An evaluation of Quercus prinus response to thinning treat-ments shows that scaling percent growth-change values toprior growth better reflects crown release than percent growth-change values alone (Fig. 6). In this study, maximum per-cent growth change pulses occurred within five years of thethinning treatment, as expected considering the three-year lagidentified by Rentch et al. (2003) for this same data set. Asimple linear regression of percent-growth change and crownrelease yields and R2 value of 0.27, which nearly doubles toan R2 of 0.55 when the same values are scaled to the Quercusprinus boundary line (Fig. 6). As has been shown for runningmean release criteria, the relationship between percent growthchange and degree of crown release is linear (Rentch et al.,
205p9

Ann. For. Sci. 66 (2009) 205 B.A.Black et al.
approach that utilizes time-series analysis to identify pulses,steps, and other changes in tree-ring measurement time se-ries that could represent disturbance events (Druckenbrod,2005), a "divergence method," that differentiates fine-scalefrom regional-scale disturbances (Thompson et al., 2007), andan "absolute-increase method" in which growth subsequent toan event is subtracted from growth prior to an event, indirectlyincorporating tile effects of prior growth on release responseto distinguish disturbance events (Fraver and White, 2005).These release criteria vary widely, and each was formulatedto accommodate a specific set of objectives for the speciesinvolved (Black and Abrams, 2004; Rubino and McCarthy,2004). For example, criteria may be designed to identify smallgap openings or catastrophic disturbance events, while othersmay focus upon the responses of a single species or groupof species (Black and Abrams, 2004; Rubino and McCarthy,2004). Also, release criteria may attempt to identify a singleevent in the lifespan of a tree, such as canopy accession date,or multiple events over a tree's lifetime (Lorimer and Frelich,1989; Nowacki and Abrams, 1997).
Boundary-line release criteria are an extension of theNowacki and Abrams (1997) criteria and must be interpretedaccordingly. As in the original Nowacki and Abrams (1997)criteria, boundary line releases should reflect the degree ofcrown exposure a tree experiences following a disturbanceevent, as indicated in Quercus prinus. Also, boundary linecriteria can capture multiple disturbance events from a sin-gle tree as currently formulated, though more conservativerelease thresholds may allow for detection of single majorevents, such as a canopy accession date. Limitations of thetechnique must be considered, including the failure of trees toattain the boundary line as they become old and large, partic-ularly in shade-intolerant species. Also, the large sample sizesrequired to develop boundary line criteria are a potential com-plication, but one that could be offset by utilizing the grow-ing International Tree-Ring Data Bank. Most importantly, in-tegrating prior growth into release criteria does appear to helpstandardize release events across various size and age classeswithin a species, particularly within the first half of the aver-age species' lifespan. Clear prior growth and percent-growthchange relationships exist for all species examined, allowingfor the potential development of boundary line release criteriaacross a diverse array of taxa, and facilitating more direct com-parisons of disturbance histories among sites and even amongspecies.
Acknowledgements: The authors thank Gary Miller, who estab-lished the Chestnut Ridge thinning treatment in 1982and generouslyallowedaccess to the site for this study. Wealso thank contributors tothe International Tree-Ring Data Barlie.
REFERENCES
AbramsM.D.. van de Gevel S., Dodson R.C., and CopenheaverC.A.,2000.Thedendroecologyand climaticimpactsfor old-growthwhitepine and hemlock on the extreme slopes of the BerkshireHills,Massachusetts.USA.Can. J. Bot. 78: 851-861.
Figure 6. (A) Relationship betweenpercent crown exposed and per-cent growth change (as calculated using the Nowacki and Abrams1997 formula) for Quercus prinus trees following a 1982 thinningtreatment. (B) Relationship between percent crown exposed and thesame percent growth-change values after expressing them as a per-centage of the value predicted by the Quercus prinus boundary line.
2003), which also appears to be the case for boundary-line re-lease criteria (Fig. 6). At the time of treatment (1982) averageage was 54 years (± 2 years) while average diameter was 21ern (± 3 cm), These trees were young and small enough thatage- or size-related declines in the ability to reach the Quercusprinus boundary lines did not affect their response to distur-bance (Tab. I). Yet even with this rather limited data set, theresults of this analysis support the underlying assumption thatprior growth better predicts the percent-growth change pulsethat a tree experiences following a crown release.,
4. CONCLUSIONS
In a recent review, Rubino and McCarthy (2004) iden-tify thirty novel release criteria techniques, and hundreds ofpapers in which they have been implemented. Since thattime, additional criteria have been developed, including an
205p10

Boundary line release criteria
Abrams M.D .. Copenheaver C.A., Black B.A., and van de Gevel S., 2001.Dendroecology and climatic impacts for a relict, old-growth, bog for-est in the Ridge and Valley Province of central Pennsylvania, USA.Can. J. Bot. 79: 58-69.
Black B.A. and Abrams M.D., 2003. Use of boundary-line growth pat-terns as a basis for dendroecological release criteria. Eco!. Appl. 13:1733-1749.
Black B.A. and Abrams M.D., 2004. Development and application ofboundary-line release criteria. Dendrochronologia 22: 31-42.
Burns R.M. and Honkala B.H" 1990. Silvics of N0l1h America, U.S.Dept. of Agriculture, Forest Service, Washington, D.C.
Cade B.S. and Noon B.R., 2003. A gentle introduction to quantile regres-sion for ecologists. Front. Ecol. Environ. 1: 412-420.
Dahir S.E. and Lorimer CiG; 1996. Variation in canopy gap formationamong developmental stages of northern hardwood stands. Can. 1For. Res. 26: 1875-1892.
Druckenbrod D.L., 2005. Dendroecological reconstructions of forest dis-turbance history using time-series analysis with intervention detec-tion. Can. J. For. Res. 35: 868-876.
Forrester JA., Leopold DJ., and Art H.W., 2007. Disturbance historyand mortality patterns in a rare Atlantic barrier island maritime hollyforest. Nat. Area. J. 27: 169-182.
Fraver S. and White A.S., 2005. Identifying growth releases in den-drochronological studies of forest disturbance. Can. J. For. Res. 35:1648-1656.
Grissino-Mayer B.D. and Fritts H.e., 1997. The International Tree-RingData Bank: An enhanced global database serving the global scientificcommunity. Holocene 7: 235-238.
Lafon C.W. and Speer J.H., 2002. Using dendrochronology to identifymajor ice storm events in oak forests of southwestern Virginia. Clim.Res. 20: 41-54.
Lorimer C.G, and Frelich L.E., 1989. A Methodology for EstimatingCanopy Disturbance Frequency and Intensity in Dense TemperateForests. Can. J. For. Res. 19: 651-663.
Meko D., Cook E.R., Stahle D.W., Stockton C.W., and Hughes M.K.,1993. Spatial patterns of tree-growth anomalies in the United-Statesand southeastern Canada. J. Climate 6: 1773-1786.
Nagel T.A., Levanic T., and Diaci J., 2007. A dendroecological re-construction of disturbance in an old-growth Fagus-Abies forest inSlovenia. Ann. For. Sci. 64: 891-897.
Ann. For. Sci. 66 (2009) 205
Nowacki G.J. and Abrams M.D., 1997. Radial-growth averaging crite-ria for reconstructing disturbance histories from presettlement-originoaks. Ecol. Monogr. 67: 225-249.
Rentch J.S., Desta E, and Miller G.W., 2002. Climate, canopy distur-bance, and radial growth averaging in a second-growth mixed-oakforest in West Virginia, USA. Can. 1For. Res. 32: 915-927.
Rentch J.S., Fajvan M.A., and Hicks R.R., 2003. Oak establishment andcanopy accession strategies in five old-growth stands in the centralhardwood forest region. For. Eco!. Manage. 184: 285-297.
Rozas V. 2003. Regeneration patterns, dendroecology. and forest-use his-tory in an old-growth beech-oak lowland forest in Northern Spain.for. Ecol. Manage. 182: 175-194.
Rubino D.L. and McCarthy B.C., 2004. Comparative analysis ofdendroecclogical methods used to assess disturbance events.Dendrochronologia 21: 97-115.
Ruffner C.M. and Abrams M.D .• 1998. Relating land-use history and cli-mate to the dendroecology of a 326-year-old Quercus prinus talusslope forest. Can. J For. Res. 28: 347-358.
Schuler T.M. and Fajvan M.A., 1999. Understory tree characteristics anddisturbance history of a Central Appalachian forest prior to old-growth harvesting, USDA Forest Service. Washington, DC.
Shumway D.L.. Abrams M.D., and Ruffner e.M., 2001. A 400-year his-tory of fire and oak recruitment in an old-growth oak forest in westernMaryland. USA. Can. J For. Res. 31: 1437-1443.
Speer .LH., Swetnam T.W .• Wickman B.E., and Youngblood A., 2001.Changes in pandora moth outbreak dynamics during the past 622years. Ecology 82: 679-697.
Splechtna RE .• Gratzer G .• and Black B.A.. 2005. Disturbance historyof a European old-growth mixed-species forest - A spatial dendro-ecological analysis. J Veg. Sci. 16: 511-522.
Thompson R.D., Daniels L.D., and Lewis K.J., 2007. A new dendroeco-logical method to differentiate growth responses to fine-scale distur-bance from regional-scale environmental variation. Can. J For. Res.37: 1034-1043.
Webster C.R. and Jensen N.R., 2007. A shift in the gap dynamics ofBetula alleghaniensis in response to single-tree selection. Can. J. For.Res. 37: 682-689.
Winter L.E., Brubaker L.B., Franklin J.E, Miller E.A., and DeWitt D.Q.,2002. Canopy disturbances over the five-century lifetime of an olcl-growth Douglas-fir stand in the Pacific Northwest. Can. J. For. Res.32: 1057-1070.

Ann. For. Sci. 66 (2009) 205
Online Material
2 B.A. Black et al., Online Material
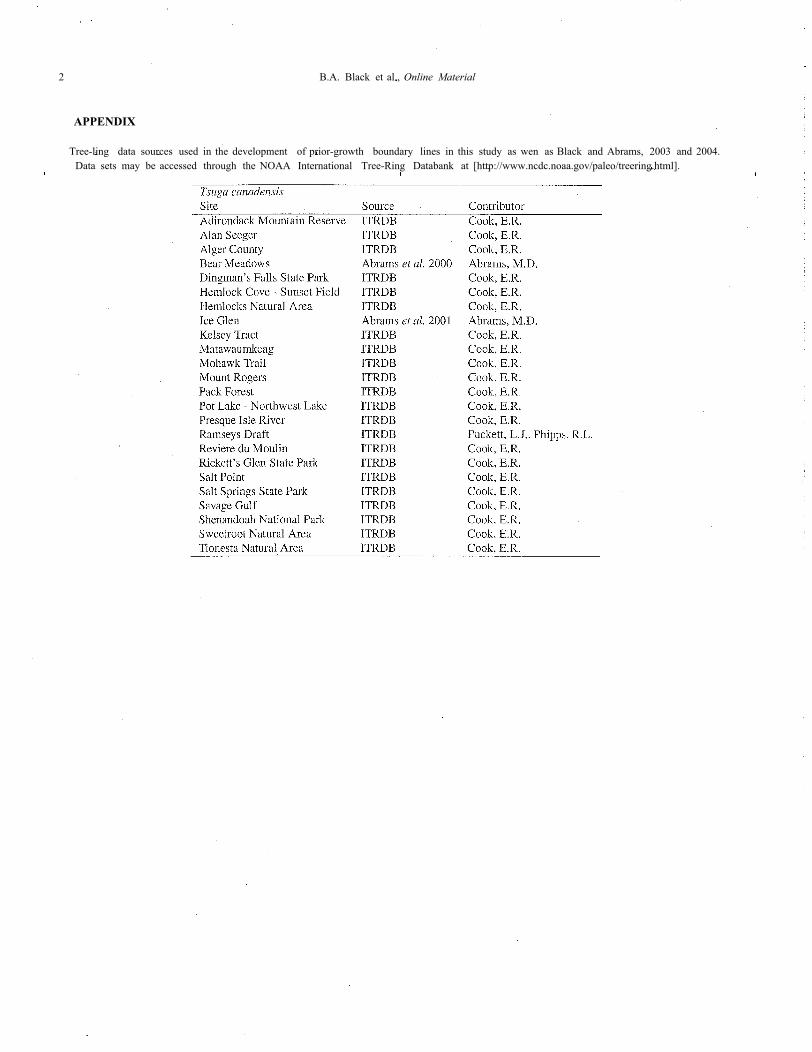
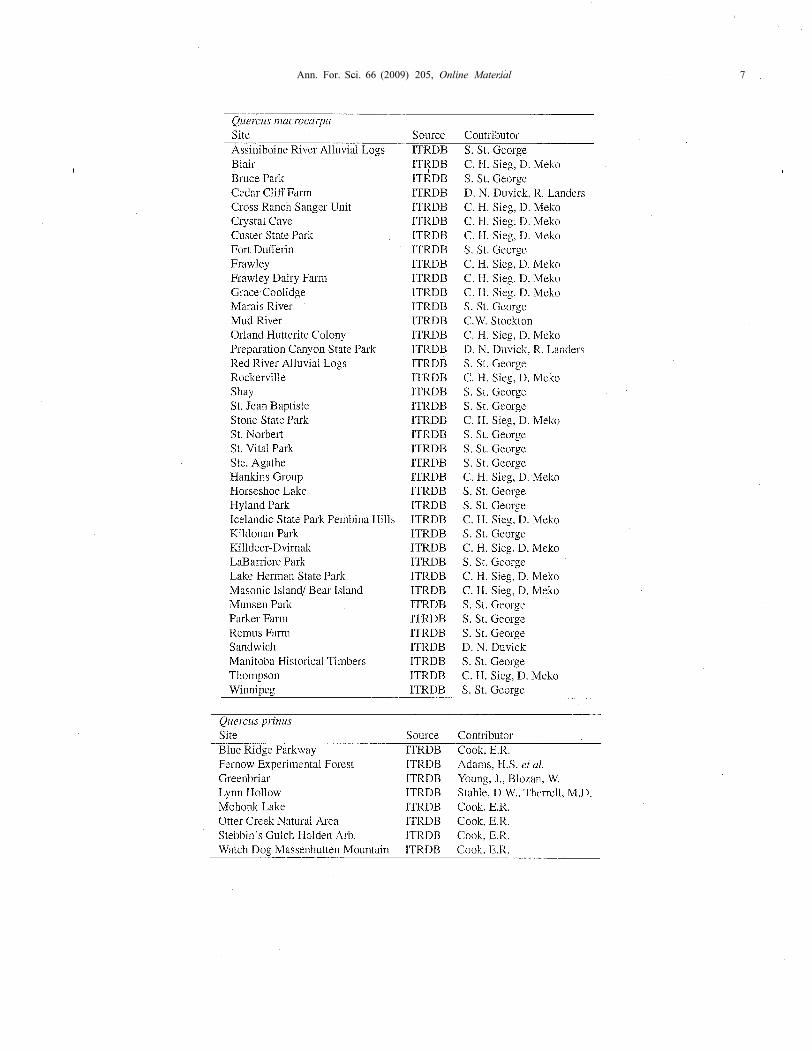
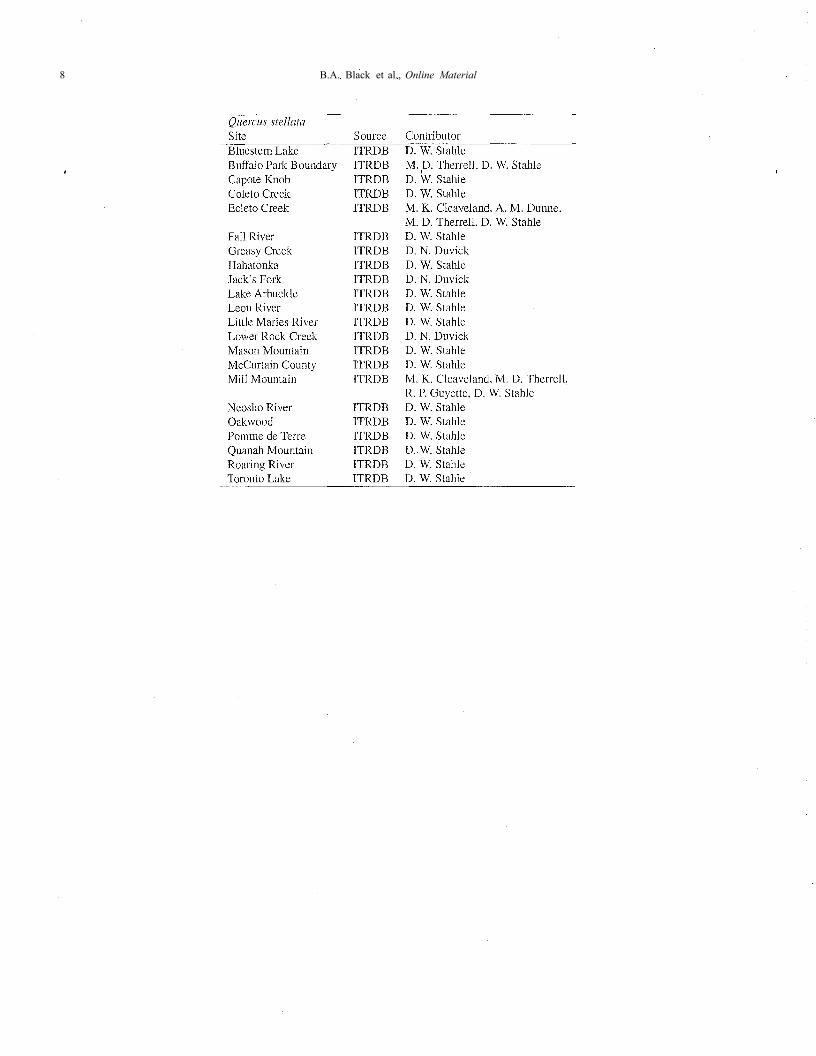
APPENDIX
Tree-ling data sources used in the development of prior-growth boundary lines in this study as wen as Black and Abrams, 2003 and 2004.Data sets may be accessed through the NOAA International Tree-Ring Databank at [http://www.ncdc.noaa.gov/paleo/treering.html].

Ann, For. Sci, 66 (2009) 205, Online Material 3

4 B.A. Black et al., Online Material

Ann. For. Sci. 66 (2009) 205, Online Material 5

6 B.A. Black et al., Online Material
Ann. For. Sci. 66 (2009) 205, Online Material 7
8 B.A. Black et al., Online Material