promoting inclusive growth in arab … inclusive growth in arab countries rural and regional...
TRANSCRIPT
PROMOTING INCLUSIVE GROWTH IN ARAB COUNTRIESRURAL AND REGIONAL DEVELOPMENT AND INEQUALITY IN TUNISIA
Mongi Boughzala Mohamed Tlili Hamdi
GLOBAL ECONOMY & DEVELOPMENT
WORKING PAPER 71 | FEBRUARY 2014
Global Economyand Developmentat BROOKINGS
Global Economyand Developmentat BROOKINGS
Mongi Boughzala is a professor of economics at the
University of Tunis El Manar.
Mohamed Tlili Hamdi is an associate professor of eco-
nomics at the University of Sfax in Tunisia.
Acknowledgements:
We would like to thank all of those in Sidi Bouzid and Le Kef who provided us with precious data and information.
We also thank Hafez Ghanem and Michael Rettig for their excellent comments on earlier versions of the paper.
We also benefited from discussions with the people we met at the workshops on regional development organized
by the GIZ in Sidi Bouzid and le Kef.
Abstract:
Regional disparities and inequality between the rural and the urban areas in Tunisia have been persistently large
and perceived as a big injustice. The main regions that did not receive an equitable share from the country’s eco-
nomic growth, as compared to the coastal regions that are highly urbanized, are the predominantly rural western
regions. Their youth often have to migrate to the cities to look for work and most of them end up with low-paying
and frustrating jobs in the informal sector. The more educated among them face a very uncertain outlook and
the highest rate of unemployment. This bias is strongest for female workers and university graduates living in
the poor rural regions. The purpose of this paper is to study the underlying causes and factors of these dispari-
ties and to discuss policies and measures that may allow these regions to benefit from faster and more inclusive
growth.
Regional disparities do not mean that Tunisia’s rural regions remain totally backwards or that nothing has been
achieved in the poorer regions. Actually, over the previous five decades various governmental programs and
projects were implemented in these regions—in particular in the area of education. But the government efforts in
the western regions were much less substantive than they were in the rest of the country, and little was done to
develop modern non-agricultural economic activities. Moreover, while the democratization of education was not
successful in ensuring job growth, it was critical in raising the level of awareness about regional disparities and
the urban/rural economic gap.
Inadequate government investment is not the only factor responsible for Tunisia’s rural poverty. The scarcity of
natural resources (mainly water), the distribution of land and the limited access to financial resources are among
the other important structural economic constraints facing agricultural development.
Two regions are studied in more detail, namely Sidi Bouzid in the midwest and Le Kef in the northwest. We also
give an overview of best international practices and the literature on economic development, with a focus on the
case of South Korea and Taiwan in order to draw relevant lessons.
We argue that, while it is possible to boost productivity and income for the rural population in Tunisia’s poor
regions, improving productivity in agriculture is part of the solution. However, it cannot ensure a decent liveli-
hood for all of Tunisia’s rural population, in particular for the impoverished Tunisians that own small farms or
are almost landless. Regional development requires major structural reforms and strategies and comprehensive
government-initiated programs operated within a holistic framework that combines public and private interven-
tions. In the case of some regions with limited resources, such as Sidi Bouzid, this will not be sufficient; inevitably,
rural to urban exodus and migration to other regions will continue. Politically, this may be hard to accept and to
include in political agendas.
CONTENTS
Introduction . . . . . . . . . . . . . . . . . . . . . . . . . . . . . . . . . . . . . . . . . . . . . . . . . . . . . . . . . . . . . . . . . . . . . . . . . . .1
Regional and Rural Development and Disparities in Tunisia: An Overview . . . . . . . . . . . . . . . . . . . . . 4
Unequal Progress and Development . . . . . . . . . . . . . . . . . . . . . . . . . . . . . . . . . . . . . . . . . . . . . . . . . . 4
Income Inequality and Poverty . . . . . . . . . . . . . . . . . . . . . . . . . . . . . . . . . . . . . . . . . . . . . . . . . . . . . . . 8
Development Challenges and Potential in Two Tunisian Rural Governorates: Le Kef and Sidi Bouzid . . . . . . . . . . . . . . . . . . . . . . . . . . . . . . . . . . . . . . . . . . . . . . . . . . . . . . . . . . . . . . . . . . . . . . . . . . 12
Sidi Bouzid . . . . . . . . . . . . . . . . . . . . . . . . . . . . . . . . . . . . . . . . . . . . . . . . . . . . . . . . . . . . . . . . . . . . . . . 12
Fairly Effective Rural Development Programs and Forgotten Youth . . . . . . . . . . . . . . . . . . . . 12
Natural Resources . . . . . . . . . . . . . . . . . . . . . . . . . . . . . . . . . . . . . . . . . . . . . . . . . . . . . . . . . . . . . . . 14
Government Services . . . . . . . . . . . . . . . . . . . . . . . . . . . . . . . . . . . . . . . . . . . . . . . . . . . . . . . . . . . 18
Le Kef . . . . . . . . . . . . . . . . . . . . . . . . . . . . . . . . . . . . . . . . . . . . . . . . . . . . . . . . . . . . . . . . . . . . . . . . . . . 20
Population and Labor Force Capacities . . . . . . . . . . . . . . . . . . . . . . . . . . . . . . . . . . . . . . . . . . . . . 21
Rural and Agricultural Development in Le Kef . . . . . . . . . . . . . . . . . . . . . . . . . . . . . . . . . . . . . . . 24
Development Institutions and the ODESYPANO Experience . . . . . . . . . . . . . . . . . . . . . . . . . . . 28
Lessons from International Experiences . . . . . . . . . . . . . . . . . . . . . . . . . . . . . . . . . . . . . . . . . . . . . . . . . 31
Alternative Policies and Recommendations . . . . . . . . . . . . . . . . . . . . . . . . . . . . . . . . . . . . . . . . . . . . . . 34
References . . . . . . . . . . . . . . . . . . . . . . . . . . . . . . . . . . . . . . . . . . . . . . . . . . . . . . . . . . . . . . . . . . . . . . . . . . 35
Endnotes . . . . . . . . . . . . . . . . . . . . . . . . . . . . . . . . . . . . . . . . . . . . . . . . . . . . . . . . . . . . . . . . . . . . . . . . . . . . 36
LIST OF TABLES
Table 1: Tunisia’s Labor Force by Level of Education, 1966-2011 (% of total labor force) . . . . . . . . . 5
Table 2: Tunisia’s Labor Force by Region and Level of Education, 2010 (Number of People) . . . . . . 5
Table 3: Tunisia’s Labor Force by Region and Level of Education, 2010 (%) . . . . . . . . . . . . . . . . . . . . 5
Table 4: Tunisians’ Access to Basic Infrastructure by Year (% total population) . . . . . . . . . . . . . . . . 6
Table 5: Distribution of Industrial Activities by Region (enterprises with more than 10 employees) 6
Table 6: Per Capita Consumption in Tunisia by Region, 2010 (2005 Tunisian dinars) . . . . . . . . . . . . 8
Table 7: Per Capita Consumption in Tunisia by Region (2005 Tunisian dinars) . . . . . . . . . . . . . . . . . 8
Table 8: Per Capita Consumption in Tunisia by Urban and Rural (2005 Tunisian dinars) . . . . . . . . . 9
Table 9: Poverty Rate in Tunisia: By Location and Year (%) . . . . . . . . . . . . . . . . . . . . . . . . . . . . . . . . . . 9
LIST OF FIGURES
Figure 1: Geographic Concentration of Tunisia’s Employment Opportunities, 2010 . . . . . . . . . . . . . . 7
Figure 2: Poverty Rate in Tunisia: By Region and Year (%) . . . . . . . . . . . . . . . . . . . . . . . . . . . . . . . . . 10
Figure 3: Map of Sidi Bouzid Governorate, Tunisia . . . . . . . . . . . . . . . . . . . . . . . . . . . . . . . . . . . . . . . . . 13
Figure 4: Distribution of Irrigated Land and Major Aquifers in Sidi Bouzid . . . . . . . . . . . . . . . . . . . . 16
Figure 5: Map of Le Kef Governorate, Tunisia . . . . . . . . . . . . . . . . . . . . . . . . . . . . . . . . . . . . . . . . . . . . . 20
Figure 6: Population Growth of Le Kef, 2007-2012 . . . . . . . . . . . . . . . . . . . . . . . . . . . . . . . . . . . . . . . . 22
Figure 7: Decreasing Unemployment in Le Kef, 2007-2012 (% total population) . . . . . . . . . . . . . . . 23
Figure 8: Distribution of Holdings by Size, 2012 (%) . . . . . . . . . . . . . . . . . . . . . . . . . . . . . . . . . . . . . . . 27
Table 10: Poverty Rate in Tunisia: By Region and Year (%) . . . . . . . . . . . . . . . . . . . . . . . . . . . . . . . . . . 9
Table 11: Unemployment Rate in Tunisia by Region and Education Level, 2010 (%) . . . . . . . . . . . . . 11
Table 12: Irrigated Land in Tunisia, 1995-2012 (hectares) . . . . . . . . . . . . . . . . . . . . . . . . . . . . . . . . . . . 14
Table 13: Water Resources in Sidi Bouzid . . . . . . . . . . . . . . . . . . . . . . . . . . . . . . . . . . . . . . . . . . . . . . . . . 15
Table 14: Distribution of Farm Land in Sidi Bouzid, 1994-2004 . . . . . . . . . . . . . . . . . . . . . . . . . . . . . . .17
Table 15: Distribution of Irrigated Land in Sidi Bouzid by Size of the Holdings, 2005 . . . . . . . . . . .17
Table 16: Labor Force by Education Level in Sidi Bouzid, 2010 (%) . . . . . . . . . . . . . . . . . . . . . . . . . . 19
Table 17: Farmers by Education Level in Sidi Bouzid, 2005 (%) . . . . . . . . . . . . . . . . . . . . . . . . . . . . . 19
Table 18: Farmers by Education Level in Tunisia, 1996 . . . . . . . . . . . . . . . . . . . . . . . . . . . . . . . . . . . . . 19
Table 19: Population Growth of Le Kef, 2007-2012 . . . . . . . . . . . . . . . . . . . . . . . . . . . . . . . . . . . . . . . . . 21
Table 20: Labor Participation and Unemployment in Le Kef, 2007-2012 . . . . . . . . . . . . . . . . . . . . . 23
Table 21: Unemployment Rates of Youth and Women in Le Kef, 2010 (%) . . . . . . . . . . . . . . . . . . . . . 24
Table 22: Land Distribution by Farming Mode in le Kef and Sidi Bouzid, 2005 (holdings) . . . . . . 26
Table 23: Distribution of Holdings by Size in le Kef, 2005 . . . . . . . . . . . . . . . . . . . . . . . . . . . . . . . . . . 26
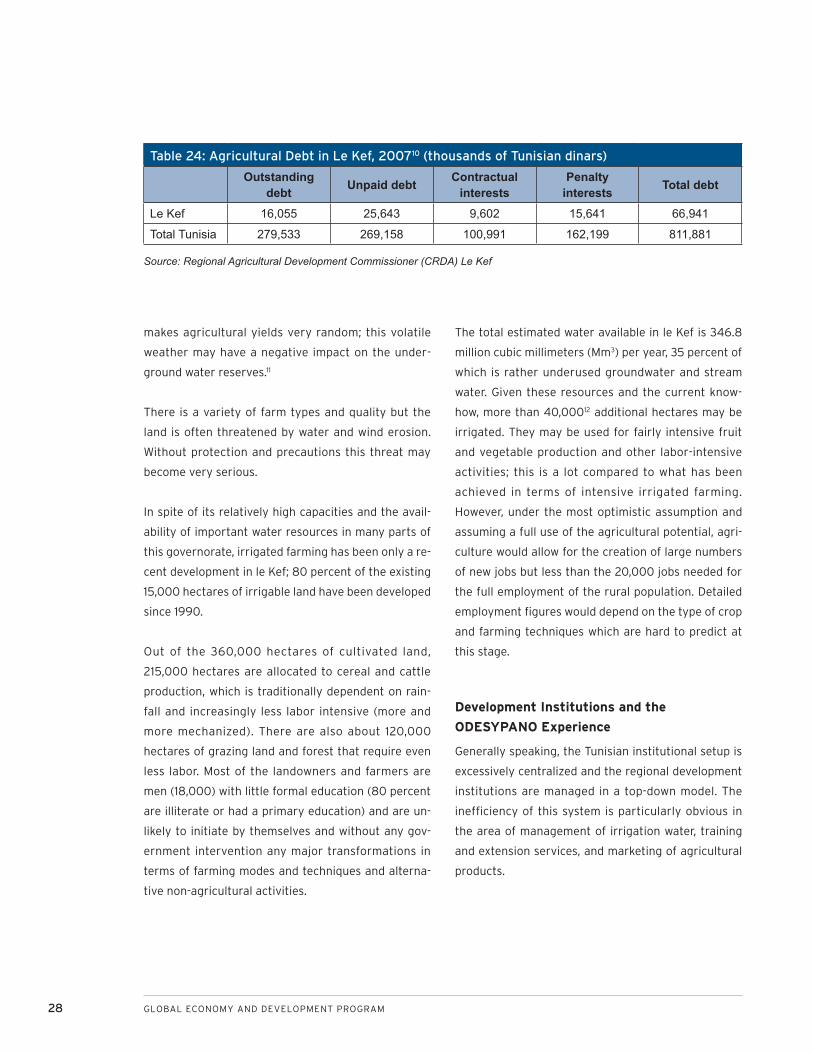
Table 24: Agricultural Debt in Le Kef, 2007 (thousands of Tunisian dinars) . . . . . . . . . . . . . . . . . . . 28
Table 25: Water Resources and their Use in Le Kef, 2012 (Mm3) . . . . . . . . . . . . . . . . . . . . . . . . . . . . . 29
Table 26: Water Erosion in Le Kef, 2003 . . . . . . . . . . . . . . . . . . . . . . . . . . . . . . . . . . . . . . . . . . . . . . . . . 29
PROMOTING INCLUSIVE GROWTH IN ARAB COUNTRIES: RURAL AND REGIONAL DEVELOPMENT AND INEQUALITY IN TUNISIA 1
PROMOTING INCLUSIVE GROWTH IN ARAB COUNTRIESRURAL AND REGIONAL DEVELOPMENT AND INEQUALITY IN TUNISIA
Mongi Boughzala and Mohamed Tlili Hamdi
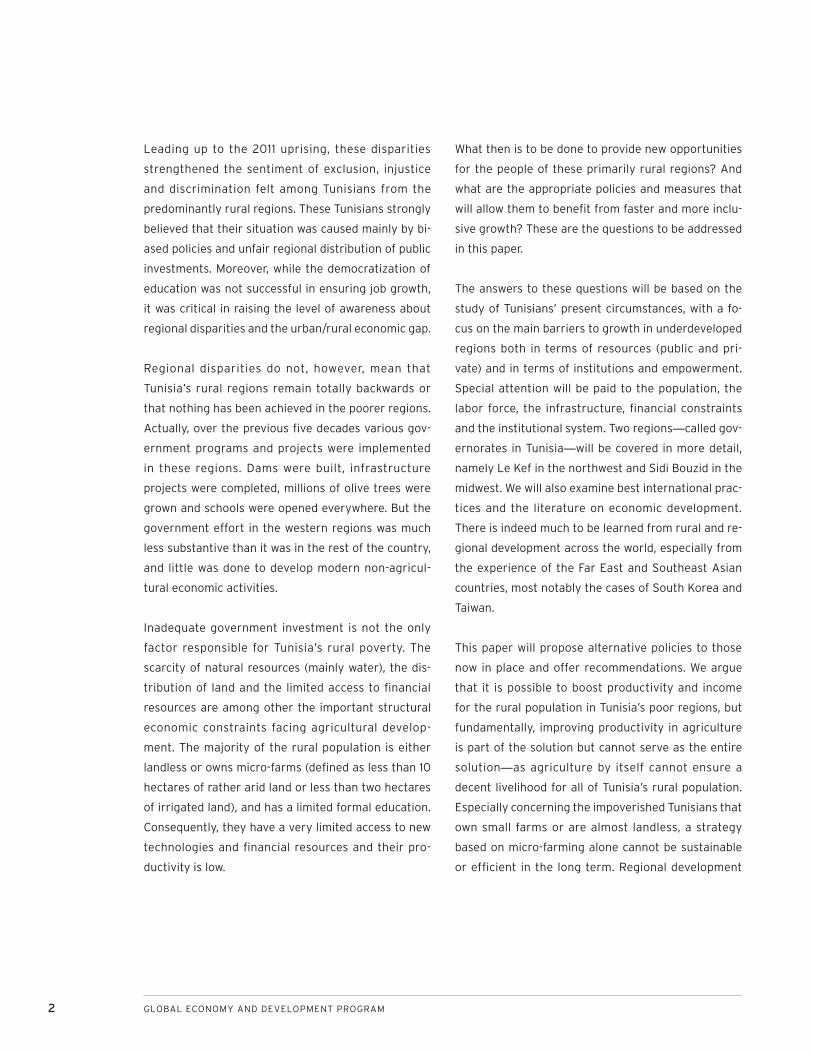
INTRODUCTION
The January 2011 uprising in Tunisia was about jobs
and justice for all regions of the country. Although
some indicators suggest that overall inequality and
poverty have decreased in Tunisia over the last five de-
cades and that the size of the middle class has grown,
by 2011 regional disparities and inequality between the
rural and the urban areas had become unacceptable.
Regional disparities have been persistently large in
Tunisia and perceived as a big injustice. The country’s
rural regions, mostly located in the western part of the
country, did not receive an equitable share of benefits
from the country’s economic growth as compared to
the coastal regions. Some areas have benefited very
little. Youth originating from the poor rural areas of-
ten have to migrate to the cities to look for work and
most of them end up with low-paying and frustrating
jobs in the informal sector. The more educated among
them feel even more politically and economically ex-
cluded, because they face a very uncertain outlook
and the highest rate of unemployment.
Tunisia’s poorer regions are predominantly rural and
their economies are much less diversified. Agriculture
remains the main economic sector in these areas and
offers only low-productivity and low-pay employment.
As a result, the per capita income in these regions is
around half that of the wealthiest regions, and the
poverty rate is three times higher.
Although Tunisia has made some important progress
building women’s rights, gender bias is another seri-
ous concern that is more prevalent in rural areas.
However, there are many promising statistics too.
Girls have equal access to schools at all levels and in
basically all regions. The absolute number of female
students has outgrown that of males. And more than
60 percent of university graduates are females. Yet
the rate of female participation in the labor force re-
mains low. Only 26 percent of Tunisian females partici-
pated in the country’s labor market in 2011, compared
to 70 percent of males. The female unemployment
rate is also much higher—nearly twice the rate for
males—and when employed, they often receive lower
pay. This bias is strongest for female workers and uni-
versity graduates living in the poor rural regions in the
west of the country. Female participation in agricul-
tural employment is relatively high, but such employ-
ment is most often unpaid family work or seasonal
work with the lowest wages in the country.
2 GLOBAL ECONOMY AND DEVELOPMENT PROGRAM
Leading up to the 2011 uprising, these disparities
strengthened the sentiment of exclusion, injustice
and discrimination felt among Tunisians from the
predominantly rural regions. These Tunisians strongly
believed that their situation was caused mainly by bi-
ased policies and unfair regional distribution of public
investments. Moreover, while the democratization of
education was not successful in ensuring job growth,
it was critical in raising the level of awareness about
regional disparities and the urban/rural economic gap.
Regional disparities do not, however, mean that
Tunisia’s rural regions remain totally backwards or
that nothing has been achieved in the poorer regions.
Actually, over the previous five decades various gov-
ernment programs and projects were implemented
in these regions. Dams were built, infrastructure
projects were completed, millions of olive trees were
grown and schools were opened everywhere. But the
government effort in the western regions was much
less substantive than it was in the rest of the country,
and little was done to develop modern non-agricul-
tural economic activities.
Inadequate government investment is not the only
factor responsible for Tunisia’s rural poverty. The
scarcity of natural resources (mainly water), the dis-
tribution of land and the limited access to financial
resources are among other the important structural
economic constraints facing agricultural develop-
ment. The majority of the rural population is either
landless or owns micro-farms (defined as less than 10
hectares of rather arid land or less than two hectares
of irrigated land), and has a limited formal education.
Consequently, they have a very limited access to new
technologies and financial resources and their pro-
ductivity is low.
What then is to be done to provide new opportunities
for the people of these primarily rural regions? And
what are the appropriate policies and measures that
will allow them to benefit from faster and more inclu-
sive growth? These are the questions to be addressed
in this paper.
The answers to these questions will be based on the
study of Tunisians’ present circumstances, with a fo-
cus on the main barriers to growth in underdeveloped
regions both in terms of resources (public and pri-
vate) and in terms of institutions and empowerment.
Special attention will be paid to the population, the
labor force, the infrastructure, financial constraints
and the institutional system. Two regions—called gov-
ernorates in Tunisia—will be covered in more detail,
namely Le Kef in the northwest and Sidi Bouzid in the
midwest. We will also examine best international prac-
tices and the literature on economic development.
There is indeed much to be learned from rural and re-
gional development across the world, especially from
the experience of the Far East and Southeast Asian
countries, most notably the cases of South Korea and
Taiwan.
This paper will propose alternative policies to those
now in place and offer recommendations. We argue
that it is possible to boost productivity and income
for the rural population in Tunisia’s poor regions, but
fundamentally, improving productivity in agriculture
is part of the solution but cannot serve as the entire
solution—as agriculture by itself cannot ensure a
decent livelihood for all of Tunisia’s rural population.
Especially concerning the impoverished Tunisians that
own small farms or are almost landless, a strategy
based on micro-farming alone cannot be sustainable
or efficient in the long term. Regional development
PROMOTING INCLUSIVE GROWTH IN ARAB COUNTRIES: RURAL AND REGIONAL DEVELOPMENT AND INEQUALITY IN TUNISIA 3
requires major structural reforms and strategies and
comprehensive government-initiated programs oper-
ated within a holistic framework that combines public
and private interventions. These programs have to
integrate public infrastructure, training and capac-
ity development, marketing, financial resources and
institutional reforms. Coordination among all these
dimensions is primarily the responsibility of Tunisia’s
government, though development efforts could surely
remain market-friendly and have a participative ap-
proach. However, because these development pro-
grams must efficiently use resources in order to be
sustainable, and because some regions with limited
resources may be unable to operate such programs,
it is unlikely—even in the long run—that all areas of
Tunisia will be able to provide enough quality employ-
ment opportunities to their residents and youth.
Inevitably, more rural Tunisians will eventually mi-
grate—either within the same region or between
regions. In some cases, migration between regions
is likely to remain the main stabilizing mechanism.
Politically, this will not be an easy sell, as all of
Tunisia’s governorates claim that they are entitled to
equal shares of government programs.
This study will be organized in four sections. The first
section will give an overview of regional and rural de-
velopment and disparities in Tunisia. It will examine
indicators concerning population, public investment
in education, infrastructure, natural resources and fi-
nancial resources. This section will illustrate the over-
all situation and the main factors underlying regional
disparities in Tunisia. The second section will focus on
Tunisia’s Kef and Sidi Bouzid governorates and rural
development. This section will also address specific
causes of rural poverty and barriers to development
and youth employment. The third section briefly re-
views regional and rural development in Asian coun-
tries in order to draw relevant lessons. Finally, the
fourth section concludes and suggests policy recom-
mendations.
4 GLOBAL ECONOMY AND DEVELOPMENT PROGRAM
REGIONAL AND RURAL DEVELOPMENT AND DISPARITIES IN TUNISIA: AN OVERVIEW
Development plans started in Tunisia in the early
1960s shortly after its independence,1 but little atten-
tion was paid by these plans to regional development
issues. Later, attempts were made to integrate the
geographic and regional dimensions into the develop-
ment planning process, but these were minimal and
inefficient—the approaches remained primarily mac-
roeconomic and sectoral. Moreover, the Tunisian gov-
ernment has always been very centralized and biased
in favor of the coastal cities. The eastern regions and
cities kept attracting more public investment because,
for historical reasons2 compounded by the lack of de-
mocracy, the western regions were politically under-
represented. The strongest lobbies in Tunisia came
from the east coast, and they systematically pushed
for more investments in their regions while neglecting
the other regions. It took at least 20 years before the
first regional development programs were launched
and more than 30 years for the government to admit
that the benefits of growth were unequally distributed
among regions. Some actions were taken starting in
the 1980s, mainly in the form of integrated develop-
ment programs, but these were not enough to change
the main resource-allocation mechanisms or signifi-
cantly reduce the level of inequality. Many institutions
were created for the sake of regional development,
but none of them could initiate and implement major
comprehensive plans for the poor regions.
Unequal Progress and Development
The regional disparities found in Tunisia do not mean
that nothing was achieved in the western regions;
rather, they reflect that the poor western regions re-
ceived an unequal share of the development process.
In accordance with the Lipsetian theory,3 which ar-
gues that democracy is “secreted out of dictatorship
by economic development,” the poorer regions could
rebel and ask for a more equitable and democratic
system only after reaching a threshold of develop-
ment. Substantial progress was actually achieved
everywhere in the area of education, health and other
public utilities and basic services. By 2010, Tunisia’s
illiteracy rate had dropped to less than 22 percent—
including in the western regions—and around half of
the population aged 10 years or more had a secondary
or higher education. This compares favorably to the
early 1960s, when the illiteracy rate was more than 65
percent and more than 90 percent of the population
had little or no education. There was virtually uni-
versal access not only to education but also to water,
electricity and basic health care in all urban areas and
in a large extent of rural areas, and the transporta-
tion and communication infrastructure was also much
more developed than in the 1960s. In short, the gov-
ernment invested in all regions, but simply less so in
the western ones.
Starting in the 1990s, the Tunisian government
showed increased interest in regional development.
Development plans and documents from the time
show that cutting regional disparities was a govern-
ment priority. However, the public resources allocated
to the poorer regions and the strategies adopted to
reach the stated goals were insufficient. The distri-
bution of investment remained weighted toward the
more powerful regions. Private investment, which
depends on the level and quality of public invest-
ment, was also much lower in the western regions.
Investment laws and fiscal incentives offered to at-
tract private investors toward Tunisia’s poor regions
had little effect on investments. This was further
aggravated by the excessive centralization of the
government system and more generally by the poor
PROMOTING INCLUSIVE GROWTH IN ARAB COUNTRIES: RURAL AND REGIONAL DEVELOPMENT AND INEQUALITY IN TUNISIA 5
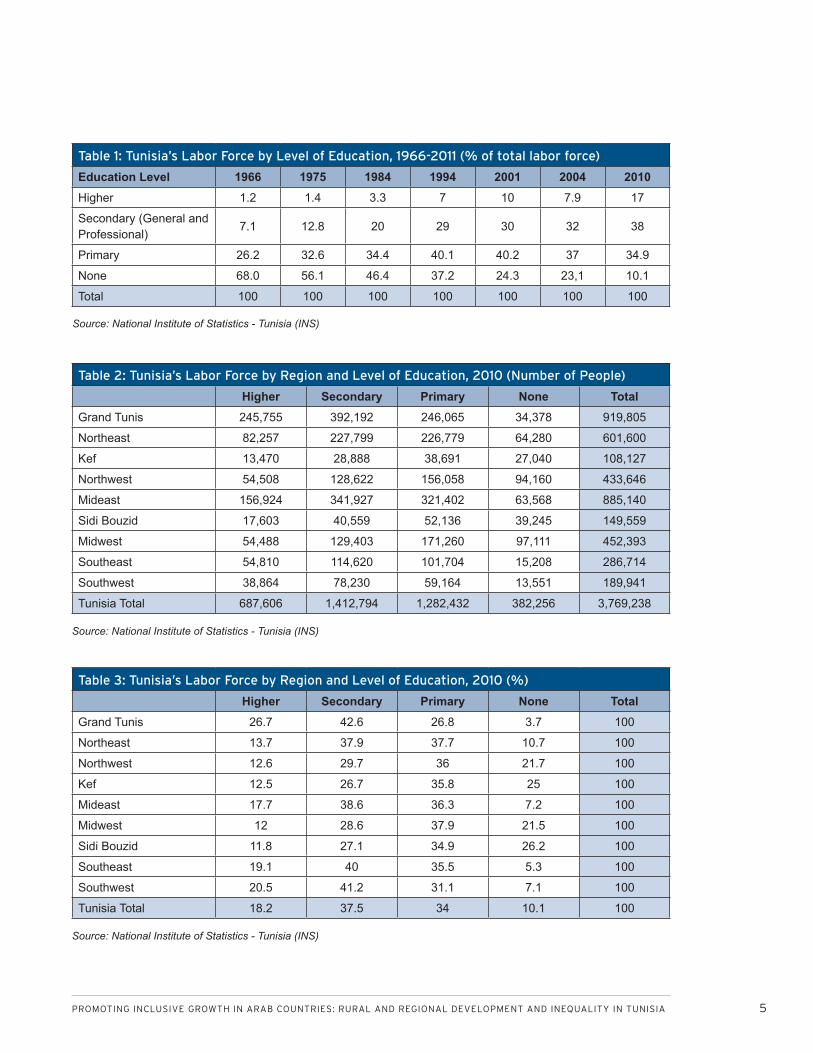
Table 1: Tunisia’s Labor Force by Level of Education, 1966-2011 (% of total labor force)
Education Level 1966 1975 1984 1994 2001 2004 2010Higher 1.2 1.4 3.3 7 10 7.9 17
Secondary (General and Professional)
7.1 12.8 20 29 30 32 38
Primary 26.2 32.6 34.4 40.1 40.2 37 34.9
None 68.0 56.1 46.4 37.2 24.3 23,1 10.1
Total 100 100 100 100 100 100 100
Table 2: Tunisia’s Labor Force by Region and Level of Education, 2010 (Number of People)
Higher Secondary Primary None TotalGrand Tunis 245,755 392,192 246,065 34,378 919,805
Northeast 82,257 227,799 226,779 64,280 601,600
Kef 13,470 28,888 38,691 27,040 108,127
Northwest 54,508 128,622 156,058 94,160 433,646
Mideast 156,924 341,927 321,402 63,568 885,140
Sidi Bouzid 17,603 40,559 52,136 39,245 149,559
Midwest 54,488 129,403 171,260 97,111 452,393
Southeast 54,810 114,620 101,704 15,208 286,714
Southwest 38,864 78,230 59,164 13,551 189,941
Tunisia Total 687,606 1,412,794 1,282,432 382,256 3,769,238
Table 3: Tunisia’s Labor Force by Region and Level of Education, 2010 (%)
Higher Secondary Primary None TotalGrand Tunis 26.7 42.6 26.8 3.7 100
Northeast 13.7 37.9 37.7 10.7 100
Northwest 12.6 29.7 36 21.7 100
Kef 12.5 26.7 35.8 25 100
Mideast 17.7 38.6 36.3 7.2 100
Midwest 12 28.6 37.9 21.5 100
Sidi Bouzid 11.8 27.1 34.9 26.2 100
Southeast 19.1 40 35.5 5.3 100
Southwest 20.5 41.2 31.1 7.1 100
Tunisia Total 18.2 37.5 34 10.1 100
Source: National Institute of Statistics - Tunisia (INS)
Source: National Institute of Statistics - Tunisia (INS)
Source: National Institute of Statistics - Tunisia (INS)
6 GLOBAL ECONOMY AND DEVELOPMENT PROGRAM
business environment. In such an environment, in-
formal and sometimes corrupt institutions emerged
to fill the gaps in the rigid and inefficient regulatory
system.
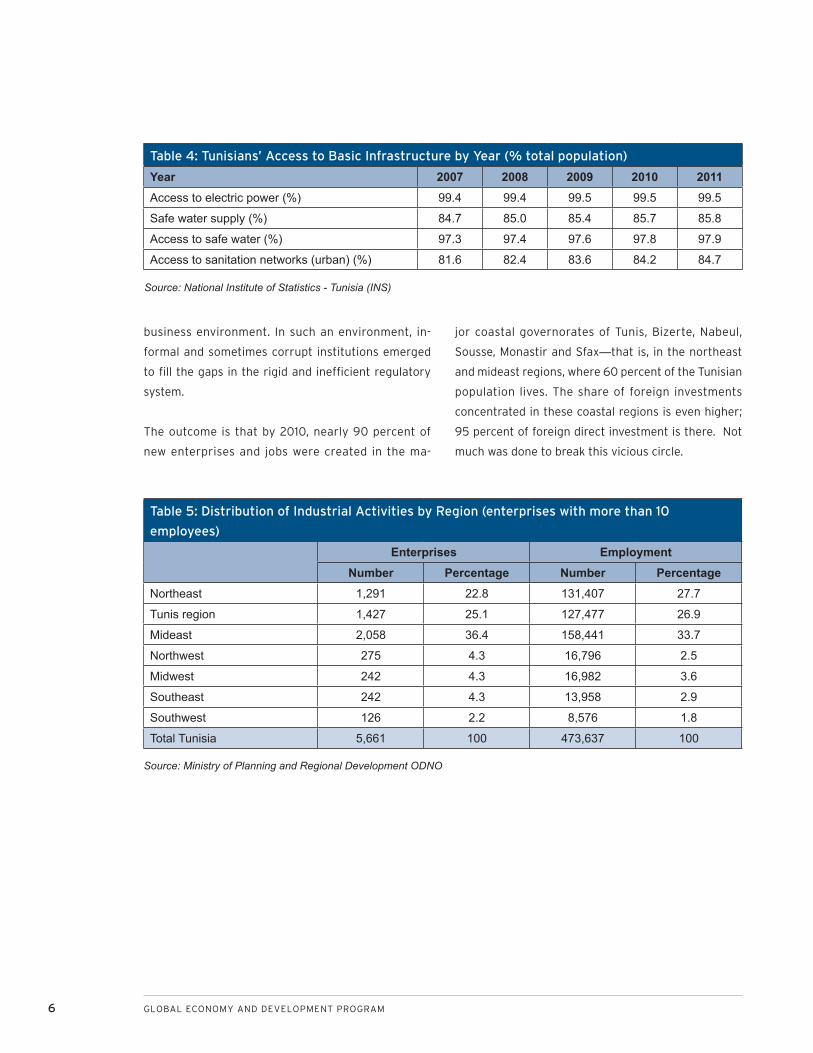
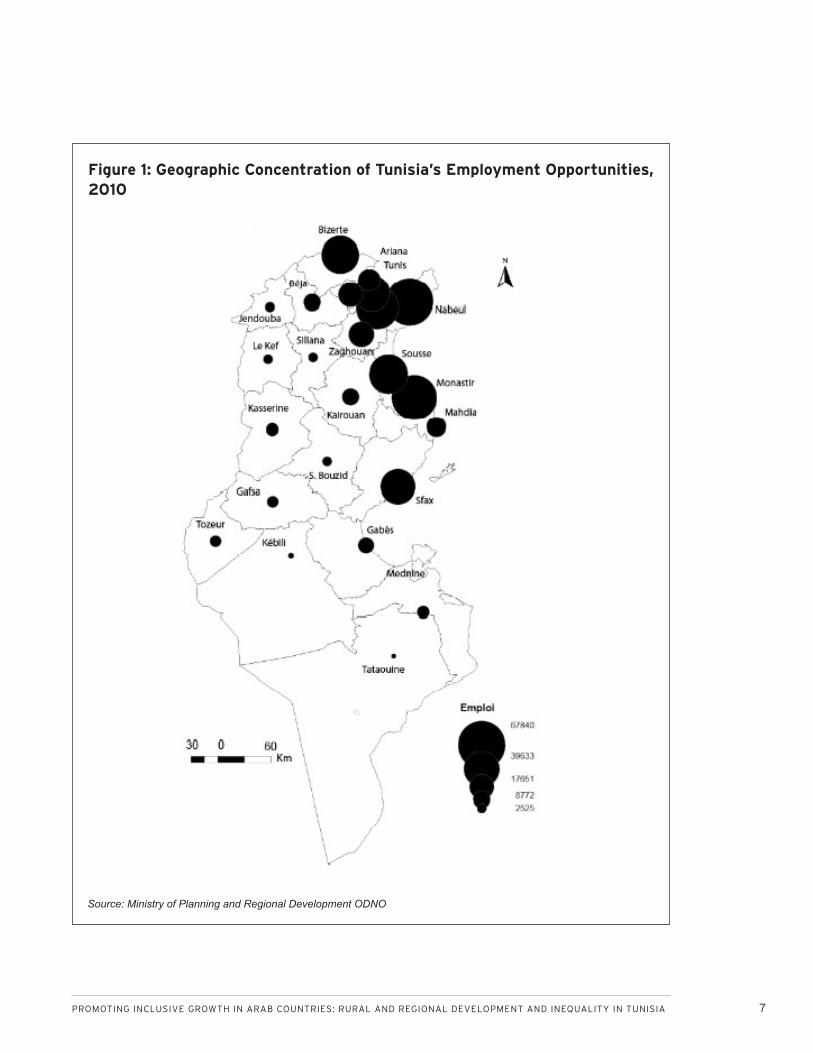
The outcome is that by 2010, nearly 90 percent of
new enterprises and jobs were created in the ma-
jor coastal governorates of Tunis, Bizerte, Nabeul,
Sousse, Monastir and Sfax—that is, in the northeast
and mideast regions, where 60 percent of the Tunisian
population lives. The share of foreign investments
concentrated in these coastal regions is even higher;
95 percent of foreign direct investment is there. Not
much was done to break this vicious circle.
Table 4: Tunisians’ Access to Basic Infrastructure by Year (% total population)
Year 2007 2008 2009 2010 2011Access to electric power (%) 99.4 99.4 99.5 99.5 99.5
Safe water supply (%) 84.7 85.0 85.4 85.7 85.8
Access to safe water (%) 97.3 97.4 97.6 97.8 97.9
Access to sanitation networks (urban) (%) 81.6 82.4 83.6 84.2 84.7
Table 5: Distribution of Industrial Activities by Region (enterprises with more than 10
employees)
Enterprises EmploymentNumber Percentage Number Percentage
Northeast 1,291 22.8 131,407 27.7
Tunis region 1,427 25.1 127,477 26.9
Mideast 2,058 36.4 158,441 33.7
Northwest 275 4.3 16,796 2.5
Midwest 242 4.3 16,982 3.6
Southeast 242 4.3 13,958 2.9
Southwest 126 2.2 8,576 1.8
Total Tunisia 5,661 100 473,637 100
Source: National Institute of Statistics - Tunisia (INS)
Source: Ministry of Planning and Regional Development ODNO
PROMOTING INCLUSIVE GROWTH IN ARAB COUNTRIES: RURAL AND REGIONAL DEVELOPMENT AND INEQUALITY IN TUNISIA 7
Figure 1: Geographic Concentration of Tunisia’s Employment Opportunities, 2010
Source: Ministry of Planning and Regional Development ODNO
8 GLOBAL ECONOMY AND DEVELOPMENT PROGRAM
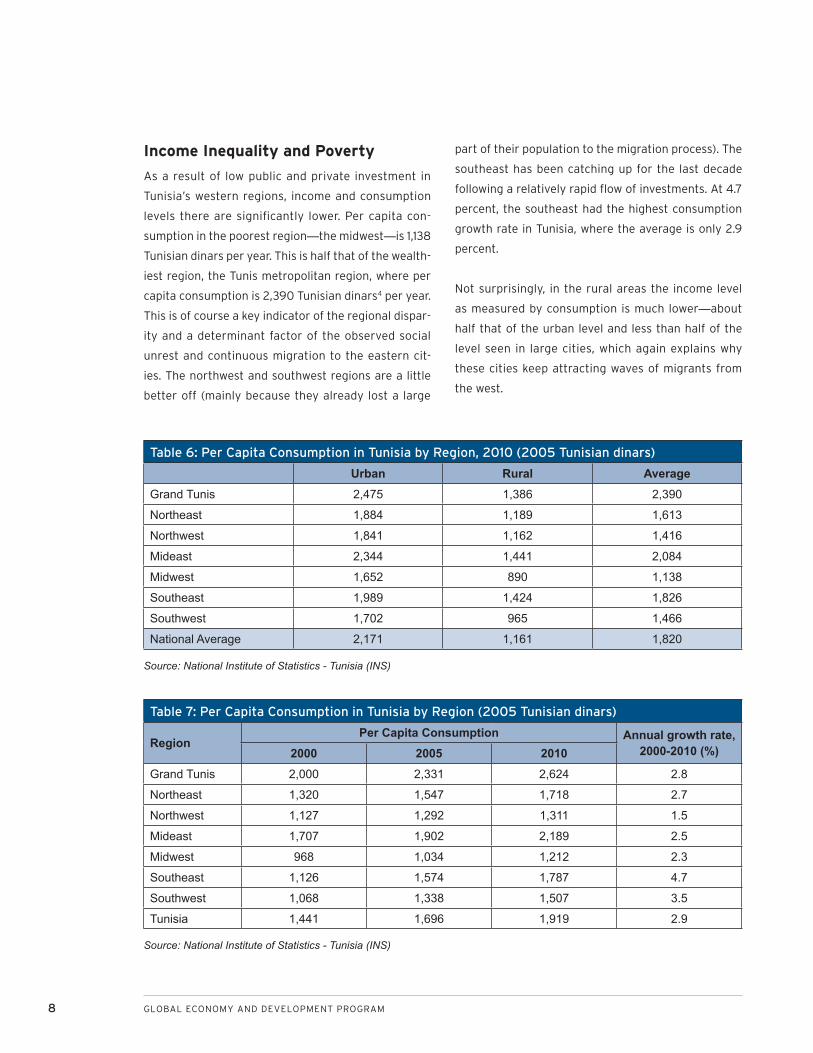
Income Inequality and Poverty
As a result of low public and private investment in
Tunisia’s western regions, income and consumption
levels there are significantly lower. Per capita con-
sumption in the poorest region—the midwest—is 1,138
Tunisian dinars per year. This is half that of the wealth-
iest region, the Tunis metropolitan region, where per
capita consumption is 2,390 Tunisian dinars4 per year.
This is of course a key indicator of the regional dispar-
ity and a determinant factor of the observed social
unrest and continuous migration to the eastern cit-
ies. The northwest and southwest regions are a little
better off (mainly because they already lost a large
part of their population to the migration process). The
southeast has been catching up for the last decade
following a relatively rapid flow of investments. At 4.7
percent, the southeast had the highest consumption
growth rate in Tunisia, where the average is only 2.9
percent.
Not surprisingly, in the rural areas the income level
as measured by consumption is much lower—about
half that of the urban level and less than half of the
level seen in large cities, which again explains why
these cities keep attracting waves of migrants from
the west.
Table 6: Per Capita Consumption in Tunisia by Region, 2010 (2005 Tunisian dinars)
Urban Rural Average Grand Tunis 2,475 1,386 2,390
Northeast 1,884 1,189 1,613
Northwest 1,841 1,162 1,416
Mideast 2,344 1,441 2,084
Midwest 1,652 890 1,138
Southeast 1,989 1,424 1,826
Southwest 1,702 965 1,466
National Average 2,171 1,161 1,820
Table 7: Per Capita Consumption in Tunisia by Region (2005 Tunisian dinars)
RegionPer Capita Consumption Annual growth rate,
2000-2010 (%)2000 2005 2010 Grand Tunis 2,000 2,331 2,624 2.8
Northeast 1,320 1,547 1,718 2.7
Northwest 1,127 1,292 1,311 1.5
Mideast 1,707 1,902 2,189 2.5
Midwest 968 1,034 1,212 2.3
Southeast 1,126 1,574 1,787 4.7
Southwest 1,068 1,338 1,507 3.5
Tunisia 1,441 1,696 1,919 2.9
Source: National Institute of Statistics - Tunisia (INS)
Source: National Institute of Statistics - Tunisia (INS)
PROMOTING INCLUSIVE GROWTH IN ARAB COUNTRIES: RURAL AND REGIONAL DEVELOPMENT AND INEQUALITY IN TUNISIA 9
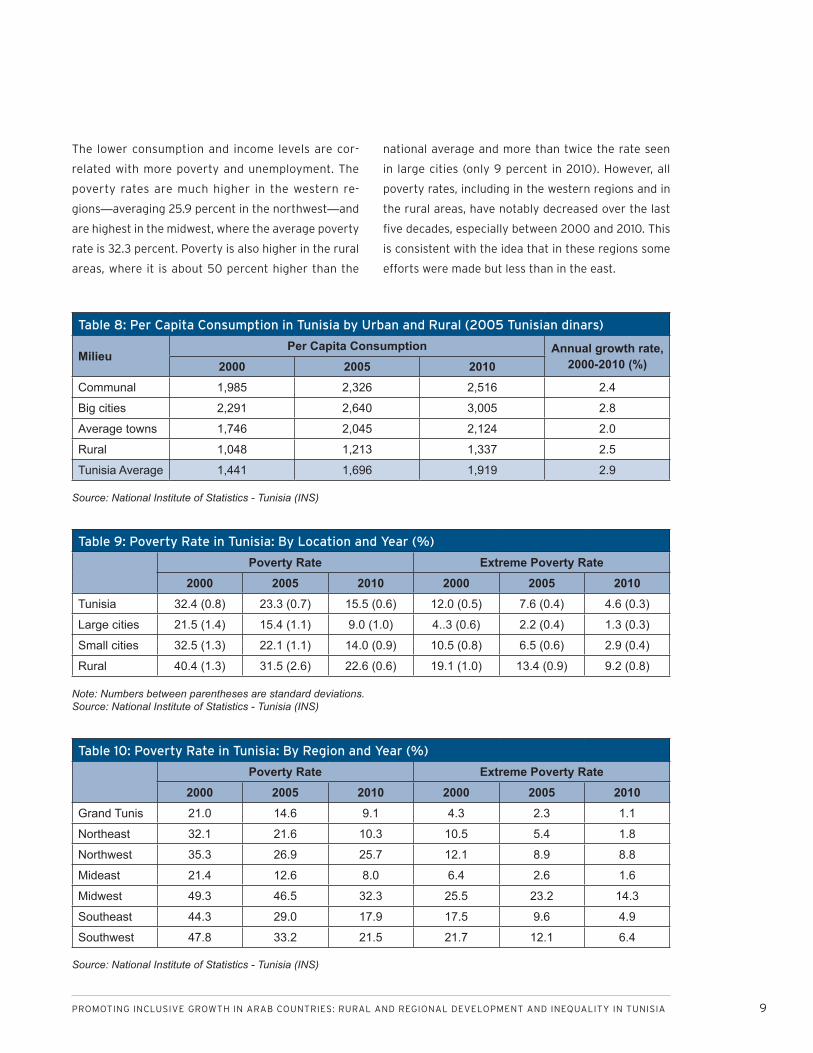
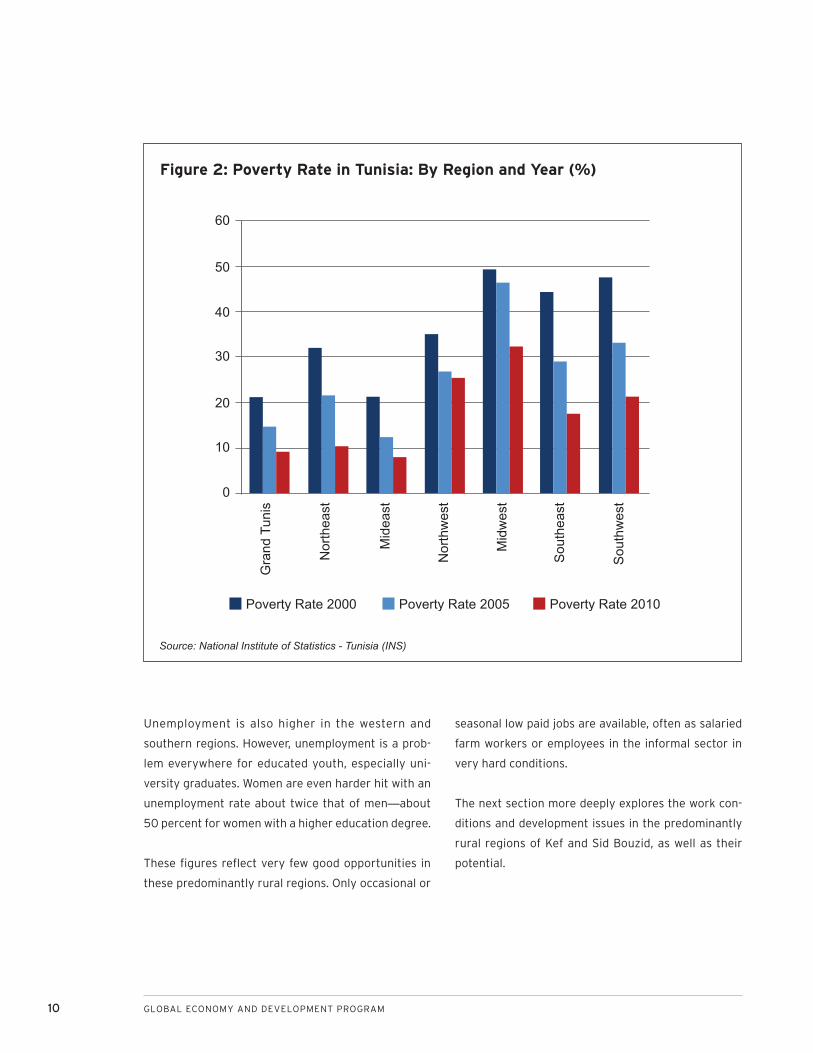
The lower consumption and income levels are cor-
related with more poverty and unemployment. The
poverty rates are much higher in the western re-
gions—averaging 25.9 percent in the northwest—and
are highest in the midwest, where the average poverty
rate is 32.3 percent. Poverty is also higher in the rural
areas, where it is about 50 percent higher than the
national average and more than twice the rate seen
in large cities (only 9 percent in 2010). However, all
poverty rates, including in the western regions and in
the rural areas, have notably decreased over the last
five decades, especially between 2000 and 2010. This
is consistent with the idea that in these regions some
efforts were made but less than in the east.
Table 9: Poverty Rate in Tunisia: By Location and Year (%)
Poverty Rate Extreme Poverty Rate 2000 2005 2010 2000 2005 2010
Tunisia 32.4 (0.8) 23.3 (0.7) 15.5 (0.6) 12.0 (0.5) 7.6 (0.4) 4.6 (0.3)
Large cities 21.5 (1.4) 15.4 (1.1) 9.0 (1.0) 4..3 (0.6) 2.2 (0.4) 1.3 (0.3)
Small cities 32.5 (1.3) 22.1 (1.1) 14.0 (0.9) 10.5 (0.8) 6.5 (0.6) 2.9 (0.4)
Rural 40.4 (1.3) 31.5 (2.6) 22.6 (0.6) 19.1 (1.0) 13.4 (0.9) 9.2 (0.8)
Table 10: Poverty Rate in Tunisia: By Region and Year (%)
Poverty Rate Extreme Poverty Rate 2000 2005 2010 2000 2005 2010
Grand Tunis 21.0 14.6 9.1 4.3 2.3 1.1
Northeast 32.1 21.6 10.3 10.5 5.4 1.8
Northwest 35.3 26.9 25.7 12.1 8.9 8.8
Mideast 21.4 12.6 8.0 6.4 2.6 1.6
Midwest 49.3 46.5 32.3 25.5 23.2 14.3
Southeast 44.3 29.0 17.9 17.5 9.6 4.9
Southwest 47.8 33.2 21.5 21.7 12.1 6.4
Table 8: Per Capita Consumption in Tunisia by Urban and Rural (2005 Tunisian dinars)
MilieuPer Capita Consumption Annual growth rate,
2000-2010 (%)2000 2005 2010 Communal 1,985 2,326 2,516 2.4
Big cities 2,291 2,640 3,005 2.8
Average towns 1,746 2,045 2,124 2.0
Rural 1,048 1,213 1,337 2.5
Tunisia Average 1,441 1,696 1,919 2.9
Note: Numbers between parentheses are standard deviations.Source: National Institute of Statistics - Tunisia (INS)
Source: National Institute of Statistics - Tunisia (INS)
Source: National Institute of Statistics - Tunisia (INS)
10 GLOBAL ECONOMY AND DEVELOPMENT PROGRAM
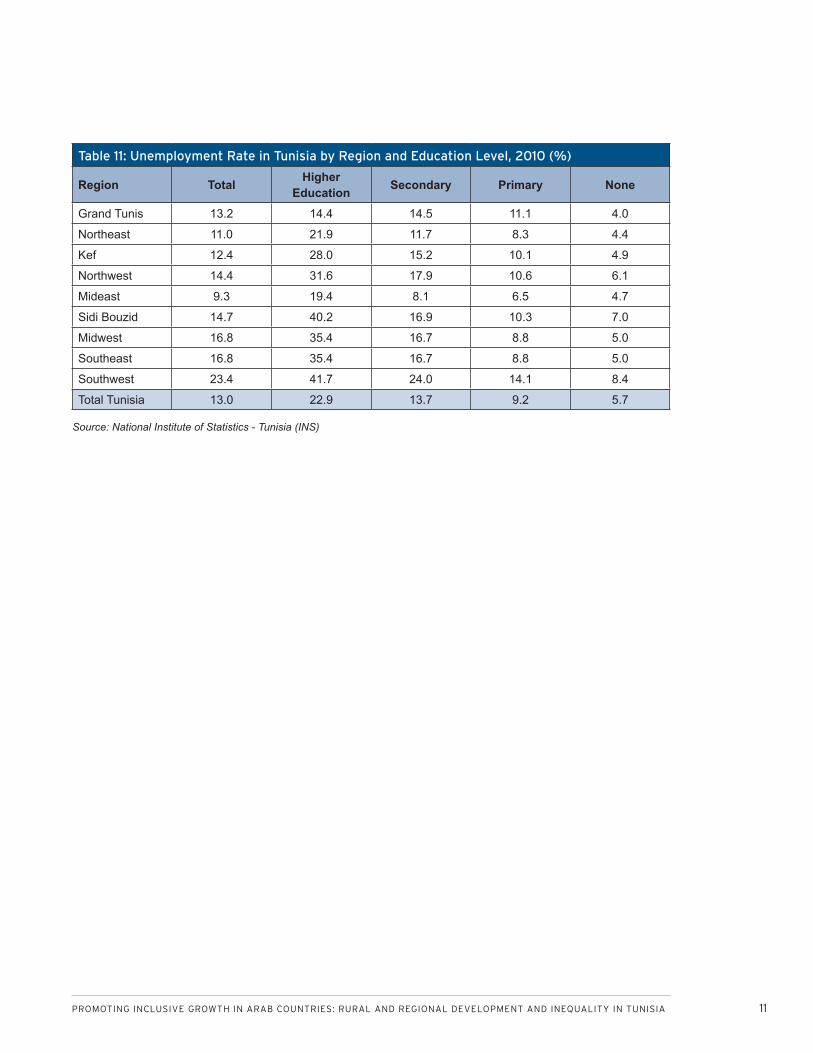
Unemployment is also higher in the western and
southern regions. However, unemployment is a prob-
lem everywhere for educated youth, especially uni-
versity graduates. Women are even harder hit with an
unemployment rate about twice that of men—about
50 percent for women with a higher education degree.
These figures reflect very few good opportunities in
these predominantly rural regions. Only occasional or
seasonal low paid jobs are available, often as salaried
farm workers or employees in the informal sector in
very hard conditions.
The next section more deeply explores the work con-
ditions and development issues in the predominantly
rural regions of Kef and Sid Bouzid, as well as their
potential.
Figure 2: Poverty Rate in Tunisia: By Region and Year (%)
Source: National Institute of Statistics - Tunisia (INS)
60
50
40
30
20
10
0
Gra
nd T
unis
Nor
thea
st
Mid
east
Nor
thw
est
Mid
wes
t
Sou
thea
st
Sou
thw
est
Poverty Rate 2000 Poverty Rate 2005 Poverty Rate 2010
PROMOTING INCLUSIVE GROWTH IN ARAB COUNTRIES: RURAL AND REGIONAL DEVELOPMENT AND INEQUALITY IN TUNISIA 11
Table 11: Unemployment Rate in Tunisia by Region and Education Level, 2010 (%)
Region Total Higher Education Secondary Primary None
Grand Tunis 13.2 14.4 14.5 11.1 4.0
Northeast 11.0 21.9 11.7 8.3 4.4
Kef 12.4 28.0 15.2 10.1 4.9
Northwest 14.4 31.6 17.9 10.6 6.1
Mideast 9.3 19.4 8.1 6.5 4.7
Sidi Bouzid 14.7 40.2 16.9 10.3 7.0
Midwest 16.8 35.4 16.7 8.8 5.0
Southeast 16.8 35.4 16.7 8.8 5.0
Southwest 23.4 41.7 24.0 14.1 8.4
Total Tunisia 13.0 22.9 13.7 9.2 5.7
Source: National Institute of Statistics - Tunisia (INS)
12 GLOBAL ECONOMY AND DEVELOPMENT PROGRAM
DEVELOPMENT CHALLENGES AND POTENTIAL IN TWO TUNISIAN RURAL GOVERNORATES: LE KEF AND SIDI BOUZID
What Le Kef and Sidi Bouzid governorates have in
common is that they are both heavily dependent on
agriculture and have benefited relatively little from
the development process during the past five de-
cades. No special effort or major non-agricultural
project has been directed toward either of them. They
attracted little private non-agricultural investment
and a significant proportion of their labor force has
migrated to other regions because of the lack of em-
ployment opportunities. Le Kef has a negative popula-
tion growth. More than half of its population remains
rural. Of course, as indicated above, the governorates
have seen gains in terms of education, poverty reduc-
tion and access to basic services. However, compared
to their human and natural potential and to other
regions, they have not received their fair share of the
progress made in Tunisia.
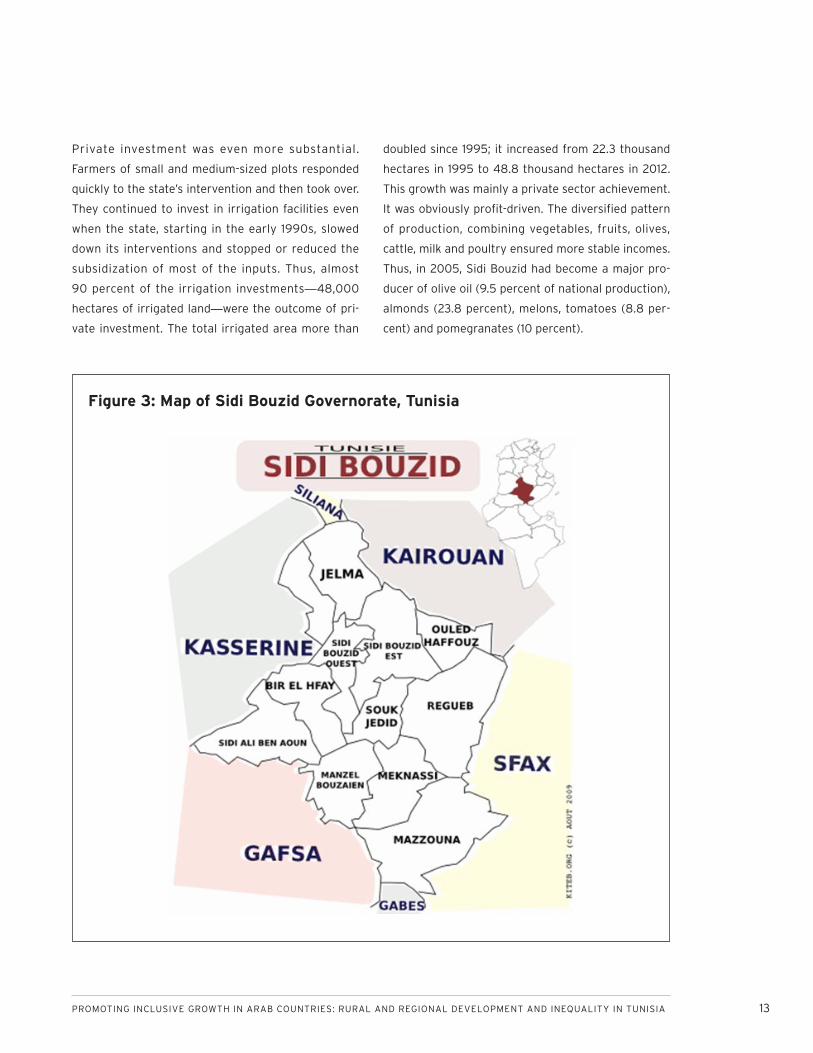
Sidi Bouzid
Sidi Bouzid is where the Tunisian uprising started in
December 2010. We argue that this was not by chance.
Sidi Bouzid is geographically at the heart of Tunisia.5
It covers approximately 4.3 percent of Tunisian ter-
ritory and hosts about 4.1 percent of the Tunisian
population. More than 70 percent of its population is
rural and involved in agricultural activities. Forty-one
percent of its labor force is fully employed in agri-
cultural activities. Sidi Bouzid is part of the midwest
region and became a separate governorate in 1973. It
is situated in a rather arid or semi-arid area. Indeed,
its agriculture depends on very volatile and uncertain
rainfall. More than half of Sidi Bouzid’s agriculture
also relies on underground water reserves, the gov-
ernorate’s only treasure, but one that is under threat
of over-exploitation. Out of its 460,000 hectares of
cultivated land, around 48,000 hectares (a little more
than 10 percent) benefited in 2012 from an irrigation
system.
Fairly Effective Rural Development Programs
and Forgotten Youth
It is important to note that modern irrigated agricul-
ture has been introduced rather recently in this re-
gion; it started in the 1970s and was accelerated in the
1980s, ultimately generating an agricultural boom.
Sidi Bouzid became a major agricultural center in just
a few decades, known especially for its fruits, veg-
etables (20 percent of total national production) and
olive oil. But the benefits of modern irrigation have
reached their limit.
Agriculture has always been the main pillar of Sidi
Bouzid’s economy, but until the 1970s most of this
agriculture was based on low-yield cereal produc-
tion and semi-nomadic sheep herding. There were
only few small sedentary communities that mastered
vegetable growing. Within decades, a state-initiated
process led to a deep transformation that turned the
governorate’s semi-nomadic people into peasants and
farmers with the skills for intensive irrigated farming.
The state’s process had a few components. First, the
tribally-owned land was divided into private lots; this
major reform created the incentive for investing in
agriculture and was critical for the emergence of sus-
tainable family farming. The government also built the
first water systems based on ground water and deep
aquifers and facilitated farmers’ access to financial re-
sources and to subsidized agricultural inputs, includ-
ing seeds and fertilizers.6 Important public projects
in infrastructure, roads and electrical and safe water
networks were also completed to the benefit of all the
agricultural community, including the poor.
PROMOTING INCLUSIVE GROWTH IN ARAB COUNTRIES: RURAL AND REGIONAL DEVELOPMENT AND INEQUALITY IN TUNISIA 13
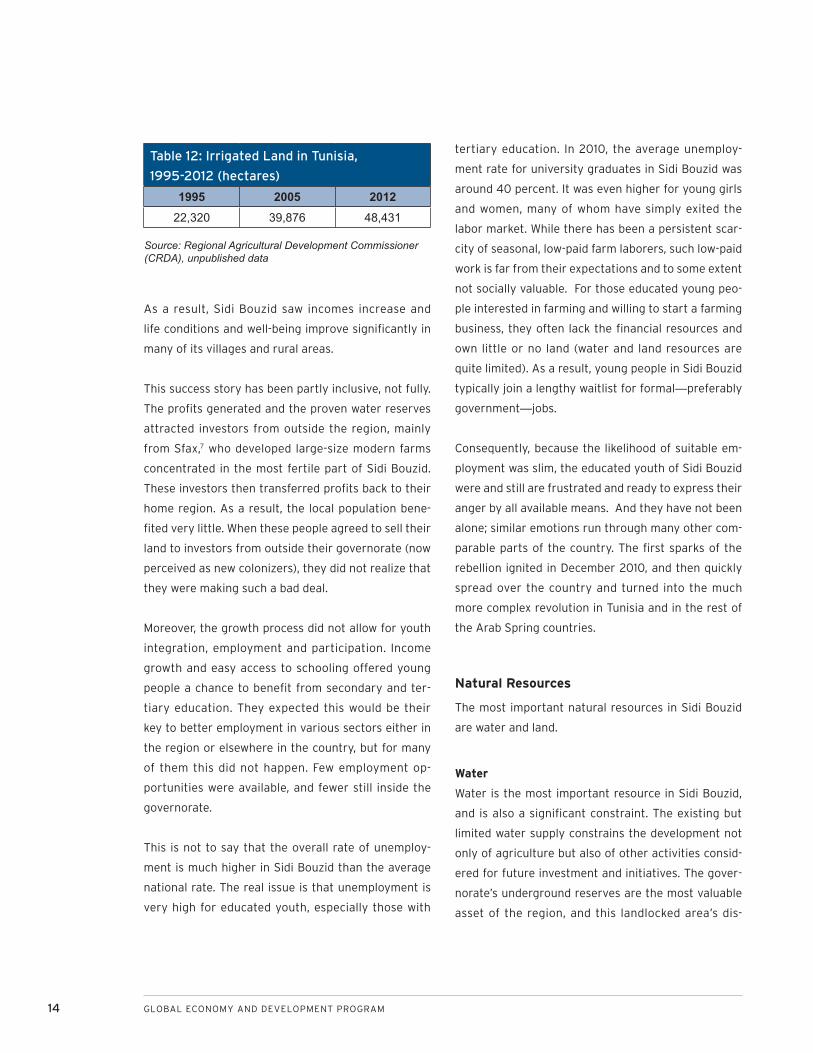
Private investment was even more substantial.
Farmers of small and medium-sized plots responded
quickly to the state’s intervention and then took over.
They continued to invest in irrigation facilities even
when the state, starting in the early 1990s, slowed
down its interventions and stopped or reduced the
subsidization of most of the inputs. Thus, almost
90 percent of the irrigation investments—48,000
hectares of irrigated land—were the outcome of pri-
vate investment. The total irrigated area more than
doubled since 1995; it increased from 22.3 thousand
hectares in 1995 to 48.8 thousand hectares in 2012.
This growth was mainly a private sector achievement.
It was obviously profit-driven. The diversified pattern
of production, combining vegetables, fruits, olives,
cattle, milk and poultry ensured more stable incomes.
Thus, in 2005, Sidi Bouzid had become a major pro-
ducer of olive oil (9.5 percent of national production),
almonds (23.8 percent), melons, tomatoes (8.8 per-
cent) and pomegranates (10 percent).
Figure 3: Map of Sidi Bouzid Governorate, Tunisia
14 GLOBAL ECONOMY AND DEVELOPMENT PROGRAM
Table 12: Irrigated Land in Tunisia,
1995-2012 (hectares)
1995 2005 201222,320 39,876 48,431
Source: Regional Agricultural Development Commissioner (CRDA), unpublished data
As a result, Sidi Bouzid saw incomes increase and
life conditions and well-being improve significantly in
many of its villages and rural areas.
This success story has been partly inclusive, not fully.
The profits generated and the proven water reserves
attracted investors from outside the region, mainly
from Sfax,7 who developed large-size modern farms
concentrated in the most fertile part of Sidi Bouzid.
These investors then transferred profits back to their
home region. As a result, the local population bene-
fited very little. When these people agreed to sell their
land to investors from outside their governorate (now
perceived as new colonizers), they did not realize that
they were making such a bad deal.
Moreover, the growth process did not allow for youth
integration, employment and participation. Income
growth and easy access to schooling offered young
people a chance to benefit from secondary and ter-
tiary education. They expected this would be their
key to better employment in various sectors either in
the region or elsewhere in the country, but for many
of them this did not happen. Few employment op-
portunities were available, and fewer still inside the
governorate.
This is not to say that the overall rate of unemploy-
ment is much higher in Sidi Bouzid than the average
national rate. The real issue is that unemployment is
very high for educated youth, especially those with
tertiary education. In 2010, the average unemploy-
ment rate for university graduates in Sidi Bouzid was
around 40 percent. It was even higher for young girls
and women, many of whom have simply exited the
labor market. While there has been a persistent scar-
city of seasonal, low-paid farm laborers, such low-paid
work is far from their expectations and to some extent
not socially valuable. For those educated young peo-
ple interested in farming and willing to start a farming
business, they often lack the financial resources and
own little or no land (water and land resources are
quite limited). As a result, young people in Sidi Bouzid
typically join a lengthy waitlist for formal—preferably
government—jobs.
Consequently, because the likelihood of suitable em-
ployment was slim, the educated youth of Sidi Bouzid
were and still are frustrated and ready to express their
anger by all available means. And they have not been
alone; similar emotions run through many other com-
parable parts of the country. The first sparks of the
rebellion ignited in December 2010, and then quickly
spread over the country and turned into the much
more complex revolution in Tunisia and in the rest of
the Arab Spring countries.
Natural Resources
The most important natural resources in Sidi Bouzid
are water and land.
Water
Water is the most important resource in Sidi Bouzid,
and is also a significant constraint. The existing but
limited water supply constrains the development not
only of agriculture but also of other activities consid-
ered for future investment and initiatives. The gover-
norate’s underground reserves are the most valuable
asset of the region, and this landlocked area’s dis-
PROMOTING INCLUSIVE GROWTH IN ARAB COUNTRIES: RURAL AND REGIONAL DEVELOPMENT AND INEQUALITY IN TUNISIA 15
tance from the relatively water-rich region in the
north and from seawater means there are no other
reasonable alternatives. There is already evidence
Sidi Bouzid is over-exploiting its water and it should
urgently promote water-saving, more efficient water-
production techniques and sustainable cropping pat-
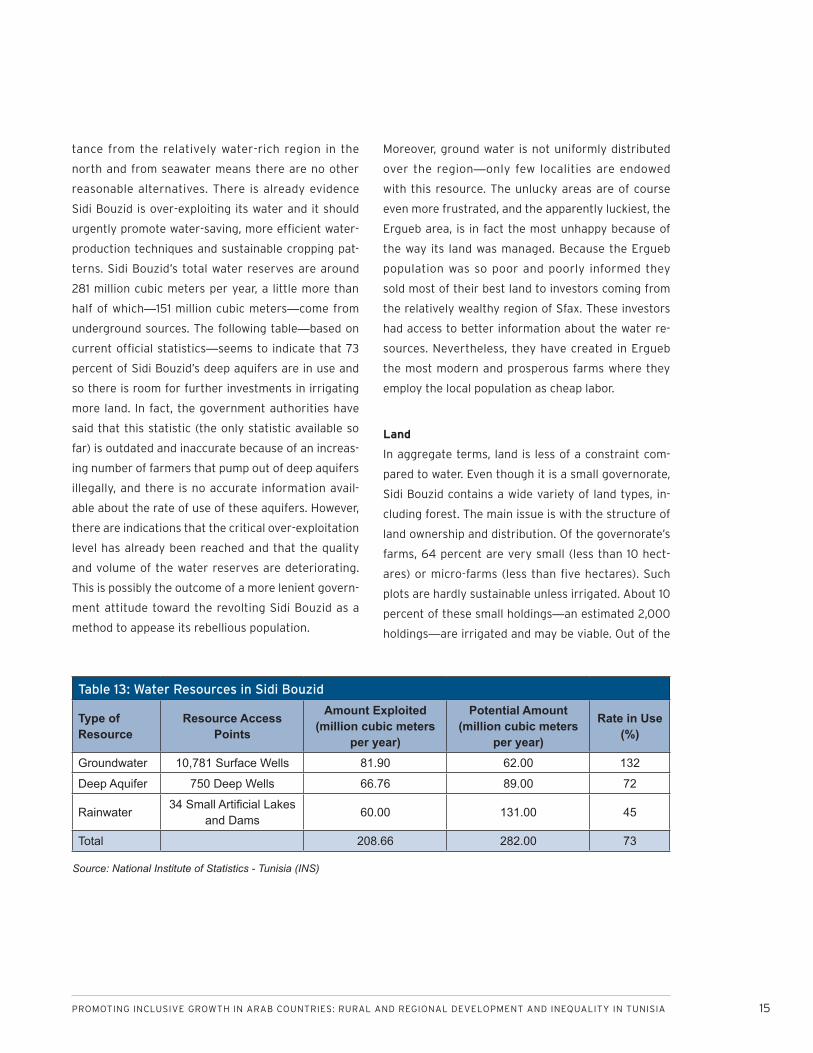
terns. Sidi Bouzid’s total water reserves are around
281 million cubic meters per year, a little more than
half of which—151 million cubic meters—come from
underground sources. The following table—based on
current official statistics—seems to indicate that 73
percent of Sidi Bouzid’s deep aquifers are in use and
so there is room for further investments in irrigating
more land. In fact, the government authorities have
said that this statistic (the only statistic available so
far) is outdated and inaccurate because of an increas-
ing number of farmers that pump out of deep aquifers
illegally, and there is no accurate information avail-
able about the rate of use of these aquifers. However,
there are indications that the critical over-exploitation
level has already been reached and that the quality
and volume of the water reserves are deteriorating.
This is possibly the outcome of a more lenient govern-
ment attitude toward the revolting Sidi Bouzid as a
method to appease its rebellious population.
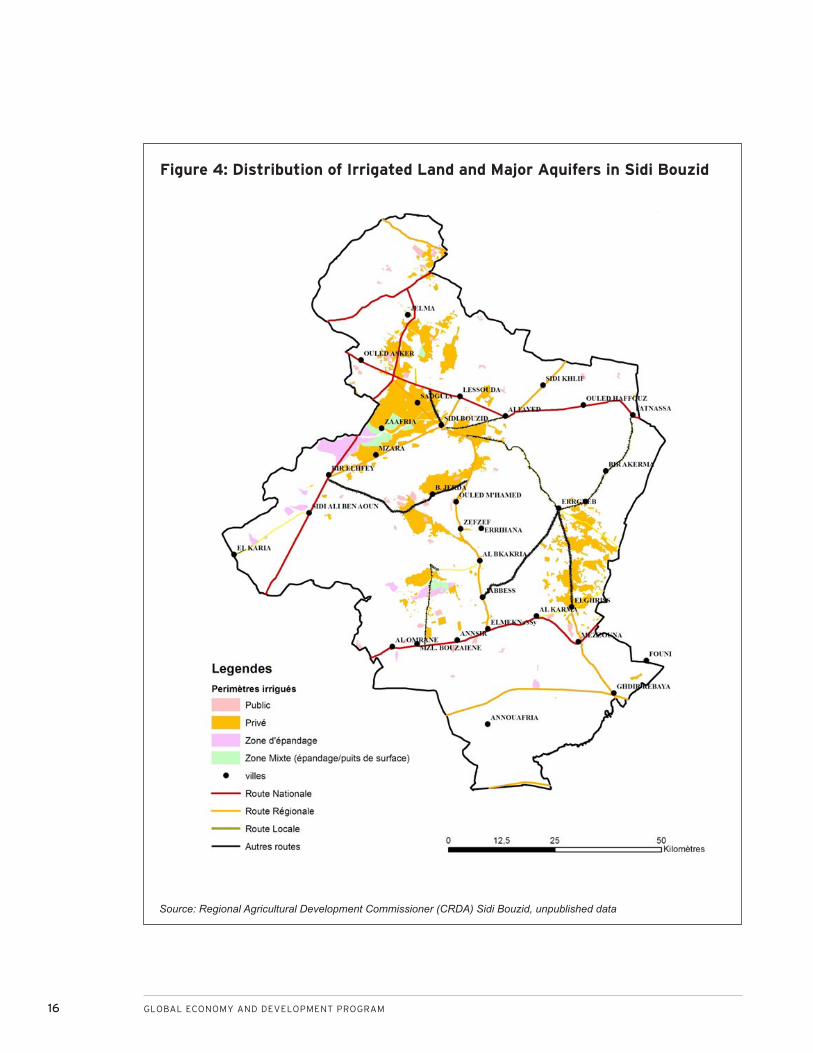
Moreover, ground water is not uniformly distributed
over the region—only few localities are endowed
with this resource. The unlucky areas are of course
even more frustrated, and the apparently luckiest, the
Ergueb area, is in fact the most unhappy because of
the way its land was managed. Because the Ergueb
population was so poor and poorly informed they
sold most of their best land to investors coming from
the relatively wealthy region of Sfax. These investors
had access to better information about the water re-
sources. Nevertheless, they have created in Ergueb
the most modern and prosperous farms where they
employ the local population as cheap labor.
Land
In aggregate terms, land is less of a constraint com-
pared to water. Even though it is a small governorate,
Sidi Bouzid contains a wide variety of land types, in-
cluding forest. The main issue is with the structure of
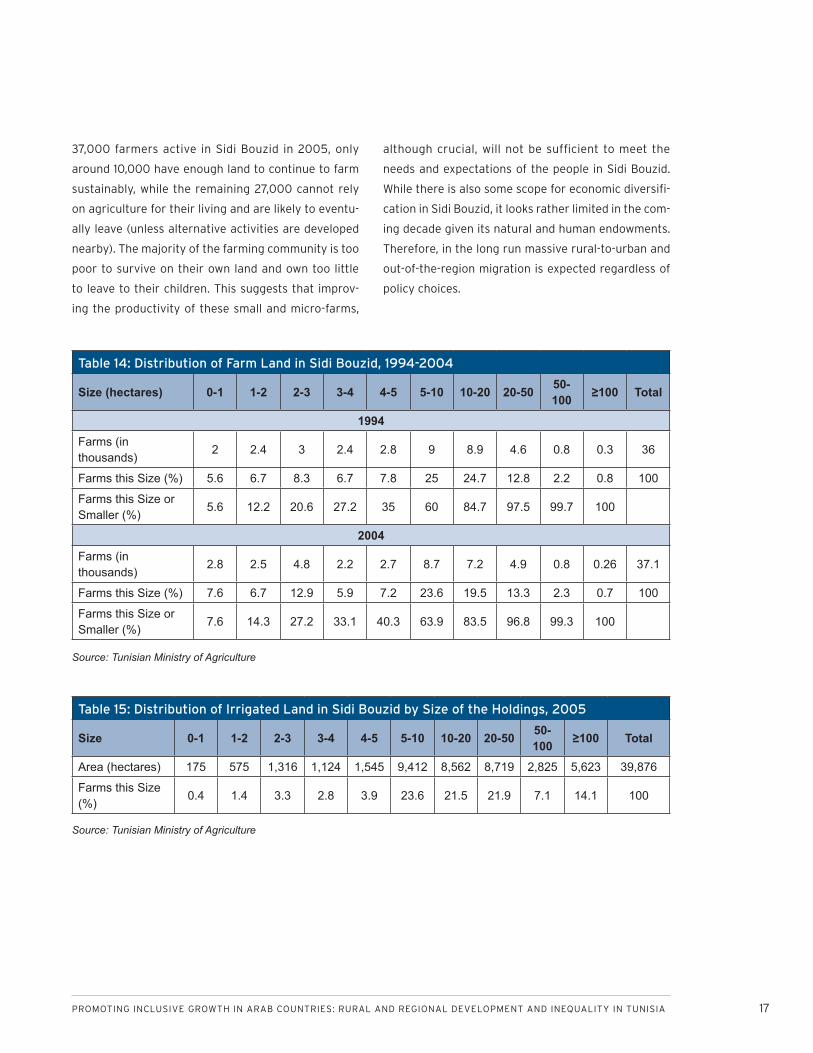
land ownership and distribution. Of the governorate’s
farms, 64 percent are very small (less than 10 hect-
ares) or micro-farms (less than five hectares). Such
plots are hardly sustainable unless irrigated. About 10
percent of these small holdings—an estimated 2,000
holdings—are irrigated and may be viable. Out of the
Table 13: Water Resources in Sidi Bouzid
Type of Resource
Resource Access Points
Amount Exploited (million cubic meters
per year)
Potential Amount (million cubic meters
per year)
Rate in Use (%)
Groundwater 10,781 Surface Wells 81.90 62.00 132
Deep Aquifer 750 Deep Wells 66.76 89.00 72
Rainwater34 Small Artificial Lakes
and Dams60.00 131.00 45
Total 208.66 282.00 73
Source: National Institute of Statistics - Tunisia (INS)
16 GLOBAL ECONOMY AND DEVELOPMENT PROGRAM
Figure 4: Distribution of Irrigated Land and Major Aquifers in Sidi Bouzid
Source: Regional Agricultural Development Commissioner (CRDA) Sidi Bouzid, unpublished data
PROMOTING INCLUSIVE GROWTH IN ARAB COUNTRIES: RURAL AND REGIONAL DEVELOPMENT AND INEQUALITY IN TUNISIA 17
37,000 farmers active in Sidi Bouzid in 2005, only
around 10,000 have enough land to continue to farm
sustainably, while the remaining 27,000 cannot rely
on agriculture for their living and are likely to eventu-
ally leave (unless alternative activities are developed
nearby). The majority of the farming community is too
poor to survive on their own land and own too little
to leave to their children. This suggests that improv-
ing the productivity of these small and micro-farms,
although crucial, will not be sufficient to meet the
needs and expectations of the people in Sidi Bouzid.
While there is also some scope for economic diversifi-
cation in Sidi Bouzid, it looks rather limited in the com-
ing decade given its natural and human endowments.
Therefore, in the long run massive rural-to-urban and
out-of-the-region migration is expected regardless of
policy choices.
Table 14: Distribution of Farm Land in Sidi Bouzid, 1994-2004
Size (hectares) 0-1 1-2 2-3 3-4 4-5 5-10 10-20 20-50 50-100 ≥100 Total
1994Farms (in thousands)
2 2.4 3 2.4 2.8 9 8.9 4.6 0.8 0.3 36
Farms this Size (%) 5.6 6.7 8.3 6.7 7.8 25 24.7 12.8 2.2 0.8 100
Farms this Size or Smaller (%)
5.6 12.2 20.6 27.2 35 60 84.7 97.5 99.7 100
2004Farms (in thousands)
2.8 2.5 4.8 2.2 2.7 8.7 7.2 4.9 0.8 0.26 37.1
Farms this Size (%) 7.6 6.7 12.9 5.9 7.2 23.6 19.5 13.3 2.3 0.7 100
Farms this Size or Smaller (%)
7.6 14.3 27.2 33.1 40.3 63.9 83.5 96.8 99.3 100
Table 15: Distribution of Irrigated Land in Sidi Bouzid by Size of the Holdings, 2005
Size 0-1 1-2 2-3 3-4 4-5 5-10 10-20 20-50 50-100 ≥100 Total
Area (hectares) 175 575 1,316 1,124 1,545 9,412 8,562 8,719 2,825 5,623 39,876
Farms this Size (%)
0.4 1.4 3.3 2.8 3.9 23.6 21.5 21.9 7.1 14.1 100
Source: Tunisian Ministry of Agriculture
Source: Tunisian Ministry of Agriculture
18 GLOBAL ECONOMY AND DEVELOPMENT PROGRAM
The privatization of the previously tribal land radically
changed the incentive structure and greatly contrib-
uted to the economic growth of Sidi Bouzid, but the
land reform measure is still incomplete. Often, farm-
ers are still without formal land titles registering their
individual ownership. Instead these farmers often
share land with family members or are in the midst
of lengthy ongoing disputes over land ownership. As
a result, they have difficulty accessing bank financing
that is typically based on mortgages. Government
loan facilities previously provided credit to many
farmers, but many now hold unpaid loans, which
makes it even more difficult for them to obtain new
bank loans.
Government Services
Farmers also have difficult access to new technolo-
gies because of the limited extension service offered
to them by the existing government agencies and
because the majority of the rural population active
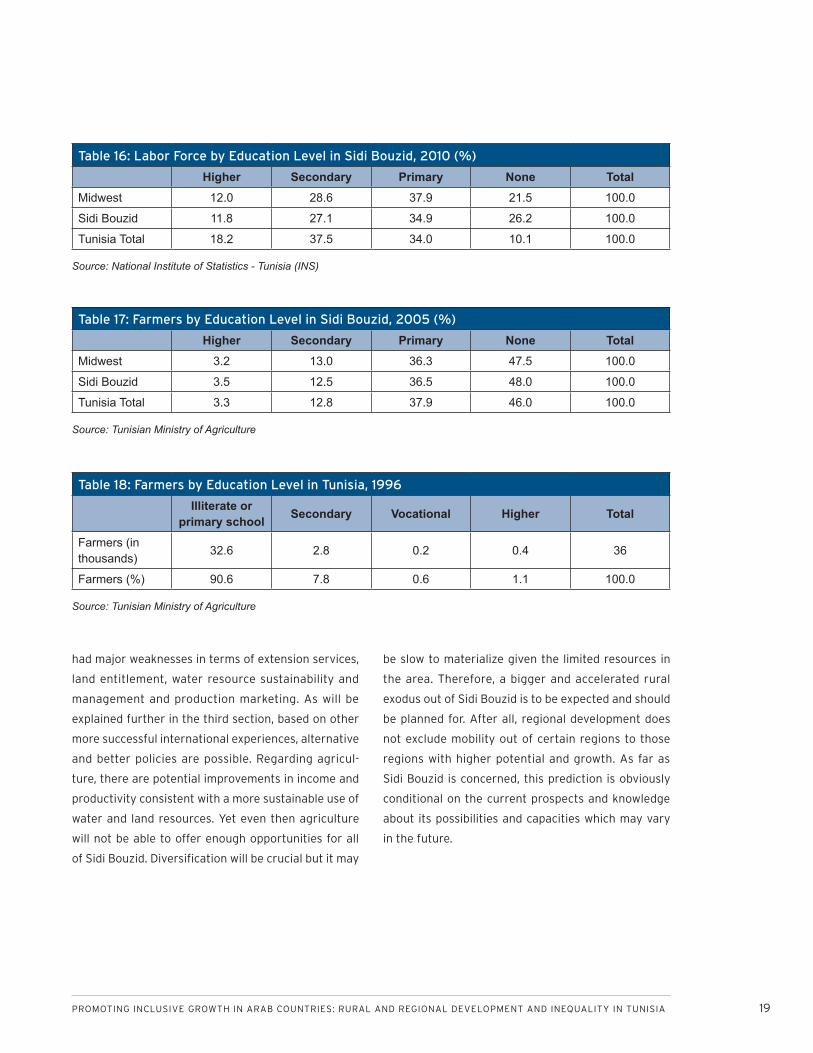
in agriculture has little schooling and formal training.
Eighty five percent of them have had a primary edu-
cation or none, almost like everywhere in the country.
This is a little better than ten years ago; it used to be
90 percent. This may be a significant change and the
beginning of the emergence of a new and more mod-
ern agriculture in the region. However, the peasants
and farmers’ level of education remains well below the
average levels of the population. That is, agricultural
activities are not attractive not only for youth but for
the working population in general.
In any case, the real wealth of Sidi Bouzid is its people,
brave and hardworking, and traditionally skilled. They
have acquired practical skills in agricultural activities
and have invested in training their youth in various
fields.
Farmers’ low levels of education also hinder their
access to both financial resources and better tech-
nologies. This difficulty is aggravated by the low level
of extension services available and of the quality of
training offered to students in the region. The set of
vocational training and higher education institutions
established in Sidi Bouzid are not demand-driven and
are quite disconnected from the region’s current and
future needs for skills. In addition, the gap between
the required skills and the existing capacities is rather
enormous. As stated above, graduates of this system
try to look for jobs elsewhere but they often end up
waiting at home for uncertain and very unlikely em-
ployment opportunities. This has driven them to ex-
asperation.
There is also a set of well-established public service
institutions in the region, but they don’t seem to re-
spond to the population’s expectations. Indeed, the
people of Sidi Bouzid have an ambivalent attitude to-
ward these government institutions; they need them,
but they also think that they are too bureaucratic,
poorly equipped and inefficient. Citizens of the region
widely share the feeling that their region was not eq-
uitably treated and has received too small a share of
government attention and major projects—including
infrastructure, health care and promotion of non-ag-
ricultural activities. Thus, many joined the rebellious
youth.
The case of Sidi Bouzid shows nevertheless that the
Tunisian government implemented important and
substantial development programs. High growth in the
agricultural sector was achieved, better infrastructure
was built, and access to education and health services
were improved for most of the population. However,
little opportunities outside the agricultural sector
were available for youth, especially the educated.
The design of the rural development programs also
PROMOTING INCLUSIVE GROWTH IN ARAB COUNTRIES: RURAL AND REGIONAL DEVELOPMENT AND INEQUALITY IN TUNISIA 19
had major weaknesses in terms of extension services,
land entitlement, water resource sustainability and
management and production marketing. As will be
explained further in the third section, based on other
more successful international experiences, alternative
and better policies are possible. Regarding agricul-
ture, there are potential improvements in income and
productivity consistent with a more sustainable use of
water and land resources. Yet even then agriculture
will not be able to offer enough opportunities for all
of Sidi Bouzid. Diversification will be crucial but it may
be slow to materialize given the limited resources in
the area. Therefore, a bigger and accelerated rural
exodus out of Sidi Bouzid is to be expected and should
be planned for. After all, regional development does
not exclude mobility out of certain regions to those
regions with higher potential and growth. As far as
Sidi Bouzid is concerned, this prediction is obviously
conditional on the current prospects and knowledge
about its possibilities and capacities which may vary
in the future.
Table 16: Labor Force by Education Level in Sidi Bouzid, 2010 (%)
Higher Secondary Primary None TotalMidwest 12.0 28.6 37.9 21.5 100.0
Sidi Bouzid 11.8 27.1 34.9 26.2 100.0
Tunisia Total 18.2 37.5 34.0 10.1 100.0
Table 17: Farmers by Education Level in Sidi Bouzid, 2005 (%)
Higher Secondary Primary None TotalMidwest 3.2 13.0 36.3 47.5 100.0
Sidi Bouzid 3.5 12.5 36.5 48.0 100.0
Tunisia Total 3.3 12.8 37.9 46.0 100.0
Table 18: Farmers by Education Level in Tunisia, 1996
Illiterate or primary school Secondary Vocational Higher Total
Farmers (in thousands)
32.6 2.8 0.2 0.4 36
Farmers (%) 90.6 7.8 0.6 1.1 100.0
Source: National Institute of Statistics - Tunisia (INS)
Source: Tunisian Ministry of Agriculture
Source: Tunisian Ministry of Agriculture
20 GLOBAL ECONOMY AND DEVELOPMENT PROGRAM
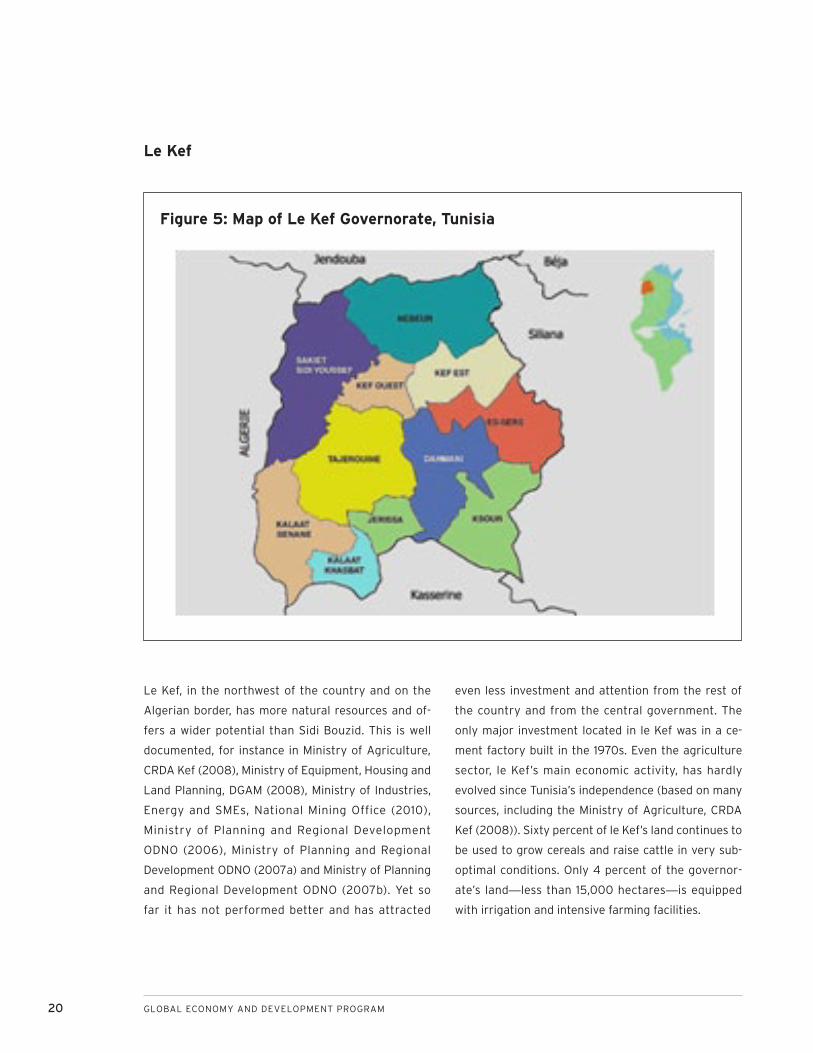
Le Kef
Figure 5: Map of Le Kef Governorate, Tunisia
Le Kef, in the northwest of the country and on the
Algerian border, has more natural resources and of-
fers a wider potential than Sidi Bouzid. This is well
documented, for instance in Ministry of Agriculture,
CRDA Kef (2008), Ministry of Equipment, Housing and
Land Planning, DGAM (2008), Ministry of Industries,
Energy and SMEs, National Mining Office (2010),
Ministry of Planning and Regional Development
ODNO (2006), Ministry of Planning and Regional
Development ODNO (2007a) and Ministry of Planning
and Regional Development ODNO (2007b). Yet so
far it has not performed better and has attracted
even less investment and attention from the rest of
the country and from the central government. The
only major investment located in le Kef was in a ce-
ment factory built in the 1970s. Even the agriculture
sector, le Kef’s main economic activity, has hardly
evolved since Tunisia’s independence (based on many
sources, including the Ministry of Agriculture, CRDA
Kef (2008)). Sixty percent of le Kef’s land continues to
be used to grow cereals and raise cattle in very sub-
optimal conditions. Only 4 percent of the governor-
ate’s land—less than 15,000 hectares—is equipped
with irrigation and intensive farming facilities.
PROMOTING INCLUSIVE GROWTH IN ARAB COUNTRIES: RURAL AND REGIONAL DEVELOPMENT AND INEQUALITY IN TUNISIA 21
The population of this governorate has been de-
creasing for decades and its economy has suffered
in terms of sectoral development and income gen-
eration opportunities, because of the exhaustion of
its iron ore mines. Le Kef, more than Sidi Bouzid, was
also clearly impacted by the Tunisian government’s
bias against rural areas from 1960 to 1987. At the
expense of farmers, Low food prices were fixed by
the government—mainly for grains and other staple
food commodities—in order to protect urban consum-
ers and control wages. By the end of the 1980s, this
policy was partially adjusted and grain prices were in-
creased, but subsidies on agricultural inputs were also
lifted. Cereal production has since become relatively
profitable but not profitable enough to start a new
era of growth and prosperity in the grain-producing
regions. Actually, the pricing bias is not the only im-
pediment to growth and development in this part of
the country. In particular, there are other social and
institutional constraints related to land distribution
and ownership, and to access to finance, knowledge
and innovation. Therefore, important urgent reforms
need to be undertaken in all these domains in order
to make development more likely and more inclusive.
Although agriculture is the predominant sector and
more than half of the population is rural, le Kef’s econ-
omy is more diversified than Sidi Bouzid’s. It includes
a larger share of manufacturing enterprises and a
small but promising tourism sector. Close to 6 percent
of employment is in manufacturing. Yet, in le Kef, still
no major non-agricultural industry has emerged. The
existing private enterprises are predominantly small
and micro-enterprises with an average size of hardly
more than one employee per enterprise.
Poverty is still more concentrated in the rural areas
and a large part of the rural population is more or less
landless and faces meager prospects. It is possible to
improve their situation and to reduce their poverty
through better policies but sooner or later most of
them will leave the countryside and migrate to the
urban areas in the same governorate or elsewhere
looking for more and better opportunities.
In the following section, the focus will be on the rural
people and their activities, mainly agriculture.
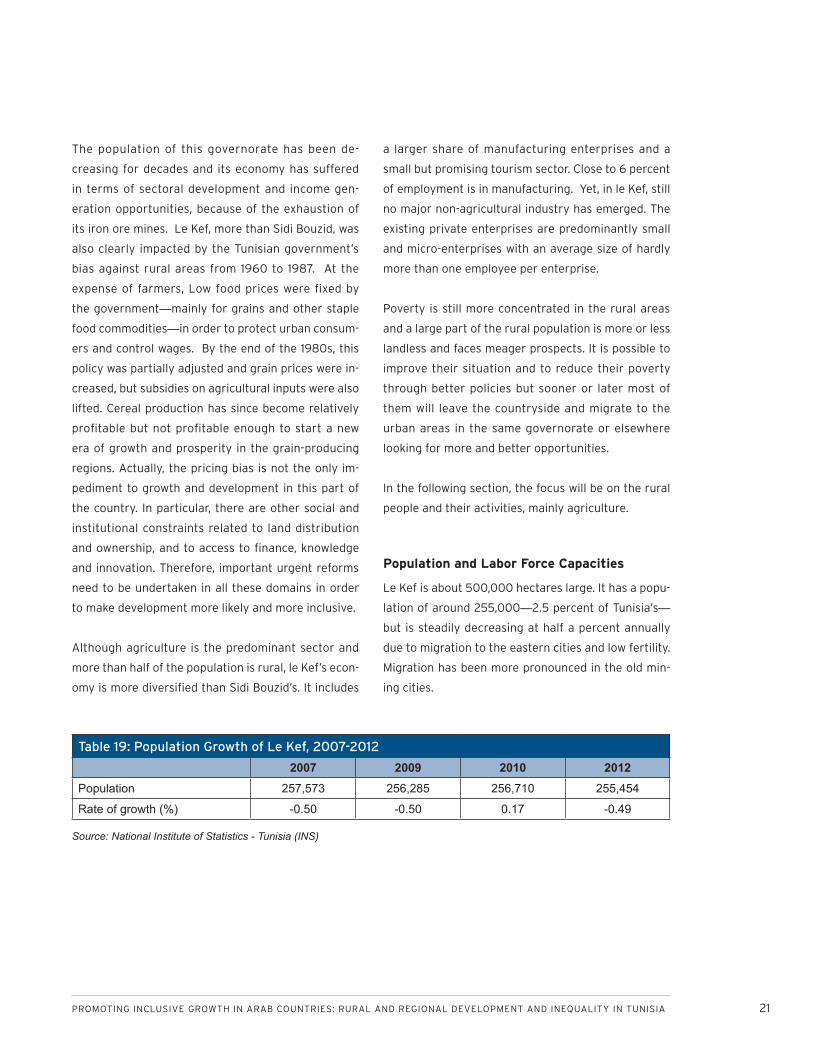
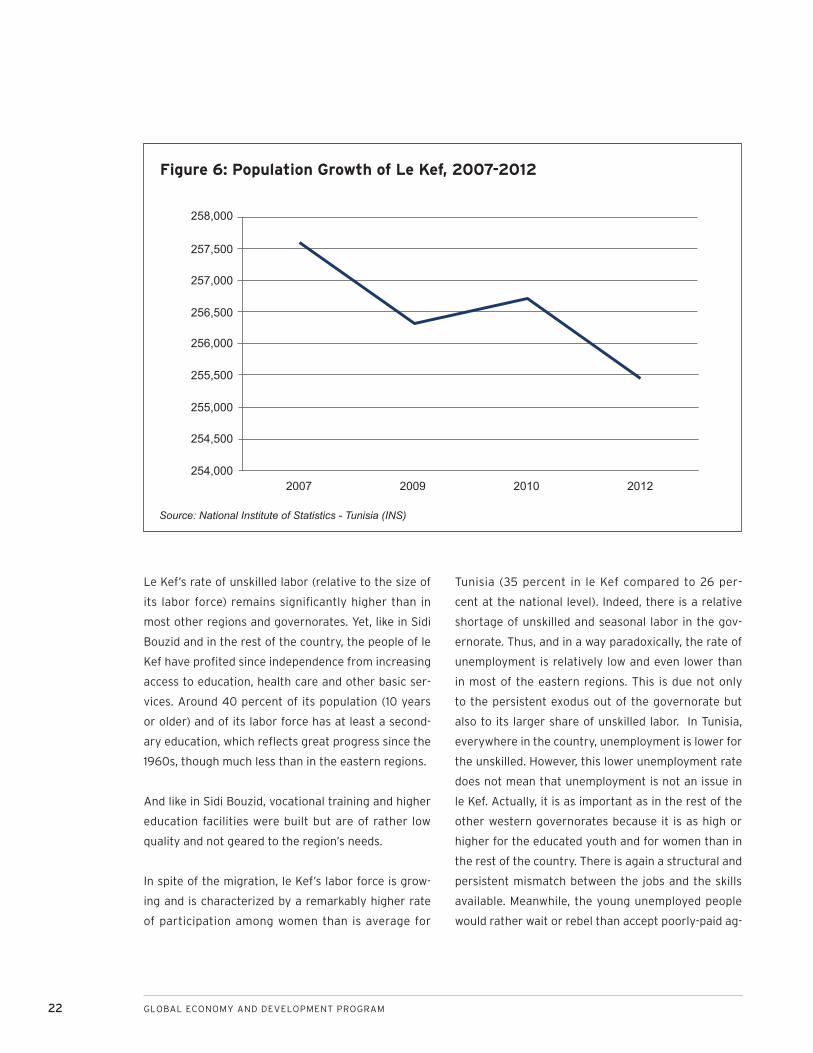
Population and Labor Force Capacities
Le Kef is about 500,000 hectares large. It has a popu-
lation of around 255,000—2.5 percent of Tunisia’s—
but is steadily decreasing at half a percent annually
due to migration to the eastern cities and low fertility.
Migration has been more pronounced in the old min-
ing cities.
Table 19: Population Growth of Le Kef, 2007-2012
2007 2009 2010 2012Population 257,573 256,285 256,710 255,454
Rate of growth (%) -0.50 -0.50 0.17 -0.49
Source: National Institute of Statistics - Tunisia (INS)
22 GLOBAL ECONOMY AND DEVELOPMENT PROGRAM
Le Kef’s rate of unskilled labor (relative to the size of
its labor force) remains significantly higher than in
most other regions and governorates. Yet, like in Sidi
Bouzid and in the rest of the country, the people of le
Kef have profited since independence from increasing
access to education, health care and other basic ser-
vices. Around 40 percent of its population (10 years
or older) and of its labor force has at least a second-
ary education, which reflects great progress since the
1960s, though much less than in the eastern regions.
And like in Sidi Bouzid, vocational training and higher
education facilities were built but are of rather low
quality and not geared to the region’s needs.
In spite of the migration, le Kef’s labor force is grow-
ing and is characterized by a remarkably higher rate
of participation among women than is average for
Tunisia (35 percent in le Kef compared to 26 per-
cent at the national level). Indeed, there is a relative
shortage of unskilled and seasonal labor in the gov-
ernorate. Thus, and in a way paradoxically, the rate of
unemployment is relatively low and even lower than
in most of the eastern regions. This is due not only
to the persistent exodus out of the governorate but
also to its larger share of unskilled labor. In Tunisia,
everywhere in the country, unemployment is lower for
the unskilled. However, this lower unemployment rate
does not mean that unemployment is not an issue in
le Kef. Actually, it is as important as in the rest of the
other western governorates because it is as high or
higher for the educated youth and for women than in
the rest of the country. There is again a structural and
persistent mismatch between the jobs and the skills
available. Meanwhile, the young unemployed people
would rather wait or rebel than accept poorly-paid ag-
Figure 6: Population Growth of Le Kef, 2007-2012
Source: National Institute of Statistics - Tunisia (INS)
258,000
257,500
257,000
256,500
256,000
255,500
255,000
254,500
254,0002007 2009 2010 2012
PROMOTING INCLUSIVE GROWTH IN ARAB COUNTRIES: RURAL AND REGIONAL DEVELOPMENT AND INEQUALITY IN TUNISIA 23
ricultural work. Women, with limited schooling, are the
most willing to work as seasonal farm laborers or as
family aids. Men, except those with higher education,
often end up working in the informal sector.
Currently, the informal sector is pervasive and encom-
passes at least half of the region’s economy. The most
problematic part of this sector is the one linked to
the illegal border trade with the neighboring Algeria.
This trade operates within opaque and corrupt net-
works hard to combat and to reorganize. Although
potentially organized trade with Algeria may offer
much greater opportunities, the border zones remain
among the poorest and most excluded from the de-
velopment process of the country. Their connections
with the illegal organizations are perhaps a form of
revenge against the state that excluded them, and,
overall, the people working in the informal sector feel
excluded and have no access to certified training and
capacity building.
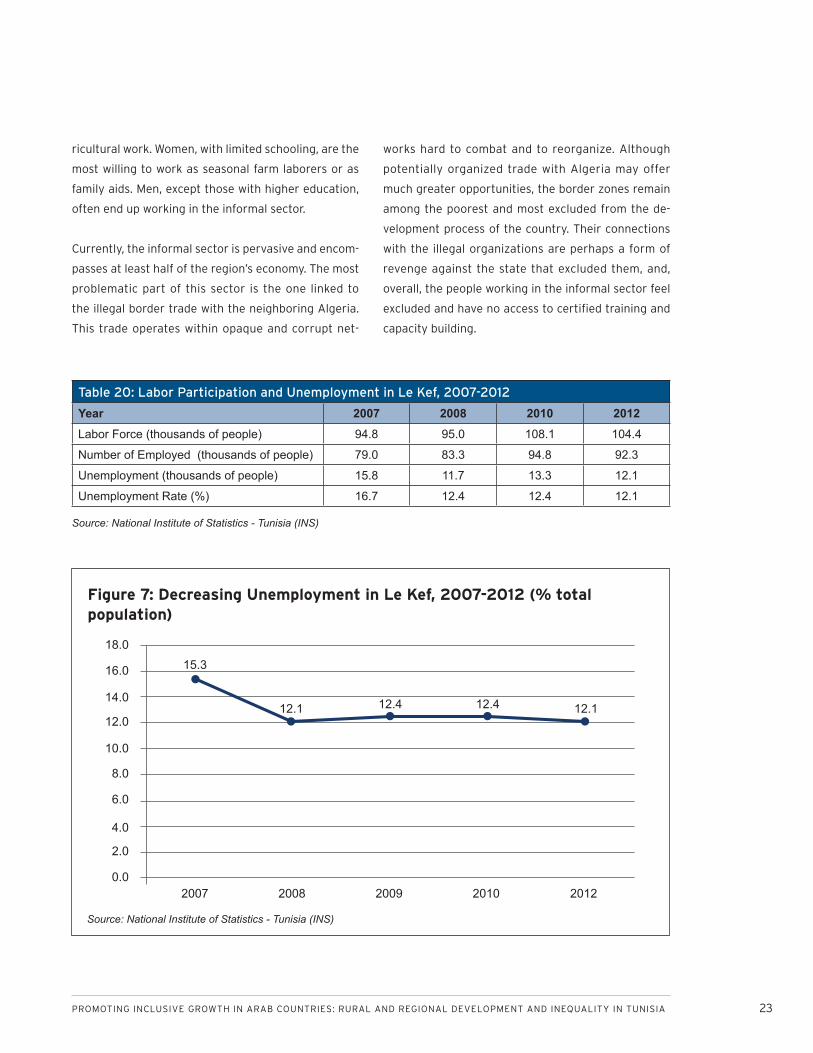
Figure 7: Decreasing Unemployment in Le Kef, 2007-2012 (% total population)
Source: National Institute of Statistics - Tunisia (INS)
Table 20: Labor Participation and Unemployment in Le Kef, 2007-2012
Year 2007 2008 2010 2012Labor Force (thousands of people) 94.8 95.0 108.1 104.4
Number of Employed (thousands of people) 79.0 83.3 94.8 92.3
Unemployment (thousands of people) 15.8 11.7 13.3 12.1
Unemployment Rate (%) 16.7 12.4 12.4 12.1
Source: National Institute of Statistics - Tunisia (INS)
0.0
2.0
4.0
6.0
8.0
10.0
12.0
14.0
16.0
18.015.3
12.1 12.112.4 12.4
2007 2008 2009 2010 2012
24 GLOBAL ECONOMY AND DEVELOPMENT PROGRAM
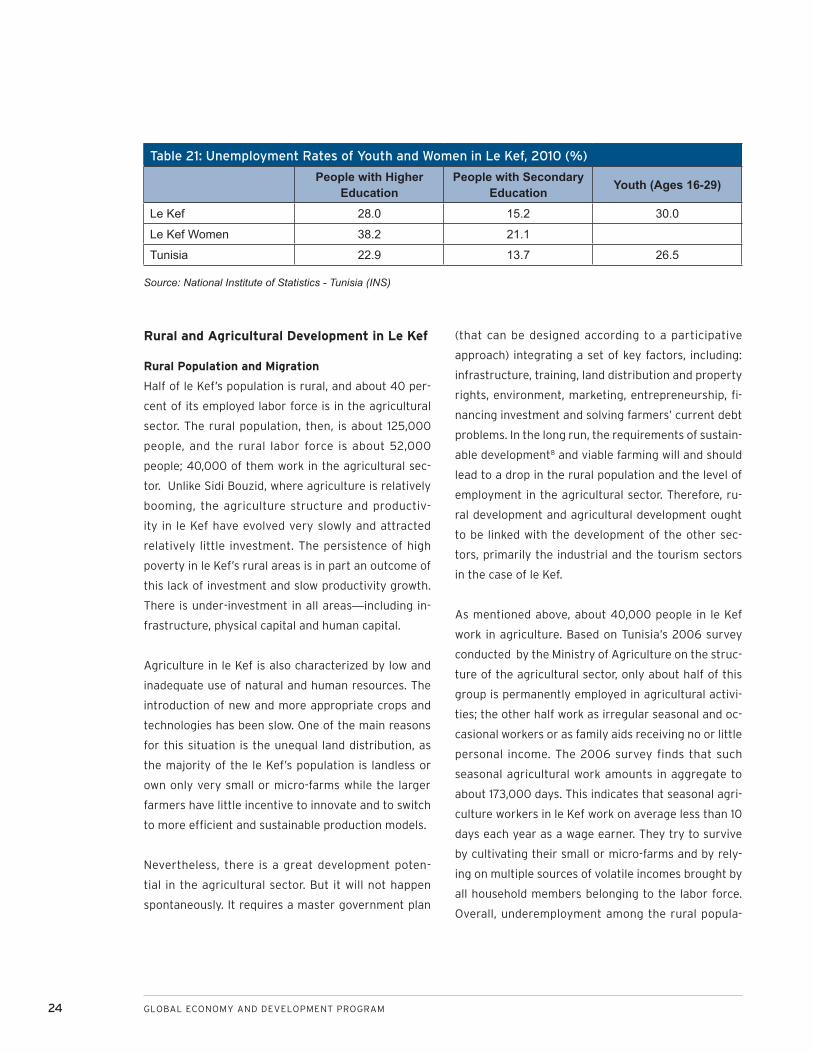
Rural and Agricultural Development in Le Kef
Rural Population and Migration
Half of le Kef’s population is rural, and about 40 per-
cent of its employed labor force is in the agricultural
sector. The rural population, then, is about 125,000
people, and the rural labor force is about 52,000
people; 40,000 of them work in the agricultural sec-
tor. Unlike Sidi Bouzid, where agriculture is relatively
booming, the agriculture structure and productiv-
ity in le Kef have evolved very slowly and attracted
relatively little investment. The persistence of high
poverty in le Kef’s rural areas is in part an outcome of
this lack of investment and slow productivity growth.
There is under-investment in all areas—including in-
frastructure, physical capital and human capital.
Agriculture in le Kef is also characterized by low and
inadequate use of natural and human resources. The
introduction of new and more appropriate crops and
technologies has been slow. One of the main reasons
for this situation is the unequal land distribution, as
the majority of the le Kef’s population is landless or
own only very small or micro-farms while the larger
farmers have little incentive to innovate and to switch
to more efficient and sustainable production models.
Nevertheless, there is a great development poten-
tial in the agricultural sector. But it will not happen
spontaneously. It requires a master government plan
(that can be designed according to a participative
approach) integrating a set of key factors, including:
infrastructure, training, land distribution and property
rights, environment, marketing, entrepreneurship, fi-
nancing investment and solving farmers’ current debt
problems. In the long run, the requirements of sustain-
able development8 and viable farming will and should
lead to a drop in the rural population and the level of
employment in the agricultural sector. Therefore, ru-
ral development and agricultural development ought
to be linked with the development of the other sec-
tors, primarily the industrial and the tourism sectors
in the case of le Kef.
As mentioned above, about 40,000 people in le Kef
work in agriculture. Based on Tunisia’s 2006 survey
conducted by the Ministry of Agriculture on the struc-
ture of the agricultural sector, only about half of this
group is permanently employed in agricultural activi-
ties; the other half work as irregular seasonal and oc-
casional workers or as family aids receiving no or little
personal income. The 2006 survey finds that such
seasonal agricultural work amounts in aggregate to
about 173,000 days. This indicates that seasonal agri-
culture workers in le Kef work on average less than 10
days each year as a wage earner. They try to survive
by cultivating their small or micro-farms and by rely-
ing on multiple sources of volatile incomes brought by
all household members belonging to the labor force.
Overall, underemployment among the rural popula-
Table 21: Unemployment Rates of Youth and Women in Le Kef, 2010 (%)
People with Higher Education
People with Secondary Education Youth (Ages 16-29)
Le Kef 28.0 15.2 30.0
Le Kef Women 38.2 21.1
Tunisia 22.9 13.7 26.5
Source: National Institute of Statistics - Tunisia (INS)
PROMOTING INCLUSIVE GROWTH IN ARAB COUNTRIES: RURAL AND REGIONAL DEVELOPMENT AND INEQUALITY IN TUNISIA 25
tion is close to 50 percent. This means that 20,000
jobs need to be created in order to fully employ the
40,000 unemployed rural people. Could they be cre-
ated within the rural areas? If not, there are 20,000
potential additional migrants out of the rural areas
of le Kef.
Some of these 20,000 people may arguably be em-
ployed in non-agricultural rural activities but the
possibilities for this type of employment are rather
limited. As we will explain, alternative rural activities
exist and there is also a real potential in alternative ir-
rigated farming—mainly in fruits and vegetables and
diary production. However, in the long run farming op-
portunities are still not enough to accommodate the
entirety of the existing rural population.
In the medium and long run, agriculture will put out
of employment more workers than it can hire. Rural-
to-urban migration will continue and may even ac-
celerate as alternative activities in the urban areas
continue to be developed, given that labor mobility is
generally driven by the difference in expected return.
The main challenge in the short and medium run is
therefore in the timing of the migration process and in
finding ways to combat and limit poverty among the
poorly employed rural population.
Ideally, a radical agrarian reform allowing for the re-
distribution of land owned by the richest landlords to
the poor farmers may provide not only more justice
but also a more efficient use of resources. However,
politically, this option is not considered. The small
fraction of farmers—624 in 2005—who own large
estates of 100 or more hectares represent 3 percent
of the total number of le Kef’s farmers, yet they con-
trol and often misallocate 35 percent of its land. The
misallocation of land is not caused by the size of the
holdings but by these farmers’ behaviors and situa-
tions. The rich landlords in this region used to own
an even larger share of the cultivated land and to
lead a rather feudal system. Their property generated
large rents and they did not have to do farm work or
directly supervise workers. Today, a large number of
the current landlords still have the same rentier and
feudal attitude and would rather avoid any involve-
ment in direct farming. Instead they prefer to either
rely on tenants or rent their land for limited periods
of time to farmers who then do not have the incentive
to undertake investment and to take important risks.
The outcome is that this land, which is often the best
and with the highest potential, is locked in stagnant
agrarian modes and is persistently allocated to the
traditional low-return grain production with little di-
versification and productivity growth. Table 25 shows
that in le Kef tenant farming and farming on rented
land is more frequent than in the rest of the country,
and much more than in Sidi Bouzid. The proportions
of rented and tenant-run farms in le Kef—3.3 percent
and 5.7 percent, respectively—may seem small. In fact
they are substantial because they correspond to the 3
percent of large farms and the 6.5 percent of medium-
sized farms (50 to 100 hectares), which together form
55 percent of total cultivated land in le Kef (2005
data). The 3.3 and 5.7 percent almost coincide with
the 3 percent and 6.5 percent of respectively large
and medium-sized farms of Le Kef that cover a little
more than 55 percent of the land (2005 data) .
This uneven and inadequate land distribution is ag-
gravated by the very complex issue of land ownership,
certified registration, and segmentation resulting
from heritage rules. All over Tunisia, this is a major is-
sue which applies to all holding sizes and often blocks
all access to financial resources and modernization
projects. Therefore, while a radical agrarian reform
comparable to the one undertaken in Japan and Korea
is not considered by any influential political party’s
26 GLOBAL ECONOMY AND DEVELOPMENT PROGRAM
agenda, the country urgently needs measures to en-
sure and clarify property rights, clarify entitlement to
land and agricultural assets and create the incentive
for more direct farming and effective involvement of
farmers in the management of their projects. This is
important for investments, productivity and income
growth of large holdings, and even more important for
small and medium ones.
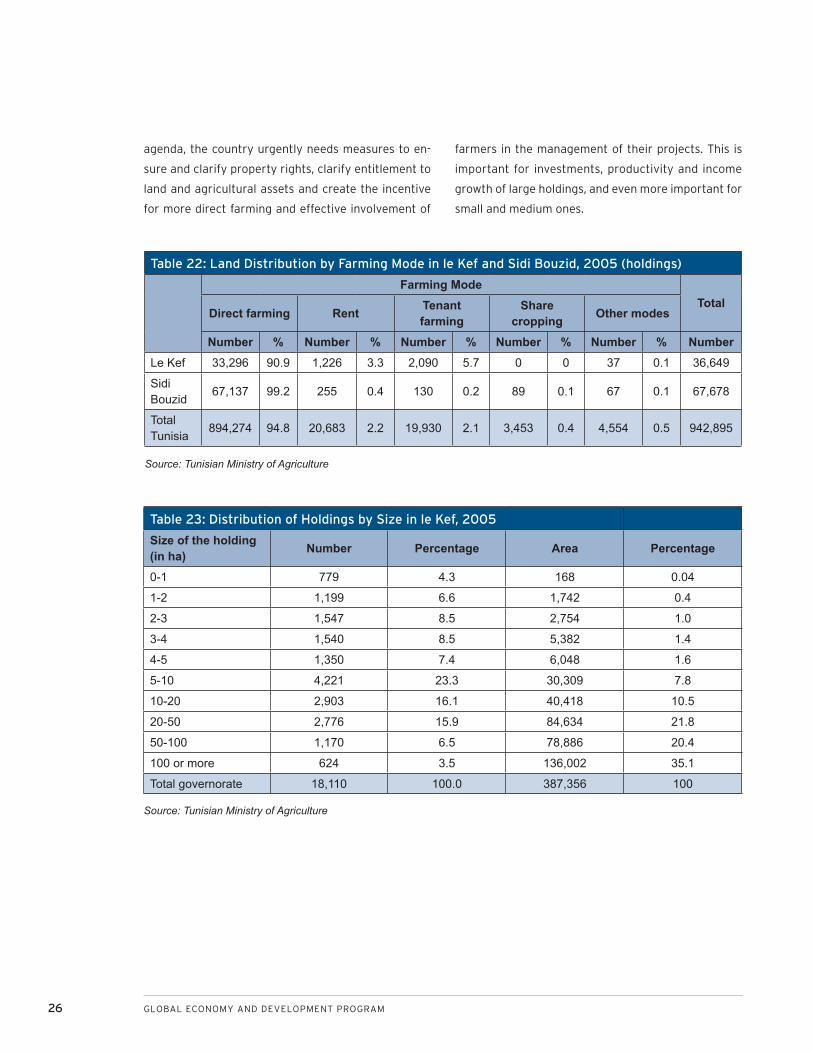
Table 22: Land Distribution by Farming Mode in le Kef and Sidi Bouzid, 2005 (holdings)
Farming ModeTotal
Direct farming Rent Tenant farming
Share cropping Other modes
Number % Number % Number % Number % Number % NumberLe Kef 33,296 90.9 1,226 3.3 2,090 5.7 0 0 37 0.1 36,649
Sidi Bouzid
67,137 99.2 255 0.4 130 0.2 89 0.1 67 0.1 67,678
Total Tunisia
894,274 94.8 20,683 2.2 19,930 2.1 3,453 0.4 4,554 0.5 942,895
Source: Tunisian Ministry of Agriculture
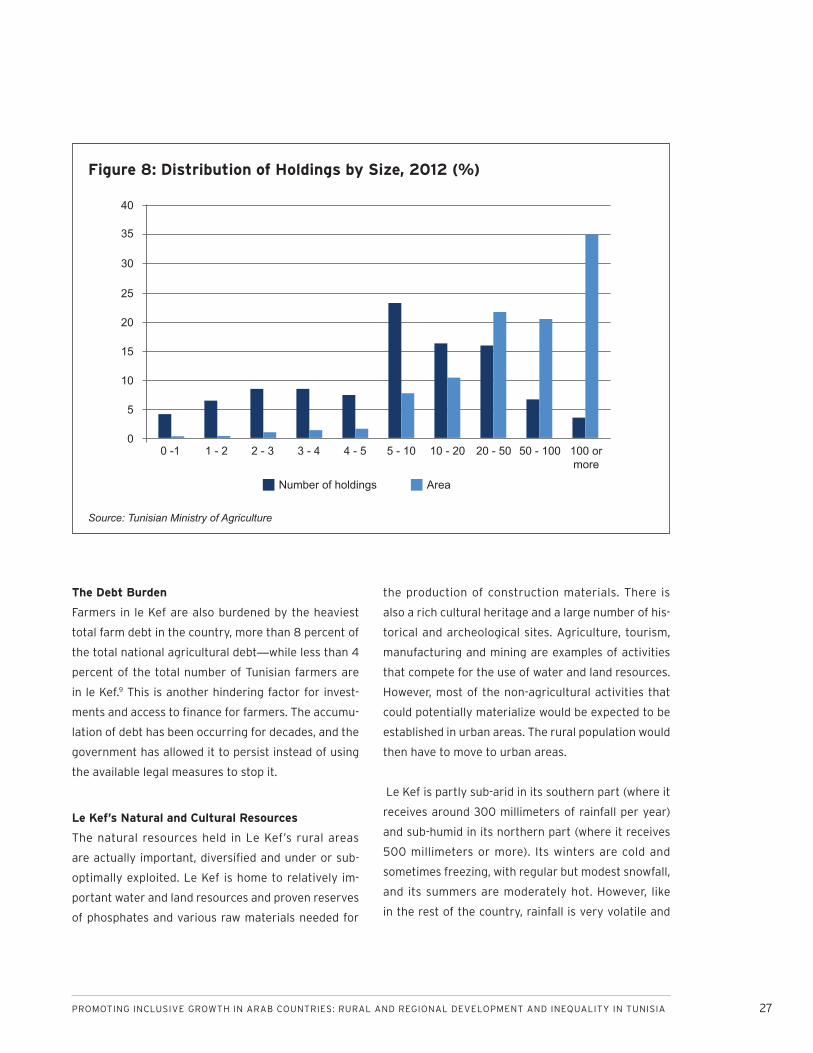
Table 23: Distribution of Holdings by Size in le Kef, 2005
Size of the holding (in ha) Number Percentage Area Percentage
0-1 779 4.3 168 0.04
1-2 1,199 6.6 1,742 0.4
2-3 1,547 8.5 2,754 1.0
3-4 1,540 8.5 5,382 1.4
4-5 1,350 7.4 6,048 1.6
5-10 4,221 23.3 30,309 7.8
10-20 2,903 16.1 40,418 10.5
20-50 2,776 15.9 84,634 21.8
50-100 1,170 6.5 78,886 20.4
100 or more 624 3.5 136,002 35.1
Total governorate 18,110 100.0 387,356 100
Source: Tunisian Ministry of Agriculture
PROMOTING INCLUSIVE GROWTH IN ARAB COUNTRIES: RURAL AND REGIONAL DEVELOPMENT AND INEQUALITY IN TUNISIA 27
Figure 8: Distribution of Holdings by Size, 2012 (%)
Source: Tunisian Ministry of Agriculture
The Debt Burden
Farmers in le Kef are also burdened by the heaviest
total farm debt in the country, more than 8 percent of
the total national agricultural debt—while less than 4
percent of the total number of Tunisian farmers are
in le Kef.9 This is another hindering factor for invest-
ments and access to finance for farmers. The accumu-
lation of debt has been occurring for decades, and the
government has allowed it to persist instead of using
the available legal measures to stop it.
Le Kef’s Natural and Cultural Resources
The natural resources held in Le Kef’s rural areas
are actually important, diversified and under or sub-
optimally exploited. Le Kef is home to relatively im-
portant water and land resources and proven reserves
of phosphates and various raw materials needed for
the production of construction materials. There is
also a rich cultural heritage and a large number of his-
torical and archeological sites. Agriculture, tourism,
manufacturing and mining are examples of activities
that compete for the use of water and land resources.
However, most of the non-agricultural activities that
could potentially materialize would be expected to be
established in urban areas. The rural population would
then have to move to urban areas.
Le Kef is partly sub-arid in its southern part (where it
receives around 300 millimeters of rainfall per year)
and sub-humid in its northern part (where it receives
500 millimeters or more). Its winters are cold and
sometimes freezing, with regular but modest snowfall,
and its summers are moderately hot. However, like
in the rest of the country, rainfall is very volatile and
Number of holdings Area
00 -1 1 - 2 2 - 3 3 - 4 4 - 5 5 - 10 10 - 20 20 - 50 50 - 100 100 or
more
5
10
15
20
25
30
35
40
28 GLOBAL ECONOMY AND DEVELOPMENT PROGRAM
makes agricultural yields very random; this volatile
weather may have a negative impact on the under-
ground water reserves.11
There is a variety of farm types and quality but the
land is often threatened by water and wind erosion.
Without protection and precautions this threat may
become very serious.
In spite of its relatively high capacities and the avail-
ability of important water resources in many parts of
this governorate, irrigated farming has been only a re-
cent development in le Kef; 80 percent of the existing
15,000 hectares of irrigable land have been developed
since 1990.
Out of the 360,000 hectares of cultivated land,
215,000 hectares are allocated to cereal and cattle
production, which is traditionally dependent on rain-
fall and increasingly less labor intensive (more and
more mechanized). There are also about 120,000
hectares of grazing land and forest that require even
less labor. Most of the landowners and farmers are
men (18,000) with little formal education (80 percent
are illiterate or had a primary education) and are un-
likely to initiate by themselves and without any gov-
ernment intervention any major transformations in
terms of farming modes and techniques and alterna-
tive non-agricultural activities.
The total estimated water available in le Kef is 346.8
million cubic millimeters (Mm3) per year, 35 percent of
which is rather underused groundwater and stream
water. Given these resources and the current know-
how, more than 40,00012 additional hectares may be
irrigated. They may be used for fairly intensive fruit
and vegetable production and other labor-intensive
activities; this is a lot compared to what has been
achieved in terms of intensive irrigated farming.
However, under the most optimistic assumption and
assuming a full use of the agricultural potential, agri-
culture would allow for the creation of large numbers
of new jobs but less than the 20,000 jobs needed for
the full employment of the rural population. Detailed
employment figures would depend on the type of crop
and farming techniques which are hard to predict at
this stage.
Development Institutions and the
ODESYPANO Experience
Generally speaking, the Tunisian institutional setup is
excessively centralized and the regional development
institutions are managed in a top-down model. The
inefficiency of this system is particularly obvious in
the area of management of irrigation water, training
and extension services, and marketing of agricultural
products.
Table 24: Agricultural Debt in Le Kef, 200710 (thousands of Tunisian dinars)
Outstanding debt Unpaid debt Contractual
interestsPenalty
interests Total debt
Le Kef 16,055 25,643 9,602 15,641 66,941
Total Tunisia 279,533 269,158 100,991 162,199 811,881
Source: Regional Agricultural Development Commissioner (CRDA) Le Kef
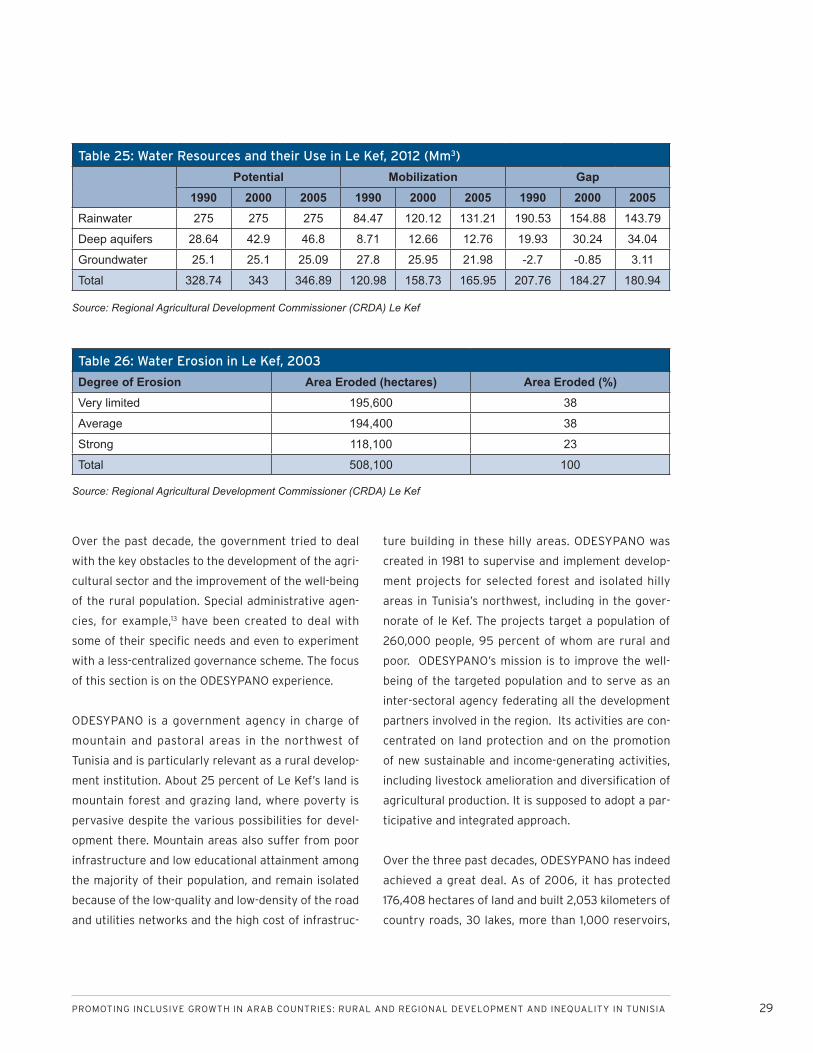
PROMOTING INCLUSIVE GROWTH IN ARAB COUNTRIES: RURAL AND REGIONAL DEVELOPMENT AND INEQUALITY IN TUNISIA 29
Over the past decade, the government tried to deal
with the key obstacles to the development of the agri-
cultural sector and the improvement of the well-being
of the rural population. Special administrative agen-
cies, for example,13 have been created to deal with
some of their specific needs and even to experiment
with a less-centralized governance scheme. The focus
of this section is on the ODESYPANO experience.
ODESYPANO is a government agency in charge of
mountain and pastoral areas in the northwest of
Tunisia and is particularly relevant as a rural develop-
ment institution. About 25 percent of Le Kef’s land is
mountain forest and grazing land, where poverty is
pervasive despite the various possibilities for devel-
opment there. Mountain areas also suffer from poor
infrastructure and low educational attainment among
the majority of their population, and remain isolated
because of the low-quality and low-density of the road
and utilities networks and the high cost of infrastruc-
ture building in these hilly areas. ODESYPANO was
created in 1981 to supervise and implement develop-
ment projects for selected forest and isolated hilly
areas in Tunisia’s northwest, including in the gover-
norate of le Kef. The projects target a population of
260,000 people, 95 percent of whom are rural and
poor. ODESYPANO’s mission is to improve the well-
being of the targeted population and to serve as an
inter-sectoral agency federating all the development
partners involved in the region. Its activities are con-
centrated on land protection and on the promotion
of new sustainable and income-generating activities,
including livestock amelioration and diversification of
agricultural production. It is supposed to adopt a par-
ticipative and integrated approach.
Over the three past decades, ODESYPANO has indeed
achieved a great deal. As of 2006, it has protected
176,408 hectares of land and built 2,053 kilometers of
country roads, 30 lakes, more than 1,000 reservoirs,
Table 26: Water Erosion in Le Kef, 2003
Degree of Erosion Area Eroded (hectares) Area Eroded (%)Very limited 195,600 38
Average 194,400 38
Strong 118,100 23
Total 508,100 100
Table 25: Water Resources and their Use in Le Kef, 2012 (Mm3)
Potential Mobilization Gap1990 2000 2005 1990 2000 2005 1990 2000 2005
Rainwater 275 275 275 84.47 120.12 131.21 190.53 154.88 143.79
Deep aquifers 28.64 42.9 46.8 8.71 12.66 12.76 19.93 30.24 34.04
Groundwater 25.1 25.1 25.09 27.8 25.95 21.98 -2.7 -0.85 3.11
Total 328.74 343 346.89 120.98 158.73 165.95 207.76 184.27 180.94
Source: Regional Agricultural Development Commissioner (CRDA) Le Kef
Source: Regional Agricultural Development Commissioner (CRDA) Le Kef
30 GLOBAL ECONOMY AND DEVELOPMENT PROGRAM
milk-collection facilities, schools, and basic health cen-
ters. ODESYPANO has also created better access to
clean water and electricity and contributed to income
growth. Income in the ODESYPANO region has, on av-
erage, increased at an annual rate of 5 percent, partly
owing to the introduction of new techniques and
crops and to better access to markets and inputs. Five
percent growth is actually the same average growth
over the country and is not totally the outcome of
ODESYPANO’s effort. ODESYPANO was not fully em-
powered, as it should be according to its missions, yet
it proved that it can act as a developer and an effec-
tive organizer and coordinator close to the people.
The village offices and committees it established are
quite effective instruments.
However, because ODESYPANO’s financial resources
and real power were limited, its achievements al-
though substantial were well below the needs of the
population. Total investments over 25 years from
1981 to 2005 amounted to 224 million Tunisian dinars
(around $150 million coming mainly from foreign aid),
for 260,000 people. That is the equivalent of about
one 1000 dinars ($650) per person for 25 years, or
$26 per person per year. This was enough to partially
alleviate poverty for some of the targeted population
but too little to significantly change their well-being.
ODESYPANO was not in practice empowered to deal
with all the key barriers to rural development, in-
cluding access to financial resources for the popula-
tion, land and assets registration and entitlement
and lack of effective training and illiteracy. Based on
ODESYPANO’s data and on our own field investiga-
tion, it is clear that nothing or little was done to pro-
vide the poor peasants with more land, more cattle,
and better training. Aside from some negligible micro-
credits, they provided no access to bank financing.
For instance, for a large number of peasants, their
income and life could be radically improved if each of
them were provided with a few dozen sheep (about
50 sheep)—enough to generate a decent and regular
income. This would be feasible if ODESYPANO could
guarantee the necessary loans, but ODESYPANO does
not have the financial resources or power to do this.
The development of some major new activities could
have made a significant difference for this region. For
instance, the targeted region has a real potential for
tourism but lacks the infrastructure and capital for
starting it. In Taiwan, the government promoted the
creation of a large number of enterprises in rural ar-
eas and a lot of off-farm good jobs.
ODESYPANO’s experience shows that a partial ap-
proach may be beneficial but not sufficient, and that
there is a need for a holistic approach that integrates
all the key factors and dimensions of development
(training, institution-building, capital accumulation,
price and marketing policies) that are out of its con-
trol. The successful experience of several other coun-
tries, especially Asian countries, was more holistic.
PROMOTING INCLUSIVE GROWTH IN ARAB COUNTRIES: RURAL AND REGIONAL DEVELOPMENT AND INEQUALITY IN TUNISIA 31
LESSONS FROM INTERNATIONAL EXPERIENCES
Alternative approaches and better policies in the
area of regional and rural development may be drawn
from international experience—both failures and suc-
cesses. In particular, never before in human history
have as many people been saved from poverty and
hunger as recently achieved in China, India and other
Asian countries such as Vietnam, where the largest
rural communities continue to live (Ravallion and Wale
2008).
The reforms undertaken in these countries, as de-
scribed in Jean-Philippe Peemans’s (2011) study, con-
firm the importance and efficiency of free and private
enterprise, including in agriculture, and show how
crucial incentive compatibility and complementari-
ties between private interests and collective (regional
or national) targets are. Without incentive compat-
ibility, objectives would not be reached even if they
were technically feasible. In the case of Tunisia, this
is important because there are many inconsistencies
between certain government policies—such as price
policies—and other objectives regarding agriculture
growth. Reforms should also fit in a comprehensive
economic reform program and complement other ma-
jor policies: industrial policy, labor market policy, in-
ternational trade, monetary policy and the exchange
regime. More specifically, for the rural population and
for agricultural growth, government should devote
sufficient effort to main infrastructural projects such
as irrigation and roads and ensure reasonable input
prices. It should also provide an efficient and equi-
table marketing platform for agricultural commodi-
ties. These measures would have a positive impact on
production and create the incentive for farmers and
peasants to adopt more efficient technologies and to
respond to the increasing and changing demand for
food.
In this section, we focus on the Korean and Taiwanese
experiences since they have quite successfully inte-
grated most of these conditions and learned from the
wrong policies they adopted in the 1960s (that are
similar to Tunisia’s current policies).
Korea started in the 1960s with a biased price policy
against the farming and rural community. The purpose
was to keep food prices low (primarily grain prices),
but this created a disincentive for higher productiv-
ity and growth. Peasants remained very poor and
started migrating in large numbers and too quickly to
the cities, as reported in FAO (2006), Looney (2012),
Peemans (2011), Park (2009) and others. In the early
1970s, Korea decided to correct this disequilibrium
and to switch to a radically different policy allowing
for a positive bias in favor of the rural population.
It launched the “Saemaul Undong” experience (also
known, according to Park (2009), as the New Village
Movement or the New Community Movement). This
policy was consistent with Korea’s export promo-
tion strategy adopted at the same time and with the
continuous improvement of its export sector com-
petitiveness, but it was not consistent with Korea’s
commitment toward the World Trade Organization
(WTO) and with its later obligations as a member
of the Organization for Economic Cooperation and
Development (OECD). Indeed, ten years later, Korea
had to re-adjust its rural development policy in order
to comply with its new status. At its current stage of
development, Korea can afford to be less concerned
with its rural community, which is now much smaller
and can rely more on capital and knowledge-intensive
technologies rather than on subsidized ordinary in-
puts for its production. Nevertheless, the support
given to the agricultural sector and the rural com-
munity during the 1970s was an important pillar of
Korea’s overall development strategy. The Saemaul
Undong Experience was a remarkable Korean experi-
32 GLOBAL ECONOMY AND DEVELOPMENT PROGRAM
ence. Many features of the Saemaul Undong are spe-
cific to 1970s Korea and will not be mentioned here,
however some universal lessons may be learned from
it. The main lesson is that it is possible to significantly
improve the livelihood of the rural population but not
without the government. The government role as cat-
alyst and coordinator and in designing and initiating
rural advancement programs is essential.
The effectiveness of such state intervention requires
that the rural population accepts the state as a devel-
opmental state and its agents as a potential source
of assistance rather than as feared exploiters. The
Korean government was able to mobilize the popula-
tion and to change their attitude toward the govern-
ment. This confirms that the political commitment
of the government was a key success factor, but the
program would have failed regardless of this commit-
ment and the political commitment would have been
meaningless if the government policies were not cred-
ible or if they were not compatible with the peasants’
interests.
Indeed, one of the main objectives of this policy was
to raise the level of rural well-being. The government
gradually provided all peasants in all villages with
better housing, subsidized agricultural inputs, paved
roads, clean water, electricity, extension services and
high-yield seeds and assured for them high output
prices The green revolution in grain production was
an important component of the government program
and the peasants adhered to it because it was profit-
able for them to do so.
Price support for farmers, especially for grain produc-
tion, concomitantly with subsidized food for urban
consumers, was maintained during the 1970s as long
as the fiscal cost of this policy was acceptable and it
did not contradict other major international interests
of the country.
Effective local organization and effective institutions
are also critical to the success of the rural develop-
ment programs. Three levels of administration were
created in Korea. At the lowest level, for each village
an elected village committee, headed by an appointed
leader, played an important role but under strong
central supervision. The central level was placed un-
der the ministry of home affairs and had the power
to deal with all relevant ministries, which allowed it
to avoid dependence on a large number of separate
agencies and ministries. Taiwan’s development experi-
ence paid even more attention to this key institutional
component.
In both Korea and Taiwan, parastatal organizations
were part of the system and were in charge of various
marketing missions (collecting and purchasing rice,
selling inputs to farmers and providing extension ser-
vices and credits to farmers)
Radical land reform was also a basic factor for rural
development in both countries. This does not mean
that it is a universal necessary condition. It is true
that the relatively egalitarian structure of land was
for a certain period a favorable factor, but what is
more essential is to legally secure entitlements to
assets, especially land and water as well as access to
markets.14
The Saemaul Undong experience also confirms the
benefit of a holistic approach integrating training,
institution-building, capital accumulation, price and
marketing policies and villagers’ needs and chal-
lenges. It also comprehensively dealt with non-agri-
cultural employment.
PROMOTING INCLUSIVE GROWTH IN ARAB COUNTRIES: RURAL AND REGIONAL DEVELOPMENT AND INEQUALITY IN TUNISIA 33
Japan and Taiwan agricultural policies showed the im-
portance of extension services and were more based
on market incentives. The Taiwanese experience also
differed from the Korean because Taiwan has a higher
food production potential, enough to meet its domes-
tic demand for food and to contribute to exports and
generate capital and labor for industrialization.
Nevertheless, in spite of the rapid rural development
and improvement in the livelihood of the rural popu-
lation Saemaul Undong was ended at the end of the
1970s. The Korean government stopped insisting on
the use of the high-yield rice variety and ended the
price support policy because it had become too costly
and too difficult to manage. By then, Korea’s policies
and priorities were also changed.
Both in Korea and Taiwan, this rapid and highly in-
clusive rural development process was not enough
to stop the rural exodus to the cities. More than half
of the rural Korean population (7.7 out of 14.4 million
people) migrated to urban areas by 1980, and the pro-
cess continued. By 2010, Korea’s rural population was
reduced to less than 7 percent and mechanization be-
came critical for the survival of family farming.
Massive migration out the urban areas happened in
Taiwan as well but it was slower because Taiwan could
provide off-farm employment for the rural people.
Like everywhere in all parts of the world, the trend is
towards a much smaller rural population.
34 GLOBAL ECONOMY AND DEVELOPMENT PROGRAM
ALTERNATIVE POLICIES AND RECOMMENDATIONS
Tunisia has adopted many features of the rural de-
velopment policies of Korea and Taiwan, including
price subsidies and support, and less systematically
provision of infrastructure and training. What it has
not achieved is a comprehensive, inclusive and con-
sistent strategy. Important efforts and programs were
devoted to certain components of rural development
while other components were either neglected or
managed ineffectively. For instance, public water fa-
cilities were provided in many places but not the right
price incentive and the access to markets. The appro-
priate land distribution and land property laws were
often missing or poorly enforced in Tunisia.
Le Kef, Sidi Bouzid and other regions can achieve
ambitious rural development targets and very signifi-
cantly improve the situation of their rural population
if a more coherent strategy and a holistic approach
were adopted and implemented—taking into account
in a realistic manner all the major obstacles and all the
key development factors (natural resources, skills and
human resources, population issues, land ownership
and distribution, financial needs, incentive compatible
and efficient institutions).
The international experiences also show that agricul-
ture development should not be designed separately
from other development programs. A strategy based
on micro-farming alone is in general not sustainable,
or at least will not be in the long term. Small and
micro-projects are beneficial for combating poverty
and reducing unemployment, but they are not enough
for reducing regional disparities and ensuring sustain-
able growth based on inclusive institutions. There is a
need for well-coordinated comprehensive programs
combining public and private interventions and in-
tegrating public infrastructure, training and capac-
ity development, marketing, financial resources and
institutional reforms. Coordination between all these
dimensions is primarily the responsibility of govern-
ment, and government intervention is indispensable.
Finally, exodus to the urban areas is inevitable—even
when and where rapid rural development is pos-
sible. There is no reason why this exodus should be
fully stopped or constrained within the same region,
and there is no logic for ensuring that all regions
are equally urbanized and industrialized. Inevitably,
growth will always be faster in some regions and pop-
ulation will move to the faster growing regions. This is
a natural and expected process.
PROMOTING INCLUSIVE GROWTH IN ARAB COUNTRIES: RURAL AND REGIONAL DEVELOPMENT AND INEQUALITY IN TUNISIA 35
REFERENCES
Boughzala, Mongi (2010), “Employment Dynamics
in the Gafsa and Le Kef Governorates :
Opportunities and Challenges to Job Creation”, a
Study Directed by M. Boughzala, in collaboration
with Salah Ahmed and Mohamed Elloumi , UNDP,
MDG Achievement Fund, in French.
CNEA-MEDD-GTZ (2008), “Strategy Study on
Sustainable Development and Agriculture in the
Governorates of Gabes, Sidi Bouzid, Nabeul, the
Kef and Bizerte,” Ministry of Agriculture, Tunisia,
in French.
FAO (2006), “Adjustment and Reforms of the Main
Asian Economies and their Impact on Food
Security and Poverty in the Rest of the Region,”
28th Regional FAO Conference for Asia and the
Pacific, Jakarta, Indonesia, 15-19 May, 2006.
Henia, Abdelhamid (2014), “The Tunisian Midwest in
the 18th and 19th century”, in Arabic, a paper pre-
sented at the seminar organized by the University
of Tunis, Faculty of Social Sciences in collabora-
tion with UGTT, 10 January 2014, Tunis, Tunisia.
International Fund for Agricultural Development
(2001), Rural Poverty Report 2001.
Lipset, Seymour (1959), “Some Political Requisites of
Democracy: Economic Development and Political
Legitimacy,” The American Political Science
Review, 53(1), 69-105.
Looney, Kristin (2012), “The Rural Developmental
State: Modernization Campaigns and Peasant
Politics in China, Taiwan and South Korea,”
Harvard University, Graduate School of Arts and
Science.
Mougou, Abdelaziz (2013), “Regional Plan for the
Environment and Sustainable Development for
Sidi Bouzid Governorate: the Agricultural Sector,”
GIZ, Tunis, non-published.
Norel, Philippe (2005), “Was Economic Development
Born in Asia?” Research Center on Economic and
Financial Integration, Poitiers University, Poitiers,
in French.
Park, Sooyoung (2009), “Analysis of Saemaul Undong:
A Korean Rural Development Program in the
1970s,” Asia-Pacific Development Journal, 16(2).
Peemans, Jean-Philippe (2011), “Discourse and Facts
on Rural Development in the World and South
Asia, (1945-2010), Studies and Documents of the
Research Group on East and Southeast Asia,” 1,
in French.
Ravallion, Martin and Dominique van de Walle
(2008), “Agrarian Reforms and Poverty in East
Asia,” Finance and Development, International
Monetary Fund.
36 GLOBAL ECONOMY AND DEVELOPMENT PROGRAM
ENDNOTES1. In 1956, Tunisia gained independence from French
colonialism.
2. See Henia (2014)
3. See Lipset (1959)
4. One Tunisian Dinar = $0.60 (December 2013 rate)
5. Sidi Bouzid’s historical name is Gammouda.
6. See Mougou (2013) for more on this process.
7. Sfax is the second major industrial city in Tunisia.
It is located on the east coast.
8. Obviously, sustainable development has to be
profitable for the enterprise; otherwise it would
not be pursued. A loss generating activity would
not be undertaken and would not last.
9. A large part of this outstanding debt is actually
long overdue, and is financially worthless in terms
of bank assets.
10. No more recent data is available but it is clear
that the situation has not improved in Le Kef and
in the rest of the country.
11. Further details about the climate and other natu-
ral factors are provided in Boughzala (2010) and
CNEA-MEDD-GTZ (2008).
12. This number, 40,000, is obtained under the as-
sumption that 3 Mm3 of water are needed to ir-
rigate 1,000 hectares and that 35 percent of the
water resources are not used.
13. ODESYPANO: Northwest Sylvo Pastoral Develop-
ment Office
14. See the International Fund for Agricultural Devel-
opment (2001)
The views expressed in this working paper do not necessarily reflect the official position of Brookings, its board or the advisory council members .
© 2014 The Brookings Institution
ISSN: 1939-9383
1775 Massachusetts Avenue, NW Washington, DC 20036 202-797-6000 www.brookings.edu/global