prolonged febrile seizures and tle: hot new information...
TRANSCRIPT
Pediatric State of the Art Prolonged Febrile Seizures and TLE:
Hot New Information December 3, 2012
Shlomo Shinnar, MD, PhD, Co-Chair
Montefiore Medical Center / Albert Einstein College of Medicine
New York, NY
Tallie Z. Baram, MD, PhD, CO-Chair
University of California-Irvine
Irvine, CA
American Epilepsy Society | Annual Meeting
Disclosure – Dr. Baram
American Epilepsy Society | Annual Meeting 2012
The Speaker’s research is supported by NIH grants
R37 NS35439; RO1 NS78279
The speaker has no relationships with entities
producing, marketing, re-selling, or distributing
health care goods or services consumed by, or used
on, patients
Disclosure – Dr. Shinnar
American Epilepsy Society | Annual Meeting 2012
Name of Commercial Interest Type of Financial Relationship Cyberonics Speaker Bureau Eisai Consultant, Speaker’s Bureau King (now Pfizer) DSMB member NeuroNEX Consultant Questcor Consultant, Advisory Board Speaker Bureau Sunovion Consultant, Advisory Board Upsher Smith Consultant, Advisory Board Supported by grants NS 43209 NINDS & HD 36867 from NICHD

Learning Objectives
• Manage FS/FSE based on knowledge regarding the relationship of FSE duration and the probability of developing TLE after FSE
• Obtain MRIs on children with FSE that allow evaluation of hippocampal volume and T2 measures (indicators of risk for future TLE).
American Epilepsy Society | Annual Meeting 2012
• What FEBSTAT Tells Us About Febrile Status Epilepticus (FSE) and TLE Shlomo Shinnar, MD, PhD
• How Might Febrile Status Epilepticus Lead to TLE? Tallie Z. Baram, MD, PhD
• Biomarkers for FSE-Induced TLE James O. McNamara, MD
• Questions/Discussion
Agenda
What FEBSTAT tells us about Febrile Status Epilepticus, Hippocampal
Sclerosis and Temporal Lobe Epilepsy December 3, 2012
Shlomo Shinnar, MD, PhD Montefiore Medical Center / Albert
Einstein College of Medicine New York, NY
American Epilepsy Society | Annual Meeting
Learning Objectives
American Epilepsy Society | Annual Meeting 2012
• Review the data on acute findings in children with febrile status epilepticus (FSE)
• Review the data on consequences of FSE
• Discuss how this data informs the controversy on the relationship between FSE and subsequent Hippocampal Sclerosis (HS) and Temporal Lobe Epilepsy (TLE) in humans
Febrile Seizures: ILAE Definition
A seizure occurring in children after age 1 month associated with a febrile illness
Prior neonatal seizures stratified separately
Exclusions:
Prior unprovoked seizures
Acute CNS infection
Electrolyte imbalance
Other acute symptomatic events
ILAE Guidelines for Epidemiologic Studies on Epilepsy. Epilepsia 1993;34:592-596.
Shinnar S. In: Swaiman KE, Ashwal S, eds. Pediatric Neurology: Principles and Practice. Third Edition. St
Louis, Mo: Mosby; 1999: 676-682.
Complex Febrile Seizure
Prolonged (10 or 15 min)
Focal
Multiple
ILAE Guidelines for Epidemiologic Studies on Epilepsy. Epilepsia 1993;34:592-596.
Berg et al. N Engl J. Med 1992;327:1122-1127.
Stafstrom CE. In: Baram TZ, Shinnar S, eds. Febrile Seizures. San Diego, Calif: Academic Press; 2002:1-25.
National Institutes of Health. NIH Consens Statement 1980;3:1-10.
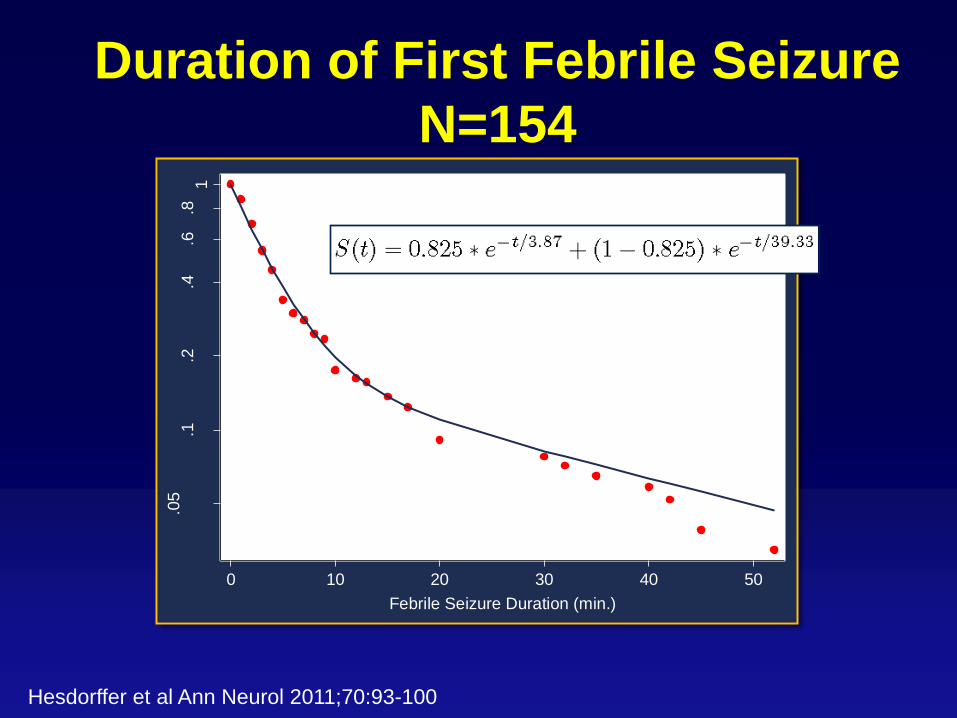
Duration of First Febrile Seizure
N=154 .0
5.1
.2.4
.6.8
1
Cum
ula
tive P
rob
abili
ty
0 10 20 30 40 50
Febrile Seizure Duration (min.)
Hesdorffer et al Ann Neurol 2011;70:93-100

Febrile Seizures in the United States
Assuming 19 million children <5 years of age
360,000 (2%) with febrile seizure annually
Febrile SE is 5-9% of all febrile seizures
18,000-32,400 with febrile status annually
ALTERNATIVE ESTIMATE
Approximately 200,000 cases of SE annually
50% occur in children under age 16
Febrile SE is approx 25% of all pediatric SE
This leads to estimate of 25,000 cases a year
Do Febrile Seizures Cause Hippocampal
Sclerosis?
Shinnar S. Ann Neurol 1998;43:411-412.
Retrospective studies report that many
patients with intractable epilepsy who
undergo temporal lobectomy and have
MTS give a history of febrile seizures
in childhood.
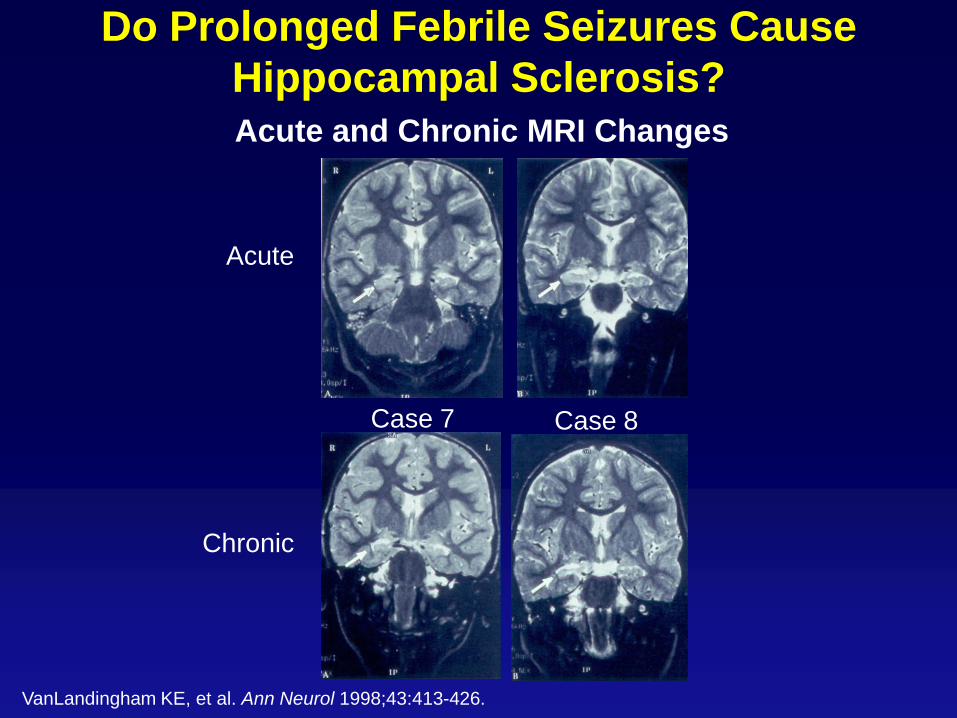
Do Prolonged Febrile Seizures Cause
Hippocampal Sclerosis? Acute and Chronic MRI Changes
VanLandingham KE, et al. Ann Neurol 1998;43:413-426.
Chronic
Case 7 Case 8
Acute
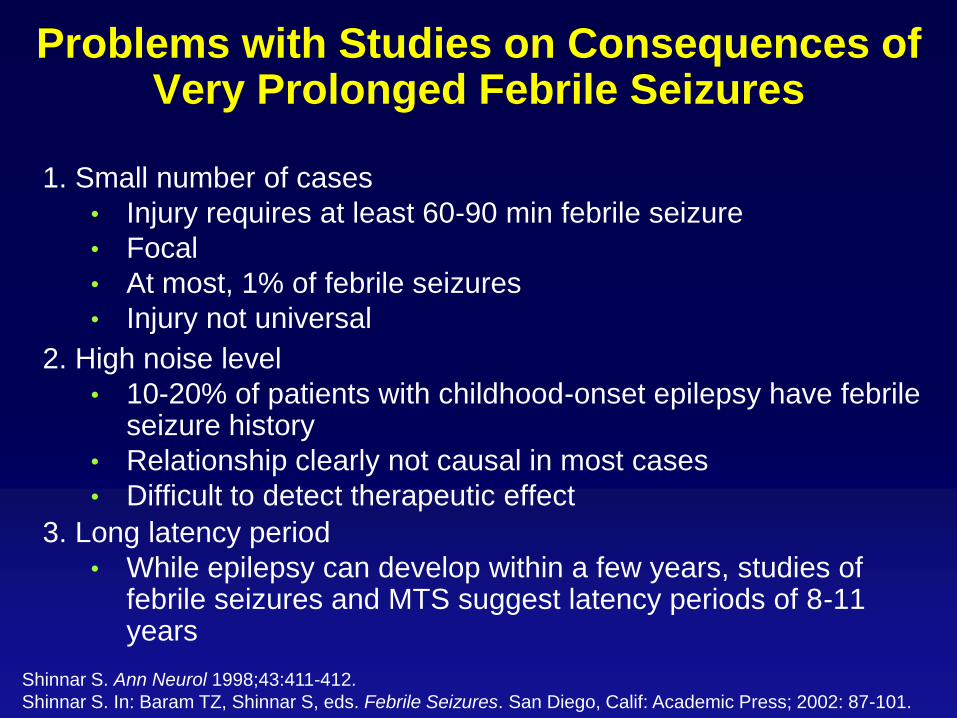
Problems with Studies on Consequences of Very Prolonged Febrile Seizures
1. Small number of cases
• Injury requires at least 60-90 min febrile seizure
• Focal
• At most, 1% of febrile seizures
• Injury not universal
2. High noise level
• 10-20% of patients with childhood-onset epilepsy have febrile seizure history
• Relationship clearly not causal in most cases
• Difficult to detect therapeutic effect
3. Long latency period
• While epilepsy can develop within a few years, studies of febrile seizures and MTS suggest latency periods of 8-11 years
Shinnar S. Ann Neurol 1998;43:411-412.
Shinnar S. In: Baram TZ, Shinnar S, eds. Febrile Seizures. San Diego, Calif: Academic Press; 2002: 87-101.
Outcomes to be studied include:
development of Hippocampal Sclerosis (HS)
development of epilepsy and in particular of Temporal Lobe Epilepsy (TLE)
occurrence of specific neuropsychological deficits (e.g. memory) in children with and without HS.
Consequences of FSE (FEBSTAT): Goals
Hesdorffer et al Epilepsia 2012; 53:1471-1480
Consequences of FSE (FEBSTAT):
Hypotheses
Hippocampal volume and T2 signal abnormalities will be seen in MRIs done in children within 72 hours of febrile SE.
The severity of acute hippocampal abnormalities will predict whether or not HS will be seen on follow up MRIs.
Children with HS will have memory deficits even prior to development of clinical epilepsy
Hesdorffer et al Epilepsia 2012; 53:1471-1480

Consequences of FSE (FEBSTAT)
Overview Recruitment Sites
Montefiore Medical Center/Jacobi Medical Center
Duke University Medical Center
Virginia Commonwealth University
Lurie Children’s Hospital (Chicago)
East Virginia Medical School
Data Management Sites
International Epilepsy Consortium (VCU)
Columbia University
Also provide controls
Hesdorffer et al Epilepsia 2012; 53:1471-1480
Consequences of FSE Research Plan:
FEBSTAT New Cohort
Prospectively recruit 200 children presenting with a first episode of febrile SE.
Children enrolled within 72 hours of the episode of FSE MRI with thin cuts of the temporal lobe within 72 hours Viral studies EEG
At one month baseline neuropsychological testing At one year repeat all of above Also repeat if another episode of status or if develop
epilepsy
These children form a cohort that is being followed long-term in the future. Recruitment completed March 2010. 200 recruited of which 199 eligible.
Hesdorffer et al Epilepsia 2012; 53:1471-1480
Consequences of FSE Research Plan:
Duke Existing Cohort
A cohort of 23 children with FSE prospectively assembled at Duke as part of the pilot data for the FEBSTAT study. Children enrolled within 72 hours of the episode of FSE
MRI with thin cuts of the temporal lobe within 72 hours. Protocol very similar to that used in FEBSTAT
Majority had EEG
These children then recruited into FEBSTAT study. Although numbers are small, the follow-up is much longer and they provide a glimpse of what we can expect in the larger FEBSTAT cohort.
Hesdorffer et al Epilepsia 2012; 53:1471-1480
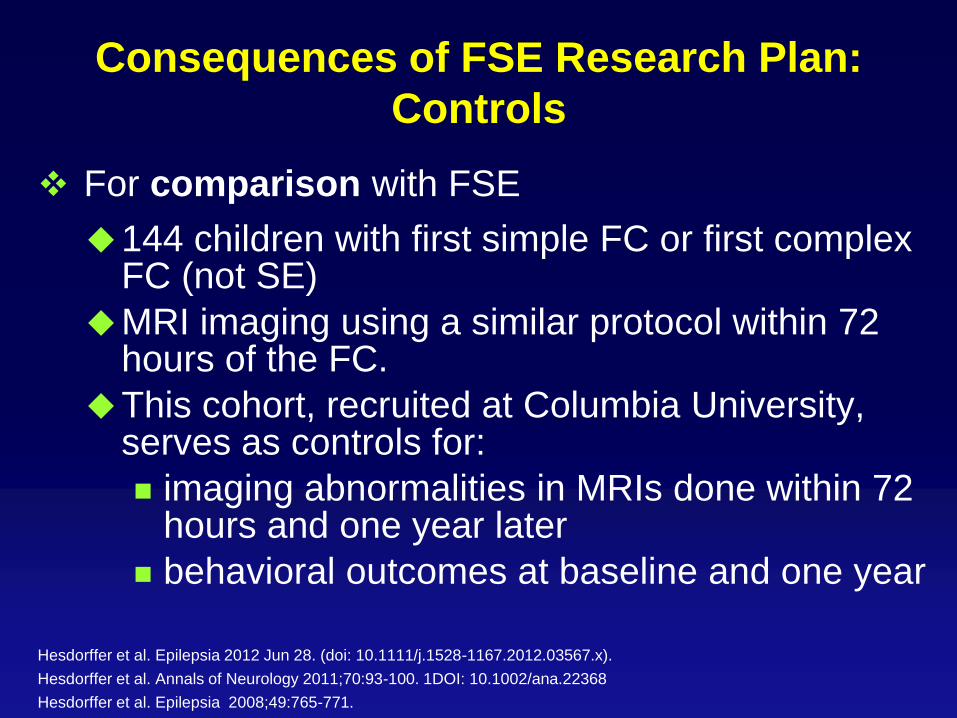
Consequences of FSE Research Plan:
Controls
For comparison with FSE
144 children with first simple FC or first complex FC (not SE)
MRI imaging using a similar protocol within 72 hours of the FC.
This cohort, recruited at Columbia University, serves as controls for:
imaging abnormalities in MRIs done within 72 hours and one year later
behavioral outcomes at baseline and one year
Hesdorffer et al. Epilepsia 2012 Jun 28. (doi: 10.1111/j.1528-1167.2012.03567.x).
Hesdorffer et al. Annals of Neurology 2011;70:93-100. 1DOI: 10.1002/ana.22368
Hesdorffer et al. Epilepsia 2008;49:765-771.
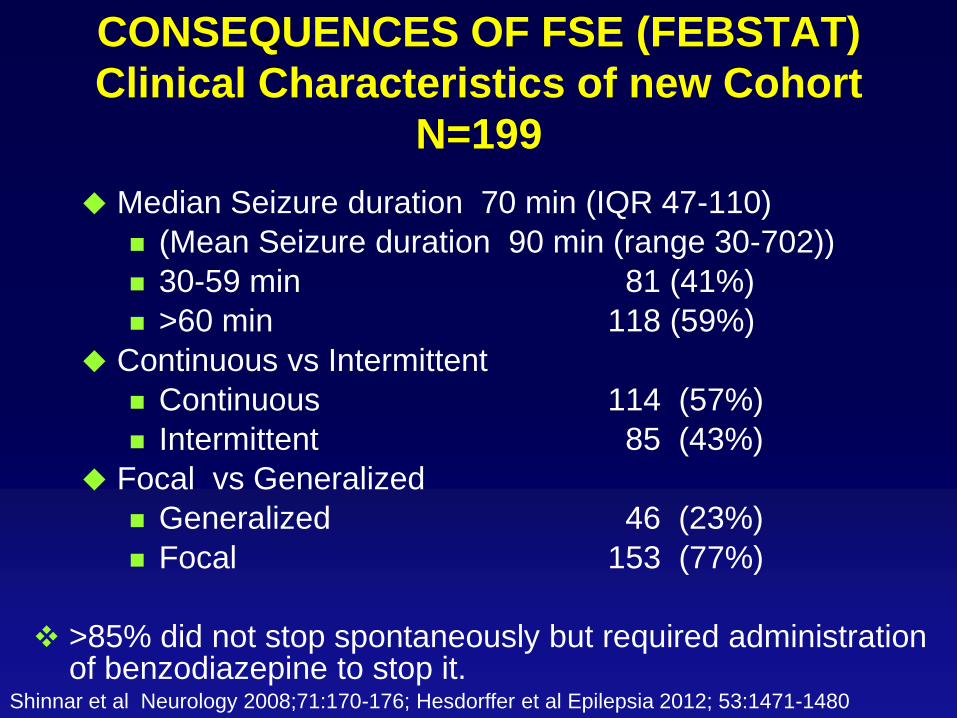
CONSEQUENCES OF FSE (FEBSTAT)
Clinical Characteristics of new Cohort
N=199
Median Seizure duration 70 min (IQR 47-110)
(Mean Seizure duration 90 min (range 30-702))
30-59 min 81 (41%)
>60 min 118 (59%)
Continuous vs Intermittent
Continuous 114 (57%)
Intermittent 85 (43%)
Focal vs Generalized
Generalized 46 (23%)
Focal 153 (77%)
>85% did not stop spontaneously but required administration of benzodiazepine to stop it.
Shinnar et al Neurology 2008;71:170-176; Hesdorffer et al Epilepsia 2012; 53:1471-1480

Distribution of the duration of febrile SE:
FEBSTAT Study (N=119)
Shinnar et al Neurology 2008;71:170-176
Duration of febrile status epilepticus (minutes)
Weibull predicted Kaplan –Meier curve
30 60 90 120 150 180 210 240 270 300 330 360
0
.2
.4
.6
.8
1
Supported by grant NS 43209 NINDS
[S(t) = e−(t/95.9)1.68 ]

Probability that a seizure that has continued to time t
will not stop at that point: FEBSTAT Study (n=119)
(Best fit model from Weibull Distribution)
Shinnar et al Neurology 2008;71:170-176
Duration of febrile status epilepticus (minutes)
30 60 90 120 150 180 210 240 270 300 330 360
.007953
.043084
Supported by grant NS 43209 NINDS
[S(t) = e−(t/95.9)1.68 ]
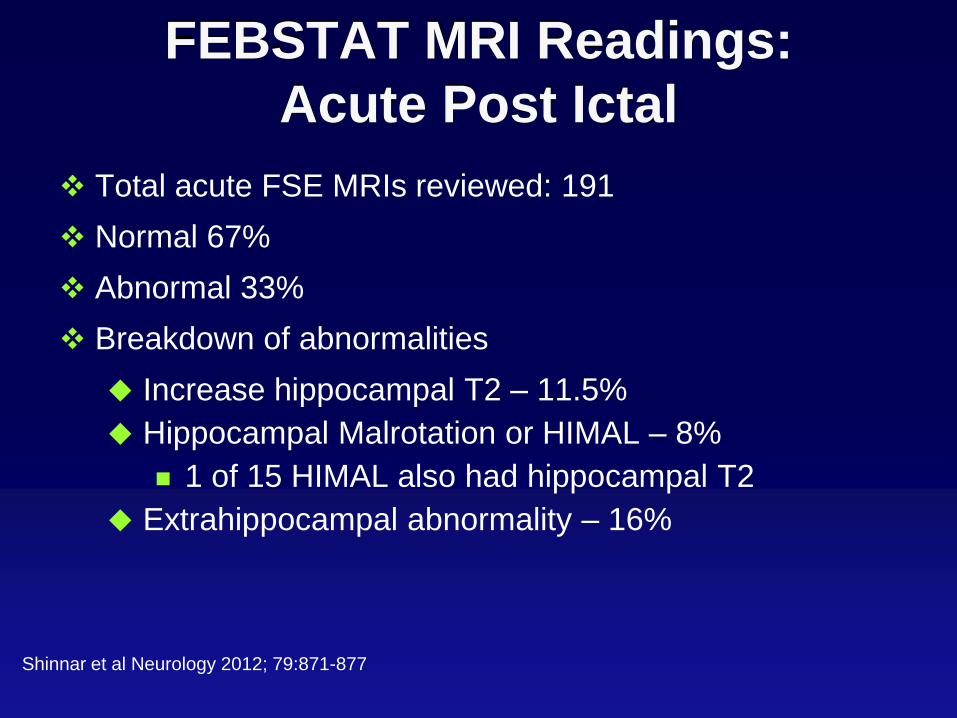
FEBSTAT MRI Readings:
Acute Post Ictal
Total acute FSE MRIs reviewed: 191
Normal 67%
Abnormal 33%
Breakdown of abnormalities
Increase hippocampal T2 – 11.5%
Hippocampal Malrotation or HIMAL – 8%
1 of 15 HIMAL also had hippocampal T2
Extrahippocampal abnormality – 16%
Shinnar et al Neurology 2012; 79:871-877
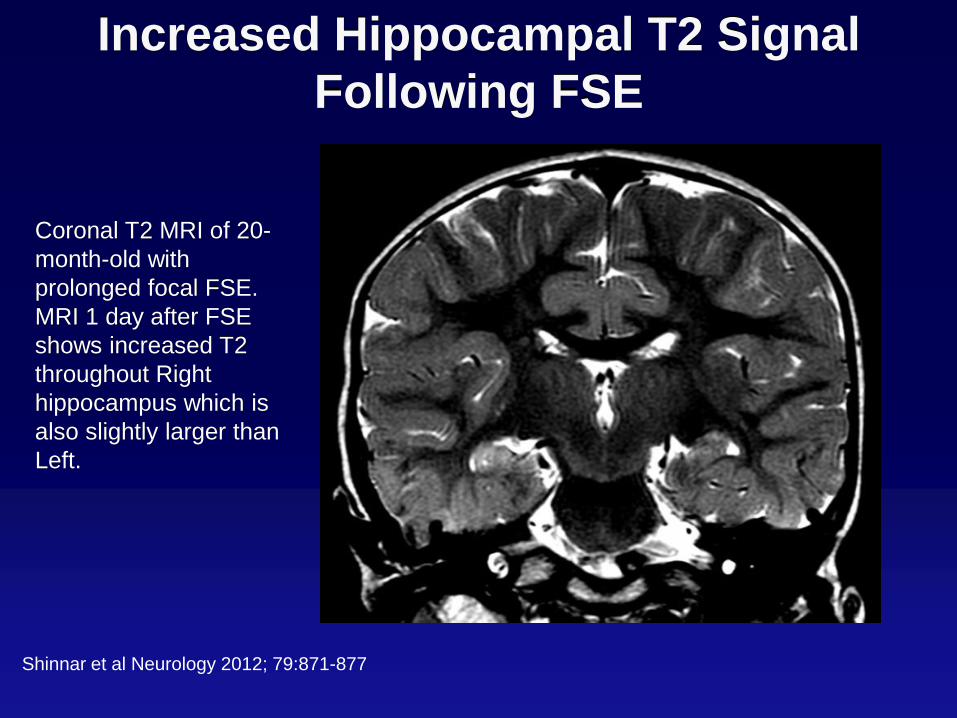
Increased Hippocampal T2 Signal
Following FSE
Coronal T2 MRI of 20-
month-old with
prolonged focal FSE.
MRI 1 day after FSE
shows increased T2
throughout Right
hippocampus which is
also slightly larger than
Left.
Shinnar et al Neurology 2012; 79:871-877

T2 Intensity in Hippocampi After Febrile SE
Both hippocampi have normal T2 Intensity
Left hippocampus slightly increased T2 and reduced anatomical landmarks.
Right hippocampus marked increase T2 in lateral inferior aspect, near CA1.
From FEBSTAT: “Consequences of Prolonged Febrile Convulsions in Childhood”
NINDS - R01 NS43209 PI S. Shinnar. Unpublished data
Slide Unavailable
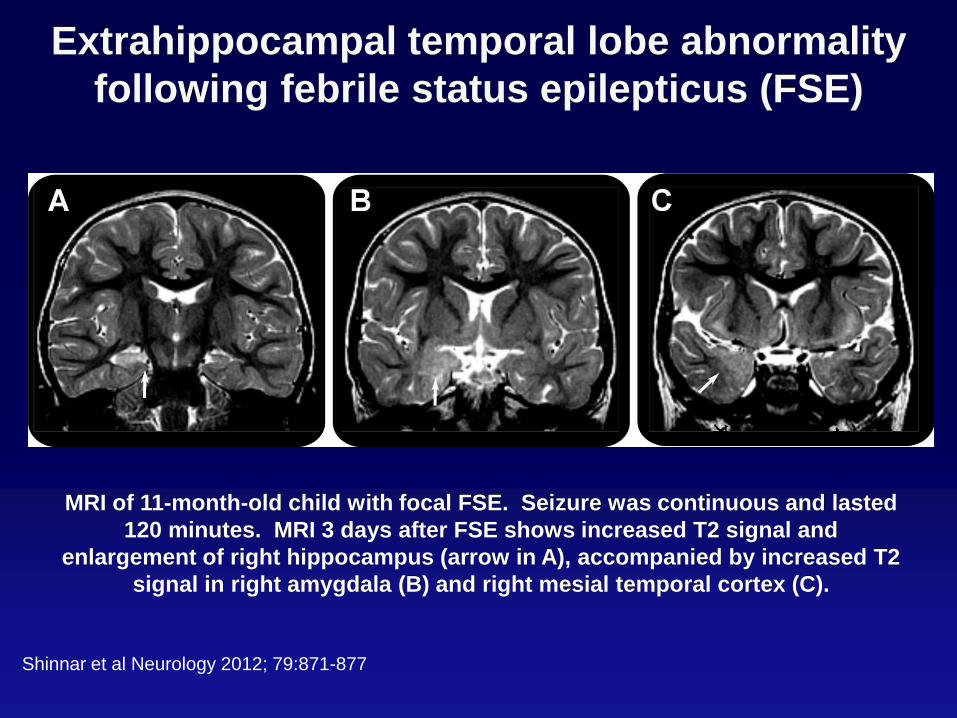
Extrahippocampal temporal lobe abnormality
following febrile status epilepticus (FSE)
MRI of 11-month-old child with focal FSE. Seizure was continuous and lasted
120 minutes. MRI 3 days after FSE shows increased T2 signal and
enlargement of right hippocampus (arrow in A), accompanied by increased T2
signal in right amygdala (B) and right mesial temporal cortex (C).
Shinnar et al Neurology 2012; 79:871-877

Example: Hippocampal Malrotation or
HIMAL Rounded, medially displaced hippocampus. Blurred internal architecture.
Depressed Ipsilateral Fornix
Vertical collateral sulcus.
HIMAL was 15 fold more
common in FSE subjects than
control group of
simple FCs (p=0.001
Fisher’s exact test)
Definitions from
(Barsi et al. Neuroradiology 42:339, 2000)
From FEBSTAT: “Consequences of Prolonged Febrile Convulsions in Childhood”
NINDS - R01 NS43209 PI S. Shinnar. Unpublished data
Slide Unavailable

Distribution of Hippocampal T2 Signal Following FSE
Has Similarities to Distribution of Pathology in HS
T2 signal intensity usually appears most
intense in the region of CA1. Is this a
reflection of CA1 selective vulnerability?
With relative sparing of subiculum.
From FEBSTAT: “Consequences of Prolonged Febrile Convulsions in Childhood”
NINDS - R01 NS43209 PI S. Shinnar. Unpublished data
Slide Unavailable

Measurements Confirm that T2 Signal is Maximal
in CA1 After Febrile Status
CA
3
CA
3
CA
2
CA
1
CA
1
CA
1
Sub
Sub
Pre
sub
0.80
0.85
0.90
0.95
1.00
1.05
1.10
No
rma
lize
d T
2 I
nte
nsity
ROI
Ipsilateral
Contralateral
Controls
**
*
*
****
Presub
CA3
Sub
Sub CA1 CA1
CA1
CA2 CA3
To measure T2 signal
distribution, the hippocampal
body cross section was
radially partitioned and the
relative T2 intensity compared
in the sectors.
From FEBSTAT: “Consequences of Prolonged Febrile Convulsions in Childhood”
NINDS - R01 NS43209 PI S. Shinnar. Unpublished data
CA3
Slide Unavailable

Hippocampal ADCs Following FSE
Plot of ADCs
(Means and 95%
confidence intervals)
for Control hippocampi,
hippocampi Contralateral
to those
with increased T2 and
Hyperintense
hippocampi.
Controls Contralateral Hyperintense0.00090
0.00095
0.00100
0.00105
0.00110
0.00115
Mea
n A
DC
N = 31 N = 13 N = 13
From FEBSTAT: “Consequences of Prolonged Febrile Convulsions in Childhood”
NINDS - R01 NS43209 PI S. Shinnar. Unpublished data
Slide Unavailable

Grey matter density differences in FSE versus
Simple FC controls
Several areas of
significant differences
between groups in grey
matter density were
found in the inferior
temporal gyrus
bilaterally, the middle
temporal gyrus on the
right and in the piriform
and olfactory cortex.
The areas noted in the
figure correspond to the
density being higher in
FSE cases compared to
controls.
From FEBSTAT: “Consequences of Prolonged Febrile Convulsions in Childhood”
NINDS - R01 NS43209 PI S. Shinnar. Unpublished data
Measurements Confirm that T2 Signal is
Maximal in CA1 After Febrile SE
To measure T2 signal distribution, the
hippocampal body cross section was
radially partitioned and the relative T2
intensity compared in the sectors.
Increase of T2 Intensity on Acute
(filled squares; N=13).
Inset shows position of ROIs overlying
the hippocampal sectors, SS=
Sommer Sector, comprising CA1
and Prosubiculum, Sub=subiculum.
Solid and dashed lines represent
the means over SS and Non-SS
sectors for the Acute and Follow-
Up time points, respectively. Bars=
95% confidence Intervals.
From FEBSTAT: “Consequences of Prolonged Febrile Convulsions in Childhood”
NINDS - R01 NS43209 PI S. Shinnar. Unpublished data
SS-a SS-b SS-c CA2-a CA2-b CA3 Sub-a Sub-b Hilus
-0.04
0.00
0.04
0.08
0.12
0.16
0.20
0.24
T2
Sig
na
l In
cre
ase
Sector
Slide Unavailable
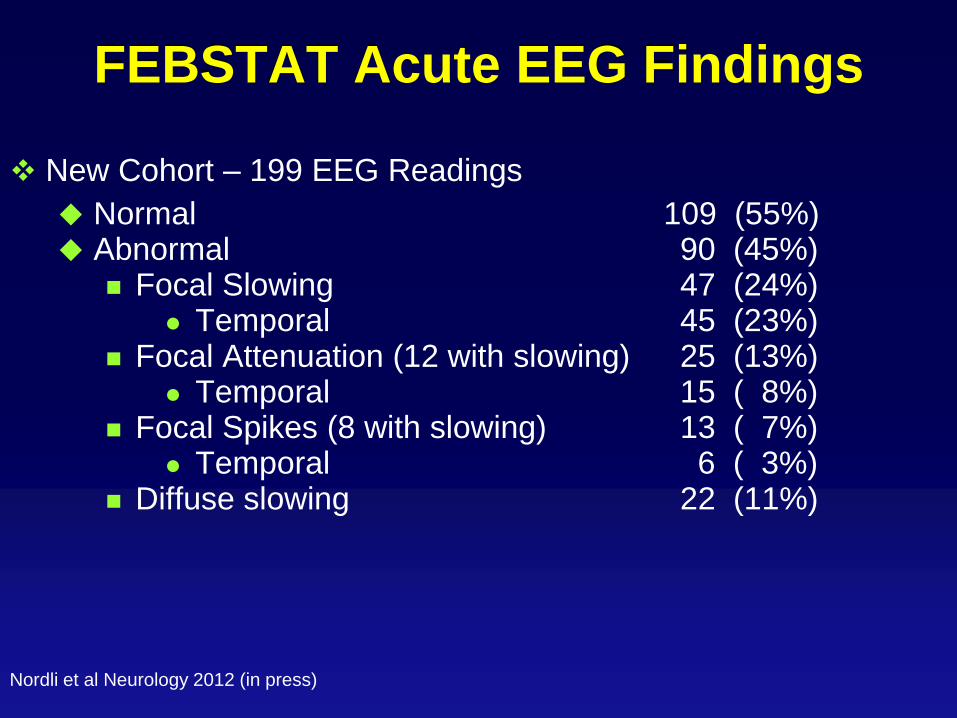
FEBSTAT Acute EEG Findings
New Cohort – 199 EEG Readings
Normal 109 (55%) Abnormal 90 (45%)
Focal Slowing 47 (24%) Temporal 45 (23%)
Focal Attenuation (12 with slowing) 25 (13%) Temporal 15 ( 8%)
Focal Spikes (8 with slowing) 13 ( 7%) Temporal 6 ( 3%)
Diffuse slowing 22 (11%)
Nordli et al Neurology 2012 (in press)
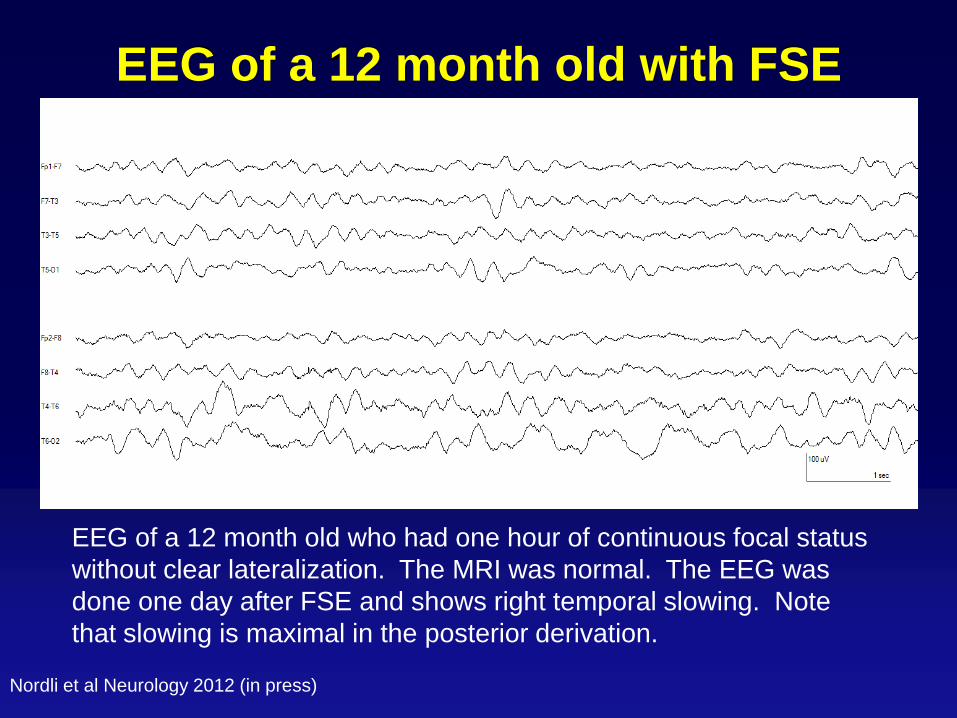
EEG of a 12 month old with FSE
EEG of a 12 month old who had one hour of continuous focal status
without clear lateralization. The MRI was normal. The EEG was
done one day after FSE and shows right temporal slowing. Note
that slowing is maximal in the posterior derivation.
Nordli et al Neurology 2012 (in press)
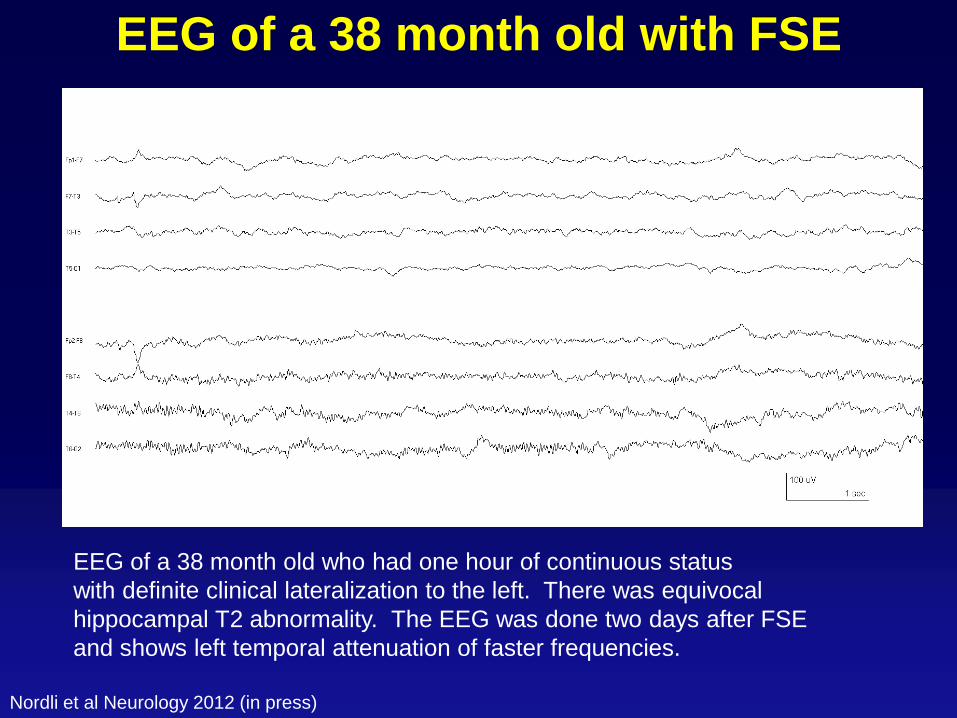
EEG of a 38 month old with FSE
EEG of a 38 month old who had one hour of continuous status
with definite clinical lateralization to the left. There was equivocal
hippocampal T2 abnormality. The EEG was done two days after FSE
and shows left temporal attenuation of faster frequencies.
Nordli et al Neurology 2012 (in press)
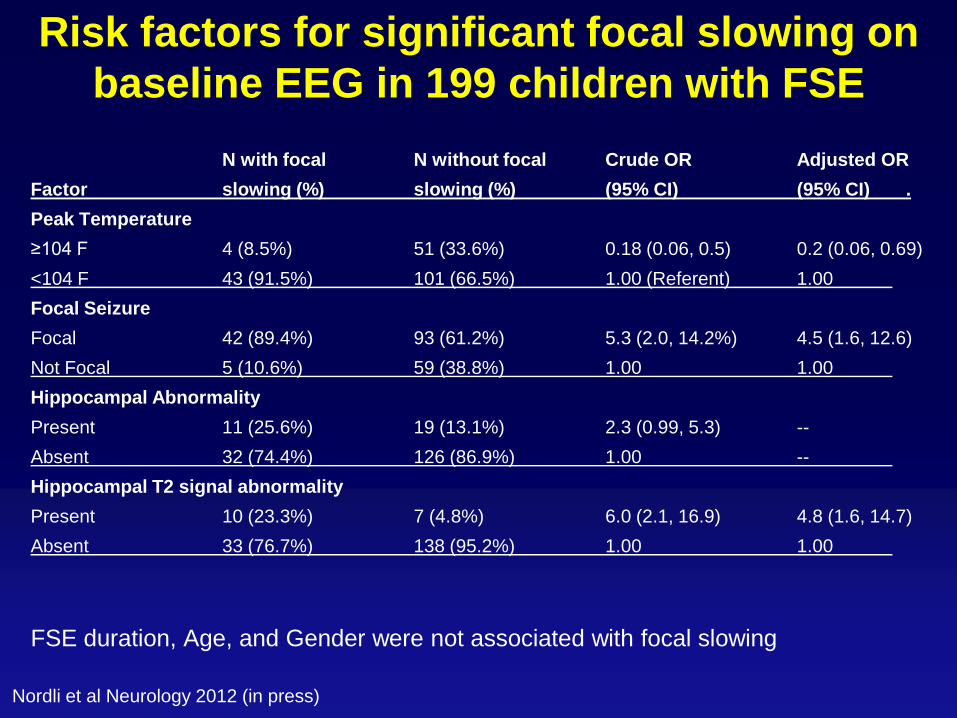
Risk factors for significant focal slowing on
baseline EEG in 199 children with FSE
N with focal N without focal Crude OR Adjusted OR
Factor slowing (%) slowing (%) (95% CI) (95% CI) .
Peak Temperature
≥104 F 4 (8.5%) 51 (33.6%) 0.18 (0.06, 0.5) 0.2 (0.06, 0.69)
<104 F 43 (91.5%) 101 (66.5%) 1.00 (Referent) 1.00
Focal Seizure
Focal 42 (89.4%) 93 (61.2%) 5.3 (2.0, 14.2%) 4.5 (1.6, 12.6)
Not Focal 5 (10.6%) 59 (38.8%) 1.00 1.00
Hippocampal Abnormality
Present 11 (25.6%) 19 (13.1%) 2.3 (0.99, 5.3) --
Absent 32 (74.4%) 126 (86.9%) 1.00 --
Hippocampal T2 signal abnormality
Present 10 (23.3%) 7 (4.8%) 6.0 (2.1, 16.9) 4.8 (1.6, 14.7)
Absent 33 (76.7%) 138 (95.2%) 1.00 1.00
FSE duration, Age, and Gender were not associated with focal slowing
Nordli et al Neurology 2012 (in press)
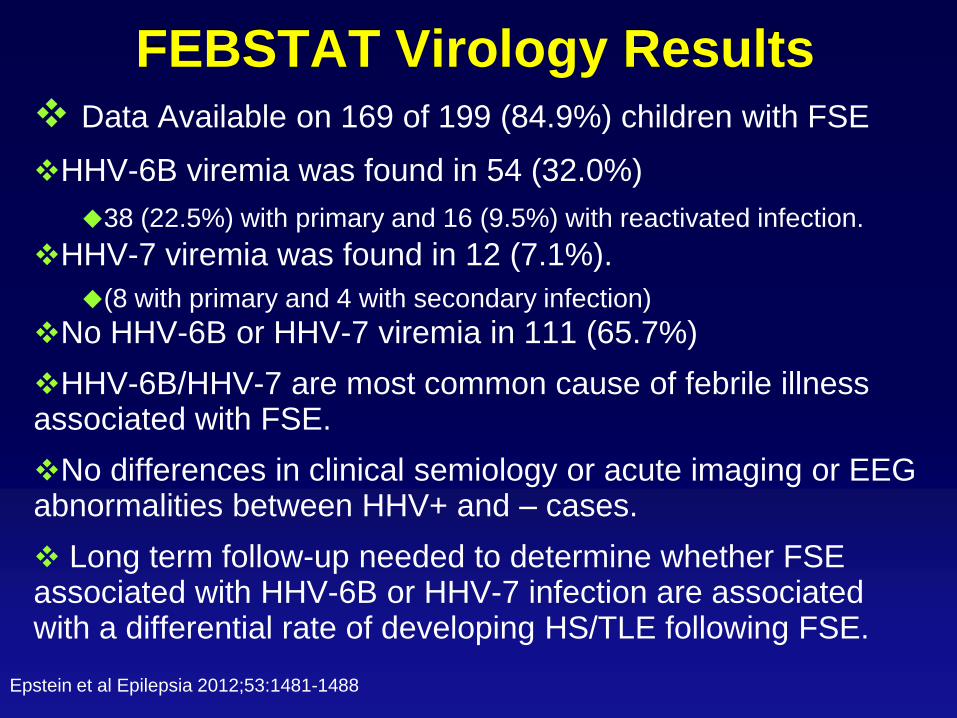
FEBSTAT Virology Results Data Available on 169 of 199 (84.9%) children with FSE
HHV-6B viremia was found in 54 (32.0%)
38 (22.5%) with primary and 16 (9.5%) with reactivated infection.
HHV-7 viremia was found in 12 (7.1%).
(8 with primary and 4 with secondary infection)
No HHV-6B or HHV-7 viremia in 111 (65.7%)
HHV-6B/HHV-7 are most common cause of febrile illness associated with FSE.
No differences in clinical semiology or acute imaging or EEG abnormalities between HHV+ and – cases.
Long term follow-up needed to determine whether FSE associated with HHV-6B or HHV-7 infection are associated with a differential rate of developing HS/TLE following FSE.
Epstein et al Epilepsia 2012;53:1481-1488
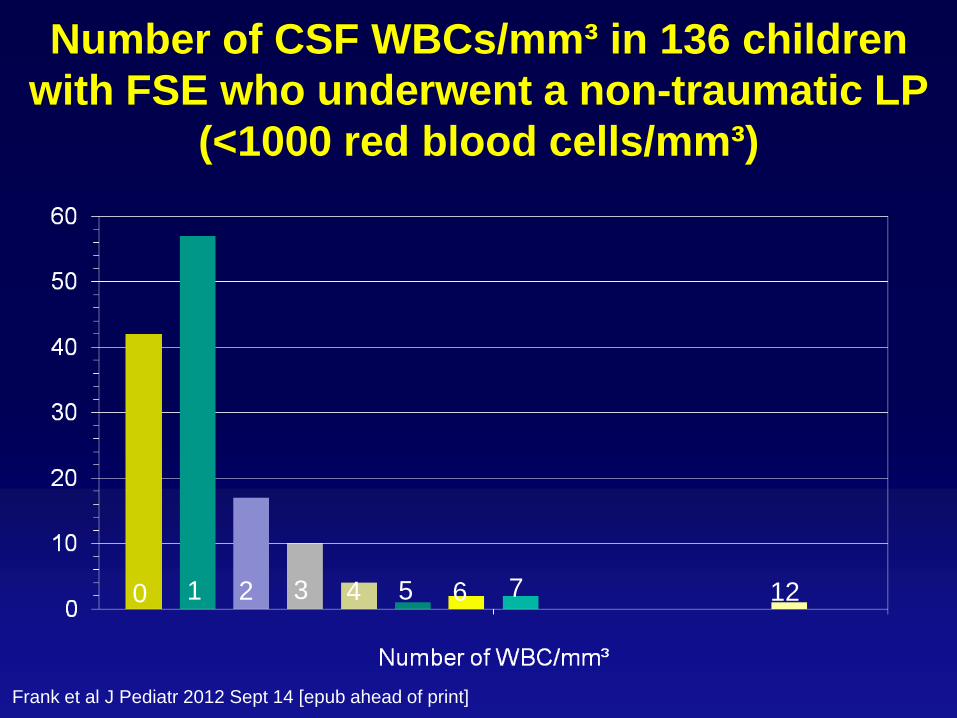
Number of CSF WBCs/mm³ in 136 children
with FSE who underwent a non-traumatic LP
(<1000 red blood cells/mm³)
Frank et al J Pediatr 2012 Sept 14 [epub ahead of print]
0 1 2 4 3 6 5 12 7
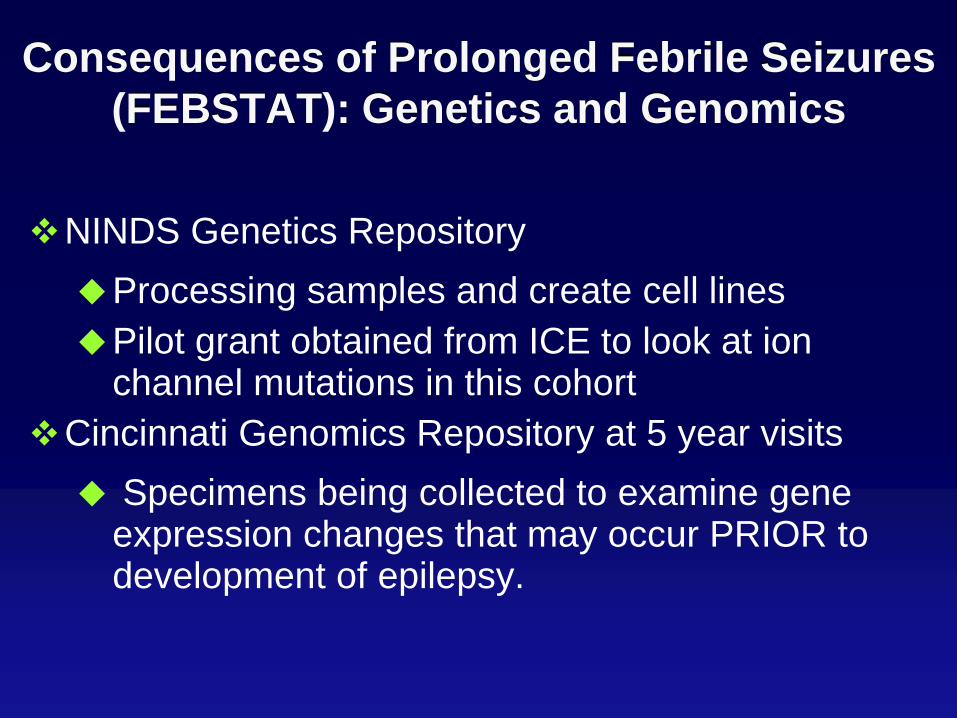
Consequences of Prolonged Febrile Seizures
(FEBSTAT): Genetics and Genomics
NINDS Genetics Repository
Processing samples and create cell lines
Pilot grant obtained from ICE to look at ion channel mutations in this cohort
Cincinnati Genomics Repository at 5 year visits
Specimens being collected to examine gene expression changes that may occur PRIOR to development of epilepsy.

Febrile Status Epilepticus
Consequences

Representative Coronal sections showing increased T2
signal following FSE.
Right side of the brain is on the left
side of the figure. A) Nissl stain of
cross section of hippocampal body
with shaded insert outlining area of
Sommer’s sector (Courtesy G.
Mathern). B) Acute T2 weighted
MRI 3 days after a 120 min duration
episode of status epilepticus in a
13 month old male.
C) Follow up MRI of same subject
6 months later. Note in (B) the
increased size and signal of the
right hippocampus with maximum
signal in the lateral margin of the
hippocampus (Arrow) in the location
of Sommer’s sector. At follow up
(C), the hippocampus is small and
the signal distribution is no longer
most intense in Sommer’s sector.
From FEBSTAT: “Consequences of Prolonged Febrile Convulsions in Childhood”
NINDS - R01 NS43209 PI S. Shinnar. Unpublished data
Measurements Confirm that T2 Signal is
Maximal in CA1 After Febrile SE
To measure T2 signal distribution, the
hippocampal body cross section was
radially partitioned and the relative T2
intensity compared in the sectors.
Increase of T2 Intensity on Acute
(filled squares; N=13).
Inset shows position of ROIs overlying
the hippocampal sectors, SS=
Sommer Sector, comprising CA1
and Prosubiculum, Sub=subiculum.
Solid and dashed lines represent
the means over SS and Non-SS
sectors for the Acute and Follow-
Up time points, respectively. Bars=
95% confidence Intervals.
From FEBSTAT: “Consequences of Prolonged Febrile Convulsions in Childhood”
NINDS - R01 NS43209 PI S. Shinnar. Unpublished data
SS-a SS-b SS-c CA2-a CA2-b CA3 Sub-a Sub-b Hilus
-0.04
0.00
0.04
0.08
0.12
0.16
0.20
0.24
T2
Sig
na
l In
cre
ase
Sector
Slide Unavailable

From FEBSTAT: “Consequences of Prolonged Febrile Convulsions in Childhood”
NINDS - R01 NS43209 PI S. Shinnar. Unpublished data
Slide Unavailable

From FEBSTAT: “Consequences of Prolonged Febrile Convulsions in Childhood”
NINDS - R01 NS43209 PI S. Shinnar. Unpublished data
Slide Unavailable

From FEBSTAT: “Consequences of Prolonged Febrile Convulsions in Childhood”
NINDS - R01 NS43209 PI S. Shinnar. Unpublished data
Slide Unavailable

From FEBSTAT: “Consequences of Prolonged Febrile Convulsions in Childhood”
NINDS - R01 NS43209 PI S. Shinnar. Unpublished data
Slide Unavailable

Examples of Hippocampal Volume Changes
After FSE: Is this pattern a biomarker for TLE? HV in FU MRIs
0
500
1000
1500
2000
2500
3000
0 1 2 3 4
Age Yrs
HV 1P002 Rt
1P002 Lt
3D011
0
500
1000
1500
2000
2500
3000
3500
0 2 4 6 8
Age Yrs
HV 3D011 Rt
3D011 Lt
3D001
0
500
1000
1500
2000
2500
3000
3500
4000
0 2 4 6 8 10 12
Age Yrs
HV 3D001 Rt
3D001 Lt
3D007
0
500
1000
1500
2000
2500
3000
0 2 4 6 8 10 12
Age Yrs
HV 3D007 Rt
3D007 Lt
Vol Loss (Bilateral)
Asymmetric Growth Late Atrophy?
Onset TLE
Onset TLE
Initial
Injury
From FEBSTAT: “Consequences of Prolonged Febrile Convulsions in Childhood”
NINDS - R01 NS43209 PI S. Shinnar. Unpublished data
Slide Unavailable

FEBSTAT – Early Clinical Outcomes
Mortality to date in FEBSTAT - 3 deaths, 2 due to SUDEP and 1 due to the underlying illness
23 children have experienced recurrent SE
21 with FSE , 5 with afebrile SE and 3 with both
Among new cohort, 27 (13%) have developed epilepsy. As expected, most of these cases are not TLE which has a longer latency
3 have Dravet syndrome
In the Duke pilot cohort (n=23) cohort, 7 (30%) have developed epilepsy, including 2 cases with medically refractory TLE who have undergone temporal lobectomy
From FEBSTAT: “Consequences of Prolonged Febrile Convulsions in Childhood”
NINDS - R01 NS43209 PI S. Shinnar. Unpublished data
Slide Unavailable

Consequences of Prolonged Febrile Seizures in
Childhood (FEBSTAT): Conclusions
Hippocampal injury following FSE is not universal.
When it does occur it is maximal in CA1 and relatively spares other hippocampal regions. This is similar to pattern seen in Human TLE with HS
While FSE can occur in children with normal hippocampi, as a group, children with FSE have smaller hippocampi than those with simple FS
Following FSE, Hippocampi demonstrating increased T2 signal acutely, shrink.
Following FSE, even those hippocampi that appear normal following FSE, fail to grow compared with hippocampi in children with simple FS suggesting injury.
Slide Unavailable

Biomarkers for Epileptogenesis, HS or TLE
following FSE? What we need to do now
Complete long term follow up of the FEBSTAT study cohort to determine
Is a “hot hippocampus” following FSE sufficient for prediction of subsequent HS ? – Preliminary data suggests yes
Is a “hot hippocampus” following FSE sufficient for prediction of subsequent TLE? – Unknown
Is a “hot hippocampus” following FSE necessary for prediction of subsequent HS or TLE? – Unknown
Memory deficits in children with hippocampal injury – in progress. As median age 15 months, reliable memory testing being done at 5 year visit.
Comorbidity - DISC being given at 5 year visit.
Can the EEG be used as a surrogate marker??
Is HHV6 associated with a higher rate of developing TLE/HS
Role of genetics and genomics
From FEBSTAT: “Consequences of Prolonged Febrile Convulsions in Childhood”
NINDS - R01 NS43209 PI S. Shinnar. Unpublished data
Slide Unavailable

FEBSTAT: Conclusions
The results of this longitudinal study will ultimately resolve the controversy on the relationship between prolonged febrile seizures in childhood and HS and TLE.
As latency to clinical epilepsy is 8-11 years we need time to get final answer
In meantime, preventing hippocampal volume loss at one year is an attractive target for antiepileptogenesis trials.
Occurs in a substantial portion of cases
Can be readily measured
Biological plausibility
Slide Unavailable

FEBSTAT STUDY TEAM
Montefiore Medical Center
Shlomo Shinnar MD PHD
Jennifer Ayala BA
Jacqueline Bello MD
Ronda L Facchini PhD
William Gomes MD PhD
James Hannigan RT
Sharyn Katz REEGT
Ann Mancini
David Masur PhD
Solomon L. Moshe MD
Jordana Schneider BA
Ruth Shinnar RN MSN
Maryana Sigalova MA
Erica Weiss PhD
Columbia University
Dale Hesdorffer PhD
Stephen Chan MD
Prudence Fisher PhD
Veronica Hinton PhD
Claire Litherand
Duke University Medical Center
Darrell Lewis MD
Melanie Bonner PhD
Karen Mohler Cornett BS, MT
William Gallentine DO
James MacFall PhD
James Provenzale MD
Elizabeth Rende RN DNP CPNP
Allen Song PhD
James Voyvodic PhD
Yuan Xu BS
Eastern Virginia Medical School
L. Matthew Frank MD
Terrie Karras Conklin RN, CCRC
Susan Grasso MD
David Kushner MD
Virginia Van de Water PhD
Lurie Children’s Hospital
Chicago
Douglas Nordli MD
Leon Epstein MD
John Curran MD
Andrew Kim MD
Julie Renaldi PhD
Diana K Umanzour
Mt Sinai School of Medicine Emilia Bagiella PhD
Virginia Commonwealth University
John Pellock MD
Tania Brazemore R-EEGT
James Culbert PhD
Kathryn O’Hara RN
Syndi Seinfeld MD
Jean Snow RT-R
International Epilepsy Consortium at Dept of Biostatistics at VCU
Shumei Sun PhD
Brian J Bush MSIT
Sreedevi Chandrasekarn
Lori L Davis
Xiaoyan Deng
John M Pellock MD
Christiane Rogers
Cynthia Shier Sabo MS
Helen Wang
Collaborators
Joan Conry MD – Children’s National
Tracy Glauser MD – Cincinnati Childrens
Jeffrey L Noebels MD PhD - Baylor
Slide Unavailable