project tr- 457 final report - iowa
TRANSCRIPT

DEVELOPMENT OF A MANUAL CRACK QUANTIFICATION AND AUTOMATED CRACK
MEASUREMENT SYSTEM
Project TR- 457 Final Report
Principal Investigator Hosin “David” Lee, Ph.D., P.E.
Associate Professor
Graduate Research Assistants Jungyong “Joe” Kim
Sponsored by:
Iowa Department of Transportation and Iowa Highway Research Board
PUBLIC POLICY CENTER CIVIL AND ENVIRONMENTAL ENGINEERING
UNIVERSITY OF IOWA January 2005

ii
The opinions, findings and conclusions expressed in this publication are those of the author and not necessarily those of the Iowa Department of Transportation.
iii
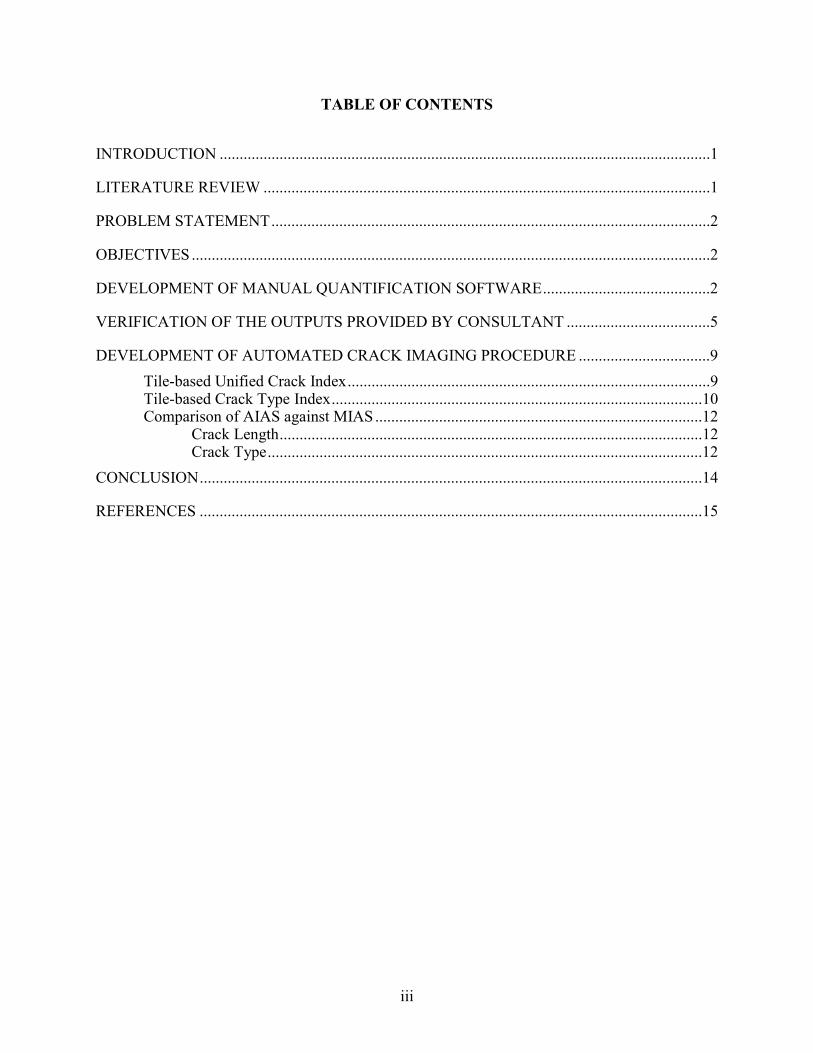
TABLE OF CONTENTS
INTRODUCTION ...........................................................................................................................1
LITERATURE REVIEW ................................................................................................................1
PROBLEM STATEMENT..............................................................................................................2
OBJECTIVES..................................................................................................................................2
DEVELOPMENT OF MANUAL QUANTIFICATION SOFTWARE..........................................2
VERIFICATION OF THE OUTPUTS PROVIDED BY CONSULTANT ....................................5
DEVELOPMENT OF AUTOMATED CRACK IMAGING PROCEDURE .................................9
Tile-based Unified Crack Index...........................................................................................9 Tile-based Crack Type Index.............................................................................................10 Comparison of AIAS against MIAS ..................................................................................12
Crack Length..........................................................................................................12 Crack Type.............................................................................................................12
CONCLUSION..............................................................................................................................14
REFERENCES ..............................................................................................................................15

iv
LIST OF FIGURES
Figure 1 Analysis of Longitudinal and Transverse Crack by Line..................................................3
Figure 2 Analysis of Patching by Polygon ......................................................................................4
Figure 3 Measurement of Crack Width with Zooming Function ....................................................5
Figure 4 Image Collected by the Consultant....................................................................................6
Figure 5 Typical Images Collected by the Consultant.....................................................................8
Figure 6 Crack Index Example based on Tile-based Crack Quantification Procedure .................10
Figure 7 Calculation of Crack Type Index ....................................................................................11
Figure 8 Range of Crack Type Index.............................................................................................11
Figure 9 No. 6 Longitudinal Cracking Image analyzed by AIAS .................................................13
Figure 10 No. 4 Transverse Cracking Image analyzed by AIAS ..................................................13
Figure 11 No. 10 Alligator Cracking Image analyzed by AIAS....................................................14
Figure 12 No. 3 Block Cracking Image analyzed by AIAS ..........................................................14

v
LIST OF TABLES
Table 1 Sample Printout of Manual Image Analysis Result............................................................7
Table 2 the Comparison of MIAS vs. AIAS..................................................................................12

1
INTRODUCTION
Automated distress collection systems have been developed over the years to evaluate the condition of pavements. The simplest method is to have a person ride or walk along the road and visually evaluate it. However, there are a number of problems with this approach, including the boredom attendant on such a mundane task and the subjective and arbitrary nature of the evaluations due to human nature. Because visual evaluations of pavements are by nature subjective and arbitrary, automated systems have been developed in an attempt to make the evaluation procedure more objective and consistent.
In 1993, a study by Cable recommended that automated equipment be used to
improve the quality of pavement condition data. Recently, another study was completed looking into the feasibility of using automated distress data in Iowa’s county need study. The study concluded that use of the automated distress data collected for the Iowa Pavement Management Program (IPMP) as an input to the quadrennial need study would be both feasible and beneficial (Maze 1998).
LITERATURE REVIEW
How to effectively implement a pavement management system is a major problem for Iowa’s highway agencies. The root of the problem for most public works departments has been their reliance on subjective pavement evaluation techniques. Current manual techniques for the collection of crack data are subjective, expensive, and dangerous. As a result, many approaches to automating the crack data collection process have been investigated (Guralnick et al. 1993). Novel algorithms based on fuzzy logic and morphology theory were discussed (Cheng et al. 1999). To compare the effectiveness of these approaches, a set of criteria for evaluating pavement imaging systems were proposed (Haas and McNeil 1990). The Federal Highway Administration (FHWA) has conducted three major studies comparing automated equipment against manual survey results. The three studies concluded that better techniques are needed to evaluate automated crack measurement systems (Luhr 1999).
Digital image processing systems can provide pavement engineers with an objective, cost-effective and easy-to-use approach to measuring the cracking condition of

2
pavements in order to schedule street maintenance and repair. More consistent information can be provided for street maintenance and repair practices by adopting the concept of the unified crack index (Lee 1992). A proprietary image processing algorithm was developed to automatically compute the unified crack index for the images collected from pavement surfaces (Jitprasithsiri et al. 1996).
PROBLEM STATEMENT
Currently, the consultant is automatically collecting pavement crack data from Iowa highways. They provide pavement crack data categorized by its types and severities in hard copies without corresponding picture images. As a result, it became difficult for Iowa DOT to verify the outputs provided by the consultant against the true pavement conditions.
OBJECTIVES
The objective of the proposed research is to develop two software packages: the first package to manually verify the outputs provided by the consultant against the procedure defined by Iowa DOT and the second package to automatically process pavement crack data objectively and consistently.
DEVELOPMENT OF MANUAL QUANTIFICATION SOFTWARE
Following the existing manual crack survey procedure of Iowa DOT, a manual crack quantification software package was developed. This software package was designed in consultation with Iowa DOT personnel that would allow them to process digital images interactively through a computer screen in the most efficient manner. For each image, the manually processed data is stored automatically in the data base for comparison with the outputs provided by the consultant.
To illustrate the manual processing concept, the following examples are provided.
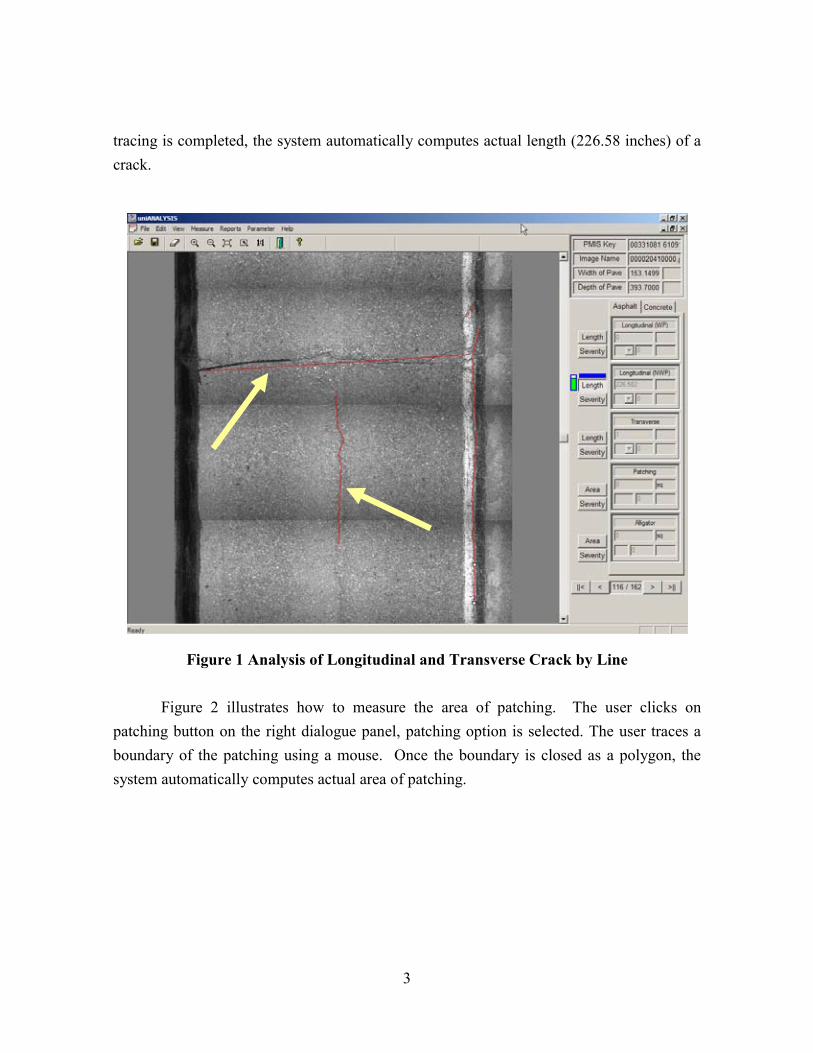
Figure 1 shows a sample image containing cracks, which would cover a pavement area of 153 inches (3.89 m) by 394 inches (10 m). By clicking on the button at the right dialogue panel, a crack type is selected. The user traces a selected crack using a mouse. Once the
3
tracing is completed, the system automatically computes actual length (226.58 inches) of a crack.
Figure 1 Analysis of Longitudinal and Transverse Crack by Line
Figure 2 illustrates how to measure the area of patching. The user clicks on patching button on the right dialogue panel, patching option is selected. The user traces a boundary of the patching using a mouse. Once the boundary is closed as a polygon, the system automatically computes actual area of patching.

4
Figure 2 Analysis of Patching by Polygon
Figure 3 illustrates how to measure the crack severity. By clicking on the Zoom Rect icon form the tool bar, the function to measure severity becomes activated. The user then moves his/her mouse on the crack and click the mouse button to zoom the crack to the fixed level. The user then drags the cursor from one side of crack to the other side to measure the width of the crack. The system automatically computes the crack width, displays it on a dialogue box, and selects the appropriate severity level based on the measured crack width.
Once the operation is completed, the system provides a report which includes all of
distress data along with pavement section information. The processed data are stored in MS Access database which can be converted into an Excel file.

5
Figure 3 Measurement of Crack Width with Zooming Function
VERIFICATION OF THE OUTPUTS PROVIDED BY CONSULTANT
Iowa DOT provided a set of digital images collected by the consultant. The size of the digital image is 154 inches (3.89m) by 394 inches (10m) as shown in Figure 4. Total 1585 images were analyzed using the manual quantification software package described above. A sample printout of the manual analysis result is reproduced in Table 1 and the printout of the manual analysis of 1,585 images is included in the Appendix.

6
972 Pixels, 3.79 m
486 Pixels 486 Pixels
1544
Pix
els,
4.9
1 m
456
Pix
els
456
Pix
els
456
Pixe
ls
Figure 4 Image Collected by the Consultant.

7
Table 1 Sample Printout of Manual Image Analysis Result
Image Directory Image Name Chain Length(LW) Severity(LW) Length(LNW) Severity(LNW) Length(T) Severity(T) Area(A) Severity(A) Area(P) Severity(P) Area(D) Number(D) Severity(D) Pave Type Unit
00331081 61091 6711 c:\000019260000\000021450000.jpg 2145 0 390.651 H 2 H 0 0 0 0 A in
00331081 61091 6711 c:\000019260000\000021460000.jpg 2146 0 392.029 H 2 H 0 0 0 0 A in
00331081 61091 6711 c:\000019260000\000021470000.jpg 2147 0 398.2 H 2 H 0 0 0 0 A in
00331081 61091 6711 c:\000019260000\000021480000.jpg 2148 0 396.481 H 1 H 0 0 0 0 A in
00331081 61091 6711 c:\000019260000\000021490000.jpg 2149 0 401.309 H 1 H 0 0 0 0 A in
00331081 61091 6711 c:\000019260000\000021500000.jpg 2150 0 401.353 H 1 H 0 0 0 0 A in
00331081 61091 6711 c:\000019260000\000021510000.jpg 2151 0 392.945 H 2 H 0 0 0 0 A in
00331081 61091 6711 c:\000019260000\000021520000.jpg 2152 0 540.478 H 1 H 0 0 0 0 A in
00331081 61091 6711 c:\000019260000\000021530000.jpg 2153 0 397.419 H 1 H 0 0 0 0 A in
00331081 61091 6711 c:\000019260000\000021540000.jpg 2154 0 401.309 H 0 0 0 0 0 A in
00331081 61091 6711 c:\000019260000\000021550000.jpg 2155 0 389.268 H 2 H 0 0 0 0 A in
00331081 61091 6711 c:\000019260000\000021560000.jpg 2156 0 348.526 H 0 0 6023.224 0 0 A in
00331081 61091 6711 c:\000019260000\000021570000.jpg 2157 0 385.305 H 2 H 0 0 0 0 A in
00331081 61091 6711 c:\000019260000\000021580000.jpg 2158 0 393.297 H 1 H 0 0 0 0 A in
00331081 61091 6711 c:\000019260000\000021590000.jpg 2159 0 212.976 H 2 H 0 0 0 0 A in
00331081 61091 6711 c:\000019260000\000021600000.jpg 2160 0 380.777 H 1 H 0 0 0 0 A in
00331081 61091 6711 c:\000019260000\000021610000.jpg 2161 0 400.872 H 1 H 0 0 0 0 A in
00331081 61091 6711 c:\000019260000\000021620000.jpg 2162 0 398.189 H 1 H 0 0 0 0 A in
00331081 61091 6711 c:\000019260000\000021630000.jpg 2163 0 396.452 H 1 H 0 0 0 0 A in
00331081 61091 6711 c:\000019260000\000021640000.jpg 2164 0 398.238 H 2 H 0 0 0 0 A in
00331081 61091 6711 c:\000019260000\000021650000.jpg 2165 0 399.663 H 2 H 0 0 0 0 A in
00331081 61091 6711 c:\000019260000\000021660000.jpg 2166 0 345.974 H 1 H 0 5448.24 0 0 A in

8
Figure 5 shows sample images used for the manual image analysis. No. 2156 image contains longitudinal crack and patching, whose measurement values are 348.526 inches and 6023.223 in2, respectively. No. 2159 image shows two transverse cracks and a longitudinal crack with a total length of 212.976 in.
(a) No. 2156 Image (b) No. 2159 Image
Figure 5 Typical Images Collected by the Consultant

9
DEVELOPMENT OF AUTOMATED CRACK IMAGING PROCEDURE
A robust tile-based automated crack imaging software package was developed, which applies a median filtering technique to each tile to remove background noise caused by the pavement’s rough texture while maintaining minimal degradation of sharp crack edges. The original image is overlaid with a tile of predetermined dimensions, such as 6 x 6 inches of a pavement surface. The size of the tile may be made of different numbers of pixels depending on the resolution of the digital camera and how high the camera is mounted above the pavement surface. First, an optimum median filter is identified for various types of pavements by varying the median filter size from 3 x 3 to 9 x 9 pixels, depending on their roughness levels. Second, a thresholding equation based on the average gray-scale of each tile is developed to obtain the optimum threshold value. To improve the accuracy of the automated crack imaging procedure, variable optimum threshold level is selected for classifying a tile as cracked or not. Finally, automated crack analysis result is compared against the one produced by the manual image analysis software.
Tile-based Unified Crack Index
To calculate crack index, first, the value of the central pixel is compared with its neighbors at 5 x 5 pixels, and its value is adjusted to the median of these neighbors. Median filters are the most effective noise reducers due to their tendency to preserve rather than blur edges (Hansen et al. 1999). The developed automated crack imaging procedure applies a regression equation based on the average gray scale of each tile to obtain the optimum threshold value. This technique first determines an optimum threshold value for each tile as a function of its average gray-scale value. For each tile, the gray value of each pixel is compared against the optimum threshold value. The pixel is classified as a crack pixel if its gray value is less than the optimum threshold value. The decision to classify each tile as cracked or not is based on the percentage of crack pixels present in a tile. The number of cracked tiles is then divided by the total number of tiles to compute a unified crack index for each pavement image. Figure 6 shows a sample image projected on a computer screen, which displays a computed crack index of 11.26% (41 cracked tiles out of a total of 364 tiles).

10
Figure 6 Crack Index Example based on Tile-based Crack Quantification Procedure
Tile-based Crack Type Index
The crack type of actual pavement images is determined using horizontal and vertical histograms of a binary image. First, the actual pavement image is converted into a binary image and horizontal and vertical histograms of the binary image are computed. The difference between two adjacent histogram peaks are computed and summed as illustrated in Figure 7. Crack type index is then calculated by subtracting sum of the horizontal differences from that of the vertical differences. The crack type is determined based on the value of crack type index.

11
Figure 7 Calculation of Crack Type Index
Figure 8 illustrates the range of crack type index. For example, as shown in Figure 8, an image can be classified as transverse cracking if its crack type index is less than -5. If the crack type index ranges from -5 to 5, it can be classified as alligator cracking or block cracking. The unified crack index can be used to distinguish block cracking from alligator cracking because block cracking produces a smaller unified crack index than alligator cracking. If the crack type index is greater than 5, it can be classified as longitudinal cracking.
Figure 8 Range of Crack Type Index
0 0 0 0 0 0 0 0 0 0 0 0 00 0 0 0 0 0 0 0 0 0 0 0 00 0 0 0 0 0 0 0 0 0 0 0 01 1 0 0 0 0 0 0 0 0 0 0 00 1 1 1 1 1 0 0 0 0 1 1 10 0 0 0 0 1 1 1 1 1 0 0 10 0 0 0 0 0 0 0 0 0 0 0 00 0 0 0 0 0 0 0 0 0 0 0 00 0 0 0 0 0 0 0 0 0 0 0 00 0 0 0 0 0 0 0 0 0 0 0 00 0 0 0 0 0 0 0 0 0 0 0 00 0 0 0 0 0 0 0 0 0 0 0 0
1 2 1 1 1 2 1 1 1 1 1 1 2
000286000000
1 1 0 0 1 1 0 0 0 0 0 1
00262600000
5
16
Sum of the vertical differences
Sum of The
Horizontal
differences
-5 0 5
Alligator Cracking Transverse Longitudinal
-11

12
Comparison of AIAS against MIAS Unified Crack Index
To compute unified crack index, 10 sample digital images were analyzed using both AIAS and MIAS and the results are summarized in Table 2. In this report, the bias is defined as an average value of the differences between two measurements from each image, one by AIAS and the other by MIAS. The precision is defined as an average value of the absolute differences between two measurements. Based on 10 sample images, the average difference was -3.4% and the average absolute difference was 3.4%. The AIAS consistently underestimated the unified crack indices compared with MIAS.
Table 2 Comparison of MIAS vs. AIAS
UCI
No. File Name
Crack Index (Auto)
Crack Index
(Manual) Difference %
DifferenceAbsolute
Difference
% Absolute
Difference1 2426 86.8 90.2 -3.4 -4% 3.4 4%2 2427 84.8 88.2 -3.4 -4% 3.4 4%3 2428 86.3 89.0 -2.7 -3% 2.7 3%4 2429 86.9 89.4 -2.5 -3% 2.5 3%5 2430 87.2 90.3 -3.1 -4% 3.1 4%6 2431 86.2 89.1 -2.9 -3% 2.9 3%7 2432 85.1 86.8 -1.7 -2% 1.7 2%8 2433 84.5 87.2 -2.7 -3% 2.7 3%9 2434 88.2 90.1 -1.9 -2% 1.9 2%
10 2435 86.7 90.3 -3.6 -4% 3.6 4%11 2436 80.8 84.1 -3.3 -4% 3.3 4%12 2437 88.9 93.1 -4.2 -5% 4.2 5%
Average 86.0 89.0 -2.95 -3.4% 2.95 3.4%
Crack Type
Crack type was also analyzed using the same images shown in Table 2. AIAS can determine only one crack type for each image. Figure 9, 10, 11, and 12 show examples of crack types: 1) longitudinal, 2) transverse, 3) alligator, and 4) block cracking.

13
`
Figure 9 No. 6 Longitudinal Cracking Image analyzed by AIAS
Figure 10 No. 4 Transverse Cracking Image analyzed by AIAS

14
Figure 11 No. 10 Alligator Cracking Image analyzed by AIAS
Figure 12 No. 3 Block Cracking Image analyzed by AIAS
CONCLUSION
The objective of the proposed research is to 1) develop manual image analysis system (MIAS) 2) verify outputs provided by the consultant and 3) develop automated

15
image analysis system (AIAS). The MIAS was designed in consultation with Iowa DOT personnel that would allow them to process digital images interactively through a computer screen in the most efficient manner. For each image, the manually processed data is stored automatically in the data base to verify the outputs provided by the consultant. A total of 1,585 images from the consultant were processed using the MIAS.
A robust tile-based automated crack imaging software package was developed,
which can compute unified crack index and crack type index. First, the image is overlaid with a tile of predetermined dimensions, such as 6 x 6 inches of a pavement surface. To improve the accuracy of the automated crack imaging procedure, variable optimum threshold level was then applied for classifying a tile as cracked or not. Using 10 sample images, AIAS result was compared against the one produced by MIAS resulting in 3.4% precision and -3.4% bias.
ACKNOWLEDGEMENTS
The authors would like to thank the guidance provided by Jason Omundson, David Oesper, and Mark Dunn of Iowa Department of Transportation throughout this study. The authors would also like to express their thanks to the Iowa Highway Research Board for providing the insight and necessary funding for the study. The opinions, findings, and conclusions expressed in this publication are those of the author and not necessarily those of the Iowa Department of Transportation.
REFERENCES
Cable, J. K., "Clarifying the Quadrennial Needs Study Process," Iowa Highway Research Board, HR-363, December 1993.
Cheng, H. D., X. H. Jiang, J. Li, and C. Glazier, "Automated Real-Time Pavement Distress Analysis," 78th Annual Meeting, TRB, Washington, D.C., 1999.
Guralnick, S. A., E. S. Sun and C. Smith, "Automating Inspection of Highway Pavement Surfaces," Journal of Transportation Engineering, Vol. 119, No. 1, 1993.
Haas, C and S. McNeil, "Criteria for Evaluating Pavement Imaging Systems," Transportation Research Record, No. 1260, 1990.

16
Hansen, J. H., S. P. DeMerchant, and A. Pujol, Jr., "An Adaptive Segmentation Technique for Automated Crack Detection," 78th Annual Meeting, TRB, Washington, D.C., 1999.
Jitprasithsiri, S., H. Lee, R. and G. Sorcic, “Development of Digital Image Processing Algorithm to Compute a Unified Crack Index for Salt Lake City,” Transportation Research Record, No. 1526, TRB, 1996, pp. 142-148.
Lee, H., "Standardization of Distress Measurements for the Network-Level Pavement Management System," ASTM STP, No. 1121, ASTM, 1992, pp. 424-436.
Luhr, D. R., "A proposed methodology to Quantify and Verify Automated Crack Survey measurements," the 78th Annual TRB Meeting, Washington, D.C., January 1999.
Maze, T., O. G. Smadi, and J. Resler, "Feasibility of Using Automated Distress Data in the County need Study," TR-418, Iowa Department of Transportation, December, 1998.