project synthesis report - undp
TRANSCRIPT

Project Synthesis Report
Project Synthesis Report
“Identi�cation and Implementation of Adaptation Response Measures
in the Drini – Mati River Deltas”
“Identi�cation and Implementation of Adaptation Response Measures
in the Drini – Mati River Deltas”


“Identification and Implementation of Adaptation Response Measures in
the Drini – Mati River Deltas”
Project Synthesis Report
Tirana 2013

AUTHORS
The publication is prepared by Dr. Martin Le Tissier based on contributions of project team:
Eglantina Bruci, Prof. Dr. Project coordinatorRobert Kay, Dr. International project consultantEmirjeta Adhami, Dr. Project technical assistantJak Gjini Local project coordinatorDavid Brew, Dr. International geomorphology & restoration
expertLiri Muçaj, Prof. Assoc. Dr. Climatology expertAlfred Mullaj, Prof. Dr. Biodiversity expertMiriam Ndini, Dr. Hydrology expertAbdulla Diku, MSc. Agriculture expertSabri Laçi, Prof. Dr. Tourism and population expertMartin Le Tissier, Dr. International ICZM expertAndrian Vaso, Dr. ICZM and restoration expertDominic Moran, Prof. International economics expertElona Pojani Economics expertNarin Panariti, Prof. Assoc. Dr. Environmental policy & legislation expertFerdinand Bego, Prof. Assoc. Dr. Biodiversity monitoring expertVangjel Mustaqi, Prof. Assoc. Dr. Hydrometeorological monitoring expertAlbana Zotaj GIS/remote sensing expertOdeta Zheku, MSc. Communication & information assistantMelita Leka Finance & admin assistant
ii

TABLE OF CONTENTS
PART 1. EXECUTIVE SUMMARY Preamble 2The project area 3Purpose of this document 5Contents of this document 5
PART 2. NON - TECHNICAL SUMMARY 1. Introduction 72. Background to the DMRD areas – the enviroment and human dimension 9
3. The context of climate change for the DMRD area 124. Synthesis of project reports 17 4.1 Status of information baseline 17 4.2 Geomorphology 18 4.3 Ecosystems 22 4.4 Agriculture 25 4.5 Tourism 27 4.6 Other sectors 29 4.7 Technical information 29
4.7.1 Geographic information systems 304.7.2 Hydrology 304.7.3 Monitoring climate change 334.7.4 Ecosystem restoration 334.7.5 The economics of climate change and adaptation 34
PART 3. TECHNICAL SUMMARY5. Climate changes expected in the DMRD area 37 5.1 Current status and trends 37
5.1.1 Solar radiation 375.1.2 Air temperatures 385.1.3 Precipitation 39
5.2 Predicted changes 415.2.1 Temperature projections 41
iii

5.2.2 Projections for precipitation 435.2.3 Projections of mean sea level pressure 445.2.4 Sea level projections 45
5.3 Expected effects of climate change 465.3.1 Effects of expected changes in temperature 465.3.2 Effects of expected changes in mean sea level pressure 475.3.3 Effect of hazardous precipitation 475.3.4 Effect of climate change on tourism climate index 47
5.4 Summary of effects 486. Geomorphology 49 6.1 Background 49 6.2 Geomorphological characterisation 49 6.3 Historical coastal change 51
6.3.1 Coastline changes detected with GIS techniques 51 6.4 Key of future coastal evolution 53
6.4.1 Coastal erosion along the Kune and northern Vaini-Patok sub cells 536.4.2 Coastal deposition along the southern Vaini-Patok sub cell 546.4.3 Tidal inlet dynamics and potential eutrophication 556.4.4 Rainfall, land drainage and river flooding 55
6.5 Conceptual evolution to 2100 557. Hydrology 58 7.1 Effects of current climate variability and extremes on the water resources in the DMRD 58
7.1.1 Drini i Lezhës water basin 587.1.2 Mati River water basin 58
7.2 Effects on groundwater and coastal dynamic and their influence in the other economic sectors in the DMRD 66
7.2.1 Likely effects of climate change on river runoff 667.2.2 Likely effects of sea level rise on coastal dynamic 677.2.3 Sea level rise impact on flooding 687.2.4 Expected climate change and sea level rise effects on ground water 69
8. Biodiversity 72 8.1 Natural Ecosystems of DMRD area 72
iv

8.1.1 Flora 728.1.2 Fauna 738.1.3 Types of habitats in the DMRD area. 75
8.2 Impact of current climate on ecosystems of the DMRD 80 8.3 The expected climate change effects on natural ecosystems and their influence in the other economic sectors in the DMRD 82
8.3.1 Impact of expected changes in temperature 828.3.2 Maximum Temperatures ≥ 35°C 848.3.3 Minimum Temperatures <-5°C 848.3.4 Extended growing season 858.3.5 Temperature rise and invasive species 858.3.6 Precipitation 868.3.7 Hazardous precipitation 878.3.8 Drought 888.3.9 Mean sea level pressure 898.3.10 Sea level rise 89
9. Agriculture 90 9.1 Background 90 9.2 Potential impacts of climate change to agriculture sector 91 9.3 Climate effects on plant growth 91
9.3.1 Impact of climate condition in the agriculture production 92 9.4 Impacts of climate change on agriculture 93
9.4.1 Temperature 949.4.2 Precipitation 969.4.3 Influence of climate on crop water needs 989.4.4 CO2 “fertilization” effects 999.4.5 Effect of climate change on growing season 999.4.6 Likely changes in sea level 1009.4.7 Climate change effects on forage quality 1019.4.8 The indirect impact of climate cahnge effects on agriculture 101
10. TOURISM AND POPULATION 102 10.1 Background 102 10.2 Current climate impacts 104 10.3 Expected climate change impacts 105
v

PART 4. ADAPTATION RESPONSES FOR THE DMRD AREA11. Introduction: Planning for adaptation 109 11.1 Background 109 11.2 Strategic risk assessment 109 11.3 Identification of measures that build adaptive capacities 113 11.3.1 Measures that can build adaptive capacities 114 11.3.1.1 Developing a management framework for climate change adaptation 115
11.3.1.2 Institutional strengthening for ICZM and climate change adaptation 118
11.3.1.3 Developing a legislative framework for climate change adaptation 120
11.4 Identification of measures that deliver adaptation options 12311.4.1 Ecosystem-based adaptation measures 123 11.4.1.1 Coastal erosion 124 11.4.1.2 Water exchange 128 11.4.1.3 Sea - level rise 12911.4.2 Community-based adaptation measures 130
12. Implementing adaptation 133 12.1 Principles to establish a system for prioritising adaptation measures 133 12.2 The prioritized system 134 12.3 Aproach to prioritisation 135 12.4 Results of prioritisation analysis 135 12.5 Indicative costs of adaptation measures 138
12.5.1 Technical studies 13812.5.2 Environmental impact assessment 13912.5.3 Indicative ‘build’ costs 139
12.6 Monitoring 14013. Economic assessment 140 13.1 Introduction 140 13.2 Economic assessment methods related to climate change adaptation 141 13.3 Cost - benefit analysis 142
13.3.1 Non-market impacts (environmental benefits and costs) 143 13.4 Economic assessment estimation 143
vi

13.4.1 Climate scenarios and impact categories 14413.4.2 Flooding events 14613.4.3 Wetland loss 14613.4.4 Loss of agricultural land 14713.4.5 Tourism demand and the value of beach recreation 14813.4.6 Fishing 14813.4.7 Ecosystem carbon 14913.4.8 Summary and implications 149
13.5 Costing of prioritized adaptation measures in the DMRD including costs and benefits 149
13.5.1 Combined ‘hard’ and CbA measures in lagoons 15013.5.2 Community-based measures 154
13.6 Conclusions and comments 156 13.7 Final proposed short term measures for implementation 156
APPENDIX 1List of project reports and other references 158
APPENDIX 2Sector specific adaptation measures that deliver adaptation options 161
APPENDIX 3Project prioritization criteria’s and respective scoring rates 166
vii

viii
ACRONYMS
BOD Biological Oxygen DemandCbA Community based AdaptationCBA Cost-Benefit AnalysisCCA Carrying Capacity AssessmentCOD Chemical Oxygen DemandDG Decision of GovernmentDMRD Drini Mati River DeltasEbA Ecosystem based AdaptationEEC European Economic CommissionEEZ Exclusive economic zoneEIA Environmental Impact AssessmentETo EvapotranspirationEU European UnionGDP Gross Domestic ProductGEF Global Environment FacilityGIS Geographical Information SystemHDI Human Development IndexIBA Important Bird AreaICZM Integrated Coastal Zone ManagementIMS Integrated Monitoring System INC Initial National CommunicationINSTAT Institute of StatisticsIUCN International Union for Conservation of NatureMDG Millennium Development GoalsMoEFWA Ministry of Environment, Forest and Water Adminis-
trationMSLP Mean Sea Level pressureMSP Medium Size ProjectNBSAP National Biodiversity Strategy and Action planNPV Net Present ValuePCU Project Coordination UnitPV Present value

SCCAP Strategic Climate Change Adaptation PlanSEA Strategic Environmental AssessmentSPA Specially Protected AreaSPI Standard Precipitation IndexSRES Special Reports on Emission ScenariosT max Temperature maximalTCI Tourism Climate IndexTEV Total Economic valueUNDP United Nations Development ProgramUNFCC United Nations Framework Convention on Climate
ChangeWATBAL Water Budget Model
iii

ACKNOWLEDGEMENTS
This publication has been prepared within the project “Identification and implementa-tion of the Adaptation response measures in the Drini-Mati River Deltas” financed by Global Enviroment Facility, Ministry of Environment, Forestry and Water Administra-tion and the United Nations Development Programme. The project is part of Special Priority Adaptation focal area.
This publication could not have been prepared without the generous contribution, valuable support and experience during the capacity building process on climate change risk assessment and adaptation planning of the Lezha Regional Council and Communes Shëngjin, Shënkoll and Fushë Kuqe, Directorate of Biodiversity at the Ministry of Environment, Forests and Water Administration, Drainage Board of Lezha, Institute of Geosciences, Energy, Water and Environment, Kune-Vain Protected Area Administration, National Agency of Territory Planning. Special thanks go to Carmen Elrick and Coastal Zone Management (CZM, Australia) in formulation of Strategic Documents, produced in the frame of project and summarized in this publication.
x

1
This publication presents a synthesis of technical studies conducted as part of the Me-dium Size Project (MSP)1 “Identification and Implementation of Adaptation Response Measures in the Drini – Mati River Deltas (DMRD)”, financed by Global Environ-ment Fund (GEF), Albanian Government and United Nations Development Program (UNDP).
Both non-technical and technical summaries are presented along with a synopsis of the adaptation measures that have emerged from the project. Institutional and tools and methods using the concept of Integrated Coastal Zone Management (ICZM) are also presented.
In summary:
• The technical studies were conducted as part of a process to build adaptive capaci-ties in the DMRD to ensure resilience of the key ecosystems and local livelihoods to climate change.
• A series of 23 reports related to identification of current climate impacts and its changes in the protected areas within the DMRD, adaptation measures proposed for implementation, including Strategic Climate Change Adaptation, have been drafted. Some other reports, related to potential restoration activities, cost and benefit analysis and integrated management have also been produced.
• This report draws out the principle findings of these studies and places them in the overall context of the project objectives.
PART 1. EXECUTIVE SUMMARY
1 MSP – project of medium size according to the implementation fund
2
PREAMBLE
The low-lying coastal region of the DMRD2 is situated in northern Albania be-tween the rock headlands of Shëngjini in the north and Cape Rodonit in the south. The lowland area is approximately 25 km long and up to 3 km wide (average 2 km) and comprises a complex of habitats, including beaches, dunes and wetlands (predomi-nantly saltmarshes and lagoons) with significant biodiversity values. These habitats and the communities that rely on them are vulnerable to future long-term climate change that will induce sea-level rise and increase storminess. In addition, short-term losses of habitat are also taking place due to changes in coastal processes caused by human inter-ventions along the coast and inland. The Lezha region (figure 1) spans an area of 1,619 km2 (or 5.6% of the national territory), divided in three districts: Kurbin, Lezhë and Mirditë, comprised of 5 municipalities and 16 communes. The region has a coast line of 38 km and includes the Drini (Lezhë district) and Mati River (Kurbin district) deltas. Coastal communes surrounding the DMRD are Shëngjin, Shënkoll and Fushë Kuqe.
The DMRD harbour significant biodiversity values that are recognized under the Na-tional Biodiversity Strategy and Action Plan (NBSAP, 1999). Three main types of habitat are found between the two deltas including: (i) marine, (ii) wetlands, including estuarine, riverine, lacustrine and palustrine, and (iii) non-wetland habitats including forests, shrubs and open fields where traditional agriculture is practiced. The DMRD provides wintering grounds for over 70 other species of waterfowl and water bird with a total population of some 180,000 individuals, and is an internationally recognized Important Bird Area (IBA). Further, the Patok lagoon, within the Mati Delta serves as an important feeding area for globally endangered loggerhead turtles (Caretta caretta) in the Adriatic Sea and forests in the DMRD harbour several medicinal and aromatic herbs.
The DMRD has been identified as a critically vulnerable region of Albania. This con-clusion comes from the first comprehensive vulnerability and adaptation assessment undertaken under the First National Communication (FNC) to the United Nations Framework Convention on Climate Change (UNFCCC). The climate change scenarios for Albania developed as part of this exercise have predicted an annual increase in tem-perature of up to 3.6 ºC, decrease in precipitation by 12.5%, and consequent reduction of water resources and arable land (due to moisture loss, soil erosion and degradation) by the year 2100. In the coastal zone, an increase in sea surface temperature and a rise in mean sea level rise of up to 61 cm by 2050-2100 is expected to have serious impacts on marine and littoral biodiversity as well as livelihoods of local communities. Extreme events such as heavy rains, floods and drought are not rare phenomena for the area, and are already causing habitat loss and fragmentation. More extreme variability in climate
PART 1. EXECUTIVE SUMMARY
2 The project area placed along Drini I Lezhes, brunch of Drini River and Mati River

3
drivers (such as wind, rainfall, storms and mean sea level) and associated impacts will lead to gradual inundation and submersion of low-lying coastal area resulting in loss of dune and marshland habitats and destruction of valuable lagoon ecosystems.
Government with its Decision no. 432, dt. 28.04.2012 and Decision of Government (DG) no. 995, dt. 03.11.2012 has expanded the existing network of protected areas to covering the entire region of Shëngjin from Kune-Vain to Tale to River Mati to Patok to Fushë Kuqe to River Ishmi. This make necessary that their protected area manage-ment plans calls for consideration of climate change impacts and adaptation measures.
THE PROJECT AREA
The Lezha region, in which the DMRD lies, is one of the poorest regions in Albania. The population in 2005 was estimated at 95,260 inhabitants, 70% of which reside in rural areas. This region has seen an influx of inhabitants from the mountainous areas of the country that seek to move to the coast. However, the region is also affected by emigration with 40.6% of families having at least one member abroad.
Figure 1. Communes within the Lezha region showing the 3 coastal communes of Shëngjin, Shënkoll and Fushë Kuqe.
Source: Millenium Development Goals (MDG) Regional Report for Lezha
Lezha is among the regions with a mid-level Human Development Index (HDI): Lezhë and Kurbin at 0.798, and Mirdita at a lower HDI of only 0.632. The unemployment rate
PART 1. EXECUTIVE SUMMARY

4
of 28% is about two times as high as the national average (14.4%), which is an indica-tion of the high level of poverty in the region. 51% of the labour force is engaged in the private agriculture sector (this includes fisheries), 35.3% in the private non-agriculture sector, and 13.7% in the state sector. Tourism and agriculture are two important sectors impacting economic growth of the region.
Considering the relatively small size of the country, Albania is rich in biodiversity residing in its numerous mountain, lake and coastal ecosystems. The country houses endangered species and a number of globally threatened species. There are at least 73 vertebrate and 18 invertebrate species of global importance that have part of their habi-tat and population in Albania.
The Drini River delta is a compound system consisting of sandy belts, capes, bays, lagoons and island areas. The Kune-Vain protected area (with a total surface of ap-proximately 2300 ha) and the Knalla Lagoon lie within the Drini Delta. The area has been recognized as an IBA and is also recognized for its landscape values under the Ramsar Convention. It provides wintering and nesting grounds for a number of bird species, and also harbours endangered mammal, amphibian and reptile species. In the Mati River delta lies the Patok lagoon with a surface area (including the outer lagoon) of 480 ha. Its catchment area is 800 ha, of which 450 ha constitute agriculture fields, 200 ha is forested, and 150 ha are pasture.
The current conservation regime in the DMRD consists of 3 protected areas: Kune (800 ha), Vain (1500 ha), and Patok-Fushe Kuqe (2200 ha). These are International Union for Conservation of Nature (IUCN) Category IV protected areas namely, managed na-ture reserves.
Under Albania’s enabling activities portfolio responding to the UNFCCC, the DMRD ecosystem has been prioritized as an ecological system vulnerable to climate change, where adaptation response measures need to be implemented. The Drini Cascade (ranging from inland Kukës to the Drini Delta on the Adriatic Coast) is identified as an area of Albania where there is both high vulnerability and a high likelihood of signifi-cant potential impacts from climate variability and change, given the globally signifi-cant biodiversity it harbours and the national importance for poverty reduction. Simi-larly, the Mati delta was identified under the INC as particularly vulnerable to climate change due to reduction in the area of coastal dunes, saline marshlands and wetlands. These two deltas form a contiguous wetland area of global significance. Further, this area is a national development priority, as articulated in the Milllennium Development Goals (MDGs) Regional Report for Lezha, offering an opportunity for considering the interaction of climate impacts with the development policies, projects and programmes envisioned for this administrative region.
PART 1. EXECUTIVE SUMMARY

5
PURPOSE OF THIS DOCUMENT
The overall development goal of the DMRD project is to assist Albania in establishing a mechanism by which strategies to moderate, cope with, and take advantage of the consequences of climate change are enhanced, developed, and implemented.
The specific objective of the project is to build adaptive capacities in the DMRD to ensure resilience capabilities improvement of the key ecosystems and local livelihoods to climate change.
This report consists of four parts:
Part 1. An Executive Summary and Preamble – This outlines the objectives of the DMRD project and the contributions the technical studies have made towards address-ing these, and the background and purpose of this document.
Part 2. A Non-Technical Summary – This presents in non-technical language the principle activities and outcomes from each of the technical subject areas made by the project. It is designed to be read by policy makers and their advisors, as well as managers from the private and public sectors, who do not require an in-depth technical knowledge of the facts and figures of climate change, but do need to develop a back-ground understanding of climate change and the challenges it presents.
Part 3. A Technical Summary – This provides a detailed outline of each of the studies carried out, the conclusions that emerge from the results and their relevance in the context of the other technical studies and the DMRD project as a whole. It is de-signed to provide a concise synthesis of the technical information that has been assimi-lated by the project. The text can be used by those who have technical understanding of climate change issues from the perspective of one subject area and need to develop a broader perspective from other subject areas.
Part 4. Adaptation measures – Provides a summary of the approach taken to determine options for adaptation measures appropriate to the DMRD area and the method of se-lection of adaptation measures that are being implemented by the project.
CONTENTS OF THIS DOCUMENT
One of the main outcomes to achieve this objective is to develop capacities to monitor and respond to anticipated climate change impacts in the DMRD at the institutional and community levels. Key to achieving this is to establish an information base that can inform decision making. To this end the project commissioned a series of studies that
PART 1. EXECUTIVE SUMMARY

6
assimilated existing information and generated new studies and data to support the de-velopment, the design and implementation of adaptation measures for the DMRD area.
These reports covered:
1. Key economic sectors, namely: • Agriculture, • Environment, and • Settlements and tourism
2. Key technical areas, namely: • Climate change, • Natural ecosystem • Environmental economics assessment, • Environmental restoration, • Geographic Information Systems, • Geomorphology, • Hydrology, • Hydromet & ecosystem integrated monitoring, • Integrated Coastal Zone Management, • Legislation & institutional capacity assessment.
3. Key management reports, namely: • Strategic climate change adaptation plan, • Recommendations for integrating adaptation measures in development and infrastructure plans / programmes, • Report on prioritization measures to support coastal ecosystem restoration and other adaptation measures.
PART 1. EXECUTIVE SUMMARY

7
Part 2 is designed to be read by policy makers and their advisors, as well as man-agers from the private and public sectors, who do not require an in-depth techni-cal knowledge of the facts and figures of climate change, but do need to develop a background understanding of climate change and the challenges it presents. The text presents in non-technical language the principle activities and outcomes from each of the technical subject areas made by the project.
1. INTRODUCTION
Governments and scientists across the world are clear that the world is warming and climate change, with its impacts, is inevitable. Climate change will adversely affect the characteristics of coasts, modifying their ecosystem structure and functioning (figure 2). As a result, coastal nations face losses of marine biodiversity, fisheries, and shore-lines. Healthy marine and coastal ecosystems provide valuable services - from food security, resources for economic growth and recreation alongside tourism and coastline protection.
The future role of ecosystems for human well-being depends increasingly on developing the capacity of countries to manage human uses and impacts to ensure their
PART 2. NON - TECHNICAL SUMMARY
Figure 2. This schematic diagram illustrates some of the features and activities of the coastal zone that will come under increasing pressure from the effects and impacts of predicted
climate change.
SnowpackHydroelectric
PowerFloods
AgricultureDrought
River flow
Habitat Delta levees
Water quality Water use
Groundwater

8
health and self-repairing capacity is not undermined. Central to a response to decades of overfishing, pollution and unplanned urban development will be moving from sec-toral marine and coastal management, to a joined approach that marries the seemingly competing interests for ocean and coastal resources and space, such as environment, tourism, fisheries and energy generation, within a robust framework and a spatial plan-ning perspective. This is central to ensuring equitable access among diverse interests and users.
In Albania, impacts that could be associated with aspects of climate change and poor development planning have recently started to become visible. A conclusion that emerges from the technical studies is that patterns of coastal erosion may be altering beyond the ‘normal’ change associated with historical sea level fluctuations destroying coastal forests and vegetation and increasing the salinity in the lagoons and fields near the coast. Currently erosion rates are estimated to be between 2 – 4 metres per year, and at the mouth of the Drini River and other parts of the coast the sea is believed to have eroded more than 400 metres inland between 1936 and 1989. In common with most coastal regions of the world the DMRD faces critical and prolonged human pressures caused by changing social and economic circumstances (e.g. migration, urban develop-ment and sprawl) that seriously impact the environment (e.g. habitat loss, groundwater aquifers) (figure 3). These existing pressures will be compounded by climate change which will worsen and intensify effects on the shoreline and wetlands, which provide many environmental services, including:
• Regulation of the water system;• Human settlement protection through flood control;• Protection of the coastal region;• Mitigating storm impacts;• Control of erosion;• Conservation and replenishing of coastal groundwater tables;• Reduction of pollutants;• Regulation and protection of water quality;• Retention of nutrients;• Sustenance for many human communities settled along the coast; • Habitats for waterfowl and wild life.
Loss of these services threatens the security and wellbeing of coastal communities.
PART 2. NON - TECHNICAL SUMMARY

9
2. BACKGROUND TO THE DMRD AREAS – THE ENVIROMENT AND HUMAN DIMENSION
The environment of the DMRD offers a natural habitat providing feeding, roosting and nesting areas for a wide range of bird species. The creeks of tidal marshes provide spawning sites and nursery areas for many fish species. Tidal salt marshes have been identified as areas of high productivity providing a source of organic matter and food sources for fish and birds.
On the other hand, the resources these ecological conditions have created conditions in the DMRD area that humans have been exploiting for many years. Initially this exploi-tation was at the level of subsistence fishing and shellfish gathering. However, during the 20th century, starting from the 1950s, and especially the mid-1960s, approximately two thirds of the wetland area were drained as a consequence of migration into the area and increased demand for agricultural land. There have been other significant changes, for instance, the supply of freshwater and sediments from the Drini River. This started in 1846 when natural flooding occurred that split the flow of the Drini and Buna Rivers – significantly reducing flow to the Drini River. This effect has been increased through further river diversions after flooding in the 1950 and during the construction of dams for hydro-electric power in the Drini Cascade in the 1960s / 1970s. Consequently, the northern part of the DRMD is ‘starved’ of sediment, making it much less resilient to future climate changes. This has been followed in more recent decades with more localised human-induced changes, for instance, a demand for land for dwellings and industry (e.g. development of tourism).
Figure 3. Schematic diagram showing important natural processes and human pressures that affect coastal ecosystems and resources.
PART 2. NON - TECHNICAL SUMMARY
Upland flux
Urban flux
Sprawl
Groundwater flux
Fisher &waterfowl
Habitat loss
Storms &erosion
Dams

10
Figure 4. Consequences from beach destruction on Patoku beach.
Increased human pressures have led to significant alterations in the environment of the DMRD area (e.g. up to the end of the 19th century, the entire lowland of Lezha County was covered by high forests of oak trees). The situation is exacerbated by the unplanned nature of much of the development. These alterations (figures 4 and 5) have increased the vulnerability of the area to change and reduced the long-term resilience of coastal systems to provide the goods and services that communities are dependent upon. This places existing human users and uses of the DMRD under significant risk in terms of their wellbeing and future opportunity.
In the past, largely because human activity had not significantly modified the environ-ment or placed barriers to natural systems adjusting to change, beaches, sandy dunes, estuaries, salt marshes, lagoons, and forest have adapted naturally to changes over long time scales.
However, now and in the future natural and human systems are likely to face rates of change that are faster over shortened time scales than previously experienced. The ability of both human and natural systems to accommodate and adjust to these changes will be constrained by the changes that humans have imposed on the natural system and by the types of activity that humans wish to engage in within the DMRD area. The coastal environment is not able to adapt to the predicted changes if the natural assets are removed or irreversibly altered. Throughout the DMRD area a rapidly growing population is modifying the natural environment and overexploiting coastal, marine and estuarine resources, with irreversible consequences (see figure 8), such as:• Loss of coastal, marine and estuarine habitats;• Removal of important geomorphologic features (sand dunes);• Extensive clearing of coastal vegetation, loss of flora and fauna;• Removal of buffer zones;• Changes in distribution of invasive species;• Reduced ecosystem resilience to sea level rise and climate change; and
PART 2. NON - TECHNICAL SUMMARY

11
• Saltwater intrusion.
Figure 5. Illegal construction in Protected Area of Kune (top photos). Tourist buildings in the beach of Shëngjini (bottom left) and in national road of Fushe-Krujë - Lezhë (bottom right)
(S. Laçi).
The degradation that has resulted has a number of consequences that limit the existing options for human use of the area and limit future opportunities, these include:• Erosion and the submergence of low-lying areas from sea level rise and increased
storm frequency leading to a loss of land and reduced shoreline protection;• Alteration of the hydrological regime leading to loss of fresh water for agriculture,
other industry and domestic use;• Loss of wetland area leading to a loss of protection from sea-level rise, amenity
value and resources; and• Alteration of habitat and biodiversity leading to a loss of resources and environ-
mental resilience.
The outcome is that communities are more susceptible and unable to cope with change (vulnerability) and more likely to be impacted by change (risk).
PART 2. NON - TECHNICAL SUMMARY

12
3. THE CONTEXT OF CLIMATE CHANGE FOR THE DRINI AND MATI RIVER DELTAS
Section 2 has outlined the context of the DMRD area and pressures that have been perceived to arise over recent history. To what extent are these changes a direct conse-quence of climate change?
Over millennia the climate has changed in a cyclic way. However, current climate change predictions in that changes are happening faster than in the past and leading to levels of parameters (rate of sea level rise, temperature, rainfall etc.) that have not pre-viously been experienced. People living in the DMRD area will, over time, experience changes such as, increased fire risks, summer water shortages, effects on human health and change in the growth of natural flora. One particular change that has enormous implications for the DMRD area is sea level rise which will significantly alter the space and ecology of the area. In addition, the following changes can be expected as a conse-quence of the combination of temperature, precipitation and sea-level:• Morefrequentandseveredroughtswithgreaterfireriskarelikely. Increases more
in daily minimum than maximum temperatures are likely to occur over nearly all land areas. Frost days and cold waves are very likely to become fewer. The number of days with the temperature above 35°C is expected to increase to approximately 10 days per year by 2100. As a consequence, the number of heat waves and cooling degree days are also expected to increase.
• An increase of the number of rainy days, with about 3-5 days of hazardous rainfalls, by 2100 .
• The occurrence of severe, moderate and dry drought is expected to increase by 2100. An increase of Standard Precipitation Index (SPI) 3, (the cases of moderate, severe and extremely dry) of about 18 cases by 2030, and about 20, 22 and 24 cases by 2050, 2080 and 2100 respectively.
• Increased spring temperatures will increase soil temperature and extend suitable zones for summer crops and length of the growth season. The length of the growing season is projected to increase from 263 days to potentially 289 days, which is 26 days longer than in 1990.
• As result of the reduction in annual total precipitation, the study area could experi-ence a general decrease in runoff. The demand for water could increase, especially in summer.
• Up to the year 2100 summer weather conditions for tourism are expected to change from an ‘ideal’ to an ‘excellent’ rating and the tourism season will extend in duration. The tourist comfort index (TCI) reveals the value ‘good’ in October, ‘excellent’ in May, June and September and ‘ideal’ in July and August.
• There will be about 10 days less with a cold wave by 2030, 7 days by 2050 and 5 days for the 2080.
PART 2. NON - TECHNICAL SUMMARY

13
• Warmer winters will reduce “heating degree days” and the demand for heating energy.
• This decreasing tendency in mean sea level pressure (MSLP) during summer sug-gests there will be an increase in the number of convective storm days.
• Scenarios project a loss of wetland area (around 1 km2 by 2100) from sea level rise. Scenarios also project increases in coastal floodplain area and population size (respectively around 66 km2 and 4.6 thousands by 2100). Coastal forest area and low un-vegetated wetlands area are likely to decrease.
Current human uses and exploitation in the DMRD area will, if not planned prop-erly, exacerbate and increase the cumulative effects of changing climate, changing the current status and ecosystem assemblages which, in turn, alter the use and exploitative opportunities available. Climate change scenarios for the DMRD are summarised in table 1.
Table 1. Likely changes in climate parameters (average) related to 1990. Summer sea level pressure levels suggest an increase in of number of storms and extreme events.
Years/parameter 2030 2050 2080 2100Annual temperature (oC) 1.2 1.8 2.8 3.2Annual precipitation (%) -3.9 -8.1 -12.9 -15.5Summer sea level pressure (hPa) -0.31 -0.52 -0.78 -0.91Mean sea level (cm) 8 15 28 38
The outcome of these climatic changes are summarised in table 2 and the changes in the relative areas of biotope types (e.g. wetland, coastal plain) can be expected to place additional stress on marine and littoral biodiversity as well as livelihoods of local communities. There is already evidence that all habitat types of the DMRD have been subject to significant erosion and inundation and inland intrusion of saline water. Rap-idly growing erosion and inland intrusion of saline water throughout DMRD area is causing numerous and irreversible consequences:• Loss of coastal, marine and estuarine habitats;• Extensive clearing of coastal vegetation, loss of flora and fauna.
Through erosion of sand dunes the coastaline is retreating by 2.5m per year on average affecting breeding grounds and loss of habitat. Clearly, these likely changes to the natu-ral and social framework of the DMRD area, with their consequent economic implica-tions, impact the sustainability and opportunity for development within the DMRD area.
PART 2. NON - TECHNICAL SUMMARY

14
Table 2. Model outputs for the coastal area of Lezha to illustrate likely land-type and population changes in the coastal zone for the DMRD area.
Parameters Unit2050 2100
Av.min Av.max Av.min Av.maxNet loss of wetland area km2 0.14 0.58 0.41 1.04
People actually flooded thousands/year 0.019 0.040 0.006 0.007Coastal floodplain area km2 56.14 59.20 57.19 65.95Coastal floodplain population
thousands 4.14 4.33 3.99 4.61
Total wetland area km2 4.5 4.06 4.22 3.60Coastal forest area km2 1.14 1.01 1.12 0.91Low unvegetated wetlands area
km2 3.37 3.05 3.10 2.69
Figure 6. Predicted future coastline positions (red line) caused by different sea level rise. A=9cm rise, B=16cm rise, C=35cm rise.
PART 2. NON - TECHNICAL SUMMARY

15
The outcome of the these predicted climate changes is that past and current patterns of change in the DMRD area will continue and occur at a faster rate than previously ex-perienced. As well as alterations in the position of the shoreline (figure 6), even taking the most moderate of predictions, all habitat types of the DMRD area (sandy beaches and dunes, salt marshes, lagoons, river deltas, riparian forest and freshwater habitats) will be subject to significant saltwater inundation from as little as a 0.09 m rise in mean sea level (see figure 7). Geomorphology studies carried out by the project suggest that a large area of land will be quickly converted to open water bodies. Terrestrial habitats in the DMRD area occupy approximately 5744 ha and losses, if the current management policy is continued, could be as high as 4604 ha (figure 7). Although there is a lot of un-certainty in sea level rise predictions, coupled with the resolution of data making exact predictions difficult, it is clear that even the most conservative predictions indicate that a major portion of the DMRD area would be permanently flooded. Habitats will attempt to adjust their location in relation to the coastline but will be unable to do so because of human interventions, such as embankments, prevent the natural migration of habitats. Individual and community properties (buildings and land) will also be inundated and become uninhabitable without significant modification.
Climate change is also likely to have significant impacts on provision of key ecosystem services beyond biodiversity that are also dependent on wildlife habitats, including nature-based recreation, locally-grown food, wood products, and fisheries. The inti-mate linkages between climate, biodiversity, natural systems and human livelihoods highlight the need for urgent attention to be focused on ensuring that natural systems are able to function in an as natural manner as possible in order to provide natural pro-tection and resource provision to safeguard the future occupation of the DMRD area.
PART 2. NON - TECHNICAL SUMMARY

16
Figure 7. Flood-map showing areas at risk from sea level rise scenarios covering the next 20 to 40 years.
PART 2. NON - TECHNICAL SUMMARY

17
4. SYNTHESIS OF PROJECT REPORTS
4.1 Status of information baseline The “Identification of adaptation response measures in the DRMD” project has carried out a range of studies producing (23 reports) covering the natural ecosystems, two prin-ciple economic sectors (agriculture and tourism) and focused studies covering features and information requirements needed to formulate an adaptation strategy:• Coastal geomorphology;• Natural ecosystems;• Climate change scenarios;• Environmental economics;• Environmental restoration;• Geographic Information Systems;• Hydrology/water resources;• Integrated monitoring of ecosystems;• Institutional analysis;• Strategic adaptation planning to climate change; and• Integrated Coastal Zone Management.
These reports provide the knowledge base to consider the impacts of climate change on (i) natural systems and human systems, (ii) the zones in the DMRD at risk from potential sea level rise, and (iii) capacity needs of national and local government to in-terpret data on climate variability/changes and understand climate change threats. The knowledge base will help decision makers realise the goal of the project, which is to: “To build adaptive capacities in the DMRD to ensure resilience of the key ecosystems and local livelihoods to climate change by integrating climate change response mea-sures into development programming in the DMRD.”
The principle output of the project are (i) a Strategic Climate Change Adaptation Plan (SCCAP) that outlines a package of amendments to integrate adaptation measures to climate change impacts into the management plan for the Kune-Vain-Tale and Patok-Fushë Kuqe-Ishëm PA; (ii) inclusion of a number of adaptation measures proposed in the SCCAP into the Concept of Regional Development for 2010-2015 developed by Lezha Regional Council; (iii) inclusion of climate change and adaptation measures into the Lezha Regional Council’s new sectoral strategies for tourism/agro-tourism and for-estry; and (iv) substantive training to build capacities and awareness-raising activities.The changing social, political and economic setting of Albania has been reflected in the
PART 2. NON - TECHNICAL SUMMARY

18
DMRD area through increasing demands placed on natural systems and the resources they provide leading to significant environmental damage and alteration in state over the past 20 years. This section considers how natural environments of the DMRD area, and agriculture and tourism as the principle economic sectors on the other hand, ex-ercise additional pressure on ecosystems, are changing and what the implications of climate change might be (see figure 8).
Figure 8. The close association between the natural ecosystem of the DMRD area with agri-culture (top left), tourism (top right), rural (bottom left) and urban (bottom right) areas – note that is no buffer between these components with the natural system so any impact will be direct. These photos also illustrate how human uses are at the same height level as the natural system such that any changes will easily ‘spill’ over and impact the human features.
4.2 Geomorphology
Much of the low-lying coastal plain landward of the DMRD has been dyked and drained for agriculture during the last hundred years. This agricultural area and the associated settlements constitute the most vulnerable areas to flooding from the sea and rivers. Hence, they are separated in places from the DMRD lagoons and the Drini, Mati and Ishmi Rivers by flood embankments or by a buffer zone of natural wetland.
PART 2. NON - TECHNICAL SUMMARY

19
• The sustainability of coastal de-fenses depends to a large degree on the morphological behavior of the fronting beach and shoreface;
• There is a strong relationship between coastal geomorphology and ecology where any geomor-phological change may be reflect-ed by a redistribution of habitats and/or change in quality, which could adversely affect their sus-tainability.
Historic sea level rise has been an on-going process and will be exacerbated by the additional sea level rise attrib-utable to climate change. However sea level rise is not the overriding cause of erosion in the DMRD area. In the future as sea level rise poten-tially accelerates it may have more of an effect, but the dominant driver of erosion is centred on the issue of sediment supply, and the lack of it. Future sea-level rise will have an im-pact on the lagoon-edge environments through the process of coastal squeeze – the habitats will have nowhere to go as they are drowned between the lagoon and the peripheral embank-ments. To describe the forcing factors of coastal change and evolution of the
PART 2. NON - TECHNICAL SUMMARY
The stability of the DMRD depends on the physical character of its coastline which, in turn, is determined by its geology, geomorphology and the actions through time of wind, waves and tides. The physical attributes influence its conservation value, its development potential, and its vulnerability to erosion or flooding. Hence, an apprecia-tion of the various physical shoreline types and their geomorphology lies at the heart of effective coastal planning in the DMRD, leading to more meaningful, objective and effective decision making, because:• Conservation considerations rely heavily on an appreciation of the link between
nearshore processes and their effect on the coastal environment;
Figure 9. The DMRD littoral sub cells and sediment transport directions.
Shëngjin sub cell
Kune sub cell
Vain - Patok sub cell
Drini River
MerxhanitLagoon
Zajës &CekësLagoons
Mati River
PatokutLagoons

20
DMRD area it is necessary to recognise that the area consists of three distinct sub cells3 (figure 9).
The Shëngjini Sub-Cell is characterised by an absence of new sediment supply so that sand is being reworked and lost from southern Shëngjini Beach to feed northern Shëngjini Beach.
The northern portion of the Kune sub cell is also characterised by erosion that places the Merxhani Lagoon at threat from marine inundation. At the same time towards the south the lagoon mouth could close and cut-off the exchange of water between the la-goon and the Adriatic Sea at the same time as high sedimentation is making the lagoon shallower. To negate the need for continued excavation of the river mouth, a shore-normal breakwater was constructed between 2007 and 2009 out from the beach on the south side of the river. This structure is a barrier to sediment entering the Drini River mouth and reaching Kune Beach; sediment is building up against the southern side of the breakwater leading to enhanced erosion of Kune Beach (over and above its already high rate of erosion).
Historically, the Drini River was a major supplier of sediment to the coastal zone, but now, major diversions and construction of dams along its course in the interior have reduced this supply significantly. Very little sediment now enters the coastal zone from the Drini River; this is the main reason for the overall sediment starvation and erosion of the Kune and northern Vaini-Patok sub cells.
Within the Vaini-Patok sub cell, the Mati River has been managed in the 1970s to con-trol flow further south to convert areas adjacent to Patok Lagoon to freshwater wetland suitable for agricultural reclamation.
So, the key factor causing coastal erosion along the Kune and northern Vaini-Patok lit-toral cell is low sediment supply, manifested in three main ways:• Reduced sediment input to the coast from the Drini River due to upstream diver-
sion;• Changing location of the Drini River mouth as a result of anthropogenic effects;
and• Alteration of longshore sediment transport rates due to construction of a breakwa-
ter south of the Drini River mouth.
Tidal inlets are apparent along the DMRD coast – some are natural and some are man-made. Overall, sediment accumulation in the tidal inlets will continue into the future reducing the exchange of water between the lagoons and the sea. It is possible that
PART 2. NON - TECHNICAL SUMMARY
3 Coastline unit within which sediment movement is self-contained.

21
the water in the lagoons will become increasingly eutrophic because of this limited exchange. Eutrophication will be exacerbated by the continued discharge of polluted runoff into the lagoons from the pumping stations.
To these on-going changes from a geomorphological perspective climate change will lead to additional/exacerbated changes in:• Sea level - predicted to rise at rates approximately 2 - 4 times faster than those of
the present day.• Storminess - increased frequency and intensity of storms will make them more
destructive at the DMRD.• Wave heights - a greater frequency of extreme waves would impact coastal land-
forms, increasing their susceptibility to erosion.• Habitat loss- sea-level rise may result in the gradual inundation of the low-lying
coastal areas of the DMRD and habitats including existing coastal dunes, salt-marshes and wetlands will likely be reduced in area.
The mechanism for loss will be coastal squeeze where a combination of sea-level rise, reduced sediment supply and the presence of embankments to protect agricultural land and settlement, do not allow the habitats to migrate inland. Sea-level rise will also ex-acerbate erosion of the beaches and sand dunes along the DMRD coast.• Coastal flooding – the area subject to flooding will increase.• Rainfall, land drainage and river flooding - although there is predicted to be a de-
creasing trend in annual rainfall, the number of intensive rain events (rainfall high-er than a threshold) is predicted to increase.
The DMRD coastline is extremely dynamic and a prediction of the alignment of the coastline in 2100 with no management interventions (a do nothing approach) is dif-ficult. Figure 7 does make a general assessment of the position with different rates of future sea-level rise. Hence, some general statements can be made regarding the poten-tial long-term evolution of the geomorphological system components over the next 90 years or so:• Shëngjini Beach north will continue to accrete in the lee of the port breakwater.
With a growth rate of 2 m/year, by 2100 the beach will be approximately 180 m wider in comparison to the present day;
• Shëngjini Beach south will continue to erode. With a future erosion rate of 3 m per year (the current average rate higher estimated to increase sea level) the beach will be 270 m inland compared to nowadays. This could result in loss of the track, buildings in the linear settlement, and a large area of the wetland;
• Most of Kune Spit will be eroded and Merxhani Lagoon will be lost. With a future erosion rate 3m/year, the larger part of litoral will be lost in sea by 2100 and the
PART 2. NON - TECHNICAL SUMMARY

22
main shoreline will be adjacent to the flood embankment at the back of the lagoon;• The continued presence of the Drini River breakwater will result in the
disappearance of Kune Beach;• Kune Island will be separated permanently from the mainland and be much smaller
than today due to continued erosion;• Sand will continue to build up in the lee of the Drini River breakwater. With a
growth rate of 2 m/year, by near 2100 the beach will be approximately 180 m wider in comparison to the present day;
• North Tale Beach will continue to migrate landward, but Zaje and Ceka Lagoons will be preserved as the buffer zone is wide enough to prevent total loss;
• South Tale beach will continue to be stable; and• The Mati River spit will join the spit growing north from Ishmi Beach, and will seal
the Patok Lagoon tidal inlet to form a continuous barrier.
In summary, much of the existing beach-barrier, spit and lagoon system between Shëngjini Beach and the Drini River will be lost and will leave an open coastline aligned with the current flood embankments. Shëngjini Beach will be approximately 300 m inland of its current position.
4.3 Ecosystems
Geomorphological studies have described the evolution and future trends for changes in the alignment of the coastline and characteristics of the coastal zone of the DMRD area. The ecosystems that have evolved as a consequence of the physical characteristics of the DMRD area, and the plants and animals they contain are sensitive to changes in their environment. Aspects such as temperature, rainfall, flooding and river flows affect the space and food available for them. The fabric and make-up of ecosystems in turn largely determines the resources and space that are available for humans to use and ex-ploit. Therefore, alterations in biodiversity can change the whole ecological dynamics of an area and should be carefully considered. It is important that the ecosystems of the DMRD area are considered as an integrated whole, as they are often intricately linked together whereby changes in one lead to changes in surrounding systems, including human systems.
The wetlands, lagoons and coastal woodlands of the DMRD are of national significance for conservation. The current conservation regime consists of two protected areas under IUCN Category IV and locally designated as managed nature reserves; Kune-Vaini (23 km2) and Patok-Fushë-Kuqe (22 km2). Both reserves are recognized as IBA (particu-larly Kune Island) and as potential Ramsar Sites. Kune-Vaini is important as habitat for the near-threatened pygmy cormorant, and Patok as a foraging area for the endangered
PART 2. NON - TECHNICAL SUMMARY

23
loggerhead turtle (Caretta caretta). Currently, the existing network of protected areas within which climate change impacts will be considered, is expanded.
The environmental quality and characteristics of the DMRD area (figure 10) are affected by changes that originate from natural sources, climate variability, agricul-tural practices and urbanisation. Agricultural practices have a major influence affecting levels and water quality. When saltmarshes are reclaimed for agriculture, the draining and withdrawal of water to provide the required quality of land leads to subsidence making the area more prone to flooding. Intensive use of fertilisers and pesticides af-fects environmental quality of surrounding areas. The close juxtaposition between ag-ricultural area and natural features (e.g. wetlands), and the associated settlements, con-stitute one of the most vulnerable areas to flooding from the sea and rivers. Although flood embankments provide a degree of protection, they also constrain the ability of natural systems to adjust to change and their ability to provide natural protection.
This is often described as a “wicked problem” because it is difficult or impossible to solve because of incomplete, contradictory, and changing requirements that are often difficult to recognize. Moreover, because of complex interdependencies, the effort to solve one aspect of a wicked problem may reveal or create other problems. In practice, this often means that human efforts to resist and/or contain changes in natural systems places even greater pressure on both artificial and natural systems such that the effect of any one or both failing is even more catastrophic.
PART 2. NON - TECHNICAL SUMMARY
Figure 10. Examples of habitat types from the DMRD area. Salt water lagoon (top left), Medi-terranean thermophilous pine forest (top right), Mediterranean salt meadow (bottom left) and resourceexploitation,e.g.fishing(bottomright).
24
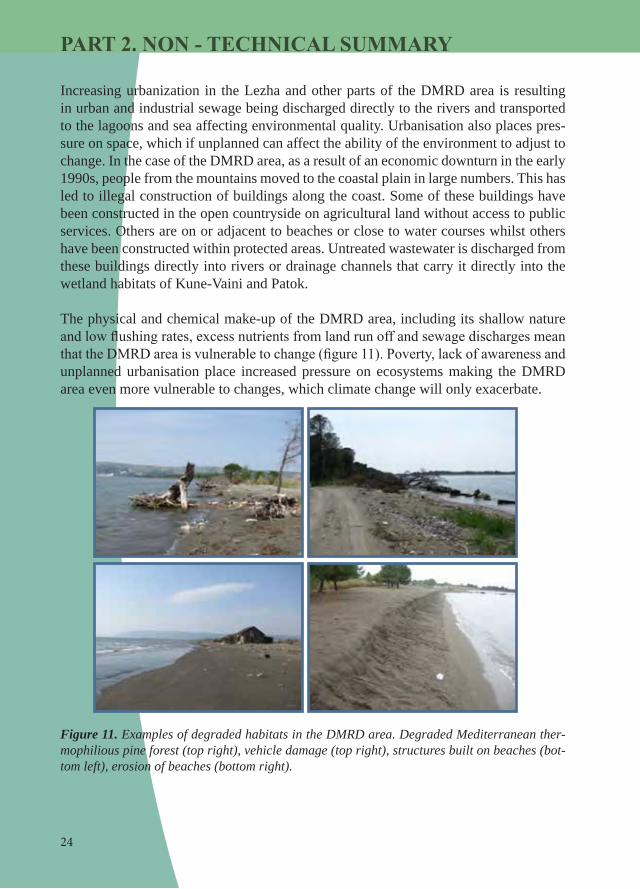
Increasing urbanization in the Lezha and other parts of the DMRD area is resulting in urban and industrial sewage being discharged directly to the rivers and transported to the lagoons and sea affecting environmental quality. Urbanisation also places pres-sure on space, which if unplanned can affect the ability of the environment to adjust to change. In the case of the DMRD area, as a result of an economic downturn in the early 1990s, people from the mountains moved to the coastal plain in large numbers. This has led to illegal construction of buildings along the coast. Some of these buildings have been constructed in the open countryside on agricultural land without access to public services. Others are on or adjacent to beaches or close to water courses whilst others have been constructed within protected areas. Untreated wastewater is discharged from these buildings directly into rivers or drainage channels that carry it directly into the wetland habitats of Kune-Vaini and Patok.
The physical and chemical make-up of the DMRD area, including its shallow nature and low flushing rates, excess nutrients from land run off and sewage discharges mean that the DMRD area is vulnerable to change (figure 11). Poverty, lack of awareness and unplanned urbanisation place increased pressure on ecosystems making the DMRD area even more vulnerable to changes, which climate change will only exacerbate.
Figure 11. Examples of degraded habitats in the DMRD area. Degraded Mediterranean ther-mophilious pine forest (top right), vehicle damage (top right), structures built on beaches (bot-tom left), erosion of beaches (bottom right).
PART 2. NON - TECHNICAL SUMMARY

25
The direct effect of warming on plants and ecosystems of the DMRD will be complex because changes in temperature impact virtually all-chemical and biological processes. Some of the effects of increased temperatures will be advantageous to specific plant species, stimulating growth rates and increasing their competitive ability within plant communities. In turn, changes in vegetation composition may have significant effects on the characteristics of whole communities.
The shallow nature of DMRD coastal lagoons means that water temperatures in la-goons will increase. Higher temperatures will reduce dissolved oxygen saturation levels and increase the risk of oxygen depletion leading to eutrophication that then damages habitat and shellfish nurseries, which can be potentially toxic to marine spe-cies and humans.
4.4 Agriculture
Agriculture continues to be one of the most important sectors of the national economy although its contribution has been decreasing year-on-year, from an estimated 22.8 % of GDP in 2005 to 20.5 % in 2006. Rural families continue to dominate the national economy, more than 50 % of the population live in rural areas and agriculture is the main working alternative of people living in these areas. The real mean increasing rate of agriculture production during the last five years has been estimated to be approxi-mately 3 % per year.
Plant growth and agricultural development is already constrained by a variety of different meteorological effects. As a direct consequence of predicted temperature in-creases the growing season will become longer. Changes driven by climate changes are not only negative (e.g. temperature induced decline of crop yields, flooding of fields, seed purification and increased levels of disease) but also positive effects will be seen on agricultural production with an estimated 3 % increasing rate of agricultural produc-tion per annum. However, the increase in agricultural production is below the national average due to outward migration of population, use of low level technologies, weak organisations leading to a relatively poorly developed agricultural and processing in-dustry. Part of the reason for this is that despite increasing productivity within the sec-tor the contribution of agriculture in the local economy is declining.
Climatic changes may be harmful to the environment, structures and plant species com-munity, as many natural processes between species are synchronized to help all kinds and interactive processes. This may lead to inhibition of cross pollination if flowers burst too early for insect pollinators to be able to transfer pollen between plants. For instance, the phenology of invertebrate pollinators and host plants could become asyn-chronous, with deleterious impacts to both pollinators and hosts.
PART 2. NON - TECHNICAL SUMMARY

26
Temperature rise brings the likelihood of an increase of alien invasive species in the DMRD area, as well as increasing the probability that “sleeper invasive species” may become invasive. New niches will become available as less tolerant species die that may become dominated by invasive species. Increasing disturbances due to extreme events could also have a detrimental effect on indigenous populations and create op-portunity for successful invasions by other species.
Decreases in precipitation can have important effects on the physical, ecological and biological characteristics of the DMRD lagoons through the alteration of freshwater in-puts and associated changes in salinity and dissolved oxygen concentrations. Decreases in soil moisture content, along with reduced rainfall, will potentially cause water stress to plants limiting leaf production and leaf surface area in order to reduce water loss. The functioning of stomata may also be altered to reduce water loss. Each response decreases the ability of the plant to carry out photosynthesis with clear implications on net primary productivity and carbon storage, and can ultimately lead to plant death. Additionally, increased temperatures and decreased water availability are likely to lead to an increase of fires with associated carbon release.
The risks presented by flooding and increased temperatures combined with decreased precipitation are seen as the underlying challenges for the agricultural sector to address.
The overall impacts of climate change on agriculture can be summarised as:• Reduced total yield potential, with extremely high temperatures causing more se-
vere losses;• Increased likelihood of both floods and droughts;• Variability of precipitation - in time, space, and intensity - will make agriculture in
the area increasingly unstable and make crop planning more difficult;• Higher temperatures and lower precipitation are likely to result in the spread of
plant pests and diseases; and• Increased crop pests may necessitate intensified use of agricultural chemicals that
carry long-term health, environmental, and economic risks.
The expected impact of climate change on agriculture will itself have an indirect impact on other sectors of the economy in the area. Tourism will most probably be one a highly affected sectors. The region has become a popular tourist destination as a result of some unique environmental features, for example Patok Lagoon. Since most of the food for tourist facilities comes from the region, and is based on organic farming, a change in the structure of crops and their yield will affect the tourism industry. The risks faced by the agriculture sector and possible adaptation responses are shown in figure 12. The adaptive responses can be characterised as:• Changes in farm management practices (e.g. planting earlier or breeding livestock
species that are more resistant to heat).
PART 2. NON - TECHNICAL SUMMARY

27
• Changes in crops used (e.g. species that are more resistant to drought).• Suitable technological measures (e.g. improvement in livestock, species or
varieties of agricultural crops, application of irrigation, soil, practices of fertilizer use, disease and pests management practices, etc.).
• More variability in precipitation
• Higher tem-peratures
• Reduction of water resources
• More frequency of the extreme events
Exposure of the Agriculture
Risk ID
• Crop failure• Crop yield
reduction• Lower quality crops• Lower yield in
livestock• More pets and
diseases• Erosion• Drought
• Improving water use efficency
• Improve irrigation infrastructure
• Improve crop varietis• Improve drainage
system• Soil moisture
conservation• Organic fertilizers • Improve livestock
management• Capacity building at
local level
Adaptation
Figure 12. Vulnerability of agriculture to climate change, the risk that comes to some of this exposure and adaptation measures against possible risks.
4.5 Tourism
The coastal area represents considerable potential for tourist activities due to its favourable geographic position (long beaches, Mediterranean climate, water resources, landscape). The tourism sector has grown considerably since 1990, but this has tak-en place without any strategic planning by the Council of Territory Adjustment. The Shëngjin-Kune-Tale zone represents one of the most important areas of the northern region of Albania for sun and sea tourism. It includes tourist complexes, a considerable number of hotels, motels, restaurants, trade and service centres etc. Roads to beaches have been expanded and/or asphalted. Although the development of tourism has repre-sented a huge economic opportunity to the DMRD area, it is based on a fragile resource base and is very vulnerable to change, for instance demand on energy supplies, fresh-water and waste treatment (figure 13).
PART 2. NON - TECHNICAL SUMMARY

28
Although tourism activity has been increasing, supporting infrastructure remains weak, and what there is has been put into place without any consideration of future needs and demands. Much of the development that has taken place has led to significant changes to natural systems – whilst some of this has been socially positive, for example drain-ing of swamps for building land that has reduced health risks, it has also significantly reduced the natural capacity of systems to adapt to change. Predicted effects of climate change suggest that the detrimental effect of sea level rise and its effects on coastal ero-sion and ecosystems will, without intervention, severely threaten recreation and tourist activities associated with coastal locations. Hotels, restaurants and other facilities will be faced with challenges affecting property, the viability of businesses and earnings, these include:• Loss of recreational value and carrying capacity;• Loss of land and property value from declining amenity value; and• Deterioration of landscape and visual appreciation.
However, climate change does also present some opportunities to the tourism sector. Increasing temperatures and sea water warming, although having negative impacts
Figure 13. Tourism in the DMRD area ranging from intense ‘sun and sea’ type facilities at Shëngjini (top left), beaches with seasonal facilities (top right), supporting facilities (e.g. res-taurants, bottom left). Without proper organisation and regulation environment quality suffers, not least through litter (bottom right).
PART 2. NON - TECHNICAL SUMMARY

29
on ecosystems, is attractive to holiday makers and locals alike. Increases in tourism numbers, however, cannot be supported in an area where infrastructure is not resilient (figure 14).
4.6 Other sectors
Agriculture and tourism, as the principle direct users of coastal space and resources, place pressure on the DMRD area, but they are not the only source of pressures (figure 14). Indirect pressures also arise from other sectors, e.g. service industries, and popula-tion patterns. Other sectors and activities can also lead to alteration of the natural land-scape and its resources as well as placing pressure on environmental quality through pollution.
4.7 Technical information
One of the difficulties for planning in a coastal zone, such as the DMRD area, is that changes, such as climate change, often take place at a pace that is difficult for society
Figure 14. ExamplesofactivitiesintheDMRDareathatcanleadtosignificantalterationsinthe environment – its quality and security of function. Building (large scale and individual plot (topphotos), infrastructure development (bottom left) and resource exploitation, e.g. fishing(bottom right).
PART 2. NON - TECHNICAL SUMMARY

30
to experience in their day-to-day lives, unless it an extreme event. The consequences of this is that society often perceive other matters to be of more immediate importance, and only recognise the risk and vulnerability they face when it is too late. Technical assessments and tools become critical to both future planning and reconciling percep-tions so that decision makers, the public and private sectors can appreciate the trends and consequences of change by bringing to the forefront today what can be expected in the future.
The project has carried out a range of technical studies to make an assessment of infor-mation that is going to be critical to making informed and “future-proof” planning for the DMRD area.
4.7.1 Geographic information systems
It is often difficult to visualise the patterns and spatial extent of an area and the changes that are taking place. GIS is a way of collating information from a wide va-riety of sources in order to ‘show’ what there is where things are and how things are changing. Examples, in framework of the project, include showing clearly the resource base through mapping of ecosystems using European Union Natura 2000 Habitats Di-rective codes. GIS has been used in the project to visualise current climatic trends and predict future impacts to show how the DMRD area is a region of vulnerability to cli-mate change and variability (variations), as well to produce climate change impact and adaptation maps (figure 15). Constructed maps show that these areas are vulnerable to suffer physical changes and the resources / services they offer.
4.7.2 Hydrology
Natural features of the coastline provide significant protection to the immediate hinter-land and the uses society make of the coastal space. Human activity is already altering the dynamics of the coastal system but climate change will exacerbate these alterations. The hydrology of the region plays a significant role in determining how natural sys-tems react to change. The hydrology within the vicinity of the DMRD, which will alter sediment and water movements in the rivers and along the coast, will be significantly affected by changes to precipitation and other climatic patterns. Understanding the pat-terns and pace of change and how these will change as a consequence of climate change is important. An assessment of current fluvial flows and past flooding events have been able to show how planning and development need to be made mindful of both historical changes and these might be altered by climate change.
PART 2. NON - TECHNICAL SUMMARY

31
Figure 15. An example of how GIS output can visually provide information useful for future planning decisions. 0.5m is the predicted scenario to 2100 with 1.0 m a high scenario. 2-3 m SLR are possible, but on much longer timeframes than 2100 – 1000s of years.
3 m sea level rise
1 m sea level rise
0.5 m sea level rise
2 m sea level rise
PART 2. NON - TECHNICAL SUMMARY

32
Current practices are either altering or placing stress on the existing hydrological re-gime of the DMRD area. Not all these issues originate from within the DMRD area, but can be caused by ‘up-stream’ activity. For instance, damming of rivers in upland areas can alter sediment supply to the coastal system. However, many issues do occur directly within the DMRD area and could, therefore, be managed from a more regional/local level. Examples are:• Deforestation leading to soil erosion that affects sediment budgets, agriculture and
ecosystem health;• Non controlled extractive activities in river basins and coastal sand dunes that alter
sediment budgets, aquifers and flooding;• Excessive pumping of groundwater that may increase subsidence (making land
more prone to flooding), soil quality (affecting agriculture), freshwater provision; and
• River diversion which has resulted in a much reduced flood drainage capability.
Such changes, coupled with rising sea levels will threaten coastal aquifers. Many of the coastal aquifers are already experiencing salinity ingress. The precarious balance between freshwater aquifers and sea water will come under growing stress as sea levels rise and hydrological regimes alter. Coastal aquifers are thus likely to face seri-ous threats from climate change induced sea level rise.
Changes in seasonal patterns of precipitation and runoff may alter hydrological and chemical characteristics of coastal lagoons and rivers in the DMRD area that may, in turn, affectg species composition and ecosystem productivity. Climate change will increase the frequency of intense precipitation events that is likely to alter ecosystems of the DMRD area.
Increases in drought intensity will particularly increase the frequency of forest fires, invasive species, coastal hyper-salinity resulting in the decline of valuable habitats through changes of habitat composition and plant communities. Increased drought stress may also lead to an increased frequency and magnitude of pest and disease out-breaks.
Decreased freshwater delivery will alter the food webs in deltas of the Mati, Dri-ni and Ishmi Rivers and lead to changes in the residence time of nutrients and contaminants. Reduced nutrient input during drought can be a major cause of the loss of productivity of these rivers during and after drought periods. A slight increase in the frequency and intensity of storms will make them even more destructive, which is likely to make coastal processes of the DMRD area more dynamic.
PART 2. NON - TECHNICAL SUMMARY

33
4.7.3 Monitoring climate change
Economic activities, particularly irrigated agriculture, urban and industrial develop-ment, as well as marine based activities such as ports and tourism, individually and collectively place pressure of the coastal environment. In order to determine the conse-quences of development and how these may be altered by climate change it is important to have a robust monitoring programme. Although monitoring efforts are in place there is still no systematic organisation and coordination of monitoring activities. Whilst cur-rent monitoring does not focus on climate change, it will be imperative this is included in future monitoring. Work by the project has designed an integrated monitoring sys-tem (IMS) for the DMRD area to help (i) understand ecosystem responses to climate change, and (ii) determine the effectiveness of adaptation measures. It is apparent that no one institution is able to do carry out all the necessary monitoring.
4.7.4 Ecosystem restoration
Another feature of adaptation is to try and reverse alterations and restore an environ-ment back to a state where it is able to provide the security and opportunity that have been lost. This is clearly an attractive proposition for the DMRD area as naturally func-tioning ecosystems could provide both the most effective defences against sea level rise and flooding and an environment attractive for the principle sector activities of tourism and agriculture. However, this would require significant reversal of changes already imposed on the natural system by human attempts to manage the environment (figure 16).
Some of the areas likely to experience the most significant effects of climate change are wetland and dune systems. Significant deterioration of these systems will have considerable implications concerning the security and sustainability for human habita-tion and activity in the DMRD area. Effects seen from climate change will increase the need for adaptation and mitigation – implying some restoration methods will need to be considered.
The DMRD is prioritised as an ecosystem where climate adaptation response measures could be implemented. This could have a positive effect alleviating pressures placed on the environment. Potential impacts, such as coastal flooding and sediment transloca-tion, arising from a change in climate will have effects on water exchange patterns and coastal erosion leading to subsequent secondary effects of habitat loss The longer adap-tation responses are delayed the greater the impacts will become making environmental restoration more and more difficult.
PART 2. NON - TECHNICAL SUMMARY

34
Figure 16. Examples of human management and mismanagement in the DMRD area. Embank-ments (red lines, top left), shoreline alterations (top right, bottom left), rubbish (middle right), pumping station (bottom right).
4.7.5 The economics of climate change and adaptation
Ultimately, changes in opportunity that arise from climate change – whether those changes are positive or negative – will impact the economics of the DMRD area. By addressing the current economic issues within the DMRD, implications of climate change in the future can be predicted. The project has studied which economic tools are the most appropriate for assessing the impacts of climate change. Figure 17 illustrates the costs of climate impacts over time, for no adaptation (dashed line), with adaptation
PART 2. NON - TECHNICAL SUMMARY

35
(solid line), and the baseline scenario of impacts with no climate change (dotted line). The baseline is increasing because the value of production and assets is assumed to increase over time. The difference between the solid and dashed lines represents the benefits of adaptation, while the difference between the dotted and solid lines repre-sents residual impacts which will not be able to be adapted to. Residual impacts will vary both over time and in different places. Although there is much uncertainty around predictions, the one thing in common is that they are on an upward trend.
From data collected across the project, the key quantifiable impacts that will arise from climate change appear to be:• Numbers of people impacted by flooding events;• Loss of wetland area;• Coastal agricultural area;• Coastal forest area;• Fisheries; and• Coastal recreational opportunities.
These impacts can be valued using both market and non-market valuation data. The outputs from this work quantifies the ‘value at risk’ in the absence of adaptation and therefore provides a basis for understanding the potential benefits from a programme of targeted adaptation measures (table 3).
The estimated range of Euro 15.4-16.8 million can alert society to the ‘value’ of assets at risk and provide a benchmark against which costs and benefits of different options can be evaluated such that the ultimate costs of adaptation choices can be judged rela-
Figure 17.Costsandbenefitsofadaptation.
PART 2. NON - TECHNICAL SUMMARY
Cost£
Time
Unregulatedimpacts
Benefit ofadaptation
Futureimpacts lessadaptation
Basilenescenarios offlooding costs
Residual impacts

36
Value category Estimated NPV (million Euro)Wetland loss WTP 0.77 Flood damages 2.8 – 3.1 Agricultural land loss 0.3 - 1.5Forest carbon 0.00015Coastal beach recreation 2.5 Fishery loss 9Total 15.4 – 16.8
Table 3. Summary of value estimates
tive to the benefit.
Put into the context of the DMRD area as a whole, or by considering the different sub-areas of the region, what the values presented in table 3 lead to is a conclusion that the likely costs of measures designed to conserve the wetland and coastal biodiversity, and safeguarding community assets, is less than the benefits that these systems and assets currently provide, i.e. the cost of measures to adapt to climate change are less than cost of doing nothing and allowing them to degrade.
PART 2. NON - TECHNICAL SUMMARY

37
Part 3 is designed to provide a concise synthesis of the technical information that has been assimilated by the project. The text can be used by those who have technical un-derstanding of climate change issues from the perspective of one subject area and need to develop a broader perspective from other subject areas.
The text provides a detailed outline of each of the studies carried out, the conclusions that emerge from the results and their relevance in the context of the other technical studies and the DMRD project as a whole. Firstly, the focus is on the past and present climate and how these may change in an era of climate change. Secondly the climate change projections have been interpreted by Sector specific experts to explore pro-jected impacts of climate change.
5. CLIMATE CHANGES EXPECTED IN THE DMRD AREA
5.1 Current status and trends
In order to determine the expected impacts of climate change on ecosystems, water re-sources, agriculture, tourism and population it is important to characterise the existing climate of the area. For the DMRD area the current climate is characterised as:
5.1.1 Solar radiation
Solar radiation over the DMRD area averages 1490 kWh m-2 yr-2 with an annual aver-age of 2580 sunshine hours (figure 18). For the study area, the maximum value of solar radiation is 213.9 kwh m-2 in July, while the minimum value of 49.8 kwh m-2 is recorded in December.
PART 3. TECHNICAL SUMMARY
0
50
100
150
200
250
300
350
400
0
50
100
150
200
250
I II III IV V VI VII VIII IX X XI XII
Figure 18. Annual course of solar radiation (kWh m-2) and sun duration (hours).
radiation sunshinet
kWh/
m2
hour
/mon
th
month

38
5.1.2 Air temperatures
Annual mean temperature is approximately 15 °C. The warmer months of the year are July and August (mean temperature 23.6 °C), while the coldest is January (mean tem-perature 6.2 °C) (figure 19). The difference between warm and cold months (17.4 °C) is relatively small compared to inland zones because of the influence of the Adriatic Sea.
Compared to the 1961-1990 average, recent years are exhibiting an upward trend in seasonal temperatures after a period of relatively lower temperatures (figure 20). There has been an increasing trend (+1.5°C yr-1) since the year 2000. This is a consequence of an increase in both maximum and minimum daily temperatures, especially in summer time because of a decrease of diurnal temperatures in summer.
PART 3. TECHNICAL SUMMARY
0
5
10
15
20
25
30
35
I II III IV V VI VII VIII IX X XI XII
Figure 19. Annual course of average, mean maximum, mean and minimum temperatures.
MonthTem
pera
ture
°C
mean temp. mean.max.temp. mean.min.temp
-1,5
-1,0
-0,5
0,0
0,5
1,0
1,5
2,0
1951
1955
1959
1963
1967
1971
1975
1979
1983
1987
1991
1995
1999
2003
2007
Figure 20. Long term anomaly and trend of mean temperature.
Years
Tem
p. d
evia
tion
°C
annual anomaly Poly. (annual anomaly)

39
There has been an increase in the number of days per annum with maximum tempera-tures in excess of 35oC, and in the current decade this is up to 4 times higher than in previous decades. There is a close relationship between the absolute maximum tem-perature and the number of days with temperature higher than 35°C.
Heat waves are characterised by six consecutive days where air temperatures are at least 5°C higher than the long-term average temperature. The occurrence of this phe-nomenon is usually accompanied with negative impacts to agriculture, health, etc. Fig-ure 21 shows that up to the year 2001, except in two cases (1961 and 1968), no heat waves were reported. However, after the year 2002 this phenomenon starts to become more persistent with 26 heat wave days registered in the year 2003. In addition, the number of days per year with temperatures less than 5oC is also increasing suggesting that the temperature range experienced in the DMRD area is increasing.
5.1.3 Precipitation
The annual precipitation registered over the study area reaches up to 1360 mm yr-1. About 66 % of the total is recorded during the cold months (October - March). The wet-test month is November (average 187.6 mm), followed by December and January with averages of 157.3 mm and 154.5 mm respectively. The driest month is July with 35.8 mm, followed by August 58.3 mm. The annual course of precipitation anomaly (figure 22) shows the variation around the 1961 – 1990 average and shows an increasing posi-tive trend in the last decade.
PART 3. TECHNICAL SUMMARY
0
5
10
15
20
25
30
1961 1965 1969 1973 1977 1981 1985 1989 1993 1997 2001 2005
Figure 21. Number of days with heat waves. (Lezhë)
Years
Nr.
of d
ays

40
Although not all flooding can be attributed to heavy rain, the most important parameter related to rainfall intensity is the maximum amount of precipitation during a 24 hour period (24h max). The long-term course of daily maximum of precipitation is given in figure 23 and shows no clear trend.
The average intensity of precipitation expresses the ratio of annual mean precipitation with the number of rainy days >1 mm. This is a general integral parameter that express-es the level of precipitation intensity that is used as a useful indicator for agriculture and shows that there is no clear trend (figure 24).
PART 3. TECHNICAL SUMMARY
-60-50-40-30-20-10
01020304050
1951 1956 1961 1966 1971 1976 1981 1986 1991 1997 2002 2007
Figure 22. Annual anomaly and trend in precipitation.
anomaly (%) Poly. (anomaly %)
Ano
mal
y (%
)
Years
0
50
100
150
200
250
57 62 67 72 77 82 87 92 97 2002 2007
Figure 23. Long term distribution of 24 hr of max precipitation
24 h
max
pre
cip.
(mm
)
Years

41
5.2 Predicted changes
The study developed climate scenarios using MAGICC4, which consists of a suite of coupled gas-cycle, climate and ice-melt models integrated into a single software package. The results of MAGICC are used by SCENGEN5 to construct a range of geographically explicit climate change projections for the area of interest.
To develop the climate change scenarios (temperature, precipitation and mean sea-level pressure), the global model MAGICC is run over Europe, followed by the downscaling for the Lezha area. Scenarios from different SRES families (A1BAIM, A2ASF, B1IMA, B2MES, A1T-MES, A1FI-MI6) are used (ar47 of IPCC).
5.2.1 Temperature projections
The likely changes (averages) in annual temperature for different scenarios and time horizons reveal a likely increase in seasonal and annual temperatures related to 1990 for all time horizons. The annual temperature is likely to increase up to 1.8 °C (1.3 - 2.4°C) by 2050; 2.8 °C (2.1 - 4.1°C) by 2080 and 3.2 °C (2.3 - 5.0 °C) by 2100 (table 4, figure 25).
PART 3. TECHNICAL SUMMARY
8
10
12
14
16
18
20
1961 1966 1971 1976 1981 1986 1991 1996 2001 2006
Figure 24. The long term distribution of average intensity of precipitation.
Years
Inte
nsity
(mm
/day
s)
4 MAGICC: Model for the Assessment of Greenhouse-gas Induced Climate Change.5 SCENGEN: A Regional Climate Scenario Generator.6 For more information, please see the “Climate Change Scenarios”report (http:// www.ccalb.org)7 SRES: Special Report on Emissions Scenarios

42
Table 4. The likely changes in annual temperature (°C).
Years 2030 2050 2080 2100A1BAIM (aver) 1.2 1.8 2.8 3.2A1FIMI (max) 1.3 2.4 4.1 5.0A2ASF (min) 0.8 1.3 2.1 2.3
The scenarios project the lowest increase in temperature for winter compared to other seasons with higher increases in absolute values likely for spring temperatures related to 1990 for the same scenarios - increases up to 1.6 °C (1.3 - 2.2 °C) by 2050; 2.5 °C (1.7 - 3.6 °C) by 2080 and 3.0 °C (1.9 - 4.4 °C) by 2100 (figure 25). Increasing spring temperatures will accelerate soil temperature warming after the winter period and ex-tend zones suitable for summer crops as well as lengthening their growth season.
Summer projections indicate increases in annual temperature up to 2.7 °C (2.4 - 3.6°C) by 2050; 4.3 °C (3.1 - 6.3°C) by 2080 and 5.1 °C (3.4 - 7.7 °C) by 2100 (figure 25). Such a situation is likely to result in increases to the frequency and/or intensity of ex-treme weather events. It is known that the relationship between averages and extremes is often non-linear. For example, a shift in average temperature is likely to be associated with much more significant changes in very hot days. The disproportionate increase in the frequency of extreme events is not limited to the frequency of very hot days but could occur with many other climate extremes that could have significant consequences on all socio-economic systems.
The average autumn temperature is likely to increase up to 1.8 °C (1.5 - 2.3 °C) by 2050; 2.9 °C (2.2 - 4.1 °C) by 2080 and 3.5 °C (2.4 - 5.0 °C) by 2100 (figure 25).
The expected changes in surface air temperatures will lead to changes in air humidity. This combination is likely to influence the increases in the heat index (which is a mea-sure of the combined effects of temperature and moisture). Recent investigations show that increasing temperatures will be followed by an increase in the probabilities of extreme events and a higher intra-annual variability of minimum temperatures (IPCC, 1997). More frequent and severe droughts with a consequent greater fire risk are likely. An increase in daily minimum temperatures means that frost days and cold waves are very likely to become fewer.
PART 3. TECHNICAL SUMMARY

43
0,0
1,0
2,0
3,0
4,0
5,0
6,019
90
2000
2010
2020
2030
2040
2050
2060
2070
2080
2090
2100
0,0
1,0
2,0
3,0
4,0
5,0
1990
2000
2010
2020
2030
2040
2050
2060
2070
2080
2090
2100
0,0
1,0
2,0
3,0
4,0
5,0
1990
2000
2010
2020
2030
2040
2050
2060
2070
2080
2090
2100
0,01,02,03,04,05,06,07,08,09,0
1990
2000
2010
2020
2030
2040
2050
2060
2070
2080
2090
2100
Figure 25. Annual temperature projections related to 1990, DMRD area. From top left, average, winter, spring and summer (bottom right).
5.2.2 Projections for precipitation
The precipitation total during winter, related to 1990, is likely to decrease an average of -8.0% (-4.3 to -12.4%) by 2050; 11.9% (-5.7 to -23.7%) by 2080 and 13.7% (- 4.7 to -29.4%) by 2100; during spring this is likely to decrease up to 6.9% (-5.9 to - 8.1%°C) by 2050; 12.3% (-9.0 to -17.7%°C) by 2080 and 15.0% (-10.1 to - 22.2%°C) by 2100 (table 5 and figure 26).
Table 5. Projections of annual precipitation changes (%) related to 1990.
Years 2030 2050 2080 2100A1BAIM (aver) -3.9 -8.1 -12.9 -15.5A2ASF (min) -2.6 -5.5 -8.4 -9.0A1FIMI (max) -5.4 -11.0 -21.0 -26.1
The highest decrease in average precipitation is likely during summer, up to -24.6%
PART 3. TECHNICAL SUMMARY
Annual
Tem
pera
re c
hang
e °C
aver. min.max.
aver. min.max.
aver. min.max.
aver. min.max.
Year
Tem
pera
re c
hang
e °C
Year
Tem
pera
re c
hang
e °C
Year
Tem
pera
re c
hang
e °C
Year
December/January/February
March/April/May June/July/August

44
(-16.5 to -33.9%) by 2050; -45.7% (-36.0 to -58.8%) by 2080 and -54.8% (-44.2 to -71.8%°C) by 2100 (Figure 26).
The high decrease in precipitation, combined with the high increase in temperature, might lead to prolonged summer droughts over the area. The demand for water could increase, especially in summer. Decrease in total precipitation combined with higher evaporative demand would probably result in less river flow (run-off). Water resources are likely to be further stressed due to a projected growth in demand and climate-driven changes in supply for irrigation, cities, industry and environmental flows. The increased temperatures expected in summer could lead to higher local precipitation extremes and associated flood risks in project area.
5.2.3 Projections of mean sea level pressure
By analysing these data it is quite evident that all scenarios project an increasing MLSP trend over future years and for individual seasons, with exception of summer. Because of this decreasing tendency during summer the occurrence of the cyclonic circulation is expected to increase (table 6 and figure 27). As a consequence the number of convec-tive stormy days will be higher.
Table 6. Projection of changes in annual MSLP (hPa).
2030 2050 2080 2100aver 0.26 0.42 0.64 0.74max 0.28 0.54 0.95 1.18min 0.22 0.33 0.43 0.44
PART 3. TECHNICAL SUMMARY
-30,0
-25,0
-20,0
-15,0
-10,0
-5,0
0,019
90
2000
2010
2020
2030
2040
2050
2060
2070
2080
2090
2100
A2ASF
A1BAIM
B1IMA
B2MES
A1TMES
A1FIMI
Figure 26. Projections of annual precipitation (%).
Prec
ipita
tion
chan
ge (%
)
Years

45
5.2.4 Sea level projections
Global model projections indicate that open coasts and estuaries will experience rising sea levels over the next century. In the next several decades, warming produced by cli-mate model simulations indicates that the rate of sea level rise could accelerate.
The exact global rate of sea level change to occur in the future is not known and is likely to vary from location to location. However, as the earth’s average temperature increases, a scientific consensus has gradually emerged that there is a serious risk that the rate of sea level rise will accelerate during the 21st century. Sea level is not only altered by climate change but also other factors such as tectonic forces that alter land levels relative to sea level. The DMRD area is prone to subsidence that could exacer-bate and intensify the impact of sea level rise from climate change. In the next several decades, warming produced by climate model simulations indicates that sea level rise will accelerate (figure 28).
As a consequence of these projections an increase in losses of wetland (approx. 1 km2 by 2100) is predicted further reducing the total wetland in the DMRD area. The projec-tions also indicate that there will be increases in coastal floodplain area and population (respectively around 66 km2 and 4.6 thousands by 2100). Coastal forest area and low un-vegetated wetlands area are also likely to decrease.
PART 3. TECHNICAL SUMMARY
Figure 27. The likely changes in annual MSLP (hPa).
0
0,2
0,4
0,6
0,8
1
1,2
1,4
1990 2010 2030 2050 2070 2090
A2ASF
A1BAIM
B1IMA
B2MES
A1TMES
A1FIMI
Pres
ure
chan
ge (h
Pa)
Years

46
5.3 Expected effects of climate change
Due to the expected changes in temperature, precipitation, mean sea level pressure and sea level the following effects to climate indicators are expected.
5.3.1 Effects of expected changes in temperature
Increasing temperatures will be followed by an increased probability of extreme events and a higher intra-annual variability of minimum temperatures. More frequent and se-vere droughts with greater fire risk are likely. A reduced temperature range, resulting from a higher rate of increase in minimum versus maximum temperatures, is likely to occur over nearly all land areas. Frost days and cold waves are very likely to become fewer.
The number of days with temperatures in excess of 35°C will become more frequent and is expected to increase by about 10 days by 2100 compared to present. As a conse-quence of this, the number of heat wave days are expected to increase too with about 80, 95, and 120 days with a heat wave likely to be registered by the years 2050, 2080 and 2100 respectively. Cold wave days are also expected to increase to approximately 10 days by 2030, 7 days by 2050 and 5 days for 2080. Warmer winters would reduce “heating degree days” and the demand for heating energy.
Increases in air temperature are also projected to lead to an increase in “cooling degree days” (which is a measure of the amount of cooling required on any given day once the temperature exceeds a threshold of 17.5°C). Taking into account the projections for summer temperature, the number of cooling degree days may reach about 550,
PART 3. TECHNICAL SUMMARY
0
10
20
30
40
50
60
1990
2000
2010
2020
2030
2040
2050
2060
2070
2080
2090
2100
A1BAIM A1FIMI B1IMA A2ASF A1TMES B2MES
Figure 28. Likely changes in annual mean sea level (cm) for diferent scenarios.
Sea
leve
l cha
nge
(cm
)
Years

47
670, 840 and 930 by the years 2030, 2050, 2080 and 2010 respectively. Warming and population growth will increase annual heat-related deaths in those aged over 65 and contribute to the spread of vector-borne, water-borne and food-borne diseases. Warmer average and extreme temperatures will enhance the demand for freshwater and water for irrigation purposes, especially for soils with low water-storage capacities. If pre-cipitation declines, the project area would face substantially increased risks of summer water shortages.
5.3.2 Effects of expected changes in mean sea level pressure
This decreasing tendency in MSPL during summer (figure 29) may lead to an increase in occurrence of cyclonic circulation, with a higher number of convective storm days as a consequence. The decrease of pressure during summer leads to an increase of number of storms.
-1,6
-1,4
-1,2
-1,0
-0,8
-0,6
-0,4
-0,2
0,0
1990 2010 2030 2050 2070 2090
5.3.3 Effect of hazardous precipitation
An increase of the number of rainy days with hazardous rainfalls is expected to increase by approximately 4 - 5 days by 2100 time horizons. The occurrence of severe, moder-ate and dry drought is expected to increase by 2100. An increase of SPI3, (cases of moderate, severe and extremely dry weather) to approximately 18 cases by 2030, and 20, 22 and 24 cases by 2050, 2080 and 2100 respectively is expected. Increasing spring temperatures will accelerate soil temperature increases from winter minima and extend suitable zones for summer crops and lengthening of their growth season. The length of the growing season is projected to increase from 263 days in 1990 to potentially 289 days in 2100 (26 days longer).
5.3.4 Effect of climate change on tourism climate index
All the indicators of maximum temperature, Tmax ≥ 35°C have an impact on the day-
Figure 29.
The likely changes in summer MSLP (hPa).
PART 3. TECHNICAL SUMMARY
Pres
ure
chan
ge (h
Pa)
Years
aver. min.max.

48
time comfort for the tourism. Tourism Climate Index (TCI) is used to explore the im-pacts of climate change on climate resources for tourism in Lezha. Based on the results of climate change scenarios proposed for the time horizon up to 2100, the TCI index indicates that good tourist conditions will lengthen and change from ideal to excellent. The tourist comfort index (TCI) reveals the value ‘good’ in October, ‘excellent’ in May, June and September and ‘ideal’ in July and August (figure 30).
5.4 Summary of effects
Table 7 shows a summary of the principle impacts of sea level rise and flooding as the primary consequences of climate change, on the Lezha area.
PARAMETERS UNIT 2050 2100av. Min av. Max av. Min av. Max
Net loss of wetland area km2 0.14 0.58 0.41 1.04People actually flooded thousands/
year 0.019 0.040 0.006 0.007
Coastal floodplain area km2 56.14 59.20 57.19 65.95Coastal floodplain popula-tion
thousands 4.14 4.33 3.99 4.61
Total wetland area km2 4.5 4.06 4.22 3.60Coastal forest area km2 1.14 1.01 1.12 0.91Low unvegetated wetlands area
km23.37 3.05 3.10 2.69
Table 7. ImpactsofsealevelriseandfloodingontheLezhaarea.
PART 3. TECHNICAL SUMMARY
0102030405060708090
100
I II III IV V VI VII VIII IX X XI XII
TCI 61-90
TCI 2030
TCI 2050
TCI 2080
TCI 2100
Figure 30. TCI of current situation and the TCI- indexes projected up to 2100 time horizon. Lezha
TC
I
Month
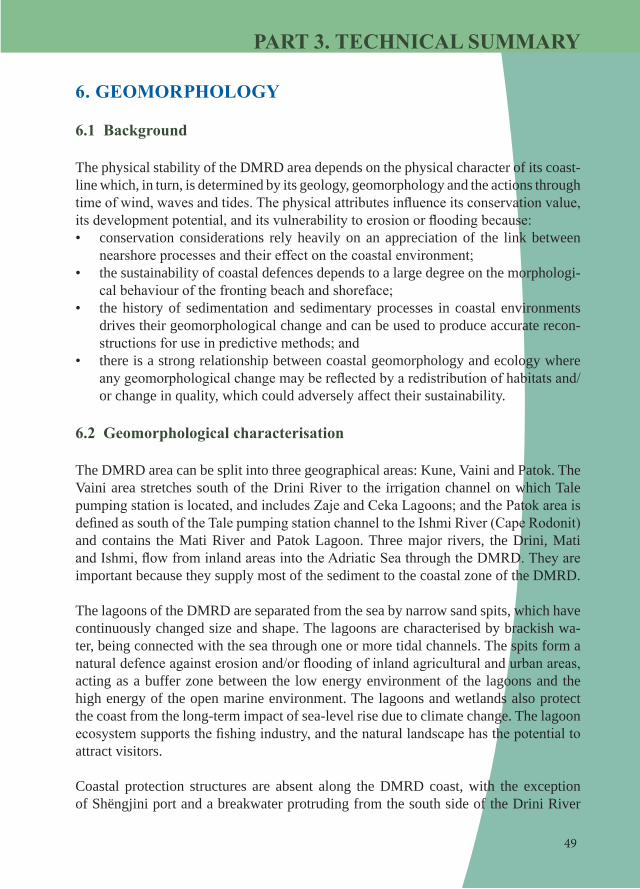
49
6. GEOMORPHOLOGY
6.1 Background
The physical stability of the DMRD area depends on the physical character of its coast-line which, in turn, is determined by its geology, geomorphology and the actions through time of wind, waves and tides. The physical attributes influence its conservation value, its development potential, and its vulnerability to erosion or flooding because:• conservation considerations rely heavily on an appreciation of the link between
nearshore processes and their effect on the coastal environment;• the sustainability of coastal defences depends to a large degree on the morphologi-
cal behaviour of the fronting beach and shoreface;• the history of sedimentation and sedimentary processes in coastal environments
drives their geomorphological change and can be used to produce accurate recon-structions for use in predictive methods; and
• there is a strong relationship between coastal geomorphology and ecology where any geomorphological change may be reflected by a redistribution of habitats and/or change in quality, which could adversely affect their sustainability.
6.2 Geomorphological characterisation
The DMRD area can be split into three geographical areas: Kune, Vaini and Patok. The Vaini area stretches south of the Drini River to the irrigation channel on which Tale pumping station is located, and includes Zaje and Ceka Lagoons; and the Patok area is defined as south of the Tale pumping station channel to the Ishmi River (Cape Rodonit) and contains the Mati River and Patok Lagoon. Three major rivers, the Drini, Mati and Ishmi, flow from inland areas into the Adriatic Sea through the DMRD. They are important because they supply most of the sediment to the coastal zone of the DMRD.
The lagoons of the DMRD are separated from the sea by narrow sand spits, which have continuously changed size and shape. The lagoons are characterised by brackish wa-ter, being connected with the sea through one or more tidal channels. The spits form a natural defence against erosion and/or flooding of inland agricultural and urban areas, acting as a buffer zone between the low energy environment of the lagoons and the high energy of the open marine environment. The lagoons and wetlands also protect the coast from the long-term impact of sea-level rise due to climate change. The lagoon ecosystem supports the fishing industry, and the natural landscape has the potential to attract visitors.
Coastal protection structures are absent along the DMRD coast, with the exception of Shëngjini port and a breakwater protruding from the south side of the Drini River
PART 3. TECHNICAL SUMMARY
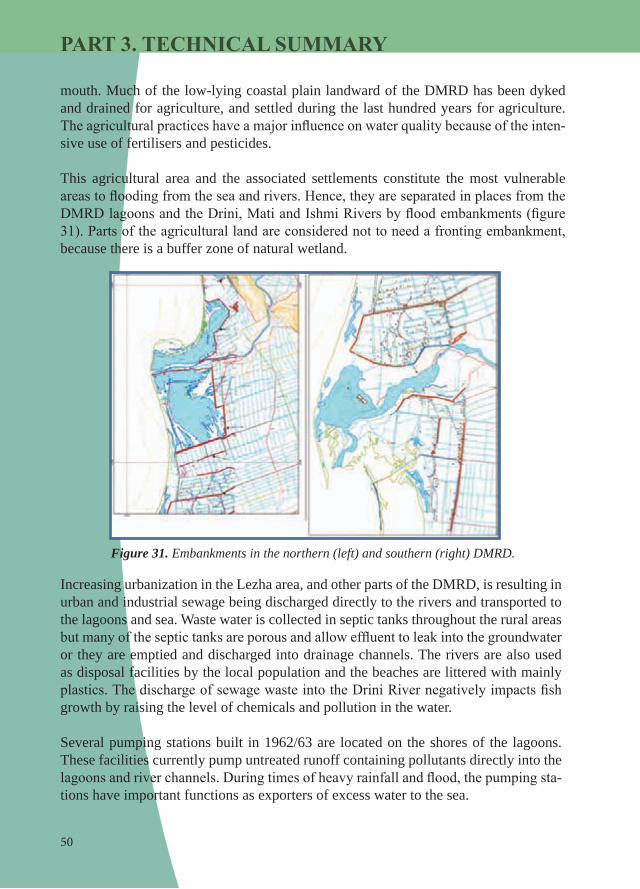
50
mouth. Much of the low-lying coastal plain landward of the DMRD has been dyked and drained for agriculture, and settled during the last hundred years for agriculture. The agricultural practices have a major influence on water quality because of the inten-sive use of fertilisers and pesticides.
This agricultural area and the associated settlements constitute the most vulnerable areas to flooding from the sea and rivers. Hence, they are separated in places from the DMRD lagoons and the Drini, Mati and Ishmi Rivers by flood embankments (figure 31). Parts of the agricultural land are considered not to need a fronting embankment, because there is a buffer zone of natural wetland.
Figure 31. Embankments in the northern (left) and southern (right) DMRD.
Increasing urbanization in the Lezha area, and other parts of the DMRD, is resulting in urban and industrial sewage being discharged directly to the rivers and transported to the lagoons and sea. Waste water is collected in septic tanks throughout the rural areas but many of the septic tanks are porous and allow effluent to leak into the groundwater or they are emptied and discharged into drainage channels. The rivers are also used as disposal facilities by the local population and the beaches are littered with mainly plastics. The discharge of sewage waste into the Drini River negatively impacts fish growth by raising the level of chemicals and pollution in the water.
Several pumping stations built in 1962/63 are located on the shores of the lagoons. These facilities currently pump untreated runoff containing pollutants directly into the lagoons and river channels. During times of heavy rainfall and flood, the pumping sta-tions have important functions as exporters of excess water to the sea.
PART 3. TECHNICAL SUMMARY
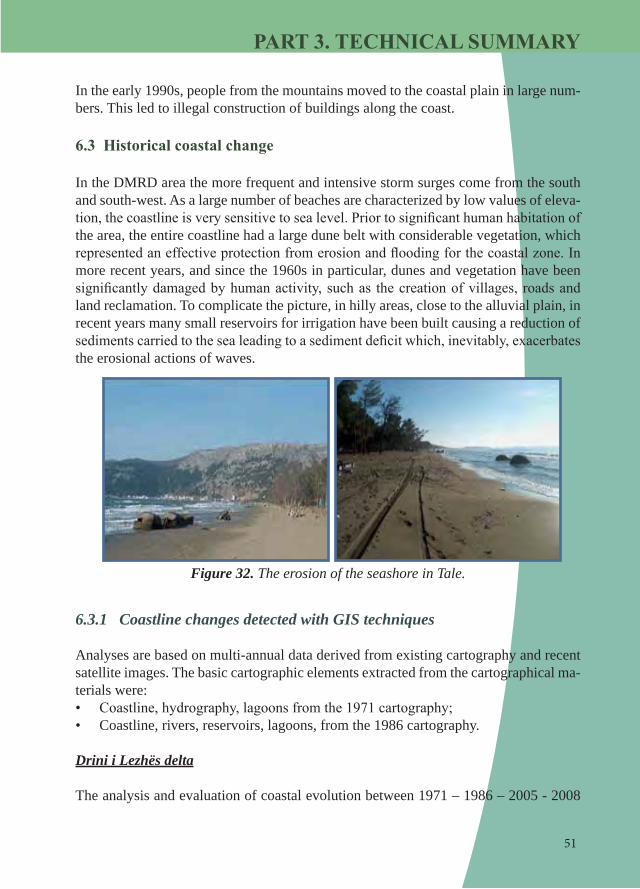
51
In the early 1990s, people from the mountains moved to the coastal plain in large num-bers. This led to illegal construction of buildings along the coast.
6.3 Historical coastal change
In the DMRD area the more frequent and intensive storm surges come from the south and south-west. As a large number of beaches are characterized by low values of eleva-tion, the coastline is very sensitive to sea level. Prior to significant human habitation of the area, the entire coastline had a large dune belt with considerable vegetation, which represented an effective protection from erosion and flooding for the coastal zone. In more recent years, and since the 1960s in particular, dunes and vegetation have been significantly damaged by human activity, such as the creation of villages, roads and land reclamation. To complicate the picture, in hilly areas, close to the alluvial plain, in recent years many small reservoirs for irrigation have been built causing a reduction of sediments carried to the sea leading to a sediment deficit which, inevitably, exacerbates the erosional actions of waves.
Figure 32. The erosion of the seashore in Tale.
6.3.1 Coastline changes detected with GIS techniques
Analyses are based on multi-annual data derived from existing cartography and recent satellite images. The basic cartographic elements extracted from the cartographical ma-terials were:• Coastline, hydrography, lagoons from the 1971 cartography;• Coastline, rivers, reservoirs, lagoons, from the 1986 cartography.
Drini i Lezhës delta
The analysis and evaluation of coastal evolution between 1971 – 1986 – 2005 - 2008
PART 3. TECHNICAL SUMMARY

52
were made by comparing the position of the coastline in different periods. This repre-sentation allows the location of all changes which occurred in the DMRD area. The analysis shows that from the period 1971 to 2005 the coast line of the Drini i Lezhës river delta had the highest intensity of erosion at 500 metres. In the period 1971 - 1986 this erosion was around 300 m and from 1986 - 2005 there was an additional 200 m. The total erosion from the period 1971 - 1986 is 57 ha and from 1986 - 2005 43 ha. From the period 1971 to 2005 the river mouth area lost 100 ha. In the northern part of the delta, for the same time period, new land has formed between 1971 and 2005. In to-tal there are 33 ha of new land created as a result of sedimentation processes (figure 32).
The Drini Bay is characterised by strong winds from the sea to the land that lead to sea surges raising the maximum level of the water 1 metre above average. In 1976 a strong storm damaged almost all the beaches along the Adriatic Sea. The same phenomena occurred in January 2010 along the coast of Shengjini Island-Kune and in Tale near the pumping station. In recent years, erosion to the north of Kune e Madhe has led to loss of pine trees and damage to the roadway (figure 33). The picture here testifies the intensity of the erosion phenomena showing the bunkers, once far from the seashore more than ten meters in the mainland and nowadays in the sea. The main factor of this phenomenon is the drastic reduction of the sediment transport from the Drini i Lezhës for the interruption of the connection of this river with the Drini River.
An exception is a 2 km stretch of coastline in the northern part of Kune coast that is characterized by processes of intensive sedimentation. Monitoring, illustrated by means of photographic images of the last 10–15 years, suggests the intensity of processes of erosion and sedimentation has increased not only for natural reasons but also as a con-sequence of impacts from human interventions. The dynamics of sediment transport in recent years has determined a wide progress of the seashore line in the south part of the mole, augmenting the surface of the littoral with about 10000 m2 of material.
Figure 33. Drini i Lezhës River. Coastline changes and sea erosion for the period 1971 – 1986 – 2005 (left to right).
(red - erosion, green - sedimentation)
PART 3. TECHNICAL SUMMARY

53
Mati delta
The Mati outlet has drastically changed in recent years where the mouth has moved towards the south. In the framework of all these processes, there is the formation of a big sandbar in front of the Patoku Lagoon and the creation of a new 300 ha lagoon (figure 34).
The Mati River mouth and the adjacent seashores are eroding. In this case the main factor for this erosion is altered hydrology in the surrounding area resulting from dams, drainage and mining from the riverbed. In the southern part of the river mouth a large collector channel has formed and water from the drainage channels is now discharged to the sea. These human interventions have led to an enlargement of the Patoku Lagoon.
Figure 34. The shift of the Mati River mouth and the lagoons in both sides of Mati River(red - erosion, green - sedimentation)
PART 3. TECHNICAL SUMMARY
6.4 Key of future coastal evolution
The key factor causing coastal erosion along the Kune and northern Vaini-Patok littoral the DMRD can be divided based on the concept of littoral cells and sub-cells (figure 35). The boundaries of a littoral cell are typically headlands or sinks such that transport of sediment into the cell from the adjacent compartments is restricted. Sediment enters a cell from rivers draining the coastal watersheds (the Drini, Mati and Ishmi Rivers in the DMRD) and is then transported alongshore and cross-shore within the cell.
6.4.1 Coastal erosion along the Kune and northern Vaini-Patok sub cells
The key factor causing coastal erosion along the Kune and northern Vaini-Patok littoral cell is low sediment supply, manifested in three main ways:• reduced sediment input to the coast from the Drini River due to upstream diversion;

54
• alteration of longshore sediment trans-port rates due to construction of a break-water south of the Drini River mouth.
In a ‘do nothing’ scenario, erosion of the beaches, spits and dunes in the Kune and northern Vaini-Patok littoral sub cells will continue into the future as sediment supply continues to be depleted. The rate of erosion is likely to be exacerbated by sea-level rise, increased storminess and nearshore wave heights, related to climate change. The po-tential for large-scale breaching at the zones of sediment transport divergence, without subsequent recovery, will increase and con-tinue to threaten the integrity of the lagoons.
6.4.2 Coastal deposition along the southern Vaini-Patok sub cell
The southern part of the Vaini-Patok litto-ral cell is part of the sedimentary system of the Mati River and has a positive sediment budget. Even though sand and gravel ex-traction has taken place from the Mati River bed, the regime at the coast is depositional. However, the extraction has caused environ-mental problems along the banks of the river. The Patok Lagoon area is very mobile due to changes in the Mati River flow where it enters the sea. Currently, deposition of a new spit has created a new outer lagoon seaward of the initial inner lagoon, providing an ad-ditional buffer to incoming waves.
• changing location of the Drini River mouth as a result of anthropogenic effects; and
In a ‘do nothing’ scenario, deposition along the new spit will continue as long as accre-tion keeps pace with future sea-level rise. Large quantities of sediment will continue to enter the coastal zone along the Mati River providing plentiful sand to the spit. The spit will continue to advance south, and could potentially converge with the spit growing north from the Ishmi River coast, closing the tidal inlet to outer Patok Lagoon.
PART 3. TECHNICAL SUMMARY
Figure 35. The DMRD littoral sub cells and sediment transport directions.
Shëngjin sub cell
Kune sub cell
Vain - Patok sub cell
Drini River
MerxhanitLagoon
Zajës &CekësLagoons
Mati River
PatokutLagoons

55
6.4.3 Tidal inlet dynamics and potential eutrophication
Four different types of tidal inlet are apparent along the DMRD coast. These are:• The main inlets to Merxhani Lagoon (north) and outer Patok Lagoon are located
between two converging spits which will continue to narrow their inlet widths into the future. It is likely that these inlets will eventually close;
• A new tidal inlet has opened at the southern end of Merxhani Lagoon when Kune Beach breached in September 2009. This inlet is gradually closing between two newly formed relatively small spits and will eventually close (if only temporarily);
• The tidal inlet of Ceka Lagoon crosses a beach with strong longshore transport and its position fluctuates seasonally. The inlet is more likely to close in the summer when freshwater runoff is low;
• Artificial inlets have been cut through the beaches fronting Merxhani and Ceka Lagoons, but these have closed quickly because of the dominance of longshore sediment transport over the lagoons tidal prisms (small tidal range), which are not strong enough to keep the inlets clear of sediment.
Overall, sediment accumulation in the tidal inlets will continue into the future reducing the exchange of water between the lagoons and the sea. It is possible that the water in the lagoons will become increasingly eutrophic because of this limited exchange. Eutrophication will be exacerbated by the continued discharge of polluted runoff into the lagoons from the pumping stations. The consequences of eutrophica-tion are higher during the summer season when the water exchange is more likely to be limited. However, the potential closure of tidal inlets in the future could be offset by an increase in lagoon tidal prism caused by future sea-level rise. This would lead to larger volumes of water passing through the inlets on flood and ebb tides which would encourage the inlets to remain open.
6.4.4 Rainfall, land drainage and river flooding
Although there is predicted to be a decreasing trend in annual rainfall, the number of intensive rain events (rainfall higher than a threshold) is predicted to increase. By 2050, the number of rainy days is predicted to increase by about 2-3 days compared to current. These predicted increases in the number of days with intense rainfall due to climate change will increase flood risk in the DMRD.
6.5 Conceptual evolution to 2100
The DMRD coastline is extremely dynamic and a prediction of the configuration of the coastline in 2100 with a ‘do nothing’ approach is difficult. However, some general statements can be made regarding the potential long-term evolution of the geomorpho-
PART 3. TECHNICAL SUMMARY

56
logical system components over the next ‘90 years or so:• Shëngjini Beach north will continue to accrete in the lee of the port breakwater.
Using an accretion rate of 2 myr-1, by 2100 the beach will be approximately 180 m wider in comparison to the present day;
• Shëngjini Beach south will continue to erode. At a future erosion rate of 3 myr-1 (at the high end of the current average rate to account for sea-level rise) the beach will be 270 m further inland by comparison to the present day. This would result in loss of the track, buildings in the linear settlement, and a large area of the wetland;
• Most of Kune Spit will be eroded and Merxhani Lagoon will be lost. At a future erosion rate of 3 myr-1, the majority of the spit will be lost to the sea by 2100 and the main shoreline will be adjacent to the flood embankment at the back of the lagoon.
• The continued presence of the Drini River breakwater will result in the disappearance of Kune Beach;
• Kune Island will be separated permanently from the mainland and be much smaller than today due to continued erosion;
• Sand will continue to build up in the lee of the Drini River breakwater. Using an accretion rate of 2 myr1, by 2100 the beach will be approximately 180 m wider in comparison to the present day;
• North Tale Beach will continue to migrate landward, but Zaje and Ceka Lagoons will be preserved as the buffer zone is wide enough to prevent total loss;
• South Tale Beach will continue to be stable; and• The Mati River spit will join the spit growing north from Ishmi Beach, and will seal
the Patok Lagoon tidal inlet to form a continuous barrier.
In summary, much of the existing beach-barrier, spit and lagoon system between Shëngjini Beach and the Drini River will be lost and will leave an open coastline aligned with the current flood embankments. Shëngjini Beach will be approximately 300 m inland of its current position. Adaptation to these changes with the goal to en-sure the natural systems are maintained and conserve their natural function involves managing three key coastal process features, namely: coastal erosion, water exchange between the open sea and lagoons and addressing sea level rise. These three key aspects are considered in the following 3 sections (section 11.4).
PART 3. TECHNICAL SUMMARY

57
PART 3. TECHNICAL SUMMARY
Figure 36. Potential management options for sediment management and water exchange in the DMRD.
Beach nourishment with groyne field (only after applied studies and EIA)
Construction of terminal groynes on either side of channel (only after feasibility studies and EIA)
Remove the Drini River breakwater (only after EIA) and re-introduce maintanance dredging of river mouth
Dune grass planting phased in after beach nourishment
Breach the embankment dividing Zaje and Ceka Lagoons
Construct moving gate across channel between the Drini River and Zaje Lagoon
Cut direct channel through to Ceka Lagoon and maintenance dredge
Part fill the old exchange channel
N
Lagoons and Watercourses
0 1 2 km

58
7. HYDROLOGY
7.1 Effects of current climate variability and extremes on the water resources in the DMRD
7.1.1 Drini i Lezhës water basin
The Drini i Lezhës is the principle river of the Lezha region with a catchment area of 314 km2. The mean altitude of the basin is 210 m and extends 50 km inland. In the Zadrima plain there is a system of irrigation and drainage channels, as well as the stream of Manatia, that have a minor influence in the Drini i Lezhës discharge. Periodi-cal floods that have occurred in the area have caused frequent damages to hydraulic works in the river bed, increasing the cost of their maintenance.
Water discharge indicators estimated by four different methods that convert rainfall data to discharge (for more details see Ndini, 2012) are as follows:• a mean annual discharge: 30 m3/s;• a maximum discharge: 215 m3/s;• a maximum discharge with a return period of 100 year: 904 m3/s;• a minimum discharge for the driest month: 6,82 m3/s;• a total volume of suspended sediment: 1054.106 ton/year.
7.1.2 Mati River water basin
The hydrographical basin of the Mati River is of significant economic importance for energy production and irrigation. The mean annual precipitation varies from 1200 to 1400 mm per year, but in the upper part of the basin can reach values of 2500 to 2700 mm per years. About 82 % of the annual precipitation occurs during the winter with only 14 % during the summer dry period (in June only 4 %). During the dry pe-riod, when precipitation is low and infrequent, the river is nourished by ground water coming from calcareous formations of the upper part of the basin. The construction of the artificial Lake of Ulza and hydropower facility of Shkopeti has affected the natu-ral water regime of this river. Owing to its highly fractured relief and large slope, and the high quantity and intensity of precipitation, there is a high quantity of sediment transported along the river flow. The solid material transported causes changes to the river bed, that can be mostly observed near the Rubik and Miloti cross sections. The Mati River has a mean annual discharge of 102 m³/s. The resulting specific discharge is about 40.l l/s.km² and the runoff coefficient 0.75. Some basic characteristics are:• annual discharge volume: 3250 million m3;• ratio wettest month (December) to driest month (August): 10;
PART 3. TECHNICAL SUMMARY
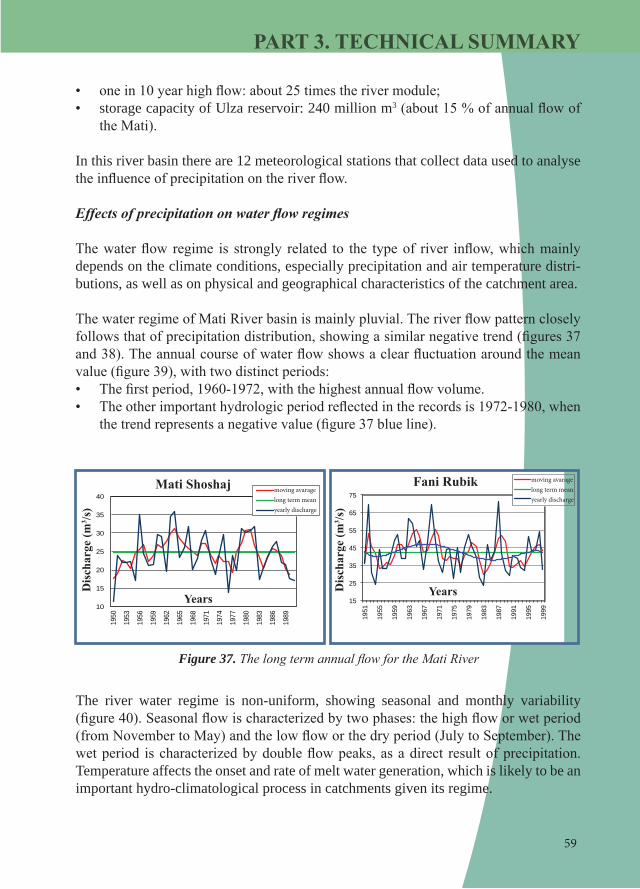
59
PART 3. TECHNICAL SUMMARY
• one in 10 year high flow: about 25 times the river module;• storage capacity of Ulza reservoir: 240 million m3 (about 15 % of annual flow of
the Mati).
In this river basin there are 12 meteorological stations that collect data used to analyse the influence of precipitation on the river flow.
Effects of precipitation on water flow regimes
The water flow regime is strongly related to the type of river inflow, which mainly depends on the climate conditions, especially precipitation and air temperature distri-butions, as well as on physical and geographical characteristics of the catchment area.
The water regime of Mati River basin is mainly pluvial. The river flow pattern closely follows that of precipitation distribution, showing a similar negative trend (figures 37 and 38). The annual course of water flow shows a clear fluctuation around the mean value (figure 39), with two distinct periods:• The first period, 1960-1972, with the highest annual flow volume. • The other important hydrologic period reflected in the records is 1972-1980, when
the trend represents a negative value (figure 37 blue line).
Figure 37.ThelongtermannualflowfortheMatiRiver
10
15
20
25
30
35
40
1950
1953
1956
1959
1962
1965
1968
1971
1974
1977
1980
1983
1986
1989
moving avaragelong term meanyearly discharge
Mati Shoshaj
Dis
char
ge (m
3 /s)
Years 15
25
35
45
55
65
75
1951
1955
1959
1963
1967
1971
1975
1979
1983
1987
1991
1995
1999
Dis
char
ge (m
3 /s)
Years
Fani Rubik moving avaragelong term meanyearly discharge
The river water regime is non-uniform, showing seasonal and monthly variability (figure 40). Seasonal flow is characterized by two phases: the high flow or wet period (from November to May) and the low flow or the dry period (July to September). The wet period is characterized by double flow peaks, as a direct result of precipitation. Temperature affects the onset and rate of melt water generation, which is likely to be an important hydro-climatological process in catchments given its regime.

60
The pattern of water flow closely follows that of precipitation distribution and air tem-perature during the year (figures 39 & 40).
The flow reaches its maximum value of high water during the November-February months when the value of precipitation is highest. There is a slight phase shift in months. For example, precipitation is highest in November and flow is greatest in De-cember. This can be explained because part of the precipitation during the fall season, October to November, goes to fill underground reservoirs because the ground is dry from the summer period. The groundwater nourishing factor represents 30 % of the annual discharge.
From the analyses conducted for the patterns of rainfall and runoff throughout the years as well as within a year, there emerges a good relationship between rainfall-runoff. Indeed for both rivers, Mati and Fani there are good respective correlation coefficients of 0.81 and 0.84 respectively.
0,6
0,7
0,8
0,9
1
1,1
1,2
1,319
49
1952
1955
1958
1961
1964
1967
1970
1973
1976
1979
1982
1985
Figure 38.
Moving average (5 years) of the mean discharge and precipitation
PART 3. TECHNICAL SUMMARY
runoff precip.
Xi/Xmean
0
20
40
60
80
100
120
140
160
180
200
X XI XII I II III IV V VI VII VIII IX
Figure 39.
The long term monthly mean distribution, stations Fani- Rubik, Shoshaj, Milot
Dis
char
ge (m
3 /s)
Month
Fani RubikMati ShoshajMati Milot

61
PART 3. TECHNICAL SUMMARY
Maximum discharge
The evaluation of the maximum discharge is important because it might directly impact on all hydro-technology works during intense flooding events. Maximum discharge occurs during the wet period of the year, from October till March (when more than 80% of the total annual precipitation falls), but sometimes rarely during other seasons.
The maximum water level within a year follows the pattern of number of the rainy days and the annual course of precipitation. The highest levels are observed between December and April. Both artificial reservoirs, Ulza and Shkopeti, are small and do not have any significant effects on flood regulation. There is an indication that the annual absolute maximum discharge and the number of these maximum events per year show a slight increasing trend over the recent past.
The effect of drought in water resources - low flow
Low flow is a seasonal phenomenon, and an integral component of the flow regime of any river. Drought, on the other hand, results from a less than normal precipitation over an extended period of time. Drought is a more general phenomenon, and may be characterized by factors other than just low stream flows. Knowledge of the magnitude and frequency of low flows for streams is important for water-supply planning and the design, waste-load allocation, reservoir storage design, and maintenance of quantity and quality of water for irrigation, recreation, and wildlife conservation.
In many cases, the majority of natural gains to stream flow during low-flow periods are derived from releases from groundwater storage. Losses to stream flow during dry weather periods may be caused by direct evaporation. Natural gains and losses to low flows are both affected by anthropogenic impacts, which can include:• Groundwater abstraction within the sub-surface drainage area;• Changes to the vegetation regime in valley bottom areas through clearing or
planting
Detecting changes in water resources using SPI method.
The SPI8 is an index based on the probability of precipitation for any time scale, and is based on statistical techniques that can quantify the degree of wetness by compar-ing usually one, three, six, twelve or even 24-monthly rainfall totals with the historical rainfall period over the history.
SPI index in Lezha zone - The SPI values for 3-months (SPI1) in the Lezha area are
8 SPI - Standard Precipitation Index

62
tabulated in the Table 8 based on the drought classification by SPI value.
Table 8.ClassificationofdroughtbasedontheSPIvalues
Classification Extremely wet
Very wet
Moderate wet
Near normal
Moderate dry
Severe dry
Extrly dry
SPI value >+2 1.99 -1.5 1 - 1.49 0.99 -0.99 -1 -1.49 -1.5 -1.99 <-2
To analyse and detect the trend of this drought the low flow indices is used - the mini-mum 30 days flow. The results of the analysis show that there is an increasing trend of this index, that means that the drought tendency is increasing during the period of observation (figure 41).
SPI values % Lezha 2.6 4.9 9.8 69.0 6.9 3.3 3.3
As can be seen from table 8, 69 % of cases are near normal, 6.9 % moderately dry, 3.3% severely dry and 3.3 % extremely dry. The SPI values calculated for Lezha show that over the period 1981 - 1990 the maximum number of cases of drought occurs in the period 2001-2008 and that there is an increasing trend in the occurrence of drought.
According to the definition that considers hydrological drought a continuous low-flow period in one year, analysis of the minimal flow for the dry period July-August-Sep-tember (figure 40) shows that there have been 12 years with less flow than the 75 % minimal flow during the dry period of the year.
PART 3. TECHNICAL SUMMARY
0
2
4
6
8
10
12
1949 1952 1955 1958 1961 1964 1967 1970 1973 1976 1979 1982 1985 1988
m3 /s
dry periodmean of dry periodthe �ow with 75%prob.
Years
Figure 40.Theminimalflowforthedryperiod

63
PART 3. TECHNICAL SUMMARY
0
1
2
3
4
5
6
7
1940 1950 1960 1970 1980 1990
Figure 41.Theminimum30daysflow.
Mati Shoshaj
Year
i) Effect of climate on groundwater
The Lezha plain and Fushë Kuqe are situated on both sides of the lower part of the Mati River flow. In the Miloti plain sector the Mati River has deposited deep granulated het-erogeneous material. Gravel deposits are widely present in depth over the entire plain zone. In the mountainous parts there are water depositing calcareous layers. Down-stream after Miloti and near the river mouth there are water depositing gravel layers. The thickness of this layer varies from 150 m in the southern and central part of the plain to 50 m in the northern and eastern part of Lezha plain. This is the most produc-tive aquifer in the area.
The plain zone of the Mati River, coinciding with the pilot area of the study, is made up of alluvial deposits. The most permeable layers are saturated with fresh water and are exposed all along the Mati valley. In the north and west, these deposits are covered by clay layers with a maximum depth of 30 to 40 m. The aquifer is mainly recharged by the infiltration of surface waters of the Mati River. The aquifer itself discharges water into the sea but water is also extracted through free flowing wells and pumping wells.
Lezha basin - Ground water storage in the Lezha region is abundant with a good distribution and quality (figure 42). This water is mainly used to supply the general population, the food industry and for other various purposes. The storage of ground water in this zone is calculated to be around of 2000-2500 l/s.
The amount of the water used from this aquifer, from existing wells and some uncon-trolled free flowing wells including the technologic water, is 800 l/sec. The remaining water discharges into the sea.

64
Fushë-Kuqe basin - Only a part of the northern part of this basin extends into the study area bounded by the Mati River. Near to the Mati River the gravel layer is 200 m thick. In this basin there are some water supply systems for local towns. The total amount of water used is 1250 l/sec. This water storage basin is the most intensively exploited in Albania. This exploitation has its impact on water quality and from the analyses there has detected a small increase in chlorine content.
Threats to the Aquifer - There are three threats that can be inferred:1. Heavy metals pollution from upstream;2. Gravel extraction in the alluvial cone at the entrance of the river into the plain;3. Sea water intrusion.
The impact of current climatic variability does not interfere with ground water pro-cesses. The process of accumulation and recharge of groundwater originate from long past times, it is a process with a very long periodicity such that any impacts of climate change will only be experienced a long time into the future. From analyses made to date, sea water intrusion is not currently a threat. Heavy metal pollution is also not a
The water quality is rather good and the risk of water pollution is low because of the thickness of the covering layer, the dis-tance of the nourishing zone and the artesian characteristic of the aquiferous layer. The only risk is from the great intensification of water extraction provoking the penetration of the water with high levels of mineralization. Other risks are from waste and waste-water discharged directly into the Mati River. The Lezha basin in its plain zone of the Mati River catch-ment has a large number of wells and new wells are being inten-sively drilled. In most cases they are free flowing wells. The wells have a seasonal fluctuation is of 1-2 m. It is also evident that in all the wells there is a general reduc-tion of the water level for the years 1962-1963 to 1998 of 1.5 - 3.5 m.
Figure 42. The aquifer layers in the zone.
PART 3. TECHNICAL SUMMARY

65
PART 3. TECHNICAL SUMMARY
problem, but remediation of the worst sites would be advisable. Sand and gravel min-ing is in the long run a serious problem. Removing sand and gravel in the alluvial cone will decrease the head versus the seawater level. The difference in level today is 15 - 25m. In addition, sand and gravel digging may clog-up important recharge area.
ii) Impact on floods
The main factor that leads to flooding impacts remains the heavy precipitation, and there is an evidence of increasing frequency of high rainfall events. The DMRD area is flooded not only from the rivers but by sea water waves too. Depending on the direction and the severity of the wind, the coastal zone is often inundated. Using available data and digitalizing in a terrain model (3D) a visual model of the potential flooding area is shown in figure 43.
Figure 43.
Flooded area in Mati Delta.
During a flooding event, waters may occupy the floodplain in a matter of hours, as in the case of flash floods, or for several weeks, as sometimes occurs during the winter period when the period of rainfall is longer or during spring floods caused by snowmelt. Flash flooding is characterized by the occurrence of the peak of the flood within 6 hours of the onset of rainfall. The Mati River channel is deep, well-shaped and defended with structural measures. Problems exist only near the river mouth where the river channel is wide and influenced by the sea.
The situation in Drini i Lezhës is rather complex (figure 44). Floods are caused by a combination of natural and anthropological causes and affect agricultural and urban areas. This situation arises because the Drini i Lezhës is not a natural river as a result from:• The river bed works as a drainage channel and is becoming filled with sediment.

66
• The very low slope of the river bed is an indicator for very low transport capacity of the water – so excess water drains away slowly.
• Poor maintenance of the river bed.• The hydraulic pressure toward the sea has been reduced as a consequence of hu-
man interventions such that water from the sea can more easily penetrate through to the land.
7.2 Effects on groundwater and coastal dynamic and their influence in the other economic sectors in the DMRD
7.2.1 Likely effects of climate change on river runoff
Two approaches have been used to analyse the sensitivity of rivers flow regimes to a range of climate change scenarios: an empirical approach, using regression analysis, and the hydrological models based on the WATBAL (monthly water balance model) applied at a range of representative sites. The analysis of the simulated mean discharges based on climate models show that they decrease, compared to the current regime for all the time horizons (figure 45). This decrease is evaluated to be 5.7 to 8 % for the first time horizon of 2030 and up to 27to 31 % in 2100. In general, it was found that changes in flow regimes are very sensitive to the assumed change scenario. Changes in catch-ment’s water balance were found to be more sensitive to changes in the catchment’s rainfall than changes in evapotranspiration. Changes in rainfall are amplified to lead to changes in runoff, increasing by factors ranging from 1.2 to 1.7.
PART 3. TECHNICAL SUMMARY
Figure 44.
The inundation in 2002 of Drini i Lezhës River plain

67
PART 3. TECHNICAL SUMMARY
-45
-40
-35
-30
-25
-20
-15
-10
-5
0L A H L A H L A H L A H
2030 2050 2080 2100
Figure 45. Graphical presentation of the precipitation and runoff changes.
Perc
enta
ge (%
)Scenarios
Precip.Runoff
7.2.2 Likely effects of sea level rise on coastal dynamic
Sea level rise is another effect of climatic change with a projected average rise of 49 cm (maximum 91 cm, according to the “worst” case scenario) up to the year 2100. In the coastal zone of the study area, erosion is a well-known phenomenon and together with the effects of the wave dynamics, is likely to lead to a retreat in the coastline (figure 46).
The extent of land affected by sea-level rise and coastal erosion, from 2030 to 2100, ranges from 520 ha to 5350 ha respectively. The existing wetland, lagoons and dry land areas will be highly affected (figure 47).
Figure 46. Coastal land to be submerged by sea level rise for the considered time horizons.
Are
a su
rfac
e (h
a)
Coastline erosion (ha)
8cm (5-14cm)2030
16cm (9-29cm)2050
35cm (15-62cm)2080
49cm (21-91cm)2100
Year

68
As conclusion, with significant acceleration of sea level rise, the wetlands are likely to be lost unless they are able to migrate inland, which is currently not possible as the shoreline is held in place artificially. The area of wetlands converted to open water will be much greater than the area of dry land converted to wetlands. According to the scenarios, all the wetlands could be lost, because they will lie below the annual high tide level.
7.2.3 Sea level rise impact on flooding
Sea level rise could increase the risk of flooding in three ways:• There would be a higher base (level) upon which storm surges would build; if sea
level rises one meter, an area flooded with 50 cm of water every 20 years would now be flooded with 150 cm every 20 years.
• Beaches and sand dunes currently protect many areas from direct wave attack; by removing these protective barriers, erosion from sea level rise would leave some areas along sea coasts more vulnerable.
• Wetlands and marshes slow the inland penetration of floodwater by increasing the friction at the estuaries by blocking waves. Losses of wetlands would thus increase coastal flooding.
In this zone, erosion coastal floods are caused also by the combination of high tides and storm surges. There are considered four sea levels scenarios: 0.50 m; 1m; 2 m and 3 m, above the “zero datum” to evaluate the combined effect of sea flood occurring by the sea level rise, with wind and surges effects. According to these scenarios, the area to be
Figure 47. The coast line prediction for the time horizon:1-2030. (SLR=8cm); 2-2050 (SLR= 16cm); 3-2080 (SLR=35 cm); 4-2100 (SLR=0.49).
PART 3. TECHNICAL SUMMARY
1 2 3 4

69
PART 3. TECHNICAL SUMMARY
flooded varies from 5330 ha to 18060 ha (table 9 and figure 48).
Sea level (h max) Sea Flooded area ( ha )+0.50 5330+1.00 11470+2.00 15050
+3.00 18060
Table 9. Flooded area (ha) for different sea setup scenarios
Figure 48.Thefloodedareafortheseasetups of :+0.5m (blue); + 1.00m (Red), + 2.00m (green), + 3.00m (green transparent).
7.2.4 Expected climate change and sea level rise effects on groundwater
Groundwater reacts to climate change mainly through changes in groundwater re-charge that in turn come from changes in mean precipitation followed by changes in river level. Trends in groundwater recharge follows, with a time lag, trends in river runoff. On the other hand these alluvial aquifers are mainly recharged by inundations originating from heavy rainfalls and floods. Thus, the net impact will depend upon the change in both the total precipitation and the variability of that precipitation.
The ground water system is vulnerable not only to climate change but to changes in

70
patterns of water extraction by the local population. While sensitivity of the ground-water system to climate change can be modelled by a hydrological model driven by climate variables that reflect climate change, changes attributable to population use has to be approximated by indicators. The sensitivity of human system to a change of groundwater recharge depends, at least in the case of decreasing groundwater recharge, on the relative importance of groundwater resources and use as compared to other freshwater resources and use, and on total human water use, from both surface water and groundwater. Groundwater resources should always be considered in relation to other freshwater resources, such as precipitation and total runoff as these resources are interdependent and not additive. Groundwater reservoirs react to climate change mainly from changes in groundwater recharge, but also from changes in river level (in response to increases in mean temperature, precipitation variability and sea level, as well as changes in mean precipitation). For groundwater recharge estimation, changes in precipitation amount and intensity (insofar as it affects runoff and infiltration) are much more important than changes in temperature.
In the study area, groundwater is an important source of drinking water and for irriga-tion in agriculture. Groundwater also plays a significant role in maintaining surface water systems through base-flow to Mati River and its tributaries. However, all of these functions become increasingly vulnerable as changes in climate occur. Studies suggest that precipitation intensities will tend to increase. Changing precipitation patterns to-gether with increased evapotranspiration, linked to increased temperatures, will affect groundwater recharge rates and the depths of groundwater tables.
Increased precipitation variability may increase recharge because only high-intensity rainfall is able to infiltrate fast enough before evaporating. On the other hand alluvial aquifers are recharged mainly by inundations due to heavy rainfalls and floods. The aquifer in this zone is mainly recharged by the infiltration of surface water of the Mati River. Thus, the net impact will depend upon the change in both the total precipitation and the variability of that precipitation.
Changes on the regional water balance affected by global warming bring changes in water storage too. Through a water-balance equation (1) the change of this water stor-age is assessed. Considering the human withdrawal of water as constant, it suggests that groundwater recharge will decreases approximately by 12.5 % at the year 2100.
δ (ΔS/Δt) = δP − δET − δQ − δD. (1)
Equation (1) suggests that a warming climate could bring a complex and interrelated
PART 3. TECHNICAL SUMMARY

71
PART 3. TECHNICAL SUMMARY
set of changes in water storage, precipitation, evapotranspiration, runoff, and net hu-man withdrawal that would affect all aspects of human activity and water-related envi-ronmental processes by offsetting water availability (expressed as δP–δET, used for ir-rigation, or δQ for aquatic organisms, or as δD for human consumption or agriculture).
Rising sea levels will threaten coastal aquifers. Many of coastal aquifers are already experiencing salinity ingress. The precarious balance between freshwater aquifers and sea water will come under growing stress as sea levels rise. Coastal aquifers are thus likely to face serious threats from climate-change-induced sea level rise. The Fushë Kuqe aquifer is very near to the coast and is affected by the effect of water intrusion. Rising sea levels will threaten this coastal aquifer. The precarious balance between freshwater aquifers and sea water will come under growing stress as sea levels rise and water withdrawal increase. The reduction of the freshwater depth with the seal level rise is explained in the table 10. These values mean there will be a reduction effect of the freshwater layer as a result of sea level rise. So the ΔH values presented in the table are the reduction in meters to be used by pumping processes.
Table 10. Effect of the sea –level rise in DMRD groundwater aquifer
Year Sea-rise (Δh) ΔH ( m )2030 8 cm -3.22050 16 cm -6.42080 35 cm -14.02100 49 cm -19.6
Coastal aquifers are thus likely to face serious threats from climate-change-induced sea level rise.

72
8. BIODIVERSITY
8.1 Natural ecosystems of DMRD area
DMRD is a wetland complex composed of a variety of different habitats. The most important habitats present are: Kune – Vain and Patok Lagoons, Drini and Mati deltas, salt marshes, sand dunes, Mediterranean pine forests, and riparian forests. These habi-tats are home to a high diversity of plant and animal communities, and provide critical ecosystem services such as coastal protection, water purification, and CO2 absorption and food security. There is an explicit link and feed-back loop that connects ecosystem health with the viability of the provision of the service provision by those ecosystems.
The DMRD area is an area that offers the highest number of species of nesting and breeding birds in Albania. The mouth of the Drini River is recognized internationally as an IBA and Specially Protected Area (SPA) and the Kune-Western area of Kune lagoon is defined in the network of Albanian Protected Areas as a Scientific Reserve. Despite the lack of knowledge of many taxa, it is evident that DMRD area is a “hot-spot” area of biodiversity for Albania, not only because of its species richness, but also because the constitution of its flora and fauna is unique.
8.1.1 Flora
Approximately 330 species of flowering plants, which belong to 58 families and 199 genera, have been identified from the DMRD area. Based on the red book (Vangjeli et al. 1996), 14 species of flowering plants, mainly of sandy dunes, as well as on riparian forests, coastal Mediterranean coniferous forests have been identified. Under the category endangered (EN) are included 8 species, and in the category vulnerable (VU) there are 6 species (table 11).
PART 3. TECHNICAL SUMMARY

73
8.1.2 Fauna
The existing knowledge of the fauna of the study area is still incomplete, although birds are relatively well studied and reptiles, amphibians and mammals less so. Some taxa are not studied at all. The Drini delta is one of the most important breeding sites along the Adriatic coast of Albania for waterfowl, which are the best studied group with organised regular winter counts of the water birds in wetlands over the last 15 years.
Table 12 and the figure 49 show the number of species of major fauna groups present in the DMRD area.
Table 11. Endangered and threatened plant species of the DMRD area and their sta-tus by IUCN
Latin name Common name Thratened Status by IUCN
Type of habitat
Pancratium mariti-mum
Zambak deti EN A1b Sandy dunes
Matthiola tricuspidata Pllatkë trithimthore EN A1b Sandy dunesJuniperus oxycedrus subsp. macrocarpa
Dëllinjë e kuqe kokër-madhe
VU A1b Sandy dunes
Cladium mariscus Klad marisk VU A1b Fresh waters habitats Quercus ilex Ilqe, hilqe, lëqeshtë,
ylnjëEN A1b Riparian forests
Quercus robur Rrënjë, rrojzë, rrajë VU A1b Riparian forestsDesmazeria marina Desmazerë bregdetare VU A1b Sandy dunesAmmophila arenaria Amofilë e ranishteve EN A1b Sandy dunesHypericum perfora-tum
Lulebasani, balç, luleg-jaku
EN A1b Riparian and Mediterranean coniferous forests
Stachys maritima Sarushë bregdetare VU A1b Sandy dunesOriganum vulgare Rigon, çaj i egër, çaj
bjeshkeEN A1b Riparian and Mediterra-
nean coniferous forestsLotus cytisoides Thuepulë vjexhësng-
jashmeEN A1b Sandy dunes
Colchicum autumnale Xhërokull vjeshtor, luleshlline, lulepreshi
EN A1b Riparian and Mediterranean coniferous forests
Posidonia oceanica Posidone oqeanike, leshterik
VU A2d Seabed of Drini Bay
PART 3. TECHNICAL SUMMARY

74
Ecosystem changes that have occurred over the last 50 - 60 years have reduced the potential of this area to support bird breeding. In addition, there has been an increase in the level of human-derived disturbance, particularly to colonies of the breeding birds (figure 50).
The Mati delta and its adjacent Patoku Lagoon represent a very rich and diverse wet-land ecosystem, both in terms of habitats and species: some 200 species of birds, 50 species of mammals, 9 species of amphibians and 25 species of reptiles. The Mati delta and its adjacent wetlands represent an important stopover site for migratory waterfowl and water birds along the Adriatic coast of Albania. The Malti delta and Patoku Lagoon are rich in waders (order Charadriformes) and is one of two sites where the slender-billed Curley (Numenius tennuirostris), one of the most endangered bird species of the world, has been reported in Albania. For its particular ornithological values the site has been designated as IBA for Europe.
Littoral waters of the Mati delta and Patoku are visited by an increasing number of sea turtles (Caretta caretta and Chelonia mydas), becoming an important site for sea turtles in the Adriaic Sea. Furthermore, the DMRD area is often visited by dolphins, mainly bottlenose dolphin Tursiops truncatus. A number of carnivores (order Carnivora) are
Table 12. Composition of fauna of Drini delta
Systematic group
Molluscs Crustaceans Decapoda
Mammals Birds Reptiles Amphibians
No. of species 17 59 49 196 24 10
Figure 49. Spectrum of the faunistic groups of the study area.
PART 3. TECHNICAL SUMMARY
Reptiles7%
Amphibians 3% Molluscs
5%
Crustaceansdecapoda
16%
Mammals14%Birds
55%

75
resident in the DMRD, including the otter (Lutra lutra) that is a species of international conservation interest.
Both the Drini and Mati River deltas are important wintering sites for the globally threatened species Phalacrocorax pygmeus. Other species protected by international treaties exist within or visit the area, such as Rhinolophus euryale, Rh. ferrumequi-num, Myotis myotis, Apodemus mystacinus, Milvus milvus, Milvus migrans, Mauremys caspica, Cyrcodactylus kotschyi, Ophisaurus apodus, Telescopus fallax, Rana balca-nica, R. lessone, amongst others.
8.1.3 Types of habitats in the DMRD area
An essential component of this project was to identify the location of habitats in the DMRD area and to produce a habitat map using the “Natura 2000” classification, and to identify and locate habitats of community interest (habitats with priority sta-tus, included in Annex I to Directive 92/43/EEC). Each habitat type within “Natura 2000” is defined by its unique combination of environment variables together with its associated biological community. The key steps in creating the DMRD habitat map were the combined use of habitat samples (point sampling data) and full coverage data layers from remote sensing. Recent (2007) high-resolution ortho-rectified digital pho-tographs of the entire study area were used to identify and classify the habitats.
The habitat map presents the definition and distribution of the habitats of the DMRD area, and a description of the species structure associated with those habitats. Each natural habitat type in this map, such as coastal lagoons or Salicornia and other
PART 3. TECHNICAL SUMMARY
0
100
200
300
400
500
600
700
80019
51-5
3
1960
-64
1966
1981
1984
1991
1993
1995
1996
2009
Figure 50. Dynamics of breeding colony of birds in Kune during the period 1950 – 2009
P. carboP. pygmeusA. cinereaE. garzettaE. albaA.ralloidesN. nzcticoraxP. leucorodiaP. falcinellus
Year
Num
ber
of b
reed
ing
pair
s

76
annuals colonizing mud and sand, has an associated set of plant species that normally occur in that location. Agricultural and urban lands and water bodies, while included on the map, are not classified as natural habitats. The vegetation present in these areas is primarily composed of non-native plant species and provides relatively low habitat value for wildlife. A “Natura 2000” code cannot be included for agricultural and urban lands and water bodies because these habitat types are not included in the “Natura 2000” classification system.
Thirteen habitats were identified, covering ca 7294 ha. Three of the identified habitats are of community interest: 1) *Coastal lagoons; 2) *Mediterranean salt steppes (Limo-nietalia); and 3) *ooded dunes with Pinus pinea and/or Pinus pinaster. A description of each habitat type is presented below referenced to the “Natura 2000” code.
1150 Coastal lagoons: Lagoons are expanses of shallow coastal salt water, of varying salinity and water volume, wholly or partially separated from the sea by sand banks or shingle, or, less frequently, by rocks. Salinity may vary from brackish water to hyper-salinity depending on rainfall, evaporation rates and the addition of fresh seawater from storms, temporary flooding of the sea in winter, or tidal exchange.
Plants: Zostera noltii, Ruppia cirrhosa, Phragmites australis, Potamogeton ssp., Typha spp., benthic algae.
1310 Salicornia and other annuals colonising mud and sand: Formations composed predominantly of annuals, in particular Chenopodiaceae of the genus Salicornia or grasses, colonising periodically inundated mud and sands of marine or interior salt marshes.
Plants: Salicornia europaea, Suaeda maritima, Frankenia pulverulenta, Suaeda splen-dens, Salsola soda, Parapholis incurva, Hordeum marinum, Sagina maritima, Spergu-laria marina, Chenopodium spp.
1410 Mediterranean salt meadows (Juncetalia maritimi): various Mediterra-nean and Western Pontic (Black Sea) communities of the Juncetalia maritimi. The different associations with their characteristic plant species such as tall rush saltmarshes dominated by Juncus maritimus and/or J. acutus, mediterranean halo-psammophile meadows (Plantaginion crassifoliae) dominated by Plantago crassifolia are included in this type of habitat.
Plants: Juncus maritimus, J. acutus, Puccinellia festuciformis, Carex extensa, Aster tripolium, Samolus valerandi, Hordeum maritimum Trifolium squamosum, Plantago crassifolia,Centaurium tenuiflorum,Aeluropus littoralis, Juncusgerardii,Artemisiacoerulescens, Aeluropus littoralis, Centaurium spicatum, Spergularia marina, Suaeda
PART 3. TECHNICAL SUMMARY

77
vera.
1420 Mediterranean and Thermo-Atlantic halophilous scrubs (Sarcocornetea frutico-si): perennial vegetation of marine saline muds (schorre) mainly composed of scrub, essentially with a Mediterranean-Atlantic distribution (Salicornia, Limonium vulgare, Suaeda and Atriplex communities) and belonging to the Sarcocornetea fruticosi class.
Plants: Sarcocornia fruticosa, S. perennis, Halimione portulacoides, Inula critmoides, Suaeda vera, Halocnemum strobilaceum, Aeluropus litoralis, Aster tripolum.
1510 Mediterranean salt steppes (Limonietalia): associations rich in perennial, ro-sette-forming (Limonium spp.) along Mediterranean coasts soils temporarily per-meated (though not inundated) by saline water and subject to extreme summer drying, with formation of salt efflorescence. Characteristic syntaxa are Limonietalia, Arthrocnemetalia,Thero-Salicornietalia and Saginetalia maritimae.
Plants: Limonium spp., Salicornia europaea, Artemisia coerulescens etc.
2110 Embryonic shifting dunes: formations of the coast representing the first stages of dune construction constituted by ripples or raised sand surfaces of the upper beach or by a seaward fringe at the foot of the tall dunes.
Plants: Elymus farctus, Honkenya peploides, Sporobolus pungens, Euphorbia peplis, Medicago marina, Anthemis maritima, A. tomentosa, Eryngium maritimum, Pancra-tium maritimum.
2270 Wooded dunes with Pinus pinea and/or Pinus pinaster: coastal dunes colonized by Mediterranean and Atlantic thermophilous pines, corresponding to the substitution facies or in some stations climax formations of evergreen oak of artificial origin (Quer-cetalia ilicis or Ceratonio-Rhamnetalia).
Plants: Pinus pinea, P. pinaster, P. halepensis, Juniperus macrocarpa.
3150 Natural eutrophic lakes with Magnopotamion or Hydrocharition - type vegeta-tion: lagoons, lakes and ponds with mostly dirty grey to blue-green, more or less turbid, waters, particularly rich in dissolved bases (pH usually > 7), with free-floating surface communities of the Hydrocharition or, in deep, open waters, with associations of large pondweeds (Magnopotamion).
Plants: Phragmites australis, Scirpus lacustris, Typha angustifolia, T. latifolia, Lemna trisulca, Ceratophyllum demersum, Potamogeton pectinatus, Potamogeton lucens.
PART 3. TECHNICAL SUMMARY

78
91F0 Riparian mixed forests of Quercus robur, Ulmus laevis, U. minor, Fraxinus an-gustifolia, and common alder (Alnus glutinosa) along the rivers (Ulmenion minoris): forests of hardwood trees of the major part of the river bed prone to flooding during regular rising of water level or, low areas prone to flooding following the raising of the water table. These forests develop on recent alluvial deposits. The soil may be well drained between inundations or remain wet. Following the hydric regime, the woody dominated species belong to Fraxinus, Ulmus or Quercus genus. The undergrowth is well developed.
Plants: Quercus robur, Ulmus laevis, U. minor, Fraxinus angustifolia, Populus nigra, P. alba, Alnus glutinosa, Humulus lupulus, Vitis vinifera ssp. sylvestris, Tamus communis, Hedera helix, Phalaris arundinacea,
92A0 Salix alba and Populus alba galleries: riparian forests of the Mediterranean and Central Eurasian multi-layered riverine forests dominated by Salix alba, Salix fragilis, or their relatives and Populus alba. These species are usually dominant in height.
Plants: Salix alba, Populus alba, Tamarix spp., Quercus robur, Fraxinus angustifolia, lianas.
92D0 Southern riparian galleries and thickets (Tamarisk and chaste tree galleries and thickets, Tamarix spp. and Vitex agnus castus): tamarisk and chaste tree galleries and thickets and similar low ligneous are formations of permanent or temporary streams and wetlands of the thermo-Mediterranean zone.
Plants: Tamarix dalmatica, T. hampeana, Vitex agnus-castus.
A list of all habitat types and their spatial coverage in the DMRD area is presented in Table 13. The habitat types fully correspond to the codes and definitions in the Direc-tive 92/43/EEC (Council Directive 92/43/EEC on the Conservation of Natural Habitats and of Wild Fauna and Flora). The habitat types, 13 in total, were mapped using Geo-graphical Information Software (GIS) and information about each habitat type was re-corded in a GIS database. The analyses of existing data are concentrated at the 1:50000 scale map (figure 51).
PART 3. TECHNICAL SUMMARY

79
Table 13. List of all types of habitats and their surface occurring in DMRD area. Habitats marked with a * are habitats with priority status, included in Annex I to Directive 92/43/EEC
CODE DEFINITION SURFACE HA1150 *Coastal lagoons 1424
1310 Salicornia and other annuals colonizing mud and sand 98
1410 Mediterranean salt meadows (Juncetalia maritimi) 914
1420 Mediterranean and thermo-Atlantic halophilous scrubs (Sarcocornetea fruticosi) 201
1510 *Mediterranean salt steppes (Limonietalia) 112110 Embryonic shifting dunes 175
2270 *Wooded dunes with Pinus pinea and/or Pinus pinaster 100
91F0Riparian mixed forests of Quercus robur, Ulmus lae-vis, U. minor, Fraxinus angustifolia, and common alder (Alnus glutinosa) along the rivers
354
92A0 Salix alba and Populus alba galleries 519
92D0 Southern riparian galleries and thickets (Tamarisk and chaste tree galleries and thickets, Tamarix spp. and Vitex agnus castus)
385
3150 Natural eutrophic lakes with Magnopotamion or Hydrocharition-type vegetation (thickets of com-mon reed, Phragmites australis)
553
Agricultural lands 2435Water bodies (rivers) 125Total surface 7294
Habitat maps are an essential source of information for integrated management and in particular towards maintaining high levels of biodiversity through the conservation of natural habitats, wild fauna, and flora in the DMRD area. Such a habitat map can also be used to estimate habitat losses due to sea level rise, both actual and predicted according to a range of projected scenarios of climate change.
PART 3. TECHNICAL SUMMARY

80
8.2 Impact of current climate on ecosystems of the DMRD
The DMRD area is subject to a range of environmental variables that can be damaging to ecosystems and habitats:• The wind becomes damaging to elements of habitats when its speed is greater than
15 m/s and such speeds or greater are recorded in all years (two peaks, with 46 and 63 numbers of cases with speeds higher than 15m/sec, respectively in 1975 and 1983, are registered).
• Heavy rainfall that can cause flooding (for example, 1970 and 2002, where the value of 24 h maximum of precipitation reached up to 220 mm).
• Poor land management that can exacerbate events, such as flooding, and threaten the viability of natural habitats.
• Storms and accompanying powerful waves that lead to steeper and narrower bar-rier profiles of the sandy dunes of the DMRD area, as well as erosion. For instance, along the Lezha seashore the coast erodes by 2.5 m per year on average. Since 1936, the sea line has progressed by 400 m (Pano 2007) resulting in the loss of considerable surface area of habitats and their flora and fauna. Erosion is leading to extensive erosion of the dune systems of the DMRD area, especially the sector between Shëngjini and Kune, western and northern parts of the Kune Islet, and the sector of Patoku Lagoon. Such disturbances can interrupt the natural succession of plant communities.
• Inundated by seawater of lagoons increases the water salinity, altering species composition. In Kune Lagoons (Merxhani, Vijë Kulari Lagoons), Patoku and Ceka Lagoons increased salinity has caused disappearance of the communities of the margins of these lagoons dominated by common reed thicket (Phragmites australis) that are replaced by halophytic vegetation. This will change the present ecosystems, gradually to a complete saline ecosystem.
• Temperature rise is predicted to effect habitat composition and also to enhance the spread and impact of many existing invasive species, as well as potentially pro-viding suitable conditions for presently non-invasive species to become invasive. Anthropogenic influenced habitats and sandy dune systems of the DMRD area rep-resent the ecosystems that are most vulnerable to this invasion. At present, the invasive alien species that has the largest negative effect on biological diversity in DMRD area is Cuscuta spp. (a parasitic plant originating from Australia) on sandy dune systems near Mati delta. Temperature affects plants mainly by influencing seed germination, and by extending or shortening the growing season. There has been an increase of about ten days in the growing season since the 1960s, as leaves bud earlier and are shed later.
PART 3. TECHNICAL SUMMARY

81
Figure 51. The distribution of habitat types in DMRD area.
PART 3. TECHNICAL SUMMARY

82
8.3 The expected climate change effects on natural ecosystems and their influence in the other economic sectors in the DMRD
Changes in climate will affect biodiversity at all levels: genes, species, habitats, and ecosystems. Temperature increase, change in rainfall patterns, drought, sea level rise, coastal flooding, damage from cyclones, and change in salinity will affect all habitat types of the DMRD area. There will be species loss if flora and fauna cannot adapt to climate change or migrate to suitable habitats fast enough.
Altered habitats can affect many bird species through loss of nesting, breeding, staging and wintering habitat coupled with a loss of their natural foraging material. The phenological data required to investigate the climatic impacts on plant development in DMRD area is not available. However, climate changes can be expected to alter flowering times (as stressed plants flower and set seed rapidly before dying), greater susceptibility to pests, and greater allocation of photosynthetic products to root growth to increase the probability of securing rare water resources. If water is in short supply in the soil because of drought, or does not fall during periods when plants most need it, plants will suffer from water stress. To deal with evaporative loss from prolonged water stress, a plant may limit leaf production and leaf surface area to reduce water loss, or close its stomata. Each response decreases the ability of the plant to carry out photosynthesis, with clear implications on net primary productivity and carbon storage, and can ultimately lead to plant death.
8.3.1 Impact of expected changes in temperature
Based on climate change scenarios for the DMRD area, effects on habitats, flora and fauna that can be expected are:• Some of the effects of increased temperatures will be an advantage to specific plant
species, stimulating growth rates and increasing their competitive ability within the plant community. Individual species will react differently, leading to changes in species composition and ecosystem structure. C4 plants are at an advantage in warm, moist climates whereas C3 plants adapt more efficiently to cooler climates. However, C3 plants are thought to be better adapted to the predicted rise in tem-perature than any other vegetation type, because the higher levels of CO2 available in the atmosphere will increase the efficiency of the photosynthesis process, out-weighing any negative effects caused by the increasing temperatures.
• Changes in vegetation composition may have significant effects on the local heat balance (Berendse, 2005). For example, by not using energy for evaporation (re-duced transpiration) the temperature of both the plant (leaf surface) and its sur-roundings will increase. In this way the ‘air conditioning’ effect of plants is re-duced, particularly during periods of water stress.
PART 3. TECHNICAL SUMMARY

83
• Though each plant species has its own characteristic response to temperature, in general, higher temperatures speed up growth and the rate of development of plants where other factors are not limiting. As temperatures rise, an optimum is reached followed by a (usually sharp) decline, where damage to plant tissue leads to the cessation of growth and ultimate death of the plant (Bisgrove & Hadley, 2002).
• The shallow nature and low flushing rates of DMRD coastal lagoons indicate that water temperatures in lagoons will increase also increasing the risk of algal blooms, eutrophication and oxygen depletion.
• In restricted lagoons with low flushing rates and high nutrient inputs such as Vije Kular, Ceka and Knalla lagoons, temperature increases will increase the probability and severity of hypoxic events and an overall decrease in species diver-sity and changes in benthic community structure characterized by a persistent shift in species composition to more hypoxia-tolerant species.
• Many lagoon species live near their threshold of thermal tolerance, at which even small changes in temperature can have large impacts on their viability. In addition, these ecosystems are more susceptible to increases in the colonization of invasive species that may thrive in warmer waters. Warmer temperatures are also thought to contribute to observed declines in seagrass abundance (Ruppia cirrhosa and Zostera noltii).
• Abnormally increased temperatures during the dormant season or winter season can potentially hinder germination of some seeds that require cold temperatures to alter hormones related with germination. In contrast, seeds that are stimulated into germination by warmer conditions to be at an advantage, as they will be able to establish themselves within the community earlier in the year and will therefore be in a better position to compete with later germinating species. This may therefore lead to a change in the species diversity or composition of the community structure.
• Plant species are restricted to their individual niche, but increased temperature will alter the niche conditions and may therefore inhibit growth of particular species. Some plants may display a phenotypic response, such that some of the character-istics of the species change in order to be better adapted and able to survive in the increased temperature. Even so, habitat loss and fragmentation may lead to a de-crease in species diversity. Plant diversity will also have a great impact on trophic levels within a community e.g. the plant community in an area is at least partly responsible for the insect populations seen.
• River and stream habitats or water bodies will be affected by rising temperatures, and changes in flow patterns. This could strongly affect primary productivity, dis-solved oxygen (DO), and invertebrate and fish communities.
• Warmer temperatures will strongly influence the species richness of many areas and alter the stability of many habitats not just for plants but for entire communities of many plants and animals.
• It is likely that warmer temperatures will alter the stages and rates of development of plant pathogens, as well as modifying host resistance, resulting in changes in the
PART 3. TECHNICAL SUMMARY

84
interactions between the two. Insects have short life cycles, high mobility, and high reproductive potential which mean they can quickly take advantage of and adapt to new climatic conditions and expand their ranges. Temperature is expected to have significant effects: increasing winter survival, extending the summer season and possibly influencing life-cycle duration, population density and distribution. Milder winters mean pests will have a ‘head start’, whilst increased temperatures in spring mean pests become active sooner, for longer and with shorter intervals between generations.
8.3.2 Maximum temperatures ≥ 35°C
The drought in Europe in 2003 combined unusually high temperatures with water stress and reduced primary productivity by 30 % (Ciais et al., 2003). If temperature increases too much, faster respiration may tip the balance towards plants becoming a CO2 source. Temperature rise will also effect habitat composition, since generally C3 plants are more sensitive to heat stress than C4 plants and CAM9 plants (Ehliringer et al., 1997).
Across the globe, climate change velocity and temperature extremes are projected to exceed the capacity of many species and communities to keep up with their climate niche space (Malcolm et al. 2005). However, the more frequent occurrence of climatic extremes is likely to make salt-marsh plant species more vulnerable and sensitive to other pressures and this increases the need for careful management.
Based on correlation existing between the numbers of days with heat wave (tempera-ture >35°C) and the average temperature for summer (during the period 1961-2008), the number of heat wave days up to the year 2100 is calculated as 80, 95, and 120 days, by the years 2050, 2080 and 2100 respectively. More frequent and severe droughts with greater fire risk are expected. More hot days and heat waves are very likely over the study area.
Additionally, whilst land management practices have decreased the incidence of wild-fires, increased temperatures and decreased water availability are likely to lead to an increase of fires with associated carbon release.
8.3.3 Minimum temperatures <-5°C
Cold days are currently an infrequent phenomenon and likely to become even more in-frequent under climate change scenarios for the area. Based on the correlation between the numbers of days with a cold wave and the average temperature for winter months (period 1961 - 2008), it is calculated that the number of days with cold waves will be
PART 3. TECHNICAL SUMMARY
9 CAM Crassulacean acid metabolism, generally succulent plants such as cactuses etc..

85
approximately 10 days by 2030, 7 days by 2050 and 5 days by 2080 (sesion 5.2.1). This means that plants growing in DMRD area will be less frequently subjected to freezing temperatures. For many species winter months and minimum temperatures less than -5°C are an important dormancy period of limited to no growth that enables plants to survive temporary climatic extremes, such as sub-zero winter conditions or prolonged drought. Some species use temperature cues as a sign that it is safe to break dormancy in order to maximize growth during favourable climatic conditions.
8.3.4 Extended growing season
As a direct consequence of temperature increases, the growing season will shift to-wards earlier starting dates (up to 7, 11 and 13 days earlier by 2050, 2080 and 2100 respectively related to the long term average). The end of growing season will shift towards later dates in December related to the long term average. The growing season is expected to lengthen by approximately 14 and 26 days by 2050 and 2100 related to 1990.
Warming has the its strongest influence over the stages of plant growth that rely on a temperature stimulus, for example, seedling germination, flowering or autumn leaf loss and extending or shortening the growing season. Growth (biomass accumulation) of some species may also be affected giving particular species either a competitive advan-tage or disadvantage. Abnormal periods of increased temperatures during the dormant season can potentially hinder plants that require cold temperatures to alter hormones related with germination of seeds.
Longer growing seasons are a major contributor to increased growth and a “greener” planet as seen in the northern hemisphere. Therefore plants can be used as a biologi-cal indicator, with changes in plant phenology often being used as evidence of global climate change. Changes may be harmful to the environment and species community structures, as many natural processes between species are synchronized, whereby two or more processes occur together to aid all species involved. The phenology of inverte-brate pollinators and host plants could become asynchronous, with deleterious impacts to both pollinators and hosts (Hegland et al. 2009). In the case of processes such as fruiting, flowering and the appearance of insects, a shift to an earlier time may also pose a threat to migratory birds, which may “miss” their food source.
8.3.5 Temperature rise and invasive species
Temperature rise brings could potentially increase the likelihood of alien invasive spe-cies, or “weedy” plants (Kriticos et al., 2003; Middleton, 2006) as well as increasing the probability that “sleeper weeds” may become invasive (Kriticos & Filmer, 2007).
PART 3. TECHNICAL SUMMARY

86
New niches will become available to invasive species as less tolerant species die-off or have their range restricted. Increasing disturbances due to extreme events could also have a detrimental effect on indigenous populations and create windows for successful invasions (Ward & Master, 2007). Biodiversity rich communities have greater “biotic resistance” and are more resilient to invaders, since diverse communities use resources more fully, leaving fewer niches for potential colonists to exploit.
There is a history of invasive species becoming established in the DMRD area (e.g. Eucalyptus globulus, E. camaldulenis,Punica granatum). In some cases, the impacts on native ecosystems occurred so far in the past that they are no longer recognised as invasives and their impact on the biological diversity of the region is not recognised. But, although the history of biotic invasions in the DMRD area is very ancient, the phe-nomenon has grown rapidly in more recent times as a result of globalization. Invasive alien species are found in all habitats types of the DMRD area, and can be considered as a potential threat for the future to these habitats. Factors such as salinity, flooding fre-quency and height seem to be the main variables which will determine the abundance of many alien species in habitats of the DMRD area.
Habitats influenced by anthropogenic pressure and sandy dune systems of the DMRD area are most vulnerable to invasive species. The belt of embryonic dunes will be at-tacked by alien and invasive species more than another habitat because of the high pro-portion of exposed soil usually found in this habitat, and this affect will be exacerbated by high human pressure and expected climate change. At present, the invasive species that has the largest negative effect on biological diversity in the DMRD area is Cuscuta spp. (a parasitic plant originating from Australia) on sandy dune systems near the Mati Delta This species is causing enormous damage to sandy dunes vegetation in this area. Temperature rise is predicted to enhance the spread and impact of this species. Overall, the potential effects of invasive species are:• Competition and subsequent replacement of native species.• Hybridizing with native species.• Introduction of pathogens.• Loss of habitats.
8.3.6 Precipitation
Annual precipitation is likely to decrease up to 8.1 % (from -5.5 to -11 %) by 2050; 12.9 % (from -8.4 to -21 %) by 2080 and 15.5 % (from -9.0 to -26.1 %) by 2100.
A decrease in precipitation could have important effects on the physical, ecological and biological characteristics of the DMRD lagoons through the alteration of freshwater inputs and associated changes in salinity and dissolved oxygen concentrations. As with
PART 3. TECHNICAL SUMMARY

87
all climatic changes, plant responses depend very much on each species’ unique adap-tive mechanisms and on the interaction of other factors. If water is in short supply in the soil because of drought, or does not fall during periods when plants most need it, plants will suffer from water stress. To deal with evaporative loss from prolonged water stress, a plant may limit leaf production and surface area to reduce water loss, or close its stomata. Each response decreases the ability of the plant to carry out photosynthe-sis, with clear implications on net primary productivity and carbon storage, and can ultimately lead to plant death. Other indirect effects include altered flowering times (as stressed plants flower and set seed rapidly before dying), greater susceptibility to pests (Kehlenbeck & Schrader, 2007), and greater allocation of photosynthetic products to root growth to increase the probability of securing rare water resources (Bisgrove & Hadley, 2002). Additionally, whilst land management practices have decreased the in-cidence of wildfires, increased temperatures and decreased water availability are likely to lead to an increase of fires with associated carbon release (Houghton, 2007) as well as habitat destruction.
Plants experiencing increased temperatures and decreased water frequently either open their stomata less widely or, more often, keep their stomata completely closed therefore reducing plant transpiration (Betts et al., 2007). While this will help plants to more efficiently utilise limited water resources (most water evaporation occurs via transpira-tion), this response may limit increases in net primary productivity, and thus limit car-bon storage opportunities that are also predicted. Additionally, transpiration is largely responsible for the ability of plants to cool their local climate. On a global scale, the loss of this cooling effect could be significant. Furthermore, reduced transpiration may allow plants to extract less water from the soil, leaving more water at the land surface.
With less precipitation, runoff of the Mati, Drini and Ishmi Rivers will decline leading to severe changes in habitat and water quality of the deltas of the Mati, Drini and Ishmi Rivers. This is because they receive much lower freshwater inflows that will lead to a shift in plant community structure to those better adapted to high-salinity conditions. An increase in evapotranspiration rates due to a decrease in precipitation, coupled with temperature increases and lengthened growing season, will reduce late summer soil moisture and rivers flow levels.
8.3.7 Hazardous precipitation
Although overall annual precipitation is expected to decrease, periods of intensive rain (precipitation higher than threshold) are expected increase by approximately 1-2 days by 2030 related to 1990, 2-3 days by 2050, 3-4 days by 2080 and about 4-5 days by 2100.
PART 3. TECHNICAL SUMMARY

88
An increase in the number of days with hazardous rainfalls will increase the risk of flooding altering ecosystems of the DMRD area. After a flood soil becomes saturated and waterlogged leaving no air spaces in the soil and depriving plant roots of oxygen, as well as preventing CO2 diffusing away. With too much water, plants are unable to draw up soil moisture and leaves will wilt (Bisgrove & Hadley, 2002) and roots will rot leading to plant mortality, literally by drowning. Plant species exhibit different tolerances to waterlogging, but this is also dependent on intensity, duration and at what stage in a plant’s life cycle it occurs (Ricard et al., 2006).
The expected increase in the intensity of precipitation events is projected to produce an increase in short-term freshwater inputs thereby decreasing salinity and dissolved oxygen concentrations in DMRD lagoons. Other effects of increased inputs of fresh-water include enhanced delivery of sediment and nutrients to lagoons. Increased nu-trient inputs may accelerate the eutrophication of lagoons, especially those with low flushing rates such as Knalla, Vijë Kulari and Ceka Lagoons. As with sea level in-creases, increased turbidity will reduce light penetration and the photosynthetic activity of aquatic vegetation (sea grasses beds dominated by Zostera noltii, Ruppia cirrhosa) compounding the risk of eutrophication as nutrient dynamics are further altered. In ad-dition, reduced light penetration can inhibit the feeding ability of animals that rely on sight to capture prey.
8.3.8 Drought
A decreasing trend in annual precipitation can be expected to increase incidents of drought (SP13 - the cases of moderate, severe and extremely dry) to approximately 18 cases by 2030 and 20, 22 and 24 cases by 2050, 2080 and 2100 respectively.
Higher incidences of drought intensity will increase incidences of forest fires. Increases in invasive species are expected to affect the composition of habitats and plant commu-nities. Increased drought stress may also lead to increased frequency of and magnitude of pest and disease outbreaks. An increase in defoliation by pests may then lead to a further increase in the likelihood of forest fires by increasing the volume of dead tree matter, which acts as fuel for fire.
An increase in drought intensity or frequency would also increase the incidence of coastal hypersalinity, resulting in the decline of valuable habitats such as Riparian mixed forests of Quercus robur, Southern riparian galleries and thickets (Tamarisk and chaste tree galleries and thickets, Tamarix spp. and Vitex agnus castus), Natural eutro-phic lakes with Magnopotamion or Hydrocharition-type vegetation (thickets of com-mon reed, Phragmites australis) and sea grasses vegetation of DMRD lagoons (sea grasses beds dominated by Zostera noltii, Ruppia cirrhosa).
PART 3. TECHNICAL SUMMARY

89
8.3.9 Mean sea level pressure
The projected decreasing tendency in mean sea level pressure (MSLP) during sum-mer may lead to an increase in the occurrence of cyclonic circulation, with a higher number of convective storm days as a consequence. The key processes involved in the building or loss of habitats are often driven by episodic extreme events. These may be extremes of temperature, winds, precipitation and storms, or more often combinations of these. The frequency and intensity of extreme weather events have been increasing and will continue to increase with warmer global temperatures. A slight increase in the frequency and intensity of storms will make them even more destructive and is likely
PART 3. TECHNICAL SUMMARY
to make DMRD processes more dynamic.
The consequences of sea level increase become acute during storm events because sea level increase and storms interact to produce high storm surges and erode barriers rapidly redistributing barrier sediment. During periods of high storm surge, wa-ter moves rapidly over the barrier in a process called overwash, which delivers sediment eroded from the front of the barrier onto the back barrier flat and into the lagoon, which in turn will increase the rate of exchange with the Adriatic Sea and consequently the flushing rate and salinity of lagoons.
8.3.10 Sea level rise
Sea-level rise can have a wide variety of impacts on the DMRD area: causing flooding, coastal erosion, increased storm surge, changes in light penetra-tion and saline intrusion. For biodiversity, poten-tial consequences of sea level rise include species and habitat change and, in cases, loss, salinization of groundwater. In the DMRD area, habitats can-not move inland as sea level rises as the coastline is effectively held in place because of the presence of flood-control, navigational, seaside development or other anthropogenic structures.
A GIS-based approach has been used to assess ex-isting and potential loss of DMRD habitats under
Figura 52. Expected area floodedby sea level rise (in 2100) and loss of habitat.
HabitatHabitat which are endargered by floods

90
Table 14.Surface of agricultural land
Communes haShenkoll 3022Shengjin 1308F-Kuqe 2490Total 6820
Table 15.Key crops and their yield
Crops Yield, ton/haMaize 4.4Wheat 3Vegetables 235Forages 251
different sea-level rise scenarios. In general, sea-level rise will inundate habitats and erode susceptible shores (figure 52). All habitat types of the DMRD area (sand beaches and dunes, salt marshes, lagoons, river deltas, riparian forest and freshwater habitats) will be subject to significant saltwater inundation even by a 0.09 m rise in mean sea level. The model suggests that a large area of terrestrial (land) habitats will be quickly converted to open water bodies. Terrestrial habitats in the DMRD area currently occupy approximately 5744.59 ha and losses over the next 100 years, if the current manage-ment policy is continued, are widely predicted to be 4604.28 ha, 4659.93 ha, 4715.59 ha, 4943.23 ha, 5063.12 ha and 5232.39 ha for a 0.09 m, 0.15 m, 0.21 m, 0.29 m, 0.63 m and 0.91 m rise in mean sea level respectively.
9. AGRICULTURE
9.1 Background
In contrast to the national trend of Albania, where agriculture has been decreasing in economic importance, in the DMRD area agriculture is the backbone of the economy, with the majority of the population engaged in this sector. The main arable crops are wheat, maize and vegetables and fluctuations in yield over the last 20 years are prin-cipally associated with periods of flooding and drainage problems, although in recent years there has been an upward trend in yields. In terms of livestock farming four main species dominate in the area: sheep, goat, cow and pigs, although the numbers of each have been falling. Many farmers are self-sufficient with small surpluses sold lo-cally, but sales are limited by poor local access to markets although there is a growing demand for organically grown local products during the summer tourist season. The surface of agricultural land per commune is given in the table 14 and the key crops and their yield in table 15.
PART 3. TECHNICAL SUMMARY
Rural families continue to dominate the national economy, about 50 % of the popula-tion lives in the rural areas, and agriculture is the main working mode of people there. The mean increase in rate of agriculture production during the last five years is esti-mated to about 3 % per year. Throughout the region, small family farms are vital to the

91
economy of rural areas, and they fill an important market niche for fresh, high quality, affordable local produce. The dependency of most farmers on rain fed agriculture has made the region‘s agricultural economy vulnerable to the effects of weather and cli-mate. A failure of rains and the occurrence of drought, or consecutive dry spells, during the growing season lead to crop failure, which in turn leads to food shortage. Rain fed agriculture in the region is dependent upon the weather and climate conditions.
9.2 Potential impacts of climate change to agriculture sector
The climate change scenarios for the DMRD area (chapter 5) report highlighted that, for the next two decades a mean warming of approximately 0.2 °C per decade is pro-jected. It should be noted that, even if the concentrations of all greenhouse gases and aerosols are kept constant at year 2000 levels, a further warming of about 0.1 °C per decade would be expected. The key climate change drivers influencing the agricultural sector are:• Temperature affects plants, animals, pests, and water supplies. For example,
temperature alterations directly affect crop growth rates, livestock performance and appetite, pest incidence, and water supplies in soil and reservoirs.
• Precipitation alters the water directly available to crops, including drought-stress, the supply of forage for animals, animal production conditions, irrigation water supplies, aquaculture production conditions, and river flows supporting barge transport.
• Changes in atmospheric CO2 influences crop and weed growth by altering one of the basic inputs for photosynthesis.
• Extreme events influence production conditions, impact trees and crops, drown livestock, alter water supplies, and potentially impact transport infrastructure such as roads and ports.
• Sea level rise influences the suitability of ports and waterborne transport, inundates producing lands, and may alter aquaculture production conditions.
• Greenhouse gas emission reduction efforts contribute to the desirability of pro-duction processes and the costs. However this could also result in new/expanded agriculture opportunities.
• Total growing season may be reduced for some crops. Cereal harvest dates would occur sooner. The lack of cold days could reduce vernalisation effects and conse-quently lengthen the first part of the growing season for the winter cereals. On the other hand, temperature increases in spring and summer could accelerate the course of crop development, more for short-cycle crops.
9.3 Climate effects on plant growth
Seasonal patterns of solar radiation, temperature, air humidity, atmospheric CO2 con-
PART 3. TECHNICAL SUMMARY

92
centration and soil conditions are the main climate-related determinants for agricul-ture. Climate elements interact with agriculture through various direct and indirect processes. Although direct effects on plant growth have been studied in great detail there are still limits to the extent to which generalizations of plant responses can be made to the crop level and to the regional food and fodder production. Detailed under-standing of plant response is required to better estimate and predict climate impacts on agriculture. Although mechanistic crop growth models have been widely used to inte-grate understanding of crop response to changing climate, there is a question as to the validity of extrapolation of local impact and adaption research to the regional.
9.3.1 Impact of climate condition in the agriculture production
There are several limitations that affect phenology development of agricultural plants, such as: high temperatures, low temperatures, drought, freezes, water stress, flooding, nitrogen stress and other nutrient stresses. In the Lezha region, probably the greatest single feature to impact agriculture has been flooding where agriculture has been af-fected by floods in 1854, 1905, 1937, 1962-1963, 1970 - 1971, 1992, 1995, 1996, 1997, 2004, 2005. The “cost” of the 1992 flood was to have impacted 17000 ha, 35000 per-sons and caused 120,000 US$ of damages. The biggest floods have occurred in autumn –winter period, and less frequently in spring. Despite this in recent years annual yields have been increasing through:• Project mechanism (work processes and agricultural land treatment). The level of
project mechanism is increased nearly 200 times in 1985, compared with 1950).• Mechanism of pickings process of agricultural products.• Distribution and improvement of seeds that are used. In 1985 there are distributed
about 11 times more different seeds in relation with 1950.• Increase of the amount and intensity of using chemical waste on the land. In 1985
there are distributed about 62 times more chemical waste in relation with 1950.• Increase of using herbicide and pesticide in agricultural cultures. In 1985 there is
used about 130 times the use different pesticides compared with 1950.• Improvement of irrigation system. In 1985 the irrigated surface is increased nearly
10 times in relation with 1950.• Improvement of irrigation technique, irrigation time etc.• Improvement of counselling services as each area has had 2 - 5 agricultural special-
ists available.
Although over the period 1961 - 1989 there is an increase in the trend of annual yield, owing to a correlation between climate data (temperature, rainfall, extreme cases etc.), it is seen that there is a positive relationship between some noticed climatic anomalies and wheat yield anomalies in the same period (high temp and high rainfall = low yield). The growing season is also increasing by more than 10 days per year.
PART 3. TECHNICAL SUMMARY

93
9.4 Impacts of climate change on agriculture
In general, predictions of climate change will lead to warmer and more variable weath-er in the DMRD area. Studies have aimed to elucidate how warmer temperatures, de-crease in annual precipitation, increase of atmospheric concentrations of CO2, like-ly changes in sea level, and increase in extreme weather events, (including spells of very high temperatures, torrential rains and flooding, and droughts) may affect a) crop yields, and b) the economic costs of agricultural production. The following conclusions can be reached:• Expected temperature increases are likely to hasten the maturation of annual crop
plants, thereby reducing their total yield potential, with extremely high tempera-tures causing more severe losses.
• Climate change projections include an increased likelihood of both floods and droughts. Variability of precipitation - in time, space, and intensity - will make the agriculture in the area increasingly unstable and make it more difficult for farmers to plan what crops to plant and when.
• Higher temperatures and lower precipitation are likely to result in the spread of plant pests and diseases. Higher temperatures reduce insect winterkill, and lead to increased rates of development and shorter times between generations. Wet vegeta-tion promotes the germination of spores and the proliferation of bacteria, fungi, and nematodes. Prolonged droughts can encourage other pests and diseases, especially those carried by insects.
• Increased crop pests may necessitate intensified use of agricultural chemicals that carry long-term health, environmental, and economic risks.
Falls in crop yields will be exacerbated by an increase in prolonged periods of droughts, a lack of water availability and a drop in precipitation incidence, which will in turn be much more intense. More frequent occurrences of extremes, such as dry spells and heat waves, will contribute as well. Thus, as elsewhere in the Mediterranean countries, there is a need to invest in better irrigation systems, more balanced crop-rotation methods and crops better adapted to water and heat stress, and to maintain levels of soil organic matter. The expected impact of climate change on agriculture will have an indirect im-pact on other sectors of the economy in the area that have some degree of dependency on agricultural production (e.g. tourism).
Considering the year 1990 as a baseline scenarios have been developed of the expected seasonal and annual temperature, air pressure and precipitation by 2030, 2050, 2080 and 2100 and the impact they might have on agriculture. Agronomic and economic impacts from climate change depend primarily on two factors:• the rate and magnitude of change in climate attributes and the agricultural effects
of these changes, and
PART 3. TECHNICAL SUMMARY
94
• the ability of agricultural production to adapt to changing environmental condi-tions.
The inter-annual, monthly and daily distribution of climate variables (e.g. tempera-ture, precipitation, changes in atmospheric concentrations of CO2, likely changes in sea level, and increase in extreme weather events) affects a number of physical, chemical and biological processes that drive the productivity of agricultural systems.
9.4.1 Temperature
Temperature limits the range and production of many crops. The effect of changing temperature as a result of climate change can be interpreted in terms of a number of interactions with crops and animals. Temperature is an important factor for crop growth and development. When the optimal range of temperature values for a crop in a par-ticular region is exceeded, crops tend to respond negatively, resulting in a drop in yield.
Annual temperature changes
The projected change in annual temperatures (relative to 1990 baseline) that predicts an increasing temperature will speed up development. In the case of an annual crop, the duration between sowing and harvesting will shorten (for example, the duration in order to harvest corn could shorten between one and four weeks). The shortening of such a cycle could have an adverse effect on productivity because senescence would occur sooner. For most crops elevated temperature causes a reduction in yield as there is less time for the capture of light, water and nutrients by the plant. Considering the main crops:• Maize - Increasing temperature causes the maize life cycle and duration of the re-
productive phase to be shortened, resulting in decreased grain yield. For the DMRD area, simulated yield decreased 5 to 8 % per 2 oC temperature increase. Using this relationship, a temperature rise of 1.2 oC over the next 30 years may decrease yield by about 4 % under irrigated or water-sufficient management. Linked to rainfall, in year 2100 where it is projected that the annual temperature will increase by 5 oC (maximum scenario), yield might reduce 9 % per 25.4 mm rainfall reduction.
• Wheat - Grain-filling period of wheat and other small grains shortens dramatically with rising temperature. Assuming no difference in daily photosynthesis, yield will decrease in direct proportion to the shortening of grain filling period as temperature increases.
• Tomato - Tomato is an important vegetable crop growing in the DMRD, known to suffer heat stress. Tomato yield is projected to decrease 12.6 % for 1.2 oC rise above 25 oC.
PART 3. TECHNICAL SUMMARY
95
Low temperatures and the number of days with temperature less than minus 5 °C re-corded during the period 1951 - 2008 in Lezha zone is very low, less than one day/year, and this will drop to zero. Temperature is the primary climate driver that will determine growing season length and plant phenology, but precipitation variability and CO2 may cause deviations from the overall patterns set by temperature. As mentioned in the pre-vious chapter on current climate variability and extremes in the DMRD, the number of days with maximum temperature greater than 35 °C has increased, particularly after the year 2000 compared to the period 1961 - 2000. As the direct consequence of increase in temperature is the increase in air humidity. The combined effects of these both climatic elements are projected to result in increases in the heat index.
Based on the existing correlation between the numbers of days with heat wave and the average temperature for summer (during the period 1961 - 2008), it is estimated (chap-ter 5) that the number of heat wave days will be about 80, 95, and 120 days by 2050, 2080 and 2100 respectively. Warmer average and extreme temperatures will enhance the demand for freshwater and water for irrigation purposes, especially for soils with low water-storage capacities. If precipitation declines, the project area would face sub-stantially increased risks of summer water shortages.
Seasonal temperature changes
Phenology is the most important attribute in the yield assessment and consequently in the adaptation of crops to the changing environment. Both the timing of phenological stages and the relative duration of the pre and post-flowering phases (vegetative and reproductive phases, respectively) are in fact critical determinants of yield. Taking each season in turn:• Winter (December/January/February) - A temperature increase will have a nega-
tive impact on the agriculture in the region. Some important crops in the region, such as grapes, have winter chilling, or vernalization, requirements. These require-ments usually involve a prolonged winter period where temperatures do not exceed a certain threshold temperature (e.g. 30 consecutive days with temperatures below 4.2 oC). Warmer winters and/or an increase in winter ―thaws could have negative consequences for spring flowering and yield of these crops, whether or not spring and summer temperatures are optimum for their growth.
• Spring (March/April/May) - The average spring temperature is likely to increase up to 1.6 oC (1.3 - 2.2 oC) by 2050; 2.5 oC (1.7 - 3.6 oC) by 2080 and 3.0 oC (1.9 - 4.4oC) by 2100. Elevated temperature during early growth stages will often be beneficial, but during the time of maximum growth can be detrimental due to short-ening this period.
• Summer (June/July/August) - An elevated temperature up to 2.6oC in the sum-mer might not be harmful for the maize. There is a potential positive side to cli-
PART 3. TECHNICAL SUMMARY
96
mate change in the region. Some crops will do better, and a warmer, longer sum-mer could create new opportunities for farmers with enough capital to take risks on new crops (assuming a market for new crops can be developed). A benign warming trend (moderate warming, and no increase in extreme weather events) will tend to benefit those attempting to grow crops that are currently a challenge to produce in the region. Examples might include watermelon, tomatoes, peppers, peaches, and European red wine grape (V. vinifera) varieties. However, a warmer climate is likely to increase the frequency of high day or night temperature stress events that can negatively affect flowering, fruit set, and quality. Even a warm-season adapted crop such as tomato can have reduced yield and/or fruit quality if temperatures exceed 37°C during critical flowering and pollination periods (Sato et al. 2001).
Although other factors, such as levels of inputs affect yields, we know that climate remains an important determinant of agricultural outcomes, especially when climatic events are severe. Corn yields decline with warmer temperatures due to acceleration of the crop’s development, especially during the grain-filling period. Greater precipita-tion (if not excessive) during the growing season tends to increase yields, as expected. Taken together, when the optimal range of temperature values for a crop in the region is exceeded, crops tend to respond negatively, resulting in a drop in yield.
9.4.2 Precipitation
In the communes of Shëngjin, Shënkoll and Fushë-Kuqe most of the farmers depend on rain fed agriculture, which makes the region’s agricultural economy vulnerable to the effects of precipitation which determines also the water availability. The availability of water is fundamental to agriculture. The impact of climate change can occur through three major routes:• drought – a lack of water for a period of time causing severe physiological stress
to plants and animals;• flooding – an excess of water for a period of time causing physiological and direct
physical stress to plants and animals; and• timing of water availability – when severe lack or excess of water does not occur
but its availability through the year changes so as to no longer be suitable for cur-rent agricultural practices, crops or animals.
Expected seasonal and annual precipitations, by 2030, 2050, 2080 and 2100 horizons have been compared relative to the 1990 baseline, this shows an obvious trend of de-crease in precipitation.
PART 3. TECHNICAL SUMMARY

97
Annual precipitation
Annual precipitation is likely to decrease up to 8.1 % (from -5.5 to -11 %) by 2050; 12.9 % (from -8.4 to -21 %) by 2080 and 15.5 % (from -9.0 to -26.1 %) by 2100 (session 5.2.2).
Crop water requirements are normally expressed by the rate of evapotranspiration (ETo) in mm/day or mm/period. Since ETo is directly related to yield, the goal for ir-rigation management is to supplement rainfall with just enough water to meet full ETo unless the water supply is inadequate. If irrigation along with rainfall is insufficient to meet ETo demand, yield reduction is likely. Irrigating too much can cause percolation of excess water below the root zone, conveying nitrate nitrogen and other agri-chemi-cals to the groundwater.
Another important drought indicator closely related to precipitation is the Standard Precipitation Index (SPI). Although the scenario shows that it is likely a decreasing trend in annual precipitation, the cases of intensive rain (precipitation higher than the threshold) are expected to intensify. So, we can expect an increase of about 1 - 2 days with the number of rainy days by 2030 relative to 1990, about 2 - 3 days by 2050, 3 - 4 days by 2080 and about 4 - 5 days by 2100 with hazardous rainfalls. Taking into account the likely decreasing trend in annual precipitation, projected by the climate change scenarios, an increase of SPI3 (the cases of moderate, severe and extremely dry) of about 18 cases by 2030, of about 20, 22 and 24 cases by 2050, 2080 and 2100 respectively might be expected.
Considering each of the seasons:• Winter precipitation (December/January/February) - Precipitation total during
winter, related to 1990, is likely to decrease up to -8.0 % (from -4.3 to -12.4 %) by 2050; 11.9 % (from -5.7 to -23.7 %) by 2080 and 13.7 % (from - 4.7 to -29.4 %) by 2100.Lower amounts of precipitation falling as snow and earlier snowmelt may bring drought conditions. Episodes of high relative humidity, frost, and hail can also affect yield, and the quality of corn and other grains and fruits and vegetables.
• Spring precipitation (March/April/May) - Crop yields are most likely to suffer if dry periods occur during critical developmental stages such as reproduction. The timing, intensity, and duration of drought spells determine the magnitude of the effect of drought, but for many agricultural crops, water availability in spring is critical. The total precipitation during spring, related to 1990, is likely to decrease up to -6.9 % (from -5.9 to -8.1 %) by 2050; -12.3 % (from -9.0 to - 17.7 %) by 2080 and -15.0% (from -10.1 to -22.2 %) by 2100. Results suggest that the sensitivity to water deficit is somewhat higher in spring, and this difference is thought to be the result of ‘conditioning’ of winter wheat which enables it to adjust its growth better in relation to water deficit.
PART 3. TECHNICAL SUMMARY

98
• Summer precipitation (June/July/August) - The highest decrease in average pre-cipitation is likely to occur during summer, respectively up to -24.6 % (from -16.5 to -33.9 %) by 2050; -45.7 % (from -36.0 to -58.8 %) by 2080 and -54.8 % (from -44.2 to -71.8 %) by 2100. Considering the fact that summer is the season with less precipitation, the scenarios forecast a dangerous situation for agriculture; a combination of heat and drought stresses simultaneously, the one contributing to the other. These conditions are often accompanied by high solar irradiance and high winds.
• Autumn precipitation (September/October/November) - In contrary to the trend of the total annual precipitation and the precipitation during winter, spring, and sum-mer where a decrease in precipitation in forecasted, the scenarios show that during autumn the precipitation changes are likely to have slight positive values up to 2040 while after that the likely trend is negative.
As with temperature, precipitation changes can impact insect pest predators, para-sites, and diseases resulting in a complex dynamic. Fungal pathogens of insects are favoured by high humidity and their incidence would be increased by climate changes that lengthen periods of high humidity and reduced by those that result in drier condi-tions. Intense bursts of rainfall forecasted to increase in the coming years up to 2040 may damage younger plants and promote water logging of standing crops with ripening grain, as well as soil erosion. In addition, greater temporal and spatial variability of pre-cipitation can affect soil conditions and susceptibility to pest and pathogen infestations.
9.4.3 Influence of climate on crop water needs
Water stress can have a significant effect on crop phenology, thus affecting the lengths of individual crop growth stages. It is a well-known fact that water stress hastens flowering and physiological maturity. The crop water need mainly depends on:• The climate: in a sunny and hot climate crops need more water per day than in a
cloudy and cool climate.• The crop type: crops like maize or sugarcane need more water than crops like
millet or sorghum.• The growth stage of the crop: fully grown crops need more water than crops that
have just been planted.
Figure 53 shows the amount of water required in each commune, based in the area of agricultural land for three communes, for years 2030, 2050, 2080, 2100 using as a base the period 1961 - 1990. Calculations are made based on water deficit (Precipitation - Eto) for the area of agricultural land located in the project area (amount of arable land surface for three communes).
PART 3. TECHNICAL SUMMARY

99
As seen from figure 53, the requirements for irrigation will grow significantly, due to severe lack of rainfall and rise in temperatures. This will require new water resources, such as reservoirs, but more important is that the farmers should increase efficiency of water use for irrigation through using techniques such as drop irrigation, which has high water application efficiency with a minimized fertilizer/nutrient loss due to local-ized application and reduced leaching. This method increases irrigation efficiency from about 45 % (traditional flooding irrigation) or 60 % (traditional spray irrigation) to over 90 %. Plus, less electricity is needed.
PART 3. TECHNICAL SUMMARY
Figure 53.Water demands based on climatic change scenarios
Cro
p w
ater
nee
ds (0
00/m
3 )
Years
9.4.4 CO2 “fertilization” effects
Plants produce more vegetative matter as atmospheric concentrations of CO2 increase. It is widely recognized that elevated atmospheric CO2 will have a fertilization‖ effect increasing crop biomass, possibly crop yield, but not necessarily crop quality.
9.4.5 Effect of climate change on growing season
The average growing season length is 273 days. It begins on begins on 14 March (day 73 of the year) and ends on 2 December (day 336 of the year). The dates of beginning and ending of growing season are highly dependent on temperature. As a direct conse-quence of the temperature increase, the beginning date of growing season will shift to-wards earlier dates (up to 7, 11 and13 days earlier by 2050, 2080 and 2100 respectively related to long term average) (figure 54). The ending date of growing season will shift towards later dates in December related to long term average. The growing season is lengthened about 14 and 26 days by 2050 and 2100 related to 1990.

100
9.4.6 Likely changes in sea level
Because of their geographic location and topography, the likely changes in the sea level will have a great impact in the agriculture in the area. The best example was this year‘s winter (December 2009 – January 2010) were increase in the sea level associated with storm surge and heavy rain have caused flooding and ponding in many fields. As a re-sult more than 600 ha were flooded causing an economic losses of ca 14,000,000 ALL (ca. 150,000 USD).
Flooding reduces the exchange of air (oxygen) between soil and atmosphere eventually leading to decreased total root volume, less transport of water and nutrients through the roots to the shoot, and formation of sulphides and butyric acid by microorganisms that are toxic compounds to plants. Even if flooding doesn’t kill plants, it may have a long-term negative impact on crop performance. Excess moisture during the early vegetative stages retards root development. As a result, plants may be subject to greater injury later during a dry summer because root systems are not sufficiently developed to contact available subsoil water.
The scenarios project an increase in loss of wetland area (around 1 km2 by 2100), and as a consequence a decrease in total wetland area. In addition, increases in coastal floodplain area and population affected by sea-level rise are predicted to be respec-tively around 66 km2 and 4.6 thousands by 2100. Finally, coastal forest area and low unvegetated wetland areas are likely to decrease.
-40
-30
-20
-10
0
10
20
30
40
50
61 63 65 67 69 71 73 75 77 79 81 83 85 87 89
Figure 54.The annual anomaly and the trend of grown season length.
Dev
iatio
n of
day
s
Years
deviation of days Poly. (deviation of days)
PART 3. TECHNICAL SUMMARY

101
Figure 55. Agriculture areas that risksfromflooding
9.4.7 Climate change effects on forage quality
Animal production depends on the quality as well as the quantity of forage. Key quality parameters for forage include fiber content and concentrations of crude protein, non-structural carbohydrates, minerals, and secondary toxic compounds. Based on expected vegetation changes and known environmental effects on forage protein, carbohydrate, and fiber contents, both positive and negative changes in forage quality are possible as a result of atmospheric and climatic change. Plant N and crude protein concentra-tions often decline in CO2enriched atmospheres, especially when plant production is
PART 3. TECHNICAL SUMMARY
enhanced by CO2. This reduction in crude protein reduces forage quality and counters the positive effects of CO2 enrichment on plant production and carbohydrates. Limited evidence (Owensby et al, 1996) suggests that the decline is greater when soil nitrogen availability is low rather than high, implying that rising CO2 possibly reduces the digestibility of forages that are already of poor quality for ruminants. Such reductions in forage quality could have pronounced negative effects on animal growth, reproduction, and mortality, and could render livestock production unsustainable unless animal diets are supplemented with N (e.g. urea, soybean meal).
9.4.8 The indirect impact of climate change effects on agriculture
The expected impact of climate change on agri-culture will definitely have an indirect impact on other sectors of the economy in the area and tourism will be most probably one of highly af-fected. The region has become a popular tourist destination as a result of some unique environ-mental features, for example, the Patok Lagoon. Since most of the food for the tourist facilities comes from the region and is based on organic farming, a change in the structure of the crops, yield and the phenological stages will affect the tourism industry.
agricultural lands
agricultural land which are endangered by floods, 1264.5 ha

102
10 . TOURISM AND POPULATION
10.1 Background
The field area of Lezha County is well-known for its variety of economic and human resources. The coastal area represents a considerable potential for multiple tourist ac-tivities due to its favourable geographic position, long beaches, Mediterranean climate, water resources, and aesthetic landscape.
The project area covers the communes of Shëngjin, Shënkoll and Fushë Kuqe. Its sur-face is 155.2 km2. The population of the zone is about 33,614 inhabitants (INSTAT, December 2007). The population density is 221.2 inhabitants/km².
This area has undergone important transformations, especially after 1960. Forest and marshy areas have decreased the number of agricultural areas and construction ones (settlements, economic and social-cultural objects, and infrastructure) have increased, the environment and landscape has been humanized (figure 56). These changes have occurred as a result of human activity and the nature reaction to resettle the damaged equilibriums caused by the improper human interventions.
As a result of the free movement process, population tends to concentrate in coastal zones with appropriate climate and conditions for multiple economic activities. It has led to increasing the population density (figure 56) and expansion of settlements. The majority of the settlements, situated in the coastal-plain zone, are widely exposed to Mati and Drini River floods and intensive precipitations due to climate extremes.
The tourism sector, almost non-existent until 1990, is currently becoming one of the main income sources, especially for the population of this coastal area. The Lezha zone offers very good comfort levels for tourist activity during the year (figure 56 & 57). Tourist activity in the study area focused on the beaches (sun and sea tourism).
During the 19 last years the infrastructure in tourism services has developed very fast, especially at the beaches of Shëngjin, Kune and Tale (Table 16). Tourism infrastructure has been constructed in the absence of any approved urban plans and without taking into consideration damages caused by extreme events (floods, storms, coastal erosion, droughts). Road, water and power infrastructure has consistently been damaged due to sea and river flooding, particularly from November to April, when precipitations levels can be frequent and heavy. Along the Kune coast (where erosion is active) every year the sea progresses further inland destroying hundreds of square meters of the beach zone and felling dozens of pine trees.
PART 3. TECHNICAL SUMMARY

103
PART 3. TECHNICAL SUMMARY
Figure 56. Left - Population density in DMRD area. Right - Land use in Shëngjini commune (2009).
0
50000
100000
150000
200000
250000
300000
350000
400000
2008
2009
Figure 57. Number of tourists in DMRD area.
Num
ber
of to
uris
ts
Shëngjin- Kune
TaleIshull-Lezhë-Vain
Patok
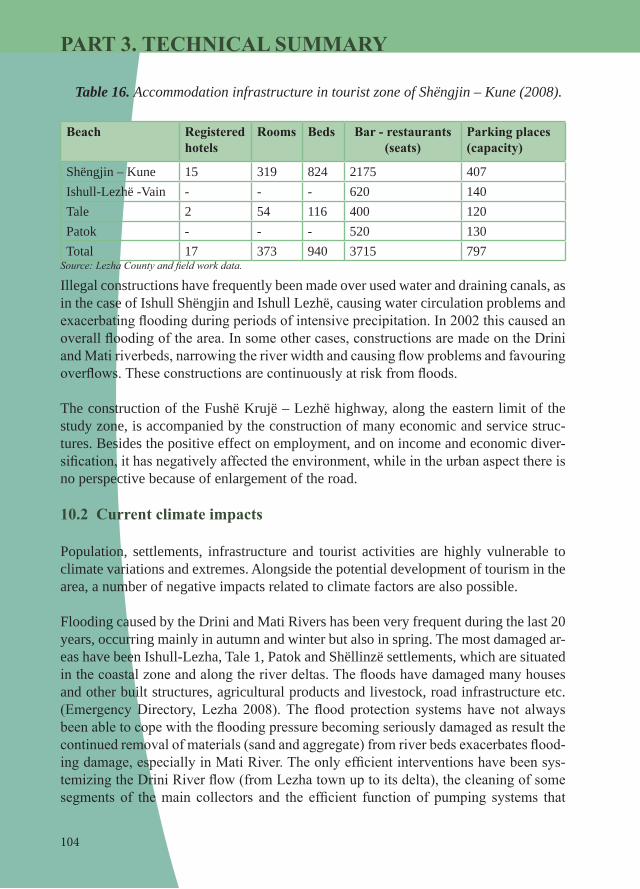
104
Illegal constructions have frequently been made over used water and draining canals, as in the case of Ishull Shëngjin and Ishull Lezhë, causing water circulation problems and exacerbating flooding during periods of intensive precipitation. In 2002 this caused an overall flooding of the area. In some other cases, constructions are made on the Drini and Mati riverbeds, narrowing the river width and causing flow problems and favouring overflows. These constructions are continuously at risk from floods.
The construction of the Fushë Krujë – Lezhë highway, along the eastern limit of the study zone, is accompanied by the construction of many economic and service struc-tures. Besides the positive effect on employment, and on income and economic diver-sification, it has negatively affected the environment, while in the urban aspect there is no perspective because of enlargement of the road.
10.2 Current climate impacts
Population, settlements, infrastructure and tourist activities are highly vulnerable to climate variations and extremes. Alongside the potential development of tourism in the area, a number of negative impacts related to climate factors are also possible.
Flooding caused by the Drini and Mati Rivers has been very frequent during the last 20 years, occurring mainly in autumn and winter but also in spring. The most damaged ar-eas have been Ishull-Lezha, Tale 1, Patok and Shëllinzë settlements, which are situated in the coastal zone and along the river deltas. The floods have damaged many houses and other built structures, agricultural products and livestock, road infrastructure etc.(Emergency Directory, Lezha 2008). The flood protection systems have not always been able to cope with the flooding pressure becoming seriously damaged as result the continued removal of materials (sand and aggregate) from river beds exacerbates flood-ing damage, especially in Mati River. The only efficient interventions have been sys-temizing the Drini River flow (from Lezha town up to its delta), the cleaning of some segments of the main collectors and the efficient function of pumping systems that
Table 16. Accommodation infrastructure in tourist zone of Shëngjin – Kune (2008).
Beach Registered hotels
Rooms Beds Bar - restaurants (seats)
Parking places (capacity)
Shëngjin – Kune 15 319 824 2175 407Ishull-Lezhë -Vain - - - 620 140Tale 2 54 116 400 120Patok - - - 520 130Total 17 373 940 3715 797Source:LezhaCountyandfieldworkdata.
PART 3. TECHNICAL SUMMARY

105
remove flood/excess water in winter. Storm surges mostly in winter time, accompanied with flooding from rivers, have not only damaged the ecosystems of the protected areas of Kune-Vain and Patok, but also negatively affected the social and economic activities of the population.
High temperatures, and especially heat waves, have caused many wild fires in both pine tree forests and oil deposits. During the summer of 2007 (the hottest of the last 50 years) hundreds of pine trees planted 40 years ago in the limestone slopes of Shëngjini mountain and along the coastline were burned. In the autumn of 2008 the oil deposits in Knalla burned. The fires have damaged the environment, biodiversity and the land-scape causing stress, as well as panic to locals and tourists. The consequence of this is considerable economic damages. The increase of the number of heat wave days after 2002 (26 days in 2003) has also created health and comfort issues for the local popula-tion and tourists.
10.3 Expected climate change impacts
Climate changes and sea level rise are likely to have a considerable impact on local population and tourist activities. The projected increases in temperature, especially in summer, and the number of days with heat wave (figure 58) are likely to influence health and the supply and quality of water. As a direct consequence of the increase in the number of hot days and heat waves, an increase in air humidity is expected. From the results of the technical studies carried out by the project, the combined effects of these climatic elements are projected to result in:
• Increases in the heat index, which might lead to a worsening of the health condition of the population. For instance, an increase in cases of heart disease and sun burn is expected as a result of exposure from increased ultraviolet radiation.
• Higher temperatures and heat waves can be expected to impact social and econom-ic activities if the wellbeing of the population becomes affected. High temperatures for relatively long periods increase the incidence of epidemic diseases and prolong their incubation period, increase the incidence of local diseases.
• The energy demand for cooling (air conditioning etc.) will increase as result of an increase in “cooling degree days”.
• In addition, in marshy coastal areas, an increase of still water surfaces is expected, where spreaders of epidemic diseases find suitable conditions for breeding.
The high decrease in precipitation, combined with the high increase in temperature, might favour prolonged summer droughts over the area (expected increase from 1 in 1990 to 4 - 5 days in 2100). Combined with higher evaporation it is likely that river flows will be reduced. Water resources are likely to be further stressed due to the pro-
PART 3. TECHNICAL SUMMARY
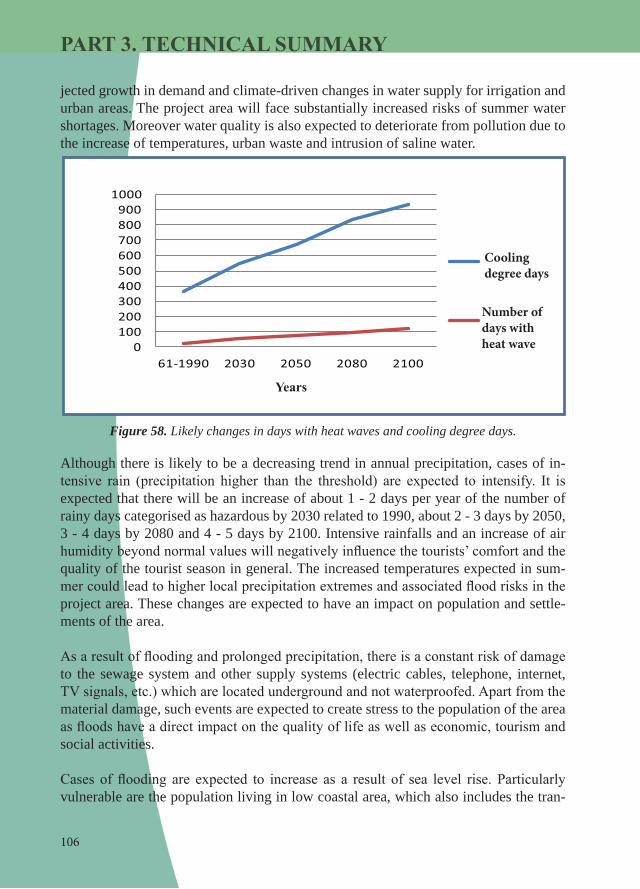
106
jected growth in demand and climate-driven changes in water supply for irrigation and urban areas. The project area will face substantially increased risks of summer water shortages. Moreover water quality is also expected to deteriorate from pollution due to the increase of temperatures, urban waste and intrusion of saline water.
Although there is likely to be a decreasing trend in annual precipitation, cases of in-tensive rain (precipitation higher than the threshold) are expected to intensify. It is expected that there will be an increase of about 1 - 2 days per year of the number of rainy days categorised as hazardous by 2030 related to 1990, about 2 - 3 days by 2050, 3 - 4 days by 2080 and 4 - 5 days by 2100. Intensive rainfalls and an increase of air humidity beyond normal values will negatively influence the tourists’ comfort and the quality of the tourist season in general. The increased temperatures expected in sum-mer could lead to higher local precipitation extremes and associated flood risks in the project area. These changes are expected to have an impact on population and settle-ments of the area.
As a result of flooding and prolonged precipitation, there is a constant risk of damage to the sewage system and other supply systems (electric cables, telephone, internet, TV signals, etc.) which are located underground and not waterproofed. Apart from the material damage, such events are expected to create stress to the population of the area as floods have a direct impact on the quality of life as well as economic, tourism and social activities.
Cases of flooding are expected to increase as a result of sea level rise. Particularly vulnerable are the population living in low coastal area, which also includes the tran-
PART 3. TECHNICAL SUMMARY
0100200300400500600700800900
1000
61-1990 2030 2050 2080 2100
Figure 58. Likely changes in days with heat waves and cooling degree days.
Cooling degree days
Number of days with heat wave
Years

107
sient tourist population. If no further dwellings are allowed to be built in the area, and a “do nothing” approach adopted, the number of dwellings/built structures that will be flooded is expected to double by 2050, to increase 2.5 times by 2080 and triple by 2100. This means that the number of inhabitants of the coastal area in Lezha district expected to be seriously affected by the consequences of floods will be around 275 in 2050, around 470 in 2080, and around 565 in 2100 (figure 59). The road infrastructure along the lowland coastal area and the tourist coastal infrastructure from Shëngjini up to Ishmi (Rodoni Cape) are at risk as well.
Intensified erosion and sea level rise will affect beaches that as well as affecting the physical integrity of the area, which will have a significant impact on the tourist poten-tial of the area, for instance:• Patok beach is likely to disappear completely by 2050, while Shëngjin and Tale
beaches will partially be lost; • Shëngjin beach and a considerable part of Tale beach are expected disappear by
2080; • Tale beach is expected to not to exist by 2100.
Despite the deterioration to the existing beaches, new beaches will be also created that could be used for tourism purposes, but the existing tourism infrastructure will be unlikely to service new beaches, while its substitution will take time and be costly at the expense not only of tourism but also local communities and the regional economy.
PART 3. TECHNICAL SUMMARY
0
100
200
300
400
500
600
2010 2050 2080 2100
Figure 59. Projection of the number of dwellings and inhabitants risked.
dwellingsinhabitants
Years
Num
ber
As a result of sea level rise, saline water will penetrate into the wetlands and Drini i Lezhës, Mati and Ishmi River deltas, as well as agricultural areas and settlements. The presence of saline water for relatively long periods will create conditions for its pen-
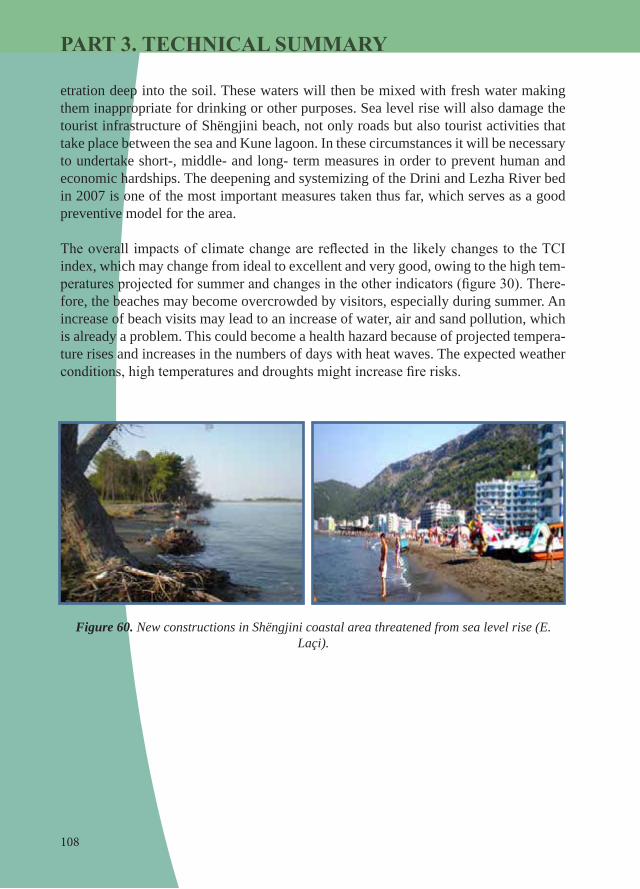
108
etration deep into the soil. These waters will then be mixed with fresh water making them inappropriate for drinking or other purposes. Sea level rise will also damage the tourist infrastructure of Shëngjini beach, not only roads but also tourist activities that take place between the sea and Kune lagoon. In these circumstances it will be necessary to undertake short-, middle- and long- term measures in order to prevent human and economic hardships. The deepening and systemizing of the Drini and Lezha River bed in 2007 is one of the most important measures taken thus far, which serves as a good preventive model for the area.
The overall impacts of climate change are reflected in the likely changes to the TCI index, which may change from ideal to excellent and very good, owing to the high tem-peratures projected for summer and changes in the other indicators (figure 30). There-fore, the beaches may become overcrowded by visitors, especially during summer. An increase of beach visits may lead to an increase of water, air and sand pollution, which is already a problem. This could become a health hazard because of projected tempera-ture rises and increases in the numbers of days with heat waves. The expected weather conditions, high temperatures and droughts might increase fire risks.
Figure 60. New constructions in Shëngjini coastal area threatened from sea level rise (E. Laçi).
PART 3. TECHNICAL SUMMARY

109
PART 4. ADAPTATION RESPONSES
11. INTRODUCTION: PLANNING FOR ADAPTATION
11.1 Background
In common with other areas of the Earth, the viability, development and sustainability of social, economic and environmental systems of the DMRD area are determined by the abilities of these systems to cope with and/or adapt to change. Historic climate variations and recent weather events (e.g. storms, droughts, floods, warming tempera-tures, and changing precipitation patterns) demonstrate the relative and continuing sen-sitivities of social, economic and environmental systems to current climate (an existing adaptation deficit) and signpost that there is a need to consider adaptation in the context of projected changes in climate (UK CIP, 2008). Climate change projections for the DMRD area, including: sea level rise, more frequent and intense floods, aggressive erosion, frequent inundation, and longer submersion of low lying coastal areas, could affect life cycles of species and pose risks of habitat loss and fragmentation of this unique compound ecosystem consisting of sandy dunes, lagoons and coastal wetlands.
An outcome of the studies reported here is that the natural systems of the DMRD will not be maintained, or provide the goods and services that communities depend on, un-der scenarios of climate change and other pressures. Extreme events, intensive floods and storm surges, especially during recent years, are placing additional stress on marine and littoral biodiversity as well as livelihoods of local communities. However, the core pressure faced by the DMRD area, and from which all other pressures are linked, is the aggressive coastal erosion, especially in Kune area, induced by natural and human factors, which are altering the nature of the area and exacerbating habitat damage and losses. The juxtaposition of the natural systems of the DMRD area with anthropogenic alterations represents a classic case of coastal squeeze, where existing and future ero-sional forces that are attempting to realign the shoreline landwards are constrained by the ‘fixed’ boundary of reclaimed land. The consequence is that threats from flooding are further increased placing existing infrastructure and activities at risk, particularly those located closest to the beaches, such as agriculture and tourism facilities. To main-tain the existing ecosystem landscape, and protect the goods and services they provide, adaptation responses will be needed.
11.2 Strategic risk assessment
The studies that have been outlined in Part 3 – technical summary set out the context and evidence base available from which an adaptation strategy may be developed. In general terms an adaptation programme has four inter-related themes/goals to develop:1. Resilient natural environment;2. Resilient infrastructure and buildings;

110
3. Resilient economy; and4. Resilient society
The “Identification and implementation of adaptation response measures in the DMRD” project is focussed on adaptation measures that will lead to a resilient natural environ-ment based on the existing ecosystems of the area. Based on the sectorial analysis of climate change effects, performed by the expert team, a strategic risk assessment with the active participation of local community was undertaken to address the potential impacts of climate change in the DMRD region. The objective of the risk assessment was threefold:1. Identify and prioritise the potential risks of climate change to the DMRD region.2. Identify and prioritise adaptation strategies to address the identified impacts.3. Build capacity of DMRD stakeholders (regional and local) to evaluate the impacts
of climate change and develop adaptation strategies.
The aim was to engage stakeholders throughout the DMRD region in identifying, ana-lysing and evaluating the potential impacts of climate change, with the subsequent task of identifying adaptation strategies to address the identified risks.
A risk assessment template (Microsoft Excel based tool) was developed and applied to undertake the risk assessment. Risk is a combination of consequence and likelihood. Therefore, risk analysis involved establishing the likelihood that the risk will occur, and the consequences of that risk arising. Risks to community, ecosystems and the natural (hydrology) and built environment were considered.
At the first risk assessment workshop10, presentations were delivered outlining pro-jected changes in climate change and the associated impacts that these climate changes may have on the socio-economic and environmental characteristics of the region. Sub-sequently, participants applied their local knowledge to review and add additional risks as appropriate. An important step in the risk analysis process is to consider the con-trols11 currently in place to manage the identified risks. This is important as an identi-fied risk that is currently well controlled through active management actions will, by definition, be less of a management challenge than a un-controlled risk. Consequently, identification of risk controls ensures that any adaptation actions and subsequent imple-mentation plans formulated as a result of the project would be based on up-to-date in-formation that recognises current and pipeline activities. The results of the strategic risk identification and analysis for ecosystems and built environment are shown in table 17.
PART 4. ADAPTATION RESPONSES
10 For more information “Strategic Climate Change Adaptation Plan” at http://www.ccalb.org11 (from 1 to 4) (1) Classification of the possibility of occurrence; (2) Classification of consequences, (3) Risk classification, (4) Control measures.

111
PART 4. ADAPTATION RESPONSES
Table 17. Strategicriskidentificationandanalysisforecosystemsandbuiltenvironment for the DMRD area.
Impact category
Risk ID Consequence Likelihood rating
Consequence rating
Risk rating
Controls
Ecosystems
Population and species extinc-tions Increasing of invasive types
Biodiversity loss Likely Major High 2
Reduced ecotour-ism that indicate to MDGs
Likely Major High 2
Reduced ecosys-tem resilience to stress
Increase in man-agement require-ments
Likely Moderate Medium 2
Increased pres-sure on dunal systems.
Biodiversity loss Almost certain
Major Extreme 2
Reduced recre-ational amenity
Almost certain
Major Extreme 1
Biodiversity loss resulting in regional species endangerment and/or extension.
Almost certain
Major Extreme 2
Increases in ecological distur-bances.
Reduced recreational amenity
Likely Major High 2
Fragmentation of habitats
Increasing main-tenance costs for housing/agricul-tural buildings
Likely Major High 1
Ground subsidence as the ground dries out
Biodiversity loss leading to peril or regional extension of species.
Almost certain
Major Extreme 2
Ecosystems
Salt water intru-sion into wetlands and ground water sources
Increased infra-structure mainte-nance and repair costs to protect from flood and coastal engineer-ing infrastructure.
Almost certain
Major Extreme 2
Increased fire events in forests
Increased erosion Possible Major High 2
Reduced forestry area
Possible Moderate Medium 2
Increased flood intensity
Almost certain
Moderate High 1
Increased emission green gases
Almost certain
Minor Medium 1
Reduced hydro-logical resource
Reduced produc-tion capacity of hydropower plants
Almost certain
Major Extreme 2

112
Impact category
Risk ID Consequence Likelihood rating
Consequence rating
Risk rating
Controls
Built Environment
Flood that caused by damage or destroyed hydrotechnics infrastructure in river and its brunches
Reconstruction and relocation costs for projected area infrastructure (road, paths, etc.)
Almost certain
Major Extreme 2
Repair and recon-struction costs
Almost certain
Major Extreme 1
Reduced freshwa-ter input into eco-systems reduces biodiversity.
Almost certain
Major Extreme 2
Increase cost for managing compliance
Almost certain
Major Extreme 2
Increase river bank ero-sion leading to loss of facilities/infrastructure, e.g. bridges
Reduction of agri-cultural production at buffer zones.
Almost certain
Major Extreme 2
A total of 42 risks across the areas of community, ecosystems, and natural and built environment were identified for the DMRD. Almost one-third of risks were allocated a medium and high risk rating, while the highest percentage of risks (40 %) was extreme. Interestingly, no low risks were identified. These findings are significant in that all risks identified are assessed as requiring some form of management intervention.
Within the ecosystem risk category, pressure on both dune and groundwater systems due to potential climate change impacts were considered significant. Evidently, these two natural systems are currently under considerable pressure across the study area, with intensive urban settlement and agricultural activities. Biodiversity loss and species extinction were considered extreme risks, as was the resulting reduced social amenity. The region’s tourism industry would be impacted by ecosystem changes. The high social value placed on the natural system was evidenced through this ranking. Various impacts in forest areas were not seen as significant ranked as either medium or high. This could partially be due to the reduced ‘visibility’ of the forest system, because they are located in highland areas or at the coastal fringe, and because the settlements are concentrated on the flood plain and reclaimed wetlands.
All risks to the built environment were assigned an extreme risk rating. The Lezhë region contains strong tourism and agriculture sectors, each significantly reliant on maintaining built infrastructure. For example, impacts on coastal and river pathways and roads would restrict the ability for tourists to travel to and from the area. Similarly, it would also impact the supply chain of goods and services needed to supply both these
PART 4. ADAPTATION RESPONSES

113
PART 4. ADAPTATION RESPONSES
industries (tourism and agriculture). Impacts on the built environment due to flooding would also entail a very significant immediate cost, potentially impacting on the abil-ity of affected Communes to deliver existing services. Similarly, costs for managing compliance were ranked as extreme, despite having existing measures already in place (risk control rating 2). The potential loss of infrastructure was also acknowledged as having other flow on impacts, such as reducing existing agricultural buffers, which could further exacerbate infrastructure loss further inland, given the physical setting of the region, with significant land areas only marginally above sea level (from 0-12 m above sea level). The low-lying river plains also contain the bulk of the region’s population due to the low cost of land. Consequently, any additional costs for main-tenance, repair, reconstruction and/or relocation would be a significant burden to each commune.
Community risks were mainly rated as either high or medium. Within this category, impacts on community health, particularly heat related illness, food, water and vec-tor borne diseases, were the most significant. Existing health services have controls in place (risk control rating 3) indicating their ability to cope with increased demand. Resettling displaced populations was seen as a high priority, particularly in terms of supplying goods and services required.
Similarly, all natural environment risks were ranked as extreme. Fresh water availability and quality was a significant risk for the region, given this is an existing issue, which already impacts the tourism sector. In addition, the impacts of altered rainfall regimes on hydrology, and the associated reduction in the capacity of reservoirs may lead to increased pressure to sub-divide land from non-viable farms increasing so-cial tension. Linked closely to these two risks was the legal liability and responsibility for Government to address the issues, particularly given the impact a significant drop in tourism would have on the region’s economy, and flow on impacts to agriculture and other sectors. Water treatment due to increased salinity would be an immediate and significant cost for the region, and was identified as currently having measures in place, but no action (risk control rating 2). The permanent or regular inundation of cur-rent low-lying agricultural areas was assessed as potentially impeding on the country’s ability to reach its millennium development goals, subsequently ranked as extreme.
11.3 Identification of measures that build adaptive capacities
The risk-based approach (described in Section 11.2) was adopted to evaluate the im-pacts of climate change on the DMRD and to define adaptation measures.
Adaptation to climate change is not only about constructing a suite of technical solu-tions but also ensuring that there is institutional capacity to both recognise and imple-ment adaptive strategies. Adaptation responses and decisions are categorized as mea-
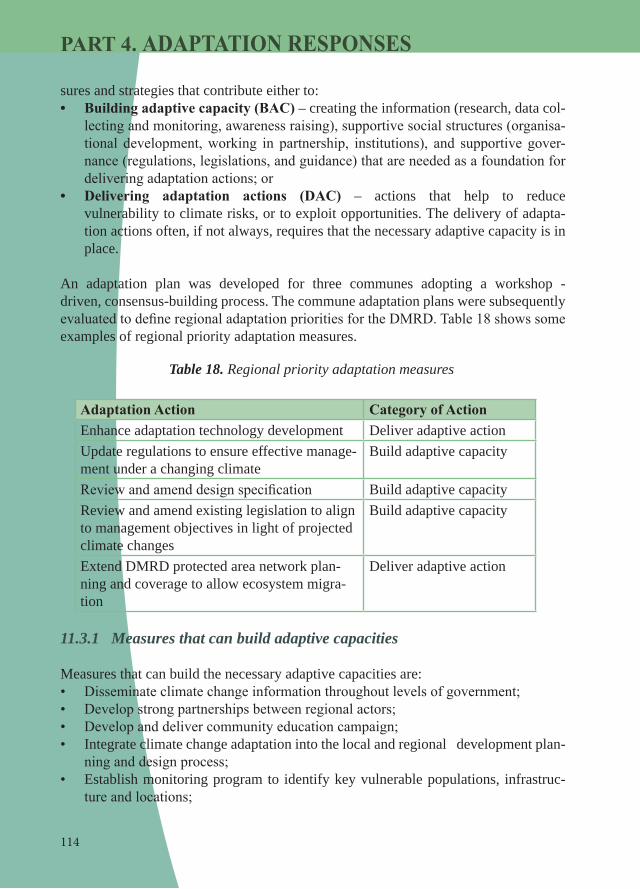
114
sures and strategies that contribute either to:• Building adaptive capacity (BAC) – creating the information (research, data col-
lecting and monitoring, awareness raising), supportive social structures (organisa-tional development, working in partnership, institutions), and supportive gover-nance (regulations, legislations, and guidance) that are needed as a foundation for delivering adaptation actions; or
• Delivering adaptation actions (DAC) – actions that help to reduce vulnerability to climate risks, or to exploit opportunities. The delivery of adapta-tion actions often, if not always, requires that the necessary adaptive capacity is in place.
An adaptation plan was developed for three communes adopting a workshop - driven, consensus-building process. The commune adaptation plans were subsequently evaluated to define regional adaptation priorities for the DMRD. Table 18 shows some examples of regional priority adaptation measures.
Table 18. Regional priority adaptation measures
Adaptation Action Category of ActionEnhance adaptation technology development Deliver adaptive actionUpdate regulations to ensure effective manage-ment under a changing climate
Build adaptive capacity
Review and amend design specification Build adaptive capacityReview and amend existing legislation to align to management objectives in light of projected climate changes
Build adaptive capacity
Extend DMRD protected area network plan-ning and coverage to allow ecosystem migra-tion
Deliver adaptive action
11.3.1 Measures that can build adaptive capacities
Measures that can build the necessary adaptive capacities are:• Disseminate climate change information throughout levels of government;• Develop strong partnerships between regional actors; • Develop and deliver community education campaign; • Integrate climate change adaptation into the local and regional development plan-
ning and design process; • Establish monitoring program to identify key vulnerable populations, infrastruc-
ture and locations;
PART 4. ADAPTATION RESPONSES

115
PART 4. ADAPTATION RESPONSES
• Establish the early warning system for flood and drought;• Provision of seasonal climate forecasts; • Enhance institutional capacity to address climate change adaptation; • Develop strong partnerships between regional actors.
Although there is often a direct focus on programmes and projects to develop the ca-pabilities necessary to develop adaptive capacity such capacity cannot operate without:• An enabling management framework that integrates outcomes within institutional
and governance structures at all levels (local to regional to national to interna-tional), and
• There is a legislative framework that supports and encourages adaptation measures.
11.3.1.1 Developing a management framework for climate change adaptation
The goal of the project is:
“To build adaptive capacities in the DMRD to ensure resilience of the key ecosystems and local livelihoods to climate change by integrating climate change response mea-sures into development programming in the DMRD.”
Achievement of this goal will also provide a wider benefit to the whole of Albania, and requires a robust, integrated and holistic management framework to be successful.
With the emerging necessity to adapt to climate change, countries and communities are starting to design and implement adaptation initiatives of various types, scales, and coverage. These initiatives seek to manage anticipated climate change risks at the national, sub-national and local/community levels. It is important that such initiatives develop systems that cross traditional Government department boundaries otherwise the resulting management responses will be largely sectoral in nature. Such system-wide local capacities should be aimed at analysing, planning, and implementing a range of priority actions that strengthen the resilience of key stakeholders and institutions against anticipated climate change risks. Very often, this entails:• Conducting analyses of the likelihood of associated biophysical and socio-eco-
nomic implications of long-term climate change risks.• Preparing development strategies and plans to include consideration of climate
change risks and opportunities.• Reviewing/revising/designing national and sub-national policies (including ac-
companying legislative adjustments) to take into account climate change risks and opportunities.
• Developing partnerships, tools, and practices to incorporate climate resilience into investment decision-making processes.
• Testing and demonstrating discrete interventions to manage climate risks.

116
ICZM provides a framework of principles and practices that can help achieve and ful-fil these goals. Management of coastal areas involves multiple problems and sources of those problems, and multiple objectives to produce desired (and often conflicting) outputs from the use of coastal resources. ICZM is a continuous, interactive, adaptive, participatory, consensus-building process comprised of a related set of tasks. ICZM can be implemented as a strategic management tool to accommodate different produc-tive capacities over space and time, greater or lesser linkages to upstream areas and, multiple constituencies, stakeholders, and institutions with varying responsibilities for different elements of management. The cycle of management for developing an adapta-tion strategy for climate change shows many similarities with ICZM (figure 61), which is also commonly described as an iterative and cyclical process.
PART 4. ADAPTATION RESPONSES
Source: USAid publication ‘Adapting to coastal climate change a guidebook for development planners’
Figure 61. A coastal adaptation roadmap applies a climate lens to the ICZM policy cycle often used by coastal practitioners.
Step 1
Assessvulnerability
Step 2Select course
of action
Step 3Mainstream
coastaladaptation
Step 4
Implementadaptation
Step 5Evaluate for
adaptivemanagement
More sustainable forms of coastal development
Issue identification and assessment
Program preparation
Formal adoption and funding
Implementation
Evaluation
Progressively larger cycle loops indicate growth in project scope
Communities and policy-makers are faced with three choices in order to remove or reduce the threats posed by climate change: They can either:• Avoid having to deal with the problem and prevent making a response, i.e. retreat
and abandon threatened areas; or• Ameliorate change by taking actions to permanently eliminate or reduce the long-
term risk and hazards of climate change to human life, property; or• Adapt by adjusting to climate change (including climate variability and extremes)
in order to moderate potential damage, to take advantage of opportunities, or to

117
PART 4. ADAPTATION RESPONSES
cope with the consequences.
It is widely accepted that climate change is inevitable and cannot be now prevented. Many studies have shown that a “do nothing” option will be much more expensive than other options which attempt to address the challenges of climate change through either mitigation and/or adaptation (figure 62).
Adaptation and adaptive capacity is perfectly compatible with the goals of an ICZM process. The challenge of climate change needs to be addressed inter alia through in-tegrated and ecosystem-based approaches and instruments, such as ICZM or green infrastructure. These are crucial to build the foundations for sustainable coastal management and development, supporting socio-economic development, biodiversity and ecosystem services.
Figure 62.The mitigation and adaption framework, which is the recognized conceptual model for society’s response to climate change. Mitigation represents actions we take to reduce the emission of greenhouse gases like carbon dioxide into the atmosphere. Adaptation is the action we take to respond to climate change, such as relocating highways and communities.
ICZM is an acknowledged tool to deal with current and long-term coastal challenges, including climate change and its impacts (for instance sea-level rise, changes in storm frequency, strength and patterns and increased coastal erosion and flooding). In 2002, the EU’s ICZM Recommendation referred to the threat to coastal zones posed by cli-

118
mate change as the basis for a strategic approach on ICZM.
The ICZM approach creates a constructive dialogue between the interests of authori-ties and multiple user-groups. It also prepares government representatives and other relevant actors for developing effective environmental legislation within their jurisdic-tions. Given the scale of tourism in Mediterranean coastal zones, one of the greatest challenges faced by coastal managers is giving tourism development a proper place within integrated coastal management in order to increase its long-term sustainability.
ICZM is carried out through a process which, generally, has three major stages:• Initiation, which includes analysis of triggering factors which could strengthen
public awareness of coastal issues and the need to take actions in coastal areas;• Planning, which refers to the development of policies and goals, and the selection
of concrete sets of actions (strategies) to produce the desired mix of goods and services from the coastal area over time; and
• Implementation, which is the vehicle through which the plan is put into effect.
Tools such as Strategic Environmental Assessment (SEA), Carrying Capacity Assess-ment (CCA), Environmental Impact Assessment (EIA), sustainability indicators, etc., each applied at the proper stage of ICZM for planning and within a well-defined regu-latory and legislative framework, provide a foundation for sustainable development.
11.3.1.2 Institutional strengthening for ICZM and climate change adaptation
Often a perceived answer to the challenges of managing coastal zones and/or climate change is a bespoke national law. However, structuring such laws is difficult because it would have to intricately link in with a wide range of existing policy and law, unless existing laws were to be themselves significantly altered or annulled. In the case of Al-bania there are a comprehensive set of laws that could be amended/added to in order to develop a coastal management and climate change nexus (see section 2.6.3).
In common with other environmental issues, adaptation to climate change are cross-cutting issues, that involve a number of institutions at the central and local level, but also a number of different structures within each institution. This suggests that what is needed is not a new law that supersedes existing legislation, but, rather, new legislation that seeks to make the existing legislation work in a more effective and efficient manner promoting cooperation and coordination between implementing agencies. Integrated management, as implicit in ICZM, “is not a substitute for sectoral planning, but avoids fragmentation by focusing on the linkages between different sectors. To this end, a framework is needed that aims to govern sectoral policies according to three major di-mensions: (1) preserving natural and cultural heritage, (2) managing coastal activities,
PART 4. ADAPTATION RESPONSES

119
PART 4. ADAPTATION RESPONSES
and (3) addressing risk. Such a framework would require all Government Ministries, Departments and other Agencies to inculcate principles of ICZM within their planning and execution of responsibilities.
The ICZM Protocol of the EU Barcelona Convention, and in particular Article 6, is designed to stimulate national, regional and local initiatives through coordinated pro-motional action, cooperation and partnership with the various actors concerned with a view to promoting efficient governance for the purpose of ICZM. Although ICZM has been identified as an appropriate tool/instrument for the planning and management of the coastal zone to deliver robust spatial planning and climate change adaptation, there is not yet established the necessary legal and regulatory frame for this and there is no obvious organisation to act as their “champion”. Although a champion is a necessary prerequisite for ICZM to become an accepted practice, the reality is that it must become adopted across all government agencies, although this does not necessarily have to be under the “label” of ICZM so long as its principles and practices are inculcated within the working of government.
Institutional development needs to be focussed on integration, which has several di-mensions:• Inter-sectoral integration - integration among different sectors involves both “hori-
zontal” integration among different coastal and marine sectors (e.g., oil and gas development, fisheries, coastal tourism, marine mammal protection, port develop-ment) and integration between coastal and marine sectors and land-based sectors that affect the coastal and ocean12 environment, such as agriculture, forestry, and mining. Inter-sectoral integration also addresses conflicts among government agen-cies in different sectors.
• Intergovernmental integration - integration among different levels of government (national, provincial, local). National, provincial, and local governments tend to play different roles, address different public needs, and have different perspectives. These differences often pose problems in achieving harmonized policy develop-ment and implementation between national and sub-national levels.
• Spatial integration - integration between the land and ocean sides of the coastal zone. There is a strong connection between land-based activities and what hap-pens in the ocean involving water quality, fish productivity, and similarly, all ocean activities are based or dependent on coastal land. Different systems of property ownership and government administration predominate on the land and ocean sides of the coastal zone, often complicating the pursuit of consistent goals and policies.
• Science-management integration - integration among the different disciplines im-portant in coastal and ocean management (the natural sciences, the social sciences, and engineering) and the management entities. Although, the sciences are essential
12 In this case “sea”

120
in providing information for coastal and ocean managers, there often tends to be little on-going communication between scientists and managers. (Here, the sci-ences refer mainly to the natural sciences concerned with the oceans and coasts, such as oceanography, coastal processes, and fishery sciences; the social sciences, concerned with coastal human settlements and user groups as well as management processes that govern ocean and coastal activities; and coastal and ocean engineer-ing, which focuses on all forms of coastal and ocean structures.)
• International integration - integration among nations is needed when there are international disputes over fishing activities, trans-boundary pollution, establish-ment of maritime boundaries, passage of ships, and other issues. Although in many instances, coastal and ocean management questions are within the purview of na-tional and sub-national governments within national jurisdiction zones (200 nauti-cal mile EEZs, extended fishery zones), in many other cases, nations face ocean and coastal management problems with respect to their neighbours and thus need internationally negotiated solutions. Typically, the national government plays the leading role in such negotiations.
11.3.1.3 Developing a legislative framework for climate change adaptation
There are two policy responses to climate change, mitigation and adaptation. Mitiga-tion addresses the root causes, by reducing greenhouse gas emissions, while adapta-tion seeks to lower the risk posed by the consequences of climate change. The focus of this project is on adaptation. The most important legislation relevant to adapta-tion to climate change in Albania is that which includes clauses that aim to provide a protection from climate change impacts. At the European level legislation is present for mitigation but not for adaptation, although preparatory documents for future legisla-tion are available. Consideration of current and future developments by the European Economic Commission (EEC) is important given the accession process that Albania is currently undertaking. However, an assessment of protocols under the mandate of the UNFCCC and the EU Barcelona Convention, in particular those parts relating to the ICZM Protocol to which Albania is a signatory, do provide a direction for future legis-lative development in support of climate change adaptation.
It is not within the authority of the current project to determine directly legislative development. However the project has made an assessment of existing legislation to make recommendations of those areas of legislation that, if amended, would better sup-port the protection of areas, such as the DMRD. The recommendations are designed to ensure that natural ecosystems are more resilient to the impacts of climate change and therefore better able to protect socio-economic systems. These can be divided into those changes required in the short term and those required in the longer term (table 19).
PART 4. ADAPTATION RESPONSES

121
PART 4. ADAPTATION RESPONSES
Table 19. Suggested additions/amendments to legislation
Implementing authority
Relevant law Notes
Short term optionsMoEFWA n/a Draft a new law to ensure the proper
implementation of the requirements of ICZM protocol
MoEFWA draft Law dt.28.02.2011 “On strategic envi-ronmental assessment”
Include SEA methodology so that climate adaptation needs must be included in the SEA reports
MoEFWA Law no. 10 440, dt.7.7.2011 “On envi-ronmental impact assessment”, article 7, paragraph 4 (EIA procedures)
Climate adaptation needs must be included in the EIA reports
MoEFWA & Others
Law no.8756, dt.26.3.2001 “On civil emer-gencies”, Article 8.e
Draft cross-cutting National Adapta-tion Strategy to Climate Change
MoI Law no.8756, dt.26.3.2001 “On civil emer-gencies”, Article 12.1
Add “Ministry of Interior requests the performance of assessment studies on the climate impact on the physical geography, ecosystems, environment, economic and social aspects”
MoEFWA Law no.10431, dt.9.6.2011 “On environ-mental protection”, Article 20 (Climate change)
Add “adaptation must be main-streamed into all existing sectorial and inter-sectorial strategies”
MoEFWA Law no.8906, dated 6.6.2002 “On pro-tected areas”, Article 15
Add that “management plans for each protected area take into consideration adaptation to climate change”
MoEFWA DCM no.266, dt.24.4.2003 “On the admin-istration of the protected areas”, Point 4
Extend the list of duties of the admin-istration of PAs with “requirements related to preventive, protective and adaptation measures to climate change”
MoEFWA DCM no.532, dt.05.10.2000 Include climate adaptation issues in the text of the revised biodiversity strategy
MoEFWA n/a Draft two Orders of the Prime Min-ister: • on the Establishment of the
Environmental Inter-ministerial Committee; and
• on the Establishment of the Inter-ministerial Expert Group on Climate Change.

122
Implementing authority
Relevant law Notes
Longer term optionsMoI Law no.8756, dt.26.3.2001 “On civil
emergencies”, Article 8.eAdd amendments:• risk assessments are to be made
following the European risk as-sessment methodologies.
• European risk assessment methodologies are adopted upon Guideline of the Minister of Interior.
MoI Law no.8756, dt.26.3.2001 “On civil emergencies”, article 11.2.b
Add amendments:• “the measures to be taken to
prevent and protect against the consequences of natural disasters in the area of responsibility of each ministry are defined based on the best practice”.
• a definition of what is meant by “best practice”
• guidance documents on “best practice” are to be approved by guidelines of the Minister of Interior.
MoPWT/ NTPA Law no. 10 119, dt. 23.4.2009 “On ter-ritorial planning” (amended), articles 22, 25, and 33.2
Draft Planning Regulations and Con-struction Regulation that transpose design standards that reflect the need for adaptation to climate change
MoPWT/ NTPA Law no. 10 119, dt. 23.4.2009 “On ter-ritorial planning” Article 13.2 (Functions, competencies of the local government)
Draft local planning instruments that introduce the detailed standards of development control and control the implementation of national and local planning instruments in their administrative territory that include the standards required for adaptation to climate change.
PART 4. ADAPTATION RESPONSES
From an institutional perspective a number of changes would make organisations better able to manage the process of adaptation to climate change, namely:• Introduce the DMRD Integrated Monitoring Program into the National Monitoring
Program,• All institutions involved with adaptation to climate change should shift focus on
prevention, forecasting, planning, impact studies, rather than on intervention and rehabilitation of damages, and amend job responsibilities accordingly,

123
PART 4. ADAPTATION RESPONSES
• Cooperation should be arranged between the structures dealing with risk assess-ment, economic assessment of impacts, etc. with the insurance companies, in order to improve their technical skills in this respect,
• Each ministry whose policy and field activity needs to adapt to climate change should appoint at least one permanent focal point on climate change to be included in cross-ministerial structures.
This package of changes is required to ensure that, through the framework of ICZM, governance and institutional structures for the DMRD area, and more widely across Albania, are able to respond to the challenges of climate change and develop the neces-sary adaptation strategies.
11.4 Identification of measures that deliver adaptation options
In order to ensure that the environment of the DMRD area can be resilient to the pres-sures of climate change adaptation measures need to be applied that consider all the features of the DMRD area, and the associations between different elements and ac-tivities of the area. In the context of the aims and objectives of this project, adaptation measures should principally be directed towards management interventions that ap-ply ecosystem-based adaptation (EbA). To ensure that the ecosystems and local liveli-hood of the DMRD are more resilient to climate change, EbA is combined with a set of “hard”/engineering restoration measures. In addition, a series of community-based adaptation measures to deal with disaster risk related to climate are proposed as well.
11.4.1 Ecosystem-based adaptation measures
EbA uses biodiversity and ecosystem services as part of an overall adaptation strategy to help people and communities adapt to the negative effects of climate change. In addition, EbA can provide other benefits to communities, for example, through the maintenance and enhancement of ecosystem services crucial for livelihoods and human well-being, such as clean water and food. Appropriately designed ecosystem manage-ment initiatives can also contribute to climate change mitigation by reducing emissions from ecosystem loss and degradation, and enhancing carbon sequestration. The design and implementation of adaptation measures using the EbA approach is a key goal of the project.
In the following sections adaptation measures have been identified as challenges for maintaining and ensuring the integrity of ecosystems DMRD area and the services they provide. These challenges focus on how we can maintain the physical integrity of bor-der land / sea and lagoon systems, and focuses on addressing three key issues that need to be resolved through technical measures in the coastal adaptation:

124
• Coastal erosion caused by poor supply of sediments along Shëngjin littoral cells Kune and Vain-Patoku and deterioration in the future of climate change leading to loss of habitat and the potential destruction of wetlands;
• Poor communication between the future through tidal channels, due to the filling of sediments transported along the coast and the lack of an adequate tidal channel to keep it open. This can lead to eutrophication, the rate of which is exacerbated by uncontrolled discharges of wastewater in lagoons from pumping stations;
• Increased sea levels in the future, causing floods and coastal wetland areas lost due to ‘narrowing’ of the coast, and increasing the risk of flooding from the sea.
The results of cost-benefit analysis of the implementation on the ground of these mea-sures are presented in section 13.1.
11.4.1.1 Coastal erosion
The main coastal erosion issues of the DMRD are confined to the sediment starved Shëngjini, Kune and northern Vaini-Patok littoral cells. The southern Vaini-Patok lit-toral sub cell is healthier because sufficient sediment enters the coastal zone from the Mati River despite the extraction of gravels (and sands) from the river bed. There are three main approaches to mitigate coastal erosion in the Shëngjini, Kune and northern Vaini-Patok littoral cells that could be considered (figure 63):
• Eliminate factors that exacerbate erosion such as reintroducing sediment to the coast down the Drini River and removing the Drini River breakwater;
• Beach restoration strategies particularly beach nourishment and dune management to slow erosion rates; and
• Structural methods of sand retention.
Methods to achieve these approaches are described in the following sub-sections.
PART 4. ADAPTATION RESPONSES

125
PART 4. ADAPTATION RESPONSES
Figure 63.
Potential manage-ment options for sediment manage-ment and water ex-change in the DMRD
Beach nourishment with groyne field (only after applied studies and EIA)
Construction of terminal groynes on either side of channel (only after feasibility studies and EIA)
Remove the Drini River break-water (only after EIA) and re-introduce maintanance dredging of river mouth
Dune grass planting phased in after beach nourishment
Breach the embankment dividing Zaje and Ceka Lagoons
Construct moving gate across channel between the Drini River and Zaje Lagoon
Cut direct channel through to Ceka Lagoon and maintenance dredge
Part fill the old exchange channel
N
Lagoons and Watercourses
0 1 2 km
Re-introducing sediment discharge from the Drini River
Only a very small proportion of the Drini River discharge enters the DMRD along the Drini “Lezha”. Most of the flow discharges along the Drini “Shkodra”. The paucity of new sediment entering the coastal system from the Drini “Lezha” is the main reason for the dominance of erosion along the Shëngjini, Kune and northern Vaini-Patok littoral cells. To re-introduce greater volumes of sediment to the DMRD from the Drini River would require management of the river system higher in the catchment to allow greater discharge.

126
Remove the Drini River breakwater
The Drini River breakwater was built between 2007 and 2009 on the south side of the river mouth to provide a barrier to northerly directed longshore sediment transport and to allow maintenance dredging of the river mouth to stop. Before construction, sand extracted from the mouth was piled on the north shore of the channel from where it was transported by waves north along Kune Beach. This barrier to sediment transport has had detrimental environmental impacts further downdrift. In September 2009, Kune Beach was breached because of a sand deficit creating a second entrance to Merxhani Lagoon, which acted as a partial barrier to sand reaching the recurve spits of Kune Island.
Removing the Drini River breakwater would be an indirect form of sediment manage-ment, because sand would be allowed to transport north into and across the Drini River mouth to feed Kune Beach and Kune Island. Beach nourishment
Beach nourishment is the introduction of sand on to a beach to supplement a diminished supply of natural sediment, for the purpose of beach restoration, enhance-ment, or maintenance. This is considered an appropriate measure along the DMRD because the Kune-Vaini beaches are experiencing losses of sediment with a natural shortage of incoming sediment for replacement. Three areas of critical erosion are lo-cated along the Kune-Vaini stretch of shoreline; fronting north Merxhani Lagoon, south Merxhani Lagoon and Zaje/north Ceka Lagoons, where healthy beaches are especially important for preservation of the lagoons and as recreation and tourism facilities.
Although the need for nourishment is urgent, there is insufficient data on sediment characteristics, beach morphology and environmental impacts for the proposed nour-ishment to be implemented.
Although North Tale Beach is eroding, it is not considered necessary to implement beach nourishment at this stage, for two main reasons:• The beach has a relatively wide buffer of forested dune area behind it, which is
providing adequate protection to Ceka Lagoon; and• Addition of more sand would not integrate effectively with other management rec-
ommendations for this stretch of shoreline including maintaining water exchange through the tidal channel between the lagoon and the Adriatic Sea.
Two different beach nourishment approaches could be adopted along Shëngjini Beach and Kune Spit: (i) subaerial placement (on beach), and (ii) nearshore placement (in surf zone). Obtaining a sufficient volume of appropriately sized sand free from con-
PART 4. ADAPTATION RESPONSES

127
PART 4. ADAPTATION RESPONSES
taminants will be a fundamental requirement of the beach nourishment activities under consideration along the DMRD.
Once the characteristics of the sand for nourishment have been established, then poten-tial sources need to be investigated. Given the lack of sand available in the Kune-Vaini coastal system and the importance of the relatively abundant sand for beach health in the Vaini-Patok littoral sub cell, suitable sources will need to be found elsewhere. There are several possible sources of sand for beach nourishment along the DMRD, which would require further investigation:• offshore seabed sand deposits;• areas of excess sediment such as ports and harbours, where sand must be removed
to restore function; and• flood control and hydro-electric power projects such as dams and reservoirs where
sand may become available as a result of dredging or excavation to restore capac-ity.
The design of any beach nourishment scheme along the DMRD should aim to create a beach width and profile that is able to provide protection during a severe storm. Allowance would also need to be made for the likely losses of beach sand over time due to longshore transport and cross-shore losses. A balance would also need to be struck between the volume of sand placed initially and future maintenance (“top-up”) commitments.
A strategy to mitigate placement impacts should be a key objective of the design at the DMRD. Impacts of beach nourishment can occur at the site where the sand is placed as a direct impact and as an indirect impact through dispersal of the sand by alongshore, cross-shore, or wind-driven transport. Impacts to biological resources can be classified into three major categories:• impacts directly related to the construction phases of a nourishment project;• impacts related to the characteristics of the sediments used; and• impacts related to the quantity of sediment applied.
Dune management
Dune environments are present along the entire DMRD coastline where they form a narrow strip behind the beaches. They comprise two forms: embryonic dunes with limited vegetation and dunes artificially planted with pine tree woodland in the 1970s. The dunes of the Shëngjini and Kune littoral sub cells are eroding concomitant with the erosion of the beaches, with stumps of pine trees partial submerged beneath the advancing Adriatic Sea, particularly along Kune Spit. The negative sediment budget between the beach and the dunes could potentially be reversed by the implementation of beach nourishment. Grass planting of the dunes which have suffered the greatest ero-
128
sion could be undertaken (after beach nourishment has been implemented).
Structural methods of sand retention
A fundamental consideration of the DMRD nourishment scheme is the likely stability of the resulting beaches for how long will the nourishment improve them. Along the DMRD, there is a long-term process of longshore sediment transport that will cause sand loss and simply adding extra sand will not prevent that loss continuing. Indeed, the longshore transport process is the main mechanism for loss of the beaches in the first place. So, it is likely that similar repeat nourishment operations would be required in the future unless measures are implemented to reduce sand losses, such as installation of groynes.
11.4.1.2 Water exchange
The limited exchange of water through tidal channels between the Adriatic Sea and the lagoons is a problem common to the entire DMRD. In order to avoid potential eutro-phication in the lagoons the tidal exchange needs to be improved significantly over the current situation. Four adaptation measures are considered:• Structural methods to restrict sediment accumulation in the channels;• Regular maintenance dredging of the channels to maintain functionality;• Increasing lagoon tidal prism and current flow (and hence scour) through the tidal
channels by managed realignment of landward agricultural areas; and• Controlled discharge of polluted water from the pumping stations.
Tidal channel maintenance
The three main lagoons of the Kune and northern Vaini-Patok littoral sub cells are con-nected to the Adriatic Sea through tidal channels of varying length and width. Merxhani Lagoon exchanges water through an 800 m long tidal channel located between two diverging spits (Kune Spit and Kune Island). Additional exchange with the sea is cur-rently taking place through the Kune Beach breach south of Kune Island. Exchange of water with Zaje Lagoon takes place via a small channel connected to the Drini River. Ceka Lagoon is connected to the sea through a meandering 3,000 m long channel in-land of North Tale Beach. There is no water exchange between Zaje and Ceka Lagoons because the original connection through a gate is now closed. The main problem with the connections between Merxhani and Ceka Lagoons and the Adriatic is their limited exchange of water and their potential to close due to infilling with long-shore trans-ported sand. Indeed, several artificial cuts have been made through the beaches in the past to improve water exchange, but these have been in-filled with sediment.
PART 4. ADAPTATION RESPONSES

129
PART 4. ADAPTATION RESPONSES
Management of Merxhani Lagoon tidal channels - The two spits (Kune Spit and Kune Island) bounding the main tidal channel to Merxhani Lagoon will continue to converge resulting in narrowing of the channel and potential closure. In order for water exchange to continue the cross-sectional area of the tidal channel has to be maintained.
Management at Ceka Lagoon tidal channel - The Ceka Lagoon exchange channel is located across Tale Beach at a location where the sediment transport regime is com-plex. Construction of terminal groynes is not considered to be an appropriate solution, because of the complexity of the sand transport system and the potential for detrimental effects of sand starvation north and/or south of any fixed entrance. A combination of cutting a new artificial straighter and shorter tidal channel with periodic (and poten-tially regular) maintenance dredging would therefore be preferred. The dredged sedi-ment could be beneficially used at eroding beach locations in the Kune and northern Vaini-Patok littoral sub cells.
Management of Zaje Lagoon - Even though Zaje and Ceka Lagoons are adjacent to each other they are not connected, so water exchanged between the Adriatic Sea and Ceka Lagoon cannot enter Zaje Lagoon. Instead, the only connection with the sea that Zaje Lagoon has is through a narrow artificial channel connected to the downstream end of the Drini River. Hence, the exchange of water is generally restricted and is much fresher than water that would enter the lagoon if it was connected directly to the sea.
Management of outer Patok Lagoon - Outer Patok Lagoon is a recent (last few de-cades) feature formed behind converging spits from the north (Mati River) and south (Ishmi Beach). The development of the outer lagoon is in its infancy and is going to be unpredictable into the future given the dynamic nature of sediment supply from the Mati River. Implementation of adaptation measures would be premature at this stage because the spit-lagoon system is still migrating towards its equilibrium morphology.
Increasing lagoon tidal prism - In order to naturally maintain the shape of the ex-change channels would require that the tidal flows entering and leaving the lagoons be powerful enough to scour longshore transported sand that fills them in. In order to increase the velocities of these flows would require a significant increase in the tidal prism of the each lagoon.
11.4.1.3 Sea-level rise
There are two main potential impacts of future sea-level rise. First, habitat will be lost through inundation because the accretion of sediment in the DMRD wetlands is unable to keep pace vertically with sea-level rise. This situation will be exacerbated by loss through coastal squeeze where a combination of sea-level rise, reduced sediment sup-ply and the presence of embankments to protect agricultural land and settlement, do

130
not allow the habitats to migrate inland. Second, agricultural areas will be at increased risk of coastal flooding because of higher water levels. In order to mitigate the trend of habitat loss and reduce flood risk, two adaptation options could be considered:• Restoration of agricultural areas to restore functioning wetland (saltmarsh) habitat
to replace that lost and provide a flood defence function; and• Maintenance and upgrade of flood embankments.
Saltmarsh restoration and flood defence
The overall conclusion, that wetland habitat will be lost due to inundation and coastal squeeze, is valid. Hence, adaptation measures to mitigate the loss of habitat could be considered, including wetland restoration.
Maintenance of embankments
Given the uncertainty regarding the feasibility of realignment, it seems likely that most of the embankments that serve a flood defence function across the DMRD will be left in place, at least in the short term. A condition assessment of the flood embankments surrounding the DMRD could be made and appropriate enhancements considered.
Critical data gaps
The critical areas where data is needed to inform the options for saltmarsh restoration and flood defence are: bathymetric and topographic data; an assessment of the func-tioning saltmarsh in the DMRD including detailed habitat mapping, quality of habitat, and the driving physical and ecological processes; compilation of accurate flood risk maps from topographic and tidal/sea level data; and condition assessments of the exist-ing coastal flood embankments and a plan for their up-keep.
11.4.2 Community-based adaptation measures
Figure 64 summarizes proposed adaptation measures identified by community consul-tations as well as assessments provided by project sector experts in their final reports. Through consultation each commune determined a preferred set of adaptation mea-sures:
SHËNGJINI Commune• Increase the efficiency of drainage canals network (Immediate & continuous
maintenance (every 2-3 years) (22)13.
PART 4. ADAPTATION RESPONSES
13 Number in parentheses correspond to the adaptation measures in figure 64 and table 20.

131
PART 4. ADAPTATION RESPONSES
• Increase pumping station capacity at Ishull Shëngjini (but expected negative im-pact at lagoon habitats) (22)
• Expand the wastewater treatment system for the entire Shëngjini Commune (21)• Upgrade the embankment along Merxhani Lagoon (15)• Increase/upgrade the road sub-base embankment height of Shëngjin – Kune road
(16)• Reforestation (19)
SHËNKOLLI Commune• Repair both sides of the Mati River embankments (13)• Increase efficiency of drainage canals network (23)• Increase/upgrade the road sub-base height at Tale (17)• Reforestation (19)• Regeneration of riverine habitats (18)• Controlled extraction of gravel from river beds • Increase the capacity of Tale pumping station (23)• Build second embankment next to Tale village (18)
FUSHË KUQE Commune• Repair and increase the height of +30 cm along the Mati River embankment (two
options) (18)• Increase the efficiency of drainage canals network (12)• Establish an embankment and a pumping station in the upper part of Alku
village (habitats’ rehabilitation with riparian forests) (19)• Establish a new embankment and reforest the area in front of Fazaneria forest (19)

132
Figure 64. Proposed community adaptation measures at DMRD area. Source: National Conference of DMRD Project”.
PART 4. ADAPTATION RESPONSES

133
PART 4. ADAPTATION RESPONSES
These measures were analysed for their potential cost-benefit to provide the results for each commune given in table 35 (section 13.5.2).
The logic of these values is that the value of avoided damage costs (household flooding and lost crops) represents that benefit to be gained from undertaking adaptations.
12 . IMPLEMENTING ADAPTATION
Although the identified ecosystem-based and community adaptation measures could potentially address the threats to the ecosystem integrity of the DMRD area, they can-not be considered in isolation when determining appropriate adaptation measures, but need to be planned in conjunction with the existing and planned future socio-economic setting of the region. In the case of the DMRD area, socio-economic factors that need to be considered include: (i) population and settlements, and the principle economic activities of (ii) agriculture and (iii) tourism.
However, these measures are effectively a “wish list” and in reality, in common with other regions and other situations, it is not possible to simply implement everything that could be wished, amongst other reasons, often simply because of financial constraints. Therefore, potential measures have to be prioritised according to the funds available and the impact they will provide.
12.1 Principles to establish a system for prioritising adaptation measures
A core element of the DMRD project is to prioritise identified measures and classify them as short, medium and long term measures. Prioritisation has taken into account the interests and concerns of all stakeholders and may involve a single directive (e.g. habitat protection), a specific sector (e.g. climate) or a combination of sectors/direc-tives. Criteria used to determine the priorities were weighted in a way that they could be adjusted and evaluated through sensitivity analysis to account for both technical and geo-political considerations.
Prioritisation of adaptation measures for the DMRD project for short (within current project life time), medium and long term aimed to:1. A robust system for implementation based on transparent criteria.2. Be considered against alternative investment scenarios governed by: a) Climate change project considerations, such as environment versus other local sector needs investments. b) Targets such as environmental, economic or social. c) Time line, such as readiness to start, rapid “no regret” measures, etc.3. Address the question of either integrated or separate priorities for:

134
d) Coastal line protection. e) Biodiversity protection (mainly related with coastal wetlands). f) Community wealthy investments (based on climate change impacts).4. Be built up in a way to allow for rolling updating, e.g. in accordance with the
rolling Albanian Environmental planning process.5. Be comprised of several individual project measures per specific requirements/
obligations and category of investment.
The prioritised system has to reflect the efforts of Albania in moving towards EU ac-cession. The system should serve as a basis regarding priorities and timing of necessary investments in order to comply with the EU legislation in the environmental sector in the future. The prioritised system reflected the outcomes from other studies carried out as part of the DMRD project:• Identification of adaptation measures on the ecosystems, agriculture, hydrology,
tourism, flooding protection, etc.• The coastal geomorphology on the DMRD conceptual model of shoreline change.• Cost-benefit analysis.• Map of climate change risk in the coastal area of DMRD.• Institutional capacities are evaluated locally and nationally.• Proposals for improving the capacity to address climate change risks and adapta-
tion.
This included close cooperation with the MoEFWA, Lezha Regional Council as well as the three communes within the project area (Shëngjin, Shënkoll and Fushë-Kuqe).
12.2 The prioritized system
They determined 23 scoring criteria grouped under five headings (Annex 3). For each possible adaptation measure a subset of typically five to ten relevant criteria were used. The heading criteria are:1. Financial Indicative Cost - covering the secured and estimated cost and expendi-
ture associated with the project and the sources of finance.2. Time Frame Criteria - measure or action in question to the time implementation
planning, that may impact on the timing or success of a proposed project.3. Potential Partnership - particularly in relation to support for or opposition to a
proposed project and mobilization of additional funds.4. Principle of Additionality Criteria - that assesses existing institutions or related ac-
tivities//measures projects that could not consider climate change issues and could provide additional values.
5. Win-Win Criteria - covering the wider economic framework (costs, benefits and affordability), relating directly to the nature of the project and how it can be imple-
PART 4. ADAPTATION RESPONSES

135
mented successfully to increase the resiliency of ecosystems and protection of the community.
12.3 Approach to prioritisation
Three main grouping measures were evaluated under the Prioritization System:• Hard infrastructure restoration measures (adaptation measures proposed by project
experts), described in section 11.4.1.• Hard Infrastructure Restoration Measures proposed by Community and interesting
partners, described in section 11.4.2.• Soft Measures - a third category of measures called “Soft Measures” was selected
by the PCU team in close cooperation with stakeholder institutions that reflect mea-sures designed to build adaptive capacity.
12.4 Results of prioritisation analysis
The applied Prioritization System led to the following scoring for the Coastal Restora-tion Measures (table 20).
These scores represent an assessment of the technical feasibility and an evaluation of the likely impact value of each of the identified measures.
PART 4. ADAPTATION RESPONSES

136
Table 20. Prioritization scoring of coastal restoration measuresNo Measures Points (Classifi-
cation)Location /Comments
A- Measures proposed for protecting of ecosystems and community1 Beach nourishment (dune con-
struction and restoration)12 1. Kune beach;
2. Merxhani beach;3. Zaje beach
2 Restore the dune (planting) 16 Potential pilot area for imple-mentation
3 Restore the dune (planting) 21 Vain (coast)4 Construction of groyne field -
Merxhani lagoon10 Shëngjini beach/Kune
5/a Construction of terminal groynes in both sides of the communica-tion channel sea - lagoon
11 Communication channel of Merxhan (Kune spit),
5/b Construction of terminal groynes - both sides of the communica-tion channel sea - lagoon
15 Ceka lagoon
6 Ceka lagoon tidal inlet cut and fill
15 Ceka lagoon
7 Maintenance dredging of Ceka lagoon inlet
14 Ceka lagoon
8 Moving gate at Drini River – Zaje lagoon inlet
16 Communication channel between Drini River – Zaje Lagoon
9 Breaching Zaje – Ceke lagoon embankment
15 Zaje-Ceke Lagoons
10 Bridge over Zaje – Ceka lagoon breach
16 Communication channel Vaini area
11 Removal of Drini River break-water
14
B- Measures proposed for protecting of community12 New wells over the PA Kune-
Vain and Patok11 Kune island, Vaini and Patoku
area.13 (F2)
Reconstruction of embankments within and on the both sides of Mati River
15 Along Mati River, (field area to delta)
14 (B)
raise level/maintenance of the embankment (continuous)
14 Embankments of Shëngjini Island
15 (C)
Raise road level up to 100 cm - embankment.
14 Shëngjini island road (Stom area)
PART 4. ADAPTATION RESPONSES

137
PART 4. ADAPTATION RESPONSES
No Measures Points (Classifi-cation)
Location /Comments
16 (E)
Raise level/maintenance of the embankment
14 Embankments of Kune/ Merxhani lagoons.
17 (F1)
Raise road level up to 30 cm and maintenance of the embankment
14 Tale – border of protected area
18 (L)
Raise embankment level 14 In both sides of the water flow and at the delta of Mati river
19 Reforestation of PA (pilot sites) 12 Parcels 1 and 2 (Vain) and in north of Tale hidrovor (Vain), in west of Alku (Fushë Kuqe).
20 Rehabilitation of channels con-necting the water bodies within the Kune lagoon.
11 Kune island
21 Waste water treatment. Decen-tralized waste water treatment plants in Commune level.
16 Whole area of DRDM includ-ing three Communes Shëngjin, Shënkoll and Fushë Kuqe.
22 (D)
Cleaning and deepening irriga-tion channels
15 Shëngjini Island
23 (G)
Cleaning and deepening irriga-tion channels
15 Shënkoll (after the embank-ment of Tale)
24 Rehabilitation of water regime of Drini i Lezhës
0 Impossible because of hydro-power cascade in the Drini River
C- Soft & policy measures25 Develop the Regional (DMRD)
climate change adaptation policy/strategy
24 Potential for implementation
26 Incorporate the ‘DMRD Inte-grated monitoring programme’ into the National Monitoring Programme and start monitoring.
23 Potential for implementation
27 Alert system 21 Potential for implementation
28 Prepare the priority adaptation project fishes for the regional government and communities; draft a project proposal
20 Potential for implementation
29 Maximize sustainable financing for adaptation: Develop a full project proposal for different do-nors funding focusing on coastal adaptation.
21 Potential for implementation

138
12.5 Indicative costs of adaptation measures
The basis for final management decisions for implementing adaptation measures will not only be based on technical considerations but also the cost to implement. The costs to implement any given adaptation measures will have three components, these are outlined below.
12.5.1 Technical studies
Technical studies will be needed to inform/guide implementation of adaptation mea-sures per sector as outlined in Section 11.4. Technical studies that should be undertaken to assess the feasibility of the coastal adaptation measures include:• Technical studies to investigate beach nourishment receiver sites (beaches and
dunes) and sediment characteristics of potential sources;• Collection of beach profiles and their interpretation with respect to the optimum
equilibrium beach profile for beach nourishment;• Technical studies to assess the feasibility and potential impact of realigning the
flood embankments of Ceka Lagoon to increase the tidal prism, reduce coastal flood risk, and restore wetland habitats;
• A condition assessment of the flood defenses surrounding the DMRD;• Morphological monitoring of North Tale Beach to support future adaptive manage-
ment; • Hydrological and morphological monitoring campaigns in the Vaini-Patok littoral
sub cell to support future adaptive management.
The indicative costs of the technical studies are presented in table 21.Table 21. Indicative costs of pre-implementation technical studies
Study Indicative Cost (US$)Nourishment sediment characterisation (including offshore survey)
100,000
Beach profiles 20,000Feasibility study for defence realignment (includes collection of elevation data)
100,000
Feasibility study for enhancement of existing degraded saltmarsh 50,000Flood defence condition assessment (walkover) 50,000Morphological monitoring (North Tale Beach) Baseline 20,000
Future years 10,000Hydrological and morphological monitoring (Patok) Baseline 50,000
Future years 30,000
PART 4. ADAPTATION RESPONSES

139
PART 4. ADAPTATION RESPONSES
12.5.2 Environmental impact assessment
The preparation of an EIA will be necessary for all plans and major projects in accor-dance with the existing Albanian law on EIA.
12.5.3 Indicative ‘build’ costs
The likely costs for the ‘build’ of each hard adaption measure are shown in table 22. The individual schemes described in table 22 will necessarily go through a series of phases prior to implementation. These are:• Feasibility assessment;• EIA; and• Detailed design (including tender documents).
The costs of these phases have not been incorporated into table 23, which are indicative costs for construction only. Indicative costs for feasibility assessment plus EIA can be approximately 20 % of construction costs. Detailed design would cost approximately 15 % of construction costs plus approximately 3 % of construction costs for tendering.
Table 22. Indicative costs of scheme implementation.
Adaptation Measure Quantity Unit Unit Indicative Price ($)
Indicative Cost (US$)
Removal of Drini River breakwater 1 each 100,000 100,000Maintenance dredging of Drini Riv-er mouth
~50,000 m3/year 1 50,000/year
Beach Nourishment ~1,200,000 m3 Nearshore placement
4,500,000
Beach placement 9,500,000Construction of groyne field 20 each 30,000 600,000Dune planting ~1,000 m 15 15,000Terminal groynes 2 each 80,000 160,000
Ceka Lagoon channel cut and fill ~60,000 m3 1 60,000Maintenance dredging of Ceka La-goon channel
~30,000 m3/year 1 30,000/year
Breaching Zaje-Ceka Lagoon em-bankment
~5,000 m3 10 50,000
Bridge over Zaje-Ceka Lagoon breach
1 each 250,000 250,000
Moving gate at Drini River-Zaje Lagoon channel
1 each 250,000 250,000

140
12.6 Monitoring
In 2007, the former Institute of Environment (IoE) was reorganized into an Environ-ment and Forest Agency, serving as an executive body for the MoEFWA. In 2008 the Agency took over responsibility for the environmental monitoring, and thus the imple-mentation of the monitoring system. The actual monitoring of the state of the environ-ment is carried out under long-running exclusive contracts between the MoEFWA and selected institutions. In the context of climate change, a specific monitoring system has not yet been identified but it will be necessary to implement a monitoring programme to both assess the accuracy of predicted changes resulting from climate change and to assess and evaluate the impact of any changes that occur. However, the design of an integrated monitoring system (IMS) for the DMRD to support decision-making would need to include observation:• meteorological - air pressure, temperature and humidity, precipitation, wind (ve-
locity and its direction), solar radiation;• hydrological - sea level, river levels and discharge, groundwater level, water ex-
change between the sea and the lagoons;• physical - temperature; conductivity and transparency, total suspended solids, sa-
linity;• chemical - pH, acidity, alkalinity, dissolved oxygen, COD, BOD5, nitrogen (NH4,
NO2, NO3, total organic nitrogen), phosphorus, total organic carbon, heavy metals, organic substances and pesticides;
• hydrobiological - phytoplankton, phytobenthos, zooplankton, zoobenthos, fish; and
• biodiversity - habitats (habitats listed in the EU Habitat Directive), priority species (plants, birds, mammals, reptiles, amphibians) including alien or invasive species, phenological changes in selected plant and animal species.
All of these monitoring indicators are useful to assess how the DMRD ecosystem is re-sponding to climate change. However, for the purposes of the technical coastal adapta-tion measures recommended in this report, a geomorphological monitoring ‘indicator’ and associated sub-indicators are missing from the IMS. A geomorphological indicator should be added to the IMS, containing two sub-indicators:• nearshore, beach, dune and channel morphology; and• sediment composition (supratidal, intertidal and subtidal).
13. ECONOMIC ASSESSMENT
13.1 Introduction
Cost-benefit analysis (CBA) was adopted to appraise the adaptation options. In this
PART 4. ADAPTATION RESPONSES

141
PART 4. ADAPTATION RESPONSES
way, adaptation is treated in the same way as other investment decisions. The cost benefit analysis addresses adaptation measures that have originated from the technical studies of the project, and relate to the “biodiversity” of the DMRD region, or from discussions with local communities. The biodiversity analysis is heavily influenced by a high willingness to pay benefit estimate to cover the total economic value of wetland preservation. The community measures in contrast are highly valuable in terms of their potential contribution to flood protection.
13.2 Economic assessment methods related to climate change adaptation
Quantifying the costs and benefits of adaptation to climate change is complex. Unlike mitigation, adaptation is a continual process, rather than a one-off action or outcome, and society is unlikely to be fully adapted to climate change. Figure 65 illustrates the costs of climate impacts over time, for no adaptation (dashed line), with adaptation (solid line), and the baseline scenario of impacts with no climate change (dotted line). The baseline is increasing because the value of production and assets is assumed to increase over time. The difference between the solid and dashed lines represents the benefits of adaptation, while the difference between the dotted and solid lines repre-sents residual impacts which will not be able to be adapted to. Residual impacts will vary both temporally and spatially.
Figure 65. Costsandbenefitsofadaptation.

142
13.3 Cost - benefit analysis
CBA is a rationale framework for considering adaptation options. In essence, the ap-plication in this context will compare the costs of appropriate interventions with the anticipated benefit, which are the avoided “costed” or valued damages. The relevant stages of applying CBA are set out in 3 stages.
1. Stage 1 - options appraisal. An options appraisal defines the objective of an inter-vention at any site and sets out the range of potential technologies or hard and soft interventions that could potentially meet the desired objective.
2. Stages1&2-collectingcostandbenefitinformation. The CBA process aims to choose the option offering greatest benefit per unit of cost, or (using a cost-effec-tiveness criterion), the intervention that meets the qualitative objective at least cost.
3. Stage 2 - non-monetary consideration (environmental costs and benefits). In the case of climate change adaptation, impacts to ecosystem conservation, goods and services are not traded in markets and therefore non-priced.
4. Stage3-determiningthepresentvalueofnetbenefits. In most projects, investment costs and project benefits typically occur over several years and a rational method must be used to collapse this information back to a common year or (net) present value. This process is called discounting and the actual number used to convert future stream to present values is the discount rate. The discount rate can depend on all these factors. The Net Present Value (NPV) of an investment is calculated as a function of benefits, costs, and the discount rate (Equation 1):
PART 4. ADAPTATION RESPONSES
Where B - represents the benefits, C - the costs, r is the discount rate, and t - is a time index. The discount rate of Equation 1 is expressed in real terms, net of any changes in the price level. To give an example, a Euro invested today at an interest rate of 5 % will have increased to 11.47 Euros in 50 years.
5. Stage 3 - determining the selection criterion and sensitivity analysis. The measure/project with the highest NPV is typically selected as the best investment. Projects with positive NPV’s indicate efficient investment opportunities, where inter tem-poral benefits outweigh costs.
6. Stage 3 - identify distributional effects. A positive NPV suggests a good investment project, however, it ides not tell us anything about the relative distribution of the overall costs and benefits from an intervention.
7. Stage 3 - make a decision. The CBA and associated methods provide the basis for informing a decision, which is normally a move away from the status quo in which climate change will have adverse effects.

143
13.3.1 Non-market impacts (environmental benefits and costs)
EIA can provide a picture of the physical alterations caused by climate change and adaptation to it. For example comparing coastal inundation and wetland creation) ver-sus the costs and benefits arising from managed realignment of defences can give rise to multiple benefits and costs in terms of flooding damages and biodiversity loss or enhancement. For a CBA these impacts need to be converted into monetary terms – i.e. “costed”. Some goods are valued because they are used directly (e.g. fish or crop harvests), some goods are used indirectly (i.e. greenhouse gas sequestration by trees), and some goods are only valued by people because they either want to know that they can use them at another time or that they can be left for others to enjoy in future. These motives add up to the total economic value (TEV) (figure 66) that can be disaggregated into use (actual and/or planned use of the service by an individual) and non-use values (based on values associated with actual and/or planned use of the service by an indi-vidual now and/or in the future).
PART 4. ADAPTATION RESPONSES
Figure 66. Totel Economic Valuation and possible methods for its calculation
13.4 Economic assessment estimation
In this section the focus is on the benefits valuation and the exercise of converting the physical impacts of climate change into monetary values, using environmental eco-nomics techniques. The relevant physical impacts have been identified through a struc-tured vulnerability and risk assessment process and by reference to the other project

144
reports. Drawing on relevant project sources, the following sub-section identifies the key risks and impacts that can be subject to economic valuation. A valuation approach and assumptions is then set out for each impact “endpoint”. The aim is to define the economic value at risk for the whole project area, which can then be evaluated along-side adaptation options. The final sub-section offers some caveats on the use of these values. The aim is to move towards a full cost benefit sensitivity analysis that will match these valuation data with relevant adaptation investment scenarios outlined by the relevant engineering reports.
Note that this estimate is tentative. Few if any countries have attempted a convinc-ing adaptation cost-benefit analysis of this nature, with a limited number still being at the stage of undertaking systematic climate change risk assessments. The empha-sis on valuation here also confronts the challenges of mixing (potential) damage esti-mates derived from market and non-market data. While the former are more easily ob-served, the latter are more complex and require data that are not readily available in the project area. Where potential data gaps need to be addressed, are required sources outside the project area and are used the alternative assessment methods, as benefits transfer method.
13.4.1 Climate scenarios and impact categories
Project reports have identified key risks and impacts in the DRMD project area that in-clude identify coastal erosion, flooding and protected area values. Quantifiable impacts for specific time periods or scenarios of sea-level rise appear to be (table 23):
PART 4. ADAPTATION RESPONSES

145
PART 4. ADAPTATION RESPONSES
Table 23. Climate scenarios and projected climate impacts for the project area.
Parameters Unit 2030 2050 2080 2100Annual temperature rise
°C 1.2 (0.8-1.3) 1.8 (1.3-2.4) 2.8 (2.1-4.1) 3.2 (2.3-5.0)
Number of days with temperatures ≥ 35°C
Days 4-5 6-7 8-9 10-11
Number of days with heat wave
Days 60 80 95 120
Cooling degree days Days 550 670 840 930Precipitation decrease % 3.9 (2.6-5.4) 8.1 (5.5-11) 12.9 (8.4-21) 15.5 (9-26)Hazardous precipita-tion
Days 1-2 2-3 3-4 4-5
Mean sea level pres-sure
HPa 0.26 (0.22-0.28) 0.42 (0.33-0.54)
0.64 (0.43-0.95)
0.74 (0.44-1.18)
Sea level rise Average scenarioMaximum scenario
cm 8 (5–14) 15 (7-28)16 (9-29)
28 (12-53)35 (15-62)
38 (15-72)49 (21-91)
Coastline erosion for maximum scenario of sea level rise
ha 520 1450 2860 5350
Impacts of sea level rise and coastal erosion
2050 2100av. min
av. max
av. min
av. max
Net loss of wetland area
km2 0.14 0.58 0.41 1.04
People actually flooded
1000/year
0.019 0.040 0.006 0.007
Coastal floodplain area
km2 56.14 59.20 57.19 65.95
Coastal floodplain population
1000s 4.14 4.33 3.99 4.61
Total wetland area km2 4.5 4.06 4.22 3.60Coastal forest area km2 1.14 1.01 1.12 0.91Low unvegetated wetlands area
km2 3.37 3.05 3.10 2.69

146
13.4.2 Flooding events
To date there are no studies on the valuation of flooding events in Albania. The project does provide a projection of the impact (1000 people flooded) to 2100 (figure 67). Using a 5 % discount rate applied over 40 years suggests a damage cost range of Euro 2.8- 3.1 million for the project area. This can be expressed as an annual equiva-lent Euro 165,000, which provides a benchmark for understanding any potent annual investment outlays. As the value stands, it represents the most significant damage cost to the project area.
Figure 67. Lineartrendoffloodingepisodesfortheprojectareaandtherebyproduceatimeseries of the likely damage costs.
R² = 0,0491
00,005
0,010,015
0,020,025
0,030,035
2000 2020 2040 2060 2080 2100 2120
PART 4. ADAPTATION RESPONSES
13.4.3 Wetland loss
Wetland destruction from sea level rise compromises a range of ecological and cultural services that are universally recognized as enhancing economic welfare locally na-tional and internationally. Data for projecting the trend area of wetland loss (figure 68) have been combined with the per ha value for “salt marshes”. At a 5 % discount rate for 40 years we derive a present value of Euro 0.77 million.
1000
peo
ple
Year

147
13.4.4 Loss of agricultural land
Data allows a trend line to be derived for the loss of agricultural area in the project districts subject to alternative sea level rise scenarios (figure 69). This information can be combined with data on the yield and value of alternative field crops. Again using a 5 % discount rate and a 40 year horizon, the present value losses are Euro 312,650 (as-suming the area is under wheat), and Euro 1.5 million if we assume the area is under a more lucrative salad crop. Given the varied cropping patterns identified in the project area, it would be more prudent to take a mid-point of these values.
R² = 0.9964
0
0,1
0,2
0,3
0,4
0,5
0,6
0,7
0,8
0,9
2000 2020 2040 2060 2080 2100 2120
Figure 68. Wetland loss
PART 4. ADAPTATION RESPONSES
KM
2
Year
R² = 0.4521
0
500
1000
1500
2000
2500
3000
2000 2020 2040 2060 2080 2100 2120
Figure 69. Agriculture land loss
loss
/ha
Year

148
13.4.5 Tourism demand and the value of beach recreation
Indications are that Patok beach will disappear by 2050, and Shëngjin and Tale beaches will be partially destroyed by 2080. Both are expected to disappear entirely by 2010. The extent to which this will affect visitation rates depends on the extent of the destruc-tion and the availability of substitute sites in Albania or in neighbouring countries. We use the case of Shëngjin-Kune as a lower bound estimate for a case study (figure 70).
The area receives 12800- 40000 visitor days per year. We have assumed a trend decline in daily visitation proportional to the loss of beach area. For our purposes we use a day value of Euro 20 per visit, which is towards the low end of global studies. This value can be altered as part of any sensitivity analysis. This provides a present value estimate of Euro 2.5 million.
13.4.6 Fishing
Fishing is an important activity in the project area with published data showing a wide variety of fresh and saltwater species being caught. For our purposes, we draw a link between wetland area (km2) and the current volume of fish harvest. We then assume a linear relationship between the progressive loss of area (due to sea level rise) and fish harvest. Finally, we take a lower range value for the value per kg of fish caught. This provides a present value (5 % over 40 years) damage cost of Euro 9 million.
Figure 70. Tourist number decline as beaches are lost
R² = 0.9982
-5000
0
5000
10000
15000
20000
25000
30000
35000
40000
45000
2000 2020 2040 2060 2080 2100 2120
PART 4. ADAPTATION RESPONSES
annu
al b
each
day
s
Year

149
13.4.7 Ecosystem carbon
Habitat loss includes forest biomass that sequesters carbon below and above ground. Despite being a non-Annex I country, there is considerable interest in the ways in which forests and woodland can be used as cost-effective mitigation measure with land use change and forestry contributing around 20 % to Albania’s total emissions. In this esti-mate we have simply multiplied declining forest area by a standard per ha CO2 equiva-lent value per ha.
13.4.8 Summary and implications
Preliminary estimated values are summarized in table 24, which presents present value estimates for the key impact categories discussed in previous sub-sections. The esti-mated range of Euro 15.4-16.8 million provides an initial benchmark for considering the efficiency of overall adaptation spending.
PART 4. ADAPTATION RESPONSES
Table 24. Summary of value estimates
Value category Estimated NPV (million Euro)Wetland loss WTP 0.77Flood damages 2.8 – 3.1Agricultural land loss - Approximated by wheat (low value) and salad crops (high) 0.3 - 1.5
Forest carbon 0.00015Coastal beach recreation 2.5Fishery loss 9Total 15.4 – 16.8
13.5 Costing of prioritized adaptation measures in the DMRD, including costs and benefits
This section provides the results of a targeted CBA of adaptation measures with a fo-cus on the valuation of the benefits of adaptation. These benefits can then be a basis for judging the scope and costs of meaningful adaptation measures. The CBA stages provide the data to derive a key indicator, the NPV of an investment, calculated as a function of benefits, costs, and the discount rate (Equation 2):
NPV = –C + [B1/(1+i)1] + [B2/(1+i)2] + ... + [Bn/(1+i)n] (Equation 2)

150
Where: C - is the initial investment (cost) outlay, which for some measures may be one-off or recurrent; B - represents the benefits associated with specific adaptation measures; i - is the discount rate; and t-n - is a time index to denote the time horizon over which we are considering cost and benefit flows.
In the analysis a 5 % discount rate is used, with the rationale that this rate is lower to reflect lower community time preference for environmental preservation in the context of climate change adaptation. We use a 40 year time horizon for the investment calcula-tion, but we note that, given scenario uncertainty this horizon may be longer than the useful life of some of the interventions being proposed. The results of the analysis are undertaken for two sets of measures broadly termed “lagoon” and “community” mea-sures. The lagoon measures target wetland and coastal biodiversity conservation. The community measures are more biased towards safeguarding community assets.
13.5.1 Combined “hard” and CbA measures in Lagoons
Table 25 provides some estimated present value (PV) costs used in the analysis for the combined analysis for three lagoons. To compare with the PV costs we estimated PV benefits of relevant corresponding benefit categories that were previously identified as tourism wetland biodiversity and fishing value. Table 26 presents these estimates and the underlying estimates.
For wetland values we have linked a trajectory of loss of wetland area (see previous section) to a willingness to pay estimate for wetlands that combines a use and non-use element predominantly related to wetland biodiversity value. As noted in the previous section this WTP value was derived from a global meta-analysis of WTP studies. In addition, we have made specific assumptions about the potential increase of this value over time as Mediterranean wetlands become rarer. Thus our analysis can be based on different value growth rates of 5 and 10 % per year. We note that this assumption is somewhat arbitrary. In the final instance our NPV is derived without this growth assumption. In addition to wetland values we use market prices to value tourism and fishery values. The former is based on a highly conservative estimate of around 40 Euro per visitor to beach areas. As shown in table 27 all scenarios for PV benefit ex-ceed costs. Hence, as a package, the investment in the totality of measures would be economically efficient. This is summarized in table 27.
PART 4. ADAPTATION RESPONSES

151
Table 25. Present value costs lagoons combined measures
COSTS PV Removal of Drini River breakwater to release sand supply to the north and re- instatement of maintenance dredging of river mouth. US$ 100,000
Maintenance dredging of Drini River mouth US$ 958,440 Beach nourishment at Shëngjini Beach/Kune Spit US$ 12,902,490
Construction of a groyne field across the beach nourishment re-ceiver site US$ 58,570
Dune planting at degraded sites along Kune Spit US$ 12,960 Terminal groynes US$ 156,190 Ceka Lagoon tidal inlet cut and partfill the old exchange channel US$ 58,570
Maintenance dredging of Ceka Lagoon tidal inlet US$ 575,060 Breaching Zaje-Ceka Lagoon embankment US$ 50,000 Bridge over Zaje-Ceka Lagoon breach US$ 250,000 Moving gate at Drini River-Zaje Lagoon inlet US$ 250,000 Total US$ 15,372,280 Total (Euro) Euro14 11,529,210
PART 4. ADAPTATION RESPONSES
Table 26. Presentvaluebenefitslagoonscombined
BENEFITS PV (Euro)
Wetland value (0% growth value) 1,068,160
Wetland value (10% growth value) 22,324,150
Wetland value (5% growth value) 4,671,720
Tourist visits 6,488,880 Fishing 9,615,9830Total (Euro) (0% growth value) 17,173,0140
(5% growth value) 20,776,580
(10% growth value) 38,429,010
14 1 Euro = 1.333US$
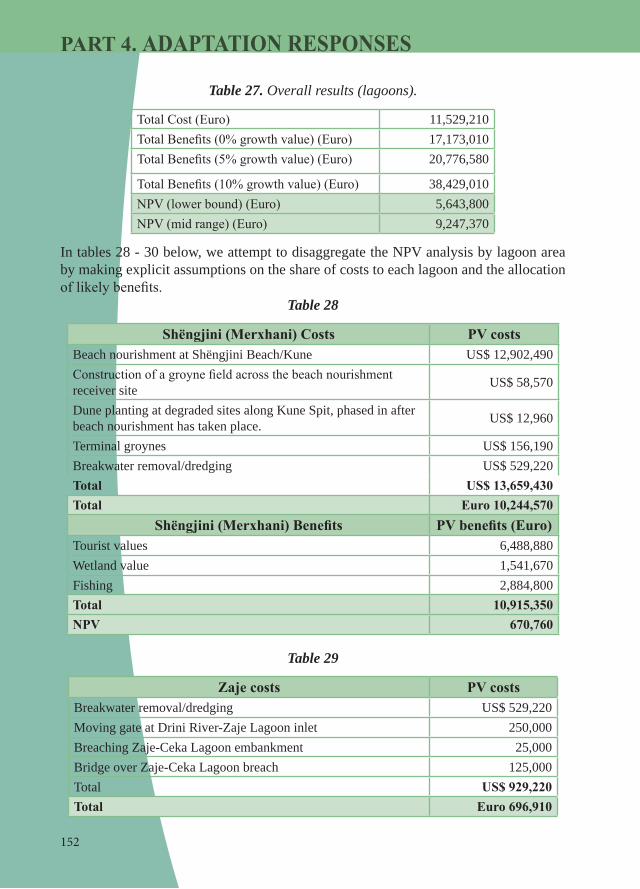
152
Table 27. Overall results (lagoons).
Total Cost (Euro) 11,529,210 Total Benefits (0% growth value) (Euro) 17,173,010 Total Benefits (5% growth value) (Euro) 20,776,580
Total Benefits (10% growth value) (Euro) 38,429,010 NPV (lower bound) (Euro) 5,643,800 NPV (mid range) (Euro) 9,247,370
In tables 28 - 30 below, we attempt to disaggregate the NPV analysis by lagoon area by making explicit assumptions on the share of costs to each lagoon and the allocation of likely benefits.
Table 28
Shëngjini (Merxhani) Costs PV costs Beach nourishment at Shëngjini Beach/Kune US$ 12,902,490 Construction of a groyne field across the beach nourishment receiver site US$ 58,570
Dune planting at degraded sites along Kune Spit, phased in after beach nourishment has taken place. US$ 12,960
Terminal groynes US$ 156,190 Breakwater removal/dredging US$ 529,220 Total US$ 13,659,430Total Euro 10,244,570
Shëngjini (Merxhani) Benefits PV benefits (Euro)Tourist values 6,488,880 Wetland value 1,541,670 Fishing 2,884,800 Total 10,915,350 NPV 670,760
Table 29
Zaje costs PV costs Breakwater removal/dredging US$ 529,220 Moving gate at Drini River-Zaje Lagoon inlet 250,000 Breaching Zaje-Ceka Lagoon embankment 25,000 Bridge over Zaje-Ceka Lagoon breach 125,000 Total US$ 929,220 Total Euro 696,910
PART 4. ADAPTATION RESPONSES

153
The overall results of this analysis are summarised in table 31, which shows that all lagoon proposals are still efficient (positive NPV), with the most marginal being Shëngjini at less than Euro 0.7 million. The largest NPV is associated with the return to measures implemented in Ceka.
PART 4. ADAPTATION RESPONSES
Zaje benefits PV benefits (Euro)Wetland value 934,340 Fishing 1,923,200 Total 2,857,540 NPV 2,160,630
Table 30
Ceka costs PV costs Ceka Lagoon tidal inlet cut and partfill the old exchange channel US$ 58,570 Maintenance dredging of Ceka Lagoon tidal inlet US$ 575,060 Breaching Zaje-Ceka Lagoon embankment 25,000 Bridge over Zaje-Ceka Lagoon breach 125,000 Total US$ 783,630 Total Euro 587,730
Ceka Benefits PV benefits (Euro)Wetland value 2,335,860 Fishing 4,807,990 Total 7,143,850 NPV 6,556,130
Table 31
Merxhani Total Cost (Euro) 10,244,570 Merxhani Total Benefits (Euro) 10,915,350 Merxhani NPV (Euro) 670,760 Zaje Total Cost (Euro) 696,910 Zaje Total Benefits (Euro) 2,857,540 Zaje NPV (Euro) 2,160,630 Ceka Total Cost (Euro) 587,730 Ceka Total Benefits (Euro) 7,143,850 Ceka NPV (Euro) 6,556,130

154
13.5.2 Community-based measures
A separate set of community measures have been defined and are separately analysed in terms of their NPV. Table 32-36 summarize the analysis for north (Shëngjini), central (Shënkoll), and south (Fushë Kuqe) zones, and table 35 summarizes the NPVs. The magnitude of household losses in a flood episode was assumed to be a cost of around 26,000 Euro per household, with 20 % of households affected in each area. The analy-sis assumed an event frequency of once every 4 years. For agricultural losses the same frequency of flooding events was assumed. But it was assumed that a different percent-age loss would occur (20 % and 50 %) of crop value in each area. In each case we have valued the losses using 2011 market prices. In the results presented here we have used conservative (i.e. lower) damage cost estimates. These are derived using a cost of 20 % loss of a wheat crop.
Table 32
Shëngjini Costs Shëngjin Present value costs C Sublimation of the road up to 100 cm - embankment 28,850 D Cleaning and deepening irrigation channels +
maintenance 94,830
E Sublimation/maintenance of the embankment 29,430 S1 Reforestation 12,610 S2 Reforestation 10,090 Present value cost 175,810 Benefits Shëngjini Present value benefits
(Euro) Agriculture 20% WHEAT (loss) 538,230 50%W WHEAT (loss) 1,345,560 20% VEG (loss) 10,943,920 50% VEG (loss) 27,359,800 Households Flooding 19,456,000 NPV 19,818,420
PART 4. ADAPTATION RESPONSES

155
PART 4. ADAPTATION RESPONSES
Table 33
Shënkoll Costs Shënkoll Present value costs
(Euro)F1 Maintenance of the embankment 159,700 F2 Sublimation of the road up to 30 cm and mainte-
nance of the embankment 59,780
G Cleaning and deepening irrigation channels: Imme-diate.
262,270
J Reforestation of embankment F2 (green line along the embankment)
5,040
S3 Reforestation 15,130 PV costs 501,920 Benefits Shënkoll Present value benefits
(Euro)Agriculture 20% WHEAT (loss) 2,652,740 50%W WHEAT (loss) 6,631,850 20% VEG (loss) 53,939,050 50% VEG (loss) 134,847,640Households Flooding 6,226,900 NPV 8,377,720
Table 34Fushë Kuqe Costs Fushë Kuqe Present value costs
(Euro) H Sublimation of the road up to 30 cm- 2 Options 124,240 I Sublimation/maintenance of the embankment 52,600 K Reforestation of the embankment “I” 2,650 M Reforestation 35,310 L Sublimation of embankment 26,360 Present value Costs 241,160

156
Table 35
NPV Shëngjin 19,818,420 NPV Shënkoll 8,377,720 NPV Fushë Kuqe 4,257,890
13.6 Conclusions and comments
The results presented here can be used to guide investment decisions in the project area. In broad terms, the choices should be prioritised according to the magnitude of the NPV analysis. Higher NPVs essentially indicate that an investment package will deliver so-cial benefits in excess of cost outlays over the period under consideration.
13.7 Final proposed short term measures for implementation
It is important to recognise that it is not possible to be prescriptive, either about the prioritisation criteria that are used or about the way in which they are applied. However, whatever criteria and approach are to be used, the following remarks should be borne in mind:• The approach must be matched to the purpose for which the prioritization is to be
carried out;• Although there are many different criteria that might in principle be used, in prac-
tice there will only be a small number that are highly relevant for a particular case;• These key criteria need to reflect the real benefits of and constraints on the project,
and not just the requirements of a particular funding scheme (unless, of course, the prioritization is being carried out in the specific context of such a scheme);
• Issues that will be determined following prioritization (e.g. sources of funding, dates of implementation) should not also be used as prioritization criteria;
Benefits Fushë Kuqe Present value benefits (Euro)
Agriculture 20% WHEAT (loss) 2,942,310 50%W WHEAT (loss) 7,355,780 20% VEG (loss) 53,939,050 50% VEG (loss) 134,847,640 Households Flooding 1,556,730 NPV 4,257,890
PART 4. ADAPTATION RESPONSES

157
PART 4. ADAPTATION RESPONSES
• Relevant information relating to the selected criteria must be available for all the projects to be prioritized, and this may influence the selection of criteria;
• The approach should be based as far as possible on objective criteria that can be quantified by those carrying out the prioritization.
Based on the analyses results, the PCU defined the potential adaptation measure to be implemented within the time frame of current running DMRD project. These measures were judged by the experts’ team as the most feasible, taking into account the GEF cli-mate change criteria for project selection (opportunities), as well as the advice provided by the experts’s team of local government, MoEFWA and other stakeholders.
The final measures selected to be implemented within the project life of the DMRD project are:• Development of a Policy Paper Document on the integration of Climate Change
and adaptation issues in strategic programs and development plans in DMRD and Protected Area Management Plans.
• Introduction into the National Monitoring Programme of the DMRD Integrated Monitoring Program and pilot starting of the observation activities.
• Pilot dune restoration (planting) in Vaini area.• Drafting of the project fiches on the implementation of priority adaptation mea-
sures by the county council and communes, development of a project supported by different donators.

158
• Mucaj, L., 2010. Report on the climate change scenarios for DMRD• Mucaj, L., 2011. Reports on the expected future climate impacts/risks on the coast-
al ecosystems, agriculture, water resources, tourism and settlements• Mucaj, L., Mullaj, A., Zotaj, A., 2012. Final report on the vulnerability assessment
and adaptation options for the DMRD area• Mullaj, A. and Zotaj, A., 2011. Report on ecosystems vulnerability within DMRD,
with focus on protected areas; habitat map• Mullaj, A., Mucaj, L., Zotaj, A., 2012. Identification of relevant forms of adapta-
tion and their impacts on natural ecosystems• Diku, A., 2012. Final report on agriculture & livestock in the DMRD• Ndini, M., 2011. Impact of current climate variability, Expected impact on water
resources and coastal dynamic and Adaptation measures in DMRD• Laci, S., 2011. Final report on tourism, population and settlements• Le Tissier, M. and Vaso, A., 2012. Final report on ICZM activities in Albania,
specific to DRMD, including recommendations on the mainstreaming of ICZM approaches in Albania
• Moran, D. and Pojani, E., 2011. Final Project Report on climate change adaptation costing activities, specific to the DRMD
• Mucaj, L., Mullaj, A., Laci, S., Ndini, M., Diku, A., 2011. Identification of the adaptation measures for the coastal ecosystems, water resources, agriculture and tourism and population in the DMRD area
• Brew D. and Vaso A., 2011. Potential Coastal Environmental Restoration in the Drini-Mati River Deltas, Albania: Final Report
• Brew, D., 2011. Coastal Geomorphology of the Drini-Mati River Deltas, Albania• Zotaj, A., 2011. Report on climate change impacts on biodiversity and other sec-
tors – habitat map• Zotaj, A., 2011. Coastal climate change risk map within the DMRD area – risks
map• Zotaj, A., 2011. Climate change adaptation measures on biodiversity and other sec-
tors – Developing of the map of adaptation options related to environmental res-toration
• Mustaqi, V. and Bego, F., 2010. Report on designing of the integrated monitoring system and implementation program for the DMRD. Final report.
• Vaso, A. 2012. Report on prioritization measures to support coastal ecosystem res-toration and other project activities
• Panariti, N. 2011. Final report on Institutional needs with respect to climate change adaptation
• Kay, R and Elrick, C., 2010. Strategic Climate Change Adaptation Plan
LIST OF PROJECT REPORTS AND OTHER REFERENCES
APPENDIX 1

159
APPENDIX 1
• Kay, R, and Elrick, C., 2012. Recommendations for integrating adaptation mea-sures in development and infrastructure plans / programmes in DRMD area
• Berendse, F. (2005). Impacts of global change on plant diversity and vice versa: Old and new challenges for vegetation scientists. Journal of Vegetation Science 16: 613-616
• Betts, R.A., Boucher, O., Collins, M., Cox, P.M., Falloon, P.D., Gedney, N., Hem-ming, D.L., Huntingford, C., Jones, C.D., Sexton, D.M.H. and Webb, M.J. 2007. Projected increase in continental runoff due to plant responses to increasing carbon dioxide. Nature 448: 1037-1041
• Bisgrove, R. and Hadley, P. (2002). Gardening in the Global Greenhouse: The Im-pacts of Climate Change on Gardens in the UK. Technical Report.
• Ciais, Ph., et alt., 2005: Europe-wide reduction in primary productivity caused by the heat and drought in 2003. Nature, 437, 529-533.
• Council Directive 92/43/EEC on the Conservation of Natural Habitats and of Wild Fauna and Flora. Annex I to Directive 92/43/EEC.
• Ehleringer, J., Thure E., Cerling, B. and Helliker, R., 1997. C4 photosynthesis, atmospheric CO2, and climate. Oecologia, 112:285-299.
• Hegland, S., A. Nielsen, A., La´ zaro, A., L. Bjerknes, and O. Totland. 2009. How does climate warming affect plant-pollinator interactions? Ecology Letters 12: 184–195.
• Houghton, R., 2007. Balancing the Carbon Budget. Annual Review Earth Plan-etary Science, 35:313–47.
• Kehlenbeck, H. & Schrader, G., 2007. Climate Change, Happy future for plant pests? In: Secretariat of the Convention on Biological Diversity, 2007. Emerging Issues for Biodiversity Conservation in a Changing Climate. CBD Technical Series No. 29, Montreal, Canada.
• Kriticos, D. & Filmer, M., 2007. Weeds will thrive on climate change. Farming Ahead, 182.
• Kriticos, D., Sutherst, R., Brown, J., Adkins, S. and Maywald, G., 2003. Climate change and the potential distribution of an invasive alien plant: Acacia nilotica ssp. indica in Australia. Journal of Applied Ecology, 40:111–124.
• Malcolm, J. et alt., 2005. Projected tree distributions, tree migration rates, and for-est types in Ontario under a 2°C global temperature rise. Pp. 52-99 in: T. Tin (Ed.). Implications of a 2°C global temperature rise for Canada’s natural resources. World Wide Fund for Nature, Gland, Switzerland.
• Middleton, B., 2006. Invasive Species and Climate Change Open-File Report 2006-1153. U.S. Department of the Interior, U.S. Geological Survey, USA.
• Pano N. 1998. The dynamic change of the coastal line in the Drini river mouth. Conservation
• and wise use of wetlands in the Mediterranean basin (Focus on the Kune-Vaini lagoon,
• Lezha, Albania). Med Wet, Tirana

160
• Ricard, B., Aschi-Smiti, S., Gharb, I. and Brouquisse, R.,2006. Cellular and Mo-lecular Mechanisms of Plant Tolerance to Waterlogging. In: Huang, B. (ed), 2006. Plant Environment Interactions. Third Edition, Taylor and Francis Group, London, UK and New York, USA.
• Vangjeli J., Ruci B., Mullaj A., 1996 - Red Book (Threatened and rare plants spe-cies of Albania), Tirana
• Ward, N. & Masters, G., 2007. Linking climate change and species invasion: an illustration using insect herbivores. Global Change Biology, 13(8): 1605–1615.
APPENDIX 1

161
APPENDIX 2
SECTOR SPECIFIC ADAPTATION MEASURES THAT DELIVER ADAPTATION OPTIONS
In order to ensure that the environment of the DMRD area can be resilient to the pres-sures of climate change adaptation measures need to be applied that consider all the features of the DMRD area, and the associations between different elements and activi-ties of the area. Identifying adaptation measures for the DMRD region must account for the physical integrity of the area that is at the core of the sustainability of the existing systems of the area – environmental, social and economic. To this end to be successful, adaptation measures must account for some key geomorphological pressures that exist, namely:• Coastal erosion affecting the sediment starved Shëngjini, Kune and northern Vaini-
Patok littoral cells. Adaptation measures should include: a. Eliminate factors that exacerbate erosion such as reintroducing sediment to the coast down the Drini River and removing the Drini River breakwater; b. Beach restoration strategies particularly beach nourishment and dune man agement to slow erosion rates; and c. Structural methods of sand retention.
• Limited exchange of water through tidal channels that could lead to eutrophication. Adaptation measures should include:
a. Structural methods to restrict sediment accumulation in the channels; b. Regular maintenance dredging of the channels to maintain functionality; c. Increasing lagoon tidal prism and current flow (and hence scour) through the tidal channels by managed realignment of landward agricultural areas; and d. Controlled discharge of polluted water from the pumping stations.
• Loss of habitat and increased risk of flooding, addressed through consideration of: a. Restoration of agricultural areas to restore functioning wetland (saltmarsh) habitat to replace that lost and provide a flood defence function; and b. Maintenance and upgrade of flood embankments
However, these factors cannot be considered in isolation when determining appropri-ate adaptation measures, but need to be planned in conjunction with features of the natural and socio-economic systems that are important to the integrity of the DMRD area. These fall under the categories of (i) coastal ecosystems, (ii) flood protection, (iii) agriculture, (iv) population and settlements, and (v) tourism.

162
Coastal ecosystems
Adaptation activities that can be beneficial to natural ecosystems of the DMRD area include the establishment of a mosaic of interconnected: terrestrial, freshwater and ma-rine multiple-use reserve protected areas These areas should be designed to take into account climate impacts, and integrated land- and water-management activities that reduce non-climate pressure on the natural ecosystems and hence make the system less vulnerable to climate impacts. Adaptation measures that can have positive impacts on natural ecosystems of the DMRD include:• Conservation of ecosystem structure and function;• Develop a Management Action Plan based on improvement of environmental fea-
tures and services to restoration and maintain natural habitats;• Instigate activities to conserve maximum habitats for plant conservation;• Stop/control illegal tree cutting, hunting in wrong season with wrong weapons,
hunting of species with special status, fishing anywhere, etc.;• Stop/control hunting activity, in DMRD area until the wildlife diversity and popu-
lation ratio will be restored;• Control contamination and pollution;• Control future illegal constructions, and inappropriate developments, except those
proposed by management plan, will help on habitat maintenance and biodiversity restoration;
• Encourage afforestation and reforestation activities;• Develop field-based monitoring programmes, focused on vulnerable areas • Restoration or rehabilitation of natural habitat especially in the most vulnerable
sections of the DMRD area; beach and dune nourishment and restoration (figure 68 and 69) in order to achieve an overall equilibrium of geomorphological processes;
• Restoration or rehabilitation of natural habitat;• Improvement of water quality in Vaini Lagoons by avoiding discharge of Tale
pumping station waters into the Matkeqe channel; • Building (drilling) more artesian wells to reduce the salinity; • Opening of water communication channels between lagoons and sea; • Enlarging existing protected area of the DMRD area including in it Tale coast, from
Tale pumping station channel to the ex Mati River mouth;• Developing agroforestry systems at transition zones.
APPENDIX 2

163
APPENDIX 2
Flood protection
Although structures may successfully protect areas, they also can engender a false sense of security promoting continued development and require continuous mainte-nance. Flood protection systems at Drin Lezha River delta that could be considered are modifications to the existing system of embankments and drainage – although existing embankments are functioning well they may need reinforcement/raising and water levels may need to be managed.
Flood protection systems at Mati River are threatened by illegal gravel extraction lead-ing to maintenance problems that exacerbate flooding. Construction of new embank-ments could greatly reduce the threat from flooding. Other measures that could be considered to reduce the threat from flooding include:
Figure 71: Dune planting in the DMRD area with Ammophila arenaria.A - selected area before planting; B - selected area after planting
A
B B

164
• The arrangement and systematic cleaning of river beds. • Continuous monitoring and maintenance of the embankments along the river banks.• Continuous monitoring of the river flows.• Creation of the Regional Center for the Flood Forecast and Prevention.
Agriculture
Agriculture is a principle economic activity of the DMRD area. Adaption is impor-tant to protect local livelihoods and to ensure agricultural practices do not reduce the buffering capacity of the natural environment. There are a variety of measures and ap-proaches to adapt to climate change. Adaptation is generally in the form of:• Changes in farm management practices (planting earlier in time or breeding of
livestock species that is more resistant to heat).• Changes in the use of plants and agricultural crops (species that fit more or are
more resistant to drought).• Technological improvements (improvement in livestock, improvement of species
or varieties of agricultural crops, improvement in the application of irrigation, im-provement of the work and planting soil, improvement of the practices of fertilizers use, disease and pests management practices etc.).
• Coupling agro-forestry practices.
Population and settlements
The population in the coastal area of Lezha County will continue to grow, mainly due to the movement of the inhabitants from mountainous areas. Increasing population density will be associated with increased consumption of natural resources (land, wa-ter, vegetation, and fauna), increased waste and environmental pollution. In terms of continuous increase of temperatures it is expected that risks to human health, especially during the hot period to be increased. Meanwhile during the summer period, the con-centration of population will be greater as a result of the arrival of tourists and return of emigrants for holidays. Some proposed measures for adaptation to the expected climate changes are:• Develop a communication strategy to disseminate information on climate change
impact, including climate related hazards, to increase the public awareness;• Incorporate climate change adaptation in environmental education;• Improve the medical care, especially during the summer;• Propose low cost alternatives for protection from heat.
Other specific features that will come under increasing pressure from climate change are:• Water supply - Fresh water reserves during the next century are projected to decline
through a reduction of the rainfall up to 15.5% by the year 2100 and salinization of
APPENDIX 2

165
APPENDIX 2
the ground and underground fresh water as a result of sea level rise and sea floods.
Adaptive measures include:• rational use of water; • provision of new water resources; • strengthening of existing coastal dams and seawalls, as well as the construction of
new ones in areas where they are needed (Ishull Lezha, Tale, Patok, Shëllinza) so that all coastal areas have a defense system against sea flooding;
• strengthening and modernizing the evacuation system of brackish water, in order to stop their penetration inland and mix with fresh water.
Fire risk - Fires that occurred during the past twenty years in the coastal area of Lezha County have caused significant damages to forests and biodiversity, houses and social economic facilities, fuel tankers, and landscape, besides the stress, fear and insecurity to the residents. Adaptive measures include:• public education on the increased fire risk owing to climate changes,• strengthening of fire protection,• provision of dwellings and other buildings with fire extinguishers,
Tourism
The expected changes of temperature regime are likely to have a positive impact in the tourist comfort index, especially in regard with the sea water temperature. Over this century, the number of tourists in the coastal area will increase which will lead to increased demands for water and energy, while these reserves are expected to decrease. To meet the demands of the tourism sector, the adaptation measures listed above will need to factor in the transient population increase and infrastructure pressures that this industry will bring.

166
PROJECT PRIORITIZATION CRITERIA’S AND RESPECTIVE SCORING RATES
Criteria Scoring Rate & Description1. Project Estimated Cost 1. over 1,000,000 US$
2. 500,000 - 1,000,000 US$3. 300,000 - 500,000 US$,4. 100,000 - 300,000 US$5. up to 100,000 US$
2. Urgency and timeframe for implementation
1. Long term (after 2020)3. Midterm (up to the year 2020)5. Short term (within project lifetime - 2013)
3. Potential for partnership and mobilization of additional fund-ing
1. No strategies; no running projects to develop strategies2. Strategies in development phase; no projects running3. Strategies exist but no follow up projects running4. Strategies exist; follow up projects in initial phase5. Strategies exist; follow up projects in implementation phase
4. Compliance with the principle of additionality
1. No adaptation strategy & planning exist; no adequate institutional structure in place.2. Some initial potential strategic documents/projects exist but no adequate institutional structure in place.3. Developed strategies and initial adequate institutional structure in place, planning/projects process in initial phases.4. Adequate institutional structure in place exist, initial planning/projects in process.5. Adequate institutional structure in place exist and follow up planning/projects well established.
APPENDIX 3

167
APPENDIX 3
5. Win-win solution for ecosys-tem resilience and community protection (CBA results for group measures considered)
1. Feasibility studies completed, engineering projects to increase livelihood resilience not ready for implementation;2. Feasibility studies done, engineering projects to increase ecosystem resilience not ready for implementation;3. Feasibility & detailed studies done, engineering projects to increase livelihood resilience ready for implementation;4. Feasibility & detailed studies done, engineering projects to increase ecosystem resilience ready for implementation;5. Feasibility & detailed studies done, engi-neering projects to increase ecosystem and livelihood resilience ready for implementa-tion