project management knowledge and effects on … · range of projects (zwikael, 2009). project...
TRANSCRIPT

PA
PE
RS
October 2012 � Project Management Journal � DOI: 10.1002/pmj 47
INTRODUCTION �
The construction industry is closely related to economic developmentand living lifestyles. Engineering management, as one of the critical dis-ciplines in construction engineering, directly impacts the life and prop-erty security in the environment. As society develops, construction
projects naturally grow in scale, involving vast numbers of professionals, longlife cycles, and complex interfaces. Therefore, the types and quantities of con-struction-related information have become quite large and complex, whichhas increased the complexity of construction operations processes. Constructionprojects now require highly specialized knowledge and experiential feedback.Traditional operational processes may no longer be useful for resolving certainproblems. Project management was developed in response to these chal-lenges, by facilitating project implementation and delivery.
Because of the limited information disseminated by global project man-agement educators, the rapid changes in the construction industry urgentlyrequire engineers who can apply project management techniques, tools, andskills (TTS) in the work practice. Rapid advances in management science haveled to development of project management into a complete system of knowl-edge (Indelicato, 2009). Project management was initially developed by thedefense industry in response to national security needs but has since grown toemphasize the relationships among various operational activities during theproject life cycle. In engineering projects, a construction project can be ana-lyzed in terms of five main steps: feasibility analysis, planning, design, con-struction, and operation. Each stage can also be analyzed as a single project,meaning that a unique product or service is produced at each stage.
Effective project management is essential in a project-oriented industrysuch as construction (Isik, Arditi, Dikmen, & Birgonul, 2008). Identifying effi-cient approaches is crucial for project success. To improve project outcomes(e.g., performance; satisfaction, and success), A Guide to the ProjectManagement Body of Knowledge Guide (PMBOK® Guide) was developed bythe Project Management Institute to identify general project managementknowledge, processes, techniques, tools, and skills (PMI, 2008). ThePMBOK® Guide contains the fundamental, baseline practices that drivebusiness results for any organization, including those organizations in theconstruction industry. By applying these management techniques, projectmanagers and project teams can enhance the chances of success over a widerange of projects (Zwikael, 2009).
Project Management Knowledge and Effects on Construction ProjectOutcomes: An Empirical StudyJui-Sheng Chou, Department of Construction Engineering, National Taiwan University ofScience and Technology, Taipei City, TaiwanJung-Ghun Yang, Department of Construction Engineering, National Taiwan University ofScience and Technology, Taipei City, Taiwan
ABSTRACT �
This study examines the relationships among thePMBOK® Guide, project performance, customer satisfac-tion, and project success by assessing the efficacy ofmanagement techniques, tools, and skills for imple-menting infrastructure and building construction.Experienced interviewees from private engineeringfirms and public agencies were asked to complete aquestionnaire, and the responses were analyzed bymeans of a structural equation model. The analyticalresults indicate the appropriateness of prioritizing thepractice of the PMBOK® Guide in the construction indus-try. This study contributes to the literature by providinginsight into interactions among the PMBOK® Guide andconstruction project outcomes in engineering prac-tices. Particularly, the “bidder’s conference” and “pro-curement negotiations” are the priority techniques tominimize bidding and legal procurement problems.Moreover, the study recommends the use of “stake-holder analysis,” “communication requirements analy-sis,” and the “communication methods” to performeffective communication management. Although theconclusions are based on the sample collected inTaiwan, the research findings can be used by projectmanagers and educators to tailor the PMBOK® Guide totheir unique needs and to design effective training pro-grams for construction specialists.
KEYWORDS: PMBOK® Guide; perceived per-formance; customer satisfaction; project suc-cess; structural equation model; constructionengineering
Project Management Journal, Vol. 43, No. 5, 47–67
© 2012 by the Project Management Institute
Published online in Wiley Online Library
(wileyonlinelibrary.com). DOI: 10.1002/pmj.21293

48 October 2012 � Project Management Journal � DOI: 10.1002/pmj
Project Management Knowledge and Effects on Construction Project OutcomesP
AP
ER
S
One trend in the construction indus-try is a growing emphasis on project man-agement. However, project managementas pursued by most construction compa-nies is related only to fields such as docu-ment management and knowledge communities. Ineffective integration ofproject management with enterpriseoperational processes prevents synergis-tic effects and causes resource waste andreduced operational efficiency. These fail-ures have increased enterprise burdensand have prevented companies fromenhancing their competitiveness. Con-struction engineers and personnel havewidely varying understanding of projectmanagement knowledge practice.
Specifically, no clear standards havebeen developed for prioritizing projectknowledge needed for task execution(Bryde & Wright, 2007; Zwikael, 2009).Most companies determine which man-agement techniques or tools are neededfor a particular project based on personalexperience or on legacies passed down byindustry predecessors. These methods arenot scientific or objective. Managementpersonnel may be unable to make accu-rate judgments regarding the projectmanagement skills or tools needed for aspecific project before engineering isimplemented. A current literature reviewshows that no studies have attempted toidentify a priority list of PMBOK® Guidetechniques, tools, and skills or to empiri-cally measure their effects on project outcomes—namely, perceived perform-ance, customer (stakeholder) satisfac-tion, and project success.
The association between PMBOK®
Guide practice and construction proj-ect outcomes needs further clarifica-tion. Therefore, this study empiricallyexamined the impact of the projectmanagement knowledge of projectmanagers and stakeholders on finalconstruction project outcomes.Particularly, the project managementknowledge examined in this study isthe techniques/tools/skills (TTS) in thePMBOK® Guide of application domains.The results of this study are expected tobe critical for improving understanding
of how the PMBOK® Guide affects proj-ect success.
First, a hypothetical research modelwas constructed by reviewing the rele-vant literature. Construction industryproject personnel in Taiwan were thensurveyed regarding the application ofproject management TTS and theirimpact on project outcomes in terms ofperformance in project participation,business owner satisfaction, and thefrequency of project success. Structuralequation modeling (SEM) was thenperformed to identify the managementtechniques with the greatest impact onperformance, business owner satisfac-tion, and project success. The objectivewas to use the empirical findings toprovide a reference for practitionerswhen allocating and prioritizing man-agement techniques that should beused in modern construction projects.
The remainder of this article is organ-ized as follows. The section “LiteratureFindings and Research Hypotheses”reviews the literature on PMBOK® Guideapplications, project performance (PP)evaluation, customer satisfaction (CS),and project success (PS) requirementsrelated to construction engineering andmanagement. Based on the literature, theresearch hypotheses are formulated, andthe empirical model is developed. The“Research Method and Flow” section out-lines the research methodology andanalysis methods applied in this study.The next section, “Analytical Process andResults,” describes the data profile,including construct indicators in thequestionnaire, descriptive statistics, ana-lytical results using the proposed SEM,and discussion. The final section,“Conclusion and Recommendations,”concludes the managerial implicationsfor construction engineering practice.
Literature Findings andResearch HypothesesComparison of ConceptualFrameworks of PMBOK® Guide andProject PerformanceApplication of SEM in a project man-agement study by Kim, Han, Kim, and
Park (2009) found that the key factors inproject performance and project suc-cess were communications manage-ment, cost management, and scopemanagement. Cho, Hong, and Hyun(2009) and Konchar and Sanvido (1998)noted that cost, progress, and qualitymanagement significantly affect proj-ect performance. Anantatmula (2008),Kang, O’Brien, Thomas, and Chapman(2008), and O’Connor and Yang (2004)also confirmed that the growing use ofinformation technologies has signifi-cantly improved performance. Excep-tional product and service quality canalso increase project performance(Ling, Ibbs, & Hoo, 2006).
Particularly, Hwang, Thomas, andCaldas (2010) developed a hierarchicalstructure of pharmaceutical projects soas to make a clear comparison. To exhib-it the uniqueness of pharmaceutical con-struction projects in deliveries, industry-specific metrics (i.e., project cost, sched-ule, and dimensional performance) tai-lored to the processes were produced.Their studies (Hwang, Thomas, & Caldas;2010, 2011) indicated that the stakehold-ers can efficiently measure and evaluatethe performance of pharmaceuticalfacility construction projects by employ-ing the proposed metrics.
A study by Dvir, Raz, and Shenhar(2003) suggested that defining objec-tives and functional requirements andapplying technological specificationsare critical for successful national secu-rity defense-related projects. Yang,O’Connor, and Wang (2006) found thatinformation technology and automatedtechnologies contribute to the successof small and medium-sized projects;Yang (2007) also suggested that auto-mated technologies are critical for suc-cessful task execution. A study ofEuropean Foundation for QualityManagement (EFQM) business modelsby Qureshi, Warraich, and Hijazi (2009)found that project management andhuman resource management positive-ly affect project performance.
Yeung, Chan, and Chan (2009) fur-ther suggested that cost, quality, time,

October 2012 � Project Management Journal � DOI: 10.1002/pmj 49
and safety performance are reliableindicators of project performance.Studies by the Construction IndustryInstitute (CII) (2009) and Kang et al.(2008) showed that project perform-ance can be measured by factors suchas cost, time, safety, design changeratio, and rework ratio. Ling et al. (2006)found that the variable with the great-est impact in the architecture, engi-neering, and construction industries isthe understanding of customer require-ments; therefore, achieving this factoris essential for good project perform-ance and customer satisfaction.
Additionally, Cho et al. (2009) ana-lyzed the overall relationship betweenproject performance and project charac-teristics. They identified causal relation-ships among 17 project characteristicsand five project performance indica-tors. The five project performance indi-cators were: “reward ratio,” “unit cost,”“progress growth,” “cost increases,” and“speed of completion.” Application ofthe nine PMBOK® Guide KnowledgeAreas to examine international projectpractices in Ling, Low, Wang, andEgbelakin (2008) showed that thePMBOK® Guide significantly affects theperformance of international construc-tion projects in China.
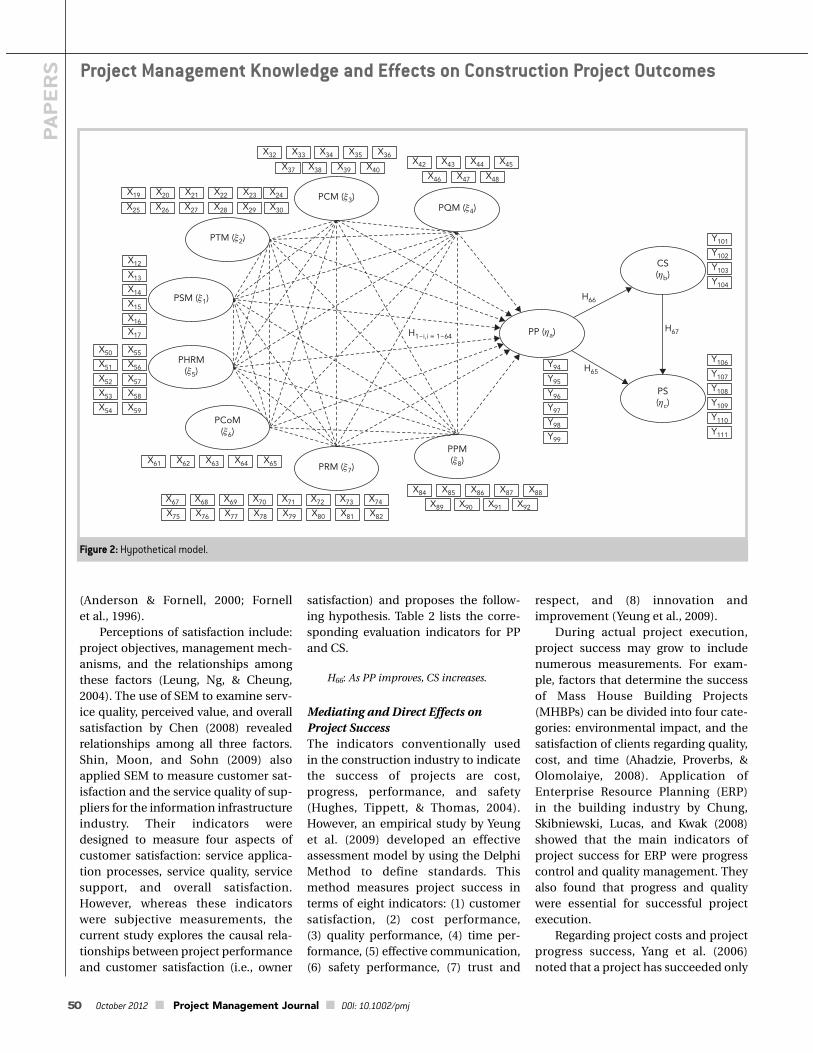
The PMBOK® Guide notes that proj-ect management processes typically useclearly defined interfaces to indicateindividual processes (Figure 1). In prac-tice, however, they often overlap. Theneed for integrated project managementresults from the interaction among dif-ferent processes. Therefore, this studyhypothesizes that the research subjectsfor project management TTS (Table 1)are provided for the management pur-pose of project scope (PSM), time(PTM), cost (PCM), quality (PQM),human resource (PHrM), communica-tions (PCoM), risk (PRM), and procure-ment (PPM). Based on the literature, thisstudy proposes the hypotheses listedbelow. Figure 2 depicts the complexstructural linkages (hypotheses)between the PMBOK® Guide and projectperformance (PP) in the research model
for testing the initial path hypotheses.Table 1 describes the evaluation indica-tors corresponding to PMBOK® Guideconstructs.
H01: Use of project managementenhances its perceived usefulness forPTM.
H02: Use of project managementenhances its perceived usefulness forPCM.
. . . . . . .
H63: Use of project managementenhances its perceived usefulness forPRM.
H64: Use of project managementenhances its perceived usefulness forPP.
Hypothesized Linkage Between ProjectPerformance and CustomerSatisfactionAs customer requirements diversify andas operating environments change,
increasing customer satisfaction hasbecome a key goal pursued by enter-prises seeking to increase tangiblevalue (Anderson & Fornell, 2000;Fornell, Johnson, Anderson, Cha, &Bryant, 1996). In 1993, the U.S. govern-ment appointed the Fornell researchteam to develop service standards, pri-marily to help American enterprisesincrease their competitiveness in inter-national markets. Another objectivewas to use standardized benchmarkingto analyze the domestic economy and toprovide the government with dataneeded to establish effective economicpolicy. Fornell surveyed 200 companiesin 34 industries to develop theAmerican Customer Satisfaction Index(ACSI) in 1994. The purpose of the ACSIis to provide a holistic measurement ofcustomer satisfaction based on surveysof customer satisfaction with product orservice quality. To ensure consistencyand comparability, the research modelbetween PP and CS developed in thisstudy incorporates ACSI characteristics
Human Resource Management/Communication Management
Time Management
Cost Management
Quality Management
Risk Management
Procurement Management
Integration Management
ScopeManagement
Initiation Planning Execution/Monitoring &
Controlling InstallationCompletion
Close Out &Turn Over
Full OperationsProject “Go” Decision Major Contracts
Figure 1: PMBOK® Guide and project phase.
50 October 2012 � Project Management Journal � DOI: 10.1002/pmj
Project Management Knowledge and Effects on Construction Project OutcomesP
AP
ER
S
(Anderson & Fornell, 2000; Fornell et al., 1996).
Perceptions of satisfaction include:project objectives, management mech-anisms, and the relationships amongthese factors (Leung, Ng, & Cheung,2004). The use of SEM to examine serv-ice quality, perceived value, and overallsatisfaction by Chen (2008) revealedrelationships among all three factors.Shin, Moon, and Sohn (2009) alsoapplied SEM to measure customer sat-isfaction and the service quality of sup-pliers for the information infrastructureindustry. Their indicators weredesigned to measure four aspects ofcustomer satisfaction: service applica-tion processes, service quality, servicesupport, and overall satisfaction.However, whereas these indicatorswere subjective measurements, thecurrent study explores the causal rela-tionships between project performanceand customer satisfaction (i.e., owner
satisfaction) and proposes the follow-ing hypothesis. Table 2 lists the corre-sponding evaluation indicators for PPand CS.
H66: As PP improves, CS increases.
Mediating and Direct Effects onProject SuccessThe indicators conventionally used in the construction industry to indicatethe success of projects are cost,progress, performance, and safety(Hughes, Tippett, & Thomas, 2004).However, an empirical study by Yeunget al. (2009) developed an effectiveassessment model by using the DelphiMethod to define standards. Thismethod measures project success interms of eight indicators: (1) customersatisfaction, (2) cost performance, (3) quality performance, (4) time per-formance, (5) effective communication,(6) safety performance, (7) trust and
respect, and (8) innovation andimprovement (Yeung et al., 2009).
During actual project execution,project success may grow to includenumerous measurements. For exam-ple, factors that determine the successof Mass House Building Projects(MHBPs) can be divided into four cate-gories: environmental impact, and thesatisfaction of clients regarding quality,cost, and time (Ahadzie, Proverbs, &Olomolaiye, 2008). Application ofEnterprise Resource Planning (ERP) in the building industry by Chung,Skibniewski, Lucas, and Kwak (2008)showed that the main indicators ofproject success for ERP were progresscontrol and quality management. Theyalso found that progress and qualitywere essential for successful projectexecution.
Regarding project costs and projectprogress success, Yang et al. (2006)noted that a project has succeeded only
PP (ηa)
CS(ηb)
PS(ηc)
PSM (ξ1)
PCM (ξ3)PQM (ξ4)
PHRM(ξ5)
PRM (ξ7)
PPM(ξ8)
PTM (ξ2)
PCoM(ξ6)
H1~i,i = 1~64
Y101
Y102
Y103
Y104
Y106
Y107
Y108
Y109
Y110
Y111
Y94
Y95
Y96
Y97
Y98
Y99
X12
X13
X14
X15
X16
X25
X24
X26
X23
X27 X29
X19 X20 X21 X22
X36X35
X37
X34
X38 X39 X40
X32 X33
X48X47X46
X42 X43 X44 X45
X55
X56
X57
X58
X59
X50
X51
X52
X53
X54
X61 X62 X63 X64 X65
X67 X68 X69 X70 X71 X72 X73 X74
X75 X76 X77 X78 X79 X80 X81 X82
X84 X85 X86 X87 X88
X89 X90 X91 X92
X17
X30X28
H65
H66
H67
Figure 2: Hypothetical model.

Group Construct Indicator
Project Management Techniques Scope Requirement
/Tools/Skills Expert scope judgment
Product analysis
Alternatives identification
Work breakdown structure
Inspection
Time Expert time judgment
Decomposition
Rolling wave planning
Analogous estimating
Parametric estimating
Three-point estimating
Reserve analysis
Critical path method
Critical chain method
Resource leveling
What-if scenario analysis
Schedule compression
Cost Expert cost judgment
Analogous estimating
Parametric estimating
Bottom-up estimating
Three-point estimating
Reserve analysis
Earned value management
Forecasting
To-complete performance index
Quality Quality audits
Cost of quality
Cause-and-effect diagrams
Control charts
Benchmarking
Design of experiments
Statistical sampling
Human Resource Training
Team-building activities
Ground rules
(Continues on next page)
Table 1: The indicators of project management tools and techniques in the PMBOK® Guide.

Project Management Knowledge and Effects on Construction Project OutcomesP
AP
ER
S
Group Construct Indicator
Colocation
Recognition and rewards
Observation and conversation
Project performance appraisals
Issue log
Conflict management
Manager’s interpersonal skills
Communication Stakeholder analysis
Communication requirements analysis
Communication methods
Reporting systems
Performance reports
Risk Documents reviews
Information-gathering techniques
Checklist analysis
Diagramming techniques
SWOT analysis
Expert risk judgment
Probability and impact matrix
Risk data quality analysis
Risk urgency assessment
Sensitivity analysis
Expected monetary value analysis
Modeling and simulation
Decision tree
Risk reassessment
Risk audits
Variance and trend analysis
Procurement Make-or-buy analysis
Expert law judgment
Bidder conference
Independent estimates
Advertising
Procurement negotiations
Procurement performance reviews
Claims administration
Negotiated settlements
Table 1: (continued)

October 2012 � Project Management Journal � DOI: 10.1002/pmj 53
if the actual budget is lower thanexpected and if the actual progress isfaster than expected; otherwise, it hasfailed. Additionally, in terms of the proj-ect execution described previously, theliterature on project managementdefined project success in terms of fac-tors such as objectives, budgeting,progress, and operating efficiency(Tesch, Sobol, Klein, & Jiang, 2009).
Previous studies have defined suc-cess in terms of three factors: cost, time,and progress. Other scholars have pro-posed adding eight other criteria,which results in 11 total criteria: usersatisfaction; supplier satisfaction; teamsatisfaction; satisfaction of stakehold-ers; progress, cost, and quality per-formance; meeting the needs of users;achieving project objectives; customersatisfaction (Frame, 2010); and repeatbusiness (Muller, Geraldi, & Turner,2011). Based on the above discussions,Table 2 lists the measurable indicators
for the conceptual constructs. Wehypothesize the following causal rela-tions among PP, CS, and PS (Figure 2):
H65: As PP improves, PS improves.
H67: As CS improves, PS improves.
Research Method and FlowThe research method and flow weredivided into four phases. Phase 1 of theresearch method established the SEMframework and the measurement indi-cators based on literature review. Phase2 collected survey data and assessed therelationships of indicators and con-structs based on the conceptual SEMmodel. Phase 3 optimized the modelspecifications to improve the SEMframework before modifying the struc-tural model. Specifically, the goodnessof fit (GOF) of the research model wasused as a criterion for evolutionaryoptimization. In the final phase, the
relationships of project managementTTS, PP, CS, and PS were analyzed usingthe optimized model.
Survey ProcessThe survey empirically measured theuse of the PMBOK® Guide in construc-tion engineering projects and how itaffects effectiveness and efficiency interms of project performance, stake-holder satisfaction, and project success.The questionnaire was evaluated in apilot study before performing the formalsurvey. The pretest results for 30 respon-dents showed that the constructs, alongwith their indicators, were easily under-stood and answered. To improve theresponse rate and data validity duringthe official survey, the survey packageincluded a postage-paid return enve-lope and the offer of a gift certificate forcompleting the questionnaire. Afterreceiving the completed survey formand confirming its completion, the giftcertificate was mailed to the physicaladdress of each respondent.
Structural Equation ModelingThe two classes of variables used in theresearch model were observed indica-tors and latent constructs. Observedindicators are those that can be meas-ured directly, such as usage of particu-lar techniques, tools, and skills. Latent constructs used in this study, whichincluded body of knowledge, projectperformance, customer satisfaction,and project success, are latent variablesthat are not directly measurable.Therefore, latent constructs are meas-ured by means of observable indica-tors. To establish an appropriate modelfor testing the research hypothesesregarding the impacts of latent con-structs on the other variables, this studyused structural equation modeling,which is widely considered the mosteffective statistical method for this purpose.
Structural equation modeling sys-tematically combines confirmatory fac-tor analysis, multiple regression analysis,and path analysis. It incorporates ameasurement model for confirmatory
Construct IndicatorProject performance Cost performance
Schedule performance
Quality performance
Safety performance
Rework
Change order
Customer satisfaction Meeting customer’s expectations
Satisfaction of quality
Satisfaction of schedule
Service quality of the contractor
Project success Completed on time
Completed within budget
Meeting quality requirement
Meeting design requirement
Overall stakeholders’ satisfaction
Reoccurring business
Table 2: Measurement indicators for project performance, customer satisfaction, and project success.

54 October 2012 � Project Management Journal � DOI: 10.1002/pmj
Project Management Knowledge and Effects on Construction Project OutcomesP
AP
ER
S
factor analysis of how well latent con-structs (i.e., group factors drawn fromfactor analysis) are represented byobserved indicators and a structuralmodel for multiple regression analysisand path analysis to model relation-ships between latent variables and afinal outcome (Chou, Kim, Kuo, & Ou,2011).
The structural equation model canthen be defined in terms of a set ofthree matrix equations. The first twoequations, which represent the meas-urement model, are:
(1)
and
(2)
Here �x is a q � n matrix of coeffi-cients representing the effects of theindependent latent variables (LVs) ontheir indicators, and � is a q � 1 vectorof “errors of measurement” in the indi-cators. Similarly, �y is a p � m matrix ofcoefficients representing the effects ofthe dependent LVs on their indicators,and � is a p � 1 vector of errors of meas-urement in these indicators. Thus, themeasurement model defines each ofthe measured variables as a linear com-bination of the LVs, plus an error term.The final SEM equation represents thestructural model, which defines therelations among the LVs:
(3)
In this equation, B is an m � mmatrix of coefficients representing theeffect of each dependent LV on each ofthe other dependent LVs. The matrix � isan m � n matrix of coefficients repre-senting the effect of each independentLV on each dependent LV. Finally, z is anm � 1 vector containing residuals, orerrors in equations, for each of thedependent LVs. Thus, the structuralmodel defines each dependent LV as alinear combination of independent LVsand other dependent LVs, plus a residual.
The goodness-of-fit indicator is a cri-terion for assessing the appropriateness
H � BH � �J � Z
Y � ∂yJ � E
X � ∂xJ � D
of a SEM. The main purpose of assessingGOF is determining whether the theoret-ical model constructed by researchersreasonably explains the data actuallyobserved. This study uses the followingindicators as the fitness criteria for evolu-tionary optimization:
a. Chi-square/degrees of freedom ratio
:
As the number of estimation variablesin a hypothetical model increases, thedegree of freedom increases; the Chi-square value also increases with thenumber of samples. When consideringboth the Chi-square value and thedegree of freedom, the ratio of the twocan be used as an indicator of modelfit—that is, values less than 3 indicate agood fit (Hayduk, 1987).b. Goodness-of-fit index (GFI):
This indicator is the ratio betweenobserved variance and the square of thedifference between an observed Smatrix and a matrix � constructedusing a theoretical method. This indica-tor functions similarly to explainedvariance (R2) in the regression analysis(Wallgren & Hanse, 2007). The formulafor calculating this indicator is:
(4)
where the numerator is the sum of theweighted variance reproduced basedon theory; the denominator is the totalsum of weighted variance from repro-duction of covariance based on actualobservation, and W is the weightedmatrix. The GFI value ranges from 0 to1, where values closest to 1 have thebest fit (Hair, Black, Babin, & Anderson,2010).
c. Incremental fit index (IFI):
The IFI is a category of GOF indicatorsfor SEM; a common indicator in thiscategory is comparative fit index. Thisindicator must be calculated using otherbaseline models as a reference point. TheGOF of the hypothetical models pro-posed by the researchers for empiricaldata is assessed using comparative
GFI �tr(s�Ws)tr(s�Ws)
a x2dofb
methods. Typically, the closer the IFI to1, the better the goodness of fit(Benamati & Lederer, 2008). Equation 5shows the formula for IFI:
(5)
where is the Chi-square of the nullor base model and is the Chi-squareof the proposed model.
d. Comparative fit index (CFI):
This indicator reflects not only thedifference between a proposed modeland a null model, but also the disper-sion of a tested model and central Chi-square distribution. The CFI is equal tothe discrepancy function adjusted forsample size. Any hypothetical modelshould have a GOF superior to that ofthe null model, which is the least idealmodel. Therefore, the closer the CFIindicator to 1, the better the non-cen-tral Chi-square distribution (Bagozzi &Yi, 1988).
e. Root mean square error of approxi-mation (RMSEA):
The RMSEA measures the differ-ence between a measured observedcovariance matrix and an estimatedcovariance matrix versus the unitdegree of freedom (dof). The smallerthe RMSEA, the better the model fit. Avalue less than 0.1 indicates an accept-able model; a value less than 0.08 is areasonable GOF for the model; and avalue less than 0.05 indicates an excel-lent GOF (Hair et al., 2010). The formu-la for this indicator is shown inEquation 6:
, where (6)
After carefully considering theabove description and review, the fol-lowing optimization process was per-formed to examine the indexes:
i. Singular index testing: select fiveindicators to compare their independ-ent criteria.
ii. Synthesis Index (SI) testing: com-pare the criteria used in GFI, CFI, andIFI. The closer the value to 1, the better
F0 �x2 dof
NRMSEA � B
F0dof
x2test
x2indep
IFI �x2indep x2test
x2indep doftest
�

October 2012 � Project Management Journal � DOI: 10.1002/pmj 55
the fit; the RMSEA judgment criteriaindicates a better fit as it approaches 0.If GFI, CFI, and IFI are reversed, theyconstitute the same judgment criterionas RMSEA. Restated, an SI value closerto 0 indicates a better fit. The formula isshown in Equation 7:
(7)
Reliability and Validity AnalysisInternal consistency reliability, which ismeasured by “Kuder-Richardson relia-bility” (KRR) and the “a coefficient,” is adirect indicator of the consistency ofconstructs or correlations betweenconstructs. The KRR is typically used toindicate the reliability of the measuredvariables. Here, this analysis is used tocompare reliability between the meas-ured indicators. Cronbach (1951) fur-ther modified KRR as follows (Hair et al., 2010):
(8)
: variance of component i; s2: variancein test scores; k: number of questions.
Validity refers to the effectiveness ofa tool for measuring a variable of inter-est. Validity is often measured by aver-age variance extracted (AVE) and com-posite reliability (CR) (Fornell &Larcker, 1981). First, the loading coeffi-cient is obtained using factor analysisto measure the consistency betweenindicators and constructs. In CFA, theAVE measures the mean varianceextracted for the items loaded on a con-struct; it indicates the explanatorypower of the variance in each indicatorfor a latent construct. This value can becalculated using Equation 9:
(9)
where AVE is average variance extract-ed, li denotes standardized factor load-ings of each indicator for the construct,and n is the number of items. The high-er the factor loading, the greater the
AVE �an
i�1l2i
n
s2i
Cronbach’s a �k
k 1a1
a si2
s2b
SI �1
GFI
1CFI
1IFI
RMSEA
explanatory power of the indicator for agiven construct. Hair et al. (2010) sug-gested that a factor load should exceed0.7, while Fornell and Larcker (1981)indicated that an AVE exceeding 0.5 issatisfactory.
Composite reliability represents theinternal consistency of indicators with-in a construct where the higher the reliability, the higher the internal con-sistency in these latent constructs.Fornell and Larcker (1981) suggested aminimum CR of 0.6, while Hair et al.(2010) suggested a threshold of 0.7. Theformula for composite reliability is:
(10)
where CR is a composite reliability, li
denotes the standardized factor load-ings of each indicator for the construct,and ei is the measurement error for themeasured indicator i.
Evolutionary Optimization for ModelSpecification SearchThe PMBOK®Guide recommends theuse of project management techniquesto improve project performance andsuccess. However, searching for thecombination of project managementtechniques that obtains the largestimprovement in project performance ona case-by-case basis is very time-con-suming. Therefore, this study usedgenetic algorithm (GA), an adaptiveheuristic search procedure that cansolve large-scale optimization problems.
The goal of GA is finding the opti-mum of a given function over a givensearch space. In the initialization step, aset of points in the search space iseither selected randomly or specified bythe user. A GA iteration is then per-formed in four sequential steps, includ-ing evaluation, selection, reproduction,and replacement, until a stopping con-dition is met. The sequential steps are(1) evaluation: compute the function sothat a starting population of individualscan be ordered from best to worst;
CR �
a an
i�1lib
2
a an
i�1lib
2
a an
i�1eib
2
(2) selection: select pairs of individuals,usually called parents; (3) reproduc-tion: produce the offspring of pairs ofindividuals; and (4) replacement: gen-erate a new population of individualsby replacing some worse members ofthe population with better ones.
Searching for the specific model inSEM is difficult, especially when thenumber of possible alternative modelsis large. Therefore, automation is essen-tial for managing this chaotic process.The searching space was focused on therelationship within the project man-agement knowledge bodies and projectperformance constructs. Severalimportant issues arise before a GA pro-cedure can be established for perform-ing a specification search in SEM. Theseissues include the following:
• Choosing a Criterion for Model SelectionMany criteria have been proposed inthe SEM literature for evaluating theGOF of a specified model. Given the numerous fit indices proposed in theSEM literature, several fits (where x2;
; GFI; CFI; IFI, RMSEA, and SI)
were selected as criteria for modelselection in the GA search in this study.
• Model Definition and ChromosomalCoding
Empirical data were collected and theliterature was reviewed before creatingan initial structural model by assumingpossible paths (where ). Themodel paths were then coded. Forexample, if a relationship was observedbetween project scope and project per-formance, the path was coded as 1.Otherwise, the path was coded as 0.
• Generating the Initial PopulationBased on the demonstration case, thechromosome for the structural modelcan be written with 64 genes. Althoughmany chromosomes can be generated,this study randomly generated threefrom an initial chromosome for illustra-tion purposes. These members werethen used to evaluate their correspon-ding estimated criteria.
H1~ i,i�1~64
x2
DOF

Project Management Knowledge and Effects on Construction Project OutcomesP
AP
ER
S
Attribute Distribution Frequency Percent (%)
Gender Male 114 89.8
Female 13 10.2
Total 127 100.0
Age 21–30 34 26.8
31–40 43 33.9
41–50 28 22.0
51–60 19 15.0
� 61 3 2.4
Total 127 100.0
Education High school 1 0.8
University 26 20.5
Graduate or higher 100 78.7
Total 127 100.0
Level of awareness and certified training program for PMBOK® Guide Low familiarity 51 40.2
Below average familiarity 30 23.6
Average familiarity 29 22.8
Above-average familiarity 11 8.7
High familiarity 6 4.7
Total 127 100.0
License Licensed registered engineer 60 47.2
PMP 5 3.9
None 52 40.9
Others 10 7.9
Total 127 100.0
Role in project Owner/government 60 47.2
Contractor 24 18.9
Consultancy/technical services 37 29.1
Professional 5 3.9
Others 1 0.8
Total 127 100.0
Role in company Person in charge 13 10.2
Manager 34 26.8
Designer 8 6.3
Site manager 4 3.1
In-house engineers 28 22.0
On-site engineers 7 5.5
(Continues on next page)
Table 3: Socioeconomic characteristics of survey respondents.
October 2012 � Project Management Journal � DOI: 10.1002/pmj 57
• Executing the GA Search ProcedureFrom this initial population, new offspringwere generated by crossover, mutation,and reproduction. The offspring were thendecoded for import to Amos 16.0 softwarein order to calculate their GOF values. If theoffspring criterion was better than the onein the initial population, it was replaced toyield the following new population.• Establishing a Stopping Criterion andModifying ModelRunning the GA search procedurerevealed the best chromosome in the
population according to the evaluationcriteria. The optimized model was thenmodified so that the GOF indices metthe standards suggested in the literature.
Analytical Process and ResultsDescriptive StatisticsA convenience survey was performed bydistributing 299 paper questionnaires.Of these, 115 effective questionnaireswere retrieved (including 75 completedby various professional institutions) fromindustry practitioners. Additionally, 12
surveys were received from onlinerespondents, of which 127 were valid.Therefore, the effective response ratewas 40.83%. The questionnaires appliedthe 10-point Likert scale suggested inprevious studies. The empirical datawere then used to test the proposedmodel using GA-SEM methodology asdescribed earlier.
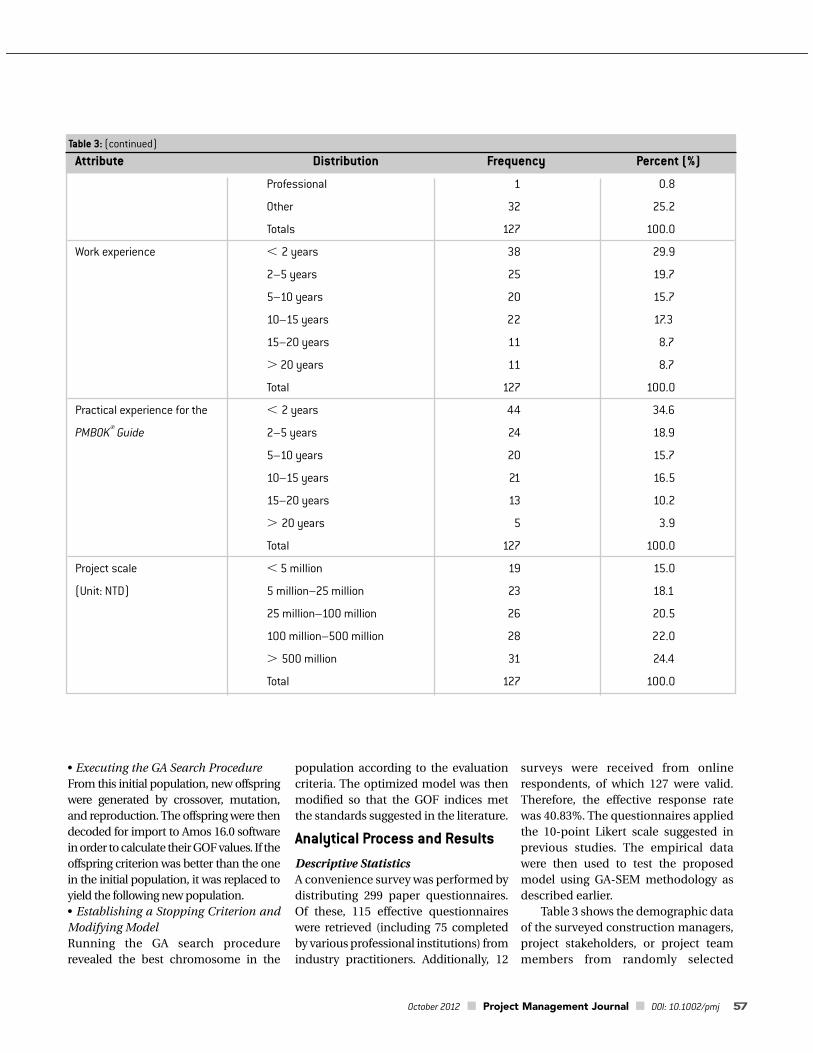
Table 3 shows the demographic dataof the surveyed construction managers,project stakeholders, or project teammembers from randomly selected
Attribute Distribution Frequency Percent (%)
Professional 1 0.8
Other 32 25.2
Totals 127 100.0
Work experience � 2 years 38 29.9
2–5 years 25 19.7
5–10 years 20 15.7
10–15 years 22 17.3
15–20 years 11 8.7
� 20 years 11 8.7
Total 127 100.0
Practical experience for the � 2 years 44 34.6
PMBOK® Guide 2–5 years 24 18.9
5–10 years 20 15.7
10–15 years 21 16.5
15–20 years 13 10.2
� 20 years 5 3.9
Total 127 100.0
Project scale � 5 million 19 15.0
(Unit: NTD) 5 million–25 million 23 18.1
25 million–100 million 26 20.5
100 million–500 million 28 22.0
� 500 million 31 24.4
Total 127 100.0
Table 3: (continued)
58 October 2012 � Project Management Journal � DOI: 10.1002/pmj
Project Management Knowledge and Effects on Construction Project OutcomesP
AP
ER
S
engineering-related firms. Of therespondents, 89.8% were male and10.2% were female; most (82.7%)respondents were in the age range of 21to 50 years. Respondents who had aneducation level of college or above com-prised 99.2% of the total; 86.6% of indi-viduals had an average or poorer under-standing of project management knowl-edge. Although project managementtechniques are apparently widely usedin engineering activities, a relativelysmall proportion of respondents had atrue understanding of the underlyingprinciples of project management.About half (47.2%) of the respondentsheld a technician’s license, while 40.9%did not; only 3.9% were a ProjectManagement Professional (PMP)® cre-dential holder.
Notably, most survey respondentswere business owners or governmentemployees (47.2%), followed by indi-viduals working in consulting compa-nies or technical services (29.1%). Mostrespondents were either managers orother (26.8% and 25.2%, respectively).In-house engineers constituted 22%. Interms of work experience at their cur-rent unit, 29.9% had worked for lessthan two years; 52.7% for 2 to 15 years;and 17.4% for 15 to 20 years. In terms ofexperience, 34.6% had less than twoyears of experience in constructionproject management; 61.3% had 2 to 20years of experience; and 3.9% had morethan 20 years of experience. In terms ofthe distribution of project scale, morethan 60% had experience in projectsranging from 5 million New TaiwanDollar (NTD; 1 USD is approximatelyequal to 30 NTD) to 500 million NTD.
The questionnaire survey sampledprofessionals in the Taiwan area. TheSEM maximum likelihood estimation(MLE) was primarily used for modelestimation, with the sample matchingan approximately normal distribution(Kline, 2005). Kline (2005) has indicatedthat the normal theoretical peak is kur-tosis � 3 (current statistical software willsubtract 3; thus, kurtosis � 0 and skew �0 is normal). In practice, however, a skew
with an absolute value within 2 and akurtosis with an absolute value within 7can be considered normal, whereas askew larger than 3 and a kurtosis largerthan 20 are considered extreme. Graphicdepiction of the data distributionsobtained in normal testing in this studyshowed that the above criteria were metand that the data presented an approxi-mately normal distribution.
Confirmatory AnalysisThe main purpose of confirmatoryanalysis is to test whether the linkagesbetween the measured variables andlatent constructs are reliable and valid.The typical method of measuring thereliability of each construct is examin-ing the Cronbach’s Alpha (a) coeffi-cient, AVE, and CR (Hair et al., 2010).
Table 4 shows that most factor load-ings for the measured indicatorsexceeded 0.7. However, a total of 19items did not reach this standard.Moreover, aside from the PPM con-struct (0.4354) and the PCM construct(0.4859), the AVE of the other con-structs exceeded 0.5. The 19 variableswith factor loadings of less than 0.7were deleted after the quality analysisshowed that their removal would effec-tively increase the reliability of the asso-ciated constructs.
After reloading these indicators, theAVE of the PSM construct increasedfrom 0.5411 to 0.6068; the AVE of thePTM construct increased from 0.5222 to0.6058; and the AVE of the PCM con-struct increased from 0.4859 to 0.6065.The AVE of the PRM constructincreased from 0.6388 to 0.6634; that ofthe PPM construct increased from0.4354 to 0.5767; and that of the PP con-struct increased from 0.6380 to 0.6837.The AVE exceeded 0.5 for all constructs,indicating that this survey had accept-able overall reliability and validity.
Regarding the correlation coefficientsof the various constructs, a correlationcoefficient larger than 0.7 generally repre-sents a strong correlation, whereas a coef-ficient between 0.3 and 0.7 represents amoderate correlation, and a coefficient
smaller than 0.3 represents low correlation.The correlation matrix listed in Table 5shows that PPM had strong correlationswith PCM, PHrM, PRM, PQM, PTM, andPP. The PCM had strong correlations withPCoM, PRM, PQM, PTM, and PSM. ThePCoM had strong correlations withPHrM, PQM, PTM, and PP. The PHrM hadstrong correlations with PQM, PTM, andPP. The PRM had strong correlations withPQM and PTM. The PQM had strong cor-relations with PTM and PSM. The PTMhad strong correlations with PSM. The PP had strong correlations with CS andPS. Lastly, CS had a strong correlationwith PS. All of the above constructs hadcorrelation coefficients larger than 0.7.
Conversely, PPM showed only mod-erate correlations with PCoM, PSM, CS,and PS. The PCM had a moderate corre-lation with PHrM, PP, CS, and PS. ThePCoM had a moderate correlation withPRM, PSM, CS, and PS. The PHrM had amoderate correlation with PRM, PSM,CS, and PS. The PRM had a moderatecorrelation with PSM, PP, CS, and PS.The PQM had a moderate correlationwith PP, CS, and PS. The PTM had amoderate correlation with PP, CS, andPS. The PSM had a moderate correla-tion with PP, CS, and PS. All of the aboveassociations had correlation coeffi-cients between 0.3 and 0.7, represent-ing a moderate association.
Evolutionary Model Construction andModificationThe modeling process was performed intwo phases. The first phase studied rela-tionships between the PMBOK® Guideand PP using evolutionary GA optimiza-tion due to the complex linkages. Theoverall SEM analysis of the PMBOK®
Guide, PP, CS, and PS was then performedin the second phase. The hypothesispaths (H08, H09, H32, H40, and H48), initial-ly assumed to exist according to the liter-ature, were designated Chromosome 1.
By randomly producing three chro-mosome sets, Chromosome 1 creates fourchromosome sets as the initial populationfor executing the evolution process.Mating, mutation, and replacement steps

October 2012 � Project Management Journal � DOI: 10.1002/pmj 59
Average Variance Composite Cronbach’s Construct Indicator Factor Loading Extracted Reliability Alpha (a)
Scope Requirement 0.65 0.5411 0.875 0.8727
Expert scope judgment 0.71
Product analysis 0.80
Alternatives identification 0.84
Work breakdown structure 0.76
Inspection 0.63
Time Expert time judgment 0.53 0.5222 0.9282 0.9275
Decomposition 0.72
Rolling wave planning 0.77
Analogous estimating 0.68
Parametric estimating 0.66
Three-point estimating 0.68
Reserve analysis 0.82
Critical Path Method 0.62
Critical Chain Method 0.81
Resource leveling 0.82
What-if scenario analysis 0.71
Schedule compression 0.79
Cost Expert cost judgment 0.46 0.4859 0.8923 0.8932
Analogous estimating 0.62
Parametric estimating 0.60
Bottom-up estimating 0.62
Three-point estimating 0.72
Reserve analysis 0.79
Earned value management 0.77
Forecasting 0.83
To-complete performance index 0.78
Quality Quality audits 0.72 0.5622 0.8996 0.8989
Cost of quality 0.77
Cause-and-effect diagrams 0.75
Control charts 0.84
Benchmarking 0.72
Design of experiments 0.70
Statistical sampling 0.74
(Continues on next page)
Table 4: Confirmatory analysis of variables.

60 October 2012 � Project Management Journal � DOI: 10.1002/pmj
Project Management Knowledge and Effects on Construction Project OutcomesP
AP
ER
S
Average Variance Composite Cronbach’s Construct Indicator Factor Loading Extracted Reliability Alpha (a)
Human resource Training 0.77 0.6983 0.9584 0.9577
Team-building activities 0.75
Ground rules 0.86
Co-location 0.81
Recognition and rewards 0.77
Observation and conversation 0.91
Project performance appraisals 0.86
Issue log 0.86
Conflict management 0.86
Manager’s interpersonal skills 0.89
Communication Stakeholder analysis 0.96 0.7232 0.9279 0.9287
Communication requirements analysis 0.94
Communication methods 0.87
Reporting systems 0.76
Performance reports 0.69
Risk Documents reviews 0.52 0.6388 0.9476 0.9653
Information-gathering techniques 0.78
Checklist analysis 0.85
Diagramming techniques 0.81
SWOT analysis 0.81
Expert risk judgment 0.81
Probability and impact matrix 0.79
Risk data quality analysis 0.88
Risk urgency assessment 0.78
Sensitivity analysis 0.83
Expected monetary value analysis 0.82
Modeling and simulation 0.79
Decision tree 0.80
Risk reassessment 0.85
Risk audits 0.78
Variance and trend analysis 0.83
(Continues on next page)
Table 4: (continued)

October 2012 � Project Management Journal � DOI: 10.1002/pmj 61
are performed based on the genetic algo-rithm. Figure 3 shows that the SI valuesderived from distinct SEM analysesapproach a convergence of 4.9 after the135th evolution. Thus, the structuralmodel of this evolution was adopted asthe basis of the second phase of modelingin this study.
During parameter estimation,researchers may discover that the
assumed theoretical model does nothave a good fit to the observed data. Toimprove model GOF, researchers tend toincrease or remove the paths betweenconstructs or indicators within con-structs established in the initial model(Hair et al., 2010). This study performedconfirmatory analysis of the above opti-mized structural model to remove pathswith unsatisfactory significance levels.
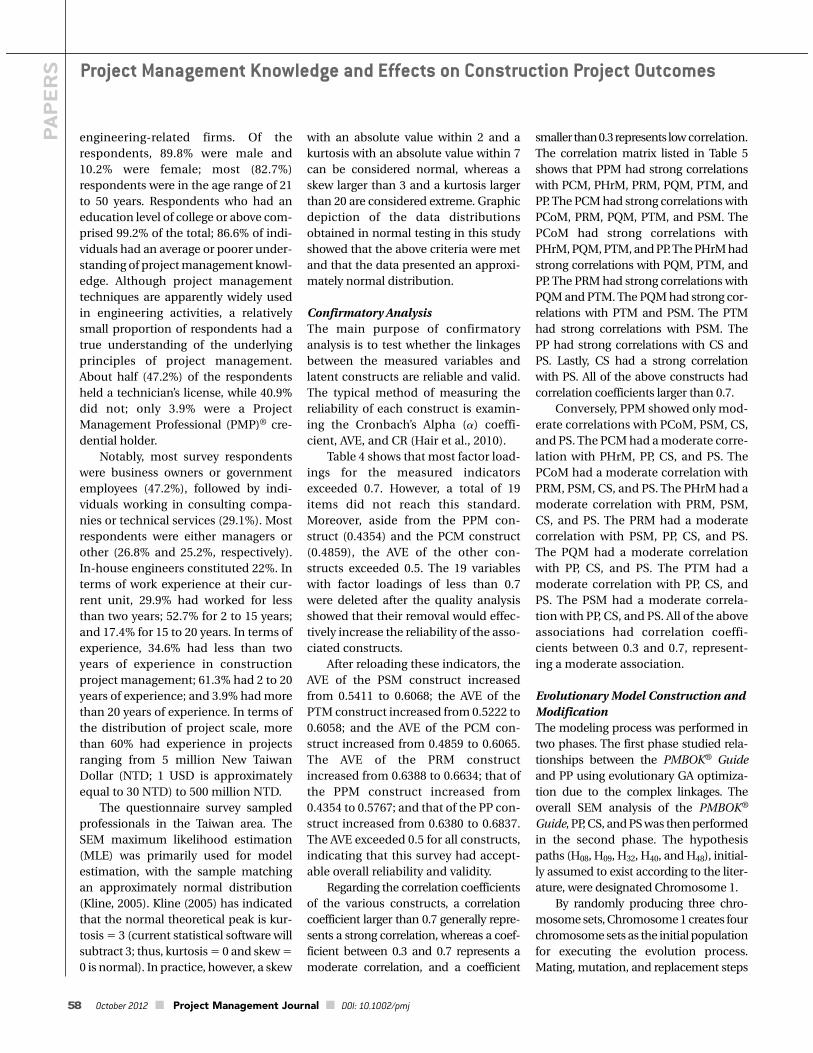
Hypotheses H08, H19, and H33 revealed pvalues lower than 0.1 and were thereforeunsustainable. Thus, this study deletedthese three assumed paths. Table 6shows the final results.
Second, adjustment indicator errorswere identified in order to delete the corre-sponding observed variables until theGOF index matches the criteria listed inTable 7. The table also shows that the GOF
Average Variance Composite Cronbach’s Construct Indicator Factor Loading Extracted Reliability Alpha (a)
Procurement Make-or-buy analysis 0.63 0.4354 0.8680 0.8593
Expert law judgment 0.63
Bidder conference 0.70
Independent estimates 0.59
Advertising 0.27
Procurement negotiations 0.77
Procurement performance reviews 0.84
Claims administration 0.72
Negotiated settlements 0.63
Projectperformance Cost performance 0.83 0.6380 0.9129 0.9088
Schedule performance 0.83
Quality performance 0.89
Safety performance 0.80
Rework 0.78
Change order 0.64
Customersatisfaction Meeting customer’s 0.96 0.7966 0.9397 0.9392
expectations
Satisfaction of quality 0.94
Satisfaction of schedule 0.79
Service quality of the contractor 0.87
Project success Completed on time 0.76 0.7552 0.9483 0.9448
Completed within budget 0.75
Meeting quality requirement 0.92
Meeting design requirement 0.86
Stakeholders’ satisfaction 0.94
Reoccurring business 0.96
Table 4: (continued)

62 October 2012 � Project Management Journal � DOI: 10.1002/pmj
Project Management Knowledge and Effects on Construction Project OutcomesP
AP
ER
S
index values improved after model modi-
fication. The , GFI, CFI, IFI, and RMSEA
increased from 2.316, 0.486, 0.727, 0.729,and 0.102 to 1.549, 0.802, 0.941, 0.942, and0.066, respectively, which matched valuesrecommended by the literature.
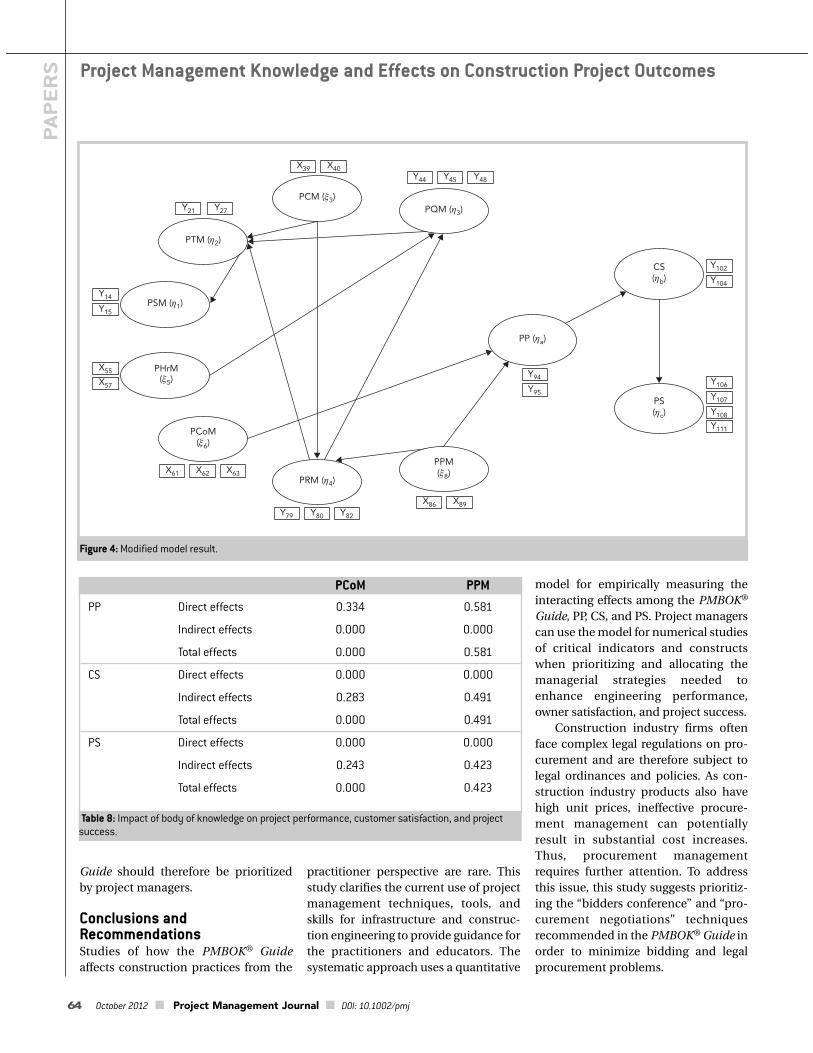
Figure 4 shows the final structuralmodel after completing the modifica-tion process. The remaining con-structs were PSM construct (product
x2
dof
analysis and alternatives identifica-tion); PTM construct (rolling waveplanning and the Critical ChainMethod); PCM construct (forecastingand to-complete performance index);project quality management con-structs (cause-and-effect diagrams,control charts, and statistical sam-pling); PHrM construct (observationand conversation, and issue log);PCoM construct (stakeholder analysis,
communication requirements analy-sis, and communication methods);PRM construct (decision tree, riskreassessment, and variance and trendanalysis); PPM construct (bidder con-ference and procurement negotia-tions); PP construct (cost performanceand schedule performance); CS construct (satisfaction of quality andservice quality provided by the contrac-tors); and PS construct (completion ontime, completion within budget, meet-ing quality requirements, recurringbusiness).
Analysis DiscussionEleven constructs and their correspon-ding 27 indicators revealed critical asso-ciations with each other. The variousimpacts were categorized as direct, indi-rect, and overall. Overall impacts includeboth direct and indirect impacts. Here,direct impact refers to the direct relation-ships between two constructs in amodel, while indirect impact refers to therelationships between two constructs in amodel through a mediating construct(Wallgren & Hanse, 2007). Table 8 showsthat PCoM and PPM techniques, tools,and skills significantly affect PP, CS, andPS, both directly and indirectly. Thus,the empirical data suggest that enhancing
PPM PCM PCoM PHrM PRM PQM PTM PSM PP CS
PCM 0.732 –
PCoM 0.672 0.774 –
PHrM 0.817 0.698 0.796 –
PRM 0.709 0.817 0.657 0.643 –
PQM 0.784 0.794 0.773 0.875 0.745 –
PTM 0.743 0.871 0.743 0.752 0.824 0.86 –
PSM 0.642 0.702 0.637 0.682 0.661 0.729 0.797 –
PP 0.724 0.668 0.703 0.703 0.614 0.693 0.682 0.654 –
CS 0.594 0.548 0.577 0.577 0.504 0.569 0.560 0.537 0.821 –
PS 0.520 0.480 0.505 0.504 0.441 0.497 0.490 0.469 0.718 0.841
Table 5: Construct correlation matrix.
0 10 20 30 40 50 60 70 80 90 100 110 120 130 1404.85
4.90
4.95
5.00
5.05
5.10
5.15
5.20
5.25SI
Iteration No.
Figure 3: SI convergence diagram.
October 2012 � Project Management Journal � DOI: 10.1002/pmj 63
these two techniques is the most effi-cient way of improving project perform-ance, business owner satisfaction, andproject success.
Notably, Table 9 shows that theimpact of procurement management onthe cost and schedule performance eval-uation indicators (0.506 and 0.471) wasalmost double that of communicationmanagement (0.291 and 0.271).Similarly, compared to communicationmanagement, procurement managementtechniques have a 70% larger influenceon business owner satisfaction with theengineering quality and service quality
provided by contractors. Lastly, procure-ment and communication managementhave the largest effects (0.405 and 0.233,respectively) on the recurring businessof the project success construct.
The results of the SEM analysisshow that PHrM has a strong correla-tion with PQM, PPM, and PCoM (0.875,0.817, and 0.796, respectively); timemanagement has a strong correlationwith PCM, PRM, PSM, and PQM (0.871,0.824, 0.797, and 0.860, respectively);and owner satisfaction has a strong cor-relation with PP and PS (0.821 and0.821, respectively).
Particularly, the final confirmedmodel indicates that only PCoM andPPM have statistically significantimpacts on project performance, busi-ness owner satisfaction, and projectsuccess (Table 6). Confirmatory analy-sis shows that PCoM can be assessed by“stakeholder analysis” (0.949), “com-munication requirements analysis”(0.945), and “communication methods”(0.872). The PPM can be assessed by “bid-der conference” (0.822) and “procurementnegotiations” (0.770). For enhancedproject performance, the above fivetechniques described in the PMBOK®
Hypothesis Estimate StatisticCost → Risk 0.403 0.012**
Procurement → Risk 0.398 0.014**
Human resource → Quality 0.499 ***
Risk → Quality 0.412 ***
Cost → Time 0.273 0.009**
Quality → Time 0.439 ***
Risk → Time 0.369 0.002**
Time → Scope 0.799 ***
Communication → Project performance 0.334 0.004**
Procurement → Project performance 0.581 ***
Project performance → Customer satisfaction 0.846 ***
Customer satisfaction → Project success 0.860 ***
** Significant at 0.05 level. *** Significant at 0.01 level.
Table 6: Path testing results of revised research hypotheses.
ValueIndex Criterion Source Before Model Modification After Model Modification
�3 (Hayduk, 1987) 2.316 1.549
GFI �0.8 (Scott, 1994) 0.486 0.802
CFI �0.8 (Bagozzi & Yi, 1988) 0.727 0.941
IFI �0.8 (Benamati & Lederer, 2008) 0.729 0.942
RMSEA �0.1 (Hu & Bentler, 1999) 0.102 0.066
x2
dof
Table 7: Goodness-of-fit index criterion and output value.
64 October 2012 � Project Management Journal � DOI: 10.1002/pmj
Project Management Knowledge and Effects on Construction Project OutcomesP
AP
ER
S
Guide should therefore be prioritizedby project managers.
Conclusions andRecommendationsStudies of how the PMBOK® Guideaffects construction practices from the
practitioner perspective are rare. Thisstudy clarifies the current use of projectmanagement techniques, tools, andskills for infrastructure and construc-tion engineering to provide guidance forthe practitioners and educators. Thesystematic approach uses a quantitative
model for empirically measuring theinteracting effects among the PMBOK®
Guide, PP, CS, and PS. Project managerscan use the model for numerical studiesof critical indicators and constructswhen prioritizing and allocating themanagerial strategies needed toenhance engineering performance,owner satisfaction, and project success.
Construction industry firms oftenface complex legal regulations on pro-curement and are therefore subject tolegal ordinances and policies. As con-struction industry products also havehigh unit prices, ineffective procure-ment management can potentiallyresult in substantial cost increases.Thus, procurement managementrequires further attention. To addressthis issue, this study suggests prioritiz-ing the “bidders conference” and “pro-curement negotiations” techniquesrecommended in the PMBOK® Guide inorder to minimize bidding and legalprocurement problems.
PP (ηa)
CS(ηb)
PS(ηc)
PSM (η1)
PCM (ξ3)PQM (η3)
PHrM(ξ5)
PRM (η4)
PTM (η2)
PCoM(ξ6)
Y102
Y104
Y106
Y107
Y108
Y111
Y94
Y95
Y14
Y15
Y27Y21
X39 X40Y48Y44 Y45
X55
X57
X61 X62 X63
Y79 Y80 Y82
X86 X89
PPM(ξ8)
Figure 4: Modified model result.
PCoM PPM
PP Direct effects 0.334 0.581
Indirect effects 0.000 0.000
Total effects 0.000 0.581
CS Direct effects 0.000 0.000
Indirect effects 0.283 0.491
Total effects 0.000 0.491
PS Direct effects 0.000 0.000
Indirect effects 0.243 0.423
Total effects 0.000 0.423
Table 8: Impact of body of knowledge on project performance, customer satisfaction, and projectsuccess.

October 2012 � Project Management Journal � DOI: 10.1002/pmj 65
Meanwhile, as construction tech-nology is already highly developed, com-munication management is extremelyimportant not only for converging andintegrating technology, but also forfacilitating the clear and effective com-munication of stakeholder opinionswithin project teams. This study recom-mends the use of “stakeholder analy-sis,” “communication requirementsanalysis,” and the “communicationmethods” addressed in the PMBOK®
Guide to perform effective communica-tion management.
The empirical results of this investi-gation are expected to have many prac-tical applications. For researchers usingstructural equation models, the pro-posed perspective can assist in effi-ciently searching for structural paths.For construction practitioners, thisstudy hopes to improve project per-formance, increase owner satisfaction,and facilitate the effective use of man-agement techniques by industry workersseeking success under circumstances oflimited capital, time, and other relevantresources and thus improve efficiencyin the use of management resources.This study contributes to the literatureby providing insight into interactionsamong the PMBOK® Guide TTS, PP, CS,and PS in engineering practice. Thefindings of this study can be used by
project managers and educators to tai-lor the PMBOK® Guide to their uniqueneeds and to design effective trainingprograms for construction specialists.
Although this study prioritizes thesignificance of the PMBOK® Guide tothe general construction business, theconclusions are based on the sampleconveniently collected in Taiwan.Future work can expand the scale ofsurvey and even a cross-nation com-parison to consolidate the researchfindings in particular project types. Afurther study can be conducted by ana-lyzing the level of awareness for thePMBOK® Guide on construction proj-ect outcomes. Additionally, a periodicsurvey is recommended for long-termevaluation of the PMBOK® Guideusage on owner satisfaction and proj-ect success. This work limits on the uti-lization of indicators from thePMBOK® Guide. Future researcherscan update and explore novel indica-tors that are appropriate to assess theconstructs. �
ReferencesAhadzie, D. K., Proverbs, D. G., &Olomolaiye, P. O. (2008). Critical suc-cess criteria for mass house buildingprojects in developing countries.International Journal of ProjectManagement, 26(6), 675–687.
Anantatmula, V. S. (2008). The role oftechnology in the project manager per-formance model. Project ManagementJournal, 39(1), 34–48. doi:10.1002/pmj.20038
Anderson, E. W., & Fornell, C. (2000).Foundations of the American customersatisfaction index. Total QualityManagement, 11(7), 869–882.
Bagozzi, R. P., & Yi, Y. (1988). On theevaluation of structural equation mod-els. Journal of the Academy ofMarketing Science, 16(1), 74–94.
Benamati, J. S., & Lederer, A. L. (2008).Decision support systems unfrastruc-ture: The root problems of the man-agement of changing IT. DecisionSupport Systems, 45(4), 833–844.
Bryde, D. J., & Wright, G. H. (2007).Project management priorities and thelink with performance managementsystems. Project Management Journal,38(4), 5–11. doi: 10.1002/pmj.20014
Chen, C.-F. (2008). Investigating struc-tural relationships between servicequality, perceived value, satisfaction,and behavioral intentions for air pas-sengers: Evidence from Taiwan.Transportation Research Part A: Policyand Practice, 42(4), 709–717.
Cho, K., Hong, T., & Hyun, C. (2009).Effect of project characteristics onproject performance in constructionprojects based on structural equationmodel. Expert Systems withApplications, 36(7), 10461–10470.
Chou, J.-S., Kim, C., Kuo, Y.-C., & Ou,N.-C. (2011). Deploying effective serv-ice strategy in the operations stage ofhigh-speed rail. TransportationResearch Part E: Logistics andTransportation Review, 47(4), 507–519.doi: 10.1016/j.tre.2010.12.004
Chung, B. Y., Skibniewski, M. J., Lucas,H. C., Jr., & Kwak, Y. H. (2008).Analyzing enterprise resource plan-ning system implementation successfactors in the engineering-construc-tion industry. Journal of Computing inCivil Engineering, 22(6), 373–382.
PCoM PPM
PP Cost performance 0.291 0.506
Schedule performance 0.271 0.471
CS Satisfaction of quality 0.259 0.450
Service quality provided by the contractors 0.244 0.425
PS Completed on time 0.189 0.328
Completed within budget 0.181 0.314
Meeting quality requirement 0.225 0.390
Reoccurring business 0.233 0.405Table 9: Impact of management techniques on project performance, customer satisfaction, and project success.

66 October 2012 � Project Management Journal � DOI: 10.1002/pmj
Project Management Knowledge and Effects on Construction Project OutcomesP
AP
ER
S
Construction Industry Institute.(2009). CII benchmarking measure-ment categories. Austin, TX: Author.
Cronbach, L. J. (1951). Coefficientalpha and the internal structure oftests. Psychometrika, 16(3), 297–334.
Dvir, D., Raz, T., & Shenhar, A. J. (2003).An empirical analysis of the relation-ship between project planning andproject success. International Journalof Project Management, 21(2), 89–95.
Fornell, C., & Larcker, D. F. (1981).Evaluating structural equations modelswith unobservable variables and meas-urement error. Journal of MarketingResearch, 18(1), 39–50.
Fornell, C., Johnson, M. D., Anderson,E. W., Cha, J., & Bryant, B. E. (1996).The American customer satisfactionindex: Nature, purpose, and findings.Journal of Marketing, 60(4), 7–18.
Frame, J. D. (2010). Project manage-ment theory and practice. ProjectManagement Journal, 41(5), 87. doi:10.1002/pmj.20217
Hair, J. F., Black, W. C., Babin, B. J., &Anderson, R. E. (2010). Multivariatedata analysis: A global perspective (7thed.). Upper Saddle River, NJ: PearsonEducation International.
Hayduk, L. A. (1987). Structural equa-tion modeling with LISREL. Hillsdale,NJ: Lawrence Erlbaum Associates.
Hu, L., & Bentler, P.M. (1999). Cutoffcriteria for fit indexes in covariancestructure analysis: Conventional crite-ria versus new alternatives. StructuralEquation Modeling: A MultidisciplinaryJournal, 6(1), 1–55.
Hughes, S. W., Tippett, D. D., &Thomas, W. K. (2004). Measuring proj-ect success in the construction indus-try. Engineering Management Journal,16(3), 31–37.
Hwang, B.-G., Thomas, S. R., & Caldas,C. H. (2010). Performance metric devel-opment for pharmaceutical constructionprojects. International Journal of ProjectManagement, 28(3), 265–274. doi:10.1016/j.ijproman.2009.06.004
Hwang, B.-G., Thomas, S. R., & Caldas,C. H. (2011). Application of customizedindustry-specific metrics to assessmentof capital projects performances. KSCEJournal of Civil Engineering. doi:10.1007/s12205–012–1352–8
Indelicato, G. (2009). A guide to theproject management body of knowl-edge (PMBOK® guide), fourth edition.Project Management Journal, 40(2),104. doi: 10.1002/pmj.20125
Isik, Z., Arditi, D., Dikmen, I., &Birgonul, M. T. (2008). Impact of cor-porate strengths/weaknesses on proj-ect management competencies.International Journal of ProjectManagement, 27(6), 629–637.
Kang, Y., O’Brien, W. J., Thomas, S., &Chapman, R. E. (2008). Impact ofinformation technologies on perform-ance: Cross study comparison. Journalof Construction Engineering andManagement, 134(11), 852–863.
Kim, D. Y., Han, S. H., Kim, H., & Park,H. (2009). Structuring the predictionmodel of project performance forinternational construction projects: Acomparative analysis. Expert Systemswith Applications, 36(2, Part 1),1961–1971.
Kline, R. B. (2005). Principles and prac-tice of structural equation modeling(2nd ed.). New York, NY: Guilford.
Konchar, M., & Sanvido, V. (1998).Comparison of U.S. project deliverysystems. Journal of ConstructionEngineering and Management, 124(6),435–444.
Leung, M.-Y., Ng, S. T., & Cheung, S.-O.(2004). Measuring construction projectparticipant satisfaction. ConstructionManagement and Economics, 22(3),319–331.
Ling, F.Y.Y., Ibbs, C. W., & Hoo, W.Y.(2006). Determinants of internationalarchitectural, engineering, and con-struction firms’ project success in China.Journal of Construction Engineering andManagement, 132(2), 206–214.
Ling, F. Y. Y., Low, S. P., Wang, S., &Egbelakin, T. (2008). Models for pre-dicting project performance in Chinausing project management practicesadopted by foreign AEC firms. Journalof Construction Engineering andManagement, 134(12), 983–990.
Muller, R., Geraldi, J., & Turner, J. R.(2011). Relationships between leader-ship and success in different types ofproject complexities. IEEE Transactionson Engineering Management, 59(1),77–90.
O’Connor, J. T., & Yang, L.-R. (2004).Project performance versus use oftechnologies at project and phase lev-els. Journal of ConstructionEngineering and Management, 130(3),322–329.
Project Management Institute (PMI).(2008). A guide to the project manage-ment body of knowledge (4th ed.).Newtown Square, PA: Author.
Qureshi, T. M., Warraich, A. S., &Hijazi, S. T. (2009). Significance of proj-ect management performance assess-ment (PMPA) model. InternationalJournal of Project Management, 27(4),378–388.
Scott, J. E. (1994). The measurement ofinformation systems effectiveness:Evaluating a measuring instrument.Paper presented at the FifteethInternational Conference onInformation Systems, Vancouver, BC.
Shin, S. Y., Moon, T. H., & Sohn, S. Y.(2009). Structural equation model foreffective CRM of information infra-structure industry in Korea. ExpertSystems with Applications, 36(2, Part 1),1695–1705.
Tesch, D., Sobol, M. G., Klein, G., &Jiang, J. J. (2009). User and developercommon knowledge: Effect on the suc-cess of information system develop-ment projects. International Journal ofProject Management, 27(7), 657–664.
Wallgren, L. G., & Hanse, J. J. (2007).Job characteristics, motivators andstress among information technology
October 2012 � Project Management Journal � DOI: 10.1002/pmj 67
consultants: A structural equationmodeling approach. InternationalJournal of Industrial Ergonomics, 37(1),51–59.
Yang, L.-R. (2007). Exploring the linksbetween technology usage and projectoutcomes. Construction Managementand Economics, 25(10), 1041–1051.
Yang, L.-R., O’Connor, J. T., & Wang, C.-C.(2006). Technology utilization on dif-ferent sizes of projects and associatedimpacts on composite project success.International Journal of ProjectManagement, 24(2), 96–105.
Yeung, J. F. Y., Chan, A. P. C., & Chan,D. W. M. (2009). Developing a perform-ance index for relationship-based con-struction projects in Australia: Delphi
study. Journal of Management inEngineering, 25(2), 59–68.
Zwikael, O. (2009). The relative impor-tance of the PMBOK® Guide’s nineKnowledge Areas during project plan-ning. Project Management Journal,40(4), 94–103. doi: 10.1002/pmj.20116
Jui-Sheng (Rayson) Chou received his BS and MS from the National Taiwan University and hisPhD from the University of Texas at Austin. He iscurrently a professor in project management atthe National Taiwan University of Science andTechnology. He has over a decade of practicalexperience in engineering management and con-sulting services for the private and public sectorsand serves on a number of professional commit-tees. With registered professional engineer
licenses in four engineering disciplines, he is amember of several international and domesticprofessional organizations. His teaching andresearch interests primarily involve project man-agement related to knowledge discovery in data-bases (KDD), data mining, decision, risk and relia-bility, and cost management. He has publishedand written over 180 journal articles, conferencepapers, and technical reports related to projectmanagement.
Jung-Ghun Yang is a graduate research assis-tant at the National Taiwan University of Scienceand Technology (Taiwan Tech) under the men-torship of Professor Jui-Sheng Chou. He receivedhis MS in the construction management pro-gram at the National Taiwan University ofScience and Technology.

Copyright of Project Management Journal is the property of John Wiley & Sons, Inc. and its content may not be
copied or emailed to multiple sites or posted to a listserv without the copyright holder's express written
permission. However, users may print, download, or email articles for individual use.