project fire detection - defense technical … fire scan fire detection interim report ... equipment...
TRANSCRIPT

U.S. FOREST SERVICERESEARCH PAPER INT-25, 1966
AVAILABILITY NOTICE 6
Distribution of this document is unlimited
PROJECT FIRE SCANFIRE DETECTION INTERIM REPORT
April 1962 to December 1964 (Work Unit 2521A)
!'=2 "" ... :": 7, " , -•
FEB 231967,
U..)ep~artitwnt of Agriculture -Forest Serv ice(
in t,.rniuntain F'orest and [Range Experinwnt StatiomNorthM wn Fo,'-t Fire IkMborattrtNIiiooula, Montana

-. .......-. - -........... ..... . . ..
DDC Li.T:"
-- ..--.----.. _ ..-.
'DNA
'INA
ACKNOWLEDGMENT
T'he authors gratefully ac:knowledge finan-cial, technical, an(I cooperative assistance by
'everal agencies an(I organizations in accom-
plishing the ta;sks included in this report..rmong them aCe:
Department of the Army. Office of theSecretary of the Army
Department of IDefense, Advanced Re-
search Projects Agency l
hnfrared Physics LaI)oratory, Institute of"ycience and Technology. University of .
MichiganHRB-Singer, IncWrlIorated
State of M~ontana, Foi'estry I Jeal tmentTh'e a.h Instrument CompanyU.S. Forest Service National Forest Ad-
ministration-The Electronic Command. U.S. Army Ma-
teriel Command
I11U.S. F s e

Headquarters for the IntermountainForest ant Range Experiment Stationare in Ogden, Utah. Project headquar-ters are also at:
Boise, Idaho
Bozeman, Montana (in cooperationwith Montana State University)
Logan. Utah (in cooperation withUtah State University)
Missoula, Montana (in cooperation
with University of Montana)
Moscow, Idaho (in cooperation with
the University of Idaho)
Provo. Utah (in cooperation withBrigham Young tzn~iversi.ty)

U.S. FOREST SERVICERESEARCH PAPER INT-25, 1966
PROJECT FIRE SCANFIRE DETECTION INTERIM REPORT
=' April 1962 to December 1964by
Ralph A. Wilson, Physicistand
Nonan V. Noste, Research Forester
THE EVALUATION OF AN AIRBORNE INFRARED MAPPERAS A TOOL FOR DETECTING AND MEASURING FIRES
(Work Unit 2521A)for
Department of Defense, Office of Civil DefenseContract OCD-OS-62-174
andDepartment of Derense, Advanced Research Projects Agency
ARPA Order No. 636, Program Code No. 5860
OCD REVIEW NOTICEThis report has been reviewed in the Office of Civil Defense and ap-proved for publication. Approval does not signify that the contentsnecessarily reflect the views and policies of the Office of Civil Defense.
INTERMOUNTAIN FOREST AND RANGE EXPERIMENT STATIONU.S. DEPARTMENT OF AGRICULTURE- FOREST SERVICE
NORTHERN FOREST FIRE LABORATORYMISSOULA, MONTANA
AVAILABILITY NOTICE. - Distribution of this document is unlimited.

CONTENTS!! Page
IN T RO D U CTIO N 2........... . ................. ................................... 2
PHASE ! TEST PROGRAM .................................. 3
IN T R O D U C T IO N ............. ............................................................ 3
EQUIPMENT .......................................... 3D)EVELOPMENT OF TEST PROCEDURE ................................. 3
DISCUSSION OF RESULTS ............................... 5
SUMMARY, PHASE .......................... 7
PHASE II TEST PROGRAM .................................. 7
IN T R O D U C T IO N ...... ...................................................................... 7
DEVELOPMENT OF EQUJIPMENT ............................................. 7
TEST PROCED URE .......................................................................... 8
DISCUSSION OF RESULTS ........................................................... 10
SUM M ARY, PH ASE II ...................................................................... 15
PHASE III TEST PROGRAM .............................. 16
OBJECTIVES ....................................... 16
FIRE DETECTION TESTS .............................................................. 16
FIR E PAT R O L ................................................................................. 17
Equipment and Test Procedures ...................... 17SP atrol A rea ........................................ .. ............. ................. ............ 17
Patrol Flight ........................................... ................................. 17
MOUNTAINTOP TESTS ................................ 17
General Discussion ............................................... 17
Preparation of Program ................................. 18
Instrumentation ..................................... 19
Discussion of Tests at 450 Plot ...................................... 24Detection Predictions at 450 for Spot. Fire Models .......... 28
Detection Probability Beyond 450 ............................ 30
Summary of Mountaintop 'rest Series ...................................... 35
CONCLUSION ..... .......................................... 3...
SUMMARY OF PHASES I, 11, and III ..................................... 36
PLANS FOR THE FUTURE . ....................................... -....... --........ 36
APPENDIX I - DESCRIPTION OF TEST AREA ................................ 38APPENDIX II - CRITERIA FOR SPECTRAL
R ESPO N SIV IT Y .................................................................................. 42
APPENDIX III - SENSITIVITY OF SCANNING SYSTEM .......... 44
APPENDIX IV- CRITERIA FOR DETECTION .....................
APPENDIX V - ATrENUATION OF RADIATION ..........................
ii
ILLUSTRATIONSFigure Page
1 Percent transmission versus vertical angle for fo'r coniferousspecies. .. .. ... .... .. ................. .. . ....... .......
2 Percent total detection versus vertical angle for three timberstands ................................................. 6
3 Plreent: total deteetMinn vorqusI basal area classed f1r three
altitudes and two system resolutions ....... ... ... ................... U
4 Equipment. modification: A, Infrared receiver modified to a10-inch focal length system; 3, Polaroid image recording camera. 8
5 Fire array target pattern ............................. 10
6 Samples of flight, test imagery: A, Imagery obtained withscanner tilted at. 20'; 13, imagery with scanner tilted at 50.. ........ 11
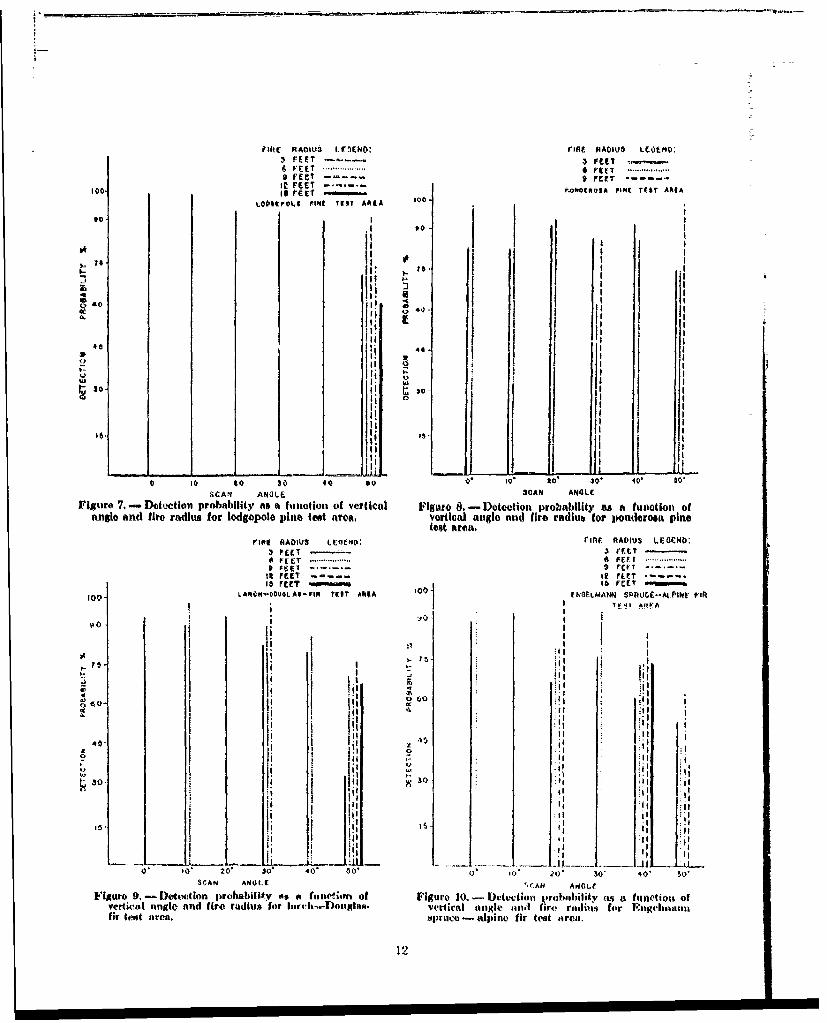
7 Detection probability as a function of vertical angle and fireradius for lodgepole pine test area ................................................ 12
8 Detection probability as a function of vertical angle and fireradius for ponderosa pine test area .................................... 12
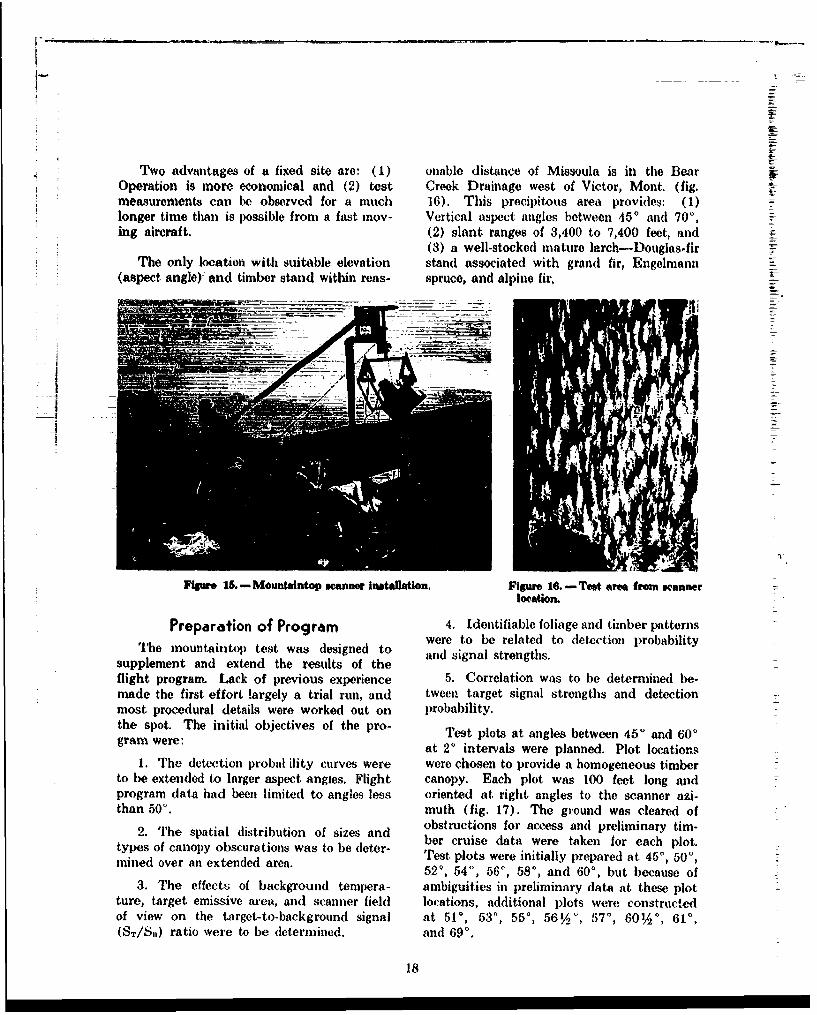
9 Detection probability as a function of vertical angle and fireradius for larch-Douglas-fir test area ....................................... 12
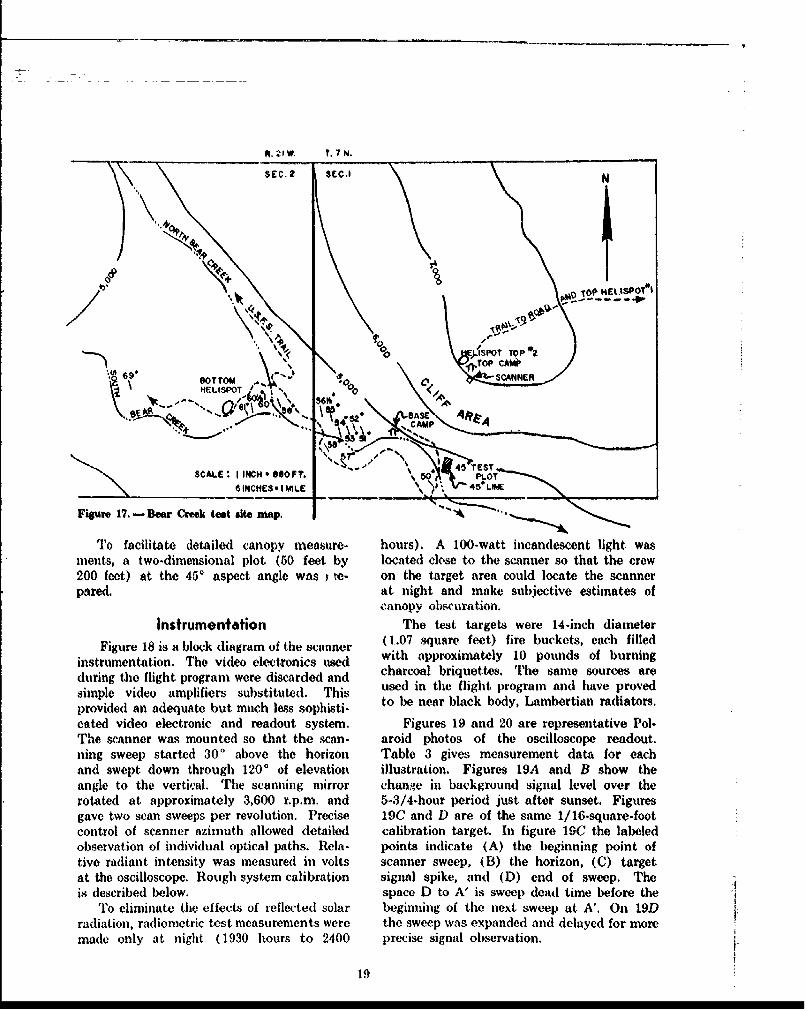
10 Detection probability as a function of vertical angle and fireradius for Engolmann spruce-alpine fir test area ................... 12
11 Accumulative detection probability versus vertical angle andfire size for lodgepole pine test area ........................ 14
12 Accumulative detection probability versus vertical angle andfire size for ponderosa pine test area ................................................. 14
13 Accmulative detection. probability versius vrcrtlval ansgle 1-4fire size for larch-Douglas-fir test area ....................... 14
14 Accumulative detection probability versus vertical angle andfire size for Engelnunm spruce--alpine fir test area .................... 14
16 M ountaintop scanner installation ................................................. 18
16 Test. area from scanner location .................................................... 18
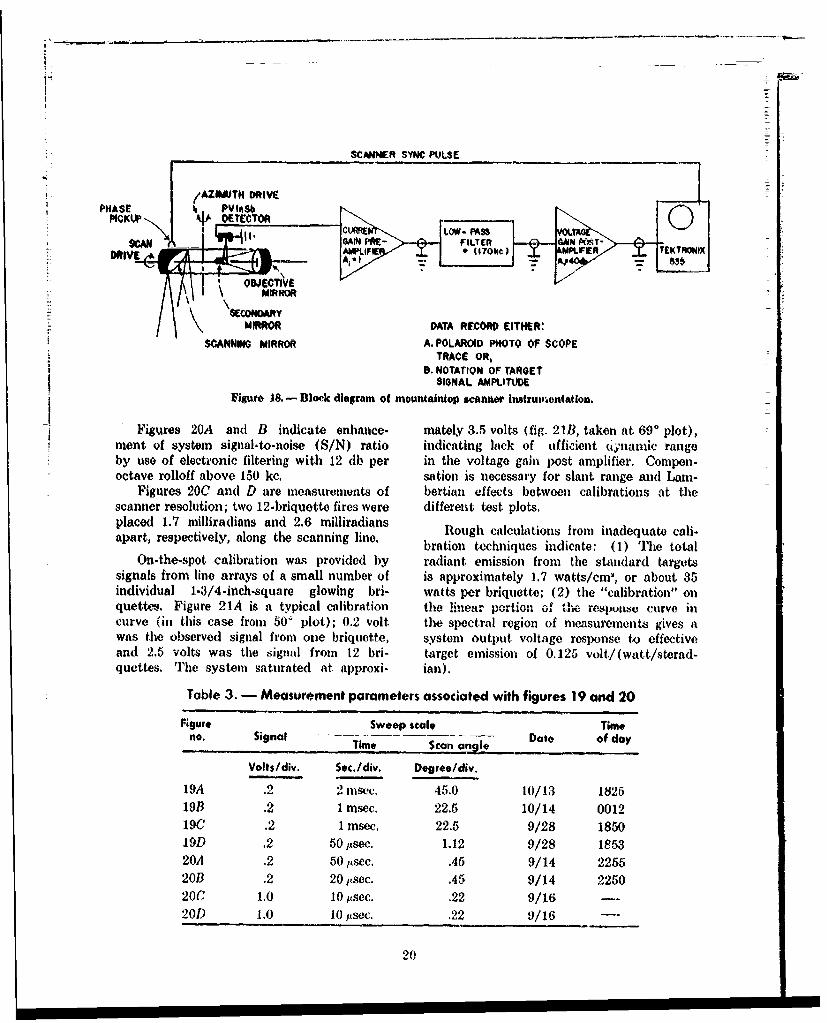
17 Bear Creek test site m ap ............................................................... . 1918 Block diagramn of mountaintop scanner instrumentation ........... 20
19 Polaroid photographs of oscilloscope readout: A (1825 hours,10/13) and B (0012 hours. 10/14), Change in backgroundsignal level over a 5-3/4-hour period; C and D (!/16-square..foot target), full scan sweep on C, sweep expanded and de-layed fot more precise signol observation on D ........................... 21
20 Polaroid photographs of oscillo•cope readout: A, Target(35,75) signal and system noise with no electronic filter; B,same sweep with 150 ke. low-pass electronic filtering; C,measurement of scanner resolution, two fires 1.7 milliradiansapart; D, measurement of scanner resolution, two fires 2.6milliradians apart. .................................. 22
iii
I-

I4; wrl Page
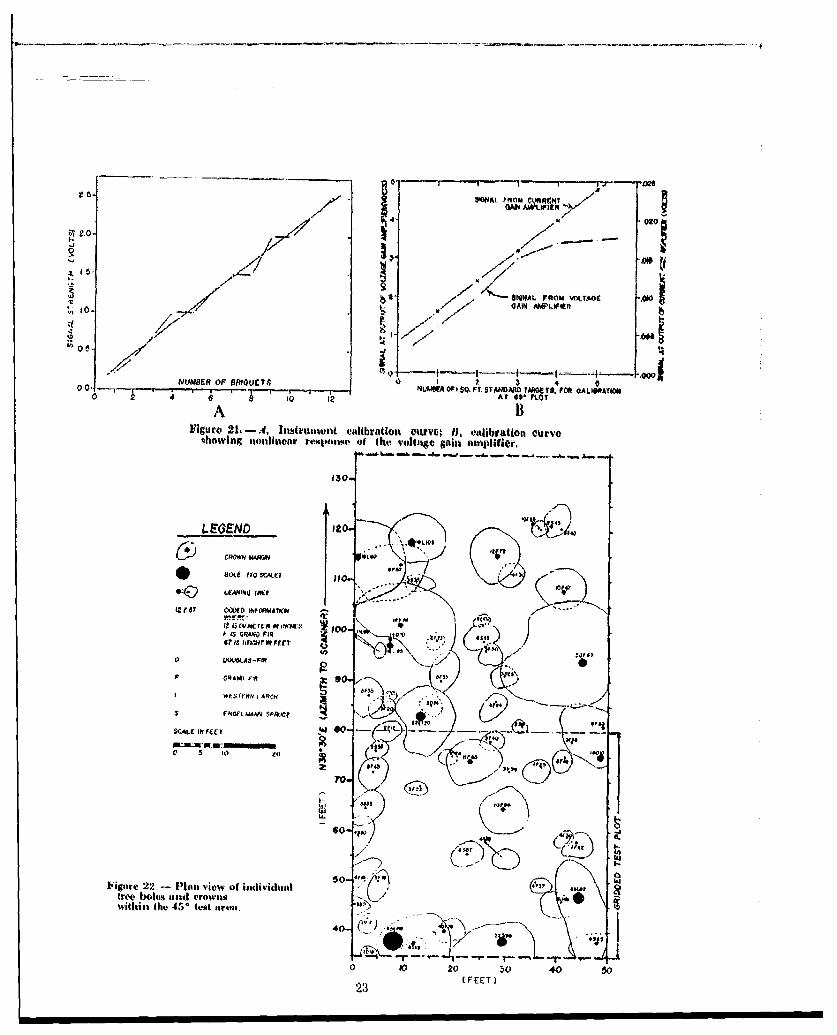
21 A, Instrument calibration curve; B3, calibration curve show-ing nonlinear response of the voltage gain anplifior. .................... 23
"22 Plan view of individual troe bolos and crowns within the 46'test area . .........-............ . ........................................ . . 23
23 Signal voltage profile. of ,45' test area, from 1-square-foot.charcoal sources . ............ .. . . . . . ......... . 24
24 A. Accumulative pereont of total observations versus signalstrengths for 1-. 2-. 3-. and 5-squtroe-foot targets; B3, fre-quency of occurrence of equivalent unobscured source sizes(1-square-foot targoets at 45') ........................... 25
25 Photograph of goneral canopy chartvier of1 45' ploL fromevenly spaced plot locations. Numlibers in parentheses referto plot location abscissa and ordinate associated with figures2 2 an d 23 ........................................................................................ . . 26
26 Photogroph of selected plot locations uhowing canopy clhar-acteristics associated with several values of signal strength ......... 27
27 Measured percent of positive detections as a function of in.creasing test plot size . ....................................................................... 28
28 Percent detection at 450 detcririined for three fire meodls asa fLunction of model size and signal threshold........................... 29
29 Frejuoncy distribution of distances from random locationsto nearest positive (detection ..........-..... ................. ............ 30
30 Frequency distribution of signial strengths versus size of thesolid fire m odel A ........................................................................ 31
31 Percent detection versus aspect angle for several detectionsignal thresholds ....... . .. .................... ........... . 32
32 Phase II, lurch-Douglas-fir flight data to 50' extended past600 by the mnountainton test data .....................................
33 Frequency of occurrence for all 5-square-foot target arrays,450 to 69°, by signal strength .....................................-. 33
34 Absoluto spectral emnissive powers for black bodies at varioustem peratures . ........................................ . ..... ...................... . 43
35 Aircraft scanning geometry.. .................. .................. 4736 Typical video signal osvilloscope trace ....................................... 4737 Pulse-height discrimination circuit separating low arnplituude,
high frequency signal from background . ................... 4838 Lower limit values of (target area)/(aircraft. altitude)" ratio
as function of peakato-peak background temperature varia-tion for several tUmrget temperatures, assunuing detectioncriteria of Eqn. 7 in the text.. . ......................................... 49
39 Spectral characteristics of a typical (letecdor atd filter ............... 51
40 Typical atniospheric transmission curve: 16.25 kmi. sea levelpath, 68." 'F., 53-percent relative hunidity, 15.1 cm. It.:in p ath .. ............ .... .. . 5 1
iv

-t
Figure Page
41 Spectral tra nsmis.hion of waer for vai-,ois ,ptical paiiths. 52
42 Spectral t'ansmission of CO, for vaioitub opticld paths. .............. 52
43 Variotion in atmospheric CO, concentration with altitudenormialized to soa level. A I
44 Procipit-4tblo H,O concentration as a function of atmosphorictemperaturo and rolativo humidity, ............ 53
45 Percent transmission of watur in tho 2.8- to 5.8.nmicron bandvorsus concentration of precipitable water. 54
4 6 Observed and prdicted obscmrations from a true bole model ....... 54
v
PROJECT FIRE SCANINTERIM REPORT
April 1962 to December 1964
This work was accomplislhed trder WorkOrder 0OCD.S-62-174. Thin agraomemt out-lined a threeiphase test program to evaluateairborne Infrared devices as tools for use Infire control. After Phase I1 was completed,the tasks wore more 8pocifically doefied. Atthat time the proramn was adminiitrativelydivided into its two natural componentsfire mapping and fire detection.
This report summarizes the fire detectionwork from April 1962 to December 1964, Thefire mapping effort will be discussed in a laterreport.
I!
-J S

INTRODUCTIONThe original program objectives wore t,
develop and test a heat-sensitive system cap-able of: (1) locating small fires, (2) mappingfire perimeters, and (3) measuring rates offire spread. The usefulness of infrared map-pers was to be examined by surveillance offire sources in forest environments. The cap-ability for locating fire perimeter and de-tecting incipient fires was to be comparedwith that of aerial patrol and methods ofground observation now in use.
The work agreement outlined a three-phasetest program. After Phase II was completed,the tasks were more specifically defined andthe program was divided into its two naturalcomponents - fire mapping and fire detec-tion. This separation allowed both programsto concentrate on development of syste-isspecifically adapted to their unique problems.The goal of the detection program is to de-velop the capability for precisely locatingsmall fire targets over extended land areas.
2
PHASE I TEST PROGRAM
INTRODUCTION provided imagery of nmininmm distortion (see
Preliminary work included acquiring the Appendixes III and IV).
necessary instrumentation and familiarizing Control settings were not optimized priorproject personnel with the equipment and to or during the test flights. The test imagerytest procedures. The infrared instrumenta- was unobservable until the film had beention used during the period covered by this returned to the Laboratory and developed.report was designed and built for other uses, These recording limitations seriously hamper-and hence required considerable modification ed evaluation of the test results that werefor use in fire surveillance, directly dependent upon the imagery.
Five types of detectors and optical filtersEQUIPMENT of six different spectral bands were obtained
with the scanning equipment. The detector-The scanner system used during this phase filter combinations used during the fire de-
of the program consistedl of a receiver unit tection tests were chosen by subjective evalu-and control-readout console. The infrared ation of image quality.optical-mechanical receiver was installed inthe nose hatch of a modified Beechcraft AT-11 aircraft. The optical receiver scanned an80ý-wide field (40 to either side of vertical TEST PROCEDUREin normal operation) perpendicular to the Instrumented aircraft flew tests over for-air-raft's line of flight. Continuous-strip ested test plots that contained artificial firephotographic recordings of the cathode ray targets. Very little was known about thetube (C.R.T.) readout gave map-like imagery specific radiation characteristics of fires burn-of the terrain's thermal detail. The optical ing tinder marginal conditions. A heat sourceresolution at this time was approximately 4 of arbitrary size and temperature simulatedinillii'adians. The scanning geometry was an incipient forest fire. The target had tosimilar to that discussed in Appendix IV. be uniform, repeatable, portable, and safe to
use in a forest environment during high fire-Thle receiver unit could be rotated into a danger periods. A 14-inch-diameter bucket,"side-looking" mode, i.e., from the vertical to 9 nces der tidlly filledith sand ,
80' n oe sie o thefliht pth.Thismodfi- 9 inches deep, partially filled with sand, thencation oasneceside of the er fhto eath.mThiinodfilled to the brim with 10 pounds of charcoal,cation was necessary in order to examine the
was selected as the standard target. Burningfeasibility of wider flight paths. charcoal temperatures, measured with a ther-
'rho canirol-readout console was mounted mocouple, ranged from 700- F. to 1,190' F.,The ~niol-radot cosol wasmouted andI averaged 892'" F. A radiometer measure-
in the passenger cabin of the aircraft. Moni- ant of 895 ' F. ( radiometr tere-
tors included C.R.T. presentations of the raw pertore F a eeclsely.
video signal ("A"-scan) and an auxiliary TV- perature) agreed closely.
like raster scan of ,he thermal imagery ("B"- A time-history record showed the sourcescan). Controls adjusted the video signal on emission to be steady between one-half hourthe C.R.T. readout for proper photographic and 5 hours after ignition. Variation of radi-exposure and aircraft flight parameters. Elec- ant energy, measured as a function of verticaltronic "gain" and "level" adjustments con- angle and plotted as a cosine function, showedtrolled the photographic contrast and film that this source closely approximates a Lam-d(n;,:id., respectively. A V/11 (Velocity/ bertian radiator. These targets have provedHeight) control of the strip film drive speed quite satisfactory and have been used through-

ii
out thie program, although at times sparks determine the effect of timber cover on de-from them are a fire hazard, tection probability. Another was to develop
The first night and day flights were con- a stand measurement to predict the obscura-
ducted over a relatively flat, barren target ton effect of the various timber stands. Anarea adjacent to Missoula, Montana. The optimum vertical angle, within 200 of theoperators were familiarized with equipment, zenith, was anticipated at which the canopyo p e at o s e r e f a m li ri z d w t h e q u p m e t , w o u ld le a s t in te r fe r e w ith d e te c t io n , A m na x i-
and the sevwral detector-filter combinations woul leabeyint with detection A aewere examined. Unfiltered indium antimo- mm angle beyond which detection would benide, lead sulfide, and lead telluride de- virtually impossible was also predicted.tectors were used in combination with a Only four coniferous species were consider- -
3-micron, long-pass filter. Initial tests showed ed initially - lodgepole pine (Pimm contortathe lead sulfid.e detectors, with a 3.4- to 4.1- Dougl.), ponderosa pine (Pinus pontderosamicron filter gave the best imagery during the Laws.), Douglas-fir (Pseudotsuga menziesiidaytime tests; however, these results were var. glauca (Beissn.) Franco), and Engel-not acceptable. Subsequent searching for a mann spruce (Picea engelmannii Parry).sat,. le daytime detector-filter combination These species were selected on the basis ofshowed that an indium antinonide detector shade tolerance. Tolerance- is an expressionand a 4.5- to 5.N-micron filter were the best of a species' ability to endure shade. Thus,available, but daytime results were still tolerance is a good guide to canopy densitymarginal, since species that require less light are more
For best results at night no filter was likely to develop very dense canopy covers.
used. Little difference was apparent between The species selected sampled the range of
lead sulfide and indium antimonide detectors. canopy densities found in western Montana.
The detection tests that followed utilized both Four timbered areas were selected to testlead sulfide and indium antimonide detectors the effect of timber cover on detection proba-for night operation, and indium antimonide bility. Flight tests provided data on threewith a 4.5- to 5.5-micron filter during day- types of forest cover - ponderosa pine, Doug-time conditions. las-fir, and Engelmann spruce. Relatively
Measurements made by t h e Materiel pure, but nonhomogeneous, stands were se-lecteed to provide a large variation in standBranch, Electronic Research Development form, stand dlensity, and canopy character-
Laboratory, Fort Belvoir, Va.,, showed that. istics For example, tae ponderosa pine test
coniferous foliage and tree bark are opaque area cortai pl ts ofo erown, oer-
to energy radiated in the infrared portion of area contained units of open grown, overma-
the spectrum. However, no data were avail- Cure, thrifty mature, and small stagnated
able concerning the obscuration of small fires trees.
by a forest canopy. The distribution, size, Also considered in selecting test areasshape, and total number of transmission paths were: (1) recognizable terrain features totbrough a canopy were likely to vary with facilitate navigation, (2) peaks and ridgesforest type, site quality, age, stand densi(y, that make night air operations hazardous,and other factors that affect stand morphol- (3) level topography within the area, andogy. (4) distance from Missoula.
A major objective of the program was to Twenty plot centers in a 4 by 5 patternwere systematically located 500 feet apart
IIdentification of the lead sulfide detector must throughout each test area. Each plot wasbe questioned by the sensitivity parameters requiredfor this performance. The best PbS detectors now described according to slope, aspect, and basalavailable have peak responses at 3.2it and tirne area within a variable radius (Bitterlich')constants of greater than I reset. (for optimum re- ae in aae ds trhsponses, less than 5a see. is required). This identifi- .:Baker, Frederick S. A revised tolerance table. J.cation was made by printed labels on borrowed Forest. 47: 179-181. 1949.equipment. ' Grosenbaugh, L. R. Plotless timber estimates -
"-'Unpublished report. new, fast. easy. J. Forest. 50: 32-37. 1952.
4

plot. Total height, percent of live crown, 100
crown diameter, diameter at breast height LEOGND BASAL AREA• \ -- ~PONDEA60A MIKt 0# $0. rr/(d.b.h.), and species were recorded for each $0 .OLAS -.. if, 100 ,0.rT./ACR,tree within the plot, and two timber crown - -- 019CoAt PlUt i1$ Sot.v/.ACphotographs were taken froom each plot center.This description aided the qualitative analysis \of the flight data.
At three plots within each test area a ?"theodolite measured the portion of the hemi- *2
sphere over the plot center covered by forest tovegetation. The theodolite was mounted ona standard tripod, and leveled. The telescope /was pointed toward the zenith (90') and the so %,,observer would estimate the percen, of the ; \2* field of view filled by boles and foliage. u 40
The percent of open canopy was estimated ,at each 2' interval, front 900 down to 20' 340
above the horizon. The telescope was again 30
pointed toward the zenith, the azimuth lock \ ,. }i• /'. .. .released, and the theodolite rotated to an- toother random azimuth angle.
This procedure was repeated eight times •,at each plot. Figure 1 is a plot of the curvesgenerated by averaging the eight readings foreach vertical angle. The curves show no W ,o 2o- o 4o 10- 6. TOtendency to peak below the zenith (0W). oV ATtCA .,L
Although they are not well defined, the trans- Figure 1. - Percent transmission versus verticalmission curves decline steadily toward the angle for four eonifeous speel.s.horizon. Ponderosa pine and Douglas-fir aresimilar, with the Engelmann spruce signifi- because of the high degree of coordinationcantly more dense. required between the scanner operator and
the pilot. A technique of flying compassData acquisition flights were coordinated bearings from visible reference points approxi-
between the aircraft crew and ground crew. mately 4 miles from the test area was moreThe ground crew ignited the 20 charcoal fires satisfactory. Flight passes were flown fromat least 30 minutes prior to the time the two checkpoints such as towns, ranger stations,aircraft was scheduled over the area. The or other landmarks that were identifiableaircrew consisted of a pilot and one operator; during night operations.occasionally a third member acted as observerand relief operator. Passes were flown from Becaure these test flights were exploratory,altitudes of 2,000 feet to 10,000 feet over many variables were introduced that wereterrain. Courses were charted to position eliminated in later test design. Detectorster aircraft directly over te t est area and were changed during flights, altitude was notto place all targets within the field of view held constant,' and equipment settings wereof the scalner at the proper vertical aspect not optimized. These factors made it possibleangles, to draw only general conclusions from thedata.
DISCUSSION OF RESULTS Imagery obtained from flight tests was
Aircraft navigation over the test area examined on a microfilm reader, and the flight(dependent upon the map presentation of a passes containing usable data were analyzed.5-inch monitor scope) was not, satisfactory Identification of individual targets depended
0r|

upon recognizing landmarks or observation of was only 50 percent. Detection in spruce isenough targets to recognize the 4 by 5 pat- very low for angles greater than 30'; how-tern. The interpreter was required to use ever, 40. to 50-per nit detection was observedconsiderable judgment, in extracting data from for the other two types. During the fourthe film strips. Target signatures on the flights represented by these data, no targetsimages were often questionable because of were detected beyond 40' except in theimproper film exposure. The film density was Douglas-fir stand, where 33 percent were do-too dark if video levels were set too high. tected between 40' and 50-. None of the
detection data in this report are correctedThe percent of targets detected wits utsc( for the inherent. dependence of slant range
as the dependent variable in evaluating the and Lambertian effects on aspect angle (seeseparate effects of stand density, forest type, scanning geometry, Appendix IV).altitude, vertical angle, and horizontal grounddistance. A single mission, flown in cooperation
with the Infrared Physics Laboratory, Insti-A summary of detection results of the tute of Science and Technology, University
three timber types is shown in figure 2. Tar- of Michigan, indicated their 2-milliradian-gets in ponderosa pine and Douglas-fir were scanning system would consistently achievedetected easily at vertical angles less than better results; this was especially true in the10', but in the Fngelmann spruce detection denser portion of the stand (fig. 3).
LEGENO
tooALTITUD0E 4000'-PONOCROSA PINE
.. ............ OOUOLA$ - FORSE. • LMANA $SPAUCC '00 L EGE N
---- 000' 4MA0........... 4 00' MA.
SO . -.- 00 O WA., :
1I00
*:1 al on401
I 4•0 4I I
4 0 i l iio
- " -20o aI - o0 * 40' 41- 50' 5. - o ,. 0-300 to 100-1o"
Figure 2.-•Percent total detection versuls vertical Figure 3. •.Percent total detection versus basal areaangle for three timber stands. classed (or three altitudes and two system resolu-
tions,.S I I I I I I I I I I I I I I I I I I

Th'le effects of increasedl stand densit~y and with the information and instrumeontation atvertical angle were examined by using the hand, and both proved inadequate.data from all altitudes and ftimber types. Deficiencies included: (1) The shortageThis lumping of data was necessary because of pert~inent* timiber canopy ground truth, (2)of thle small s amlil size. These dat-a showed, crude nAvigational procedures, (3) inadequate(1) Th'le extremely low probability for (detect- data readout, and (4) very poor infrareding, target~s in thle (tensest plots for vertical systemn sensitivity and resolution.angles greater than W0; and (2) tile diffi.cunty ellcomitere liat angc-es greater than 50' Positive results were: (1) T1he, projectin all but the least sparse portions of the stand. personnel were initiatedl into airborne infrared
experimentation, and (2) personnel obtktineda better knowledge of specific program re-
SU M RPHASE I quirements. Using this background knowl-SUMMARYedge, reasonable program goals were formu-
Th'le first season's work produced very few lated and the necessary modifications of(definitive resuits. The problem was atittacked instrumentation were determineod.
PHASE 11 TEST PROGRAM
INTRODUCTION tern. A higher resiolution tube replaced theCART. printer tube. The video amplifiers
Objectives of Phase 11 wvere to implement were modified to) providle the necessary band-the modifications suggested by the Phase I pass. A modified Beattie Coleman oscillorec-results, and to make quantitative measure- 01(1 camlera, incorporating a Polaroid backments of fire detection probabilit~y in the (fig. 4B) replaced tile caimera. The Polaroidrepresentative timber types. 'rest plans were filmn pack was mechanically driven perpendic-
mad inororaingth nees~ryre ~ ~ tins llar ito the eftmera axis, to provide the verticalArbiirary goals of 90-percent detection prob- sweep. ''l'his mechanical sweep drive Simulatedability and 10-mile-wide coverage were estab- thIe conventional 35 mmn. strip filmn drive.lished as realistic objectives for fire patrol. Addition of at 1/4- by 1/4-millimieter indium
DEVEL PMENTOF EUIPMET atimonide detect-or produced at calculatedDEVEOPMET OFEQUIMENT system resolution of 1 milliradian.
E~xperience gained (luring thle 1962 test The mount built in the n~ose escapeý hatchprogram dlemonst rated tb.ý need for a higher of the ATl-1 1 aircraft provided for two modesresolution scanner. Replacement of the standl- of operation. Thle normal mode of operationard 35 mm. recordling camecra with a Polaroid placed the scanner in a fixed vertical Jposi-camera facilitated control of image, quality. tion to attain a full 120' scan. Thlvý scannerA wider scan angle was needed to eliminate .ls I ol emnal oae rudti
the eed or ffsetin thcscaner.The lateral axis to direct the scan plane1 forwardoriginal scanner was modified t~o provide 120- of thle vertical to at maximum "tilt" angle ofscan angle by machining a slot, onl each side 0.'1leltrpovdd artin fth
oftscannsep rger horusintadr oifig.h aspect angle while repeatedly flying the samescanswep trgge (~ic~iry.flight path (directly over thle target area. This
Adding a housing, extension that. holds a eliminated the needl for offsetting the aircraft10-inchi focal length objectivil mirror (fig. 4A) flight paths -- anti extremely dlifficult, taskincreasedl the focal length of tile optical SyS. to accomplish accurately.
7

circle necessary to make the fire deteetnblethen becomes one of the obsorvables of tile
rhe Phaso 1i test. stands were selectedto eliminate as much variation as possible.
___The ttest, programt prolposodl flight' experimtentsover light, flWdhum, and heavy (elesity standswithin each of the four timber typos-,,; low-ever, time restriettj-l the1 actual tests to onlestand1( wit-hinl oi'Al t-ype.
The number of randolony located targets -
reqluired t~o dletermuine detect ioii probaibili tywithinl ± 10 Percent was estimaitc(I to ho til-
- reasonably largec.' T1he number of targets hadto be redu(:ed to it pract~ical number that. couldbe handled in the field. instead of locatingthe t~arget~s at randomi, we selected dense
-- ~locations. BiaSing of thle targot locations by-J I ~selecting the worst. cases provided a basis for-/ - - establishing tA lower limit for detection prob)--
abilit.y, and t hereby eliminated some ques-tions of reliability inherent in a small samplesize.
The establishnielt of ai lower, Jlimit fordetection probability was judged to be arealistic goal for Phase 11I because of the titneand effort. required for systemi modification.
For desc:ribing forest stands in this report,it is useful to review forest-type terminology
B ~used by foresters. Thle Society of AmericanForesters' deiretse forest type as:
Figure 4. - 11.3qupulent mnodification: A. Infraredreceiverm'iodlified to a 10-inch focal length system~; A descriptive terni used to group) statids. of
-It, Polaroid iniage, reeor(hut~g camera. Miniilar chairacter as regar(ls composition anadetlCCi~l)iitt dule to ,ivell physical andii biologi-cal factors, by Which they lnt'Iav derifferentiat'rlfronit other groups of stjmds' Thfe termi suti-
gssre pet i (itll of filhe sani helatrlict er 11 n hrTEST PROCEDURE shnilar cond~itions
The Phamse I timbered test areas were D)uring the te-st prograin of 1 963, the fol.selected for diversity of stand (leriliy and)( lowing types as des5cribe)d ini "Forest Cover'stmtidl form. Thew tests prodiwed useful fire Ty3'pes of North America,` were sampled todet~ection information, buta thle limited uIlai- r-epresenlt t~ypical western forest tyvpes: Typeber of samples precluded good quantitative z2.3i Interior Ponderosa Pine, 'Type ý7r218results. -,Adslsil of sunipie size alld de(tectionj proh~l-
During Phase I thle ability to dletect the bility' is included in lthe Phase III section.,
1-square-foot. targets p~rovedl very limited. A 1,oit ol 41nerican Fore'sters. lPorest,'y handl-target array designed with five 1-sqjuatrefoot hook. p. 6. ?4. New York~ Ronald Press. 1955.charcoal buckets onl the circumference of acircle was Judged to reasonably approximate 7Cormirtee' onl Forest 'l'ypes. P"West cover typ~es
of North Anirrica (exclusive of Atexaco). Pp. 42, 440,anl incipient spot fire. The radius of this 48, and 57. W4asheingjton: Soc. Amner. Forest. 16

Lodhaepole Pine. TIype 4?012 Larch-Douglas- 5. Slopes in I he area should not exceedIfir, andl 'typo 2,.0(; EnIgolnutnnil Spruce-Al- 20 percont..p~ine Fir (Abies Ilasiocarpa (Hook.) Nutt.).Atetna1,0fe. uiby,00etspeci,;x- ill thelOypes f1lieiIC( usuailly foril 50Ats raI,(i fe.ln y100fepercent. or more of tho composition. Pro- Nvide was delineated onl the bavis of tile above(loinlanits are judged on the basis of number criteria. Witliii this a~rea thle timber witsof stem- In thle dominant and codominant clue b~y the "itiable plot wedge prismClasses comlbinled. - (LBit~terlich) micthod. The basal ares factor
During the field season of 19631, four lnew for' this cruise was select-ed to give a 50-test, areas were chosen to determine thle Offect percen1t. sample1 of thiu standing timber on theof timlber cover onl probability of dketction. site. i['ho cruiSci' reorded (1h0 Mati height,Relatively pure stands of ponderosa pine, dilameter breast high, percent live crown, andlodlgepole pine, larch -lMuglas-fir.. and lHngel- species of each tree selected by this methiod1111111 qj)ruce-al pin lie ir Were Selectedl Which on eanch plot. within the test area. 'thle rium-mnet, thle followingII criteria: her of p~lot~s varied b~ecause of tho charticte-r-
lxticý'z of thle stand~, but was always, sufficient1. 'IitubI)O type must, be typical of the to give mn avecurate repre'.4entiitive samplec of
(descriptions used by thle Societ~y of American the stand according to- s~mandrd cruise tech-Foresters.1 itiques for merchant able timber.
2. Area must be about .10 acres or larger.3, Figh pah (i eihera noth-out 'Two sots of cruise data were compiled
or Flighwet. diaethion) eistherovidenorthsouth for these areas -oixe based on merchantalble01'ceaftwet navigation. utlrviefrsf volumne, thle description most easily visualized
airurlt nvigaionby a field forester: the other including all4, Vehicular accessq mu-st he available at. tiees with 4-inch and larger diameters.
each wid of the area for placement. of air- Merchantable volume probably relates miorecraft navigational devices, closely to a stand's (letection potential, A
Ibid :?.complete description of the cruise data is_____________ included in Appendix 1, atnd is summarlllized~(
"I1bid. pp. 412, 46. '4S. and 57. in table 1.
Table 1. - Cruise information from Phase 11 test areas by timber typeTest areas
Lodgepolo Pondlero~sci Larch - EngetmannMeasuremient pine pine Douglas-fir Spruce -
alpine fir
Tree!s per acre .. 161.2 67.1 120.8 160Board-foot volume per
acre,'......... ....... 9,050 5,330 16,923 41t,208Average (l.b.h. (inches) 10 14.5 14.9 17.5Average tree height (feet) 62 58.1 82 86Averagc crown'l thickness
(feet.).................44 40 47 6j2Cumlakliitive stem dlensit~y
(inches per acre)....2,662 0,622 2,224i 10,344Crown cover density-,
(percent) ! so 8 60 80 100
Scribnu'r Icglo" t ti CIS iftr c lise lot- f ti echeatit(0b/h voltnes,. CriaJsI' ZICinclues aill iner
'Estinuiuted by ,jwriaI phwot,;oce (tefst (wres.
9,
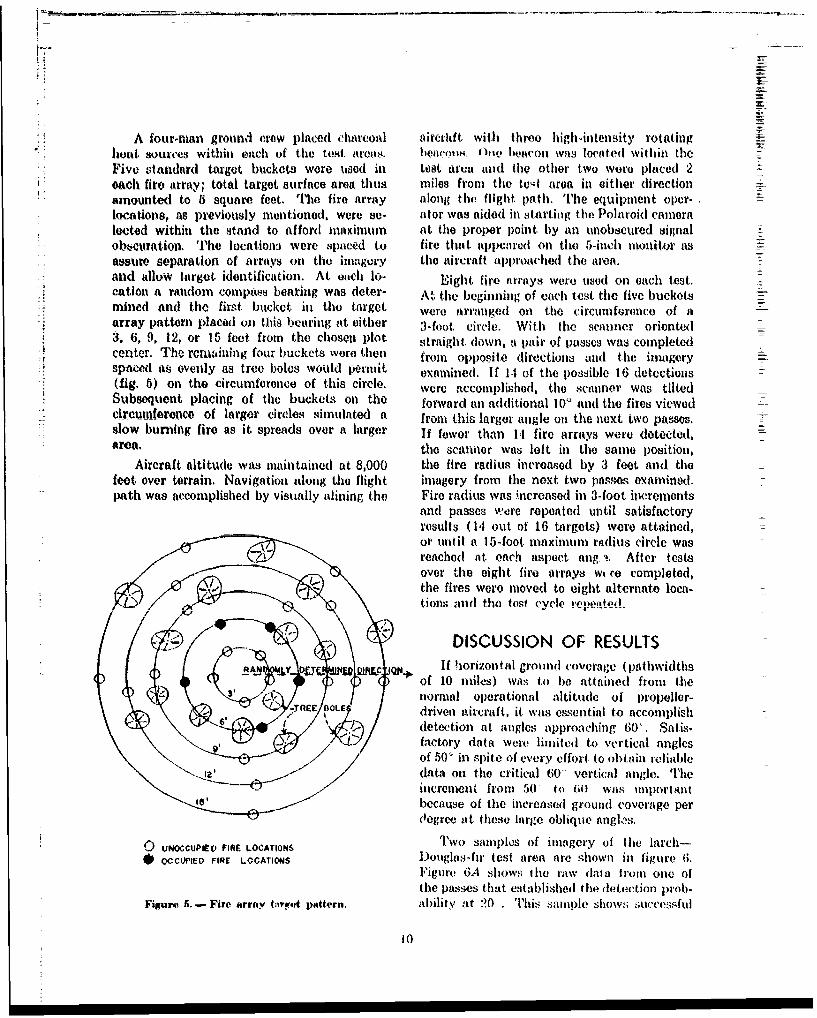
A four-nian ground craw placed charcoal airerlift, with three liigh-i,,tensity rotatingj7he1ti. SOUWCes Within eaIchI of t110e tet. 11olkts. beavo)IN tOlCVl was1 locaited within thleFive standard target buckets wore used in Lost. utra and the ot~hier two woro placed 2each firo array; total target surface area thus miles from tho toe-t area in either directionamounted to 5 square feet. The fire arrmy along the flight. path, TIhe equipment opor-locations, ais previously mentioned, were Be- ator was aided in starting tho Polaroid canmeralected within the stand to af fordl 11Aiixiniut at. the proper point. ly an unobscured signalo~icsuration. The locations were spaced tCo fire that. applealro oil thle r-inch 1110njt-or LISassure separation of tirrays onl the innagery the aircraft approachedl the area.and allow target. identification. At. each I(-) L~ight. fire inrays wvere usod on cachi test.-
*cation a random cornpass bearing was deter- At the beinn of each test the five huckets,-mined and the first bucket. in the target were alrYAnged Ok theo circumiference of itarray p~attern placed oil thist buering at either -foot. circleŽ. With the scanner orientod-3. 6, 9, .12, or 15 feet from the chosen plot straight, down, a pair oif passes was completedcenter. The rein.,ining, four buckets woro then from opposit~e directions andi the imagery-
spacd a ovnlyas reebols wuldperit. examined. If 1.4 of the possible 16 detections(fig. 6) on the circumference of this circle. wre copihdtesan wsildSubsequent placinig of the buckets onl the forward an additional IV~ and the fires viewed-circumference of larger circles simulated at fro th-lrknl o h ettopsses.slow burning fire as it. spreads over a larger If fee than 14 fire arrays were dotected,
area.the scanner was loft in the same position,Aircraft. altitude was maintained at 8,000 the fire radius increased by 3 feet. and the
feet over terrain. Navigation along the flight imagery from the next two P1xOss examined.path was accomplished by visually alining thie Fire radius was increased in :1-foot increments
and passes were repeated until satisfactoryresults (14 out of 16 targets) wore attained,or until at 1 5-foot mlaximiumi riudhkis circle wasreached at. each asp~ect. ang u. After testsover the eight fire arrays wt to completed,the fires wore moved to eight alternate loca-tions anld thet. togi cycle repealted.
DISCUSSION OF RESULTSID 'A If horizontal ground coverage (pttthwidthsý_N Y T MC Q14*of 10 miles) wits Co he at~tainled from the
- ~normial operational altitude of lprolx~elr-/ ... TfEE DOLEdriven~ aircraft-, it- was essential to accomplish
dletection at angles approaching 60'. Satis-factory data were limited to vertical anglesof 50' in spite of every effort to obtainl reliable
-12"data oin the critical 60 vertical angle. VTheincrement from 50' to Wl- was imp~ortantbecause of the increased ground coverage perdeogree at these lar1ge oblique angks.
0 UtWOcUPWV FIRE LOCATIONS Two' samples of imiagcry of (lie larchi-* OCVPE FIRE LOCATIONS JDouglas-fir test area are shown in figure 6.
Figure 6A shows; the raw dlata f rom onec ofthe passes thut es9tablished thme detection prob)-
Figure 6. -Fire array tartet pattern, ability at 20 . Tlhis samiple shows successful
10

m~ovedI by 3-foot. radtIuS illerements to at mIixt*-m111113 raclati of If) feet.
Data were recorded by fir'e raiuscasscan angle incruments9, aund flightpasns numn-bers. Th'le raw data wore then refined intocomposite, value. for each fire radiuB classwithinl Oach of the 10'" 8vall aliglo uicrointints.Theso (lata are aihowni graphically (figu. '7through 10). Thin analysis shows an inicreasein dletection probability corresponding to anincroase in fire radius. The inaxinium det.oc-tion p~robability occurs inl the(, range between9& and( 12-foot radius fire airrays.
A Proper initerpretait~ion of tit m,5 results, asthey relato to a i~proading fire with hot spotsremaining inside the perimeter, excited con-siderable discussion, Anr extrapolated percentdetection was calculated in the followingmanner.
For each timber type and maspOt angle,the imagery wits examined by consecutivo 3.
- toot-radial increments. An mndividuai targetarray detectod ait at given fire radius was as-sumed to be detect-able at all larger radii.Positive detection results were accumulatedby 3- foot- radial increments at each of theeight. target, locations in the test, area, Thefinal radius at which 90 + percent detectionfor the test are-a occurred was recorded for
l~I~ureO. Sape o tt etIag , E vC1~ ect angelle atud fl-JuN'. Ip.1 'TAble 2hiagety obtained with aeaniter tilted at 20'- is at syntopsis of the acetnimulative (letoction1D. imagery with mc'nneir IOtWA of ~W. results.
It is important t~o remember that thelot~oc~tiou of wich of the oight, fit-e arrays. 3-foot fire size represent-s 6 square feet ofFigure 6)W Shows two targets detected at 160 ; fire; the 6-foot. fire size, 10 sqttare feet of fire;(-lose examiination reveals at least four targets etc. Figures 11 through 14 give the acen-froin which radiation penet-rated the canopy). initative detection probabilities versus aspou-tyet. the systemi failed to separate thorn tide- angle for the several test areas. Theo ratioqlitately from the background. These four of detected targets to a total number of tar-targets were considered suibinargittal because gets in the sarlple is iticluded on each graph.an ininge interpreter onl a fire patrol mission Ilc(ceto rbblt hsiesiewould have trouble making at positive identi- is'[lieservativ'. probabie lty hs weeaselecedficatconervaive Ma[hea firet,, Clotd wer selectedloficatio et y M at di nga itarg tis o ldheig t mail ttcrin il the denlsest. portions of thme test. stand~s.
natiiotnt Cpbity adin at ulehe sseiht- icrm This analysis loeq riot. accoutit. for any energytiaton apablit t~t~mesysem.radiated in less than threshold arnoutits. The
resuilt's of this accuulakitive (detectioni analysisIll all effort to s illiulate 11 spreadlti fire, establish lower bound detection probabilities
five 1-Squarjle-ffOt hit':a I. NoURt reiWere, placed for fires ill t~ilmlibeI statttds Sitliflar ill dItllsil yonl at 3-foot-raditis circle, and subsequetntly and( cuitipositicit to time 124t stad.til.
I I
raItr RAOIU3 1. IrF .3I(W rint RAOIUO LEOIVMt:
6• FEET .................. 0 F T ............0 o t- 9 FEET1
:I FEET -------100.I fEET rcOttO)SA PINt T(Mr AAJA
LO 6It POLI PINt T99T AANI i00
Ito IlI,: Ito.
to
isI
o- I I
46 • it .44
I.,- I.....
so. ~~30-
0 10 to 10 40 O 0. tO " a** 90' 40, 6O "
SCAN ANOLE S3AN ANGLE
Figure 7. eloeltlon probaiulity as i hametlio, of vertical Figureo 8.- Dateetion probability as a funotion of"anglo and firo radius for lodgepolo pine leot ar•o, vertical anglo and fire radiub (ot ponderoa pine
test Ara.FIRE RADIUS LEOGND: rlt nADOIUs LEaOCN:
S PECT 3 FELT0 F E E T . F E T t ..................
V FEET -. .- FEE~T --- --it FE ET - - - -. 1 P .EEI FEET 1• 10 FEET m
too. LANCII'ODUOLA I-FIR T!9T AOIA 0 . INOG LMANN SP QIGC--A.wtPIN " FiR
i _ot
I i ~"' III I
Ill It ; ;itI
!i " IIi
IsI
I. ii t
" " Ai OII ' ,AF g r ,I I p bI a s a: n i o o f
v Ii i i i ,.I f1 il li 'Si "Ii •I !l i ,
f. ' a a l
1i1 i% 1I ii lI . Ih' ,I ill ~ I.
S.. .. .. ...... 1I J _I AIAII~ fI• A A NI LI
1i0 ur- j.- eo~i nlrlm iiv • i u r in oltli lr 0 -D• %,o i I llolllt L l(lI(i i o
I I I I I I I Ij II III III I I II
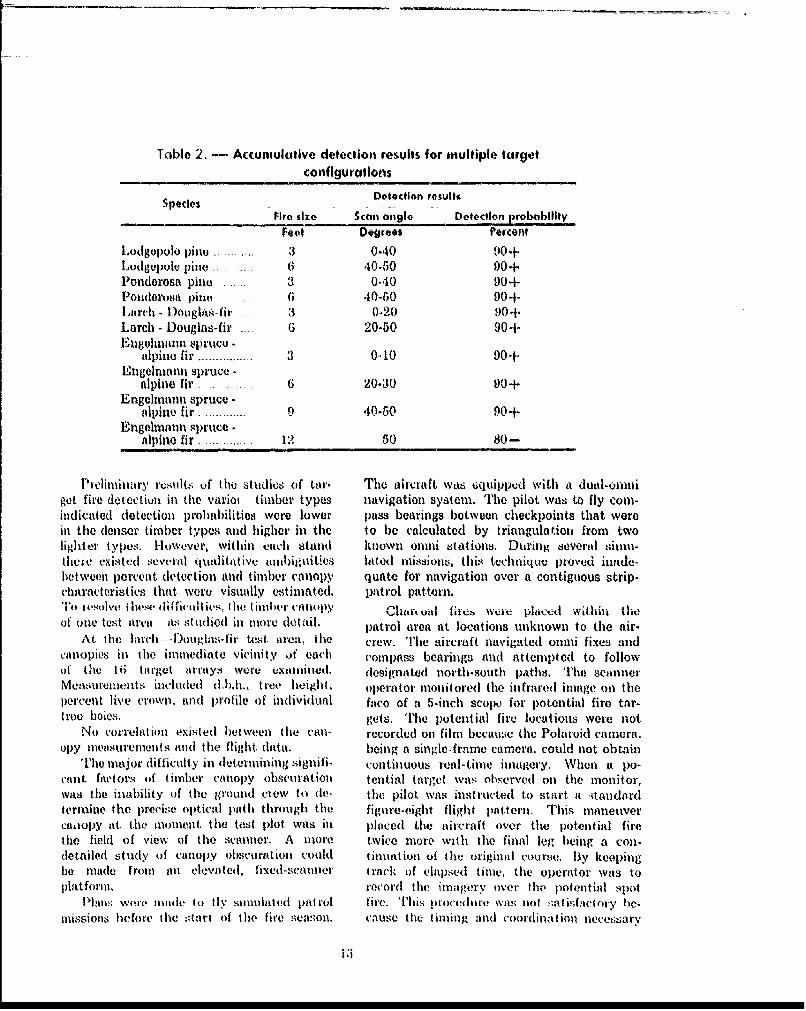
Table 2. - Accumulative detection results for multiple targetConfigurations
Sped" ~ Defection resultsFlte site Scon 0119l0 Deteclion probablity
F~eet D4,grees Percent
Lodgopolo pino ... .. 3 0-40 90o+Lodgepole pineO 6 40-50 g0+Pondorosa pine 3 0-40 90+Poliderosia pint, . 6 .0-60 90 +Lurch - Dotiglas-fir 3 0-20 90+Larch - Douglas-fir .. 6 20-50 90+Fougolinazn epi-twu
alpine fi r ........ 3 0-10 90-4-Engelmnani sprIuce -
alpine fir ._-6 20430 90+Engeunitna spruceJ -
alpine fir ....... 9 40-50 90+Enlgelmalin Slrucee -
alpine fir ........... ... 1 50 80-
P'i.liitiiiiitry resuIlt4 of tho mtudius of tar'. Tile aircraft was 3quipped with a dual-onminget fire detection in the variot timber types navigation System. Thie Pilot was to fly Corn1-indicated detection probabilit~ies were lower pass bearings between checkpoints that weroin tile dienser timber types; and higher in thle to be calculated by triangulation from twolighter types. However, within eaich stand known oinni stations. During several siniu-there existed Several q ualit4ittive, alinbigivni tis ldtOd mi1613io11, thiS ChtechiqueI Proved iiimde-between percent detection and timber canopy quate for navigation over a contiguous strip-characteristics that wore visually ustifllatOe. patrol pattern.to (Iov ChatIQ*~4 ~lIIIl~-V,11 ~IEI ~(xrk Oad fires wcre placed Withinl the
ofotl(eI test inrelt is stk~idod ill HIlore detail. patrol area at locations unknown to the air-At the lIa1cl- -lDtfglas-fir test. nrea,1 t he crew. llThe aircraft navigated oniii fixes and
canopies inl the immediate vicinit~y of each compass bearings and attempted to followof the 16 targot arraysi were VXalklilld, designated northl-South pathls. 'I'e scalilerMeaueet nldddhh.te egt operator monitored thle infrared image on thlel)QKCli~t live Crownl, 111d prtofile of individall fance of ai 5-inch scopo for pot~ential fire tar-tree boleS. gets. Il'he potential fire locations were not
No correlation existed between the catil- recorded onl filmn because thle Polaroid camern.Oj)y nieltisuremleuits and the flight. da(l~.. being a single-framne camera, could not obt.4in
Thull major (lifficuilty inl determininug signifi- conitinluous real-timle ilmagery. Whenl xi p)0cant facetors of timber canlopy obsctinatioxi tent-ial target was observed on thle mionitor.wasq the iniability of the grounid crew% N) (1- thle pilot was instructed t~o Start. at tAnldirdterniine the lprc(i-se optical pathi through thle figuiro-oight flight. lat~terti. This manetivercalloipy at. tlhe mom11enit. the test plot was inl placed the aircraft over (lie p)otenftial firethle field of view of the scakiner. A more twice, more w11,1 thle finial leg lbeilir a Conl-detailed studyv of caniopy ol)scurationl could tinuatioxi of the original course, By keepingbe miade from til elevated, fixed-scanner track of elxtpSCwl t ime, the operator wats toI)latfori'u. re41ord1 tho imagerv ovefr the potential Spot
Fllswere Ii~llad to Ify Suailatiuid pat rot fire. l'111S IWOCedkore was not s;at isftxct orv Ie-
Ifilissiofll before thle start of thle fire Weason,. cause the timingj and~ coordination niecessary
i 3

FIRE RADIUS LE8END: WaIR6 RAbIUS LEGEN04,3 FEET 3 FEET6 FEET ...... 6 FEET ..................
FEET POROCROSA PINE 191T AREA12 FEET -------
LOOGIPOLE PiNt TEST AREA100- ioo
90, to-0
I 75 I48- P 45-
so -
ta a tes
120 FEE -- -- -
* Iil g
460
U D
I SII
Z -tit
00 20' 30 0 500 10 ZO* 30 40' 0*SCAN ANGLE SCAN ANGLE
Figure 11.- Accumulative detection probability ver- Figure 12. - Accumulative detection probability ver-sus vertical angle and fire size for lodgepole pine Rus vertical angle and fire size for ponderosa pinetet area. teat area.
FIRE RADIUS LEGEND: FIRE RADIUS LEGEND13 FEET _____3 FEET
6 EE FEET ...9 FEET -..... tS. FEET .......
it FEET ...... -15 FEET ---IS FEET ENGELMANN •PRUCE"-AI. PPJE FIl•
I0"LARCI4--OOUGLA$- FIN LTAtE O TEST AREA j
I1• ,I I"
:' " i:i •I- 1i"- "i II
-. a! I.Ii I.
: .III * .. . *00 0.1)3 i-Q .I .I
o I' I!' ~i I Ii iI~i,.• ~
(1, 0o 'o" 30" 40" 50" O 0° 0" 3:0" 40" 0
SCAN ANGtLE SC.AN ANGLEFiguare 13. - Accumulative detection probability vat- Figure 14. Accumulative detection probability ver-
gus vertical angle and fire size for larch--Douglas- msus verical angle and lire size lot IEngelmannfRu test aie- s pruce alpine fir teal area.
14

to precisely locate the target area during the during Phase II demonstrated that the rela-maneuver could not be achieved. tively simple navigation techniques used will
not satisfy patrol requirements.One mission detected one out. of five The Beechcraft AT-11 aircraft was unable
chartcoal fires (each was a five-bucket array) to operate at 15,000 feet, above terrain, thepiaced in the 900-square-mile patrol area. altitude needed to attain 10-mile-wide cover-The ground crew observed that the naviga- age utilizing a 120' scan. Limitations on air-tion techniques used (lid not place the air- craft fuel and oxygen supply made attempts tocraft in position to detect the remaining four. perform extended high altitude tests imprac-Four other hot spots were detected on the tical. The aircraft could not attain altitudesmission, however; these targets coincided with necessary to investigate the detection limitsknown campground locations. The one test for unobscured 5-square-foot sources. Thefire detected was accurately located through unheated, unpressurized, and cramped in-use of infrared imagery and existing aerial strumentation space seriously degraded thephotographs. The fire detection patrol flights performance of the equipment operators.
SUMMARY, PHASE IIAt the end of Phase II many factors were b. The aircraft must have a better
evident that affected the realization of the navigation capability.project goals. Their scope is best presented c. The scanner system modificationsin the following outline: should include:
1. Accomplishments (1) an increased electronic band-
a. Equipment performance and data pass,
acquisition techniques provided reproducible (2) the addition of a pulse-height
detection measurements, discrimination circuit, and
b. Information about detection prob- (3) the addition of a rapid process,
ability was obtained for the four representa- continuous strip photographic
tive coniferous timber types. readout,
c. A qualitative list of requirementsfor an operational system was being acquired. 4. Proposed program modifications
2. Problems yet unsolved a. The technical competence of theproject should be broadened by acquiring ad-
a. Instrumentation a n d navigation ditional professional personnel, including U.S.problems limited the( detection data to aspect Forest Service pilots and technical personnel.angles of less than 50'. b. Experimental reorganization should
b. The large number of submarginal include:target observations indicated inadequate sys- (1) the addition of a mountaintop-tem sensitivity. fixe atfon of a can-
c. The ',igh speed nature of flight tests fixed platform study of can-(foes not facilitate precise observation of tin- aidler obscuration factors. and
d. Aircraft navigation and altitude (2) the division of the flight pro-gramt into two separatecapabilities of the present aircraft are ir.ade- studies:quate. (a) Fire detection studies in
3. Proposed equipment modifications the various timber types
a. An aircraft capable of flying at and t3
higher altitude and providing at least a mini- (b) Wildfire patrol and navi-mum of operator comfort must be acquired. gation problems.
15

I " ---m'nt -- . .n, •_•__ --- , ... ...
PHASE III TEST PROGRAMOBJECTIVES The first instrumentation checkout flight
was not made until June 22, primarily be-The goals of the 1964 season, delineated cause the Convair T-29 aircraft arrived late.in a test plan, are summarized as follows: On June 24, the first extended night checkout
1. The infrared system modifications were flight proved very encouraging. The aircraftto be checked out. Correlation was to be a n d radar navigation system performedestablished with previous test results by re- beautifully. The electronic instrumentationruns on the lodgepole pine test area, Data seemed adequate at that time. Intermittentgathering and flight test operational proce- use of the pulse.height discrimination circuitdures were designed similar to those of indicated satisfactory performance.Phase II. On June 25, the first attempt was made
2. When equipment performance proved at reproducing 1963 data for the lodgepolesatisfactory, flight tests were to be run on pine test area. The scanning system includedwhite pine (Pinus monticola Dougl.) and a new rapid process, continuous strip photo-coastal Douglas-fir. Also, flight measure- graphic readout (moving window display),nients were to be extended to 15,000 feet and a modified video electronic system. Pre-over terrain and 600 aspect angles in repre- liminary system sensitivity measurementssentative timber types. This would complete were marginal. During the first week in July,the preliminary survey of fire detection prob. a new high resol... on cathode ray tube wasabilities for northwestern coniferous timber installed in the moving window display. Thistypes. modification worked very well and the photo-
3. During the lightning fire season (July processor readout continued to perform im-
15 to September 1) the problems of fire patrol pressively for the rest of the season.
were to be investigated. The immediate goals In the middle of July the aircraft's electric,included familiarization with the navigation hydraulic, and navigation systems becamesystem and comparison of effectiveness of unreliable. During the next two months theinfrared surveillance with present Forest Serv- aircraft went through five extensive mainte-ive methods. Observations were to include nance periods.the feasibility of early detection of incipient The flight test program continued throughfires and immediate dispatching of fire sup- July and into August. Tests were made inpression forces. the lodgepole pine test area and the white
4. After the lightning season, the scan- pine test area at Priest River, Idaho. A singlener was to be removed from the aircraft and fire patrol mission was flown on August 21.mounted at the previously selected mountain- The infrared receiver and video electronicstop-fixed platform test site. The mountaintop continued to demonstrate intermittent reli-program included: (1) Extension of the ability because of excessive modification.larch-Douglas-fir detection probability curve During the third week of August it wasto beyond 60' and (2) the detailed investiga- apparent that continued efforts to increasetion of forest canopy obscuration factors. the sensitivity of the present electronic and
receiver system would not. succeed. FlightFIRE DETECTION TESTS operations were terminated and the instru-
mentation removedl from the aircraft.A Convair T-29 aircraft, equipped with a
Doppler radar navigation system, was ac- Bench tests of the infrared receiver indi-quired on loan from the U.S. Air Force. The cated it would still operate satisfactorily in ainfrared instrumentation was modified as stable ground environment. It produced satis-proposed at the conclusion of the 1963 pro- factory results during the mountaintop testgrain and installed in the aircraft, series.
16

FIRE PATROL similar disturbances. 'tihe 60-mile-wide patrolarea was bordered on the east by a 100-mile
Equipment and Test Procedure line extending from Alberton, Mont., south
The Doppler navigation system, which to the Salmon River.reads out directly in latitude and longitude, The area was divided into seven 8-mile-provided a suitable navigation capability, wide patrol strips. This width was chosen toSpecifications for the accuracy of Doppler give ample overlap on adjacent passes, andsystems are commonly within 2 percent of to provide simplicity for navigation becausetrack. If this accuracy could be attained, the adjacent flight lines would be separated byDoppler system would keep the aircraft within 10-minute increments of longitude.2 miles of the proposed flight path on a 100-mile patrol rv, . This accuracy is near limits At least three prominent topographic fea-which could be tolerated on patrol missions. tures, such as road intersections or lakes,
were selected on each proposed flight pathA 1:60,000 aerial photomosaic was made to serve as checkpoints for purposes of estab-
of the proposed patrol area and used as a lishing true location during the flight.navigational aid. The photomosaic was cutinto strips that included the area to be cov- Patrol Flighered on each patrol run. Latitude and longi-tude lines were marked on the photostrips A single patrol was flown on August 21.to describe locations. The aircraft's operational ceiling of 18,000
feet m.s.l. limited the flight altitude to 12,500The moving window display provided feet over average terrain. At this altitude
rapidly available strips of infrared imagery the 120' scan angle gave 4-mile coverage tothat could be compared to the aerial photo- either side of the flight path.mosaic to determine aircraft location.
During the first pass, on a southerlyDuring the detection missions it became heading along strip 1, we relied on the
evident that cumulative errors in the Doppler Doppler system entirely. The aircraft begansystem would exceed the accuracy require- the pass on course and drifted consistentlyments for patrol work. Infrared-aerial photo- to the west. This drift was detected byinterpretatica could not provide the precise comparing the infrared image to the aerialinformation in reasonable time for patrol photomosaic. When the pass was completed,navigation. A combination of the two sys- the Doppler navigation was corrected by addi-tenis offered a better chance for success. tion of 4 minutes longitude. The pilot wasPlans were made to navigate with the Dopp- able to correct his heading on the second passler system, and to use the comparison of the and the drift was eliminated.aerial photo-infrared imagery to determineperiodically true aircraft location. True loca- The Doppler and scanning equipment weretion provides a basis for correcting accu- both functioning poorly during the flight;mulated errors in the Doppler system. If however, it was still possible to navigate thenavigational procedures worked satisfactorily, desired course. Patrol flights were terminatedpatrol missions would be flown after periods at this point because of equipment troubles.of lightning activity.
Patrol Area MOUNTAINTOP TESTSA 6,000-square-mile patrol area southwest General Discussion
of Missoula was selected because it wassparsely populated and had a history of fre- A fixed-mountaintop scanner site wasquent lightning occurrence. A sparsely pop- established to examine in detail those factorsulated area is less likely to give false alarms which obscure targets and extend detectionattributable to campers, vehicle exhaust, and data beyond the critical 60' (fig. 15).
17
Two advantages of a fixed site are: (1) onable distance of Missoula is in the BearOperation is more economical and (2) test Creek Drainage west of Victor, Mont. (fig.measurements can be observed for a much 16). This precipitous area provides: (1)longer time than is possible from a fast mov- Vertical aspect angles between 450 and 70',ing aircraft. (2) slant ranges of 3,400 to 7,400 feet, and
(3) a well-stocked mature larch-Douglas.firThe only location with suitable elevation stand associated with grand fir, Engelmann
(aspect angle) and timber stand within reas- spruce, and alpine fir.
F11w* 15. -Mountaintop scanner installation. Figure 16.- Test area from scannerlocation.
Preparation of Program 4. Identifiable foliage and timber patternswere to be related to detection probabilityThe mountaintop test was designed to and signal strengths.
supplement and extend the results of the
flight program Lack of previous experience 5. Correlation was to be determined be-made the first effort largely a trial run, and tween target signal strengths and detectionmost procedural details were worked out on probability.the spot. The initial objectives of the pro- 'rest plots at angles between 45' and 60'gram were: at 2' intervals were planned. Plot locations
1. The detection probal ility curves were were chosen to provide a homogeneous timberto be extended to larger aspect angles. Flight canopy. Each plot was 100 feet long andprogram data had been limited to angles less oriented at right angles to the scanner azi-than 50". inuth (fig. 17). The ground was cleared of
obstructions for access and preliminary tim-2. The spatial dlistrib~ution of sizes and ber cruise data were taken for each plot.
types of canopy obscurations was to be deter- Test plots were initially prepared at 4 5ac 50p,inined over an extended area. As lt÷eeiiil rprda 6,5*i52, 54, 566, 580, and 600, but because of
3. The effects of background tempera- ambiguities in preliminary data at these plotture, target emissive area, and scanner field locations, additional plots were constructedof view on the target-to-background signal at 51%, 53', 550, 56½°, 57', 60½°, 61%,(ST/S81 ) ratio were to be determined, and 690.
18
II, "It W. T. I' N,
SEC. 2 SECA N
Top HEkLISPOT*I-OW
1< EOooT OP*GV BSOTTO SCANNER
B .\ * %C% AN
SCALE: INCH@ 0,FT. " TE
6 INCHES- I M1LEI \4 L
Figure 17.-Beer Creek test site map. " .
To facilitate detailed canopy measure- hours). A 100-watt incandescent light wasments, a two-dimensional plot (50 feet by located close to the scanner so that the crew
200 feet) at the 450 aspect angle was )re- on the target area could locate the scannerpared. at night and make subjective estimates of
canopy ocrtion.. ,
Instrumentation The test targets were 14-inch diameter
Figure 18 is a block diagram of the scanner (1.07 square feet) fire buckets, each filled
instrumentation. The video electronics used with approximately 10 pounds of burning
during the flight program were discarded and charcoal briquettes. rhe same sources are
simple video amplifiers substituted. This used in the flight program and have proved
provided an adequate but much less sophisti- to be near black body, Lambertian radiators.
cated video electronic and readout system. Figures 19 and 20 are representative Pol.The scanner was mounted so that the scan- aroid photos of the oscilloscope readout.ning sweep started 300 above the horizon Table 3 gives measurement data for eachand swept down through 120' of elevation illustration. Figures 19A and B show theangle to the vertical, The scanning mirror change in background signal level over therotated at approximately 3,600 r.p.m. and 5-3/4-hour period just after sunset. Figuresgave two scan sweeps per revolution. Precise 19C and D are of the same 1/16-square-footcontrol of scanner azimuth allowed detailed calibration target. In figure 19C the labeledobservation of individual optical paths. Rela- points indicate (A) the beginning point oftive radiant intensity was measured in volts scanner sweep, (B) the horizon, (C) targetat the oscilloscope. Rough system calibration signal spike, and (D) end of sweep. The Jis described below, space D to A' is sweep dead time before the
To eliminate the effects of reflected solar beginning of the next sweep at A'. On 19Dradiation, radiometric test measurements were the sweep was expanded and delayed for moremade only at night (1930 hours to 2400 precise signal observation.
19
SCANNER SYNC PULSE
PHIASE1 Rb*PICKUPDTCO
GANPE ILTER "NM post-
AWLIGNAL ANPLITIJDEFigure~~1714 18. flok igamo outino cantintua.nato!R-rirFRigue 20A and B niaeenac- mtoy35vltAfg 1,?tkna 6 o)
Aeto� ytm sga-onie(/)rto iniaiglc f ufcet(yai ag
by us of lectrnic MItRinR ih1ORpe ntevlag anps mpiir opnoctae roloffabSE10kCONDARYsncesr orsat ag adLm
signals omlin gurray of. a-smllc nuagbar of mutinto aproiannely 1.stumenation. , rabut3
iniiduals 1-3/4-nchBsq diar e glwngabri- mvattl .5 perbrqutte (f.2)B taken "lbatin 60pon)quee. Figysrem 2sAisnal-typnical caIb)ration theiclineg pohick of ufieth roynainis urvne Ibyurve (if ecthisicas froteringlot); 0.2 volti the speltrage rgaion poft amplisir.otsgiesawcasvte rollfbse ved inlfo o5e briete system ius u voltsage f reslantsane to effativ
andur2.520Coltswasrte measud remen12 ofi etiarge efficsio oftee 0.25vl/(rationstrad-e
quartt esp Te syti emy a ton rathed s atnn lproi-e baian) tcnqe.idct: (1 oanThoalblea3.-nMeasproviedt pa rameesdsoiantem issio figromtes s9tandar 20 ret
iniida gure nhsuae glwn Sweep wcattleerqete 2 h Tcaibrtie"ono.t ~ Siue2A ign tpal Dairto hebna o t eon of dayepos urei
curve(in tis ca e ifro 6di lot. 0e./dvol theg spectaergodoieaueensg.ewas9 .2e observe 45.0a f0/13 o1825et, ytmotu vlaersoset fetv
20A /i.2 5~Sec./dv .45 9/14 225
209B .2 20 1msc. 2.45 90/14 2250
20C 1.0 10 psec. .22 9/16 -
20D 1.0 1.0 p~sec. .22 9/16

A B
C D
Figure 19. - Polaroid photographs (of oscilloscoope readout: A (l8°S hours, 10/13) amd It (0012 hours, 10/14),change in background signal level over a 5-3/4-hour period; i and ID (1/16-square.foot itirgot), full seussweep oi l, sweep expandle mind delayed for more precise signal observation on I).
21

A 13
C D
Figure 20.- Polatroid pIhotograjlL.s of onicifloscoj* red'f(I(ImI: 2, target (3s, 75) jigmIIII auiqI yl isoiaso withnto elmtrottw filter: , itat,411C siwt'p Iwith 1.50 k-,- low-pnies electronic filter: C7, menestremnewi of scannuerre5sohtiont, two fires 1.7 millhicitcdiams apad. 1), measuremenot of sentmur reotiutioit, two fires 2.6S moiiii.radians apart.
/2
4- 020~eo -
4NA, FROM VOLTIAG
iO. 4 , GAIN MW'Lift
,,/
NUMBER OF BRIQUETS 0 n 4 000. r " NUMR 011 SQ6 FT. STAINDARDt INT*. fOef CALWATi0N
0 ' 6' At W PLOT
A BFigue 21.-A, - Al. Imrumet calibration cuirve; /, calibration •urve
qh|owing IomlnhieIr rEkil,-1.0 of the voltage gain aInpiifier,
130=
LEGEND 190-
CROWeN MNGAN ~ j Si
8it 6 Ma It~S 4. R.Nlo -Vp~ 's GRNDFI
GRAM) " JA
WI.AM"V, R4 F
I I$ APICN" W fl ",, 1
s FNGLMAA- qPAtCt
SCALh INr FCC Y
C 5 0I ý
o0 9 oJ05 O l
Was
Figure 22. -'tauu vieW Of isidivicluazu 6ý hi RA(we boles tutid crownulgwithsin 1he 45* test amroo,a
0 $O 20 50 40 6
23 (FEET)

i
"Discussion of Tests at 46" Plot Radiation measurements (i.e., scannorsignal voltage) were made from a 1.07-square.
Ti98 plot was prepared to observe the foot target placed successively at oeach 1.exact nature of the timber canopy obscura-
tio~. grddo plt ws lid ut ~.&ft squaro foot prid increment th roug1"hout tiletion. A grhldod plot was laid out (45 feet 4.5 by 50-foot plot. Figure 23 shows a signalby 50 feet) to encompass "several representa- voltage profile of the 4•° area. Siglnals weretive trev crowns." A plan view waB niade of recorded by 0.1-volt. increnients. Tihe onlyall treo crowntj and boles which would obscure syatemi calibration availablo is that which wasany portion of the test plot (fig. 22). For extrapolated to 45" from the 50: plot. Forthis purposo it. was necessary to include treos the qualitative nature of this report tile 50up to 66 fedt in frot of the gridded area. calibration urve-s are a(dequate for the 46'"
The 45' plot grid locations are referred data. For precise extrapolation to 45--, multi-to by the abscissm and or(linate, respectively, ply the abscissa of the 504 calibration curvesof figure 22, and have the dimensions of foot by 1.33 (fig. 21A).from the extreme southwest corner of the In addition, a limited number of largertest area, fire arrays was investigated to determine the
•T"OK
K xt X )ex0
NX
r448
424
KYX
~~OOa~Y K K
2m X X .i Pt XR..OT ~ ~ ~ ~ ~ ~ ~ K COA4AE PC0 6A~ TX SCS0 ZMUH(
MINl STENRH NK Xi.~,,.9 00~5.* R-s.
2-,VB 3X 9.U,3ýV+
Figure~~~~~~~~ K3 indvlaepoieo 6 etne~,Io~tsur~otcarol~u~e
X2
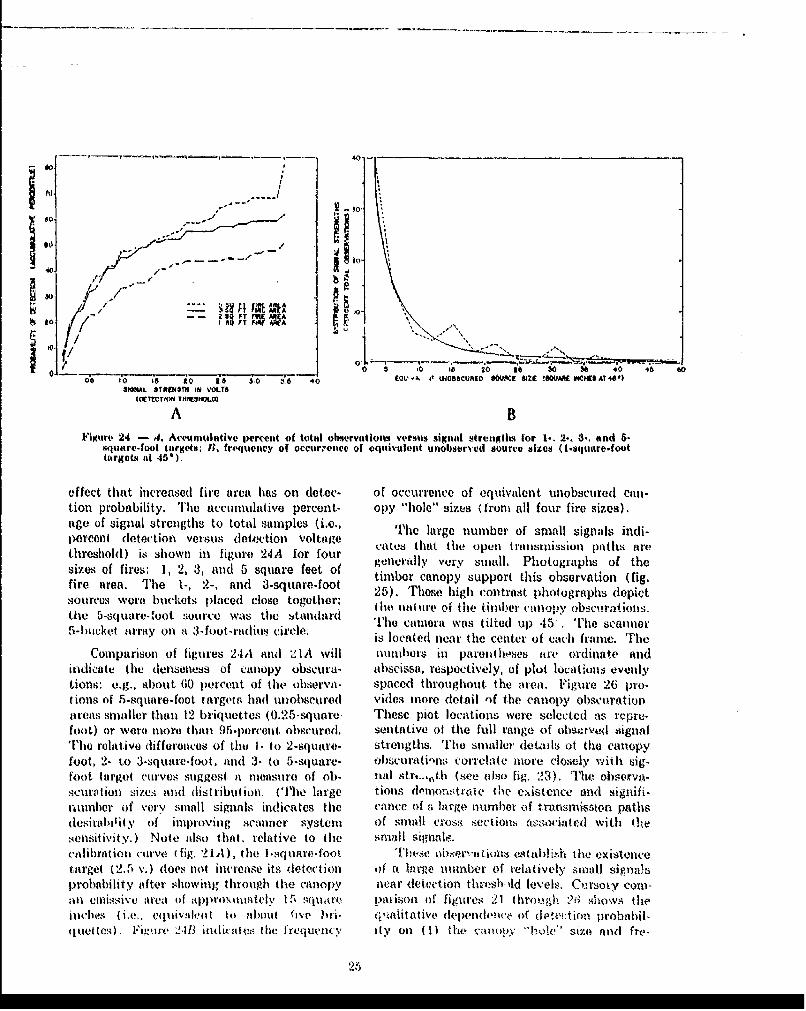
a0 fj Il A
/1 I FT A
00 '0 (k' to 18 3.0 68 40 EOU.', iT WEOBSCURED OW 80W88ZI (SQU WCHISAT46')SJNLSTMESTH1 1it, "OL.T,
1O10CRICTfd THRE31101.0
A BFuture 24 - 4. Acetmula~tive Ierceht of total ohstrvations Ymus~s iignil mtrengths for 1-. 2-, 3-. and 6.-
xquaire-foot Ithrgp(8; It, frequieney of occuroince of eqtluillonet unobserwed dolirve sizes (I-Squaro-foottargets ati 60)
effect that increased fire area has ol (totec- of occurrence of equivalent unobscured can-hion probability. T'he aeccumulative percent-- opy "hole" sizes ( ironi all four fire sizes).age of signal strengths to total samples (i.0., The large number of small signals indi-percent detection Versus detection voltage etsthat the open tranismission paths tiret~hreshold) is shown inl figure 24IA for four generally Very small. Photographs of thlesizes of fires: 1, 2. 3, and 5 square feet 0 timber canlopy support this observation (fig.fire area. The 1.-, 2-, and 3-square-foot 25). rThese high contrast photographs dlepictsourcus woro bucket,; O~acCl close together: aueo tetmethe 5-sqluare-f00t source wats tile Standlardt too am ra was tiletimer canp y 45 i'Uelmscanne5-bucskot arrmy on it 3-foot-radaiu cirele-, is located near the center of each frame. mPe
Comparison of figures 24IA mid -21A~ will numbers tin parenfit-m~es fire ordlinate andindicate the denseness of canopy obsvura- abscissa, respectively, of plot locationls evelilytions: e.g.. abouit 60 porcent of thle observii- spaced throughout. the arpa. Figure 26 pro-tions of 5-square-foot. targets, had imohacured viles more (etntal of the canopy obscuirationareas smaller than 12 briquet~tes (0.25-square- These piot locatiolis were selected as rvprw,,foot) or wvcro atoro (halt 95-port-mit. obscured. senitative of tile full range of obsl'rved signalThe relative differencees of the I- to 2-squarel- strengths. The smallelr (etd.11s of tho Canlopyfoot, 2- toc 3-square-foot. au1di 3- to 5-square- olbsctirati'nis correlate more Closely with sig-foot. targot curves suggest at meansure of ohl- linl st~rc.,..ti (,,ie also fig. 23.). T1h0 obsorv'A-scurptitin size., and dlist ribut ion. (T'he large tioltS (lPtmorftrai(, the existence and signifi-num11ber Of Vcry s11all siglnals inldicates thle vanice of i large number of t.m111nsmissie pathsdtesirability (of improving scanlner, systemil of small Cross, sectionls aIs3OCiated With l-th!sensitivity.) Note ailso that. rohinttive to thie Smallsignb1calibraltion curlve (fig. 21.1), thie 1-4quatre- foot Thebse tbe~itus*th ilhte existencecmrgc (2.5 v. ) dtoes not increase its dletection of rt large numbehtr of relatively Small sign-Alsprobability after showing through the canopy near dettection thneshl-ld levels. Cursoi-y comn-ani emizz.4vt area of appro~intmitcdv r. squtiA patlison O~f figure~s 21 t hroughl -2i; shows; thle-inchies (i.e., cqlltiv!111'a I to 11.)(3ut fiteP lii- tilttiitat ive dependtence onf dptcition probabil,quetteS) . Fig:ure 241B Indicate-i thie frviu4?nCy1 aty Onl (1) the Valnov.y "hole"' size And ftc-

~LO
Ae
C%. -0
bes
26

COLUMN I COLUMN 2 COLUMN 320 FIELD FOCUSED ON
W:DE ANGLE VIEW 2*FIELD FOCUSED ON CANOPY SCANNER LOCATIO
(25,75)
SIGNAL STRENGTH
SIGNAL STRENGTH
* .4 VOLT
;0-0
SIGNAL STRENGTH -
Z.O VOLTS J
Figure 26. -Photograp)h of selected plot locations sh1owing canopy characteristics associated with severalvalues of signal strength.
27.
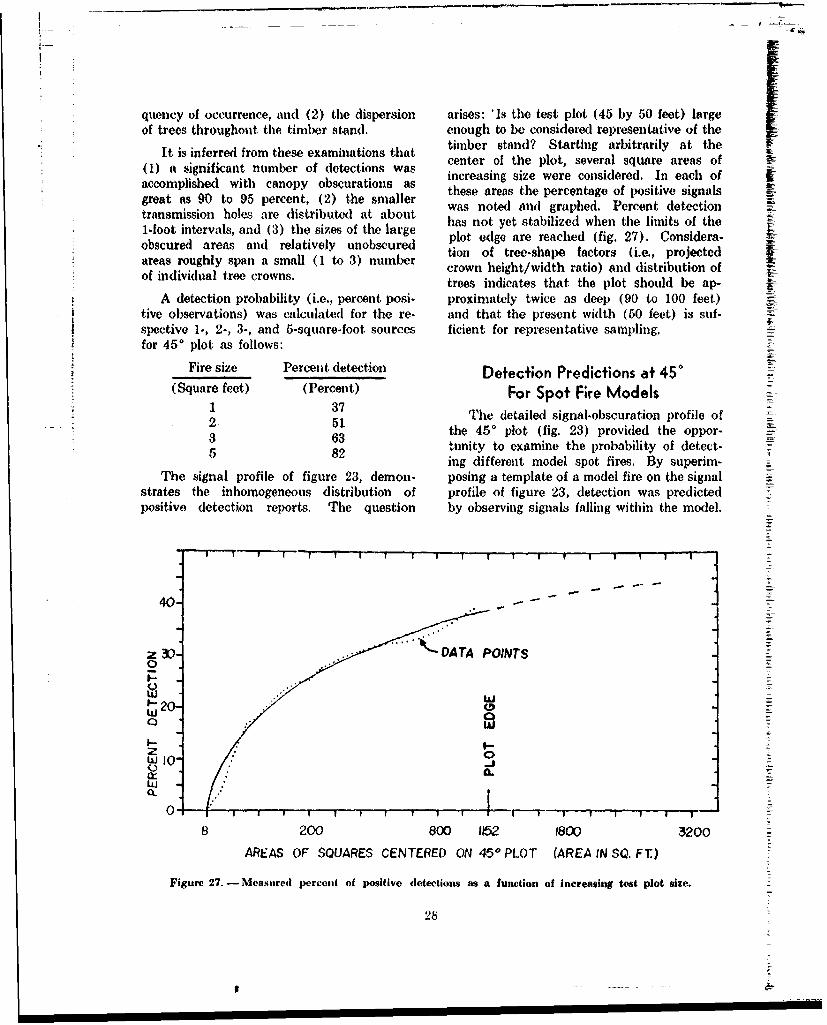
quency of occurrence, and (2) the dispersion arises: 'Is tile test plot (45 by 50 feet) largeof trees throughout the timber stand. enough to be considered representative of the
It is inferred from these examinations tha timber stand? Starting arbitrarily at thecenter of the plot, several square areas ofS(1) it significant number of detections was increasing size were considered. In each of li
accomplished with canopy obscurations as irSgreat as 90 to 95 percent, (2) tihe snmller these areas the percentage of positive signalstransmission holes are distributed at about was noted and graphed. Percent detection1transmissiontr les an te disribtes oathe lart has not yet stabilized when the limits of the1-loot intervals, and (3) the sizes of the large plot edge are reached (fig. 27). Considera-obscuara reas and a esall unbs r tion of tree-shape factors (i.e., projectedareas rouhl spansp fatr (ima., projectedmbe
crown height/width ratio) and distribution ofof individual tree crowns, trees indicates that the plot should be ap-
A detection probability (i.e., percent posi- proximately twice as deep (90 to 100 feet.)tive observations) was calculated for the re- and that the present width (60 feet) is suf-"spective 1., 2-, 3-, and 5-square-foot sources ficient for representative sampling.for 450 plot as follows:
Fire size Percent detection Detection Predictions a+ 450(Square feet) (Percent) For Spot Fre Models
1 37 rTle detailed signal-obscuration profile of2. 51 the 450 plot (fig. 23) provided the oppor-3 63 tunity to examine the probability of detect-5 82
ing different model spot fires, By superim-The signal profile of figure 23, demon- posing a template of a model fire on the signal
strates the inhomogeneous distribution of profile of figure 23, detection was predictedpositive detection reports. The question by observing signals falling within the model.
I I I I -- I I - I I I ' I I I V f " I I y I 1
40-"
Z 30- DATA POINTS
0
tLJJF.20 o
o -
I.- I-.
C 0
LU
200 800 152 1800 3200
AREAS OF SQUARES CENTERED ON 450 PLOT (AREA IN SQ. FT)
Figure 27. - Measured percent of positive detections as a function of increasing test plot size.
28

90.
80. / / , .............:l: :•; ...............
80.
o•Tp ...............
70.
60'
S 50 / - A SOLID AREA FIRE MODEL
t/ / - ---- s8 =ONE FOOT WIDE FIRE RING
/ C PARTIAL CIRCUMFERENCES/ FIRE
S 3 0 .T- ... 0 a SAME AS 9 FOR SV0.4
20. -- ESANE AS B FOR $SO.7
I0.
0 RADIUS OF FIRE CIRCLE
1 2 3 5 6 7 8 9 12 obFigure 28. - Percent detection at 450 determIned for three fire
models as a function of model size and signal threshold,
Three fire model configurations were con- in radius (fig. 28, curve C (the five-firesidered: (A) A solid burning circular area; array)). This may indicate that 9 feet is(B) a 1-foot-wide circular burning ring; and the normal radius of influence of any tree(C) five 1-square-foot burning areas random- or group of trees. This correlates nicely withly spaced around a circle. The fire radius inferences of the same effect observed fromwas varied for each model. Detection prob- the flight data.ability at 80 random plot locations for each The distance to the nearest positive signalconfiguration was evaluated as a function of from each fire center was recorded (histogram,"fire" radius. Positive detection was recorded fig. 29). In no case was the fire center morewhen a positive scanner signal fell within than 5 feet from at least one positive signal.the "burning" fire area. Results of this This indicates that a spot fire started any-analysis are plotted in figure 28, curves N, where under this canopy would become ob-B, and C. Also examined was the effect of servable sometime before it had grown to aincreased detection signal threshold on the 5-foot radius.detection probability for the circular-ring fire(fig. 28, curves D and E). Qualitatively, these Ewauation of the sum of signal intensitieshigher thresholds decreased tie detection wwithin each modeled burning area is usuallyprobability, as was expected. a more reliable prediction of detection prob-
The probability of detection does not in- ability. These sums should then be examinedcrease significantly for fires larger than 9 feet with varyinig signal intensity detection thresh-
29

40-
W AVERAGE DISTANCE= 1.6 FEET30-
020-
14.3 .8 0%
0 .1-1.0 1.3-2.0 2.1-.0 3.14.0 4.1-5.0 5.1-6.0DISTANCE FROM FIRE CENTER TO NEAREST POSITIVE SIGNAL (FT)
Figure 29. - Frequency dislributioa of distances fromrandom locations to nearest positive detection.
olds. This evaluation will be one of the Several observations are worth noting. Ingoals for experiment redesign. Accurate tech- each case, fewer than 1 percent of the signalsniques for calibration and test area enlarge- were in the 2.5- to 3-volt interval. The per-ment are required if the sampling is to be centage of signals stronger than 3 voltsmore representative of the timber stand. increases slowly with fire size. The distribu-
Detection probability for the models is tion of small and intermediate signals tendsinherently low. The larger "burning" area to gather into fewer signal strength lucre-of the models may have subtended several ments as fire size increases. And the meansmall transmission paths that would have signal strength of this group tends to largeradded up to a positive detection report; how- values with larger fire size. From theseever, these paths individually could have observations we may conclude: (1) The totalattenuated the 1-square-foot targets' trans- radiation from the smaller transmission pathsimitted intcnsity below the .1-volt detection (individually below system threshold) ac-threshold resulting in a negative detection counts for the dependence of detectionprediction. probability on detection signal threshold, and
A rough evaluation was made to investi- (2) the smaller holes may be spatially dis-gate the significance of integrating over sev- tributed in a more homogeneous manner thaneral minute transmission paths. Although the the larger transmission paths.radiation 'ntensity from a single small trans- Lack of adequate calibration and timbermission path may be below the level of de- cruise measurements forces us to defer thetection threshold, the total radiation from rigorous statistical correlation of these param-several such paths may be great enough to eters until more reliable (ata are produced.give positive detection. While taking samplesfor fire model A (solid circular fire), each Appendix V includes a brief discussion ofpositive detection signal strength that fell theoretical approaches to timber canopy ob-within an individual "burning" area was re- scuration.corded. Eighty random samples were takenof each fire size. The frequency of occur- Detection Probability Beyond 45°rence of signal strengths versus fire size is Measurements were made at 16 differentplotted in figure 30. angles beyond 45 vertical angle. The target
30

60-
40- 2-FOOT RADIUS 40- 3-FOOT RADIUS
- SOLID AREAS_ SOLID AREAS
64% TOTAL DETECTION 72% DETECTION PROSPROBABILITY
20- 20-
(0I-
.5 1.0 1.52.02.5 3+- 0 .5 1.0 2.0 3+
4 0 - 40- 6-FOOT RADIUSSOLO
4-FOOT RADIUS SOLID AREAS 100% DET.
AREAS 86% DETECTION
20- 20-
L*. 1.0 2.0 3+" 0 1.0 2.0 3
0
60- 60-
z"o -FO SOLJD AREAS 9-FOOT RADIUS
10%DE TECTION I0 % DETEC1nON
1 2
Q
k::
0 05 10 5202. DET0E0.5IO. 1.020. 3+ETCTO
°:
Lo
U..
0 0.5 1.O 1.5 2.02.5 .3+ 0 .O I. 1. Z02.5 3 +SIGNAL STRENGTH (VOLTS) SIGNAL STRENGTH (VOLTS)
F•igure 30. - Frequency distribution of sign al strengths versus size of the solid( fire model A.
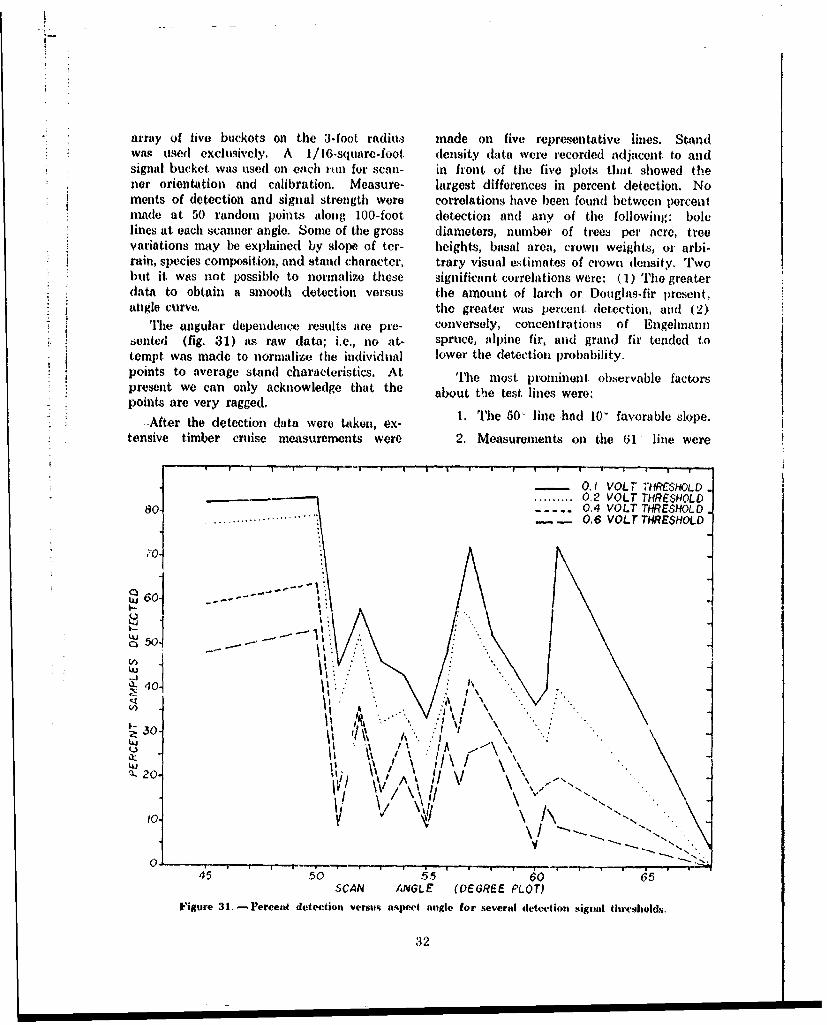
"array of five buckets on the 3-foot. radius made on five representative lines. Standwas used exclusively. A 1/16-square-foot density data were recorded adjacent to andsignal bucket was used on each run for scan- in front of the five plots that. showed thenor orientation and calibration. Measure- largest differences in percent detection. Noments of detection and signal strength were correlations have been found between percentnade at 50 random points along 100-foot detection and any of the following: bolelines at each scanner angle. Some of the gross diameters, number of trees per acre, treevariations may be explained by slope of ter- heights, basal area, crown weights, or arbi-rain, species composition, and stand character, trary visual estimates of crown density. Twobut it was not possible to normalize these significant correlations were: (1) The greaterdata to obtain a smooth detection versus the amount of larch or Douglas-fir present,angle curve, the greater was percent. detection, and (2)
The angular dependence results are pre- conversely, concentrations of Engehnann-Anted (fig. 31) as raw data; i.e., no at- spruce, alpine fir, and grand fir tended totempt was made to normnalize the individual lower the detection probability.points to average stand characteristics. At Tm most prominent observable factorspresent we can only acknowledge that the about the test lines were:points are very ragged,S i ~~~~~~~~1. The 50" iehd1,fvrbesoe
-After the detection data were taken, ex-tensive timber cruise measurements were 2. Measurements on the 61 line were
0.1 VOLT TIHRESHOLD- - 0.2 VOLT THRESHOLD
80.... 0.4 VOLT THRESHOLD.. . 0,6 VOLT THRESHOLD
IXVto .. - Il . ' -
S 60*.... .. 0 . "
2:U
|". .20•
"1 \ " :'I "k :-.1
45 50 55 60 65SCAN A4NGLE (DE6REE PLOT)
Figure 31. - Percent detection versus aspect anigle for several detection Signial thresholds.
'32

LEAST $41VARK FFIT
looo X W
M60- (n'14•
o 40- LARCH-OOUGLAS*FIR FUOHIT DATA
LARCH--DOUGLAS-FIR MTNTOP OATA
(OCETECTION TRAESHOLD 0.2 VOLT)
Figre 32.-IPhase II, larch- wughas-fir flight deta to 50° 20.
extended puat 60*by the mountaintoptest data.
0 10 20 W0 (S o7VERTICAL SCAN ANGLE (OEGREE$)
unique in that they were taken on a very from wet ground near the creek toward a drywindy night. Also, the timber was largely slope occupied by intolerant species.intolerant species (i.e., "easy site"). However, foresters predicted that variation
3. The 600 line was a short distance from of detection probability would depend morethe creek and had a dense understory of on changes in angle around the 600 - 61' areaPacific yew ('l'Taxis brevifolia Nutt.) brush. than on differences in timber type. This is
Measurements made after this brush was re- evidently not true. Most of the statisticalmoved increased detection from 10 to 36 per- ambiguities in the detection probability -
cent. timber cruise correhation (cAn be attributed to
4. Lines 60', 60I 1', and 61 ' were within inadequate sample size for the measurements.
a short distance of one another, progressing In spite of the odd character of figure 31,
900
~J70"60.
)40.
Figure 33.-Frequeney of Coccurrence for all W 30-5-squau. fot target arrays,45° to 69% by a t0signal strength. % O
CU1 . 1.0 53~ 20 Z'S .30' 3 4SIONAL STRENGTH (VOLTS)
33

there Is no reason to expect that these meas- The frequency of occurrence of signalitrements do not qualitatively describe tile strengths for all data on the 3-foot-radius
existing physical conditions five fire arrays is shown in figure 33, It is
STo interpolate the detect~ion probability interesting to note the test observer's personal
versus aspect angle data between the one-look preference for integral and half-Integral volt-
method of the flight program and the mott- age values. The relation between percent.
taintop test series, a detection criteria rela- detection and mean signal strength at eachtionship between the two moust be established. of the test plots was examined with theTargets observed on the flight imagery were Spearman Rank-Order (Rho) correlation co-detected when the target intensity exceeded efficient, r. The resultant corrected correla-
the maximum background intensity. The tion was r = +,98, or approximately a 1-to-i
criteria that mountaintop target signals must relation between the two sets of measure-
exceed the peak background signal (described menta. This correlation is logical and has beenin Appendix IV) established 0.2-volt as the assumed in the past; however, it had not ',eenappropriate detection threshold. When used previously justified by rigorous argunment.
as an extrapolation of the flight data (fig. 32), Te accumulative percent detection forthe mountaintop data look a little better. Teacmltv ecn eeto osuccessively larger detection signal thresholds
Pursuant to geometric considerations dis- is presented in table 4 for all data on 3-foot-cussed in Appendix IV, the best fit (CosnO) radius fires, and in these angular increments:curve was adjusted to the data and Stfttisti- 450, 500 to 54•, 550 to 590) and 60'° and
cally tested. The best fit, n = 1.40, gave an greater. This was an attempt to smooth outR.M.S. standard error of measurements of the detection probability versus angle data13.3-percent error and an expected ±-2.6- and to examine the effects of higher detec-
percent error at the 95-percent confidence tion threshold. The smoothing effect directlylevel, resulted from fewer but larger angle classes
Table 4. - Percent detection for various signal level thresholds,at aspect angles 45' to 60'
s;.'gna! Aspect anale increanorot
threshold(Volts) 450 500 - 54' 55 - W9 +600
------------ Percent ---------.--.---0.0 100 100 100 100.1 82 55 53 40.2 76 46 42 26.3 60 35 34 16.4 55 32 30 13.5 49 25 26 9
1.0 43 24 21 61.5 28 12 11 1.52.0 23 9 7 12.5 22 6 43.0 16 5.8 33.5 14 5 2
34

encompaI,•1ing a gr(eal'r number of measure. 6, Calibration techniques wire inadequate
itUit samiples pen' clast. for reducing data to reliable absolute unrits.
It appears, then, that about 300 to 500individual measurements Lire necessary to es- T'he lxositive results of the test include:tabliAh it reliable detection probability in a 1. The unique instrumentation require-given timber type at a given aspect alngle. menits, logistics problems, and site preparation
Summary of Mountaintop Test Series are now familiar.
I'ho original objectives of the mounttintop 12. The general trend of percent detectiontesti have not yet. been met. This test was versus angle is established,planned as the first of a series of possibly 3. The cause and importance of the largotwo or throe tests. The first. effort. was suci- iulbor of very small signals have been idon-cessful in that it yielded information about tiffed,the relative value of several obscurationparameters. The usefulness of five separate buckets in
Among the deficiencies are: t.ho standard test array has been questionedand discussed at length. The use of five
1, Sampling of percent detectqion versus separate sources in one target array doesangle was poor and inadequate. It is evident introduce N, times the minimum acceptablenow that representative sampling will require number of unknowns in any detection prob-test plots three to five times larger than those ability equation; e.g., five separate measure.used. Up to 600 datai samples per plot will ments of a single bucket "should" more pro-
b necessary. cisely measure detection probability. With a2. The timber cruise measurements were five-.bucket array, one does not know which
inadequate for correlation with signal obscura- bucket is obscured and which is producingtion data. a positive detoction signal.
3. Human bias in the recording of the Results of the first niouutaintop effortdata was obvious, should be regarded as inconclusive, However,
4. The limited dynamic range and non. these results will be reviewed continuaily as!i-nenrify of the electronic amplifiers intro- critoria for experilientali d esign for tile con-duced uncertainties into the data. tinuation of the program.
35

CONCLUSION
SUMMARY OF T.29 aircraft, equipped with the l)opplorSPHASES !, lit AND II! radar navigation system, hao the capabilityPuriEg th I Ar D o e l to follow patrol corridors accurately during
SDuring the :3 years of the development nighttime detection flights, The moving win-and field evaluation of an infrared detection dow dioplay provides immediate readout ofsystem, many limiting factors have been information with high resolution.identified, equipment has been produced toS overcome BonO of the limitations, and some The research capability developed duringdata have been generated on which feasibility this period undoubtedly will prove to be thecan be judged. Except in situations where most significant contribution toward thethe patrol area is small and well defined, operational devolopment of the airborne in-the usefulness of daytime patrol is limited. rared detection system. The project now hasThe probability of detecting small fire targets a staff experienced in infrared techniques andas a function of flight pathwidth in four qualified to develop and test a superiorrepresentative timber types is qualitatively syatem.defined, For detection purposes the fourspecies tested are in two classes as follows:(1) "easy" detection class, including larch- PLANS FOR THE FUTUREDouglas-fir, lodgepole pine, and ponderosa Design criteria based on detection criteriapine; and (2) "difficult" detection class, (liscussed in Appendixes III and IV haveEngelinaun spruce. been written for the construction of an in-
Operational feasibility of an infrared fire frared receiver and electronic video systempatrol system ultimately is judged on its to meet the specific requirements of the Firecapability for detection under various mess- Scan research program. This system will
~rable conitons of forert a ., include a seven-channel tape recorder. A
Instrumnentation used to ineasure any inad video recorde of detection exl)eriientsnomenon must have sufficient sensitivity. A will allow signal strengths, backgrouni tWnm-stat(:-of-the-art system is necessary in order porature difference, and background frequencythat the effects of silva and topology on de- characteristics to be examined in the labora.tection can be determined. The scanning tory. These are needed to adequately quan-system now in use is not adequate for this tify the system's capability.purpose. More sophisticated discrirninmtion rhe 1966 flight program will evaluate thistechniques are needed if the low-intensity state-of-the-art scanning qystem. Prior to thesignals from timber-obscured targets at angles test program, the Convair T-29 aircraft willbeyond 50' are to be detected reliably, undergo all IRAN inspection and the Doppler
Comparison of high altitude imagery with system will be inspected and repaired. Ex-aerial photographs appears to give accurate periment design and acquiring adequatedescription of fire location. The Convair instrumentation will be emphasized.
36
APPENDIXPage
I DESCRIPTION OF TEST AREA ........... ............................... 38
II CRITERIA FOR SPECTRAL RESPONSIVITY ......... ...... 42
III SENSITIVITY OF SCANNING SYSTEM...... ................. 44
IV CRITERIA FOR DE1TECTION ................ .................................... 46
V ATTENUATION OF RADIATION ................................................ 50
37

iIfI
APPENDIX I
DESCRIPTION OF TEST AREA young ponderosa pine (Pinus ponderosaDES dRIPTIO NeOF TEST AREA Laws.) sawtimber grows on the northeastern
Lodgepole Pine Test Area .portion of the area. The larch (Larix oc-cidentalis Nutt.) -- Douglas-fir (Pseudotsuga
1. Test area designation and location. - menziesii var. glauca (Beissn.) Franco) timber
The area, within a very dense lodgepole pine type borders the south and east edges of thestmd, is located on the east side of Gold -est area. Density of the lodgepole pine isCreek approximately 6¼ miles north of State fairly uniform throughout. Basal area on theHighway 20. This area is on the Missoula plots ranges from 0 in small openings withinRanger District, Lolo National Forest. Legal the stand to 227 square feet per acre.description is S½SW/4 sec. 6, N½NW¼ sec. 4. Direction of flight paths. -- Flights7, T, 14 N., R. 16 W., PMM. over the area are due north and south; true
2. Elevation and topography.-The area, azimuths, 0' to 1800.situated on a bench with low ridges and 5. Cruise summary. - Number of plotsmi-'nor draws, has an elevation of 4,200 feet in area - 50; acreage of test area - 34.44In.s.l. A marsh is on the east side toward acres (1,000 feet by 1,500 feet); prism basalthe northern extremit', No slopes on the area area factor 20.exceed 20 percent,
3. Timber type and size class. - Timber Ponderosa Pine Test Area
consists of a typical stand of stagnated lodge- 1. Test area designation and location. -
pole pine (Pinus contorta Dougl.). Some The area, within a medium density ponderosa
Table 5. - Cruise information from lodgepole pine test area
Test area
Timber measurements Lodgepole Ponderosa Averagepine pine or total
"Trees per acre ...................... 166 5.2 161.2Net volume per acre (b.f.)' I.......... 8,730 320 9,050Average basa! area per tree (sq. it ) ...... .57 1.02 .795Average d.b.h. (inches), weighted ......... 10 14 10.1Average tree height (feet), weighted ...... 62 53 6!.7Average lower crown limit, both
species in mixed stand'(feet) .......... - 28Average crown thickness (feet),
both species ..................... . .......... 44Cumulative stein density, d.b.h. X trees
in e,:-h diameter class (inches) ...... 2,662Crown cover density (percent) as
estimal-d by aerial photos overtest !ire areas .................................. - -80
'Scribuer log rule teas uwed for all merchantab- vc'lu'nes. Cruise includes all mer-chanrtable trces 8 ;nchcs d.b.Jt. and large,- (by 2-inch classes).
38

pine stand, is located on a bench south of aspect) where it becomes intermingled withthe Big Blackfoot River, approximately 1 mile Douglas-fir. As the slope with a northwest of State Highway 20. The NE¼ sec. aspect increases in gradient to 30 percent,35, T. 14 N., R. 15 W., PMM, encompasses the pine decreases to scattered clumps in athe area. This area is on the Lubrechl Ex. predominantly Douglas-fir stand. Basal areaperimental Forest, University of Monta. for plots ranged from 0 to 190 square feet
2. Elevation and topography. - Eleva- per acre; the less dense plots were on the2. Eevaionandtoporapy. Elva- north side of the area. Average basal areation of the area is 3,650 feet m.s.l. Terrainis slightly rolling, with no slopes more than for the overall test area was 73 square feet
10 percent. per acre.
4. Direction of flight paths. - Flight3. Timber type and size class. - rTimber due east and west; trueon the area is a stand of residual ponderosa 900 and 270w.
pine. Patches of stagnated pole stands are
scattered throughout the area. Average 5. Cruise summary. - Number of plotsheight of dominant and codominant trees in in test area - 70; acreage within areathe area of young, thrifty, mature timber is 34.44 acres; prism basal area factor - 10.58 feet, while in the areas of reproductionthe average height is 12 feet, consisting ofabout 80-percent total crown. Density of the Larch - Douglas-Fr Test Areaponderosa pine increases toward the south 1. Test area designation and location. -side of the test area (slope with a north The area, located within a medium density
Table 6. - Cruise information from ponderosa pine test area
lest area
Timber measurements Pokidecoso Larch - Averagepine Douglas-fir or total
T rees per acre .......................................... 67 0.1 67.1Net volume per acre (b.f.) .................. 5,316 13 5,330Average basal area per tree (sq. ft.) ...... 1.14 1.06 1.13Average d.b.h. (inches), weighted ....... 14.5 14 14.5Average tree height (feet), weighted .... 58 60 58.1Average lower crown limit, both
species in mixed stand (feet) .......-- 18Average crown thickness (feet),
both Sp•,t ies _...... .......................... - - 40Cumulati-. n density, all plots
(inches)•..................... 6,540 82 6,622Apparent crown cover density (percent)
from aerial photos over test fire areas - - 60
'Scribner log rule was used for all merchantable volumes, Cruise includes all me'-chantable trees 8 inches d.b.h. and larger (by 2-inch classes).
39

! I
larch-Douglas-fir stand, is approximately and almost 100-percent total crown height.1¼ miles east of State Highway 31, and I%. Density of the timber (steins per acre) ismiles north of Pierce Lake. This area is on uniform over the entire area, varying onlythe Condon Ranger District, Flathead Na- in species composition. Basal area for thetional Forest. An approximate legal descrip- 50 plots ranged from 20 square feet to 260tion is: NEV4 or SW¼ sec. 10, T. 19 N., square feet; average overall basal area wasR. 16 W., PMM. 149 square feet per acre.
2. Elevation and topography. - Eleva- 4. Direction of flight paths. - Flighttion of the area is 4,500 feet m.s.l. Terrain paths run north and south; true azimuths,is moderately rolling slopes. 0' and 1800.
3. Timber type and size class. - Timber 5. Cruise summway. - Number of plotson the area is old-growth Douglas-fir and on test area - 50; acreage of timber withinlarch. The sparse reproduction is predomi- area - 34.44 acres; prism basal area factornantly Douglas-fir, an average of 40 feet high - 20.
Table 7. - Cruise information from the larch - Douglas-fir test area
Test area
Timber measurements Douglas- Lodgepole Engelmann Averap-fir pine spruce - Larch or total
alpine fir
Trees per acre .............. 71.1 14.9 11.0 23.8 120.8Net volume per acre
(b.f.)' .................................. 8,168 1,316 1,800 5,639 16,923Average basal area per
tree (sq. ft.) ............ 1.20 .69 1.25 1.73 1.21Average d.b.h. (inches),
weighted .............................. 15 11 15 17 14.9
Average tree height (feet),weighted .......................... ?5 77 80 97 82
Average lower crown limit,all species in mixedstand (feet) ........................ - - - - 35
Average crown thickness(feet), all species .............- - - - 47
Cumulative stem density,all plots (inches) ................ 2,656 238 450 1,536 2,224
Apparent crown coverdensity (percent) fromaerial photos overtest areas ............................ - 80
1,5cribner log rule was used [or all ,ngrchantable volumes. Cruise includes all mner-chantable trees 8 inches d.b.h. and larger (by 2-inch classes).
40
1!
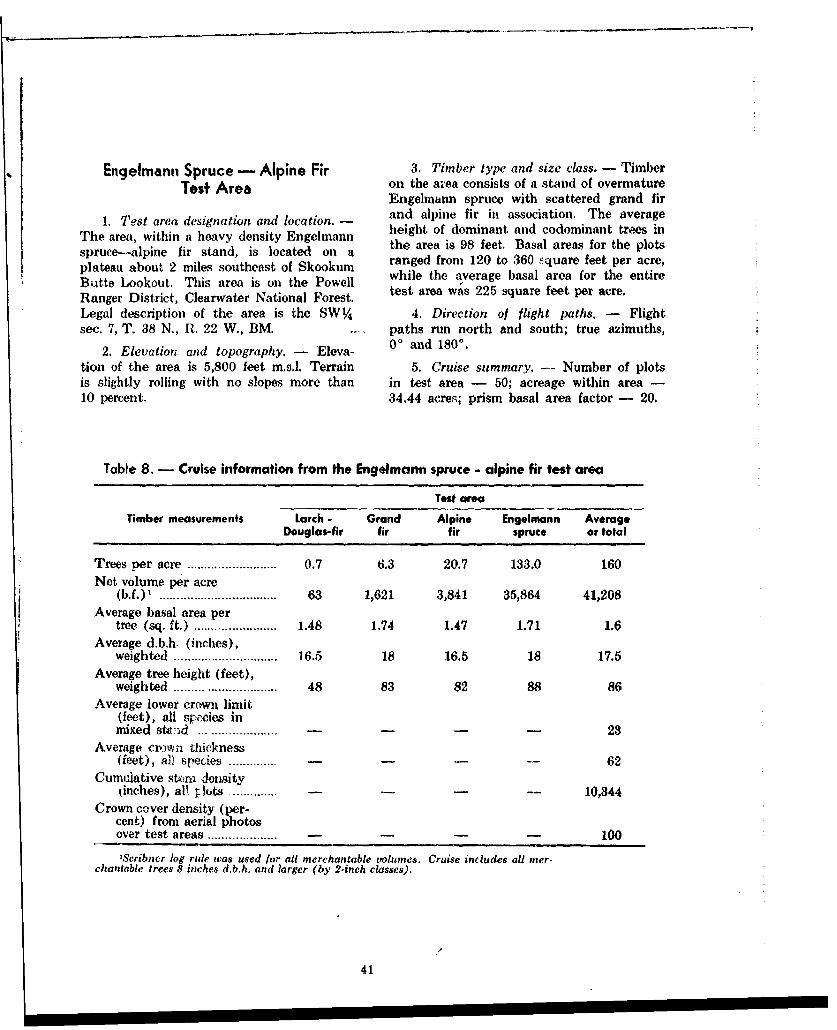
Engelmann Spruce - Alpine Fir 3. Timber type and size class. - TimberTest Area on the amea consists of a stand of overmature
Engelmunn spruce with scattered grand fir
1. Test area designation and location. - and alpine fir in association. The averageThe area, within a hoavy density Engelmann height of dominant and codominant trees inspruce--alpine fir stand, is located on a the area is 98 feet. Basal areas for the plotsplateau about 2 miles southeast of Skookun ranged from 120 to 360 s.quare feet per acre,platteau L out. 2Ties southeaist of thePowl while the average basal area for the entireButte Lookout. This area is on the Powell tetae Its25sqaefe e ceRanger District, Clearwater National Forest. test area was 225 square feet per acre.
Legal description of the area is the SW¼ 4. Direction of flight paths. - Flightsec. 7, T. 38 N., R. 22 W., BM.... paths run north and south; true azimuths,
2. Elevation and topography. - Eleva- 00 and 1800.tion of the area is 5,800 feet m.s.l. Terrain 5. Cruise summary. -- Number of plotsis slightly rolling with no slopes more than in test area - 50; acreage within area -10 percent. 34.44 acres; prisn basal area factor - 20.
Table 8. - Cruise information from the Engelmann spruce - alpine fir test area
Test area
Timber measurements Larch - Grand Alpine Engelmann AverageDouglas-fir fir fir spruce or total
Trees per acre ............... 0.7 6.3 20.7 133.0 160Net volume per acre
(b.f.). .................................. 63 1,621 3,841 35,864 41,208Average basal area per
tree (sq. ft.) ........................ 1.48 1.74 1.47 1.71 1.6Average d.b.h. (inches),
weighted .............................. 16.5 18 16.5 18 17.5Average tree height (feet),
weighted ................. 48 83 82 88 86Average lower crown limit
(feet), all species inmixed stand ....................... - 23
Average crown thiickness(feet), all species ......... . 62
Cumviative stim jernsitVtinches), al! iots ............. 10,344
Crown cover density (per-cent) from aerial photosover test areas .................... - 100
'Scribnc-r log rule was used for all merchantable volumes. Cruise includes all mer-chantable trees 8 inches d.b.h. and larger (by 2-inch classes).
4
41

APPENDIX II
CRITERIA FOR To facilitate system design, first the opti-SPECTRAL RESPONSIVITY mum spectral wavelength region is selected,
and it in turn is dependent on the nature.Since the advent of solid state semicon- of the phenomenon to be observed.
ductor technology, new devices have beendeveloped that provide capabilities for meas- Fire surveillance requires not only thaturement, at high speed and low intensity burning fuels be detected, but also that theirleveis, of the low energy electromagnetic radi- location relative to observable terrain back-ation associated with infrared (IR) wave- ground features be determined. Small spotlengths, fires are most easily detected in the spectral
region where the fires are most intense (2 toA review of typical sources of radiation 7 microns, fig. 34). Similarly, terrain back-
and infrared detector responsivities is neces- ground detail is best acquired near the peaksary to establish criteria for system design of the ambient black body curve (5 to 20-pertinent to-our special applications. milcrons).12 Very little information is avail-
able concerning the reflectance of solar radia-Of immediate interest to the Forest Serv- tion from terrain in the intermediate and far
ice is the application of techniques of infrared infrared regions. The solar spectral irradianceremote sensing to forest fire surveillance, for zero atmospheric absorption (fig. 34) canHere three possible sources of infrared radia- be used as an upper bound for the expectedtion exist - the radiant emission of the fire interference from sunlight. Both terrain re-itself, the emission from terrain background, flectance and atmospheric absorption attenu-and the interference of illumination from ate the reflected sunlight intensity. A spectralsources such as the sun. wavelength region should be selected as far
T'he spectral radiant emission of real world from the solar irradiance peak as practicable;emitters ismetrasuredabydianteiss ion frelord in this application, this must be to the longer
emitters is measured by their deviation fromsinificnt, thea theoretically defined ideal black body ra- wventh b ide. Also very an the
diaton ourc. Te enissve pwer at spectral bandpass must overlap an atmospher-diation source. The emissive powers at i tassiowndwic transmission window.several black body source temperatures are
shown in figure 34. Glowing, burning fuels In general, the following qualitative de-associated with applications in forest fire ductions can be made:surveillance closely approximate the ideal 1. Thermal emissive temperatures of ter-black body radiation curves. In the 3- to rain background can best be measured in the6-micron region, typical terrain background 8- to 14-micron atmospheric window; however,emitters may iall 15- to 20-percent below significant information can be acquired in thethe theoretical curves, but generally stay 3- to 4.2-micron and 4.5- to 5.3-micronwithin 90 percent of the emission exrected windows.*ron a true black body.") Also shown is the 2. Glowing fuel beds can be detected best
spectral irradiance of the sun"' and rough against a terrain background in the 2- to 2.6-indications of the transparent atmospheric micron, 3- to 4.2-micron, and 4.5- to 5.3-windows. micron windows.
Fredrickson. W. R.. N. Ginsburg, and R. Paul- 3. For daytime fire detection, the 2- toson Infrared spectral emissivity of terrain. Final 2.6-micron bend, and possibly the lower partRep. Syracuse Univ. Res. Inst., ASTIA Doe. No.AD 155552, WADC - TR - 58 - 2229. 153 pp., 2 U.S. rillus. 1958. 4ir Force Cambridge Res. Lab. (Max
Nagel. ed.), Background measurements during theSU.S. Air Force. Handbooth of geophysics. Rev. infrared measuring program. 1956- Geophysics lRes.
e:d. New York: Malcillnn. 656 pp., illus. 196!. Dir.. ORD Res. Note 46, A"CRIL - TN - 60 - 692.
42
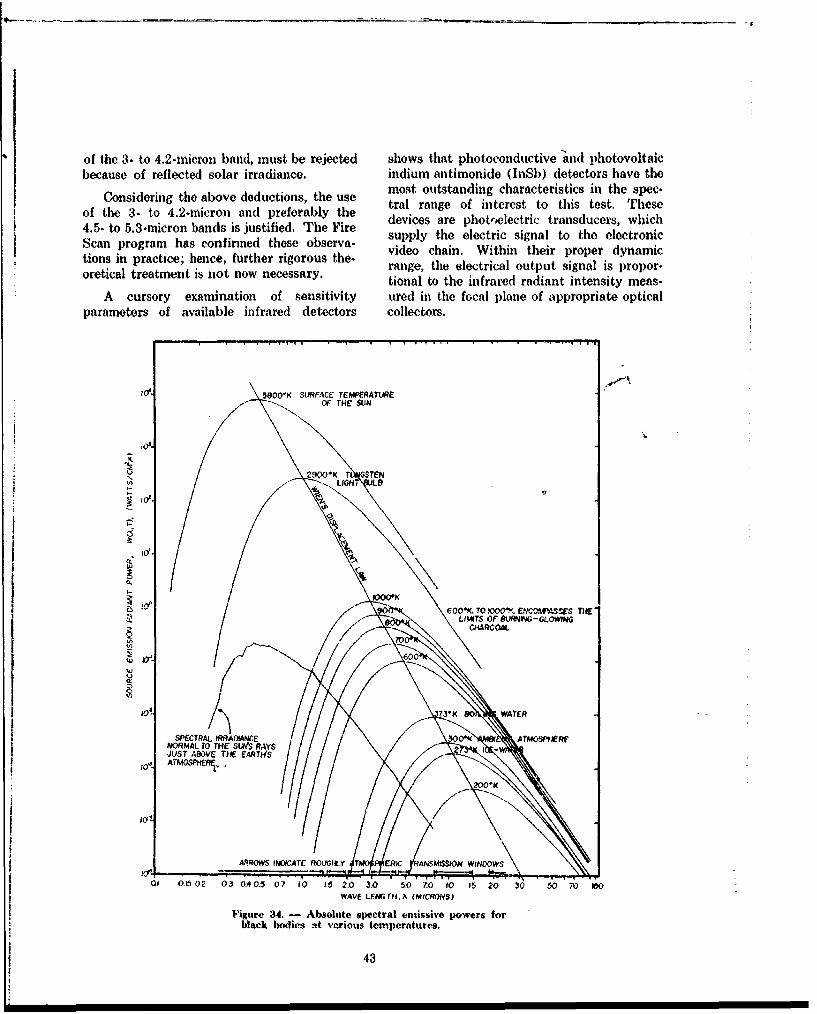
of the 3- to 4.2-micron band, must be rejected shows that photoconductive and photovoltaicbecause of reflected solar irradiance. indium antimonide (InSb) detectors have the
Considering the above deductions, the use~ most outstanding characteristics in the spec-:,of s the 3bo-e to ,euon sdpreferably the u tral range of interest to this test. These
of the 3- to 4.2-micron and preferably thie devices are pt,, e.hoelectric transducers, which4.5- to 5.3-micron bands is justified. Thle Fire supp"lvy the electric signal, toteeetoi
Scan program has confirmed these observa- video chain. Within their proper deytrnamic
tions in practice; hence, further rigorous the- r ch e W ithin tpeir pro pr opor-range, the electrical output signal is propor-oretical treatment is not now necessary. tional to the infrared radiant intensity meas-
A cursory examination of sensitivity ured in the focal plane of appropriate opticalparameters of available infrared detectors collectors.
5000K SURFACE TEMPERATURE
"OF THE SUN
2900*K T STENLIGH Le
at
10
z• L)M'r$ OF )LWONG-G,.MOWSNG
Fiue3.-A-oueseta \msiepwr o10 73K9 AE
NORALTOTH SWS RNIAYS 2OU 1
al 0.15 02 03 0.4 0.5 07 10 1.5 2.0 3.0 5,0 Z.0 10 15 20 x0 50 1- 16oWAVE LENGrT,A, (MICRMS)
Figure 34. -- Absolute spectral entissive powers forblack bodies --it verious temperatures.
43
H

APPENDIX III
SENSITIVITY OF cm.'Ideg"1, and T is the absolute temperature
SCANNING SYSTEM in degrees Kelvin. Then E becomes,E =--•- '- AoT4.
Remote sensing devices usually collectradiation with modified Newtonian or Cassi- The term for temperature resolution in thegrainian telescopic systems. The detectors limit of small temperature differences:measure the total .adiation falling on themat some point in the optical image plane. aE -- AwEeT'A T.To compare the large number of individualpoints over an extended terrain object plane Solving for AT,and thus provide the relative spatial inior- AEmation, an optical-mechanical scanning mech- ,T - 4AwckT Eqn. 1anism must be provided. This is accomplished The infrared detector detectivities, D*, areby placing a spinning, flat mirror in frontof the collector objective. On an aircraft plat-form, the infrared optical receiver is oriented SNEso that the spinning mirror looks down and "- 2
scans abeam of the aircraft from one side to where S/N is the signal to noise voltage ratiothe other. The velocity of the aircraft allows measured foi a specific detector irradiated byTV-like scanning of the two-dimensional ob. power, J; a is the detector area; and AI is theject plane (see fig. 35, Appendix IV, scanning electrical frequency bandwidth used in theinstrumentation and geometry). detectivity measurement.
The radiant power, E, reaching the de-tector is the product of the power density, By definition:1 W(x,T), from the source; the solid angle, E = J, when S/N = 1 Eqn. 37r
.,, subtended by the source from the rce-iver; Combining equations 1, 2, and 3 now re-and the area, A, of the optical collector ob- defines AT as the noise equivalent temperaturejective: (NET):1
E= - W(,,T) - A., w -Ir NET =- ,.AT = 4D*A ,.,k, Tl Eqn. 4This equation is further refined by examining
For easy calculation, the Stephan-Boltzman \/aA- in terms of system parameters.equation is used to estimate W(,\,T) for ,total The area of the detector, a, defines theoutput power of the source. Then, the power, field of view or resolution element from op-E, is modified by some constant, k, which is tical principles as:the frction of the total power that is includedby the system spectral sensitivity. Calcula. ation of k is made by numerical integration where F is the focal length of the objective,over empirical measurements of the system which has area A.spectral response (fig. 39, Appendix V).
Further, a( is the rate at which the ter-The Stephan-Boltzman law states: rain field is covered, divided by the optical
W= •T4 resolution element:
Where t is the emissivity of the source, a, is 2•- V/H (steradians/scc.)the constant of proportionality, a=5.67 watts - ,, steradians
44
Then equation 4 becomes: source accepted by system, for par-
71:1 V 1/2 ameters of figure 39, Appendix V;NF( -k = 0.071 when atmospheric spec-
NEI' 8 TI) tral windows are accounted for.D*k etP
where: = Stephan-Boltzman constant, 5.67 XF = focal length of collection optics. 10'11 watts cm.'Ideg.-4.
V/H = velocity to height (altitude) ratio, T = ;-. "kground average temperature,to be specified by performance re-quirements (V/H of .2 or .4 stera-
A = afea of optical collector objective.dian/sec, is typical).
D* = broad band detectivity of detector; optical system resolution, steradi-
typically, 2 X 10¹⁰ watts'lcm.sec."/. ans.
c(x ---spectral emissivity of background. Typical NET's are of the order of 10K. to2°K. for ambient terrain background with sys-
4 - percent total spectral power of the tems using the 3- to 6-micron spectral range.
45

APPENDIX IVCRITERIA FOR DETECTION RM() Responsivity of scanning sys-
tom (volts/watt, i.e., watts in-The electrical signal (video) proceesing cident on unit square aperture
chain in infrared line scanners generally is of scanner).not d.c. coupled. Hence, an absolute radio-
metric background intensity reference level is 8 Scanner output signal (volts).not maintained. However, the background a Area of scanner aperture.radiation intensity does fluctuate about somelocal mean value. This mean intensity level The signal from the system is related toshifts relative to the clamped output d.c. source radiation by:signal level over large terrain distances, but S(T) = awfj'-RC(O) N(A,T)dA.does not significantly change over small dis- Since R(x) is not an analytic function, thistances, A system's response to these gross calculation is made by numerical methods,changes is fixed by its scanning speed andlow frequency cutoff. For the remainder of e.g.:
this section we shall assume the video sys- S(T4 ) -- v a',R(,\) N(,k,Tj) axi.tern has sufficiently wide bandwidth to estab.lish a short-term d.c. signal level associated Consider a target much smaller than the
with the local mean background radiant instantaneous field of view with no obstructionintensity, or attentuation in the optical path. Figure 36is a typical scanner video output signal. S,, is
This kind of equipment is sufficiently the clamped d.c. signal bias. Define S, and S,sensitive to map terrain background. Accu- as signal levels from the coldest and warmestrate detection of hot targets against a terrain (T, and T,) spots, respectively, in the neigh-background depends upon radiornetric criteria. borhood of the momentary field of view and
S., as the signal from a particuiar field thatDefine tl.following terms: contains a hot target to be detected. Let
T,, T,, T., T, Temperatures ('K.) of.!.cl (S-.c..., be the dynamic signal that is pro-m e a n backgrounld,- coolest portional to the variation of radiant intensitypoint and warmest point in about the local mean radiant intensity,background, and hot target, .[N(A,T) - N(A,T.)] iA.
respectively, Unless complex signal discrimination isuused, in order for a small target to be "de-
= - Instantaneous field of view tectable" the signal from the spot, ,o, con.A Area of target. taining the target must be greater by some
factor, K, than the signal from the wannestspot in the background. From figure 36 this
signal ratio (explicitly defined lcomes:below).
N(A,T) Spectral radiance (watts/ster- S-,>K(S.S0 ). Eqn. ,adian cm.2 micron). For targetq much smaller than (, the worst
pcase, as shown in figure 36, occurs when the(X, T) Spectralradiantemiro n c target is situated in the coolest spot in theW (0,T) (watts/cm.' micron). background.
L Aspect angle (see fig. 35). S., then becomes:
r Slant range. S. , fa R(x) A Cos 0
h Altitude. A.0 +A ,D Tot~al scan width. G, - -A ) N(xT, 4.
46

• ~FLIGHT PATH
Figure 35. - Aircraft scanning geometry.
$3
ARBITRARLY ESTAB-
o -_"77 -LISHED d.c. LEVEL
SCAN SWEEPOOCTIME
Figure 36. - Typical video signal owillolcq, (ra(*.
47

IIiA
Since 'T' varies with i, .9 is deternined by: A note should be made here nbout inst~ru-niontation. The system readout has been
S' = a• ýJ'IR(A) JN(,\0,) dOdA. assumed to be a signal display (fig. 36) pro-, 0,.--0, x~o 0, sented by a C.R.T. Large or very intense
where 0, and 0. are defined such that: target sources give adequate signatures fordetection. The marginal sources are the ones
I, do. of concern and are usually much smaller thanf d 7 the instantaneous field,
where t is low frequency limit of system band. Electronic detection by pulse-height dis.pass, and A is the scanning speed. To be criminatiou (P.HILD.) is much more precise
(itmore precise, S0 is determined by the preset than visual interpretation. The upper tracesystem d.c. bias, This calculation determines of figure 37 shows the capability of a I-ypicalthe associated T,, or S(T?) in the neighbor- larrow-band, piulse-height discriminator tohood of 0o < u < a- distinguish a low amplitude "spike" target
"hdofsignal from large variations in the backgroundDefine S, as the signal from target alone intensity as is shown in the lower trace of
and assume the same figure. Since the small targets are
S>A/r> . the major problem, we suppose that tieP.I.D. should he narrow banded about the
Then: field sampling frequency, f, such that:
S,= S + S,. 1 dO
Criteria for detection then becomes: • dt
Sr Ž_ K(S2-S,) + (S,.+S,) Eqn. 6 With the narrow-band provision, the lowerlimit on S7 could be decreased since the ter-
S,,, by definition, is the mean signal level, ap-proximately one-half way between S, and S,1(fig. 36).Hence:
S" ~ ~ : - .0 Q2
Thus, we can define a new K' greater than 1such that Eqn. 6 becoines:
2.97. K'22
or
S 7 > (KI .S. Eqn. 7
Sr =a R •,)A Cos C-S'.a R60 ýr-" N(,\,T,) > (K'+I)
a I? (,k)-y- . [N(,k,T.) - N(,,T,)]2
A Cos 0 N(0,T:) T) K'+1)r K' ) 2-[N(A,TP2) - N(x,TI,).I
A _ ' I .,N (F\,ig.urq(,\,p)\ i ure 37 Pi' lis-lhcight dt'.(rinfill ion ehietait sep-______ 8 atatfllg lowv tuipli~tde. highm frequ4'Iiey 9ignol froni
r- Cos [I A N (A,•, l background.
4

rain background features are generally mich Then Eqn. 8 reduces to:larger than tile instantaneous field, 6. Do- A AWtection of smaller values of Sr would, however, /-V-z 10",.33 (wAtt! 2x 3 X 10" AMWinvolve a significant inIcrease in the false alarm" w• /7 Eqn 9rate. If a certain false alarm rate is not ob- Figure 38 shows a plot of A/h2 againstjectionable, the absolute lower limit of Sr AT = T.-T, for background temperaturpsis determined'by the system noise level, t.. (T1 and 7..T) around 300' K. ambient. It as-
sumes (1) the dotection criteria of equation 7;S2. > I, (2) that. optical transmission losses do not
and bury any signals in the system noise; and (3)there is no target obscuration and you are
a A CosO N(,\,T,) ýix looking straight down into the butket.2• 2; NET.
Note it is meaningless to talk in tenns of K The angular dependence of A/h9 ,in this narrow-band limit since S,,, 5,, S2, etc., Ai 1are not established. (i.e., -•- o - ,here r h/Cos 0)
Referring again to Eqn. 8: is a consequence of inverse square law and
A> (W'+ 1) IN(,,T.)- N(x,T,)•Eý the 1.mbertian angular dependence on tArget> Cos A N -,' )Eqn. 8 radiant intensity. It is assumed here that the
Cs 2major terrain features are larger than theLet us absume that with appropriate instru- instantaneous field of view; hence, the terrainmentation (P.H.D., etc.) we can reliably lot background signal is not attenuated by eitherK' = 1. Also, let 0 = 0, T, = 800'K., w0 = of these features by the same factor as the10" steradians, and assume spectral band- small fire targets. When the target becomeswidth of 4.5 microns to 5.5 microns. Note larger than the instantaneous field of view,that It = r Cos 0, W ( x, T) = ,-N(,T), and the angular dependence of detection criteria
-iW (W(x,Tz.) - W(A,T,) ). disappears and A/h' is independent of u.
i 500"0K 6OO*K
TARGET
T0APERATURE
3-
tt
hgure 38--Lower iitj 'dIue0of (ta'rget iorenm)/(arci altihud,,) 2 4ratio as function of peak.to.jimmk aSifPk tctihind tenulmrartvre v.,ri.ion3 Wfor se'rnid iarget t|emptteratkrMs. 0uASSuMiIhg tiCction criteria -i /
1 2 3 5 5 O 2 0 ?V to o• of Et=.t. 7 ill t~i| (ext. /--- ,_____4 ._ _ AT. ,.-i 8~ACKOR•OQNO ,aT (Kg)
i4

APPENDIX V
ATTENUATION OF RADIATION 2. A four-surface system:
The radiation that reaches an airborne 1',, = (.92)' = .716
infrared scanner from a small incipient spot The sensitivity of the infrared receiver isfire must traverse several attenuating media also governed by the spectral response of thebefore it reaches the infrared detector. These detector and the spectral bandpass of themedia are of three basic types: (1) The optical filter, if one is used. These are notgcometric obscuration by tree boles, timber conducive to analytic representation and,canopy, understory, and brush; (2) the at- hence, must be handled by graphic or nuieri-mospheric path consisting of molecular ab- cal integration. Typical detector and filtersorption mainly by H-1,O and CO,. and scat- spectral curves are shown in figure 39.tering by haze (smog, fog, smoke): and (3)the transmission character of the infrared Atmospheric absorption is a major con-receiver optics. The latter two media are cern in fire detection. The scattering effectsspectrally dependent; we are discussing them are easily described. Smog and smoke parti-in reverse order. cles associated with forest fires are much
smaller than the Rayleigh limit for 3-micron
Infrared Receiver Transmission radiation; so they are negligible in the pres-ent application. Indeed, very good terrain
The scanning mode is most easily accom- imagery has been obtained through smokeplished by a rotating 45" mirror (high speed, palls 2,000 feet deep. However, water con-nodding optical systems have prohibitive iner- densate associated with clouds and fog renderstia). them totally opaque. Therefore, we may con-
The objective elemen. also should be a sider the "scattering" transmission either:mirror. Mirror objectives have only one opti-cal surface to figure, have adequate resolu- •1 (smoke, smog)tion over small fields, and have no chromatic TS,.a. = 6' .
aberrations. However, these mirror objertives (9, (fg, cos).usually require at least one secondary fold-ing mirror. Infrared lenses in general have Transmission of .he Atmospheregood resolution over a larger field, but have The problem of molecular absorption isvery high reflection and transmission losses. more complex. The spectral region of interestCorrection of chromatic aberration requires at (3- to 6-micron) contains significant 11,0 andleast two elements; this requires the figuring CO. absorption bnands. Figure 40"i showsof at least four optical surfaces. The rela-tively large apertures required make lenses typical atmosphere transmission. Figures 41
both economically and technically prohibitive and 42 (1I.S. Air Force)" show, respectively,for the present application, 1-10 and CO. trans:.,issions. Since HjO and
CO,, concentrations vary independently in the
Mirrors are not perfect reflectors. A typ- rea! world, they are handled anal-tically byical aluminized mirror has a reflectivity, R = separate absorption coefficients. CO. con-.92 at 4 microns; silver and gold have highel centration is sufficiently stable in time thatreflectivities but are not as durable as an we consider only its variation with altitudealuminized mirror. Hence, we can consider the (fig. 43). -h1O concentrations can be ineas-optical transmission, T,,,, of an aluminizedmirror colle,;ting system as:
1 Yctes. U1. W. and J. /L. Taylor. Infrared trais-1. A three-surface system: mission of the atmosphere. .l.,• Naval Res. Lab.• lpt. 5453. 19U0.
- (.92) -. 78 " U.s. Air Force. O,. cit.
50

00, InSb DETECTORRELATIVE RESPONSE3000 X BACKOROUNDL//
2 FILTER RESPONSE0 6O PERCENT TRANS-UC MISSION
LU> 40-
<1
20/
00 2 3
WAVELENGTH (MICRONS)
Figure 39. - Spectral characteristics of a typical de-tector and filter.
100 . , , * , - , F ' ' - ' , , -
S80 1
Y) 40.-
Fr 4.0 3.5 4 5 a hiIWAI LENGTHZ(MICRONS) 05
curve; 16.25 kin. sea level path, 68.7* F.. 5.3-pertcet relative hunidity, 15.1 cr. H.0 in path.
ured by the relative humidity and dry bulb If we have a linear system:temperatures (fig. 44), and percent transmis- S"sion estimated from figure 45. A cursory look S -= N(X,T) ax N(,\,T) axat figures 44 and 45 proves that major changesin the minimum detectable signal level can Good practice requires calibration for severalbe attributed to realistic variations of rela- source intensities spread over the full dynamictive humidity. range of the system,
Atmospheric transmission, particularlyhigh H, -0 concentration, is obviously one of Timber Canopy Obscurationsthe major parameters of significance to fire From the mountaintop test proceduresdetection probabilities, and its effects should described elsewhere in this report, qualitativeziot be neglected. conclusions were established concerning can-
Whenever possible, the practical procedure opy obscuration factors. These may be sepa-would be to use a known source, NR (A,T) for rated into two types: firqt, the larger obscur-system calibration. ations (almost always large tree boles), wlich
51
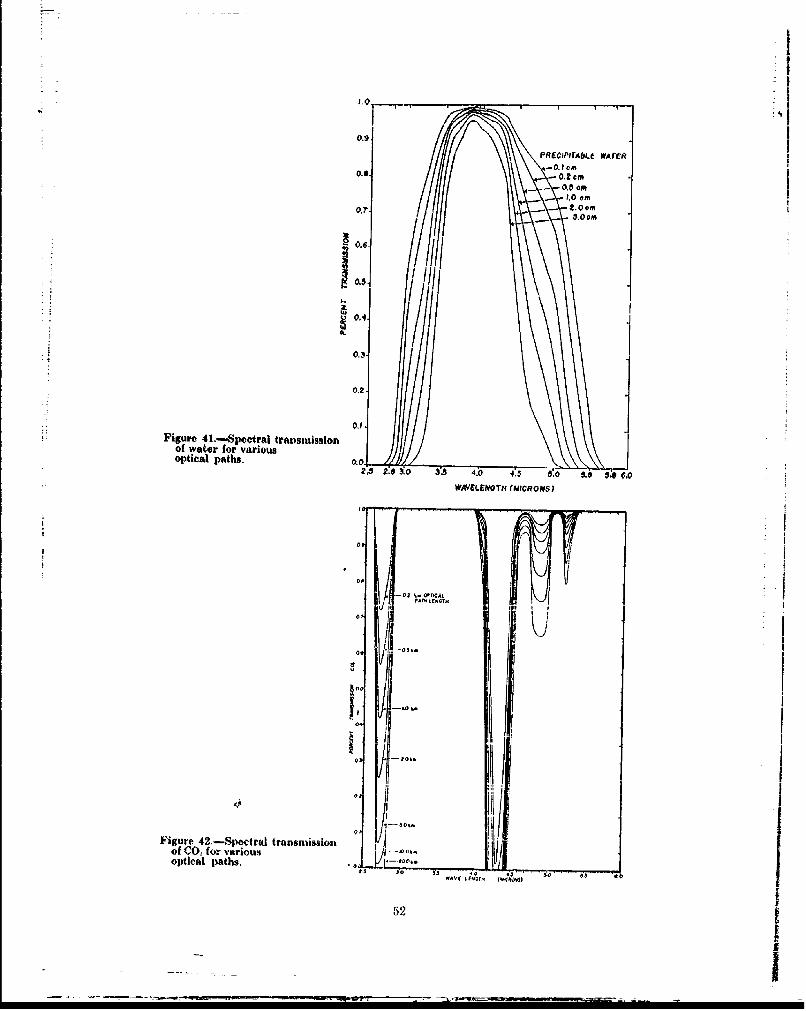
D.0 I.0
0.6-
0.4
0.2
0.6
]Figure 4l.-Spectral tranmmission .of Wa~or for various
optical paths. 0.02.520~ 3.5 4.04:8.F. 5 .
W3A'LLENOTH (WGVOR~ls)
I 0-TICA
0 P 20
03f 1 -301.Il
Figure 42.-Spectral transmission Iof COI for various ~o.optical paths. 00 -0too,'--
52
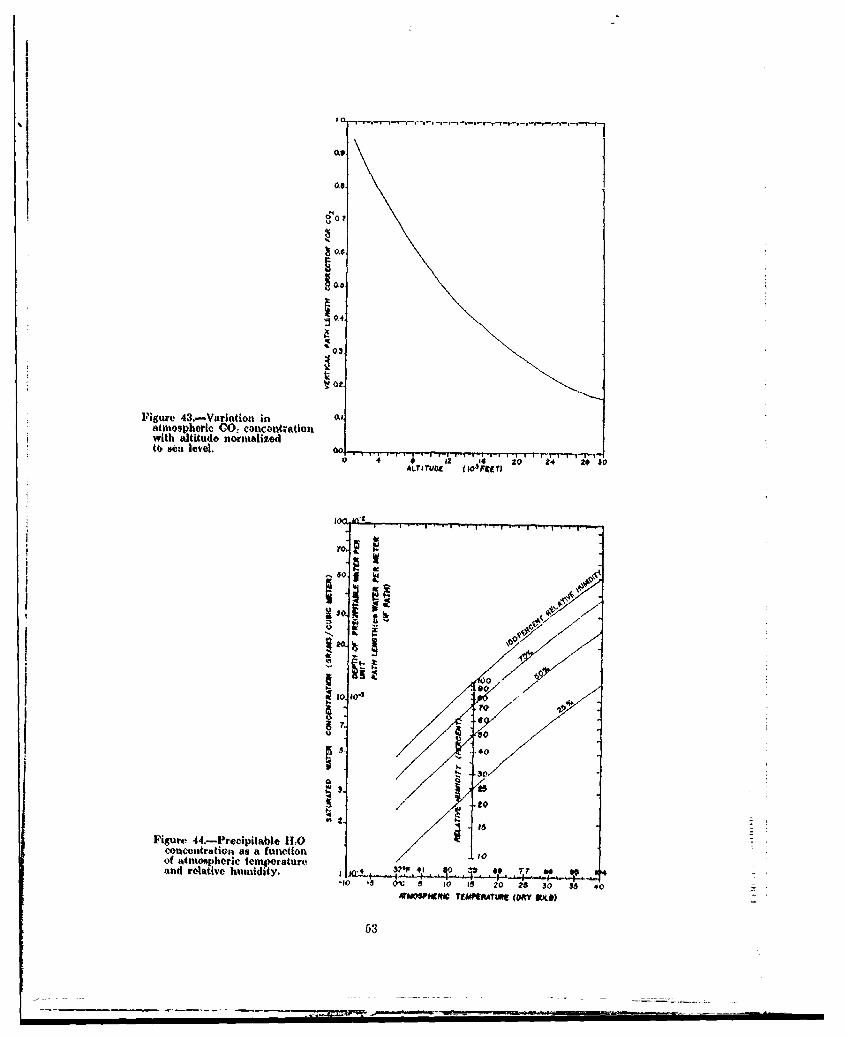
CN roa
0.6
St .
Figure 43,-VarIation in Okatmospheric CO. concentrationwith altitude normalizedto sea level, 0o *,, .I, , T,-,, --
0 4 5 it Id *0 *4 20 30ALThO•C 1t04Fgr T)
100
-toand .0 7
40 4
,.3
_o S
Figure. 44.--Precipitable H.,O ÷ Icowetlliratioea as a fuInct[IIo 1 vof atmospheric temperatureand relative humidity. , ia2•_ .._ t4 .At. 4* . 7. r m .,
-JO .5 Ct 5 iO ISJ 20 25 50 55 4•0
63
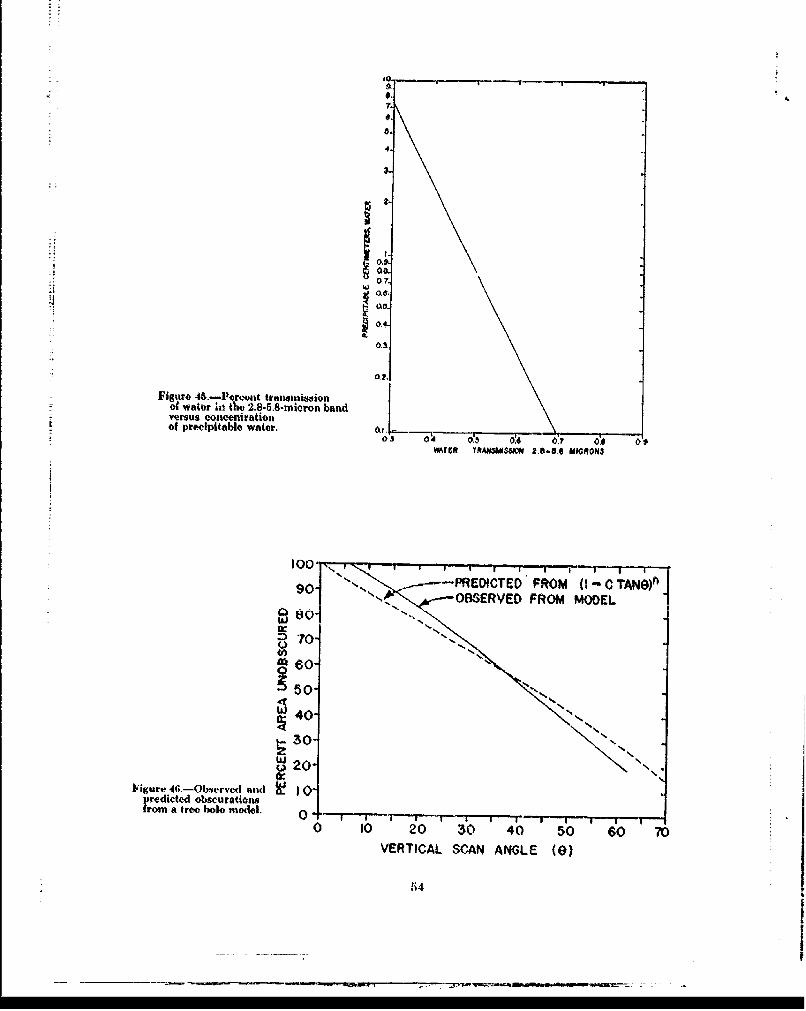
4.
0.
0.
0.3-
0.2.
Figure '4S-lPervoait tnal"is180omiof water in _thu 2.8-5.8-micron band-v-ersus -cn-centratioii
tof preelpit able water, .... .~---.
WaTEft TRAN3S"~ 2.80.0. MIGRONS
'90 PREDICTED FROM (1- C TAN0)ý1Ar-0'D BERVED FROM MODEL90 -cý
~6O
0 2 0 -
F~igure 46.-OIserved anld 3QSrledicted obscurationstona tree bole, modl I-
0 10 20 30 40 5,0 60 70VERTICAL SCAN ANGLE (0)
54

iII
totally obscured the targets; and. secoiid, 0-, A similar effort to rolate obscuratioi. tosaull noedle awl! limb obscurations, win -h timber cruise proinrotors for the canopy over-only partially attenuated the target radiatif n, story is contemplated. Since correr lotin of
A conifer tree bole can be npproximat.d Ihis typo of attenuation with prasont timber
by an inverted paraboloid of revolution whose Measurements is lacking, a test to check anyvertical cross sectional area is two-thirds its theory is unavailable. However, by the naturebvre dicaleter, d times its height ho The pro- and distribution of signal strengths from thebjeedrtedroud tirea itscheight fo Te asprt mountaintop tests, the following theoreticaljected ground area obscured from an aspect ateuio mdlisoteptdfrthangle, 0, is then: attenuation model is contemplated for the
tree crowns:22 Tan 0 0.. = 0. C'1
The percent unobscured area, 0y, for a ran- whore a is related to crown characteristics anddam stand of sueh tree boles b.qeomes: x iS the optical path length, i.e.:
0, = (1- 2/3 dh Tan 0 )n 1h43,500 x - Cos 0
where d and It are rnoasuroments in feet,, andn is the number of trees per' acre. We tested where h = crown depth, f nd 0 -- asqect anglothis bole obscuration by constructing a model as before. Further field neasiemente shouldof a random tree stand and correlating actual provide data for correlation checks on thesemeasurements on the model with the formula proposed relations.prediction; results are plotted in figure 46. The ultimate objective of these considera-The model had equivnlent timbor cruise tions is to pro'vide field niatmagwiiont pursutn-parameters of 328 square feet per acre basal nol with a measure of the usefulness of re-area, (d.b.h.) of 1-ioot and 82.2-foot tree mote sensing equipment in particular forestedheights. areas.
I
|r

totermly obscured the targeig: and, second, the A Ami!nilr effort to relate obscuration tosmall neodli And limb obacurattone, which timber cruttiso parameters for tih arnuopy ovor-only partia&ly attonulated the targot radiation, story is contemplated. Since correlation of
At oat this type of attenuation with present UimberS • A conifer tree bole can be appromdmatodmengaurcmn.nts is lacking, t, test. to cheek any
by an inverted parabaloid of revolution whosei ~~vertical cross tjoational area is two-thiRd9 its thoyi uaibl.owvrbyheauevertcalcros setioal OO~kis wo tird j~ and distribution of signal strengths from tho
base diameter, d times its height It. The pro- ainton t fssi t rengthsoroticjected ground area obscured from an aspect mountaintop tests, thie following thforeticalS~attenuation tmodoi is contemplated for tileangle, 0, is then: tree crowns:
2Adh Tan 0 0. = 0. wa*"
The poreoent uuobscured area, On, for a ran- where S is rulated to crowri characteristics anddom 8tand of such tree bolos becomes: x is the optical path length, i.e.:
On= (10- 2/3 dh'arn0 )n h43,50 x- Cos (A
where d and hi are measurements in feet, and where I = crown depth, and 0 = aspect angle?i is the number of trees 1er anre. We .e9t ahere . F ro th fie d 0 -as pent aholdthis bole obscuration by constructing a model as before. Further field measurements shouldof a random tree stand and correlating actual provide data for correlation chocks on tlhoso
.. measuiements on the model with the formula proposed relations.prediction; results are plotted in figure 46. The ultimate objective of these considera-The model had equivalent fimher cruise tions is to provide field manaloment. paemon.parameters of 328 square feet per acre basal nol with a measure of the usefulness of re-area, (d.b.h.) of 1-foot and 82.2-foot tree mote sensing equipment in particular forestedheights, areas.
i Ii
i
"I-4
3

SJ OCurIly Ciarjfkxii-iton " -
0-0CUJAV•T C.OiHTRO!L DATA, E.D
!.s, reportment'��ft Agricuiture. Forrst Servic•
[ttermOiintain Forest 6 HIange Exp. Sts, i. oNorthern Forest Fire Laboratory, Missoula, Montana
A 1111140hT TOYLE
l'rolvect FIre Seann ("tJr Detection lnterlm Rieport
4 DECMNIPTIv9'"6f9* (Trr of .eovt and Inoluelvs dotW~
Interim Rtoport, April 1962 to December 19645 AUTIIOR(S) (Ltik nfm#. fwiti n@Me. iniltl)
Wilson Rl-iph A,*NOte, Notian V.
S. 1 fT7 DATo 74, TOTAL No. OF' PAo .N.Jlie 196 609126
6a. 4CONTRA•%C On 49RANT o., te." ORInaiATORietc rP-ORT tNMsflt(s)OCO -OS. 0 2 e 174ARPA OR[IRA n16365b. POOJilT Na. GRES-ARCli PAPER INC -20. Ig66
%URK UNIT 2521A
ARPA PROGRAM CODE NO. 5060d.
10. AVAIL AOILITY/LIMITATIC" NOTICIts
DISTRIBUTION OF THIlS DOCUMENT IS UNLtIMITED.
1I1 SUPPLEMIENARY NOTIE- S'UD TIu rILC% 14, I0OQINIHlMILiTARY ACT IVIT" jTilE EVALuATION OF AN AIRBORNqE INFrRAOMAPPER DEPARTIviENT OF T"E ARMYAS A TOOL FOR DETECTING AND MEASURING FIRES." OFF ICE OF THE SECRETARy OF THE ARMY
OFFICE OF CIVIL DIEFENSEI WASH'INGTON o. C, _0.1O
IS. A 1$TR•ACT"• 'The first 3 years of Project Fire Scan's airborne Ilifrorod fire detection
program are reported. The program ob-iect', ib the evaluation of systoms andueGhiiiques for the detection of incipient forest firos. Qualitative correla-
If t%-*, "A I., A .. .. NF, kA '- rle.0 ln4 etimb-r type, and fire target size, Aircraft patrol navigation roquiroientsare briefly exomioed. A capability is demionst~rated for precise observationsof timber canopy obscurations from a fixed, grotifd platlforni. Afiputdixosincilude theoretical discussions of system sp-ctral responlso, scaniner- Sonisi-i. ivity, source backgrounld radiomletric detection criteria, and the sovoralmechanisms of radiation attenuation. •
I
A'°"'4,. 14 7 3 .. ......S•'urfty Claissification
•.-•••.-.-.t-", w - - - A-

A f ___9 -hAoV I
I~ I
aetertLion of Incipient forost firesprobAbIlILY o~f detettionscannler asIiQcL 4111910timber typefire taorjt sizepfttrol ADICavhiloal requirenmefitstimbe'r canopy obscurations
fixed, ground plat form
Scanner Sensitivityradodemtric deteetion critoriamechattisms~ of radiation dittnuutlon
1, ORIG011ATING ACTIVITV; isntot the 'ame nd a01 ddress 10 AVAIL ArILIT Y&LMTATION NOTI'CES3: Itno AA liymbOf~ ~ ~ ~ ~ ~ ~ ~ ~ ~ ~~~Iain on ~lt~~,ubonr4l( iisDasiato ) folthe dlmsectnnatinn of the rePort, Other than khop
tenose etivt'ty or othli& oigalnteetton (coiPotag. AMu10o: Ifisuing1 impgaa by 4#urity clap pinostion, using standard statemre'Matt~lb vtpofl. a unh qw2a. RiKPOcRT URCU1ITY [A981,9PICA'rloN, Vnitof thO over- (1) *-Qtiolfled ,tetiatrs. my ob~t4i to~pie of thleall wparkit clatteificattoo of thii tasort. Indioalt Whether eotfmDM"Rettrictsd V~eto'" Is Included. Muirking is to be in goootI etr Ioo ..
AnceWit appoprate ecuity *41j~t~D16(2) :'Forellpi announcement and disisamluition of this2b. Gith Appopitemai downgradin tmlt~o seilldI M epoft by DDC is not buthorl;.d."
2b.ly 5200.P 10tand~i AmdFowresaIduntrial Marifled Bitte (oD 111] a. G~J overnment Aagenioes thag obtAIA 1119A lam o
mtke ceihave beanu# o rop3ag to.4a auhior tOpkQm shallfrp3throug
ised,
3. REPORT TFI'LU Ilniar the aomtplott report title ini Q11 (4) "U. 9. military agencies may obtain COPIOs Of thiscapiatalletters.6 Titles In all a&*es should be unlmointd. I trt directly fromt DDt. Other quaelified Ufetsr
ljame ningful till# cannlot be 4*lected Without otiketilloa. 1h0ll rerpmelt throughtion, show title claselficallion ick all QMpitale lin pottenthriilaInimedioeley following time till*.4. DESCRIPTIVZ lNOIRS It .pproptia~te, enter the tim0 of (5) "All distnibutionl of this report is contriolld. Qual.report, e.g., intvrim, progress, .urmet~y, annual, or fItlt. 1Usd DD1C users shall request throughGive the inolutmeho dotes when a specific reportiig period tocovered.
S. ATIIO(S~ Kntr th nae(.>of atho(,) ~ I the repmort hasa been furnished to tit* Offica of Technicali.n IRg) p~ the eot etnhame.) o( auhrt t shw On Srvcs Department of Commerce, (or sale to the public, indi-
ct i tit rpor. Etw lst ame fiot mt, nidl* nitul, cats, this fact and enter thie pricat It known.It military, show rank and branch of service. The unom ofthe, prinolpal author to ist-aboolute minimum requirement. IL. SUPPLiIMENTARY NOT";: Use, for additional .icPlane.-
tory Cntomflctt. REPORT ItTF aet 12. i'P C - k MILIIAK ACTIVITY.- Evitvr the inome of~ntl.,~ ~, ~r~Ut.~eat~if liethn on* oiat* appears
othrpOtt, use date of ptibltlctlol. the depaitniental Piojeot *(fice or laboratory sPonsorin PY7&. TOTAL. NOW~EH OlV PAGES! This total page count I~t. l& s~c im sict moueade~should folloiw nminal paglirto pt'ime.L. ne h slTttACT! Enter on atCtract giving a britl and factual
number of pagoe contolinag Infwetihlon. surimiar~y of lite document Indicative of tWe IePott, evejn though76.l4UWE OFREFREC!~Knt te ttalnu*.rof it lijsy also appear elivewitae i i i the body of the tewlmnicel re-c76. UMBR O REFRENR& nlotthototl n~mb of Port. If emldittoriml ofmce is required. a contlniatioton ehte'
fefereliciri cited In ths, report, 4116eu b6e lttoichild.
8.. C04TRACT OR GRANT NUMBER: It app.t fplat#, e'nter It is highly desirable that the AlttCraci of olataified is.the applicabIC numbier of the conttaoit or grant u 17ter witich ports be unclasstfied, Easch Petrepeph of the. abstimct *haltthe report *los written, end wlth. on Indleotion of the military security ehasteficattoii
06, &-, & 8Fi. PROJECT NUMOER SAWe tit& apjpropirIat of the InformaItionl in the paragraPh, representad As 0Ut), (S),Military 'depsrtulelt Idenotlvlatte". such aso project 11-umbar, (C), or (U).sub~project number. syatem numi~bers, task nurlitlir, ottý, Thera te no litmltatiof.n )o til lo~inth of the abstract. flow-
9*. ORIOINATORIS REIPORT NUMTJER(s)t Wtne* the offi. ever, the Suggested length Is from' 150 to 235 words.dcil report number by which the doKcummet will be identified1 t4. KPY Wi2q)S: Koxy wc-.da am- tvmhnhvelly rneoplongfui term#sod -ýontmllad by the originating activity. This number must or shor jmhritao emirac)e.1*4tt' a revort end mey bet lived sobie uniqtue to this report. iniden ontirioo for osttloattng lthe report. Key words moust be
96. OTitR RICORT NUNDRR(8). If the reviort hap been select 4, to that no security ctaosificat tot it required. Idrit.*Ostggnitd say other repott numbersa (either 6), file originastor (leis, such an equipnment tmodel devianitilon, trade name, milt-
o-by Mie, aponeot), aliso ibttr this numbetros). tary project code li~mo. V~tepl oain.myb sdakeV worda* but will 1)0 followed by an Indication of t#ChnicAlContoirt. The eme1gifimen' Of links. Mul66, and weights Itopti nol.