project evaluation for complex systems - mit … · project evaluation for complex systems: ... •...
TRANSCRIPT

Project Evaluation for
Complex Systems:Pure Home Water’s Experience
Establishing a “Successful” Social Business
Susan Murcott – Senior LecturerCivil and Environmental Engineering Dept,
MITGuest Lecture – Project Evaluation (1.011)
April 21, 2010

World Water(Introduces household drinking water treatment system
design to provide safe water to low-income people in developing countries)
http://web.mit.edu/watsan/media_videos.html

There are many Assessment Methodologiesfor evaluating large infrastructure
engineering projects. Here are a few:
• Cost Benefit Analysis• Environmental lmpact
Assessment• Social Impact Assessment • Technology Assessment • Risk Assessment• Life Cycle Analysis• Systems Analysis• Factor 10/Factor X• Ecological Footprint
• Climate Impact Assessment• Public Health Assessment• Environmental Justice
Analysis• Multi-objective/Multi-criteria
Analysis• Expert Opinion (e.g. National
Academy of Science studies)• “Integrated” or Sustainability
Assessment
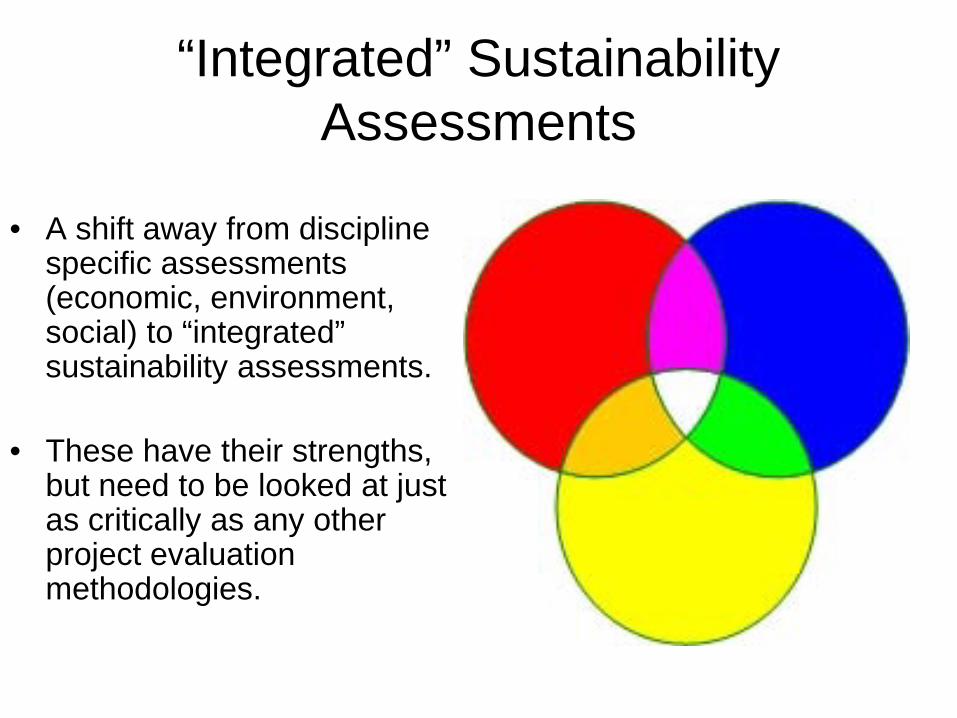
“Integrated” Sustainability Assessments
• A shift away from discipline specific assessments (economic, environment, social) to “integrated” sustainability assessments.
• These have their strengths, but need to be looked at just as critically as any other project evaluation methodologies.

How does one decide which assessment tools to use?Consider the problem of water…

Water scarcity, access & pollution are among the biggest challenges to human & ecosystem well-being in the 21st century
Clean Water for 2 Billion People?By Susan Murcott, Lecturer, MIT
Civil and Environmental Engineering Dept.
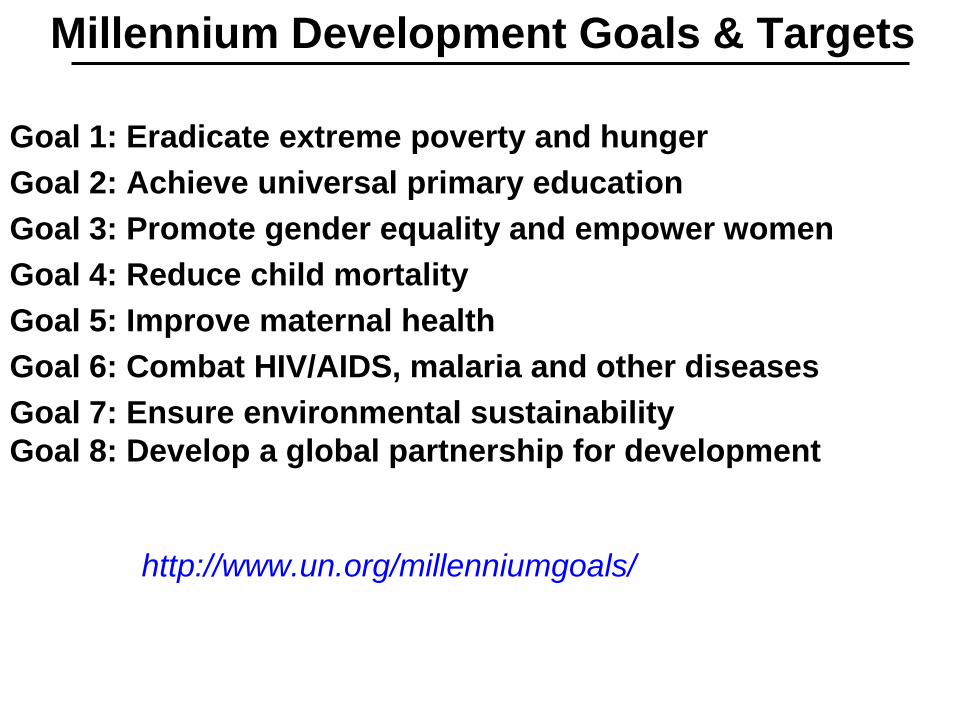
Millennium Development Goals & Targets
Goal 1: Eradicate extreme poverty and hunger Goal 2: Achieve universal primary education Goal 3: Promote gender equality and empower women Goal 4: Reduce child mortality Goal 5: Improve maternal health Goal 6: Combat HIV/AIDS, malaria and other diseases Goal 7: Ensure environmental sustainability Goal 8: Develop a global partnership for development
http://www.un.org/millenniumgoals/
MDG – Goal 7 - Target 3
Halve, by 2015, the proportion of people without sustainable access to safe drinking water.
http://www.un.org/millenniumgoals/environ.shtml
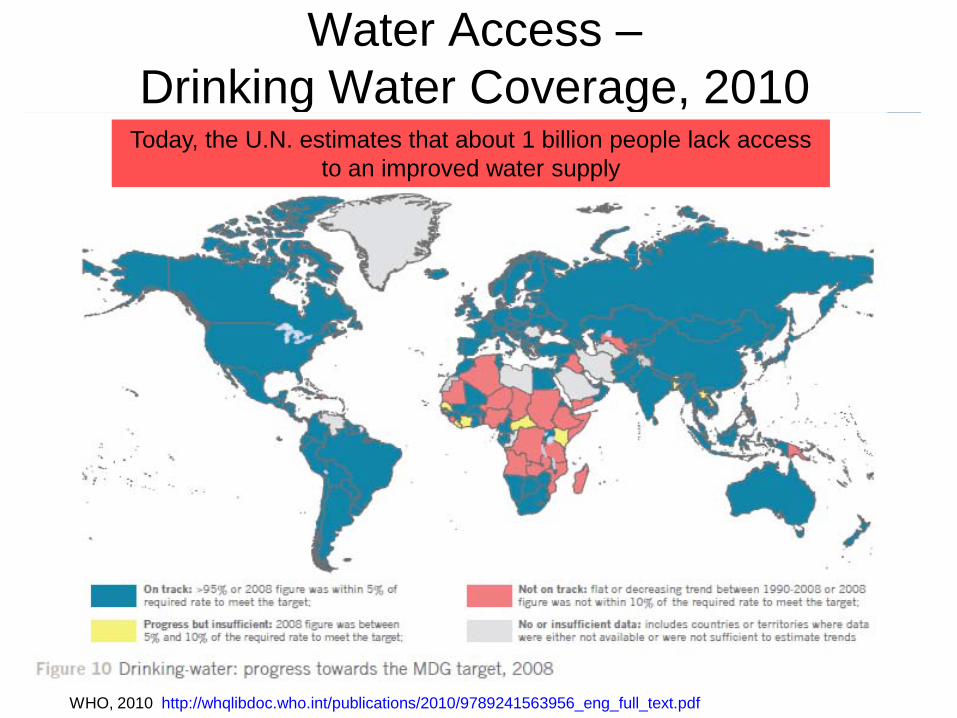
Water Access –Drinking Water Coverage, 2010
WHO, 2010 http://whqlibdoc.who.int/publications/2010/9789241563956_eng_full_text.pdf
Today, the U.N. estimates that about 1 billion people lack access to an improved water supply
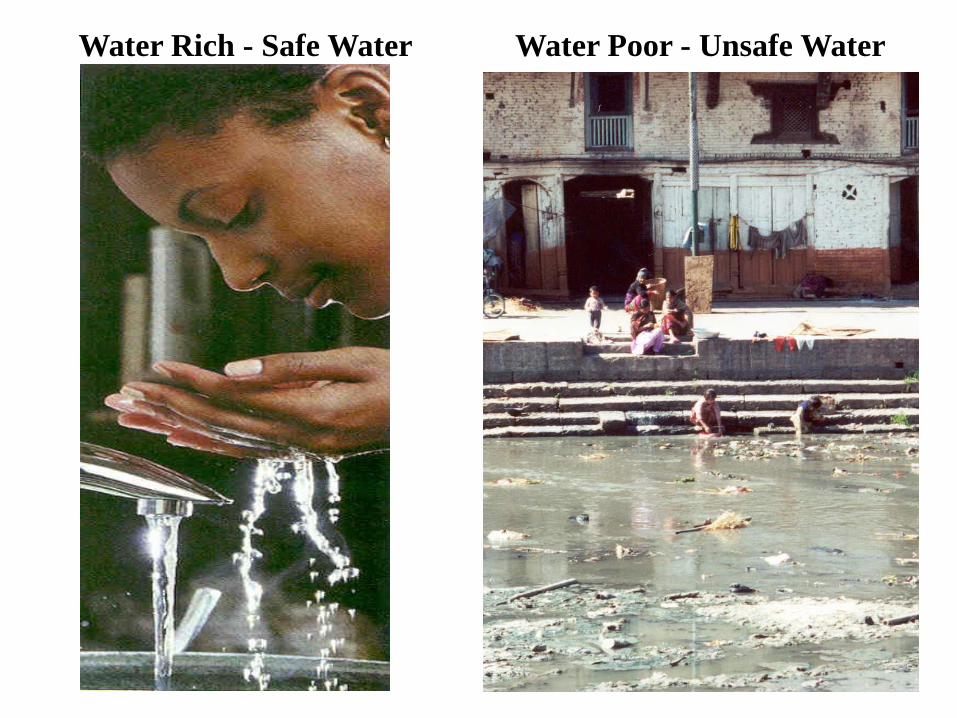
Water Rich - Safe Water Water Poor - Unsafe Water

Watershed Treatment Primary Distribution
System
Community Distribution
Systems
Water Rich WorldPiped Water Supply
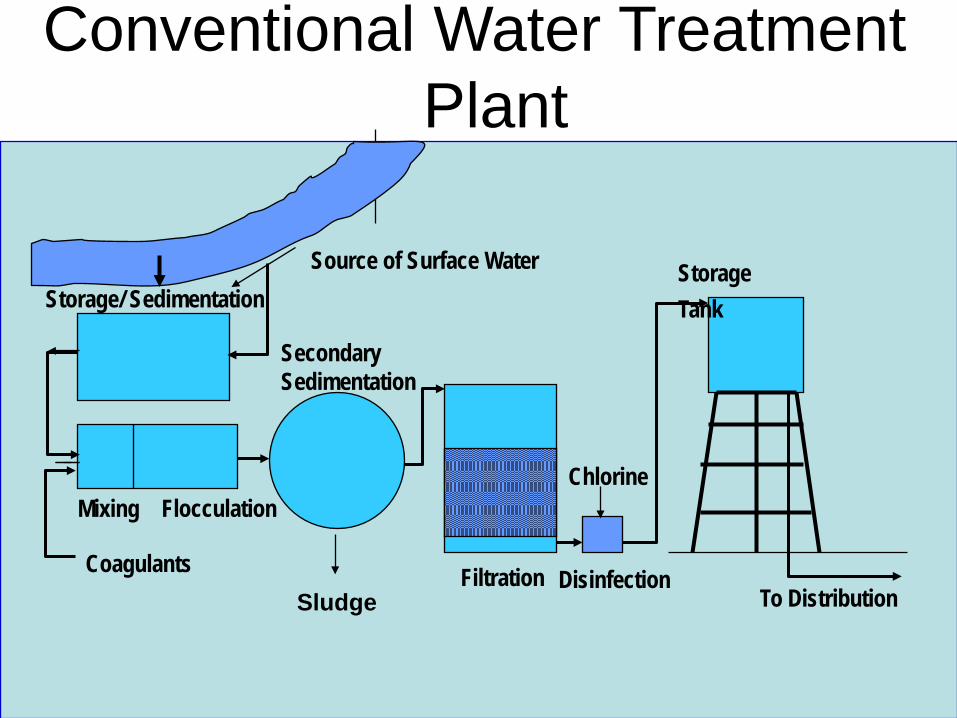
Conventional Water Treatment Plant
Source of Surface WaterStorage/ Sedimentation
Mixing Flocculation
Coagulants
Secondary Sedimentation
Filtration Disinfection
Chlorine
Storage Tank
To DistributionSludge

Watershed Human (and Animal?) Distribution System Home
Water Poor WorldNon-Piped Water Supply
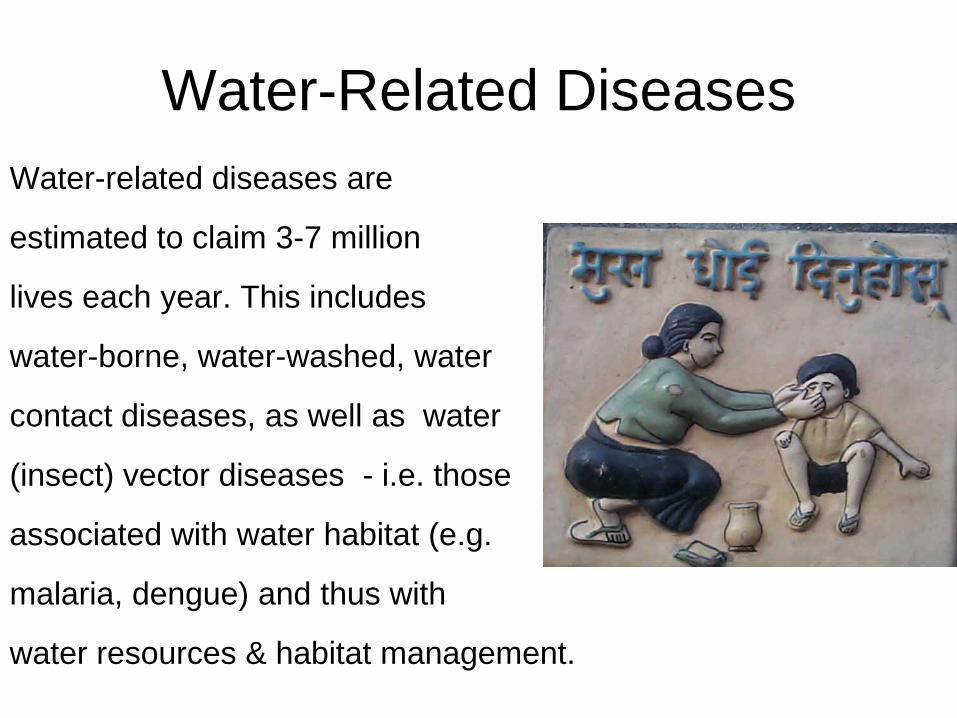
Water-Related DiseasesWater-related diseases are
estimated to claim 3-7 million
lives each year. This includes
water-borne, water-washed, water
contact diseases, as well as water
(insect) vector diseases - i.e. those
associated with water habitat (e.g.
malaria, dengue) and thus with
water resources & habitat management.( WHO, 2004)

Leading Causes of Death Worldwidefrom Infectious Diseases - 2002
Lower RespiratoryInfections
HIV/AIDS DiarrhoealDiseases
Tuberculosis Malaria Measles
Over age 5
Under age 5
Dea
ths
in m
illio
ns
Source: WHO 2004
0.0
0.5
1.0
1.5
2.0
2.5
3.0
3.5
4.0 3.9
2.8
1.81.6
1.3
0.6

Who are the people lacking improved water? Where do they live? Rural areas…
(Credit: Time Magazine)
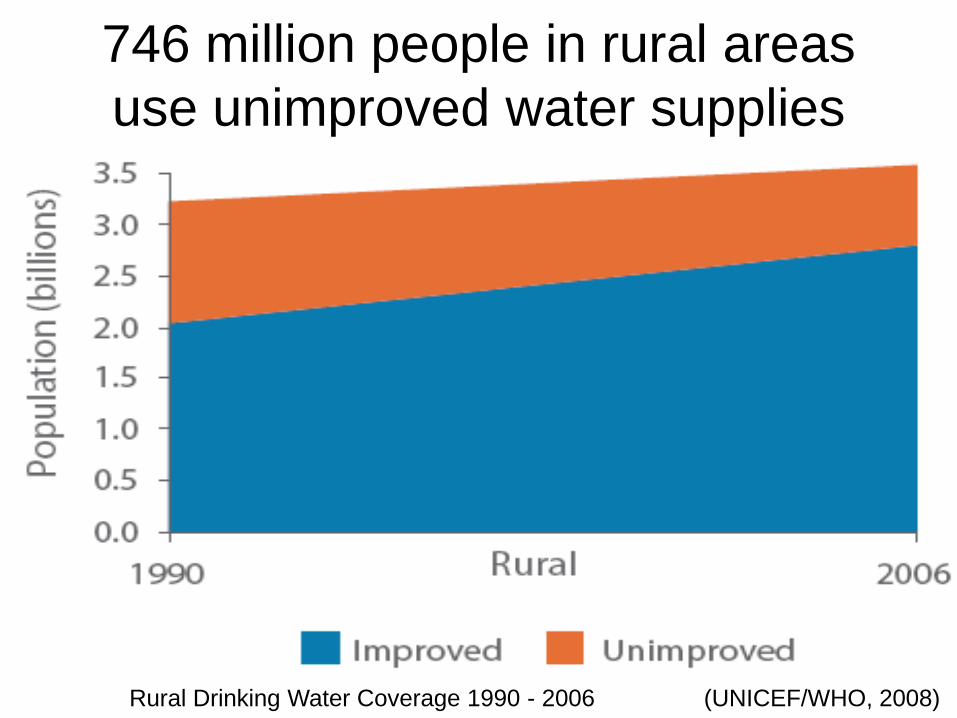
746 million people in rural areas use unimproved water supplies
(UNICEF/WHO, 2008)Rural Drinking Water Coverage 1990 - 2006

(Photo: Genevieve Connors)
… and Urban / Peri-urban Slums

How do you define and evaluate a “Social Business?
• “A social business is a company that is cause-driven rather than profit driven, with the potential to act as a change agent in the world.
• A social business is not a charity. As long as it relies on subsidies and donations to cover its losses, such an organization remains in the category of a charity.”
(Muhammad Yunus , Creating a World Without Poverty, 2007, p.22)

How do you define and evaluate a “Social Business?
• Once a social-objective-driven project overcomes the gravitational force of financial dependence, it is ready for space flight. Such a project is self-sustaining and enjoys the potential for almost unlimited growth and expansion. As the social business grows, so do the benefits it provides to society.
(Muhammad Yunus , Creating a World Without Poverty, 2007. p. 23)

Evaluation, Decision-Making, Values• “EVALUATION is “the process of analyzing a # of plans/
projects/policies with a view to searching out comparative advantages and disadvantages and the act of setting down the findings in a logical framework.”
• “EVALUATION ≠ DECISION-MAKING.” Decision-making is done by institutional players – government, and the political process, engineering and scientific experts, monied interests.
• “EVALUATION is based on VALUES.”(Ortolano, 1997)
• Different values are reflected in different assessment methodologies

The Pure Home Water Story (so far…)• Pure Home Water (PHW): a
social enterprise founded in 2005 to provide safe drinking water via household water treatment and safe storage (HWTS) in Northern Ghana.
PHW has 2 goals:1. Reach people most in need of
safe drinking water in Northern Ghana, the poorest part of Ghana
2. Become financially and locally self-sustaining

Typical Drinking Water Supply for Pure Home Water Customers
Ghanasco Dugout, Tamale, Ghana

Ghanasco Dugout, Tamale
Credit: S.Murcott
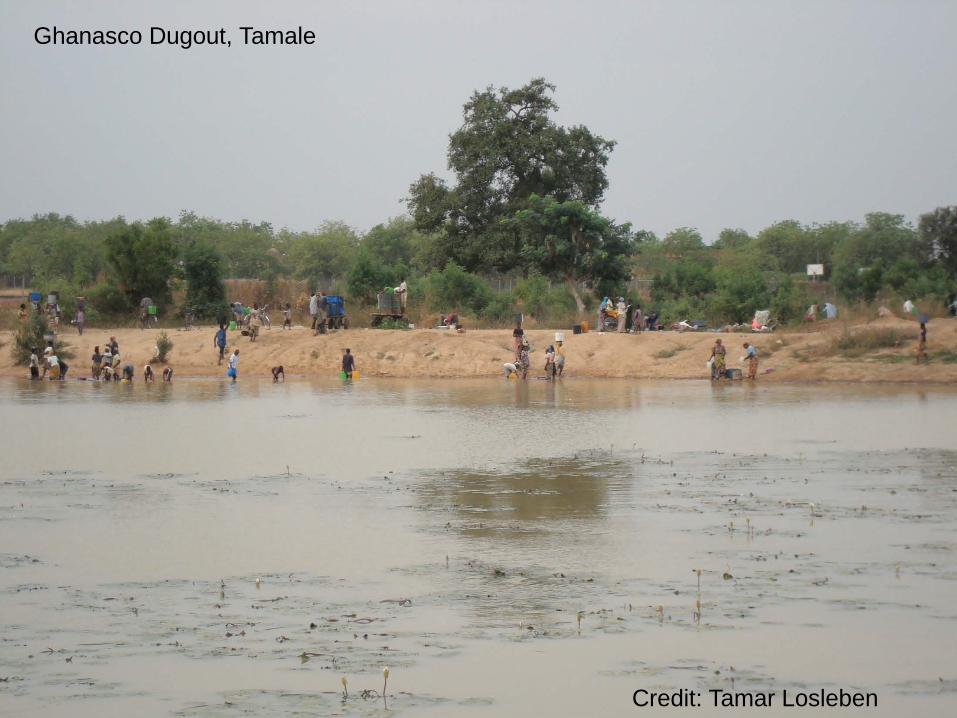
Credit: Tamar Losleben
Ghanasco Dugout, Tamale
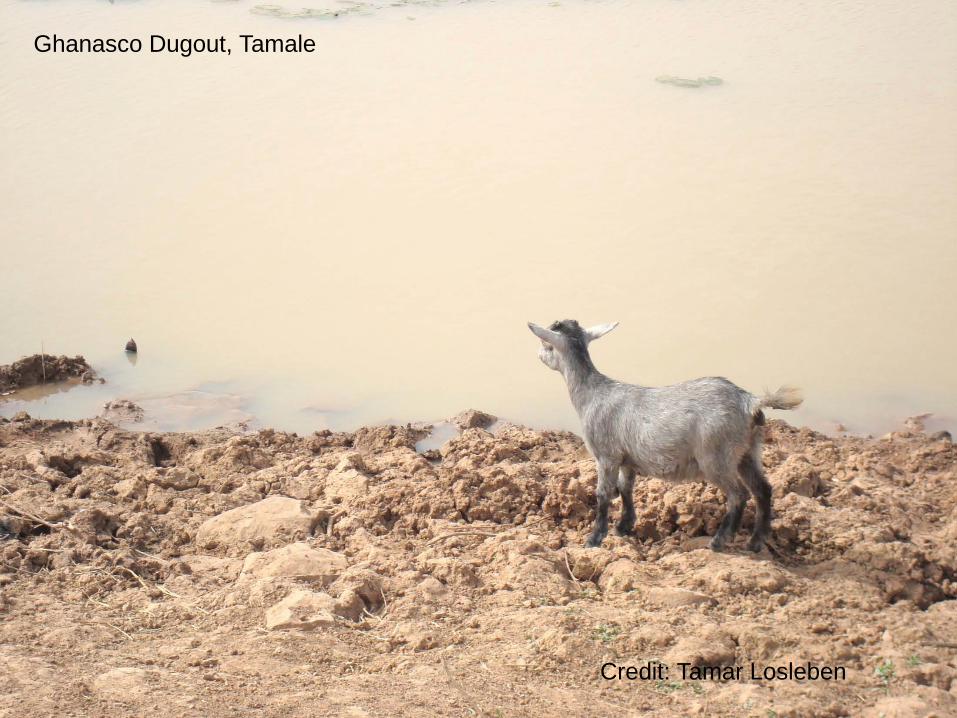
Ghanasco Dugout, Tamale
Credit: Tamar Losleben

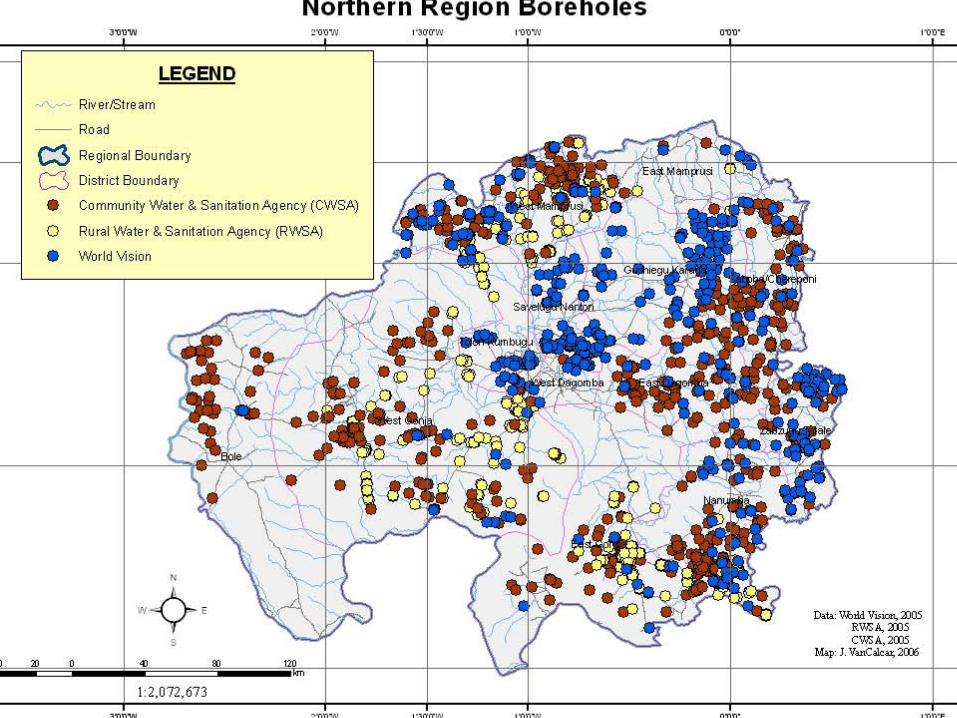
50% (0.9 million out of 1.8 million people) in Northern Region, Ghana currently use an unimproved source
• Improved Sources– Boreholes– Household
connection– Public standpipe– Rainwater harvesting– Protected springs and
dug wells
• Unimproved Sources– All surface water
sources– Unprotected springs
and dug wells– Tanker trucks– Vendor water

Example of Water Quality Data for selected Tamale District Dugouts
Location Date (2006)E. coli
(CFU per 100 mL)Total Coliforms
(CFU per 100 mL)Turbidity
(TU)
Ghanasco Muali Dam, TD 20-Jun 169 6,621 ~1,600
Kaleriga Dam, TD 22-Jun 754 13,475 > 2,000
Bipelar Dam, TD 27-Jun 100 21,667 38
St. Mary's Dam, TD 29-Jun 1,650 52,110 >2,000
Dungu Dam, TD 4-Jul 133 4,540 400
Libga Dam, SD 6-Jul 0 500 75
Bunglung Dam, SD 11-Jul 200 5117 300
Diare Dam, SD 13-Jul 0 3,417 23
Libga Dam, SD 17-Jul 50 1,408 50
Gbanyami Dam, TD 19-Jul 367 19,150 ~1,000
Vitting Dam, TD 25-Jul 1,400 12,767 ~125
Average 438 12,797 690
By any standard, this water should be considered unacceptable for drinking!
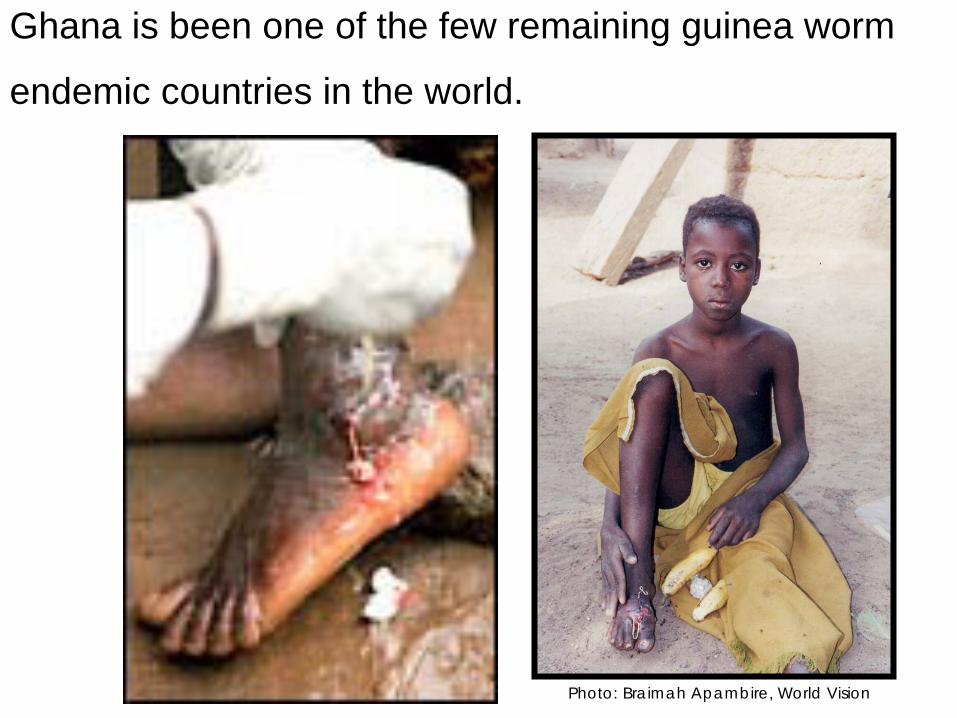
Ghana is been one of the few remaining guinea worm
endemic countries in the world.
Photo: Braimah Apambire, World Vision

Northern Sector - Target Area of Pure Home Water
Sales & Distribution
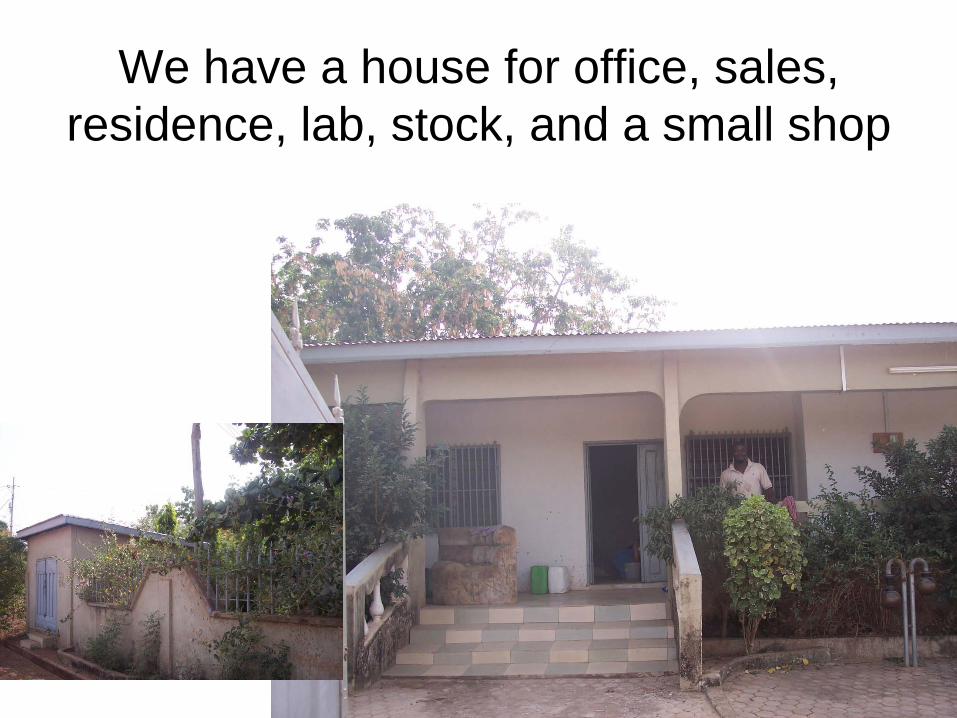
We have a house for office, sales, residence, lab, stock, and a small shop

For the past 18 months, we have had a factory under construction
(Aug. 2010)
Credit: Claudia Espinoza

Typical Village in Northern Ghana


Since 2005, > 50 MIT M.Eng.,Sloan MBA and other students have assisted Pure Home Water by conducting applied research, water quality tests, product evaluations, monitoring, consumer choice and business assessment studies in Ghana.

1st Product: Kosim Ceramic Pot Filter Since 2006, we have focused on disseminating the Kosim ceramic pot filter.

Why did we choose a ceramic pot filter?• Extremely high turbidity, even in dry season,
in the widely used surface water supplies
Turbidty Test (NTU)
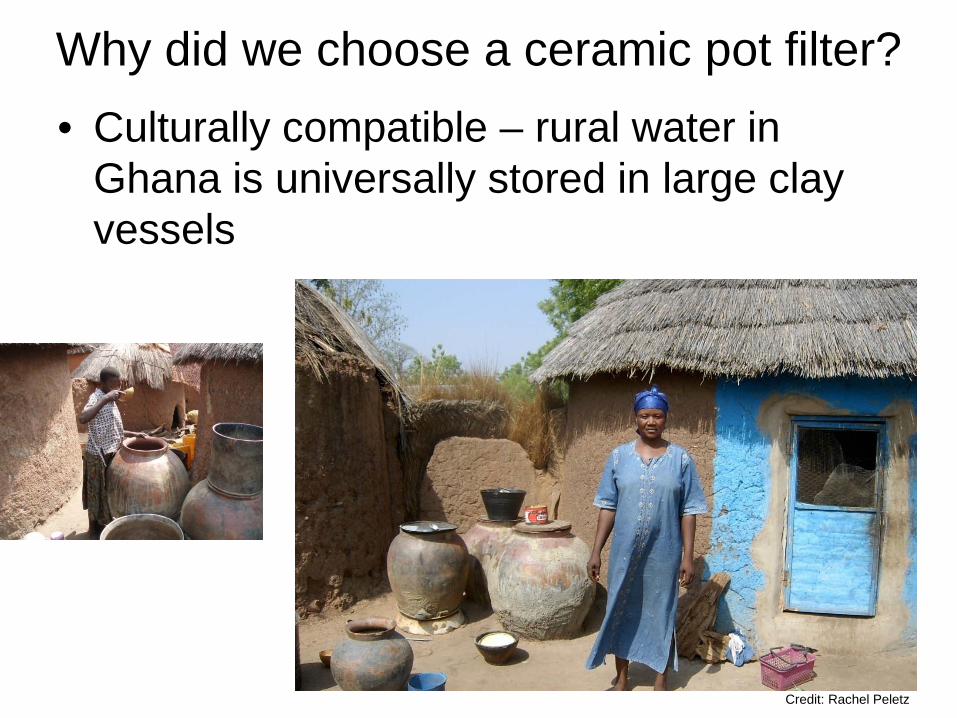
Why did we choose a ceramic pot filter?• Culturally compatible – rural water in
Ghana is universally stored in large clay vessels
Credit: Rachel Peletz

Because it works!Before and After
Credit: Alexandr Nishichenko
But how do we know it works?Or, if our social business is “successful?”

Pure Home Water’s Present & Future Plans
(2010 – 2015)• Complete ceramic filter and brick
factory in Tamale in 2010-2011• Produce quality filters and
construction materials• Focus on building markets.
– Kiosks/retail outlets– Advertising (billboards, radio ads,
demos, village committees)– Business capacity developmt
• Extend reach in urban Ghana with new Pure Home Water products

Our factory is on the map!Close-up of Factory Land from Google Earth

Factory Architectural Design Plan
Credit: Chris de Vries
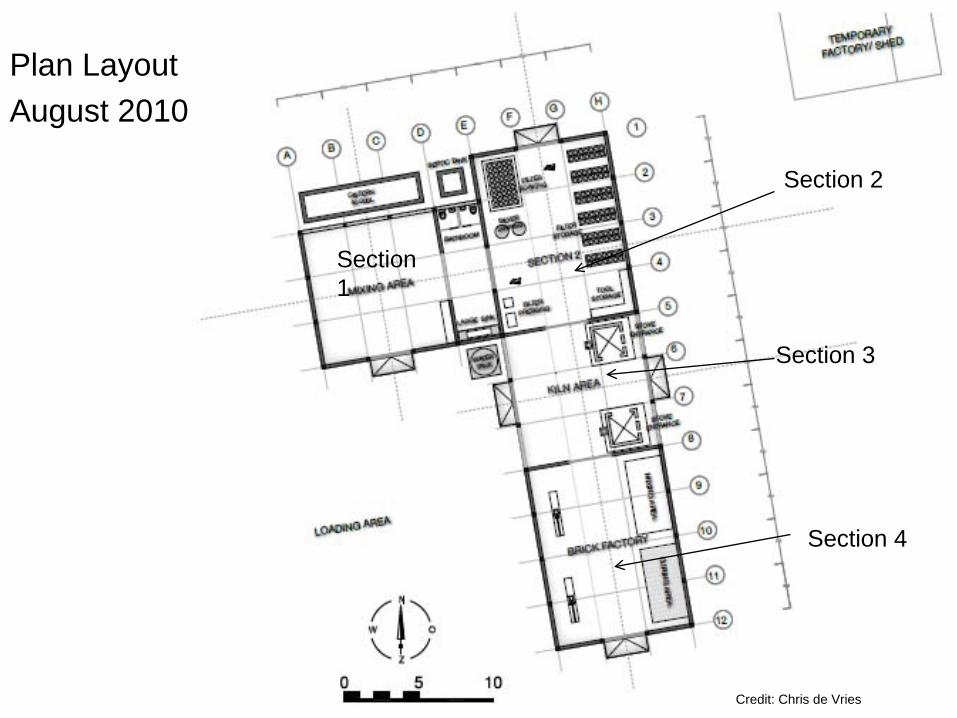
New LayPlan LayoutAugust 2010
Section1
Section 2
Section 3
Section 4
Credit: Chris de Vries
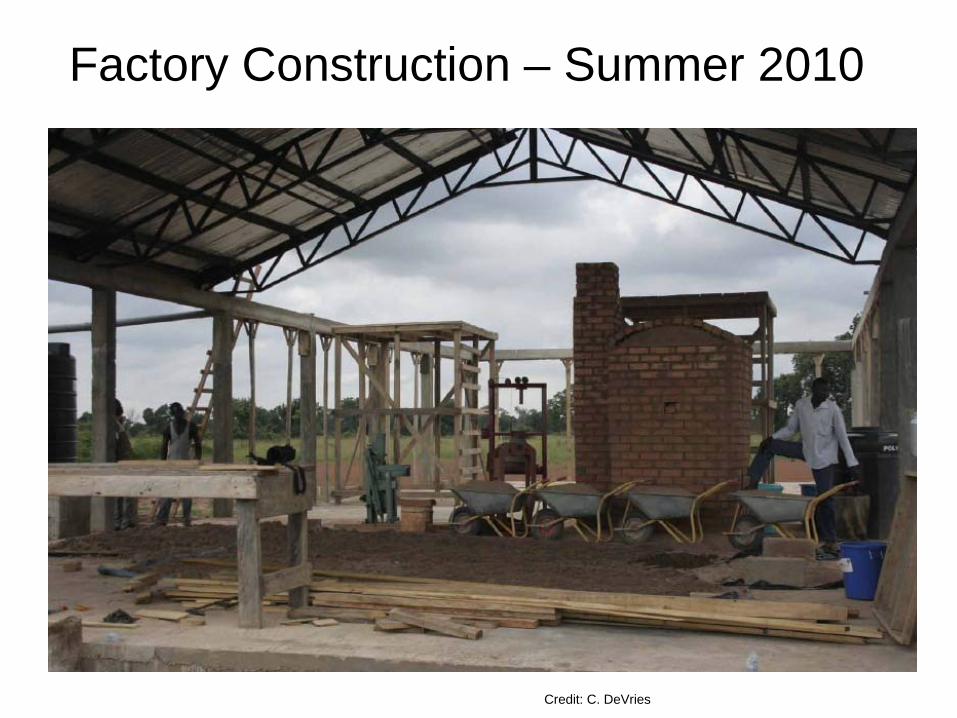
Factory Construction – Summer 2010
Credit: C. DeVries

Factory -January 2011

Factory Floor, Drying Racks, Saturation Tank in Foreground

Rainwater Harvesting Tank Construction – Jan. 2011

Production StepsFilter Production is comprised of
multiple steps
1. Procuring the clay and transporting it to the site

2. Processing the clay
Credit : Leah Nation

3. Sieving the Combustible (Rice Husk or Saw Dust)
Credit: Travis Watters

4. Milling the Combustible (Rice Husk or Saw Dust) – to obtain finer particle size
Inside Hammer mill
Gerry-rigging hammer mill to make it work for our rice husk

5. Mixing the clay and combustible materials together in the proper ratio of clay to combustible

6. Measuring and adding water to clay mixture
Credit: Steve Buchele

7. Kneading clay until uniform mixture is obtained
Credit: Steve Buchele

8. Weighing mixture
Credit: Steve Buchele
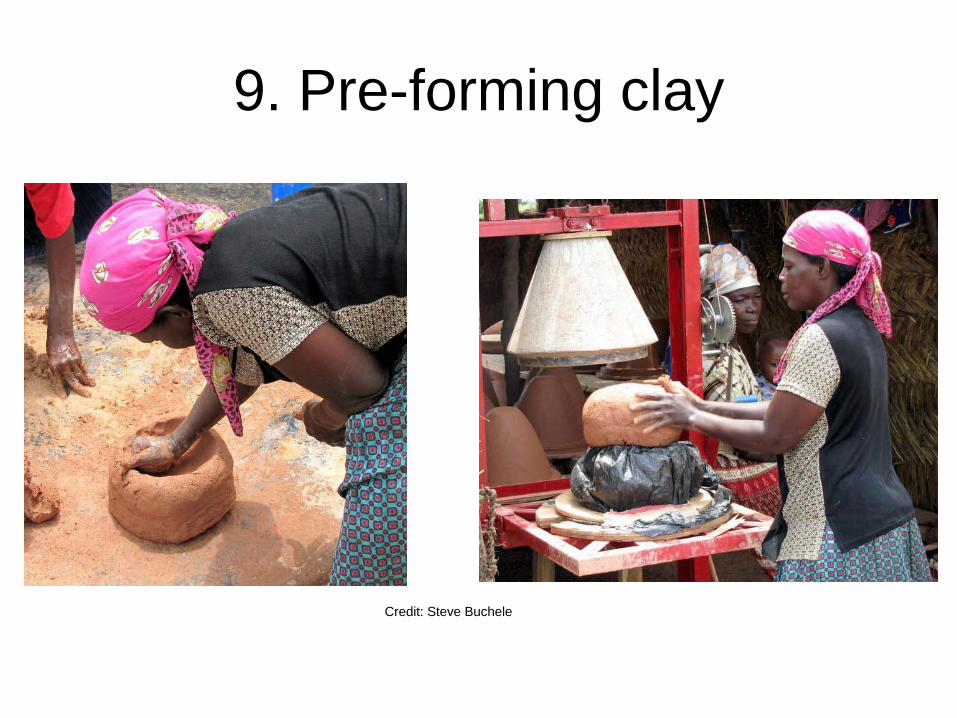
9. Pre-forming clay
Credit: Steve Buchele
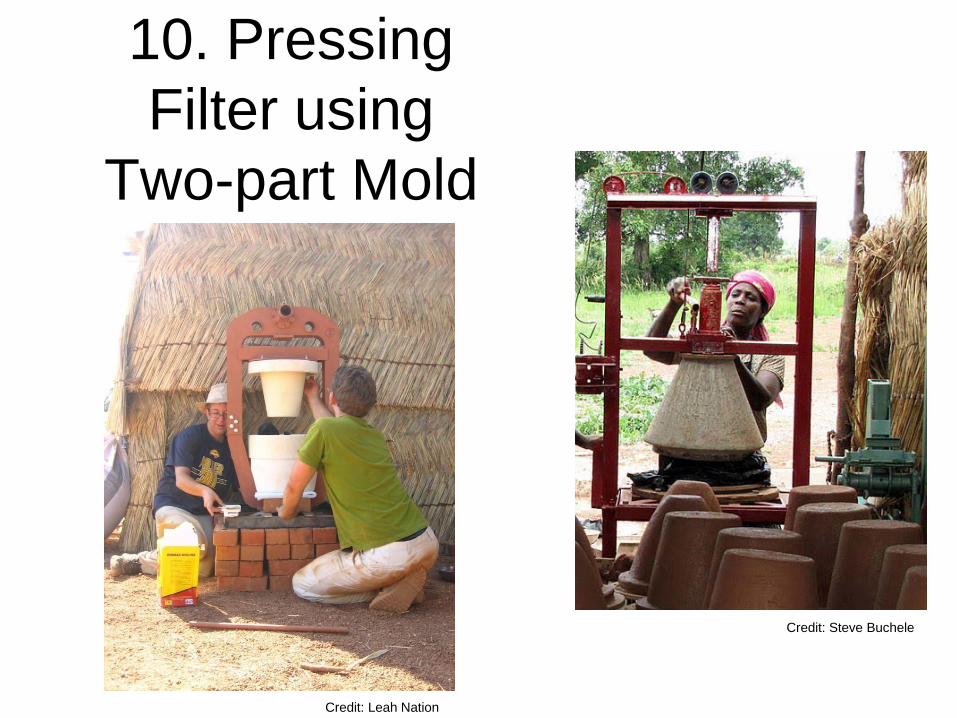
10. Pressing Filter using
Two-part Mold
Credit: Steve Buchele
Credit: Leah Nation

12. Drying Pots in the Sun
Credit: Travis Watters

13. Stacking Filters in the Kiln

14. Firing in Small Kiln: Ramping up to the Correct Maximum Temperature for
the Right Time Duration

14. Firing – Big Kiln (Jan. 2011)

14. Factory Manager, John Adams, firing kiln –March 2011

15. Dipping or Painting Filters in Colloidal Silver Solution
16. Flow testing Filters
17. Packaging and sending out to market
(pictures from EcoFiltro, Antigua, Guatemala)

16. Flow Rate Testing
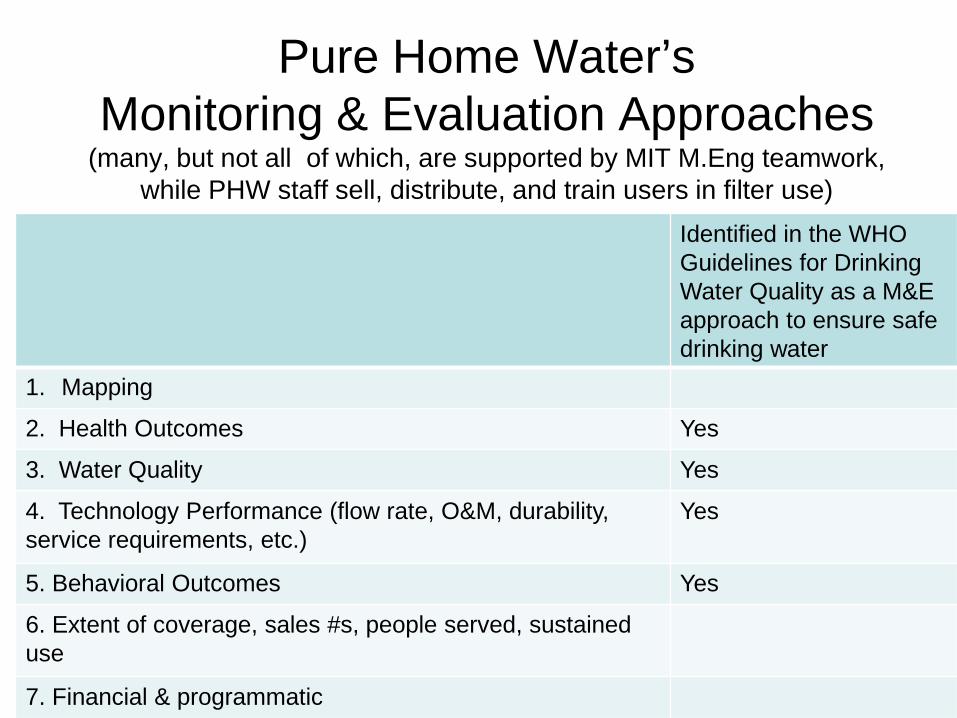
Pure Home Water’s Monitoring & Evaluation Approaches
(many, but not all of which, are supported by MIT M.Eng teamwork, while PHW staff sell, distribute, and train users in filter use)
Identified in the WHO Guidelines for Drinking Water Quality as a M&E approach to ensure safe drinking water
1. Mapping
2. Health Outcomes Yes
3. Water Quality Yes
4. Technology Performance (flow rate, O&M, durability, service requirements, etc.)
Yes
5. Behavioral Outcomes Yes
6. Extent of coverage, sales #s, people served, sustained use
7. Financial & programmatic

Mapping
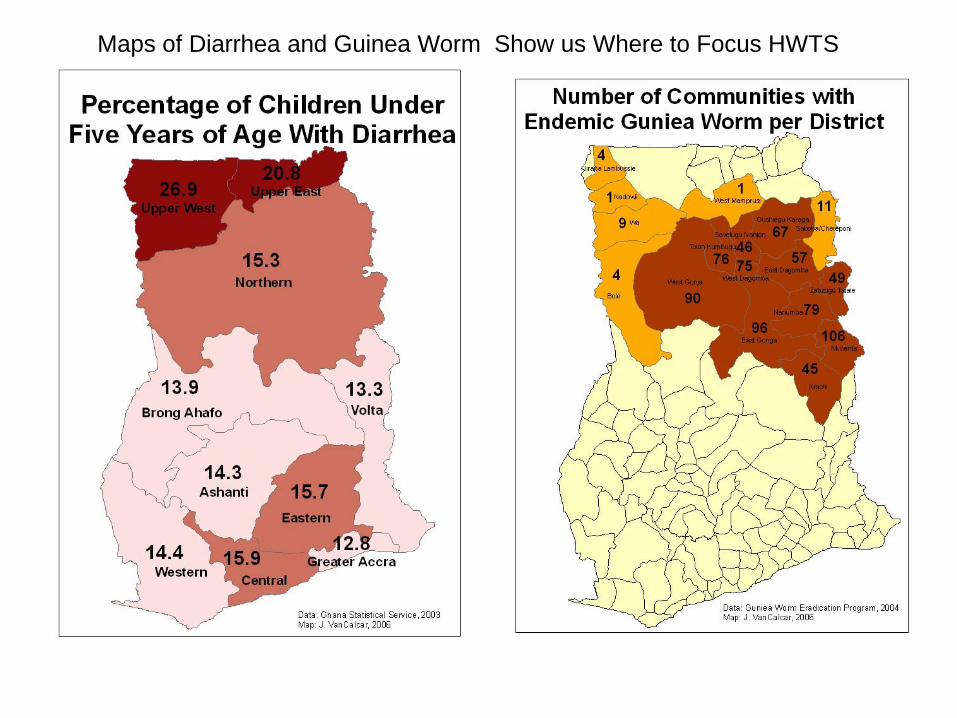
Maps of Diarrhea and Guinea Worm Show us Where to Focus HWTS
#Y#Y
#Y
#Y#Y#Y
#Y
#Y
#Y
#Y
#Y#Y#Y
#Y#Y
#Y#Y #Y#Y
#Y#Y#Y #Y#Y#Y #Y
#Y
#Y#Y#Y#Y#Y
#Y#Y
#Y#Y#Y#Y#Y#Y#Y#Y#Y
#Y
#Y
#Y
#Y
#Y#Y#Y#Y
#Y#Y#Y
#Y
#Y
#Y
#Y#Y
#Y#Y#Y #Y #Y
#Y #Y #Y
#Y#Y#Y
#Y#Y#Y#Y#Y#Y
#Y#Y#Y#Y#Y#Y#Y#Y#Y
#Y#Y#Y
#Y#Y#Y#Y #Y#Y
#Y#Y
#Y#Y
#Y#Y
#Y
#Y#Y
#Y#Y#Y#Y
#Y
#Y #Y#Y
#Y
#Y#Y
#Y#Y#Y#Y
#Y#Y#Y#Y#Y#Y
#Y #Y#Y#Y #Y#Y#Y#Y
#Y#Y
#Y
#Y
#Y
#Y
#Y
#Y
#Y
#Y
#Y #Y
#Y
#Y#Y#Y#Y
#Y
#Y#Y
#Y#Y#Y
#Y#Y #Y#Y#Y
#Y
#Y#Y#Y #Y#Y
#Y#Y #Y#Y
#Y#Y
#Y#Y#Y#Y#Y
#Y
#Y#Y#Y#Y#Y#Y
#Y#Y#Y#Y#Y#Y#Y#Y#Y#Y#Y#Y#Y #Y#Y#Y#Y#Y#Y
#Y#Y#Y#Y#Y#Y#Y#Y#Y#Y#Y#Y#Y#Y#Y#Y#Y#Y#Y#Y#Y#Y#Y#Y#Y#Y#Y#Y#Y#Y#Y#Y#Y#Y#Y#Y#Y
#Y#Y#Y#Y#Y#Y#Y#Y#Y#Y#Y#Y#Y
#Y#Y#Y#Y
#Y#Y#Y#Y#Y #Y#Y#Y#Y#Y#Y
#Y#Y#Y#Y#Y#Y#Y#Y#Y#Y#Y#Y#Y
#Y#Y#Y#Y#Y #Y#Y#Y#Y#Y#Y#Y#Y#Y #Y#Y #Y #Y#Y#Y#Y#Y#Y#Y#Y#Y#Y
#Y#Y#Y#Y#Y#Y
#Y#Y
#Y#Y#Y
#Y#Y#Y#Y#Y#Y#Y#Y#Y
#Y
#Y
#Y#Y #Y#Y
#Y #Y#Y#Y#Y #Y
#Y#Y
#Y #Y#Y#Y
#Y#Y
#Y#Y#Y#Y#Y#Y
#Y#Y #Y#Y#Y #Y#Y
#Y#Y#Y#Y#Y
#Y
#Y
#Y #Y#Y#Y
#Y #Y#Y
#Y
#Y
#Y
#Y#Y#Y#Y
#Y
#Y#Y
#Y#Y#Y
#Y #Y#Y#Y #Y#Y
#Y#Y#Y
#Y
#Y
#Y#Y#Y
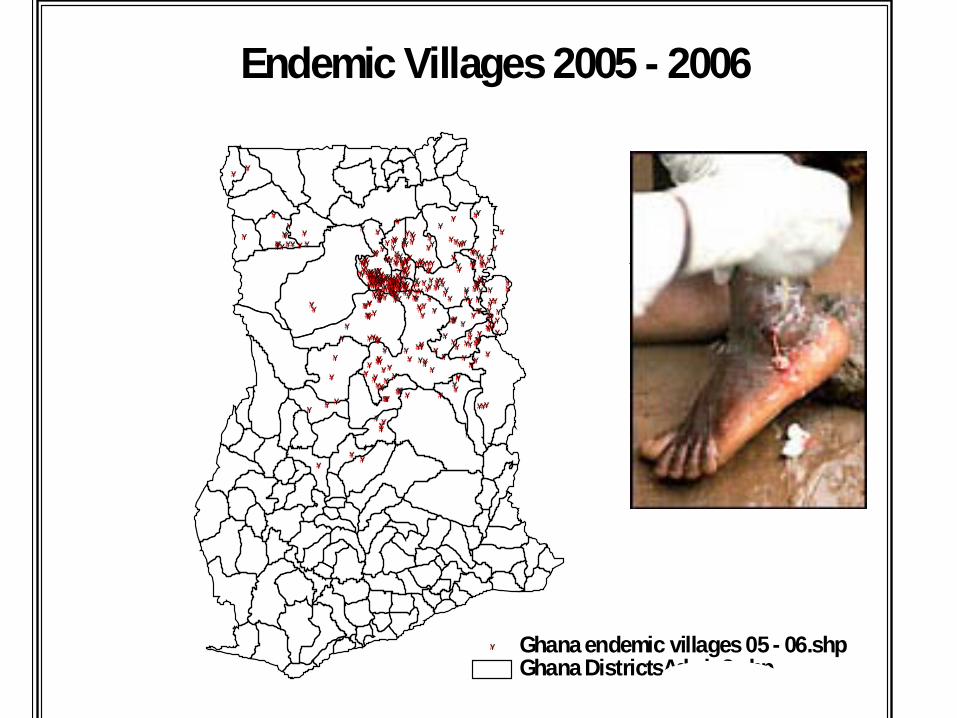
Ghana DistrictsAdmin2.shp#Y Ghana endemic villages 05 - 06.shp
N
EW
S
Endemic Villages 2005 - 2006
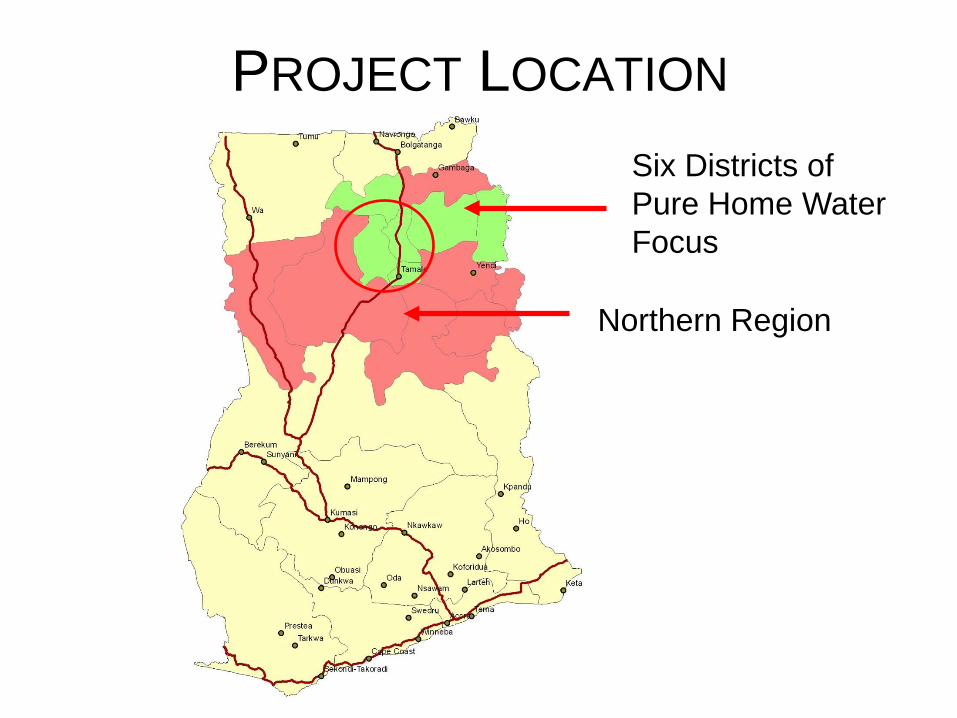
PROJECT LOCATION
Northern Region
Six Districts of Pure Home Water Focus

Target Population
Improved Sources Boreholes Household connection Public standpipe Rainwater harvesting Protected springs and dug wells
Unimproved Sources All surface water sources Unprotected springs and dug wells Tanker trucks Vendor water
1 million out of 1.8 million people in the Northern Region currently drink water from an unimproved source.

Tanker Open Well
Stream Dugout
Typical Unimproved Sources in Northern Ghana

Health

Health Outcome
• Quantifiable reduction in the overall level of disease
• Primarily applicable to some microbial hazards in developing countries and chemical hazards with clearly defined health effects
(WHO 3rd Edition – Guidelines for Drinking Water Quality)

Health Outcome in Ghana• Reported incidence of diarrhea in
household in the past week.• 50 households (2006), 110 households
(2007) from traditional, rural and modern, urban households surveyed on diarrhea
– Half with ceramic filters; half without
(WHO 3rd Edition – Guidelines for Drinking Water Quality)

COMMUNITIES
Traditional
Modern

DIARRHEAL PREVALENCE (2006)
• Overall Prevalence = 5%– 5% (39/724) of all people suffered
from diarrhea at time of study• Children under five years = 16%
– 16% (17/109) of children under five suffered from diarrhea at time of study
Children under 5 are at the greatest risk for diarrheal illnesses

RELATIVE RISK ANALYSIS
Odds Ratio= (4x203) = 31% Statistically significant (p<0.035)(12x219)
Traditional rural households with filters have 31% of the risk (69% less risk) of having diarrheal illness compared to households without
filters
Diarrhea No Diarrhea
Filter 4 219No Filter 12 203
(Johnson, 2007)

COMMUNITIES SURVEYED50 Households, 7 Communities, Mothers Interviewed
(Jan. 2006)
5 5
3 3
3 3
0 6
4 4
0 7
0 7
0 2 4 6 8 10
Number of households
Barracks
Vitin Estates
Jisonayili
Kaleriga
Libga
Bunglung
Diare
Technology
No Technology
(Peletz, R. 2006)

Water Quality

Water Quality• Established for individual drinking water constituents that
are a health risk from long-term exposure, where fluctuations are small or occurring over long periods
• Typically expressed as guidelines values (concentrations) of the substance or chemical of concern
• In Ghana, we have a established and trained local technicians in simple water quality testing for turbidity and 3 low-cost indicator tests: 3M petrifilm (E.coli and total coliform), membrane filtration (E.coli and total coliform) and hydrogen sulfide bacteria presence/absence testing.
(WHO 3rd Edition – Guidelines for Drinking Water Quality)
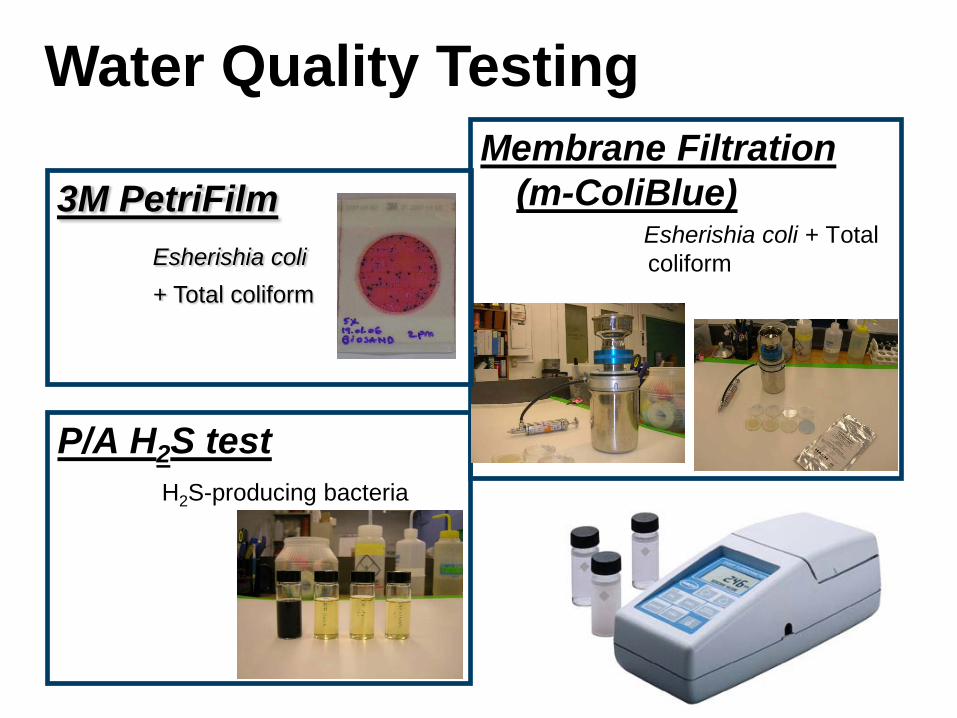
P/A H2S testH2S-producing bacteria
Membrane Filtration (m-ColiBlue)
Esherishia coli + Total coliform
Water Quality Testing
3M PetriFilmEsherishia coli + Total coliform

17.Water QualityTesting

Water Quality Results
Membrane Filtration E. Coli Comparison
1
10
100
1000
10000
Shenshegu Taha Gbalahi Chenshegu Gbanyamni Kalariga VitinEstates
KaminaBarracks
Traditional Communities Modern Communities
Aver
age
E. C
oli C
FU/1
00m
L
UnfilteredFiltered

Water Quality Results: Filtered vs. Source Water
Traditional Households
Modern Households
E. coli Reduction 99.7% 85%Total Coliform
Reduction 99.4% 90%
Turbidity Reduction 92% 68%
Technology Performance
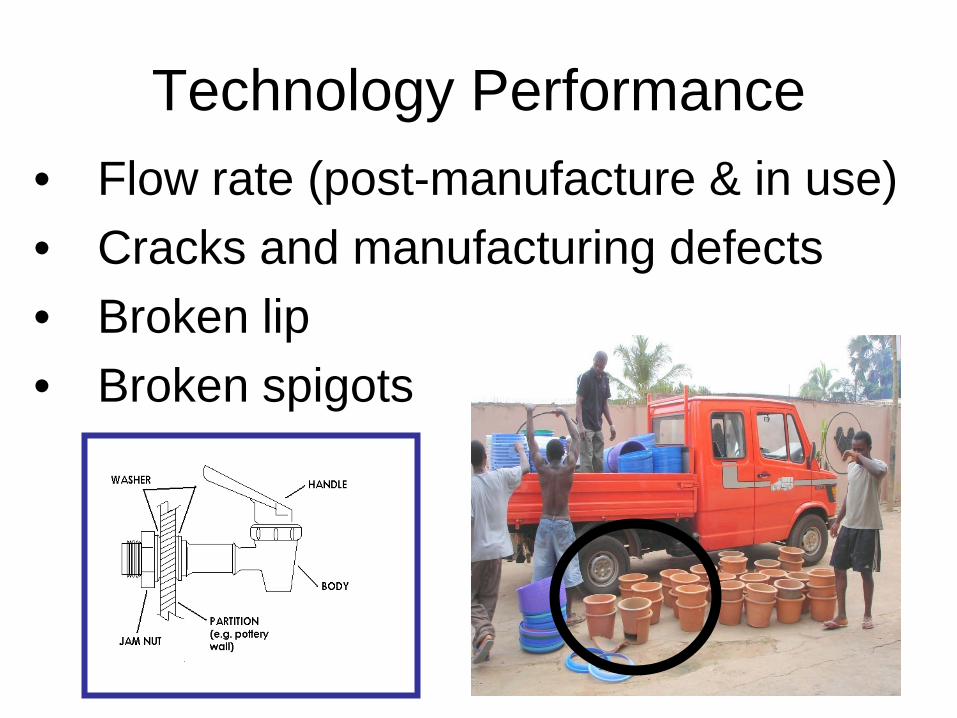
Technology Performance• Flow rate (post-manufacture & in use)• Cracks and manufacturing defects• Broken lip• Broken spigots

Behavioral Outcomes
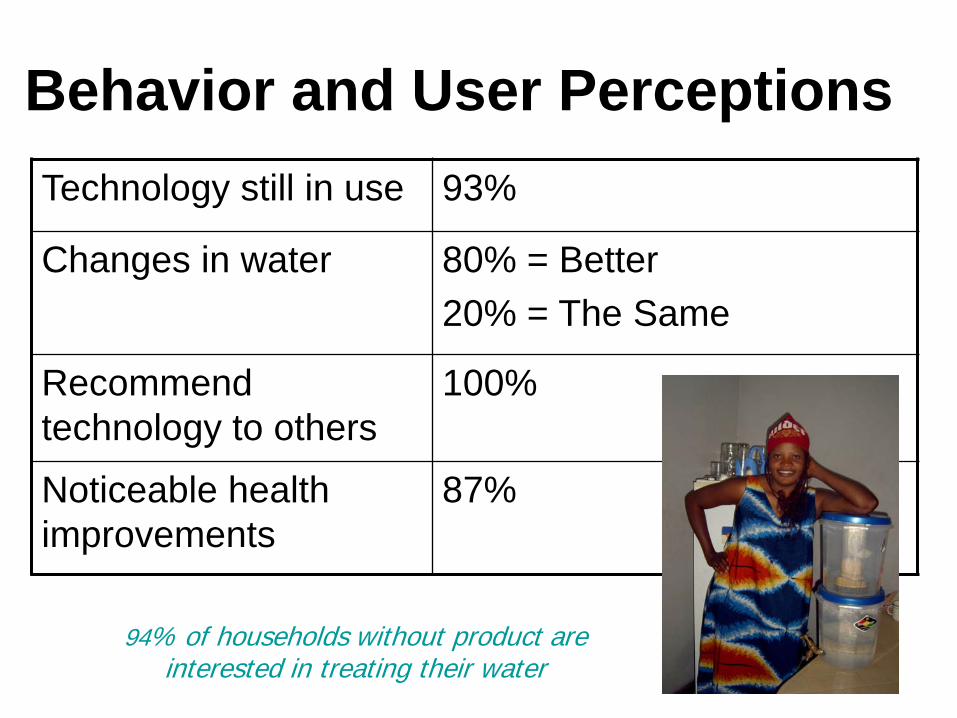
Behavior and User Perceptions Technology still in use 93%
Changes in water 80% = Better20% = The Same
Recommend technology to others
100%
Noticeable health improvements
87%
94% of households without product are interested in treating their water
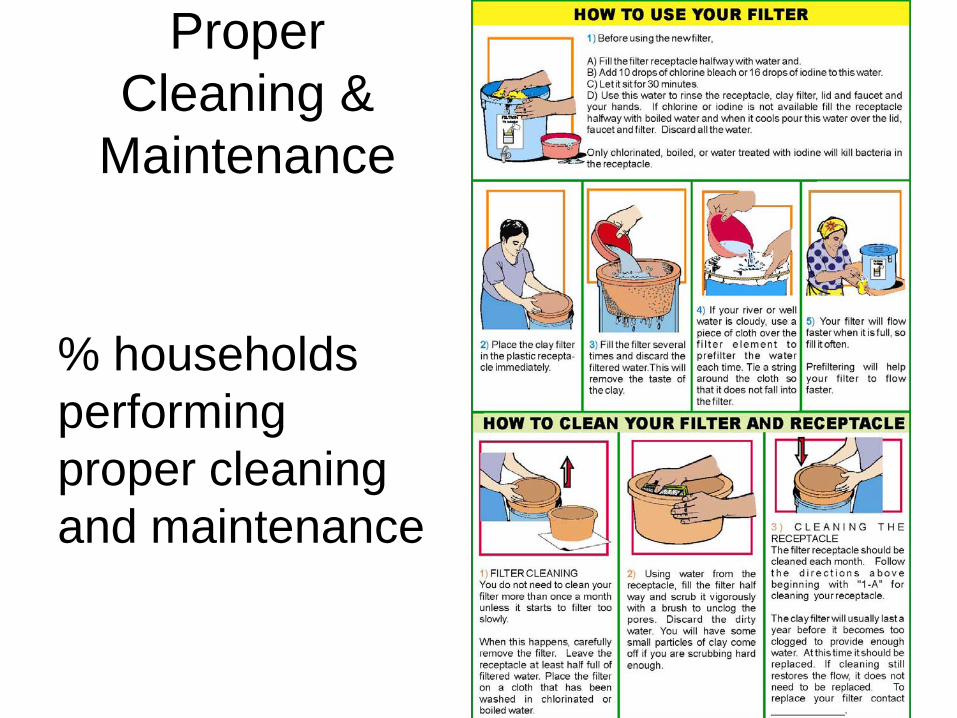
Proper Cleaning &
Maintenance
% households performing proper cleaning and maintenance
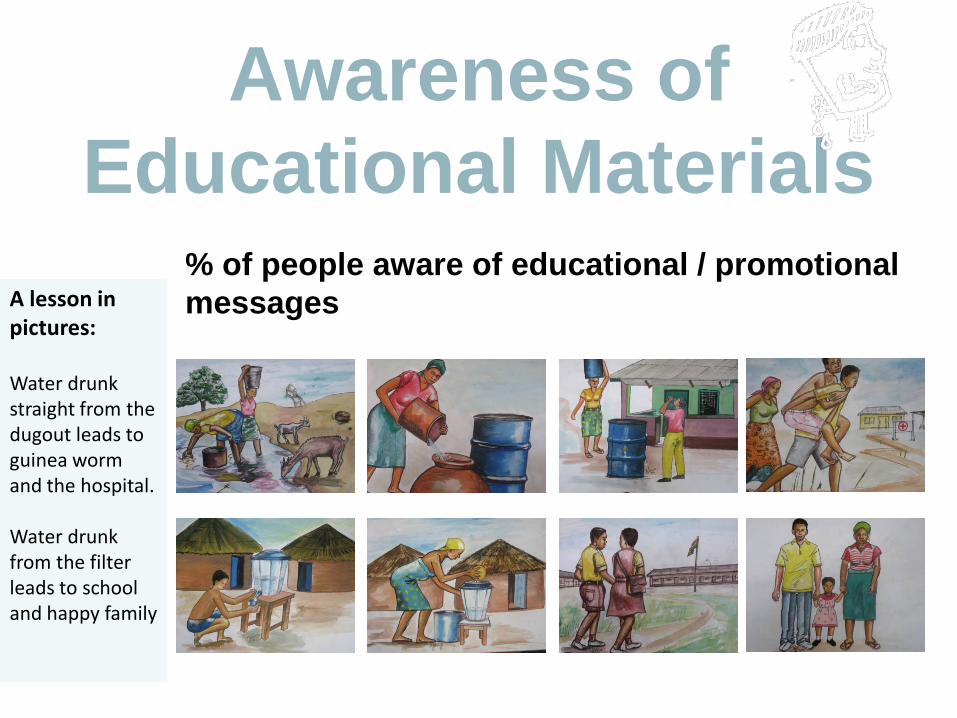
Awareness of Educational Materials
A lesson in pictures:
Water drunk straight from the dugout leads to guinea worm and the hospital.
Water drunk from the filter leads to school and happy family
% of people aware of educational / promotional messages
# of Sales# of People Reached Use/Sustained Use

Accomplishments: Pure Home Water Filter Sales(2005 – 2010)
We have reached over 100,000 people to date!
0
1000
2000
3000
4000
5000
6000
7000
8000
Yr 1 (0506) Yr 2 (0607) Yr 3 (0708) FY 4 (0809) FY5 (0910)
5691,224
7,700 flood sales
4,000 emergency distribution
333
902 967
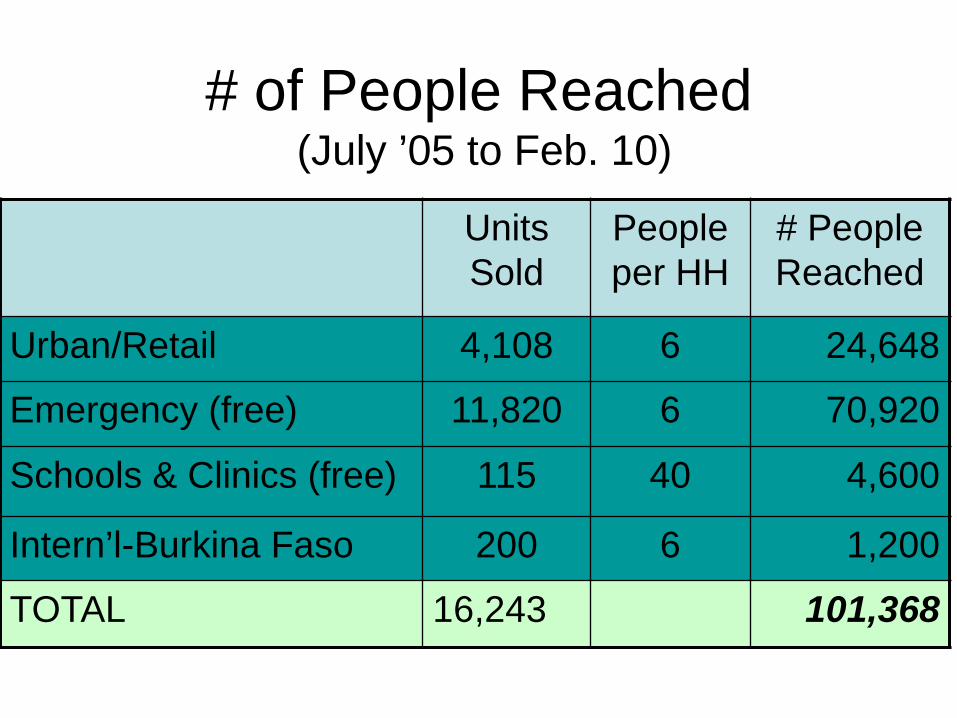
# of People Reached(July ’05 to Feb. 10)
Units Sold
People per HH
# People Reached
Urban/Retail 4,108 6 24,648
Emergency (free) 11,820 6 70,920
Schools & Clinics (free) 115 40 4,600
Intern’l-Burkina Faso 200 6 1,200
TOTAL 16,243 101,368
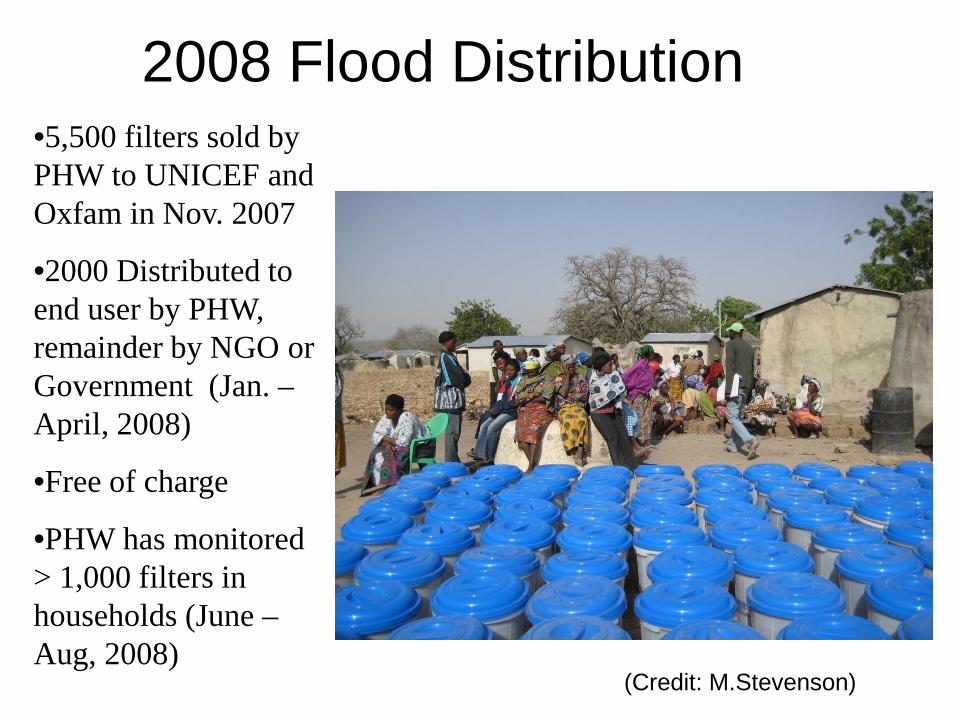
2008 Flood Distribution•5,500 filters sold by PHW to UNICEF and Oxfam in Nov. 2007
•2000 Distributed to end user by PHW, remainder by NGO or Government (Jan. –April, 2008)
•Free of charge
•PHW has monitored > 1,000 filters in households (June –Aug, 2008)
(Credit: M.Stevenson)

2009 Guinea Worm Distribution - 4000 Filters
Training, Dissemination, Monitoring
Woman from Yesapi, Central Gonja, with bandage covering guinea worm-infected foot
Use/Sustained Use
• See Masters of Science thesis of Kate Clopeck (Ghana, 2009):
• http://web.mit.edu/watsan/docs_theses_ghana.html

Financial Evaluations
Clear and Transparent Accounting, Prices, Breakeven Analysis
• Our project aims for locally managed, clear and transparent accounting
• We have invested in accounting training for one of our staff
• Clear accounting includes precise tracking of production, distribution, retail costs and any subsidies.
• Break-even analysis – shows us how many products we must sell on a monthly basis to break-even
4/24/2011
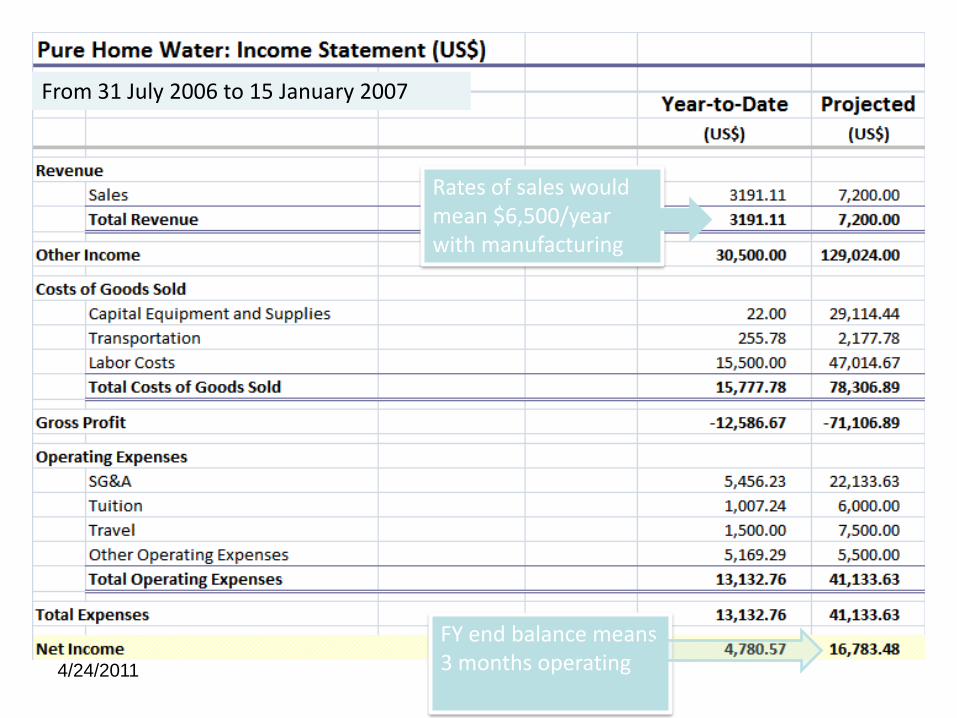
Rates of sales would mean $6,500/year with manufacturing
FY end balance means 3 months operating
From 31 July 2006 to 15 January 2007

Prices and Subsidies– Urban Retail
– Rural
PHW Cost Retailer Price
Customer Price
137,000 100,000 120,000 (Cash)
137,000 100,000 130,000 (Credit)
PHW Cost Liaison Customer
137,000 50,000 60,000 (Cash/Credit)

PRODUCT PRICING FEEDBACKAverage willingness to pay = $9
Cost to purchase and transport from Accra = $15Estimated cost of local manufacture = $6

Breakeven Analysis
• FormulaRevenue = Unit sold × PriceCost = Fixed Cost + Variable Cost
= FC + Unit sold × VC Ratio(Fixed cost) (Variable cost)
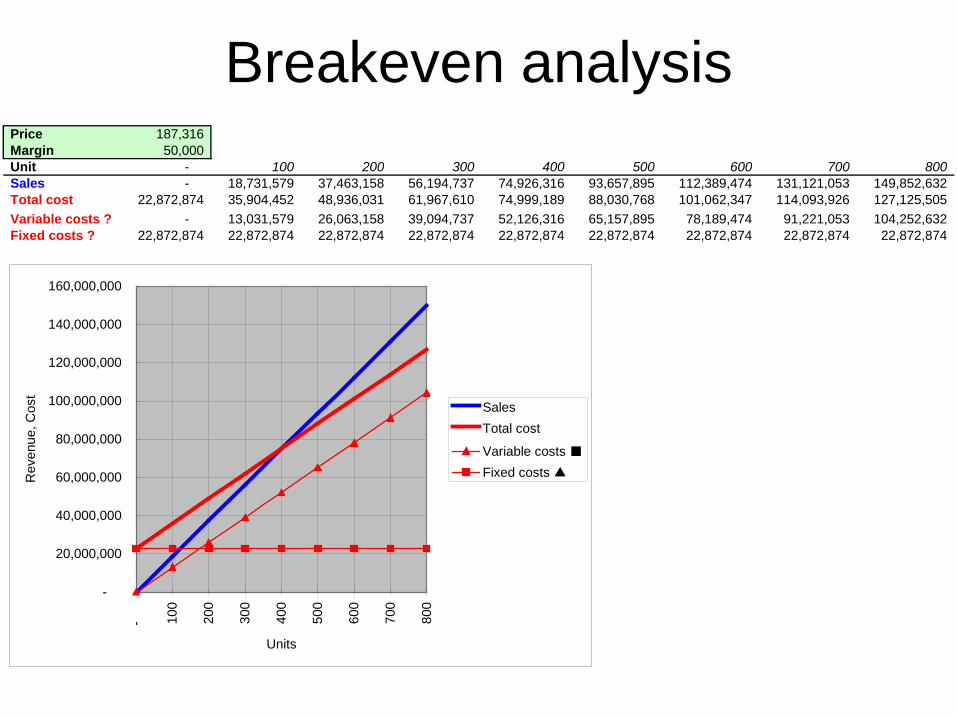
Breakeven analysisPrice 187,316 Margin 50,000 Unit - 100 200 300 400 500 600 700 800 Sales - 18,731,579 37,463,158 56,194,737 74,926,316 93,657,895 112,389,474 131,121,053 149,852,632 Total cost 22,872,874 35,904,452 48,936,031 61,967,610 74,999,189 88,030,768 101,062,347 114,093,926 127,125,505 Variable costs ? - 13,031,579 26,063,158 39,094,737 52,126,316 65,157,895 78,189,474 91,221,053 104,252,632 Fixed costs ? 22,872,874 22,872,874 22,872,874 22,872,874 22,872,874 22,872,874 22,872,874 22,872,874 22,872,874
-
20,000,000
40,000,000
60,000,000
80,000,000
100,000,000
120,000,000
140,000,000
160,000,000
- 100
200
300
400
500
600
700
800
Units
Rev
enue
, Cos
t
SalesTotal cost
Variable costs ■Fixed costs ▲

Breakeven Analysis2005 MARGIN ANALYSIS FOR PURE HOME WATER PROJECTCERAMICA TAMAKLOE FILTER
# VARIABLE COST CedisUnit Price
V1 Purchase price 110,000V2 Transportation (Accra-Tamale) 16,316V3 Brush 2,500V4 Manual 1,000V5 Tap Fixing 500V6 Sales Commission 7,000
M Margin 14,684 10,000 20,000 30,000 40,000 50,000 60,000Retail price 152,000 147,316 157,316 167,316 177,316 187,316 197,316
Margin % 7.3% 14.6% 21.8% 29.1% 36.4% 43.7%
# FIXED COST (PER MONTH) Cedis
F1 Average fixed cost per month 22,872,874
F1/V6 Breakeven sales volume 1,558 2,287 1,144 762 572 457 381381.214559

Programmatic Evaluations

Business Results: 4Ps
• Product is acceptable to users:– 100% of users said it is easy-to-use, that they use it daily, and
that they would recommend it to others– Spigot problems in filters in use >1 year
• Promotion channels are effective:– 94% of non-users were aware of ceramic filters in their
community
• Price is affordable to low-income families:– Non-filter users actually reported a higher monthly income per
person than filter users (US $ 7.60 vs. US $5.50)
• Place of focus is in communities that need the filters the most– 0% of targeted communities have improved water supplies or
sanitation
4/24/2011
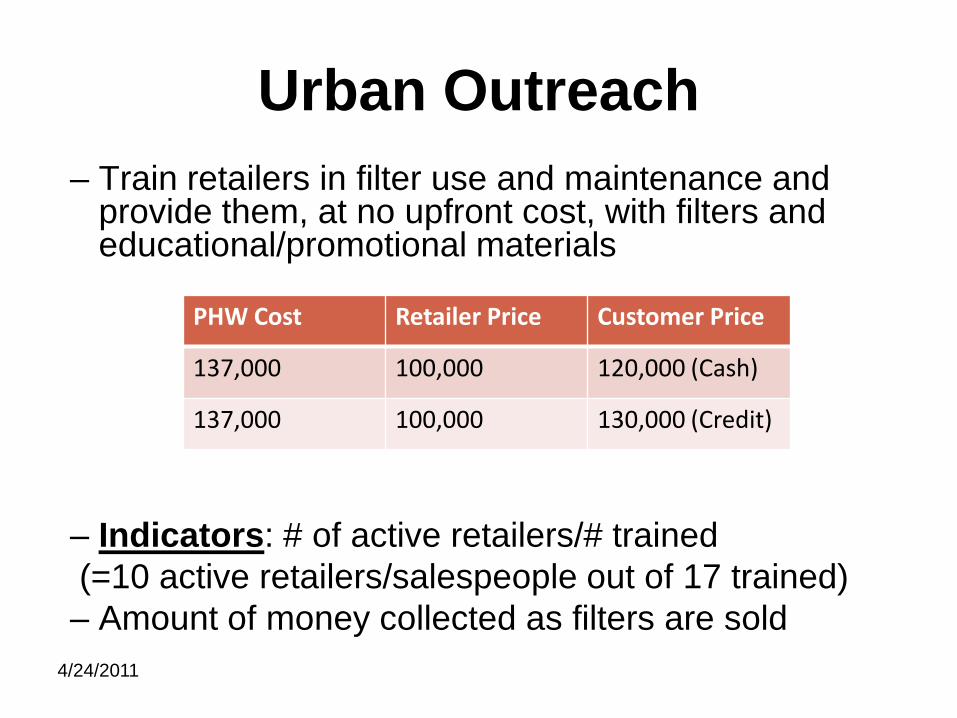
Urban Outreach– Train retailers in filter use and maintenance and
provide them, at no upfront cost, with filters and educational/promotional materials
– Indicators: # of active retailers/# trained (=10 active retailers/salespeople out of 17 trained)– Amount of money collected as filters are sold
PHW Cost Retailer Price Customer Price
137,000 100,000 120,000 (Cash)
137,000 100,000 130,000 (Credit)

4/24/2011
Rural Outreach: SalesOutreach took place in 9 communities in one month and led to sales in 7
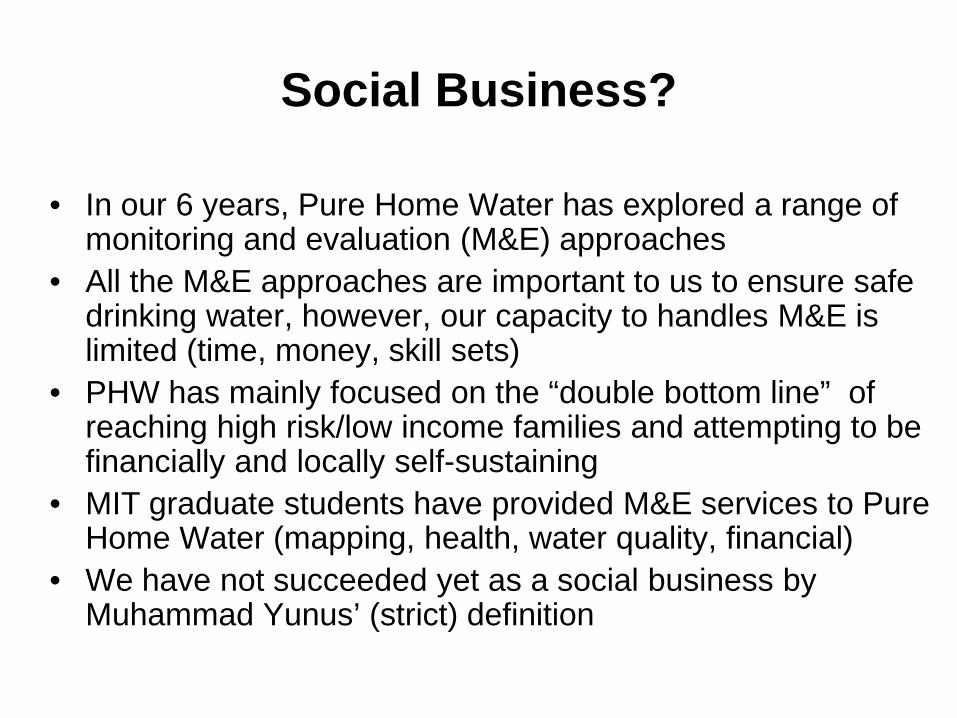
Social Business?
• In our 6 years, Pure Home Water has explored a range of monitoring and evaluation (M&E) approaches
• All the M&E approaches are important to us to ensure safe drinking water, however, our capacity to handles M&E is limited (time, money, skill sets)
• PHW has mainly focused on the “double bottom line” of reaching high risk/low income families and attempting to be financially and locally self-sustaining
• MIT graduate students have provided M&E services to Pure Home Water (mapping, health, water quality, financial)
• We have not succeeded yet as a social business by Muhammad Yunus’ (strict) definition

Pure Home Water
Factory & MIT Team 2010-2011

http://web.mit.edu/watsan/meng_ghana.html
http://www.purehomeh2o.com
Pure Home WaterPO Box TL 2261, Tamale, Ghana+233-246-560145Samuel Hackman<[email protected]>Susan Murcott <[email protected]>
For More Information
MIT OpenCourseWarehttp://ocw.mit.edu
1.011 Project EvaluationSpring 2011 For information about citing these materials or our Terms of Use, visit: http://ocw.mit.edu/terms.